ford-1q2021 earnings- presentation
TRANSCRIPT

Q1 2021 Earnings ReviewApril 28, 2021
Note: See slide A15 for related notes

2
Information Regarding This PresentationFORWARD-LOOKING STATEMENTS
This presentation includes forward-looking statements. Forward-looking statements are based on expectations, forecasts, and assumptions by our management and involve a number of risks, uncertainties, and other factors that could cause actual results to differ materially from those stated. For a discussion of these risks, uncertainties, and other factors, please see the “Cautionary Note on Forward-Looking Statements” at the end of this presentation and “Item 1A. Risk Factors” in our Annual Report on Form 10-K for the year ended December 31, 2020, as updated by subsequent Quarterly Reports on Form 10-Q and Current Reports on Form 8-K.
GAAP AND NON-GAAP FINANCIAL MEASURES
This presentation includes financial measures calculated in accordance with Generally Accepted Accounting Principles (“GAAP”) and non-GAAP financial measures. The non-GAAP financial measures are intended to be considered supplemental information to their comparable GAAP financial measures. The non-GAAP financial measures are defined and reconciled to the most comparable GAAP financial measures in the Appendix to this presentation.
ADDITIONAL INFORMATION
Calculated results may not sum due to rounding. N / M denotes “Not Meaningful.” All variances are year-over-year unless otherwise noted.
REPORTING CHANGES
Effective with 2021 reporting, certain costs for the benefit of the global enterprise previously reported in Automotive are now reported in Corporate Other, and costs and benefits related to connectivity previously reported in Mobility are now reported in Automotive. Prior period results have been updated to be consistent with 2021 reporting. For details, see Slides A12 - A14 of the Ford Motor Company Q4 & Full Year 2020 Earnings Presentation.
In addition, consistent with our adoption of ASU 2019-12 as of January 1, 2021, we no longer allocate a portion of our consolidated U.S. current and deferred tax expense to certain U.S. subsidiaries. As a result, Ford Credit’s income tax expense is reduced, and since this ASU was adopted on a retrospective basis, $875M of tax sharing payments from Ford Credit to Ford Motor Company in 2020 are now reclassified as distributions from Ford Credit and included in Adjusted Free Cash Flow.

3
The PlanTo Stay in the Game We Must:
Capitalize on our strengthsDisrupt ourselvesPartner for expertise and efficiency Lead the electrification revolution in areas of strength
To Grow and Win We Will:
Turn around automotive operations, compete like a challengerTreat customers like familyCreate must-have products and servicesSimplify everythingModernize everywhereCare for each other

4
First Quarter Highlights
Turn Around Automotive• Adjusted EBIT of $4.8B and a margin of 13.3% (10.8% excluding gain on Rivian), despite significant
disruption of semiconductor supply chain; North America EBIT margin of 12.8%, Europe 4.8%
• Overseas operations delivered EBIT of $0.5B, an improvement of $1.0B year over year
Must-Have ProductsAnd Services
• All-electric Mustang Mach-E on sale in NA and Europe; China accepting preorders for locally-built vehicles
• Continue to build-out connected services, including Ford Telematics, FORDLiive and BlueCruise
Electrification Revolution• $1B investment in new electric vehicle manufacturing center in Cologne, Germany
• Ford European passenger vehicles completely all-electric by 2030
4

5
First Quarter Financial Results
$0.89
Adj. FCF Adj. EBIT MarginAdj. EBITRevenue Adj. EPS
$(0.4)B 13.3%$4.8B$36.2BUp $1.8B Up $1.9B Up $5.4B Up 15.1 ppts Up $1.12
5Lincoln Vehicles

6
The Plan: Must-Have Products And Services
• Announced Ford Telematics Essentials; utilizes connected vehicle data to give customers access to vehicle health insights such as diagnostic trouble codes, oil life, engine hours and recalls
• Will allow fleets to track and plan maintenance and repair services with local dealers
• Available across the F-150 lineup, featuring more exportable power than any light-duty full-size pickup, allowing the vehicle to be used as a mobile generator
• Dealers in Texas loaned F-150 pickups with Pro Power Onboard to deliver power to many of those impacted by the February power outages
• High reservation-to-order conversion rate with 70% new customers to Ford
• Majority of orders for higher trim series (Outer Banks, Wildtrak, Badlands and First Edition)
• Expanding capacity to meet customer demand
Note: See slide A15 for related notes
Ford Telematics Pro Power OnboardBronco

7
• Launched FORDLiive in Europe, a connected uptime system to help Ford commercial vehicle operators increase their productivity by maximizing vehicle uptime
• The system is available for all Ford connected commercial vehicles
• BlueCruise allows hands-free highway driving on more than 100,000 miles of prequalified sections of divided highways in North America called Hands-Free Blue Zones
• Over-the-Air software updates will enable BlueCruise capability on F-150 and Mustang Mach-E vehicles later this year
• Over 500,000 miles of development testing completed; BlueCruise will give drivers the comfort and confidence of hands-free highway driving
• All-electric Mustang Mach-E on sale in North America and Europe
• Charging network continues to grow with 16,000 charging stations in NA and over 174,000 in the EU
• Accepting preorders from China customers through direct sales network; local production to begin later this year
• Announced China charging network with State Grid and NIO; first automaker to offer “plug-and-charge” convenience in China
The Plan: Must-Have Products And Services
Note: See slide A15 for related notes
BlueCruiseMustang Mach-E FORDLiive

8
• Investing $1B in a new electric vehicle manufacturing center in Cologne, Germany as part of ~$22B* electrification investment
• Ford’s first European-built, volume all-electric passenger vehicle for European customers will be assembled in Cologne starting in 2023
• By mid-2026, all Ford European passenger vehicles will be plug-in hybrid or all-electric; completely all-electric by 2030
• By 2024, all Ford European commercial vehicles will be zero-emission capable. By 2030, two-thirds of commercial vehicles expected to be all-electric or plug-in hybrid
The Plan: LeadElectrificationRevolution
* 2016 - 2025
9
$0.5
$(2.2)
$(4.8)
$6.6
$1.9
$(0.4)
Q4 Q1 Q2 Q3 Q4 Q1
$22.3
$34.3
$39.3
$29.5 $30.8 $31.3
$35.4 $35.1
$39.8
$45.5 $46.9 $47.2
Q4 Q1 Q2 Q3 Q4 Q1
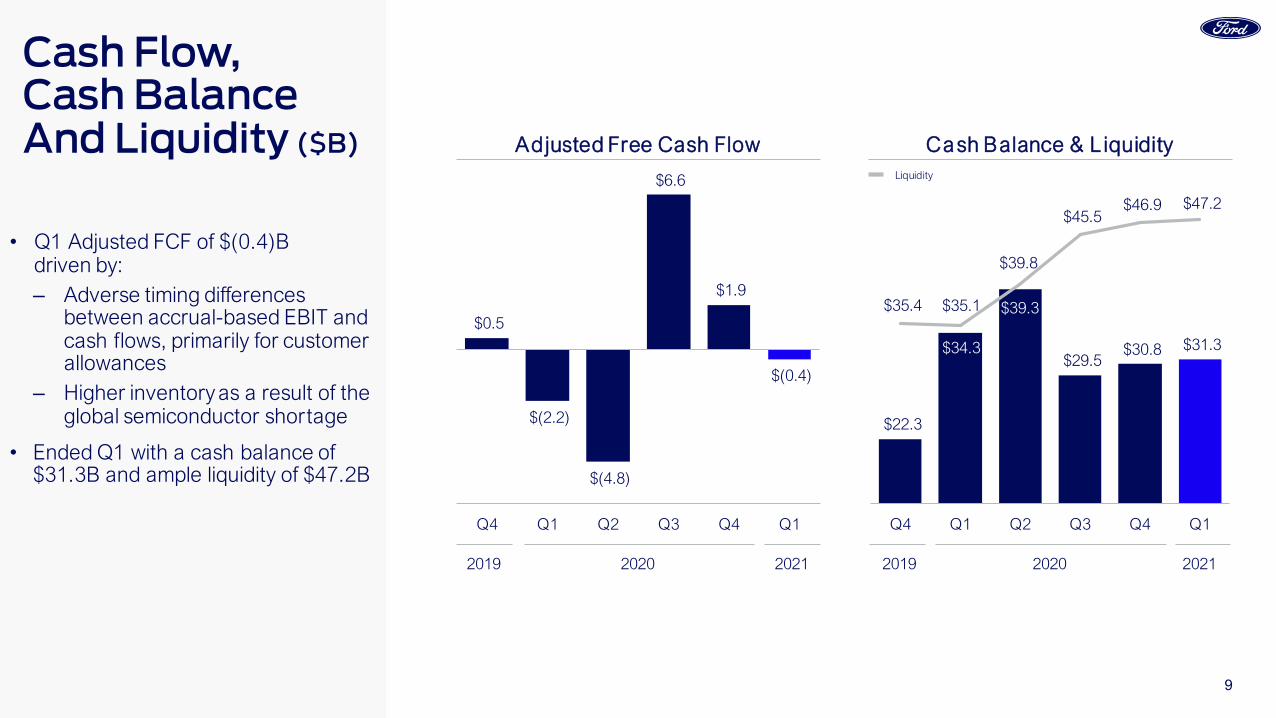
• Q1 Adjusted FCF of $(0.4)B driven by:‒ Adverse timing differences
between accrual-based EBIT and cash flows, primarily for customer allowances
‒ Higher inventory as a result of the global semiconductor shortage
• Ended Q1 with a cash balance of $31.3B and ample liquidity of $47.2B
Cash Flow, Cash Balance And Liquidity ($B) Adjusted Free Cash Flow Cash Balance & L iquidity
Liquidity
2019 2020 2021 2019 2020 2021

10
$0.5
$(0.6)
$(1.9)
$3.6
$1.7
$4.8
Q4 Q1 Q2 Q3 Q4 Q1
$39.7
$34.3
$19.4
$37.5 $36.0 $36.2
1,354
1,126
645
1,1781,238
1,062
Q4 Q1 Q2 Q3 Q4 Q1
• Q1 wholesale units down 6%, driven by the global semiconductor shortage
• Revenue up 6%, driven by higher net pricing, favorable mix and stronger currencies, offset partially by lower volume
• Adjusted EBIT of $4.8B, up $5.4B, driven by:
– Higher net pricing
– Higher Ford Credit EBT
– Investment gain of $0.9B based on Rivian’s January Series F funding round
– Lower structural costs
• Adjusted EBIT Margin of 13.3%, up 15.1 ppts; 10.8% excluding Rivian gain
Revenue And EBIT Metrics
Wholesale Units
YoY: YoY:
Revenue (5)% (15)% (50)% 1% (9)% 6% Adj. EBIT (67)% (126)% N / M 103% N / M N / M
Wholesale Units (8)% (21)% (53)% (5)% (9)% (6)% Adj. Margin (2.3) ppts (7.9) ppts (14.3) ppts 4.9 ppts 3.6 ppts 15.1 ppts
Adj. EBIT Margin 1.2% (1.8)% (10.0)% 9.7% 4.8% 13.3%
Wholesale Units (000) &Revenue ($B)
Adjusted EBIT ($B) &EBIT Margin (%)
2019 2020 2021 2019 2020 2021

11
$3.4
$(0.2)
$1.0 $0.6
$4.8
$(0.5) $(0.4)$(0.7)
$3.3
AutomotiveNet Income /
(Loss)(GAAP)
Ford CreditMobility CorporateOther
Company Adj. EBIT
Interest On Debt
SpecialItems
Taxes /Non-Controlling
Interests
B / (W) Q1 2020 $3.6 $0.1 $0.9 $0.9 $5.4 $(0.2) $(0.1) $0.2 $5.3Q4 2020 2.1 0.1 0.1 0.8 3.1 0.0 4.6 (1.7) 6.1
• Company Adjusted EBIT of $4.8B, up $5.4B, driven by improvement in Automotive, Ford Credit and Corporate Other
• Corporate Other includes $0.9B gain on our investment in Rivian
• Special Items of $(0.4)B reflects primarily global redesign actions in South America and Europe
Q1 2021 Results ($B)
12
Nor thAmerica
SouthAmerica
Europe China IMGTotalAuto
TotalCompany
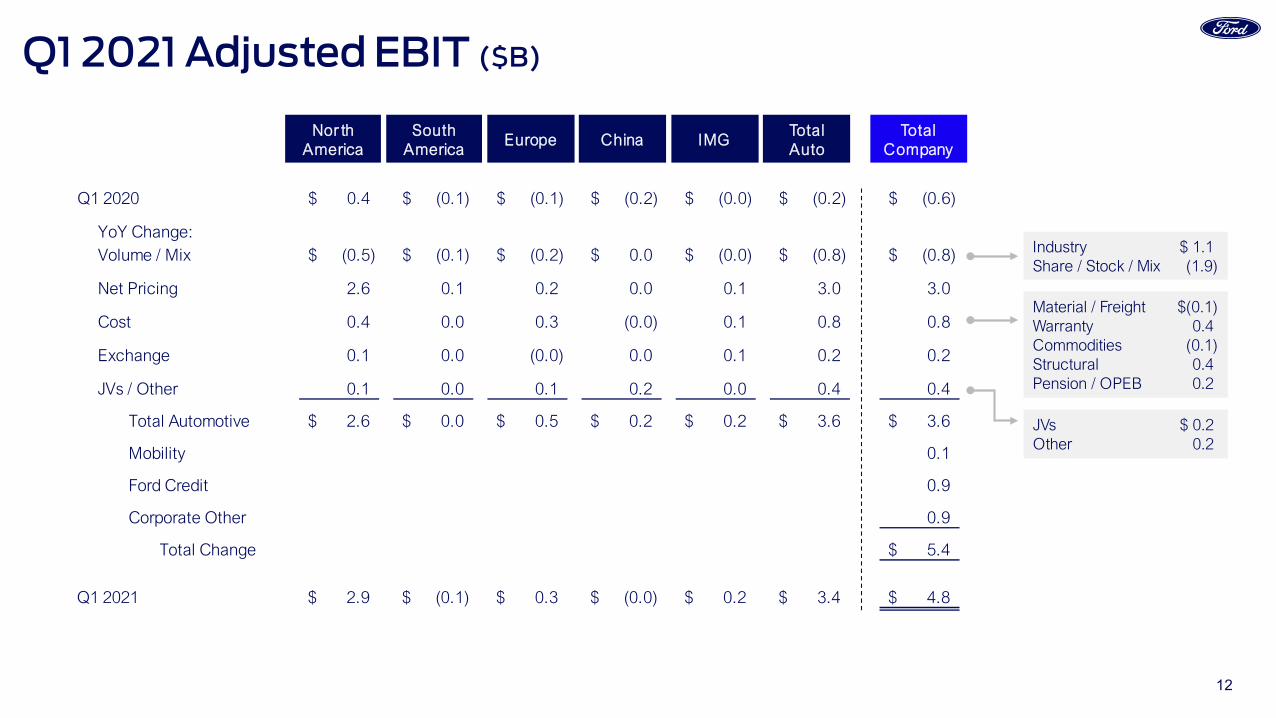
Industry $ 1.1Share / Stock / Mix (1.9)
JVs $ 0.2Other 0.2
Material / Freight $(0.1)Warranty 0.4Commodities (0.1)Structural 0.4Pension / OPEB 0.2
Q1 2021 Adjusted EBIT ($B)
Q1 2020 0.4$ (0.1)$ (0.1)$ (0.2)$ (0.0)$ (0.2)$ (0.6)$
YoY Change:Volume / Mix (0.5)$ (0.1)$ (0.2)$ 0.0$ (0.0)$ (0.8)$ (0.8)$
Net Pricing 2.6 0.1 0.2 0.0 0.1 3.0 3.0
Cost 0.4 0.0 0.3 (0.0) 0.1 0.8 0.8
Exchange 0.1 0.0 (0.0) 0.0 0.1 0.2 0.2
JVs / Other 0.1 0.0 0.1 0.2 0.0 0.4 0.4
Total Automotive 2.6$ 0.0$ 0.5$ 0.2$ 0.2$ 3.6$ 3.6$
Mobility 0.1
Ford Credit 0.9
Corporate Other 0.9
Total Change 5.4$
Q1 2021 2.9$ (0.1)$ 0.3$ (0.0)$ 0.2$ 3.4$ 4.8$

13
Q1 Headlines
Q4 2019 Q3 2020Q1 2020 Q2 2020 Q4 2020 Q1 2021
Q4 2019 Q3 2020Q1 2020 Q2 2020 Q4 2020 Q1 2021
Q4 2019 Q3 2020Q1 2020 Q2 2020 Q4 2020 Q1 2021
Wholesale Units (000)
Revenue ($B)
EBIT ($B)
$0.7 $0.4
$(0.9)
$3.2
$1.1
$2.9
$25.3 $21.8
$10.9
$25.3 $22.0 $23.0
YoY (2)% (14)% (54)% 8% (13)% 5%
EBIT YoY (64)% (83)% (156)% 59% 53% N / M
EBIT Margin 2.8% 1.7% (8.6)% 12.6% 4.9% 12.8%
681 619
272
651 540 533
YoY (8)% (18)% (61)% 2% (21)% (14)%
North America
• Wholesales declined 14% YoY, driven by semiconductor supply constraints
• Revenue up 5%, reflecting strong customer demand for new product portfolio and higher industry-wide net pricing on lower dealer inventories from semiconductor shortage
• EBIT of $2.9B, up $2.6B; EBIT margin 12.8%
• New product portfolio, including successful launch of F-150, Mach-E and Bronco Sport, aided profitable growth; 70% of Mustang Mach-E customers new to Ford
• Semiconductor shortage accelerating modernization of sales processes, transitioning to lean inventory sales model with higher turn rates and leveraging new customer ordering capabilities
• Improved quality processes gaining traction; warranty expense down $0.4B
Q1 Key Performance Indicators• U.S. market share 13.1%, 1.3 ppts lower YoY. Quality of share improved, with retail up
1 ppt to 9.9% and fleet share down, driven by lower rental sales
• U.S. retail average transaction price increased by $2,934 per unit
• YoY cost performance of $0.4B, driven by lower warranty expense

14
Q1 Headlines
Q4 2019 Q3 2020Q1 2020 Q2 2020 Q4 2020 Q1 2021
Q4 2019 Q3 2020Q1 2020 Q2 2020 Q4 2020 Q1 2021
Q4 2019 Q3 2020Q1 2020 Q2 2020 Q4 2020 Q1 2021
Wholesale Units (000)
Revenue ($B)
EBIT ($B)
$(0.2)
$(0.1)
$(0.2)
$(0.1) $(0.1)$(0.1)
$1.0 $0.7
$0.2
$0.6 $0.9
$0.4
74 59
14
48 63
18
South America
• EBIT of $(0.1)B, our best quarterly EBIT since Q3 2013; marks the sixth consecutive quarter of YoY EBIT improvement
• Significant restructuring of the business progressing as planned
• Accelerating transition to a lean, de-risked and asset-light business model focused on portfolio strengths with growth of Ranger pickup, Transit van and key imports
YoY (22)% (21)% (75)% (39)% (10)% (40)%
YoY (17)% (13)% (81)% (39)% (15)% (70)%
• Strong Ranger performance with Q1 segment share of 16.8%, up 2.3 ppts
• Structural costs down 33% YoY; achieved $0.8B annual structural cost reduction since 2018
• Headcount down 5% YoY
EBIT YoY 12% 28% 19% 34% 40% 35%
EBIT Margin (18.2)% (15.4)% (68.1)% (17.0)% (12.2)% (16.7)%
Q1 Key Performance Indicators

15
Q1 Headlines
Q4 2019 Q3 2020Q1 2020 Q2 2020 Q4 2020 Q1 2021
Q4 2019 Q3 2020Q1 2020 Q2 2020 Q4 2020 Q1 2021
Q4 2019 Q3 2020Q1 2020 Q2 2020 Q4 2020 Q1 2021
Wholesale Units (000)
Revenue ($B)
EBIT ($B)
$0.1
$(0.1)
$(0.7)$(0.4)
$0.4 $0.3
$7.0 $6.2
$3.6
$5.7 $7.1 $7.1
341 288
154 239
339 278
Europe
• EBIT of $0.3B, up $0.5B on 4% lower wholesales; EBIT margin of 4.8%
• Commercial vehicle share reached a record high; launched new FORDLiive connected uptime system in our segment-leading commercial vehicle business
• Moving to the next phase of Europe transformation with a commitment to an all-electric future
• Announced electrification plan for Cologne; next-generation 1T Transit / VW alliance product to be manufactured by our low-cost Turkey JV
• Further reduced Western European headcount; now 11K lower since the start of the transformation
* Includes Ford brand vehicles produced and sold by our unconsolidated affiliate in Turkey(about 11K units in Q1 2020 and 17K units in Q1 2021). Revenue does not include these sales
YoY (1)% (16)% (51)% (10)% 1% 13%
YoY (2)% (25)% (58)% (20)% (1)% (4)%
• EU20 commercial vehicle share 15.9%, up 1.0 ppt; utility mix 30.4%, up 11.5 ppts
• Net pricing up $0.2B
• Structural costs down $0.2B
EBIT YoY 153% N / M N / M N / M N / M N / M
EBIT Margin 1.0% (2.4)% (18.5)% (7.8)% 5.8% 4.8%
Wholesale Units* (000)
Q1 Key Performance Indicators
16
Q1 Headlines
Q4 2019 Q3 2020Q1 2020 Q2 2020 Q4 2020 Q1 2021
Q4 2019 Q3 2020Q1 2020 Q2 2020 Q4 2020 Q1 2021
Q4 2019 Q3 2020Q1 2020 Q2 2020 Q4 2020 Q1 2021
Wholesale Units (000)
Revenue ($B)
EBIT ($B)
Total
China YoY (7)% (29)% 34% 22% 27% 85%
$(0.2)$(0.2)
$(0.1)
$(0.1)$(0.1)
$(0.0)
$1.0
$0.6 $0.8
$1.0 $0.8 $0.8
China
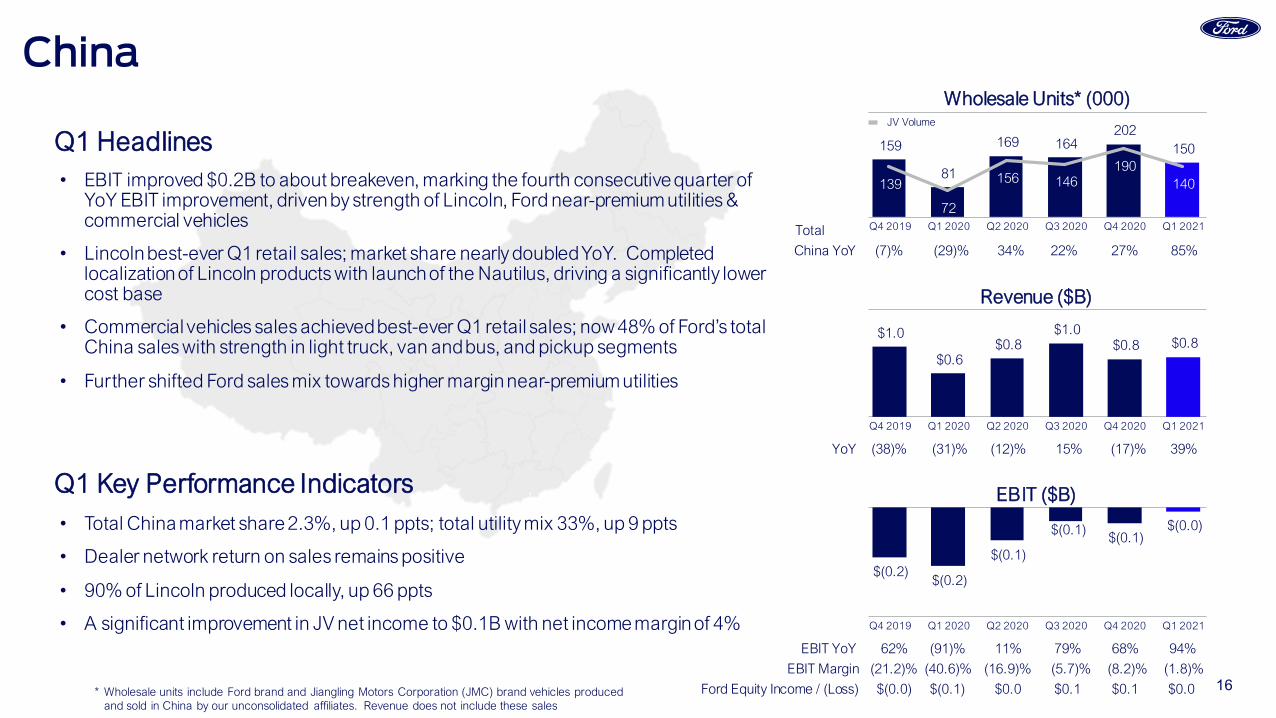
• EBIT improved $0.2B to about breakeven, marking the fourth consecutive quarter of YoY EBIT improvement, driven by strength of Lincoln, Ford near-premium utilities & commercial vehicles
• Lincoln best-ever Q1 retail sales; market share nearly doubled YoY. Completed localization of Lincoln products with launch of the Nautilus, driving a significantly lower cost base
• Commercial vehicles sales achieved best-ever Q1 retail sales; now 48% of Ford’s total China sales with strength in light truck, van and bus, and pickup segments
• Further shifted Ford sales mix towards higher margin near-premium utilities
* Wholesale units include Ford brand and Jiangling Motors Corporation (JMC) brand vehicles producedand sold in China by our unconsolidated affiliates. Revenue does not include these sales
YoY (38)% (31)% (12)% 15% (17)% 39%
159
81
169 164 202
150
139
72
156 146 190
140
JV Volume
• Total China market share 2.3%, up 0.1 ppts; total utility mix 33%, up 9 ppts
• Dealer network return on sales remains positive
• 90% of Lincoln produced locally, up 66 ppts
• A significant improvement in JV net income to $0.1B with net income margin of 4%EBIT YoY 62% (91)% 11% 79% 68% 94%
EBIT Margin (21.2)% (40.6)% (16.9)% (5.7)% (8.2)% (1.8)%
Ford Equity Income / (Loss) $(0.0) $(0.1) $0.0 $0.1 $0.1 $0.0
Wholesale Units* (000)
Q1 Key Performance Indicators

17
Q1 Headlines
Q4 2019 Q3 2020Q1 2020 Q2 2020 Q4 2020 Q1 2021
Q4 2019 Q3 2020Q1 2020 Q2 2020 Q4 2020 Q1 2021
Q4 2019 Q3 2020Q1 2020 Q2 2020 Q4 2020 Q1 2021
Wholesale Units (000)
Revenue ($B)
EBIT ($B)
$(0.2)
$(0.0)$(0.1)
$0.1
$(0.1)
$0.2
$2.4 $2.0
$1.0
$2.0 $2.5
$2.3
98 78
36
76 93
82
International Markets Group
• EBIT of $0.2B, up $0.2B; achieved best quarterly EBIT
• All markets are profitable, except India
• Ranger recognized as Car of the Year in Thailand and best-selling pickup in Vietnam and Cambodia
• FordPass launched in South Africa on Ranger; connected functionality enhances customer experience
• Investing $1B to modernize our South Africa manufacturing, expanding our Ranger capacity to meet customer demand in more than 100 global markets
* Includes Ford brand vehicles produced and sold by our unconsolidated affiliate in Russia(about 3K units in Q1 2020 and 2021). Revenue does not include these sales
YoY (19)% (25)% (60)% (11)% 5% 15%
YoY (22)% (27)% (64)% (18)% (5)% 5%
• Total share 1.7%, up 0.2 ppts
• Ranger total segment share 14.4%, up 1.4 ppts
• Everest total segment share 14.5%, up 0.6 ppts
• Structural costs down 18% EBIT YoY N / M N / M (115)% 181% 64% N / M
EBIT Margin (7.1)% (1.3)% (14.6)% 3.6% (2.4)% 8.9%
Wholesale Units* (000)
Q1 Key Performance Indicators

18
Q4 2019 Q3 2020Q1 2020 Q2 2020 Q4 2020 Q1 2021
EBIT ($B)
Q1 Headlines
Q1 EBIT YoY ($B)
Mobility
• Ford AV LLC celebrated its third anniversary in Miami with the addition of a new 140,000 square foot command center
• In partnership with Ford, Argo AI is now simulating ride-hail and delivery operations across six cities in advance of multiple customer pilot programs launching later this year
• Spin progress continues; unit economics improved by more than 60% compared with a year ago
$(0.3) $(0.3) $(0.3)$(0.2) $(0.3) $(0.2)
YoY (43)% (27)% (43)% (2)% 8% 31%
Q1 2020 (0.3)$
Autonomous Vehicles 0.1$ Other Mobility 0.0
Total Change 0.1$
Q1 2021 (0.2)$

19
Q1 Headlines
Q4 2019 Q3 2020Q1 2020 Q2 2020 Q4 2020 Q1 2021
Q4 2019 Q3 2020Q1 2020 Q2 2020 Q4 2020 Q1 2021
Q4 2019 Q3 2020Q1 2020 Q2 2020 Q4 2020 Q1 2021
EBT ($B)
U.S. Retail LTR Ratios (%)
Auction Values (Per Unit)*
Q1 Key Performance IndicatorsQ1 EBT YoY ($B)
• ROE 22%, up 22 ppts
• Net liquidity $33.7B, up $5.6B
• Managed leverage 7.3
• Distributions $1.0B, up $0.7B
0.63% 0.62%
0.15%0.30%
0.37%0.22%
Ford Credit
• EBT of $1.0B, up $0.9B, reflecting non-recurrence of increase in credit loss reserves due to COVID-19 and strong auction performance
• Portfolio performing well – loss-to-receivables (LTR) remains low, reflecting historically low losses; auction values, at record-high levels, improved significantly from a year ago
• Balance sheet and liquidity remain strong
* U.S. 36-month off-lease auction values at Q1 2021 mix
$0.6
$0.0
$0.5
$1.1 $0.9 $1.0
$18,905 $19,235 $19,835
$21,340 $20,450
$21,925
Q1 2020 0.0$
Volume / Mix (0.0)$ Financing Margin 0.0 Credit Loss 0.6 Lease Residual 0.4 Exchange 0.0 Other (0.1)
Total Change 0.9$
Q1 2021 1.0$
20
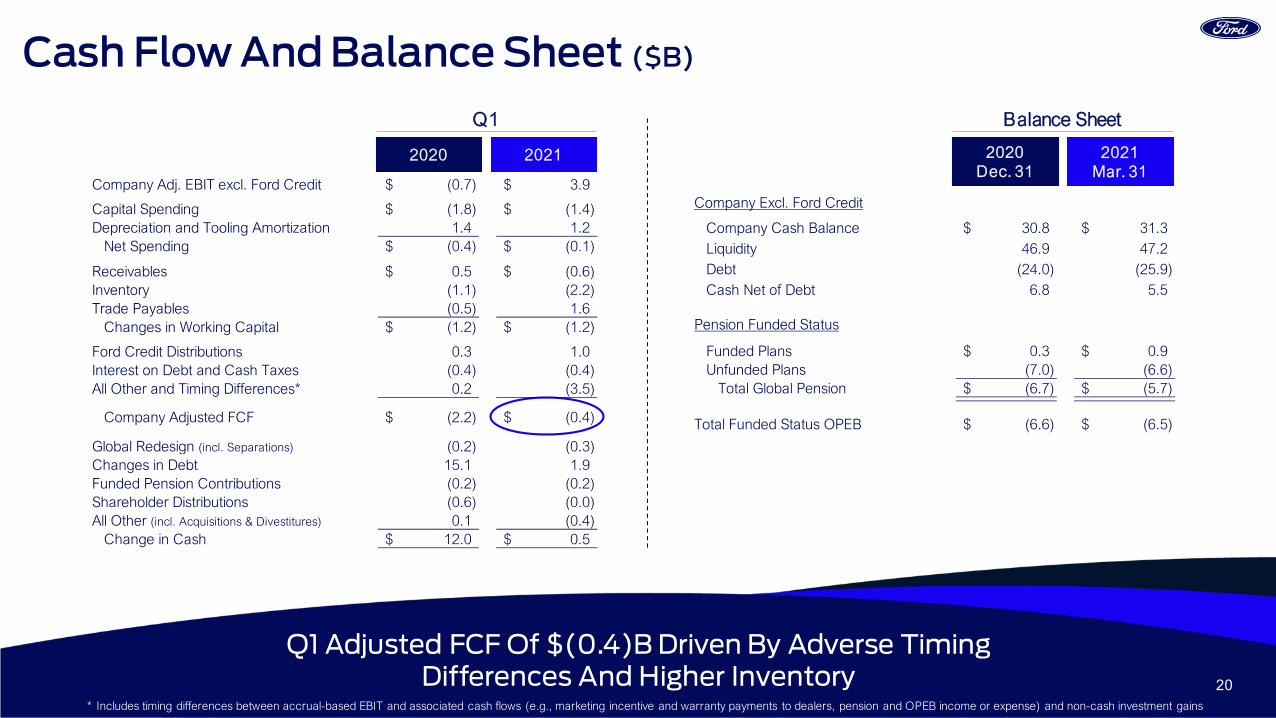
Cash Flow And Balance Sheet ($B)
Q1 Adjusted FCF Of $(0.4)B Driven By Adverse Timing Differences And Higher Inventory
Balance Sheet
2021Mar. 31
2020Dec. 31
Q1
20212020
Company Excl. Ford Credit
Company Cash Balance 30.8$ 31.3$ Liquidity 46.9 47.2Debt (24.0) (25.9)Cash Net of Debt 6.8 5.5
Pension Funded Status
Funded Plans 0.3$ 0.9$ Unfunded Plans (7.0) (6.6)
Total Global Pension (6.7)$ (5.7)$
Total Funded Status OPEB (6.6)$ (6.5)$
* Includes timing differences between accrual-based EBIT and associated cash flows (e.g., marketing incentive and warranty payments to dealers, pension and OPEB income or expense) and non-cash investment gains
Company Adj. EBIT excl. Ford Credit (0.7)$ 3.9$
Capital Spending (1.8)$ (1.4)$ Depreciation and Tooling Amortization 1.4 1.2
Net Spending (0.4)$ (0.1)$
Receivables 0.5$ (0.6)$ Inventory (1.1) (2.2) Trade Payables (0.5) 1.6
Changes in Working Capital (1.2)$ (1.2)$
Ford Credit Distributions 0.3 1.0Interest on Debt and Cash Taxes (0.4) (0.4)All Other and Timing Differences* 0.2 (3.5)
Company Adjusted FCF (2.2)$ (0.4)$
Global Redesign (incl. Separations) (0.2) (0.3) Changes in Debt 15.1 1.9 Funded Pension Contributions (0.2) (0.2) Shareholder Distributions (0.6) (0.0) All Other (incl. Acquisitions & Divestitures) 0.1 (0.4)
Change in Cash 12.0$ 0.5$

21
Special Items ($B)
2021 Global Redesign Primarily South America; Total Global Redesign Of ~$10B EBIT Charges And ~$5B Cash Effects Through 2021
Global Redesign
Potential 2022+ Actions and Cash EffectsPotential 2021 Actions and Cash EffectsRecorded 2018 - 2020
$7.1
$1.6
1.45
1.9
~$11
~$7
EBIT Charges Cash Effects
$2.2 - $2.7
$3.0 - $3.5
~$1
~$2
Q1
20212020
Global RedesignEurope excl. Russia (0.1)$ (0.1)$ India (0.0) - South America (0.0) (0.3) Russia 0.0 0.0 China (0.0) (0.0) Separations and Other (Not Included Above) (0.0) (0.0)
Subtotal Global Redesign (0.1)$ (0.4)$
NA Hourly Buyouts / Other (0.2) (0.0)
Pension and OPEB Gain / (Loss)Pension and OPEB Remeasurement 0.0$ 0.1$ Pension Settlements and Curtailments (0.0) (0.0) Subtotal Pension and OPEB Gain / (Loss) 0.0$ 0.0$
Total EBIT Special Items (0.3)$ (0.4)$
Cash Effects of Global Redesign (Incl. Separations) (0.2)$ (0.3)$
22
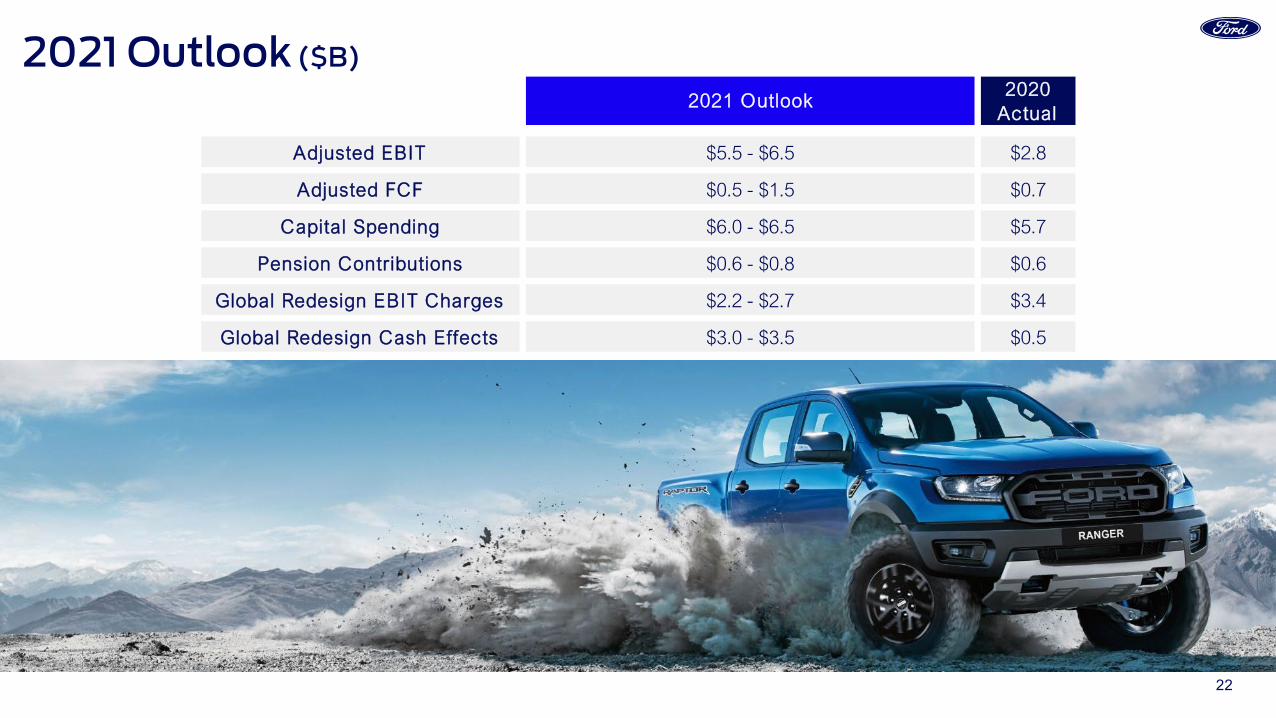
2021 Outlook ($B)2021 Outlook
2020 Actual
Adjusted EBIT $5.5 - $6.5 $2.8
Adjusted FCF $0.5 - $1.5 $0.7
Capital Spending $6.0 - $6.5 $5.7
Pension Contributions $0.6 - $0.8 $0.6
Global Redesign EBIT Charges $2.2 - $2.7 $3.4
Global Redesign Cash Effects $3.0 - $3.5 $0.5

23
Perspectives On 2021
Tailwinds / Headwinds Global Semiconductor Shortage
Segment And Regional EBIT Calendarization Of EBIT And Cash Flow
• Ford lost about 200K units or 17% of planned production in Q1; outlook assumes about 50% of planned production lost in Q2 (700K units) and about 10% losses in second half (200K units), with limited opportunity to recover lost production within 2021
• Full year outlook assumes 1.1M units lost with a $(2.5)B EBIT and $(3.0)B FCF impact
• Global semiconductor shortage may not be fully resolved until 2022
• All Automotive Business Units improved except IMG; Mobility flat; Ford Credit EBT improved
Tailwinds: Non-recurrence of COVID shutdown-related volume losses net of structural cost offsets, strong must-have products, Rivian gain, warranty and material costs, strong new vehicle demand
Headwinds: Global semiconductor shortage; higher commodity costs, up about $2.5B YoY
Adj. EBIT: Q1 expected to be the best quarter. Due to the Renesas fire, Q2 expected to be a loss with Q2 losses recovered in second half
Adj. FCF: Significantly negative free cash flow expected in Q2 with recovery in second half
24
Statements included or incorporated by reference herein may constitute “forward-looking statements” within the meaning of the Private Securities Litigation Reform Act of 1995. Forward-looking statements are based on expectations, forecasts, and assumptions by our management and involve a number of risks, uncertainties, and other factors that could cause actual results to differ materially from those stated, including, without limitation:
• Ford and Ford Credit’s financial condition and results of operations have been and may continue to be adversely affected by public health issues, including epidemics or pandemics such as COVID-19;
• Ford is highly dependent on its suppliers to deliver components in accordance with Ford’s production schedule, and a shortage of key components, such as semiconductors, can disrupt Ford’s production of vehicles;
• Ford’s long-term competitiveness depends on the successful execution of its Plan;
• Ford’s vehicles could be affected by defects that result in delays in new model launches, recall campaigns, or increased warranty costs;• Ford may not realize the anticipated benefits of existing or pending strategic alliances, joint ventures, acquisitions, divestitures, or new business strategies;
• Operational systems, security systems, and vehicles could be affected by cyber incidents and other disruptions;
• Ford’s production, as well as Ford’s suppliers’ production, could be disrupted by labor issues, natural or man-made disasters, financial distress, production difficulties, or other factors;
• Ford’s ability to maintain a competitive cost structure could be affected by labor or other constraints;
• Ford’s ability to attract and retain talented, diverse, and highly skilled employees is critical to its success and competitiveness;
• Ford’s new and existing products and mobility services are subject to market acceptance and face significant competition from existing and new entrants in the automotive and mobility industries;
• Ford’s results are dependent on sales of larger, more profitable vehicles, particularly in the United States;
• With a global footprint, Ford’s results could be adversely affected by economic, geopolitical, protectionist trade policies, or other events, including tariffs;
• Industry sales volume in any of Ford’s key markets can be volatile and could decline if there is a financial crisis, recession, or significant geopolitical event;
• Ford may face increased price competition or a reduction in demand for its products resulting from industry excess capacity, currency fluctuations, competitive actions, or other factors;• Fluctuations in commodity prices, foreign currency exchange rates, interest rates, and market value of Ford or Ford Credit’s investments can have a significant effect on results;
• Ford and Ford Credit’s access to debt, securitization, or derivative markets around the world at competitive rates or in sufficient amounts could be affected by credit rating downgrades, market volatility, market disruption, regulatory requirements, or other factors;
• Ford’s receipt of government incentives could be subject to reduction, termination, or clawback;
• Ford Credit could experience higher-than-expected credit losses, lower-than-anticipated residual values, or higher-than-expected return volumes for leased vehicles;
• Economic and demographic experience for pension and other postretirement benefit plans (e.g., discount rates or investment returns) could be worse than Ford has assumed;
• Pension and other postretirement liabilities could adversely affect Ford’s liquidity and financial condition;
• Ford could experience unusual or significant litigation, governmental investigations, or adverse publicity arising out of alleged defects in products, perceived environmental impacts, or otherwise;
• Ford may need to substantially modify its product plans to comply with safety, emissions, fuel economy, autonomous vehicle, and other regulations;
• Ford and Ford Credit could be affected by the continued development of more stringent privacy, data use, and data protection laws and regulations as well as consumers’ heightened expectations to safeguard their personal information; and
• Ford Credit could be subject to new or increased credit regulations, consumer protection regulations, or other regulations.
We cannot be certain that any expectation, forecast, or assumption made in preparing forward-looking statements will prove accurate, or that any projection will be realized. It is to be expected that there may be differences between projected and actual results. Our forward-looking statements speak only as of the date of their initial issuance, and we do not undertake any obligation to update or revise publicly any forward-looking statement, whether as a result of new information, future events, or otherwise. For additional discussion, see “Item 1A. Risk Factors” in our Annual Report on Form 10-K for the year ended December 31, 2020, as updated by subsequent Quarterly Reports on Form 10-Q and Current Reports on Form 8-K.
Cautionary Note On Forward-Looking Statements

Appendix
Lincoln Zephyr Preview Vehicle
Note: See slide A15 for related notes

26
North America 681 619 272 651 540 533 12.8 % 13.6 % 14.2 % 13.6 % 12.1 % 12.5 %
South America 74 59 14 48 63 18 6.9 6.9 6.5 5.7 6.0 3.6
Europe 341 288 154 239 339 278 7.4 6.9 7.1 7.8 7.1 7.2
China 159 81 169 164 202 150 2.0 2.2 2.5 2.4 2.4 2.3
International Markets Group 98 78 36 76 93 82 1.9 1.5 1.6 1.7 2.0 1.7
Total Automotive 1,354 1,126 645 1,178 1,238 1,062 5.7 % 6.0 % 5.8 % 6.0 % 5.4 % 5.3 %
North America 25.3$ 21.8$ 10.9$ 25.3$ 22.0$ 23.0$ (2) % (14) % (54) % 8 % (13) % 5 %
South America 1.0 0.7 0.2 0.6 0.9 0.4 (22) (21) (75) (39) (10) (40)
Europe 7.0 6.2 3.6 5.7 7.1 7.1 (1) (16) (51) (10) 1 13
China 1.0 0.6 0.8 1.0 0.8 0.8 (38) (31) (12) 15 (17) 39
International Markets Group 2.4 2.0 1.0 2.0 2.5 2.3 (19) (25) (60) (11) 5 15
Total Automotive 36.7$ 31.3$ 16.6$ 34.7$ 33.2$ 33.6$ (5) % (16) % (54) % 2 % (9) % 7 %
Revenue Change (%)
Market Share (%)Wholesale Units (000)
Revenue ($B)
Q4 2020 Q1 2021Q1 2021 Q4 2019 Q1 2020 Q2 2020 Q3 2020Q4 2019 Q1 2020 Q2 2020 Q3 2020 Q4 2020
Q4 2019 Q1 2020 Q2 2020 Q3 2020 Q4 2020 Q4 2020 Q1 2021Q1 2021 Q4 2019 Q1 2020 Q2 2020 Q3 2020
Key Metrics
A2

27
North America 0.7$ 0.4$ (0.9)$ 3.2$ 1.1$ 2.9$ (64) % (83) % (156) % 59 % 53 % N / M %
South America (0.2) (0.1) (0.2) (0.1) (0.1) (0.1) 12 28 19 34 40 35
Europe 0.1 (0.1) (0.7) (0.4) 0.4 0.3 153 N / M N / M N / M N / M N / M
China (0.2) (0.2) (0.1) (0.1) (0.1) (0.0) 62 (91) 11 79 68 94
International Markets Group (0.2) (0.0) (0.1) 0.1 (0.1) 0.2 N / M N / M (115) 181 64 N / M
Total Automotive 0.2$ (0.2)$ (2.1)$ 2.7$ 1.3$ 3.4$ (80) % (108) % N / M % 98 % N / M % N / M %
North America 2.8 % 1.7 % (8.6) % 12.6 % 4.9 % 12.8 % (4.8) (7.0) (15.7) 4.0 2.1 11.1
South America (18.2) (15.4) (68.1) (17.0) (12.2) (16.7) (1.8) 1.4 (47.3) (1.3) 6.0 (1.3)
Europe 1.0 (2.4) (18.5) (7.8) 5.8 4.8 2.9 (3.5) (20.0) (5.5) 4.8 7.2
China (21.2) (40.6) (16.9) (5.7) (8.2) (1.8) 13.1 (26.0) (0.2) 26.1 13.0 38.8
International Markets Group (7.1) (1.3) (14.6) 3.6 (2.4) 8.9 (8.4) (1.6) (11.9) 7.5 4.7 10.2
Total Automotive 0.6 % (0.5) % (12.4) % 7.7 % 3.8 % 10.1 % (2.3) (5.9) (16.3) 3.7 3.2 10.6
Q1 2021
EBIT ($B) EBIT Change (%)
EBIT Margin Change (ppts)EBIT Margin (%)
Q4 2019 Q1 2020 Q2 2020 Q3 2020 Q4 2020
Q4 2019 Q1 2020 Q2 2020 Q3 2020 Q4 2020 Q1 2021 Q4 2019 Q1 2020 Q2 2020 Q3 2020 Q4 2020 Q1 2021
Q4 2019 Q1 2020 Q2 2020 Q3 2020 Q4 2020 Q1 2021
Key Metrics
ppts ppts ppts ppts ppts ppts
ppts ppts ppts ppts ppts ppts
A3
28
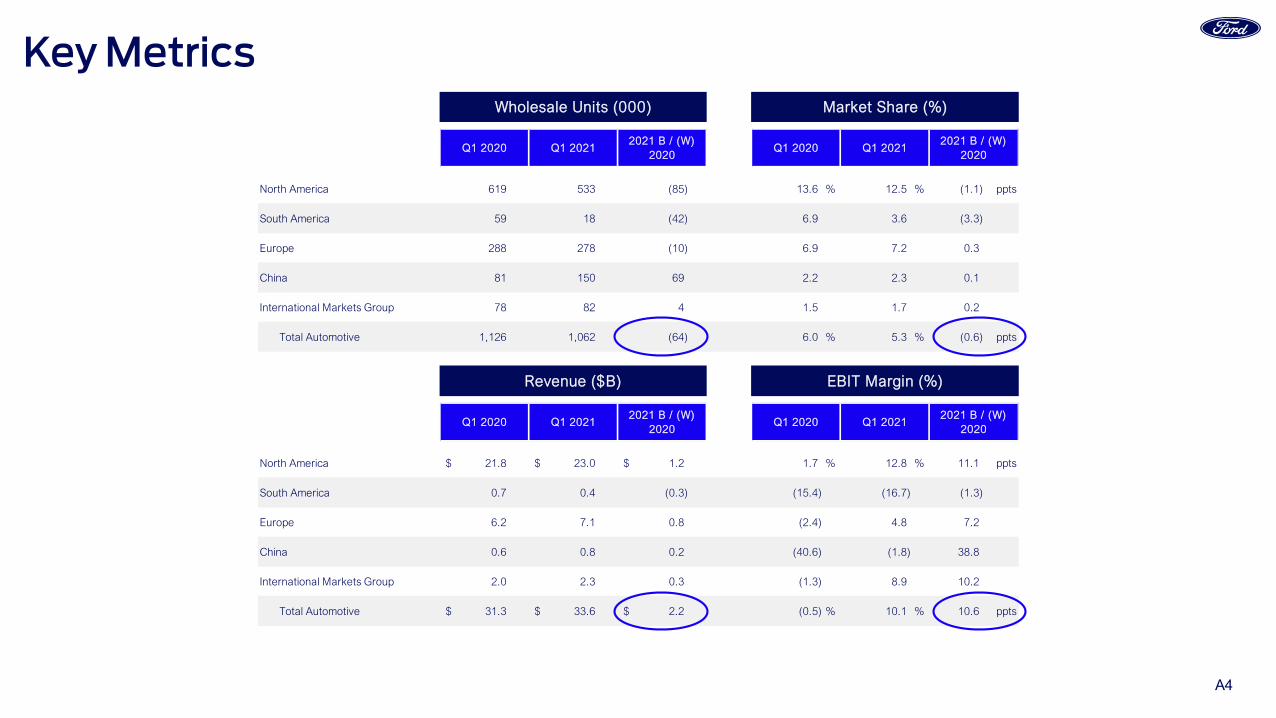
North America 619 533 (85) 13.6 % 12.5 % (1.1) ppts
South America 59 18 (42) 6.9 3.6 (3.3)
Europe 288 278 (10) 6.9 7.2 0.3
China 81 150 69 2.2 2.3 0.1
International Markets Group 78 82 4 1.5 1.7 0.2
Total Automotive 1,126 1,062 (64) 6.0 % 5.3 % (0.6) ppts
North America 21.8$ 23.0$ 1.2$ 1.7 % 12.8 % 11.1 ppts
South America 0.7 0.4 (0.3) (15.4) (16.7) (1.3)
Europe 6.2 7.1 0.8 (2.4) 4.8 7.2
China 0.6 0.8 0.2 (40.6) (1.8) 38.8
International Markets Group 2.0 2.3 0.3 (1.3) 8.9 10.2
Total Automotive 31.3$ 33.6$ 2.2$ (0.5) % 10.1 % 10.6 ppts
Q1 2020 Q1 20212021 B / (W)
2020
Wholesale Units (000)
2021 B / (W)2020
Revenue ($B)
Q1 2020 Q1 2021
Market Share (%)
EBIT Margin (%)
Q1 2020 Q1 20212021 B / (W)
2020
Q1 2020 Q1 20212021 B / (W)
2020
Key Metrics
A4
29
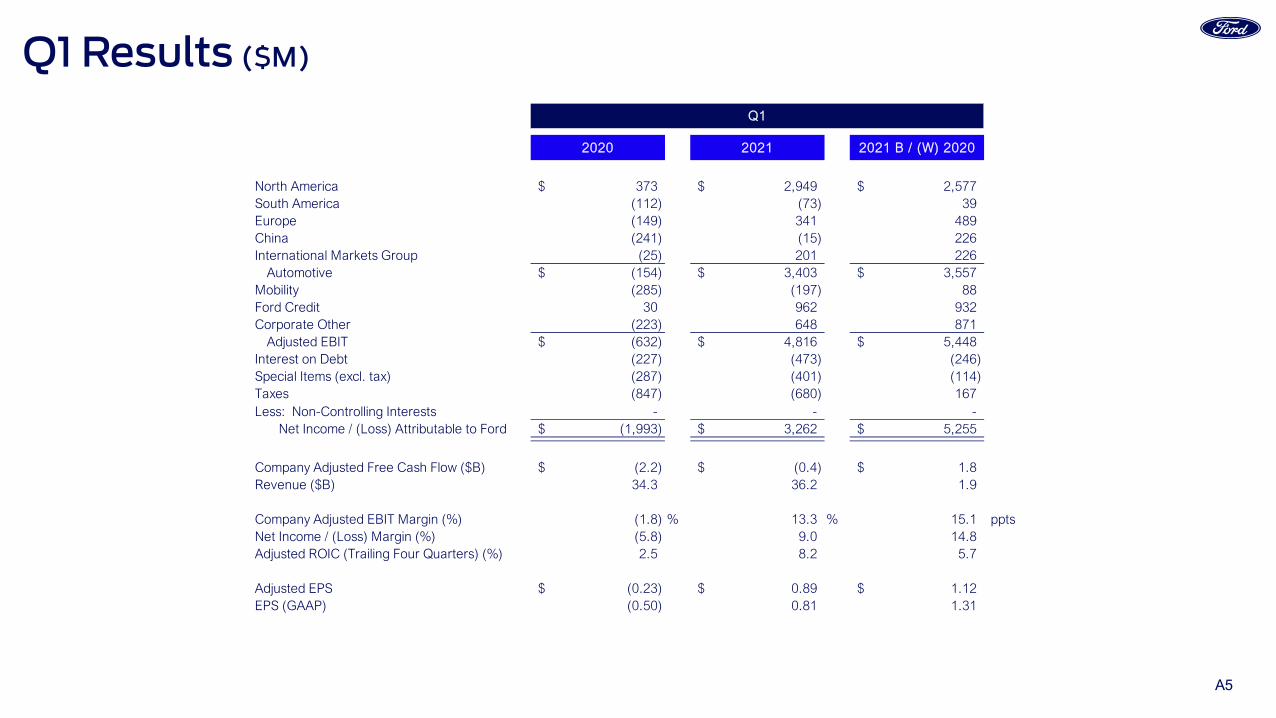
Q1 Results ($M)
2020 2021 2021 B / (W) 2020
North America 373$ 2,949$ 2,577$ South America (112) (73) 39 Europe (149) 341 489 China (241) (15) 226 International Markets Group (25) 201 226
Automotive (154)$ 3,403$ 3,557$ Mobility (285) (197) 88 Ford Credit 30 962 932 Corporate Other (223) 648 871
Adjusted EBIT (632)$ 4,816$ 5,448$ Interest on Debt (227) (473) (246) Special Items (excl. tax) (287) (401) (114) Taxes (847) (680) 167 Less: Non-Controlling Interests - - -
Net Income / (Loss) Attributable to Ford (1,993)$ 3,262$ 5,255$
Company Adjusted Free Cash Flow ($B) (2.2)$ (0.4)$ 1.8$ Revenue ($B) 34.3 36.2 1.9
Company Adjusted EBIT Margin (%) (1.8) % 13.3 % 15.1 pptsNet Income / (Loss) Margin (%) (5.8) 9.0 14.8 Adjusted ROIC (Trailing Four Quarters) (%) 2.5 8.2 5.7
Adjusted EPS (0.23)$ 0.89$ 1.12$ EPS (GAAP) (0.50) 0.81 1.31
Q1
A5

30
Quarterly Results ($M)
2019 2021
Full Year Q1 Q2 Q3 Q4 Full Year Q1
North America 6,639$ 373$ (947)$ 3,202$ 1,082$ 3,710$ 2,949$ South America (696) (112) (165) (107) (105) (489) (73) Europe (excl. Russia) 124 (149) (667) (444) 409 (851) 341 China (762) (241) (136) (57) (65) (499) (15) International Markets Group (323) (25) (149) 73 (62) (163) 201
Automotive 4,982$ (154)$ (2,063)$ 2,665$ 1,259$ 1,708$ 3,403$ Mobility (929) (285) (286) (230) (259) (1,060) (197) Ford Credit 2,998 30 543 1,123 912 2,608 962 Corporate Other (672) (223) (139) 86 (199) (476) 648
Adjusted EBIT 6,379$ (632)$ (1,946)$ 3,644$ 1,713$ 2,779$ 4,816$ Interest on Debt (1,020) (227) (450) (498) (474) (1,649) (473) Special Items (excl. tax) (5,999) (287) 3,480 (390) (5,049) (2,246) (401) Taxes 724 (847) 34 (366) 1,019 (160) (680) Less: Non-Controlling Interests 37 - 1 5 (3) 3 -
Net Income / (Loss) Attributable to Ford 47$ (1,993)$ 1,117$ 2,385$ (2,788)$ (1,279)$ 3,262$
Company Adjusted Free Cash Flow ($B) 2.8$ (2.2)$ (4.8)$ 6.6$ 1.9$ 1.5$ (0.4)$ Revenue ($B) 155.9 34.3 19.4 37.5 36.0 127.1 36.2
Company Adjusted EBIT Margin (%) 4.1 % (1.8) % (10.0) % 9.7 % 4.8 % 2.2 % 13.3 %Net Income / (Loss) Margin (%) 0.0 (5.8) 5.8 6.4 (7.8) (1.0) 9.0 Adjusted ROIC (Trailing Four Quarters) (%) 7.8 2.5 (3.1) (0.4) 1.0 1.0 8.2
Adjusted EPS 1.19$ (0.23)$ (0.35)$ 0.65$ 0.34$ 0.41$ 0.89$ EPS (GAAP) 0.01 (0.50) 0.28 0.60 (0.70) (0.32) 0.81
2020
A6
31
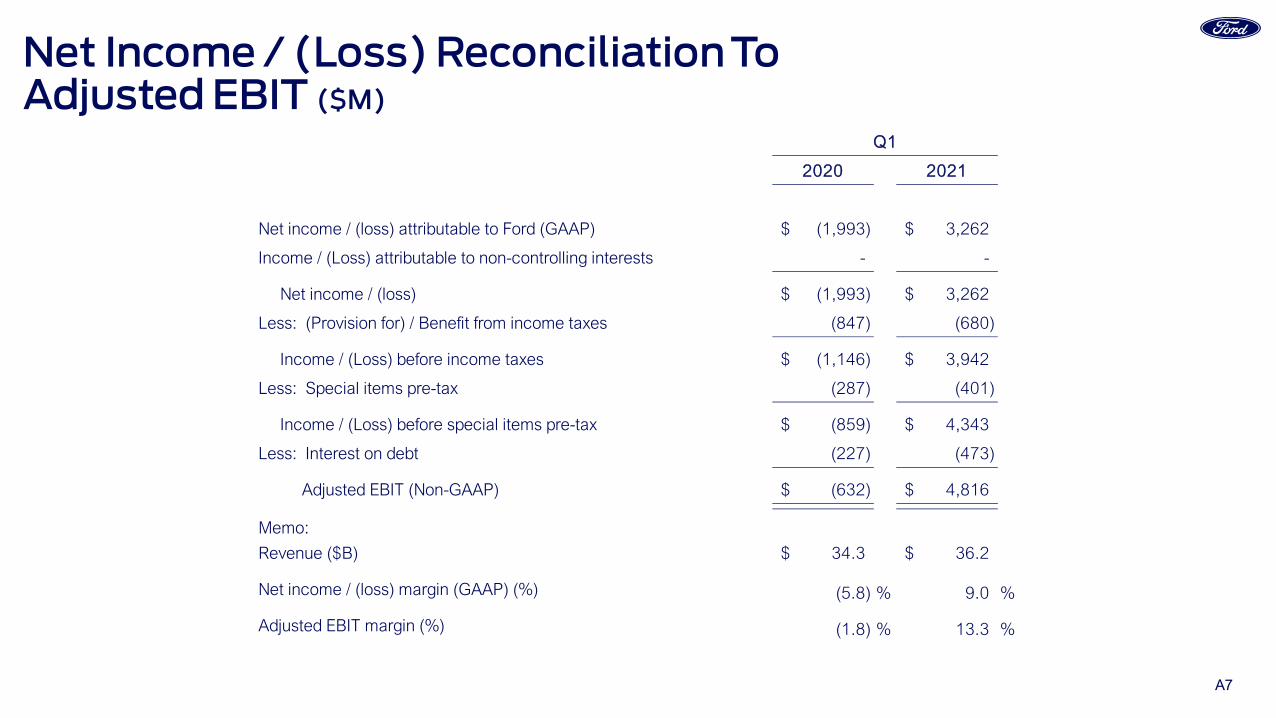
Net Income / (Loss) Reconciliation ToAdjusted EBIT ($M)
2020 2021
Net income / (loss) attributable to Ford (GAAP) (1,993)$ 3,262$
Income / (Loss) attributable to non-controlling interests - -
Net income / (loss) (1,993)$ 3,262$
Less: (Provision for) / Benefit from income taxes (847) (680)
Income / (Loss) before income taxes (1,146)$ 3,942$
Less: Special items pre-tax (287) (401)
Income / (Loss) before special items pre-tax (859)$ 4,343$
Less: Interest on debt (227) (473)
Adjusted EBIT (Non-GAAP) (632)$ 4,816$
Memo:
Revenue ($B) 34.3$ 36.2$
Net income / (loss) margin (GAAP) (%) (5.8) % 9.0 %
Adjusted EBIT margin (%) (1.8) % 13.3 %
Q1
A7

32
Net Cash Provided By / (Used In) Operating Activities Reconciliation To Company Adj. FCF ($M)
A8
Q4 2019 Q1 2020 Q2 2020 Q3 2020 Q4 2020 Q1 2021
Net cash provided by / (used in) operating activities (GAAP) 2,900$ (473)$ 9,115$ 11,088$ 4,539$ 4,492$
Less: Items Not Included in Company Adjusted Free Cash Flows
Ford Credit operating cash flows 623 201 13,964 4,417 3,010 4,998
Funded pension contributions (119) (175) (107) (147) (141) (229)
Global Redesign (including separations) (219) (172) (99) (105) (127) (345)
Ford Credit tax payments / (refunds) under tax sharing agreement 293 407 18 44 8 4
Other, net 68 (15) (178) (431) (214) 77
Add: Items Included in Company Adjusted Free Cash Flows
Automotive and Mobility capital spending (2,262) (1,770) (1,165) (1,247) (1,520) (1,358)
Ford Credit distributions 475 343 826 831 1,290 1,000
Settlement of derivatives 31 (28) 64 (336) 129 (25)
Company adjusted free cash flow (Non-GAAP) 498$ (2,174)$ (4,758)$ 6,558$ 1,902$ (396)$

33
Earnings / (Loss) Per Share Reconciliation ToAdjusted Earnings / (Loss) Per Share
2020 2021
Diluted After-Tax Results ($M)
Diluted after-tax results (GAAP) (1,993)$ 3,262$
Less: Impact of pre-tax and tax special items (1,074) (302)
Adjusted net income – diluted (Non-GAAP) (919)$ 3,564$
Basic and Diluted Shares (M)
Basic shares (average shares outstanding) 3,963 3,980
Net dilutive options, unvested restricted stock units and restricted stock* - 36
Diluted shares 3,963 4,016
Earnings / (Loss) per share – diluted (GAAP) (0.50)$ 0.81$
Less: Net impact of adjustments (0.27) (0.08)
Adjusted earnings per share – diluted (Non-GAAP) (0.23)$ 0.89$
Q1
A9* In Q1 2020, there were 30 million shares excluded from the calculation of diluted earnings / (loss) per share, due to their anti-dilutive effect
34
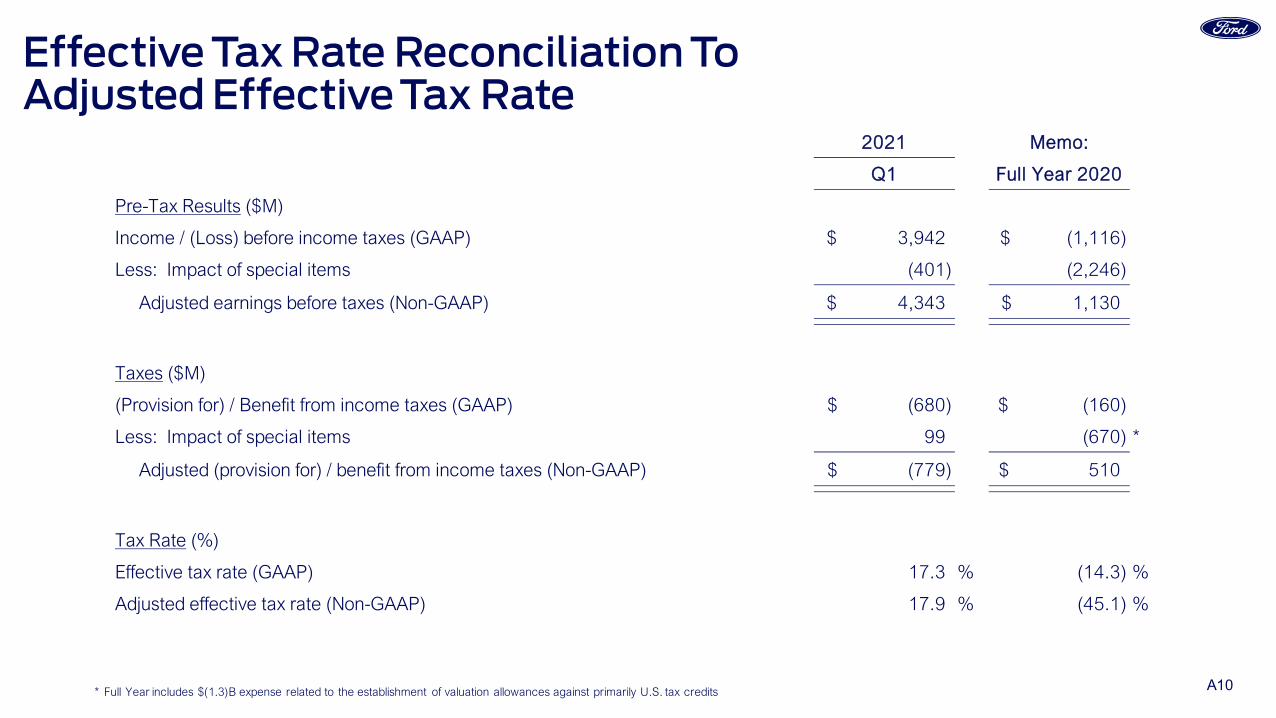
Effective Tax Rate Reconciliation ToAdjusted Effective Tax Rate
* Full Year includes $(1.3)B expense related to the establishment of valuation allowances against primarily U.S. tax credits
Memo:
Q1 Full Year 2020
Pre-Tax Results ($M)
Income / (Loss) before income taxes (GAAP) 3,942$ (1,116)$
Less: Impact of special items (401) (2,246)
Adjusted earnings before taxes (Non-GAAP) 4,343$ 1,130$
Taxes ($M)
(Provision for) / Benefit from income taxes (GAAP) (680)$ (160)$
Less: Impact of special items 99 (670) *
Adjusted (provision for) / benefit from income taxes (Non-GAAP) (779)$ 510$
Tax Rate (%)
Effective tax rate (GAAP) 17.3 % (14.3) %
Adjusted effective tax rate (Non-GAAP) 17.9 % (45.1) %
2021
A10

35* Calculated as the sum of net operating profit after cash tax from the last four quarters, divided by the average invested capital over the last four quarters** Calculated as the sum of adjusted net operating profit after cash tax from the last four quarters, divided by the average invested capital over the last four quarters
Adjusted ROIC ($B)
Four Quarters Four QuartersAdjusted Net Operating Profit After Cash Tax Ending Q1 2020 Ending Q1 2021
Net income / (loss) attributable to Ford (3.1)$ 4.0$ Add: Non-controlling interest - 0.0 Less: Income tax 0.3 0.0 Add: Cash tax (0.6) (0.4) Less: Interest on debt (1.0) (1.9) Less: Total pension / OPEB income / (cost) (2.5) (0.9) Add: Pension / OPEB service costs (1.0) (1.1)
Net operating profit after cash tax (1.6)$ 5.2$ Less: Special items (excl. pension / OPEB) pre-tax (3.2) (0.7)
Adj. net operating profit after cash tax 1.6$ 6.0$
Invested Capital
Equity 29.7$ 34.0$ Redeemable non-controlling interest - - Debt (excl. Ford Credit) 30.5 25.9 Net pension and OPEB liability 12.2 12.2
Invested capital (end of period) 72.4$ 72.1$ Average invested capital 63.7$ 72.9$
ROIC* (2.5) % 7.2 %Adjusted ROIC (Non-GAAP)** 2.5 % 8.2 %
A11
36
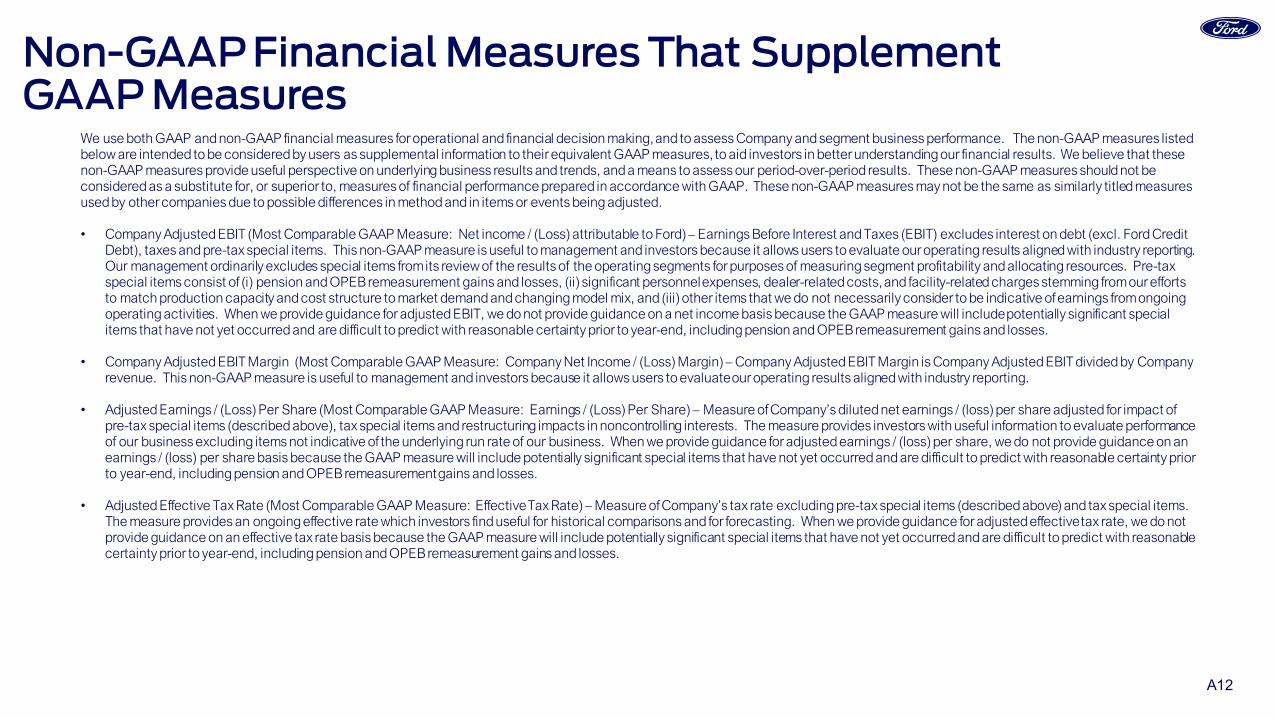
Non-GAAP Financial Measures That SupplementGAAP Measures
We use both GAAP and non-GAAP financial measures for operational and financial decision making, and to assess Company and segment business performance. The non-GAAP measures listed below are intended to be considered by users as supplemental information to their equivalent GAAP measures, to aid investors in better understanding our financial results. We believe that these non-GAAP measures provide useful perspective on underlying business results and trends, and a means to assess our period-over-period results. These non-GAAP measures should not be considered as a substitute for, or superior to, measures of financial performance prepared in accordance with GAAP. These non-GAAP measures may not be the same as similarly titled measures used by other companies due to possible differences in method and in items or events being adjusted.
• Company Adjusted EBIT (Most Comparable GAAP Measure: Net income / (Loss) attributable to Ford) – Earnings Before Interest and Taxes (EBIT) excludes interest on debt (excl. Ford Credit Debt), taxes and pre-tax special items. This non-GAAP measure is useful to management and investors because it allows users to evaluate our operating results aligned with industry reporting. Our management ordinarily excludes special items from its review of the results of the operating segments for purposes of measuring segment profitability and allocating resources. Pre-tax special items consist of (i) pension and OPEB remeasurement gains and losses, (ii) significant personnel expenses, dealer-related costs, and facility-related charges stemming from our efforts to match production capacity and cost structure to market demand and changing model mix, and (iii) other items that we do not necessarily consider to be indicative of earnings from ongoing operating activities. When we provide guidance for adjusted EBIT, we do not provide guidance on a net income basis because the GAAP measure will include potentially significant special items that have not yet occurred and are difficult to predict with reasonable certainty prior to year-end, including pension and OPEB remeasurement gains and losses.
• Company Adjusted EBIT Margin (Most Comparable GAAP Measure: Company Net Income / (Loss) Margin) – Company Adjusted EBIT Margin is Company Adjusted EBIT divided by Company revenue. This non-GAAP measure is useful to management and investors because it allows users to evaluate our operating results aligned with industry reporting.
• Adjusted Earnings / (Loss) Per Share (Most Comparable GAAP Measure: Earnings / (Loss) Per Share) – Measure of Company’s diluted net earnings / (loss)per share adjusted for impact of pre-tax special items (described above), tax special items and restructuring impacts in noncontrolling interests. The measure provides investors with useful information to evaluate performance of our business excluding items not indicative of the underlying run rate of our business. When we provide guidance for adjusted earnings / (loss) per share, we do not provide guidance on an earnings / (loss) per share basis because the GAAP measure will include potentially significant special items that have not yet occurred and are difficult to predict with reasonable certainty prior to year-end, including pension and OPEB remeasurement gains and losses.
• Adjusted Effective Tax Rate (Most Comparable GAAP Measure: Effective Tax Rate) – Measure of Company’s tax rate excluding pre-tax special items (described above) and tax special items. The measure provides an ongoing effective rate which investors find useful for historical comparisons and for forecasting. When we provide guidance for adjusted effective tax rate, we do not provide guidance on an effective tax rate basis because the GAAP measure will include potentially significant special items that have not yet occurred and are difficult to predict with reasonable certainty prior to year-end, including pension and OPEB remeasurement gains and losses.
A12

37
Non-GAAP Financial Measures That SupplementGAAP Measures
• Company Adjusted Free Cash Flow (FCF) (Most Comparable GAAP Measure: Net Cash Provided By / (Used In) Operating Activities) – Measure of Company’s operating cash flow excluding Ford Credit’s operating cash flows. The measure contains elements management considers operating activities, including Automotive and Mobility capital spending, Ford Credit distributions to its parent, and settlement of derivatives. The measure excludes cash outflows for funded pension contributions, global redesign (including separations), and other items that are considered operating cash flows under GAAP. This measure is useful to management and investors because it is consistent with management’s assessment of the Company’s operating cash flow performance. When we provide guidance for Company Adjusted FCF, we do not provide guidance for net cash provided by / (used in) operating activities because the GAAP measure will include items that are difficult to quantify or predict with reasonable certainty, including cash flows related to the Company's exposures to foreign currency exchange rates and certain commodity prices (separate from any related hedges), Ford Credit's operating cash flows, and cash flows related to special items, including separation payments, each of which individually or in the aggregate could have a significant impact to our net cash provided by / (used in) our operating activities.
• Adjusted ROIC – Calculated as the sum of adjusted net operating profit after-cash tax from the last four quarters, divided by the average invested capital over the last four quarters. This calculation provides management and investors with useful information to evaluate the Company’s after-cash tax operating return on its invested capital for the period presented. Adjusted net operating profit after-cash tax measures operating results less special items, interest on debt (excl. Ford Credit Debt), and certain pension / OPEB costs. Average invested capital is the sum of average balance sheet equity, debt (excl. Ford Credit Debt), and net pension / OPEB liability.
• Ford Credit Managed Receivables – (Most Comparable GAAP Measure: Net Finance Receivables plus Net Investment in Operating Leases) – Measure of Ford Credit’s total net receivables and held-for-sale receivables, excluding unearned interest supplements and residual support, allowance for credit losses, and other (primarily accumulated supplemental depreciation).The measure is useful to management and investors as it closely approximates the customer’s outstanding balance on the receivables, which is the basis for earning revenue.
• Ford Credit Managed Leverage (Most Comparable GAAP Measure: Financial Statement Leverage) – Ford Credit’s debt-to-equity ratio adjusted (i) to exclude cash, cash equivalents, and marketable securities (other than amounts related to insurance activities), and (ii) for derivative accounting. The measure is useful to investors because it reflects the way Ford Credit manages its business. Cash, cash equivalents, and marketable securities are deducted because they generally correspond to excess debt beyond the amount required to support operations and on-balance sheet securitization transactions. Derivative accounting adjustments are made to asset, debt, and equity positions to reflect the impact of interest rate instruments used with Ford Credit’s term-debt issuances and securitization transactions. Ford Credit generally repays its debt obligations as they mature, so the interim effects of changes in market interest rates are excluded in the calculation of managed leverage.
A13

38
Definitions And CalculationsWholesale Units and Revenue
• Wholesale unit volumes include all Ford and Lincoln badged units (whether produced by Ford or by an unconsolidated affiliate) that are sold to dealerships, units manufactured by Ford that are sold to other manufacturers, units distributed by Ford for other manufacturers, and local brand units produced by our China joint venture, Jiangling Motors Corporation, Ltd. (“JMC”), that are sold to dealerships. Vehicles sold to daily rental car companies that are subject to a guaranteed repurchase option (i.e., rental repurchase), as well as other sales of finished vehicles for which the recognition of revenue is deferred (e.g., consignments), also are included in wholesale unit volumes. Revenue from certain vehicles in wholesale unit volumes (specifically, Ford badged vehicles produced and distributed by our unconsolidated affiliates, as well as JMC brand vehicles) are not included in our revenue
Industry Volume and Market Share
• Industry volume and market share are based, in part, on estimated vehicle registrations; includes medium and heavy-duty trucks
SAAR
• SAAR means seasonally adjusted annual rate
Company Cash
• Company cash includes cash, cash equivalents, marketable securities and restricted cash; excludes Ford Credit’s cash, cash equivalents, marketable securities and restricted cash
Market Factors
• Volume and Mix – primarily measures EBIT variance from changes in wholesale unit volumes (at prior-year average contribution margin per unit) driven by changes in industry volume, market share, and dealer stocks, as well as the EBIT variance resulting from changes in product mix, including mix among vehicle lines and mix of trim levels and options within a vehicle line
• Net Pricing – primarily measures EBIT variance driven by changes in wholesale unit prices to dealers and marketing incentive programs such as rebate programs, low-rate financing offers, special lease offers and stock accrual adjustments on dealer inventory
• Market Factors exclude the impact of unconsolidated affiliate wholesale units
Earnings Before Taxes (EBT)
• Reflects Income before income taxes
Pension Funded Status
• Current period balances reflect net underfunded status at December 31, 2020, updated for service and interest cost, expected return on assets, curtailment and settlement gains and associated interim remeasurement (where applicable), separation expense, actual benefit payments, and cash contributions. For plans without interim remeasurement, the discount rate and rate of expected return assumptions are unchanged from year-end 2020
Records
• References to Company, Automotive segment and business unit records are since at least 2009
A14

39
Product NotesCover Slide
• Left: 2020 Mustang Shelby GT350
• Right: 2021 Mach-E Mustang GT Performance Edition. Pre-production model shown. Available late Summer 2021
2021 Bronco (shown on Slide 6)
• Pre-production computer-generated image shown with optional equipment and aftermarket accessories. Always consult the owner’s manual before off-road driving, know your terrain and trail difficulties and use appropriate safety gear. Available beginning Summer 2021
Ford Telematics Essentials (shown on Slide 6)
• Available on Ford vehicles with embedded modem. Requires modem activation and agreement to digital terms and conditions. Complimentary access will exist for the life of the vehicle or the life of the product. Connected service and features, and access to vehicle data depend on subscription and compatible AT&T network availability. Evolving technology / cellular networks / vehicle capability may limit functionality and prevent operation of connected features
2022 E-Transit (shown on Slide 7)
• Pre-production vehicle shown. Available late 2021
BlueCruise (shown on Slide 7)
• Software updates will enable BlueCruise capability on F-150 and Mustang Mach-E vehicles equipped with available Ford Co-Pilot360TM Technology
• Driver-assist features are supplemental and do not replace the driver’s attention, judgment and need to control the vehicle. BlueCruise is a hands-free highway driving feature. Only remove hands from the steering wheel when in a Hands-Free Blue Zone. Always watch the road and be prepared to resume control of the vehicle. It does not replace safe driving. See Owner’s Manual for detail and limitations. The BlueCruise Prep Kit contains the hardware required for this feature. Software for the feature will be available for purchase at a later date. BlueCruise functionality expected third quarter of 2021. Separate payment for feature software required to activate full functionality at that time
Lincoln Zephyr Reflection Preview Vehicle (shown on Slide 25)
• Concept of production vehicle to debut towards the end of 2021
A15

1
April 28, 2021
Q1 2021 Earnings Review

2
Information Regarding This PresentationForward-Looking Statements
This presentation includes forward-looking statements. Forward-looking statements are based on expectations, forecasts, and assumptions by our management and involve a number of risks, uncertainties, and other factors that could cause actual results to differ materially from those stated. For a discussion of these risks, uncertainties, and other factors, please see the “Cautionary Note on Forward-Looking Statements” at the end of this presentation and “Item 1A. Risk Factors” in our Annual Report on Form 10-K for the year ended December 31, 2020, as updated by subsequent Quarterly Reports on Form 10-Q and Current Reports on Form 8-K.
GAAP And Non-GAAP Financial Measures
This presentation includes financial measures calculated in accordance with Generally Accepted Accounting Principles (“GAAP”) and non-GAAP financial measures. The non-GAAP financial measures are intended to be considered supplemental information to their comparable GAAP financial measures. The non-GAAP financial measures are defined and reconciled to the most comparable GAAP financial measures in the Appendix to this presentation.
Additional Information
Calculated results may not sum due to rounding. N / M denotes “Not Meaningful.” All variances are year-over-year unless otherwise noted.
Effective January 1, 2021, we adopted Accounting Standards Update (“ASU”) 2019-12, which allows for the simplification of accounting for income taxes. As a result, return on equity, net income, distributions, leverage, and equity have been updated in the prior comparator periods to reflect the update.
3
Key Takeaways• Strong Q1 EBT of $962M
• Balance sheet remains strong with liquidity at $34B; continue to access diverse funding sources
• Portfolio performing well – charge-offs and loss-to-receivables (“LTR”) ratio remain significantly below year-ago levels, reflecting historically low losses. Credit loss reserve reduced reflecting expectation of lower lifetime COVID-related losses
• Off-lease auction values remain at record-high levels; lease share below industry average through Q1
• Effective January 1, 2021, we adopted ASU 2019-12, which reduces our U.S. tax allocation, increasing net income, ROE, and reducing leverage in Q1 and will support additional distributions to Ford; plan to manage leverage in line with target range

4
Q1 Headlines
Q4 2019 Q3 2020Q1 2020 Q2 2020 Q4 2020 Q1 2021
Q4 2019 Q3 2020Q1 2020 Q2 2020 Q4 2020 Q1 2021
Q4 2019 Q3 2020Q1 2020 Q2 2020 Q4 2020 Q1 2021
EBT ($M)
U.S. Retail LTR Ratios (%)
Auction Values (Per Unit)**
Q1 EBT YoY ($M)
0.63% 0.62%
0.15%0.30%
0.37%0.22%
Key Metrics
• EBT of $962M, up $932M, reflecting non-recurrence of increase in credit loss reserves due to COVID-19 and strong auction performance
• Portfolio performing well – loss-to-receivables (“LTR”) remains low, reflecting historically low losses; auction values, at record-high levels, improved significantly from a year ago
• Balance sheet and l iquidity remain strong
* Prior period amounts have been updated as a result of our adoption of ASU 2019-12, Simplifying the Accounting for Income Taxes** U.S. 36-month off-lease auction values at Q1 2021 mix
$18,905 $19,235 $19,835 $21,340 $20,450
$21,925
$630
$30
$543
$1,123 $912 $962
Volume /Mix
FinancingMargin
LeaseResidual
Credit Loss
Q1 2021Q1 2020 Exchange Other
Distributions* $475 $343 $826 $831 $1,290 $1,000
5
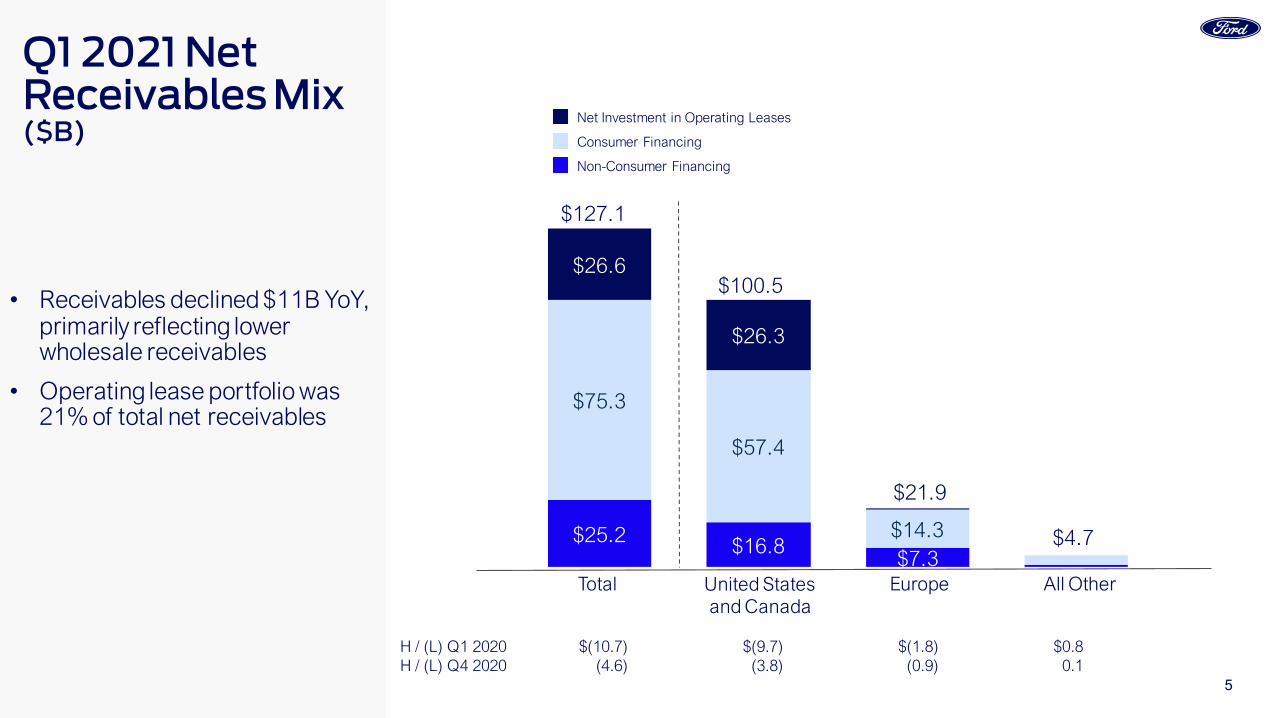
• Receivables declined $11B YoY, primarily reflecting lower wholesale receivables
• Operating lease portfolio was 21% of total net receivables
Q1 2021 Net Receivables Mix ($B)
$25.2 $16.8$7.3
$75.3
$57.4
$14.3
$26.6
$26.3
Total All OtherUnited Statesand Canada
Net Investment in Operating Leases
Consumer Financing
Non-Consumer Financing
Europe
$127.1
$100.5
$21.9
$4.7
H / (L) Q1 2020 $(10.7) $(9.7) $(1.8) $0.8H / (L) Q4 2020 (4.6) (3.8) (0.9) 0.1

6
• Disciplined and consistent underwriting practices
• Portfolio quality evidenced by FICO scores and consistent risk mix
• Repossessions, charge-offs and LTR remain low and significantly below year-ago levels
• Longer term contract mix continued at normal levels
U.S. Origination Metrics And Credit Loss Drivers
Severity (000) $11.4 $11.4 $10.9 $9.8 $10.9 $10.6
60+ Day Delinquencies* 0.14% 0.16% 0.15% 0.13% 0.14% 0.13%
65 mo 66 mo
71 mo
67 mo 66 mo64 mo
3%
7%
15%
4% 5% 4%
Q4 2019 Q1 2020 Q2 2020 Q3 2020 Q4 2020 Q1 2021
753739 743 738 735
748
6% 6% 6% 6% 6% 6%
Q4 2019 Q1 2020 Q2 2020 Q3 2020 Q4 2020 Q1 2021
Retail & Lease FICO andHigher Risk Mix (%)
Retail Contract Terms
$76 $73
$19
$39$49
$290.63% 0.62%
0.15%0.30% 0.37%
0.22%
Q4 2019 Q1 2020 Q2 2020 Q3 2020 Q4 2020 Q1 2021
Retail Charge-Offs ($M) and LTR Ratio (%)
7 7
3
5 5 5
1.27% 1.24%
0.52%
1.04% 1.01% 0.92%
Q4 2019 Q1 2020 Q2 2020 Q3 2020 Q4 2020 Q1 2021
Retail Repossessions (000) andRepossession Rate (%)
Higher Risk Portfolio Mix (%) Repossession Rate (%)
Retail > 84 months Placement Mix (%) LTR Ratio (%)
* Excluding bankruptcies
7
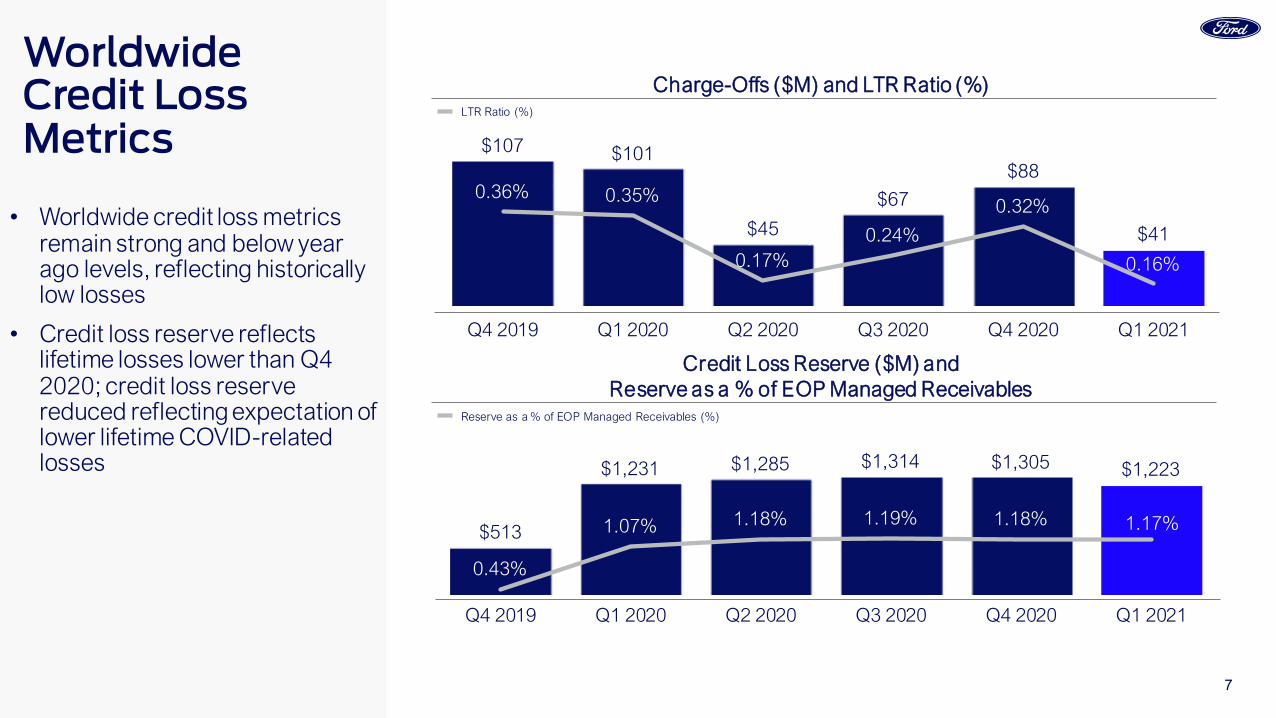
• Worldwide credit loss metrics remain strong and below year ago levels, reflecting historically low losses
• Credit loss reserve reflects lifetime losses lower than Q4 2020; credit loss reserve reduced reflecting expectation of lower lifetime COVID-related losses
Worldwide Credit Loss Metrics
$513
$1,231 $1,285 $1,314 $1,305 $1,223
0.43%
1.07% 1.18% 1.19% 1.18% 1.17%
Q4 2019 Q1 2020 Q2 2020 Q3 2020 Q4 2020 Q1 2021
$107 $101
$45
$67
$88
$41
0.36% 0.35%
0.17%0.24%
0.32%
0.16%
Q4 2019 Q1 2020 Q2 2020 Q3 2020 Q4 2020 Q1 2021
Charge-Offs ($M) and LTR Ratio (%)
Credit Loss Reserve ($M) and Reserve as a % of EOP Managed Receivables
LTR Ratio (%)
Reserve as a % of EOP Managed Receivables (%)

8
• Lease placement volume and share down YoY
• Lower lease return volume and return rate reflect auction values
• Auction values up 14% YoY
• Now planning for 2021 FY auction values to remain at historically high levels and to be higher YoY
Lease Placement Volume (000)
Lease Share of Retail Sales (%)
Lease Return Volume (000) and Return Rates (%)
Return Rate (%)
30% 31%
25%27% 27% 26%
19%22%
15%18%
14%16%
Q4 2019 Q1 2020 Q2 2020 Q3 2020 Q4 2020 Q1 2021
24-Month36-Month39-Month / Other
Industry*Ford Credit
$18,905 $19,235
$19,835
$21,340$20,450
$21,925
Q4 2019 Q1 2020 Q2 2020 Q3 2020 Q4 2020 Q1 2021
71 6758
6553 51
77% 76% 76%63% 62% 61%
Q4 2019 Q1 2020 Q2 2020 Q3 2020 Q4 2020 Q1 2021
Off-Lease Auction Values(36-month, at Q1 2021 Mix)
* Source: J.D. Power PIN
621
7 4 4 11
64 38
3659
47 41
1211
9
1211 10
8270
52
7562 62
Q4 2019 Q1 2020 Q2 2020 Q3 2020 Q4 2020 Q1 2021
U.S. LeaseMetrics

9
• Strong balance sheet is inherently liquid with cumulative debt maturities having a longer tenor than asset maturities
• As of March 31, 2021 $76B of $147B assets are unencumbered
Cumulative Maturities At March 31, 2021* ($B)
$64
$95 $120
$147
$46
$74$92
$126
Apr – Dec 2021 2022 2023 2024 & Beyond
$10 $14 $11 $30
Unsecured Long-Term Debt Maturities in Each Period
AssetsDebt
* See Appendix for assets and debt definitions

10
2020 2021Dec 31** Mar 31
Term Unsecured Debt 76.6$ 69.4$
Term Asset-Backed Securities 54.6 50.2
Ford Interest Advantage / Deposits 6.5 7.2
Other 5.7 7.2
Equity 15.6 15.3
Adjustments for Cash (18.5) (14.1)
Total Managed Receivables 140.5$ 135.2$
Securitized Funding as Pct of Managed Receivables 38.8% 37.1%
Net Liquidity 35.4$ 33.7$
• Well capitalized with a strong balance sheet; $33.7B in net liquidity
• Funding is diversified across platforms and markets
Funding Structure –Managed Receivables* ($B)
** See Appendix for definitions and reconciliation to GAAP** Prior period amounts have been updated as a result of our adoption of ASU 2019-12, Simplifying the Accounting for Income Taxes

11
• Completed $6B of public issuance in 2021
• Strong balance sheet and substantial liquidity provide funding flexibility
Public Term Funding Plan* ($B)
2019 2020 2021 ThroughActual Actual Forecast Apr 27
Unsecured 17$ 14$ $ 5 - 9 1$
Securitizations** 14 13 7 - 10 5
Total 31$ 27$ $ 12 - 19 6$
* See Appendix for definitions ** Includes Rule 144A offerings

12
Cautionary Note On Forward-Looking StatementsStatements included or incorporated by reference herein may constitute “forward-looking statements” within the meaning of the Private Securities Litigation Reform Act of 1995. Forward-looking statements are based on expectations, forecasts, and assumptions by our management and involve a number of risks, uncertainties, and other factors that could cause actual results to differ materially from those stated, including, without limitation:
• Ford and Ford Credit’s financial condition and results of operations have been and may continue to be adversely affected by public health issues, including epidemics or pandemics such as COVID-19;• Ford is highly dependent on its suppliers to deliver components in accordance with Ford’s production schedule, and a shortage of key components, such as semiconductors, can disrupt Ford’s production of vehicles;
• Ford’s long-term competitiveness depends on the successful execution of its Plan;
• Ford’s vehicles could be affected by defects that result in delays in new model launches, recall campaigns, or increased warranty costs;
• Ford may not realize the anticipated benefits of existing or pending strategic alliances, joint ventures, acquisitions, divestitures, or new business strategies;
• Operational systems, security systems, and vehicles could be affected by cyber incidents and other disruptions;
• Ford’s production, as well as Ford’s suppliers’ production, could be disrupted by labor issues, natural or man-made disasters, financial distress, production difficulties, or other factors;
• Ford’s ability to maintain a competitive cost structure could be affected by labor or other constraints;
• Ford’s ability to attract and retain talented, diverse, and highly skilled employees is critical to its success and competitiveness;
• Ford’s new and existing products and mobility services are subject to market acceptance and face significant competition from existing and new entrants in the automotive and mobility industries;
• Ford’s results are dependent on sales of larger, more profitable vehicles, particularly in the United States;• With a global footprint, Ford’s results could be adversely affected by economic, geopolitical, protectionist trade policies, or other events, including tariffs;
• Industry sales volume in any of Ford’s key markets can be volatile and could decline if there is a financial crisis, recession, or significant geopolitical event;
• Ford may face increased price competition or a reduction in demand for its products resulting from industry excess capacity, currency fluctuations, competitive actions, or other factors;
• Fluctuations in commodity prices, foreign currency exchange rates, interest rates, and market value of Ford or Ford Credit’s investments can have a significant effect on results;
• Ford and Ford Credit’s access to debt, securitization, or derivative markets around the world at competitive rates or in sufficient amounts could be affected by credit rating downgrades, market volatility, market disruption, regulatory requirements, or other factors;
• Ford’s receipt of government incentives could be subject to reduction, termination, or clawback;
• Ford Credit could experience higher-than-expected credit losses, lower-than-anticipated residual values, or higher-than-expected return volumes for leased vehicles;
• Economic and demographic experience for pension and other postretirement benefit plans (e.g., discount rates or investment returns) could be worse than Ford has assumed;
• Pension and other postretirement liabilities could adversely affect Ford’s liquidity and financial condition;
• Ford could experience unusual or significant litigation, governmental investigations, or adverse publicity arising out of alleged defects in products, perceived environmental impacts, or otherwise;
• Ford may need to substantially modify its product plans to comply with safety, emissions, fuel economy, autonomous vehicle, and other regulations;
• Ford and Ford Credit could be affected by the continued development of more stringent privacy, data use, and data protection laws and regulations as well as consumers’ heightened expectations to safeguard their personal information; and
• Ford Credit could be subject to new or increased credit regulations, consumer protection regulations, or other regulations.
We cannot be certain that any expectation, forecast, or assumption made in preparing forward-looking statements will prove accurate, or that any projection will be realized. It is to be expected that there may be differences between projected and actual results. Our forward-looking statements speak only as of the date of their initial issuance, and we do not undertake any obligation to update or revise publicly any forward-looking statement, whether as a result of new information, future events, or otherwise. For additional discussion, see “Item 1A. Risk Factors” in our Annual Report on Form 10-K for the year ended December 31, 2020, as updated by subsequent Quarterly Reports on Form 10-Q and Current Reports on Form 8-K .

AppendixEBT By Segment A2
Financing Shares And Contract Placement Volume A3
Total Net Receivables Reconciliation To Managed Receivables A4
Financial Statement Leverage Reconciliation To Managed Leverage A5
Liquidity Sources A6
Non-GAAP Financial Measures That Supplement GAAP Measures A7
Definitions And Calculations A8

14
EBT By Segment* ($M)
2021H / (L)
2020 **
ResultsUnited States and Canada segment 996$ 974$ Europe segment 66 49 All Other segment (15) (22)
Total segments 1,047$ 1,001$ Unallocated other (85) (69)
Earnings before taxes 962$ 932$ Taxes (117) (81)
Net income 845$ 851$
Distributions 1,000$ 657$
Q1
A2* See Appendix for definitions** Prior period amounts have been updated as a result of our adoption of ASU 2019-12, Simplifying the Accounting for Income Taxes

15
Financing Shares And Contract Placement Volume
2020 2021
Share of Ford Sales*United States 56 % 47 %Canada 63 60U.K. 44 35Germany 44 37China 34 41
Wholesale ShareUnited States 74 % 72 %Canada 47 13U.K. 100 100Germany 93 91China 51 66
Contract Placement Volume - New and Used (000)United States 205 196Canada 23 25U.K. 30 25Germany 29 18China 16 32
Q1
A3* United States and Canada exclude Fleet sales, other markets include Fleet

16
Total Net Receivables Reconciliation To Managed Receivables ($B)
2020 2020 2021Mar 31 Dec 31 Mar 31
Finance receivables, net (GAAP) 110.8$ 105.0$ 100.5$ Net investment in operating leases (GAAP) 27.0 26.7 26.6
Total net receivables* 137.8$ 131.7$ 127.1$
Unearned interest supplements and residual support 6.3$ 6.5$ 6.0$ Allowance for credit losses 1.2 1.3 1.2 Other, primarily accumulated supplemental depreciation 1.1 1.0 0.9
Total managed receivables (Non-GAAP) 146.4$ 140.5$ 135.2$
A4* See Appendix for definitions

17
Financial Statement Leverage Reconciliation To Managed Leverage* ($B)
A5
2020 2020 2021Mar 31** Dec 31** Mar 31
Leverage CalculationDebt 136.8$ 137.7$ 126.8$ Adjustments for cash (11.3) (18.5) (14.1) Adjustments for derivative accounting (1.6) (1.5) (0.8)
Total adjusted debt 123.9$ 117.7$ 111.9$
Equity 15.5$ 15.6$ 15.3$ Adjustments for derivative accounting (0.0) 0.1 0.0
Total adjusted equity 15.4$ 15.7$ 15.3$
Financial statement leverage (to 1) (GAAP) 8.9 8.8 8.3 Managed leverage (to 1) (Non-GAAP) 8.0 7.5 7.3
* See Appendix for definitions** Prior period amounts have been updated as a result of our adoption of ASU 2019-12, Simplifying the Accounting for Income Taxes

18
Liquidity Sources* ($B)
A6
2020 2020 2021Mar 31 Dec 31 Mar 31
Liquidity SourcesCash 11.3$ 18.5$ 14.1$ Committed asset-backed facilities 35.9 38.1 38.2 Other unsecured credit facilities 2.8 2.5 2.5
Total liquidity sources 50.0$ 59.1$ 54.8$
Utilization of LiquiditySecuritization & restricted cash (3.1)$ (3.9)$ (5.4)$ Committed asset-backed facilities (18.6) (16.7) (11.9) Other unsecured credit facilities (0.5) (0.5) (0.6)
Total utilization of liquidity (22.2)$ (21.1)$ (17.9)$
Gross liquidity 27.8$ 38.0$ 36.9$ ABS capacity in excess of eligible receivables and other adjustments 0.3 (2.6) (3.2)
Net liquidity available for use 28.1$ 35.4$ 33.7$
* See Appendix for definitions
19
Non-GAAP Financial Measures That Supplement GAAP Measures
A7
We use both GAAP and non-GAAP financial measures for operational and financial decision making, and to assess Company and segment business performance. The non-GAAP measures listed below are intended to be considered by users as supplemental information to their equivalent GAAP measures, to aid investors in better understanding our f inancial results. We believe that these non-GAAP measures provide useful perspective on underlying business results and trends, and a means to assess our period-over-period results. These non-GAAP measures should not be considered as a substitute for, or superior to measures of f inancial performance prepared in accordance with GAAP. These non-GAAP measures may not be the same as similarly titled measures used by other companies due to possible differences in method and in items or events being adjusted.
• Ford Credit Managed Receivables – (Most Comparable GAAP Measure: Net Finance Receivables plus Net Investment in Operating Leases) –Measure of Ford Credit’s Total net receivables and Held-for-sale receivables, excluding unearned interest supplements and residual suppor t, allowance for credit losses, and other (primarily accumulated supplemental depreciation). The measure is useful to management and investors as it closely approximates the customer’s outstanding balance on the receivables, which is the basis for earning revenue.
• Ford Credit Managed Leverage (Most Comparable GAAP Measure: Financial Statement Leverage) – Ford Credit’s debt-to-equity ratio adjusted (i) to exclude cash, cash equivalents, and marketable securities (other than amounts related to insurance activities), and (ii) for derivative accounting. The measure is useful to investors because it reflects the way Ford Credit manages its business. Cash, cash equivalents, and marketable securities are deducted because they generally correspond to excess debt beyond the amount required to suppor t operations and on-balance sheet securitization transactions. Derivative accounting adjustments are made to asset, debt, and equity positions to reflect the impact of interest rate instruments used with Ford Credit’s term-debt issuances and securitization transactions. Ford Credit generally repays its debt obligations as they mature, so the interim effects of changes in market interest rates are excluded in the calculation of managed leverage.

20
Definitions And Calculations
A8
ABS cap aci ty in excess of el igible receivables and other ad justments (as shown on the Liquidity Sources chart )
Includ es as set -backed capaci ty in excess of el igible receivables ; cash related to the Ford Credi t Revolving Extended Variable-uti lizat ion p rogram (“FordREV”), which can be accessed through f uture sales of receivab les
As s ets (as s hown on the Cumulat ive Maturit ies chart)
Includ es gros s finance receivables less the allowance f or credit losses , investment in operating leases net of accumulated d ep reciat ion, cash and cash eq uivalents, and marketable securit ies (excluding amounts related to ins urance activ it ies ). Amounts shown include the impact of expected p repayments
Cas h (as s hown on the Fund ing Structure, Liquidi ty Sources and Leverage charts )
Cas h and cas h eq uivalents and Marketable securit ies reported on Ford Cred it ’s balance sheet , excluding amounts related to insurance act ivi ties
Deb t (as s hown on the Cumulat ive Maturi t ies chart )
Al l wholes ale securi tization t ransactions are s hown maturing in the nex t 12 months, even i f the maturi t ies extend beyond Q1 2 022 . Also, the chart ref lects adjustments to debt maturit ies to match the asset -backed d eb t maturi t ies wi th the und erly ing asset maturi ties
Deb t (as s hown on the Leverage chart )
Deb t on Ford Cred i t’s b alance sheet . Includes debt issued in securi t izat ions and pay able only out of collections on the underlying securi tized assets and related enhancements. Ford Credi t holds the right to receive the excess cash flows not needed to p ay the debt issued b y, and other ob ligat ions of , the securi t izat ion ent i ties that are part ies to those securi tization t ransactions
Commit ted As set-Backed Securi ty (“ABS”) Faci li t ies (as shown on the Liquid ity Sources chart )
Commit ted ABS f aci l it ies are subject to avai labi l ity of sufficient assets , abi l ity to obtain d erivat ives to manage interest rate risk, and exclude FCE Bank p lc (“FCE”) access to the Bank of England’s Discount W indow Faci l i ty
Earnings Bef ore T axes (“EBT”)
Ref lects Income before income taxes as reported on Ford Credi t ’s income s tatement
Securi t iz at ion & res tricted cash (as shown on the Liquidity Sources chart )
Securi t iz at ion cash is cash held f or the b enefit of the securi t izat ion investors (for examp le, a reserve fund). Rest ricted cash is p rimari ly held to meet certain local government and regulatory reserve req uirements and cash held under the terms of certain contractual agreements
Securi t iz at ions (as shown on the Publ ic T erm Funding Plan chart )
Pub l ic securi tizat ion t ransact ions , Rule 14 4A offerings sponsored b y Ford Cred it , and widely d ist ributed of ferings by Ford Credi t Canad a
T erm As set-Backed Securi t ies (as shown on the Funding Structure chart)
Ob l igat ions is sued in securi tizat ion t ransact ions that are pay able only out of col lect ions on the underlying securi tized assets and related enhancements
T otal net receivables (as shown on the Total Net Receivables Reconci l iat ion T o Managed Receivables chart )
Includ es f inance receivables (retai l f inancing and wholesale) sold f or legal p urposes and net investment in operating leases included in securi tizat ion t ransact ions that do not sat isfy the requirements for accounting s ale t reatment . T hese receivables and operat ing leases are rep orted on Ford Credi t’s b alance sheet and are avai lable only f or payment of the debt is sued by , and other obl igations of , the securi tizat ion ent i ties that are p art ies to those securi t izat ion t ransact ions ; they are not available to pay the other obl igat ions of Ford Credit or the claims of Ford Credi t ’s other cred itors
Unal located other (as shown on the EBT By Segment chart )
Items exclud ed in assessing segment p erformance b ecause they are managed at the corporate level , including market valuation adjustments to derivat ives and exchange-rate fluctuat ions on foreign currency-d enominated t ransactions