1q2021 financial results
TRANSCRIPT

May 27, 2021
1
Net profit1 up by 20.9% y-o-y to €72m in 1Q2021
o Net profit2 of SEE operations at €32m
Pre-provision income up by 7.9% y-o-y to €231m
NPE ratio down by 14.7ppts y-o-y to 14.2%
Substantially lower than expected NPE formation (€72m)
Provisions over NPEs to 61.9%
New loan disbursements more than €1.0bn in 1Q2021
Customer Deposits up by €3.0bn y-o-y and €1.0bn q-o-q
Total CAD 15.5% and CET1 13.0% incorporate transitions for the
full year 2021
2021 profitability, capital ratios & single-digit NPE ratio outlook
reiterated
1 Adjusted net profit. 2 Adjusted net profit.
1Q2021 Financial Results

May 27, 2021
2
“As the economy reopens, sentiment is positive and strong growth is forecasted. Demand for Greek destinations for countries where travel restrictions are lifted and increase in deposits during the lockdown suggest a robust pickup in consumption for at least the rest of year. The first inflows of EU RRF funds are expected before year-end, further adding to the growth potential through investments for 2021 onwards. The vaccination rollout has been accelerated significantly and will contribute to a gradual but swift return to normalcy. In an economic environment with positive prospects, Eurobank focuses on supporting the restart of the economy by assisting our clients, mainly businesses, to regain their footing in the market. In the first quarter, still in pandemic-driven mode, Eurobank performed solidly, on track to achieve our earnings guidance for the year. In terms of asset quality, as pandemic-related moratoria have mostly expired, a positive signal is coming from low new NPE formation, significantly better than expected. New loan disbursements amounted to more than €1.0bn in the first quarter and are expected to pick-up further in the 2nd half of the year. Private sector deposits continued to accumulate, both from households and businesses, and were strongly up by one billion euros from the previous quarter. We expect this pool to fuel not only consumption but also investments going forward. The bank registered another quarter of uninterrupted organic profitability, with net profits up, reaching more than €70 million, with notable contribution from our international activities. Eurobank, having proactively enhanced its capital base through the merger with Grivalia, timely and successfully executed an accelerated NPE reduction plan, driving its NPE ratio to single-digit this year. Having radically dealt with legacy issues, Eurobank is in a privileged position to make the most of the growth cycle that is starting in all our core markets and we are dedicating all our efforts to this end.”
Fokion Karavias, CEO
May 27, 2021
3
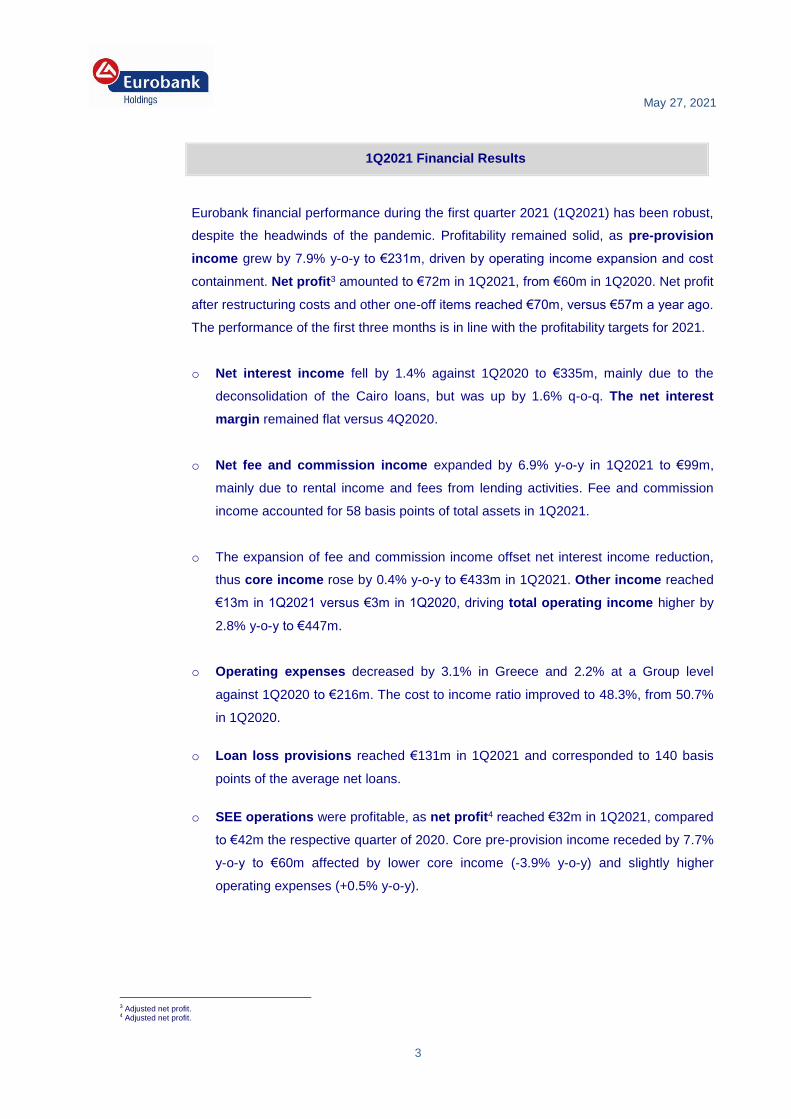
Eurobank financial performance during the first quarter 2021 (1Q2021) has been robust,
despite the headwinds of the pandemic. Profitability remained solid, as pre-provision
income grew by 7.9% y-o-y to €231m, driven by operating income expansion and cost
containment. Net profit3 amounted to €72m in 1Q2021, from €60m in 1Q2020. Net profit
after restructuring costs and other one-off items reached €70m, versus €57m a year ago.
The performance of the first three months is in line with the profitability targets for 2021.
o Net interest income fell by 1.4% against 1Q2020 to €335m, mainly due to the
deconsolidation of the Cairo loans, but was up by 1.6% q-o-q. The net interest
margin remained flat versus 4Q2020.
o Net fee and commission income expanded by 6.9% y-o-y in 1Q2021 to €99m,
mainly due to rental income and fees from lending activities. Fee and commission
income accounted for 58 basis points of total assets in 1Q2021.
o The expansion of fee and commission income offset net interest income reduction,
thus core income rose by 0.4% y-o-y to €433m in 1Q2021. Other income reached
€13m in 1Q2021 versus €3m in 1Q2020, driving total operating income higher by
2.8% y-o-y to €447m.
o Operating expenses decreased by 3.1% in Greece and 2.2% at a Group level
against 1Q2020 to €216m. The cost to income ratio improved to 48.3%, from 50.7%
in 1Q2020.
o Loan loss provisions reached €131m in 1Q2021 and corresponded to 140 basis
points of the average net loans.
o SEE operations were profitable, as net profit4 reached €32m in 1Q2021, compared
to €42m the respective quarter of 2020. Core pre-provision income receded by 7.7%
y-o-y to €60m affected by lower core income (-3.9% y-o-y) and slightly higher
operating expenses (+0.5% y-o-y).
3 Adjusted net profit. 4 Adjusted net profit.
1Q2021 Financial Results

May 27, 2021
4
o In terms of asset quality, the NPE ratio decreased by 14.7 percentage points y-o-y
to 14.2% in 1Q2021. The stock of NPEs fell to €5.8bn, from €13.0bn in 1Q2020,
registering slight increase of €117m q-o-q. The q-o-q increase in the NPE stock
along with the NPE formation of €72m were substantially lower than expected.
Provisions over NPEs increased by 630 basis points y-o-y to 61.9% in 1Q2021.
The "Mexico" securitization is progressing according to the timeline, with the pre-
rating received last week and the application for Hercules II expected within the
coming weeks. The 1Q2021performance combined with the “Mexico” securitization
confirm the target for a single-digit NPE ratio at the end of the current year.
o CET1 and total CAD reached 13.0% and 15.5% at the end of 1Q2021 against total
SREP capital requirements of 6.2% and 11.0% respectively. 1Q2021 reported ratios
incorporate IFRS9 and other transitions for the full-year 2021. The fully-loaded Basel
III CET1 was 11.9% at the end of March. RWAs amounted to €40.8bn in 1Q2021.
2021 targets for CAD ratio of c.16% and fully-loaded Basel III CET1 of c.12.8%
remain intact.
o New loan disbursements exceeded €1.0bn in 1Q2021. Total gross loans
amounted to €41.1bn at the end of March, including €3.5bn senior notes. Corporate
loans amounted to €22.7bn, mortgages to €11.5bn and consumer loans to €3.4bn.
o Customer deposits rose by €3.0bn y-o-y and €1.0bn q-o-q in 1Q2021. Savings and
sight deposits amounted to €32.5bn, while time and other deposits stood at €15.8bn.
The loans to deposits ratio further improved to 77.7%, from 79.1% in 4Q2020. The
liquidity coverage ratio also improved to 140.6% in 1Q2021, from 123.7% in
4Q2020.
o Eurosystem funding, through the TLTRO III program, increased from €8.0bn in
December 2020 to €8.8bn in March 2021. Interbank repos receded by €3.8bn y-o-y
to €0.2bn in 1Q2021. In April, Eurobank successfully completed its first for 2021
senior preferred issuance of €500m, which marked the return to international
capital markets since 2017.

May 27, 2021
5
Adjusted Net Profit (€m)
(€εκ.)
72
60
1Q2020 1Q2021
Pre-provision income (€m)
231
214
1Q2020 1Q2021
15,5
13,0
CET1 CAD
Capital Adequacy Ratios (%)
(€εκ.)
14,2
28,9
1Q2020 1Q2021
NPE Ratio (%)
(€εκ.)
61,9
55,6
1Q2020 1Q2021
Provisions / NPEs (%)
(€εκ.)
77,783,4
1Q2020 1Q2021
Loans / Deposits (%)
(€εκ.)

May 27, 2021
6
Key Financial Results
1Q2021 1Q2020 Change
Net Interest Income €335m €339m -1.4%
Net Fee & Commission Income €99m €92m 6.9%
Total Operating Income €447m €434m 2.8%
Total Operating Expenses €216m €220m -2.2%
Core Pre-Provision Income €218m €212m 3.0%
Pre-Provision Income €231m €214m 7.9%
Loan Loss Provisions €131m €126m 4.2%
Adjusted Net Profit €72m €60m 20.9%
Net Income after tax €70m €57m 23.3%
Balance Sheet Highlights 1Q2021 1Q2020
Consumer Loans €3,383m €3,805m
Mortgages €11,522m €13,960m
Small Business Loans €4,478m €6,414m
Large Corporates & SMEs €18,174m €19,658m
Senior Notes €3,504m €1,062m
Total Gross Loans €41,098m €44,971m
Total Customer Deposits €48,294m €45,301m
Total Assets €68,573m €65,843m
Financial Ratios
1Q2021 1Q2020
Net Interest Margin
1.96% 2.08%
Cost to Income
48.3% 50.7%
Non-Performing Exposures (NPEs) 14.2% 28.9%
Provisions / NPEs 61.9% 55.6%
Provisions to average Net Loans (Cost of Risk)
1.40% 1.34%
Common Equity Tier 1 (CET1) 13.0% 15.4%
Total Capital Adequacy (CAD) 15.5% 17.8%
Α Eurobank Holdings Financial Figures

May 27, 2021
7
Glossary - Definition of Alternative Performance Measures (APMs) and other selected financial measures/ ratios
Adjusted net profit: Net profit/loss from continuing operations after deducting restructuring costs, goodwill impairment, gains/losses related to the transformation plan and income tax adjustments.
Basic Earnings per share (EPS): Net profit attributable to ordinary shareholders divided by the
weighted average number of ordinary shares in issue during the period, excluding the average number of ordinary shares purchased by the Group and held as treasury shares.
Common Equity Tier 1 (CET1): Common Equity Tier I regulatory capital as defined by Regulation
(EU) No 575/2013 as in force, based on the transitional rules for the reported period, divided by total Risk Weighted Assets (RWA).
Core Pre-provision Income (Core PPI): The total of net interest income, net banking fee and
commission income and income from non banking services minus the operating expenses of the reported period.
Cost to Income ratio: Total operating expenses divided by total operating income.
Fees and commissions: The total of net banking fee and commission income and income from non banking services of the reported period.
Fully loaded Common Equity Tier I (CET1): Common Equity Tier I regulatory capital as defined by
Regulation No 575/2013 as in force, without the application of the relevant transitional rules, divided by total RWA.
Income from trading and other activities: The total of net trading income, gains less losses from
investment securities and other income/ (expenses) of the reported period.
Loans to Deposits ratio: Loans and advances to customers at amortised cost divided by due to customers at the end of the reported period.
Liquidity Coverage Ratio (LCR): The total amount of high quality liquid assets over the net liquidity outflows for a 30-day stress period.
Net Interest Margin (NIM): The net interest income of the reported period, annualised and divided by
the average balance of continued operations’ total assets (the arithmetic average of total assets, excluding discontinued operations’ assets, at the beginning and the end of the reported period as well as at the end of interim quarters).
Non-performing exposures (NPEs): Non Performing Exposures (in compliance with EBA Guidelines)
are the Group’s material exposures which are more than 90 days past-due or for which the debtor is assessed as unlikely to pay its credit obligations in full without realization of collateral, regardless of the existence of any past due amount or the number of days past due. The NPEs, as reported herein, refer to the gross loans at amortised cost except for those that have been classified as held for sale.
NPEs formation: Net increase/decrease of NPEs in the reported period excluding the impact of write offs, sales and other movements.
NPEs Coverage ratio: Impairment allowance for loans and advances to customers, including
impairment allowance for credit related commitments (off balance sheet items), divided by NPEs at the end of the reported period.
NPEs ratio: Non Performing Exposures (NPEs) divided by gross loans and advances to customers at
amortised cost at the end of the reported period.
Pre-Provision Income (PPI): Profit from operations before impairments, provisions and restructuring costs as disclosed in the financial statements for the reported period.
Provisions (charge) to average Net Loans ratio (Cost of Risk): Impairment losses relating to loans
and advances charged in the reported period, annualised and divided by the average balance of loans and advances to customers at amortised cost (the arithmetic average of loans and advances to customers at amortised cost, including those that have been classified as held for sale, at the beginning and the end of the reported period, as well as at the end of interim quarters).

May 27, 2021
8
Return on tangible book value (RoTBV): Adjusted net profit divided by average tangible book value.
Tangible Book Value (TBV): Total equity excluding preference shares, preferred securities and non
controlling interests minus intangible assets.
Tangible Book Value/Share (TBV/S): Tangible book value divided by outstanding number of shares
as at period end excluding own shares.
Texas Ratio: Non-performing exposures (NPEs) divided by the sum of impairment losses relating to loans and advances and Common Equity Tier 1.
Total Capital Adequacy ratio: Total regulatory capital as defined by Regulation (EU) No 575/2013 as
in force, based on the transitional rules for the reported period, divided by total Risk Weighted Assets (RWA). The RWA are the Group’s assets and off-balance-sheet exposures, weighted according to risk factors based on Regulation (EU) No 575/2013, taking into account credit, market and operational Risk.
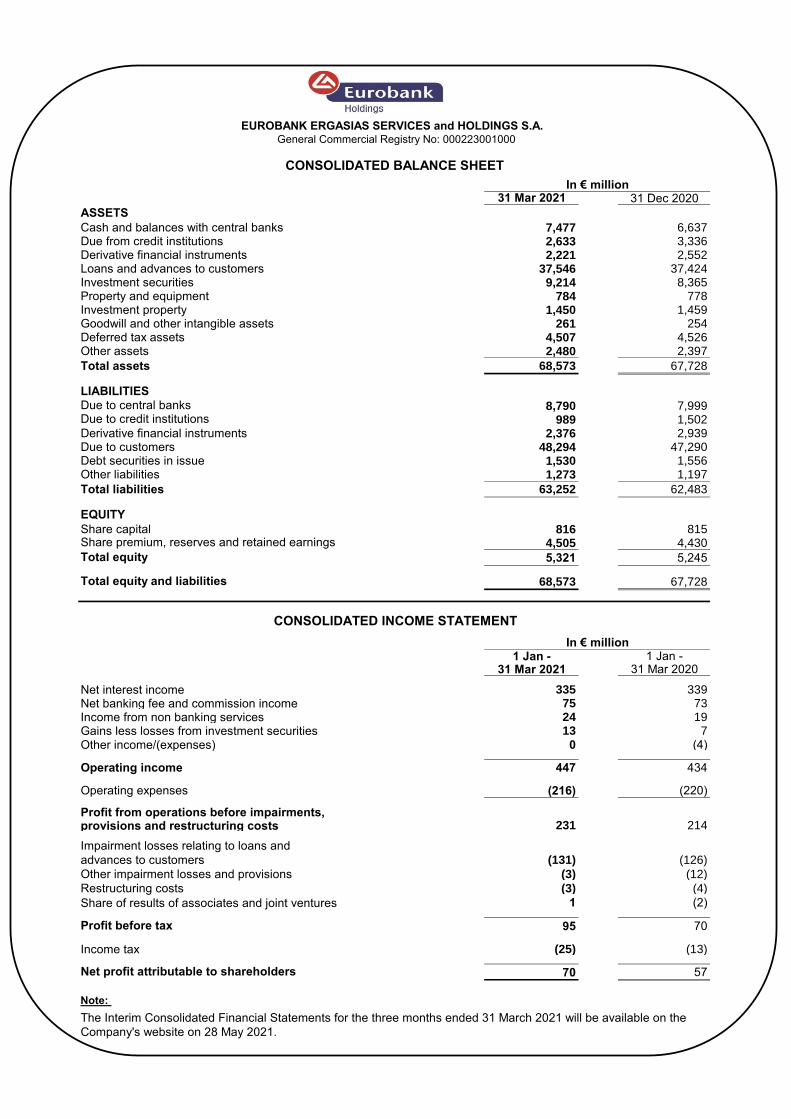
31 Mar 2021 31 Dec 2020
ASSETS
Cash and balances with central banks 7,477 6,637Due from credit institutions 2,633 3,336Derivative financial instruments 2,221 2,552Loans and advances to customers 37,546 37,424Investment securities 9,214 8,365Property and equipment 784 778Investment property 1,450 1,459Goodwill and other intangible assets 261 254Deferred tax assets 4,507 4,526Other assets 2,480 2,397
Total assets 68,573 67,728
LIABILITIES
8,790 7,999989 1,502
Derivative financial instruments 2,376 2,939Due to customers 48,294 47,290Debt securities in issue 1,530 1,556Other liabilities 1,273 1,197
Total liabilities 63,252 62,483
EQUITY
Share capital 816 8154,505 4,430
5,321 5,245
68,573 67,728
1 Jan - 1 Jan -31 Mar 2021 31 Mar 2020
Net interest income 335 339Net banking fee and commission income 75 73Income from non banking services 24 19Gains less losses from investment securities 13 7
0 (4)
Operating income 447 434
Operating expenses (216) (220)
Profit from operations before impairments,provisions and restructuring costs 231 214
(131) (126)
(3) (12)
(3) (4)
Share of results of associates and joint ventures 1 (2)
95 70
Income tax (25) (13)
70 57
Note:
The Interim Consolidated Financial Statements for the three months ended 31 March 2021 will be available on the
Company's website on 28 May 2021.
In € million
Net profit attributable to shareholders
Profit before tax
Restructuring costs
Impairment losses relating to loans and
advances to customers
Other income/(expenses)
EUROBANK ERGASIAS SERVICES and HOLDINGS S.A.General Commercial Registry No: 000223001000
In € million
CONSOLIDATED BALANCE SHEET
Due to central banksDue to credit institutions
Share premium, reserves and retained earnings
Total equity and liabilities
Total equity
Other impairment losses and provisions
CONSOLIDATED INCOME STATEMENT