foraging by mobile predators on a rocky shore: lipophrys ... · foraging by mobile predators on a...
TRANSCRIPT
MARINE ECOLOGY PROGRESS SERIES Mar Ecol Prog Ser
Published October 14
Foraging by mobile predators on a rocky shore: underwater TV observations of movements
of blennies Lipophrys pholis and crabs Carcinus maenas
Michael T. ~urrows'~*, Kei ~ a w a i ~ , Roger N. ~ u g h e s ~
'Dunstaffnage Marine Laboratory, Centre for Coastal Marine Sciences. PO Box 3, Oban PA34 4AD. United Kingdom 2School of Animal Biology, University of Wales. Bangor LL57 2UW, United Kingdom
ABSTRACT: The hypothesis was proposed that shore fishes and crabs, predators other than gas- tropods, may be primarily responsible for depletion of barnacle populations in the vicinity of crevices through thigmotactic behaviour during foraging. To test thls hypothesis, movements of mobile preda- tors on barnacle-dominated rock in the lower intertidal zone were observed using a fixed underwater television camera. An area of 0.2 m2 was monitored continuously for 14 d on a vertically oriented but relatively protected shore on the west coast of Scotland. Infrared lights during nighttime high tides lit the area. Stereo photography was used to determine the topography of the area. The principal species seen by day was the blenny Ljpophrys pholis (L.) while the shore crab Carcinus maenas (L.) was the most frequent species at night. Scorpion fish Taurulus bubalis (Euphrasen), dogwhelks Nucella lapillus (L.) and a single North American mink Mustela vison Schreber were also seen. Movements of crabs, and especially blennies, were concentrated around small-scale concavities in the rock surface of less than 10 cm dimensions, supporting the primary hypothesis. Times spent by Lipophryspholis and Carci- nus maenas in 0.001 m2 (10 cm2) areas within the video frame varied by 3 and 2 orders of magnitude, respectively. These 2 species are known to be active predators of barnacles Sernibalanus balanoides and showed behaviour consistent with attacks on barnacles as prey. Observed movements and appar- ent spatial concentration of attacks, especially around crevices, may be a cause of patchiness in barna- cle populations at this scale.
KEY WORDS: Rocky shores . Predation . Barnacles . Crabs . Intertidal fishes . Surface topography
INTRODUCTION
Predation has been long recognised as a major process structuring rocky shore communities (Fischer-Piette 1935, Connell1961). Keystone predator species may pre- vent primary competitors among the sessile species from dominating the community in some areas (Paine 1966). Elsewhere predators may either determine lower limits of sedentary animals (Connell 1970) or simply reduce their overall abundance (Fairweather et al. 1984).
Analyses of spatial variation in rocky shore commu- nities on a range of scales have shown that 2 peaks
occur in the spectra of variation: at scales of several metres or less and at larger scales of several kilometres or more (Archambault & Bourget 1996, Underwood & Chapman 1996). Small-scale variation may be entirely generated by biological self-organisation, such as that produced by natural aggregations of limpet grazers on patches of fucoid macroalgae (Hartnoll & Hawkins 1985, Johnson et al. 1997, Burrows & Hawkins 1998), or the attraction of settling larvae to their conspecifics (Crisp & Meadows 1962). The directly damaging effects of extreme wave action or wave-borne objects (Paine & Levin 1981, Shanks & Wright 1986) may phys- ically generate it. The topography of the substratum itself generates a range of patchily distributed micro- habitats that affect the growth and survival of inter-
O Inter-Research 1999 Resale of full article not permitted
238 Mar Ecol Prog Ser 187: 237-250, 1999
tidal organisms and thence community structure (e.g. Wethey 1984).
Behavioural responses of predators to the topogra- phy of the substratum (Kostlyev 1996) may be a major source of spatial variation in rocky shore communities. Mobile predators retreat to refuges such as crevices in the rock during harsh conditions of desiccation or wave action (Emlen 1966, Burrows & Hughes 1989). Haloes of bare space or reduced population density may appear around refuges used by predatory gastropods (Seed 1969, Fairweather 1988, Hughes & Burrows 1993), while large prey of sizes preferred by predators (Dunkin & Hughes 1984) may also be reduced in num- ber around such crevices (Johnson et al. 1998). The reduction in barnacle populations around crevices usually has been assumed to be caused by the activity of predatory gastropods such as dogwhelks Nucella lapillus (Hughes & Burrows 1993, Johnson et al. 1998). Yet blennies Lipophrys pholis are known also to feed extensively on barnacle cirri (Qasim 1957), show thig- motactic movemerits (to increase the quantity of con- tact stimulation) and learn routes in rock pools and lab- oratory aquaria (Almada et al. 1983, Dodd 1998). To a lesser extent shore crabs Carcinus maenas are also known to take barnacles (Elner 1981) and show thig- motactic behaviour in laboratory tanks. If these ob- served patterns of movement are expressed during for- aging in natural conditions, both species are good candidates for additional, and potentially more impor- tant, contributors to localised depletion of barnacle populations. This study, therefore, was designed to test the hypothesis that predators other than dogwhelks, specifically L. pholis and C. maenas, may be responsi- ble for depletion of barnacle populations in the vicinity of crevices through thigmotactic behaviour during for- aging. To test this hypothesis, intertidal predators (including blennies L. pholis and shore crabs C, mae- nas) were observed dlrectly on a rocky shore using a video camera both in and out of water in a 0.2 m2 area
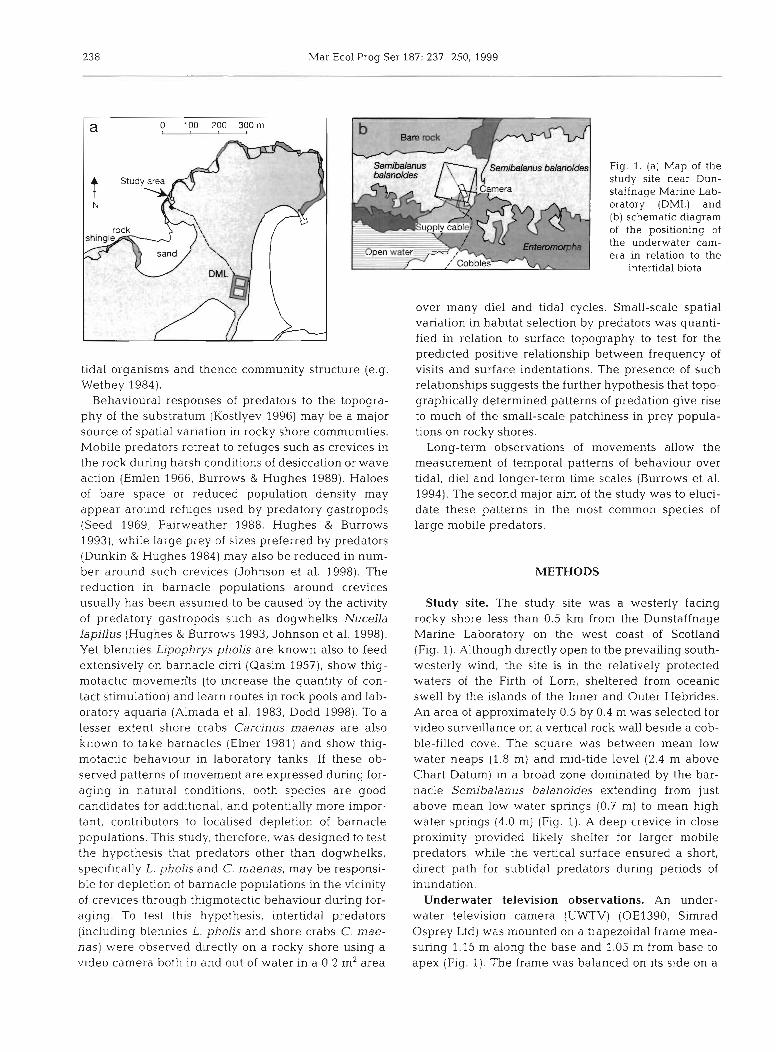
Fig. 1 . (a) Map of the study site near Dun- staffnage Marine Lab- oratory (DML) and (b) schematic diagram of the positioning of the underwater cam- era in relation to the
intertidal biota
over many diel and tidal cycles. Small-scale spatial variation in habitat selection by predators was quanti- fied in relation to surface topography to test for the predicted positive relationship between frequency of visits and surface indentations. The presence of such relationships suggests the further hypothesis that topo- graphically determined patterns of predation give rise to much of the small-scale patchiness in prey popula- tions on rocky shores.
Long-term observations of movements allow the measurement of temporal patterns of behaviour over tidal, diel and longer-term time scales (Burrows et al. 1994). The second major aim of the study was to eluci- date these patterns in the most common species of large mobile predators.
METHODS
Study site. The study site was a westerly facing rocky shore less than 0.5 km from the Dunstaffnage Marine Laboratory on the west coast of Scotland (Fig. 1). Although directly open to the prevailing south- westerly wind, the site is in the relatively protected waters of the Firth of Lorn, sheltered from oceanic swell by the islands of the Inner and Outer Hebrides. An area of approximately 0.5 by 0.4 m was selected for video surveillance on a vertical rock wall beside a cob- ble-filled cove. The square was between mean low water neaps (1.8 m) and mid-tide level (2.4 m above Chart Datum) in a broad zone dominated by the bar- nacle Semibalanus balanoides extending from just above mean low water springs (0.7 m) to mean high water springs (4.0 m) (Fig. 1). A deep crevice in close proximity provided likely shelter for larger mobile predators, while the vertical surface ensured a short, direct path for subtidal predators during periods of inundation.
Underwater television observations. An under- water television camera (UWTV) (OE1390, Simrad Osprey Ltd) was mounted on a trapezoidal frame mea- suring 1.15 m along the base and 1.05 m from base to apex (Fig. 1). The frame was balanced on its side on a

Burrows et al.: Patchy foraging by intertidal predators 239
horizontal .ledge, secured in position with sandbags filled with large cobbles, and oriented such that the camera pointed horizontally at the vertical rock sur- face. The scene was lit at night when the tide was in by two 300 W underwater lights (Osprey OE1132) fitted with infrared filters. A combined cable connected the camera and lights to a control unit (Osprey camera controller OE1230A) in a nearby building that housed pumps supplying seawater to the laboratory. Time- lapse video recordings were made at 5.56 frames s-' (Panasonic AG6024) after adding a time code signal (IMP Electronics time code generator V9000A). This gave 24 h of recording on 2 h 40 min of videotape.
Video recordings were made continuously for 14 d from low water at 12:20 h BST on 20 August until low water at 12:30 h BST on 3 September 1997.
Measurement and analysis of patterns of move- ment. Movements of large mobile epibenthic predators were recorded by digitising their location at the begin- ning and end of every move and at the end of each straight-line section of the trajectory while moving, for the whole period that they were visible. Co-ordinates were recorded using a computer program that logged the location of a pointer on the screen overlying the TV image. The time (to the nearest 0.01 S) at each location was logged by the same program via a time code reader linked to the computer (VMR V9, IMP Electron- ics Ltd).
For 7 out of 14 d of recordings, the movements of every epibenthic animal passing the camera were quantified in detail. Three species were regularly seen: 2 fishes, the blenny Lipophrys pholis (Linnaeus 1758) and the sea scorpion Taurulus bubalis (Euphrasen 1786), and 1 crustacean, the shore crab Carcinus mae- nas, Linnaeus. Other species seen but not recorded included the two-spot goby Gobiusculus flavescens (Fabricius 1779) swimming in small shoals away from the rock surface during daylight hours, and a single North American mink Mustela vison (Schreber) han- dling dogwhelks Nucella lapillus (L.) at low water one afternoon. Mink are well established in Argyll follow- ing escapes from fur farms (Craik 1997). Dogwhelks and limpets Patella vulgata (L.) were also seen but their movements were not recorded for this study. Shore crabs and blennies were by far the most abun- dant species. Most subsequent analyses were of the movements of these 2 species.
Several measures of behaviour were derived from the sequences, after correction of the co-ordinates for dis- tance from the camera and rotation relative to the verti- cal (see next section). The measures included the total duration of time visible, total distance moved, average speed, number of stationary pauses and the proportion of time spent paused. Directions of movement were cal- culated relative to the vertical, and changes in direction
were recorded as the difference in angles of current and previous moves. The degree of convolution of the trajectory was measured as the ratio of the total dis- tance moved to the straight-line distance from the point of entry to the point of exit from the field of view.
The frequency of occurrence and behaviour of Car- cinus maenas, Lipophrys pholis and Taurulus bubalis were analysed in several ways. At the level of individ- ual moves, distributions of distances travelled, time spent paused, and directions of movement were de- scribed and compared among species. Frequency of occurrence and measures of behaviour at the level of whole sequences were compared for each species among different dates, hours of the day (00:OO to 23:OO h) and time in hours relative to the nearest high water (6 h before to 6 h after high water). Non-para- metric analysis of variance based on the ranks of the data was used to test the significance of observed pat- terns. Finally, the spatial distribution of behaviour was examined by plots of the measured trajectories and comparison of frequency of occurrence and measures of behaviour among different regions in the original camera view.
Topography of study area: depth, rotation and scal- ing of measured co-ordinates. The location of the camera frame was chosen for the best compromise of stability and a good field of view. The resulting image was rotated to the left of the vertical, with the furthest parts of the image (bottom right, Fig. 2a,b) approxi- mately 1.2 m from the camera and the closest parts 0.6 m away (top left). Estimation of distances travelled in contact with the surface from the projected image in the TV picture therefore would be biased by these dif- ferences in distance from the camera, so correction for these effects was necessary.
Topography of the surface was quantified using measurements from a stereo pair of photographs taken with the left image at the location of the TV camera (Fig. 2c). Distance from the plane (zp, cm) and co-ordi- nates along the plane of the cameras (X,, yp, cm) were calculated using the method of van Rooj & Videler (1996) such that:
z~ ' zp = - XL - XR
(1)
where ZF was the distance from the camera lens to the film plane (38 mm), Xc was the separation distance of the 2 camera lenses (22.5 cm), while (xL, yL) and (XR, yR) were the co-ordinates of the same feature in left-hand and right-hand images, respectively.
Registration of the left-hand stereo image and the TV image was achieved by digitizing co-ordinates of

240 Mar Ecol Prog Ser 187: 237-250, 1999
x (pixels)
x rotated (estimated cm)
Fig. 2. Topography of the study area. Video images show the area covered by the tide with (a) a single Carcinus maenas at night (arrowed) and (b) a Lipophryspholis by day (arrowed). (c) Paired co-ordinates of points in left-hand and right-hand images of a stereo pair. (d) Traces of the water surface in video images at 10 min intervals on a rising tide with calculated water heights (m above Chart Datum). (e) Water surface traces and image limits after correction for distance from the camera (see 'Methods' for details), and ( f ) rotation of co-ordinates to the vertical, (g) Contour plot of the estimated distance of the rock surface from the cam- era ( z co-ordinate in cm) with the location, and (h) residuals from a fitted smooth response surface (as cm above or below) as a
measure of small-scale topography

Burrows et al.: Patchy foraging by intertidal predators 24 1
the same features in each image. Co-ordinates on the left-hand stereo image were nearly perfectly regis- tered to those on the TV image by rotation around a centre of rotation (to the right by 0.47 radians around X = 168, y = 470), and re-scaling to match the 640-480 pixel dimensions of the TV image.
This procedure produced measures of the distance from the camera of a large number of points within the view of the TV camera (Fig. 2c, g). To estimate the dis- tance from the camera of any object in the camera view, the relationship between measured distance (zp) and position within the image (X,, yTV) was deter- mined by stepwise polynomial regression. Parameters from the best-fit model were used to predict distances from the camera for all digitised positions of predators. These predicted distances (ip) were then used in turn to predict co-ordinates along the plane of the cameras (kp, pp, cm) using Eqs. (2) & (3). Residuals of measured distances from those predicted by the fitted regression (zp -ip, Fig. 2h) gave the small-scale topographical structure of the rock surface.
The rotation of the TV image relative to the vertical plane was measured by observation of changing water levels over a 90 min period on a rising tide in calm weather between 07:30 and 09:OO h on 25 August 1997. Water levels were digitized from TV images every 10 min. A common slope relating water elevation (recalculated yp) to X co-ordinates for these water levels (ip cm) was obtained from linear regression as -0.732, equivalent to a rotation of 0.632 radians (Fig. 2f) to the right of the vertical axis. All calculated co-ordinates of locations (ip, yp) were therefore rotated by -0.632 about the origin at the top left-hand corner of the image (Fig. 2e, f ) .
As a check on the scale, observed water levels were compared to those predicted at 10 min intervals for the nearest standard port (Oban, <4 km distant) using a tidal prediction program (POLTIPS for Windows v1.0, Proudman Oceanographic Laboratory 1996). Predicted and observed values were very highly correlated ( R ~ =
0.985) and showed that original estimates of planar X and y co-ordinates were 1.62 times greater than their true values (Fig. 2f). This error may have been due to an unreliable estimate of the focal length of the TV camera, ZF, relative to the size of the image.
RESULTS
Observed behaviour
Sequences of movement of crabs, blennies and scor- pion fish were characterised by the appearance of the animal, a series of moves across the rock surface, sometimes punctuated by stationary pauses, followed by the exit of the animal from the field of view (Fig. 3). Apart from gross movements, some types of behaviour could be observed while the animals were visible. Carcinus maenas spent much time apparently feeding, picking over the rock surface with the chelae, although the food items manipulated could rarely be seen. In one instance, a single C. maenas removed 15 dog- whelks Nucella lapillus from an aggregation on the rock surface between 02:15 and 02:48 h on 28 August 1997 manipulating each one before dropping it. The success of these attacks could not be determined. Lipophrys pholis showed sequences of moves that were possibly attacks on barnacles. The fishes initially fixated on an area and oriented towards it; this was followed by a rapid dart towards the region. This sequence of events was often immediately followed by a twisting of the body, perhaps associated with biting off barnacle cirri. Restricted visibility during periods of wave action, uneven illumination during nighttime tides and the small size of the animals in the image (Fig. 2a,b) all prevented adequate measurement of these behavioural acts.
The locations of the animals could, however, always be seen. Sequences were divided into straight-line segments ('moves', Table 1) by the observer. Moves of
Table 1. Summary and statistical comparison of properties of behavioural sequences among the 3 species observed. Pn time = proportion of time
Species n Median no. Median Median dis- Median pn Median Median convo- of moves duration tance travelled time paused speed lution of path
Shore crab 200 16 81.3 S 48.0 cm 0 0.54 cm S-' 1.25 Carcinus maenas
Blenny 203 13 27.2 S 47.7 cm 0.30 1.36 cm S-' 1.31 Lipophrys pholjs
Scorpion fish 12 12 59.8 S 40.9 cm 0.52 0.42 cm S-' 1.36 Taurulus bubalis
Kruskall-Wallis df = 2 4.59 37.58 1.50 25.06 7 1.79 4.63 chi-square
P 0.101 <0.001 0.472 <0.001 <0.001 0.099

242 Mar Ecol Prog Ser 187: 237-250, 1999
(a) Lipophrys pholis (b) 0 30
80 20
160 - go U
t240 a 0 - =. P e 320
2. -1 0
400 -20
480 -30 0 80 160 240 320 400 480 560 640 0 20 40 60 80
X (pixels) X rescaled (cm)
(c) Carcinus maenas (d)
,v 480
0 80 160 240 320 400 480 560 640 0 20 40 60 80 X (pixels) X rescaled (cm)
( e ) Taurulus bubalis (f
0 20 40 60 80 X rescaled (cm)
Fig. 3. Observed tracks of (a, b) Lipophrys pholis (n = 203 sequences), (c, d) Carcinus maenas (n = 193) and (e, f) Taurulus bubalis (n = 12) as (a, c, e) originally measured and (b, d , f) after scaling and rotation. Circles show locations of pauses
similar distance between 1 and 10 cm were recorded for all 3 species (Fig. 4a). Average duration of moves by crabs and scorpion fish (3.2 S and 3.0 S) were longer than those of blennies (1.0 S, Fig. 5). Duration of pauses followed a similar pattern, with crabs and scorpion fishes having longer stationary pauses on average (34
and 39 S) than blennies (7 s average). Moves of blennies averaged a speed of 3.4 cm S-', and those of scorpion fish 2.8 cm S-', while crabs reached only a quarter of the average speed of blennies at 0.8 cm S-'.
Summary statistics for whole sequences showed sim- llar differences among the 3 species to individual

Burrows et al.: Patchy foraging by intertidal predators 243
100 - Carcinus maenas
Lipophrys pholis 80 Fig. 4. Distributions of g 400 I Taurulus bubalis
(a) distances and (b) c 60 speeds per straight- 2 line segment (moves) & 40 of Lipophrys pholis, 200 Carcinus rnaenas (fre- quencies on left axis) 20
and Taurulus bubalis (on right axis). Note 0 logarithrmc size classes 1.0 2.0 5 10 20 50 100 0.1 0.2 1 2 10 20 100
Distance per move (cm) Speed per move (cm/$
moves (Table 1). While the distance covered, the number of moves and the convolution of the path taken were similar, Lipophrys pholis traversed the screen in less than half the time and at more than twice the speed of Carcinus rnaenas and Tauru- lus bubalis. Although the median proportion of time paused was zero for C. maenas, crabs spent a long time paused in many sequences giving a mean proportion paused of 0.19.
Despite the significance of the differences be- tween the species, each showed considerable variation among sequences. Duration, distance travelled, and speed, for example, varied over several orders of magnitude in each species (Fig. 6). The various measures of movement were strongly inter-correlated within each species (Table 2). For Lipophrys pholis and Carcinus maenas the number of moves, total duration and distance travelled, the proportion of time station- ary and the convolution of the sequence were all positively correlated with each other. Average speed was negatively correlated with all the other measures. Sequences therefore varied from long convoluted tracks with many pauses at low speed to short direct tracks with few pauses at high speed.
Temporal patterns in behaviour
Frequency of occurrence and mea- sures of behaviour of whole sequences were compared for each species among different dates, hours of the day (00:OO to 23:OO h) and time in hours relative to the nearest high water (6 h before to 6 h after high water). On the 7 d of continuous obser- vation shore crabs were 2 to 4 times as frequent at night as by day (Fig. 7) , while blennies were almost never seen
-- nn.
400 60 U g 300 Lipophrys pholis
40 200 : 100
20
0 0 0.1 1 10 100 1000
Duration (S)
Fig. 5. Distributions of duration of moves (grey bars, frequencies on left axis) and stationary pauses (open bars, frequencies on right axis) of (a) Carcinus maenas, (b) Taurulus bubalis and
(c) Lipophryspholis. Note loganthmic size classes
Table 2. Correlations among behavioural measures for sequences of movements of blennies Lipophrys pholis (n = 203) above the diagonal, and shore crabs Carcinus maenas (n = 199) below the diagonal. Values shown are Kendall's rank correlation coefficients. AU correlations were significant at p < 0.0001 (with a
single exception shown in parentheses)
No. of Convo- Distance Duration Speed moves lution
Pn time paused
No. of moves - +0.28 +OS7 +0.44 -0.23 Convolution + 0.33 - +0.21 +0.27 -0.25 Distance +0.64 +0.39 - +0.44 -0.18 Duration +0.46 +0.34 +0.49 - -0.74 Speed -0.21 -0.20 -0.19 -0.70 - Pn time paused +0.34 +0.20 +0.24 +0.39 -0.34

244 Mar Ecol Prog Ser 187: 237-250, 1999
50 (b) Carcinus maenas
0 Lipophrys pholis 40 Taurulus bubalis
30
20
10
0
5 10 20 50 100 Total distance (cm)
" 1 10 100 1000
Total durat~on (S)
60 - (c)
50 .
b 40 .
5 30 . U
E 2 0 .
Fig. 6. Measures of entire sequences of moves of Car-
l o cinus maenas, Taurulus bu- halis and Ljpophrys pholis: distributions of (a) total duration, (b) total distance moved, (c) average speed and (d) convolution of the
O track followed. Freauencies 0.1 1 10
Total speed (cmls)
1 2 5 10 20 for T bubalis are shown on Convolution (path lengthlstraight line distance) the right axis
Table 3. Comparison of measures of sequences and frequency of observation during the hours of darkness (21:OO to among dates, times of day and time relative to high water (Time high water). 04:00 h). Differences in frequency Data shown are probabilities of Kruskall Wallis H-statistics from analyses of van- between night and day were highly ance of ranked data (Zar 1984). Probabilities greater than 0 05 are not shown (ns)
significant in both species (Table 3). More crabs and fewer blennies were seen between midnight and midday than between midday and midnight. Crabs and blennies were never ob- served during periods of emersion (from 6 h before to 6 h after high- water), but were seen in similar num- bers throughout the period of immer- sion (Fig. 7).
Changes in behaviour among dates and times were seen. Carcinus mae- nas moved more rapidly on the first
Date Time Time high - Contrasts - Total df of day water A M Night Ebb
(h) (h) vs vs VS
PM Day Flood
Carcinus maenas df 8 23 10 1 1 1
Distance ns ns ns ns ns ns 191 Duration ns ns ns ns 0.049 ns 191 Speed 0.018 ns ns ns 0.002 ns 191 Convolution ns ns ns 0.038 ns ns 191 Pn time paused ns ns ns ns ns ns 191
df 9 23 11 1 1 1
Frequency Of 0.014 0.024 ns observation 0.002 0.001 ns 96
Lipophrys pholis df 8 17 9 1 1
Distance ns ns ns ns ns 202 Duration ns 0.008 ns 0.008 ns 202 Speed ns 0.036 ns 0.010 ns 202 Convolution 0.018 ns 0.033 ns ns 202 Pn time paused ns ns ns ns ns 202
df 9 23 11 1 1 1
Frequency of ns 0.00, ns observation 0.050 0.001 ns 96
4 days of observation than on the next 3 (Fig. 8e), and more slowly over a longer period during daylight hours than at night (Fig. 8a,c, Table 3, sig- nificant Date effect and Night vs Day contrasts). Lipophrys pholis moved more slowly and spent longer in view during the morning than in the after- noon and evening (Fig. 8a, c ) . L. pholis also tended to move along more con- voluted paths before rather than after the time of high water (Fig. 8b). Although the comparison of means was not significant at the 0.05 level,

Burrows et al.: Patchy foraging by intertidal predators 245
Fig. 7 Average frequencies of Carcinus maenas (--o--) and Lipophrys pholis (-o-) seen (a) during tidal immersion per hour of the day (n = 5 per hour) and (b) per hour relative to the time of the nearest high water (n = 13 per hour for
hours -3 to t 3) 0 6 12 ' 18 24
Time of day
the proportion of time spent paused by blennies was correlated with the hour of the tidal cycle (Kendall's tau b = -0.157, n = 203, p = 0.003). Blennies spent a greater proportion of time stationary on the flood tide (0.4 to 0.5) than on the late ebb tide (0.1 to 0.2) (Fig. 8b). Both species showed similar changes in con- volution of the track among dates (Fig. 8f), with the exception of L. pholis on 2 September 1997 (based on only 7 sequences). Most convoluted paths were seen on neap tides.
Fig. 8 Changes in behaviour of Car- cinus rnaenas (. . . .o... .) and Lipophrys pholis (-m-) on 3 time scales. (a) Changes in duration of sequences in relation to time of day: lines show significant differences in averages between night and day periods for C. maenas (....... Table 3) and between morning and afternoon for L , pholis (-) (b) Average proport~on of time spent paused versus time relative to high water. (c) Average speed of sequences per hour of the day. (d) Changes in average convolution of the path relative to time in the tidal cycle. (e) Average speed versus date of observation (d/mo/yr), and (f) average convolution of the path versus date (d/mo/yr), with associated changes in h e ~ g h t of high and low water (-+-)
O d " ~ " ~ " ' " ' -6 -3 0 3 6
Time relatlve to h~gh water
Spatial patterns in behaviour
Plots of all the trajectories of the 3 species reveal striking patterns of the use of different areas in the field of view of the camera (Fig. 3). Movements of Lipophrys pholis were concentrated in the regions of surface indentations to the right-hand side of the visi- ble area (compare Fig. 3b and Fig. 2c,h). Fishes fol- lowed the lines of these concavities as pathways through the field of view, pausing frequently while
\0 0 0
. . . : :.. . . .o ...o...o." .L. ; o-' 1
0 6 12 18 24 .6 3 0 3 6 T~me of day Tme relat~ve to high water
T ~ m e of day T~me relative to h~gh water
1 0 .,.+\ e . ,+*.+- 3 , +.+ f ,+*.+- 5 + -+ ++.++
m
2 2 . 0 - -
0 v ...
- 2 0
(U .+.+*-+. .- o,.... Q.. .+? *+ 4 c - E ... .... m C 01
a ++.+_c .-
m 1 . W~.... O+,+ .. m .g . +.+ .' (U
W I i . S +
I
m +.+' " 0 / +' \+. l / '-. :
+'+ ; .. +' X+. l m ++ '.. :
C 0 .e;'
+ a
0.5 eJ S +J
24 6 Mar Ecol Prog Ser 187: 237-250, 1999
(a) L. pholis
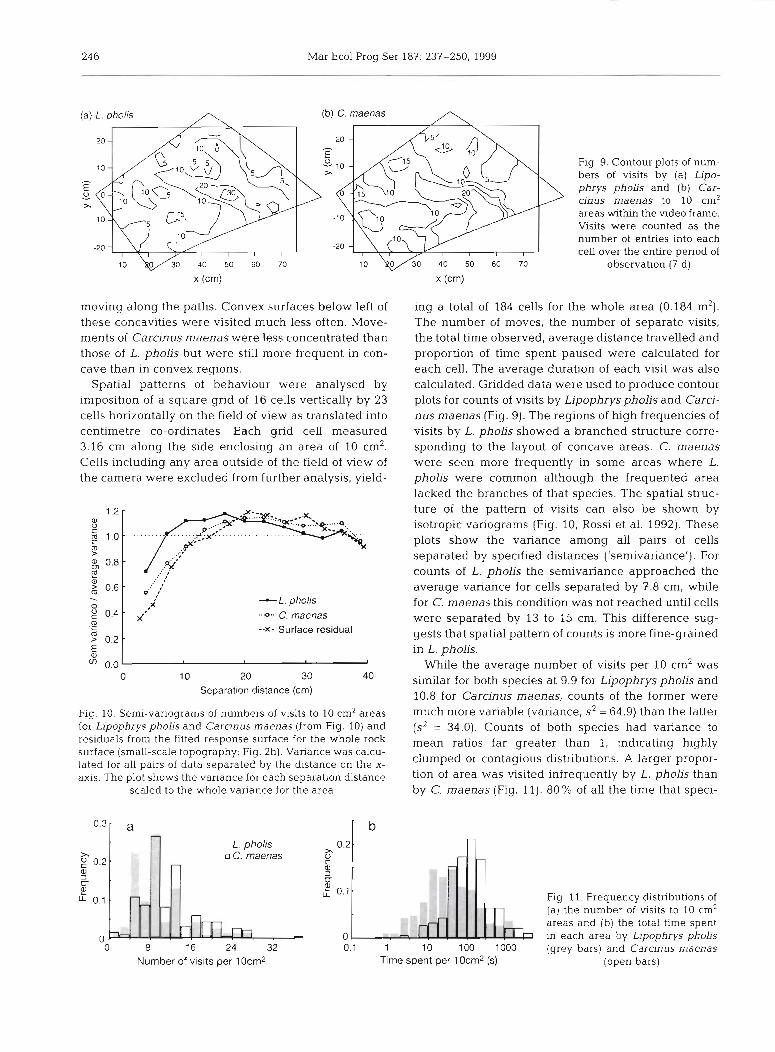
Fig. 9. Contour plots of num- bers of visits by (a) Lipo- phrys pholis and (b) Car- cinus maenas to 10 cm2 areas w i t h the video frame. Visits were counted as the number of entries into each cell over the entire period of
observation (7 d)
moving along the paths. Convex surfaces below left of these concavities were visited much less often. Move- ments of Carcinus maenas were less concentrated than those of L. pholis but were still more frequent in con- cave than in convex regions.
Spatial patterns of behaviour were analysed by imposition of a square grid of 16 cells vertically by 23 cells horizontally on the field of view as translated into centimetre co-ordinates. Each grid cell measured 3.16 cm along the side enclosing an area of 10 cm2. Cells including any area outside of the field of view of the camera were excluded from further analysis, yield-
A L. pholis 0.4 1 xi*i , , , ,
-0.. C. maenas m .- L --X- Surface residual F 0.2 .-
E m 0.0
0 10 20 30 40 Separation distance (cm)
Fig. 10. Semi-variograms of numbers of visits to 10 cm2 areas for Lipophrys pholis and Carcinus maenas (from Fig. 10) and residuals from the fitted response surface for the whole rock surface (small-scale topography: Fig. 2h). Variance was calcu- lated for all pairs of data separated by the distance on the x- axis. The plot shows the variance for each separation distance
scaled to the whole variance for the area
ing a total of 184 cells for the whole area (0.184 m2). The number of moves, the number of separate visits, the total time observed, average distance travelled and proportion of time spent paused were calculated for each cell. The average duration of each visit was also calculated. Gridded data were used to produce contour plots for counts of visits by Lipophryspholis and Carci- nus maenas (Fig. 9). The regions of high frequencies of visits by L. pholis showed a branched structure corre- sponding to the layout of concave areas. C. maenas were seen more frequently in some areas where L. pholis were common although the frequented area lacked the branches of that species. The spatial struc- ture of the pattern of visits can also be shown by isotropic variograms (Fig. 10, Rossi et al. 1992). These plots show the variance among all pairs of cells separated by specified distances ('semivanance'). For counts of L. pholis the semivariance approached the average variance for cells separated by 7.8 cm, while for C. maenas this condition was not reached until cells were separated by 13 to 15 cm. This difference sug- gests that spatial pattern of counts is more fine-grained in L. pholis.
While the average number of visits per 10 cm2 was similar for both species at 9.9 for Lipophrys pholis and 10.8 for Carcinus maenas, counts of the former were much more variable (variance, s2 = 64.9) than the latter (s2 = 34.0). Counts of both species had variance to mean ratios far greater than 1, indicating highly clumped or contagious distributions. A larger propor- tion of area was visited infrequently by L. pholis than by C. maenas (Fig. 11). 80 % of all the time that speci-
L. pholis o C. maenas
- 0 8 16 24 32
Number of visits per 1 Ocm2
% 0.2
0 C
S H 0.1 Fig. 11. Frequency distributions of
(a) the number of visits to 10 cm2 areas and (b) the total time spent
0 in each area by Lipophrys pholis 0.1 1 10 100 1000 (grey bars) and Carclnus maenas
Time spent per 1 0crn2 (S) (open bars)

Burrows et al.: Patchy foraging by intertidal predators 247
Table 4. Correlations among behavioural measures in 10 cm2 regions for blennies Lipophryspholis (n = 182) above the diagonal, and shore crabs Carcinus maenas (n = 184) below the diagonal. Values shown are Kendall's rank correlation coefficients. All
correlations shown were significant at p < 0.0001
No. of visits
No. of visits No. of moves +0.85 Total duration +0.49 Duration per visit +0.18 Average move duration +0.08 Pn time paused +0.24 Average distance moved ns
No. of moves
Total duration
Duration per visit
Average move duration
Pn time paused
Average dis- tance moved
-
mens of L. pholis were observed occurred in 20.9 % of the total area. The same proportion of total time observed for C. rnaenas occurred in 31.5 % of the area.
Most measures of behaviour were positively corre- lated with the number of visits to each grid cell (Table 4). While several of these measures were nec- essarily inter-linked (number of visits, total duration of visits, average duration), others revealed differ- ences in behaviour among regions. Only average dis- tance travelled was not correlated with any other measure. Magnitude and sign of correlations were generally similar in the 2 species. Fishes and crabs spent more time per visit, a greater proportion of time paused and had more prolonged moves (and were therefore slower) in those cells visited more fre- quently.
DISCUSSION
Diving during periods of inundation (Palmer 1984, Robles 1987, Robles & Robb 1993) has previously pro- duced direct observations of movements of mobile predators on rocky shores. The fixed UWTV used in this study has several advantages over diving obser- vations. Animals are less likely to be disturbed by the method of observation. Prolonged observation by day and night and during tide-in and tide-out periods allows determination of die1 and tidal patterns of for- aging and permits observation of rare but potentially important predatory interactions. A rigid platform and permanent record makes measurement of move- ments comparatively simple. Compared to a free- swimming observer, the main disadvantage of fixed UWTV is the limits to the field of view and resolution of the image. The other major limitation of UWTV, as used in this study, is that the effort required to pro- duce this level of detail prevents extensive replica- tion, and thereby limits the generality of any conclu- sions reached.
The intensity of activity of predators other than Nucella lapillus was striking. Up to 4 visits by crabs Carcinus maenas and up to 6 visits by blennies Lipophrys pholis were seen per hour on average. The frequency of visits reflects both activity and abun- dance of the predators. Single animals may revisit the area several times a day. For the potential prey, the risk of mortality must increase with the frequency of preda- tor visits.
Movements of the 2 species were strongly aligned with surface topography, in line with the primary hypothesis that thgmotaxis of benthic predators would result in concentration of foraging around crevices. Blennies were active only during hours of daylight, like many other species of fishes in intertidal areas (blenniids, Wirtz 1978; labrids, Edwards et al. 1982). The fishes followed regular pathways along the lines of surface depressions (also seen in Coryphoblennius galerita L., Almada et al. 1983). Lipophrys pholis, among other blenny species, has a well-developed homing ability (Gibson 1967a). Mature males defend territories around their nests (Almada et al. 1992, Gonqalves & Almada 1998) and spend most of their time in the immediate vicinity of the nest. Most of the blennies in this study were smaller juveniles and did not show overtly agonistic or territorial behaviour (Gibson 1968). Despite this, it is likely that the main tracks represent learned pathways around areas known to individual fishes. Fishes introduced into novel areas show exploratory behaviour before devel- oping stereotypical routes between topographical fea- tures (Almada et al. 1983). The species is even able to learn routes though mazes to the location of food, a process enhanced by the presence of artificial visual cues (Dodd 1998).
Concentration of movements of Lipophrys pholis along concavities and avoidance of hghly convex regions suggests that the species may be susceptible to shear during wave action. Well-developed pectoral fins allow the blenny to hold on to the rock and prevent

248 Mar Ecol Prog Ser
dislodgement (Gibson 1982) and thigmotactic swim- ming may further reduce such risk. Apart from the cost of physical damage (Nursall 1977), displaced animals may be at greater risk and be less able to best exploit areas for which they have no spatial memory (Hughes et al. 1992).
Changes in behaviour, as shown by speed of move- ment, the convolution of the path followed and the proportion of time stationary, may reflect changes in foraging behaviour. Lipophrys pholis adopted more meandering tracks and were stationary for more time during flood tide than ebb tide. The species was also slower-moving before noon. This type of behaviour may be associated with searching for, orienting to- wards and attacking barnacle prey since foraging ani- mals often show a greater rate of turning in the pres- ence of prey (Bell 1991). On the flood tide and at the beginning of the day L. pholis may be hungrier and thus stimulated to feed. Carcinus maenas did not show similar changes in behaviour, but were just less active and moving more slowly during hours of daylight. Crabs appeared to continually browse on the barna- cles in the dark whereas blennies made a series of attacks on single barnacles involving visual orientation in the light. The scorpion fish Taurulus bubalis is thought to be a 'sit-and-wait' predator (Gibson 1967a), and the pattern of movements with frequent long pauses seen in this study is consistent with this type of foraging. Although L. pholis and C. maenas both have endogenous tidal rhythms of activity (Gibson 1967b, Naylor 1985) there were no obvious changes in activity during tide-in periods. Changes in movement patterns from day to day may have been related to the suitabil- ity of conditions for foraging. Both species moved over more convoluted tracks at neap tides when a greater proportion of the intertidal prey were continually cov- ered and accessible to predators.
Greater activity of shore crabs at night has been seen on sedimentary shores (Burrows et al. 1994, Gibson et al. 1998). Intertidal migration is a strong component of behaviour in horizontally oriented shores (Hunter & Naylor 1993, Warman et al. 1993) but there was little evidence for directed movements up or down the verti- cal rock in this study. The distance to be travelled to retreat to below low water is very short for any inter- tidal predator on a near vertical shore. Most move- ments of crabs and blennies were horizontally ori- ented.
While their importance on tropical rocky shores is undisputed (Menge & Lubchenco 1981), highly mobile crab and fish predators have been considered to be rel- atively unimportant as agents structuring communities on temperate rocky shores (Bertness et al. 1981, Menge 1982). Early predator exclusion experiments showed enhanced survival inside cages (e.g. Connell 1961,
1970, Dayton 1971, Menge 1976), with effects often assumed to be due to the obvious and abundant slug- gish intertidal residents such as muricid gastropods and starfish. However, close-mesh exclusion cages also prevent access by fishes and crabs (Edwards et al. 1982), leaving the possible effects of the latter untested by the early studies. Later work with a range of cage mesh sizes did demonstrate effects of fishes and crus- tacea (Menge et al. 1986, Robles 1987, Robles & Robb 1993). Removals of single and multiple species have been successful in demonstrating unequivocal effects of specific predators (Fairweather et al. 1984), al- though impacts are often highly variable among differ- ent sites (Fairweather & Underwood 1991).
The study site was less wave-exposed than many other temperate North Atlantic shores. Predation has been found to be more important in sheltered areas (Menge & Sutherland 1976) and areas of reduced water flow (Leonard et al. 1998), with mobile predators controlled by environmental stress (Menge 1978, Menge & Sutherland 1987, Burrows & Hughes 1989). Deployment of video cameras in a variety of conditions of wave exposure could directly test this hypothesis.
Like the early predator exclusion studies, localised impacts of predators around their refuges have simi- larly been assumed to be due to the predators found in these refuges at low tide, often muricid gastropods. While the low tide occupants of refuges may be responsible for much of the local depletion of prey, this study shows that movements of fishes and crabs are also concentrated in areas used as refuges by gas- tropods.
Barnacles form the major part of the diet of Li- pophrys pholis (Quasim 1957, Milton 1983) and have been found to be part of the diet of Carcinus maenas (Elner 1981). Both species appeared to forage on the dense population of Semibalanus balanoides in the present study. On rocky shores C, maenas is better known as a predator of mussels (Kitching & Ebling 1967, Elner & Hughes 1978), and may have been for- aging for very small littorinids in this study. L. pholis removes barnacle cirri by biting. This may not be fatal to the barnacles. S. balanoides can regenerate excised cirri within 3 wk of being attacked (M.T.B. pers. obs.) at an unknown cost in terms of lost opportunity for growth. Although single attacks on prey were not located in this study, areas of foraging form a subset of the total area where the predators were seen. Of the 2 species, L. pholis made movements that were more concentrated around crevices, has a diet comprised mainly of barnacles and is therefore the most likely to generate spatially localised depletion of prey. Small- scale surveys of the incidence of damaged or misslng cirri in barnacles around crevices and direct observa- tion of patterns of attacks would be very useful.

Burrows et al.: Patchy foraging by intertidal predators 249
Acknowledgements. K.K. and R.N.H. were supported by E.U. nivorous gastropods. PhD thesis. University of Washing- grant MAS3-CT95-0012 (EUROROCK) and a NERC Special ton, Seattle Topic grant GST/02/983. We would like to thank Linda Robb Fairweather PG (1988) Predation creates haloes of bare space for help with video analysis and Jane Dodd and anonymous among prey on rocky seashores in New South Wales. Aust referees for their helpful comments. J Ecol 13:401-409
Fairweather PG, Underwood AJ (1991) Experimental removals of a rocky intertidal predator: variations within
LITERATURE CITED two habitats in the effects on prey. J Exp Mar Biol Ecol 154:29-75
Almada V, Dores J, Pinheiro M, Santos RS (1983) Con- Fairweather PG, Underwood AJ, Moran MJ (1984) Prelimi- tribuiqao para o estudo do comportamento de Cory- nary investigations of predation by the whelk Morula mar- phoblennius galerita (L.) (Pisces: Blenniidae). Mem Mus ginalba. Mar Ecol Prog Ser 17:143-156 Mar Ser Zoo1 2:l-166 Fischer-Piette E (1935) Histoire d'une mouliere. Observations
Alrnada VC, Gonqalves EJ, Oliveira RF, Barata EN (1992) sur une phase de desequilibre faunique. Bull Biol Fr Belg Some features of the territories in the breeding males of 5:153-177 the intertidal blenny Lipophryspholis (P~sces, Blenniidae). Gibson R (1967a) Studies on the movements of littoral fish. J Mar Biol Assoc UK 72:187-197 J Anim Ecol35:215-234
Archambault P, Bourget E (1996) Scales of coastal hetero- Gibson RN (1967b) Expenments on the tidal rhythm of geneity and benthic intertidal species richness, dversity Blennius pholis. J Mar Biol Assoc UK 47:97-111 and abundance. Mar Ecol Proy Ser 136:lll-121 Gibson RN (1968) The ayonistic behaviour of juvenile
Bell WJ (1991) Searching behaviour: the behavioural ecology Blenniuspholis L. (Teleostei). Behaviour 30:192-217 of finding resources. Chapman and Hall, London Gibson RN (1982) Recent studies on the b~ology of intertidal
Bertness MD, Garrity SD, Levings SC (1981) Predation pres- fishes. Oceanogr Mar Biol Annu Rev 20~363-414 sure and gastropod foraging. a tropical-temperate com- Gibson RN, Pihl L, Burrows MT. Modin J, Wennhage H, Nick- parison. Evolution 35:995-1007 ell LA (1998) Die1 movements of juvenile plaice Pleuro-
Burrows MT, Hawkins SJ (1998) Modelling patch dynamics nectes platessa in relation to predators, competitors, food on rocky shores using deterministic cellular automata. availability and abiotic factors on a microtidal nursery Mar Ecol Prog Ser 167:l-13 ground. Mar Ecol Prog Ser 165:145-159
Burrows MT, Hughes RN (1989) Natural foraging of the dog- Gonqalves EJ, Almada VC (1998) A comparative study of ter- whelk, Nucella lapillus (L.): the weather and whether to ritoriality in intertidal and subtidal blennioids. Environ feed. J Molluscan Stud 55285-295 Biol Fishes 51:257-264
Burrows MT, Gibson RN. Robb L. Comely CA (1994) Tempo- Hartnoll RG, Hawkins SJ (1985) Patchiness and fluctuations ral patterns of movement in juvenile flatfishes and their on moderately exposed rocky shores. Ophelia 2453-63 predators: underwater television observations. J Exp Mar Hughes RN, Burrows MT (1993) Predatory behaviour of the Biol Ecol 177:251-268 intertidal snail, Nucella lapillus and its effects on commu-
Connell JH (1961) Effect of competition, predation by Thais nity structure. In: Kawanabe H, Cohen JE, Iwasaki K (eds) lapillus, and other factors on natural populations of the Mutualism and community organisation: behavioural, the- barnacle Balanus balanoides. Ecol Monogr 3 1 5 - 1 0 4 oretical and food web approaches. Oxford University
Connell J H (1970) A predator-prey system in the marine Press, Oxford, p 63-83 intertidal region. I . Balanus glandula and several species Hughes RN, Kaiser MJ, Mackney PA, Warburton K (1992) of Thais. Ecol Monogr 40:49-78 Optimizing foraging behaviour through learning. J Fish
Craik C (1997) Long-term effects of North American Mink Biol (Suppl B) 41:77-91 Mustela vison on seabirds in western Scotland. Bird Study Hunter E, Naylor E (1993) Intert~dal migrat~on by the shore 44:303-309 crab Carcinus rnaenas. Mar Ecol Prog Ser 101:131-138
Crisp DJ, Meadows PS (1962) The chemical basis of gregari- Johnson MP, Burrows MT, Hartnoll RG, Hawkins SJ (1997) ousness in cirripedes. Proc R Soc Lond B 156500-520 Spatial structure on moderately exposed rocky shores:
Dayton PK (1971) Competition, disturbance and comn~unity patch scales and the interactions between limpets and organisation: the provision and subsequent uthsation of algae. Mar Ecol Prog Ser 160:209-215 the space in a rocky intertidal community. Ecol Monogr Johnson MP, Hughes RN, Burrows MT. Hawkins SJ (1998) 41:351-389 Beyond the predation halo: small scale gradients in barna-
Dodd J (1998) Topographic learning and memory in habitat cle populations affected by the relative refuge value of selection by Ljpophrys pholis L. PhD thesis, University of crevices. J Exp Mar Biol Ecol231:163-170 Wales, Bangor Kitching JA, Ebling FJ (1967) Ecological studies of Lough Ine.
Dunkin SDB, Hughes RN (1984) Behavioural components of Adv Ecol Res 4:198-291 prey-selection by dogwhelks, Nucella lapillus (L.), feeding Kostlyev V (1996) Spatial heterogeneity and habitat complex- on barnacles, Semibalanus balanoides (L.), in the labora- ity affecting marine littoral fauna. PhD thesis, Goteborg tory. J Exp Mar Biol Ecol79:91-103 University
Edwards DC, Conover DO, Sutter F I11 (1982) Mobile preda- Leonard GH, Levine JM, Schmidt PR, Bertness MD (1998) tors and the structure of marine intertidal communities. Flow-driven variation in intertidal community structure in Ecology 63:1175-1180 a Maine estuary. Ecology 79:1395-1411
Elner RW (1981) Diet of green crab, Carcinus maenas (L.) Menge BA (1976) Organisation of the New England rocky from Port Hebert, southwestern Nova Scotia. J Shellfish intertidal conlmunity: role of predation, con~petition and Res 1:89-94 environmental heterogeneity. Ecol Monogr 46:355-393
Elner RW, Hughes RN (1978) Energy maximisation in the diet Menge BA (1978) Predation intensity in a rocky intertidal of the shore crab, Carcinus maenas (L.). J Anim Ecol 47: community. Oecologia 34: 1-16 103-116 Menge BA (1982) Reply to a comment by Edwards, Conover,
Emlen JL (1966) Time, energy and risk in two species of car- and Sutter. Ecology 63:1180-1184
250 Mar Ecol Prog Ser 187: 237-250, 1999
Menge BA, Lubchenco J (1981) Community organisation in temperate and tropical rocky intertidal habitats: prey refuges in relation to consumer pressure gradients. Ecol Monogr 51:429-450
Menge BA, Sutherland JP (1976) Species diversity gradients: synthesis of the roles of predation, competition and spatial heterogeneity. Am Nat 110:351-369
Menge BA, Sutherland JP (1987) Community regulation: vari- ation in disturbance, competition and predation in relation to environmental stress and recruitment. Am Nat 130: 730-757
Menge BA, Lubchenco J, Ashkenas LR, Ramsey F (1986) Experimental separation of effects of consumers on sessile prey in the low zone of a rocky shore in the Bay of Panama: direct and indirect effects of food web complex- ity. J Exp Mar Biol Ecol 100:225-269
Milton P (1983) Biology of littoral blenniid fishes on the coast of south-west England. J Mar Biol Assoc UK 63:223-237
Naylor E (1985) Tidally rhythmic behaviour of marine anl- mals. Syrnp Soc Exp Biol39:69-93
Nursall JR (1977) Territoriality in redlip blennies (Ophio- blennius atlanticus - Pisces, Blenniidae). J Zool Lond 1821205-223
Paine RT (1966) Food web complexity and species diversity. Am Nat 100:65-75
Paine RT, Levin SA (1981) Intertidal landscapes: disturbance and the dynamics of pattern. Ecol Monogr 51:145-178
Palrner AR (1984) Prey selection by thaidid gastropods: some observational and experimental field tests of foraging models. Oecologia 62:162 -172
Quasim SZ (1951) The blology of Blennius pholis L. (Teleostei). Proc Zool Soc Lond 1281161-208
Robles C (1987) Predator foraging characteristics and prey
Editorial responsibility: Otto Kinne [Editor), Oldendorf/Luhe, Germany
population structure on a sheltered shore. Ecology 68: 1502-1514
Robles C, Robb J (1993) Varied carnivore effects and the prevalence of intertidal algal turfs. J Exp Mar Biol Ecol 166:65-91
Rossi RE, Mulla DJ, Journel AG, Franz EH (1992) Geostatisti- cal tools for modeling and interpreting ecological spatial dependence. Ecol Monogr 62:277-314
Seed R (1969) The ecology of Mytilus edulis L. (Lamelli- branchiata) on exposed rocky shores. 11. Growth and mor- tality. Oecologia 3:317-350
Shanks AL, Wright W G (1986) Ad&ng teeth to wave action: the destructive effects of wave borne rocks on intertidal organisms. Oecologia 69:420-428
Underwood AJ, Chapman MG (1996) Scales of spatial pat- terns of distribution of intertidal invertebrates. Oecologia 107:212-224
van Rooj JM, Videler JJ (1996) A simple method for stereo- photographic length measurement of free swimm~ng fish: merits and constraints. J Exp Mar Biol Ecol 195: 237-249
Warman CG, Reid DG, Naylor E (1993) Variation in the tidal migratory behaviour and rhythmic light-responsiveness in the shore crab, Carcinus maenas. J Mar Biol Assoc UK 73: 355-364
Wethey DS (1984) Sun and shade mediate competition in the barnacles Chthamalus and Senubalanus: a field experi- ment. Biol Bull (Woods Hole) 167:176-185
Wirtz P (1978) The behaviour of the Mediterranean Triptery- gion species (Pisces. Blennoidae). Z Tierpsychol 48: 142-174
Zar JH (1984) Biostatistical analysis, 2nd edn. Prentice Hall, Englewood Cliffs. NJ
Subrmtted: October 23, 1998; Accepted: May 14, 1999 Proofs received from author(s): September 27, 1999