for the year ended march 31, 2005 achievement & growth
TRANSCRIPT
ANNUAL REPORT 2005for the year ended March 31, 2005
Achievement & Growth
1 Sumitomo Corporation Annual Report 2005
We are aiming for further growth while securing profitabilityin excess of shareholders’ capital cost.We will realize greater “prosperity and dreams” for all stakeholders and thus maximize the value ofSumitomo Corporation.

Snapshot: Sumitomo Corporation
Financial Highlights
To Our Stakeholders
Special Feature
1: Boosting Our Expansion Strategy—New Medium-Term Management Plan “AG Plan”
2: Sumitomo Corporation’s Earnings Base Expansion—Samples of Business Scale Up and New Entries
Overview of Operations
At a Glance
By Business Units
Metal Products
Transportation & Construction Systems
Machinery & Electric
Media, Electronics & Network
Chemical
Mineral Resources & Energy
Consumer Goods & Service
Materials & Real Estate
Financial & Logistics
Global Strategy
Principal Subsidiaries and Associated Companies Contributing to Consolidated Results
Sumitomo Corporation’s Management System
Management Principles and Activity Guidelines
Corporate Governance
Compliance
Risk Management
Internal Control Project
Human Resources Management
Initiatives for Environmental Conservation
Philanthropic Activities
Directors and Corporate Auditors/Executive Officers
Business Operating Structure
Organization
Domestic and Overseas Subsidiaries
Principal Subsidiaries and Associated Companies
Global Network
Financial Section
Six-Year Financial Summary
Management's Discussion and Analysis of Financial Condition and Results of Operations
Consolidated Financial Statements
Independent Auditors' Report
(Reference Information) Risk Factors
Corporate Information/Stock Information
2
4
6
13
17
21
22
24
26
28
30
32
34
36
38
40
42
44
45
46
47
48
49
51
52
53
54
55
57
58
59
60
66
69
70
72
86
131
132
136
Contents
Cautionary Statement Concerning Forward-Looking StatementsThis report includes forward-looking statements relating to our future plans, targets, objectives, expectations and intentions. The forward-looking statements reflect manage-ment's current assumptions and expectations of future events, and accordingly, they are inherently susceptible to uncertainties and changes in circumstances and are notguarantees of future performance. Actual results may differ materially, for a wide range of possible reasons, including general industry and market conditions and generalinternational economic conditions. In light of the many risks and uncertainties, you are advised not to put undue reliance on these statements. The management targetsincluded in this report are not projections, and do not represent management’s current estimates of future performance. Rather, they represent targets that managementstrive to achieve through the successful implementation of the Company’s business strategies. The company may be unsuccessful in implementing its business strategies,and management may fail to achieve its targets.The Company is under no obligation – and expressly disclaims any such obligation – to update or alter its forward-looking statements.
2 Sumitomo Corporation Annual Report 2005
Snapshot: Sumitomo Corporation
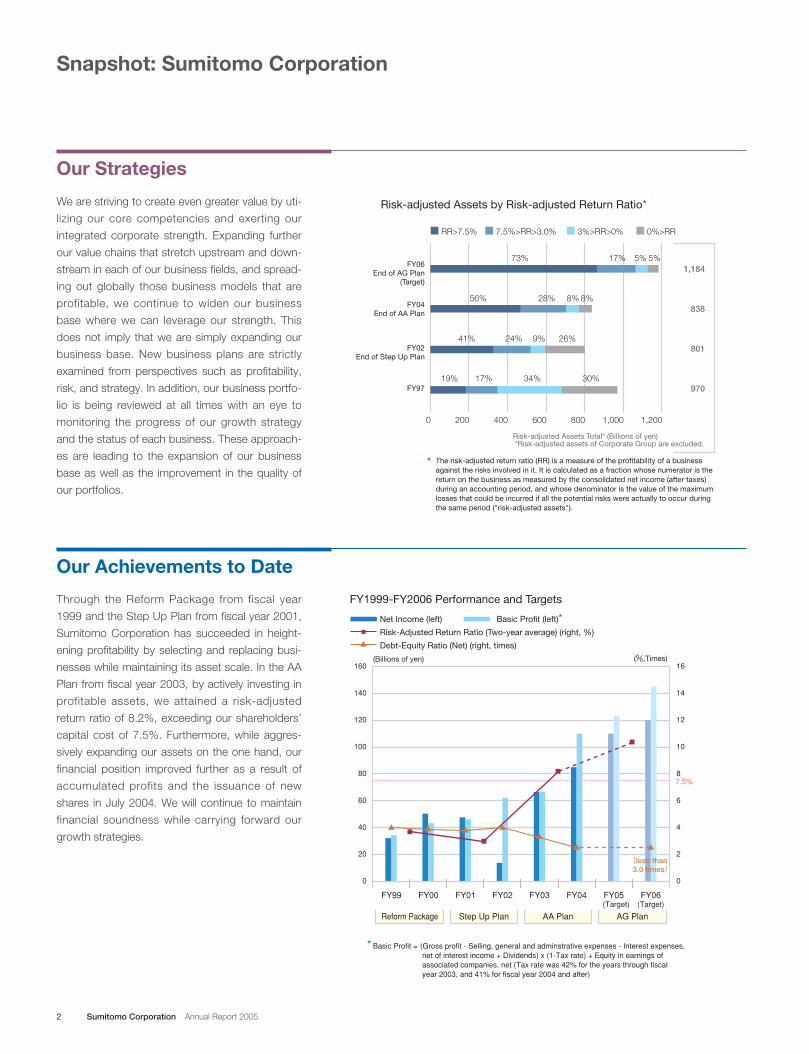
Our Strategies
We are striving to create even greater value by uti-
lizing our core competencies and exerting our
integrated corporate strength. Expanding further
our value chains that stretch upstream and down-
stream in each of our business fields, and spread-
ing out globally those business models that are
profitable, we continue to widen our business
base where we can leverage our strength. This
does not imply that we are simply expanding our
business base. New business plans are strictly
examined from perspectives such as profitability,
risk, and strategy. In addition, our business portfo-
lio is being reviewed at all times with an eye to
monitoring the progress of our growth strategy
and the status of each business. These approach-
es are leading to the expansion of our business
base as well as the improvement in the quality of
our portfolios.
Risk-adjusted Assets by Risk-adjusted Return Ratio*
FY06End of AG Plan
(Target)
FY04End of AA Plan
FY02End of Step Up Plan
FY97
RR>7.5% 7.5%>RR>3.0% 3%>RR>0% 0%>RR
1,184
838
801
970
Risk-adjusted Assets Total* (Billions of yen) *Risk-adjusted assets of Corporate Group are excluded.
0 200 400 600 800 1,000 1,200
* The risk-adjusted return ratio (RR) is a measure of the profitability of a business against the risks involved in it. It is calculated as a fraction whose numerator is the return on the business as measured by the consolidated net income (after taxes) during an accounting period, and whose denominator is the value of the maximum losses that could be incurred if all the potential risks were actually to occur during the same period ("risk-adjusted assets").
19% 17% 34% 30%
41% 24% 9% 26%
56% 28% 8% 8%
73% 17% 5% 5%
(Billions of yen)
FY1999-FY2006 Performance and Targets
160
140
120
16
14
12
10
8
6
4
2
0
(%,Times)
100
80
60
40
20
0
FY99 FY00 FY01 FY02 FY03 FY04(Target) (Target)
Net Income (left)
Risk-Adjusted Return Ratio (Two-year average) (right, %)
Debt-Equity Ratio (Net) (right, times)
Basic Profit (left)*
FY05
AG PlanReform Package Step Up Plan AA Plan
FY06
* Basic Profit = (Gross profit - Selling, general and adminstrative expenses - Interest expenses, net of interest income + Dividends) x (1-Tax rate) + Equity in earnings of associated companies, net (Tax rate was 42% for the years through fiscal year 2003, and 41% for fiscal year 2004 and after)
(less than 3.0 times)
7.5%
Our Achievements to Date
Through the Reform Package from fiscal year
1999 and the Step Up Plan from fiscal year 2001,
Sumitomo Corporation has succeeded in height-
ening profitability by selecting and replacing busi-
nesses while maintaining its asset scale. In the AA
Plan from fiscal year 2003, by actively investing in
profitable assets, we attained a risk-adjusted
return ratio of 8.2%, exceeding our shareholders’
capital cost of 7.5%. Furthermore, while aggres-
sively expanding our assets on the one hand, our
financial position improved further as a result of
accumulated profits and the issuance of new
shares in July 2004. We will continue to maintain
financial soundness while carrying forward our
growth strategies.
3
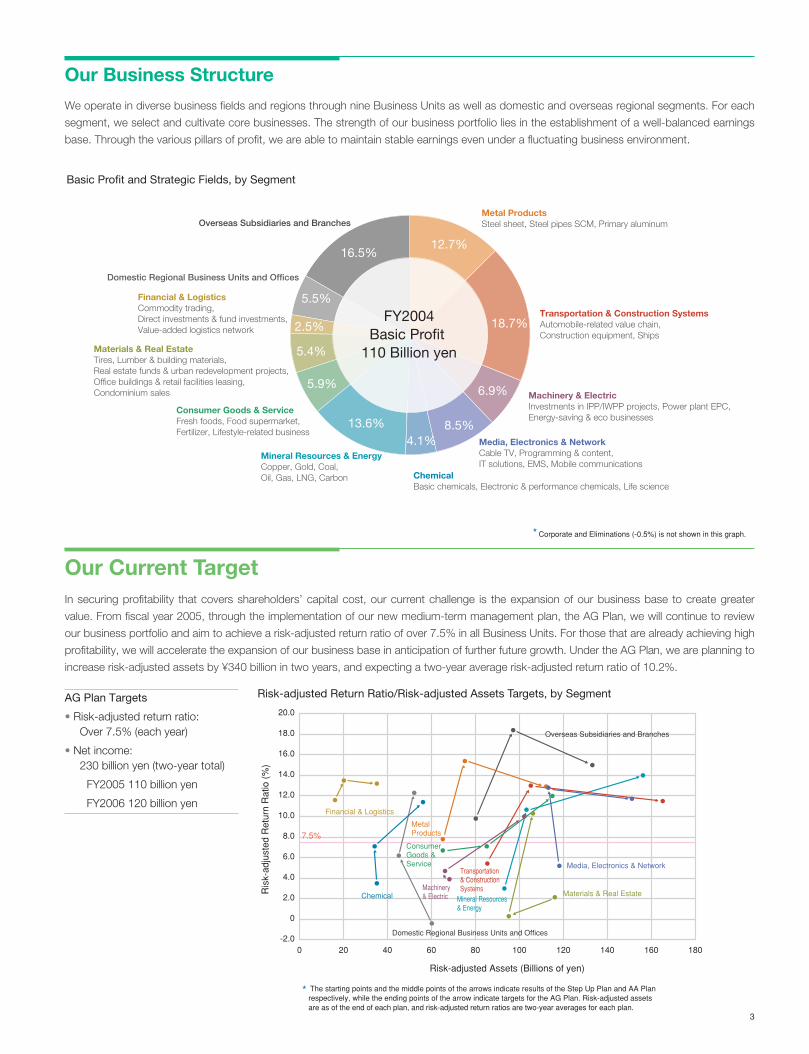
Domestic Regional Business Units and Offices
FY2004Basic Profit
110 Billion yen
18.7%
6.9%
8.5%4.1%
13.6%
5.9%
5.4%
2.5%
5.5%
16.5%12.7%
Transportation & Construction SystemsAutomobile-related value chain, Construction equipment, Ships
Metal ProductsSteel sheet, Steel pipes SCM, Primary aluminum
Consumer Goods & ServiceFresh foods, Food supermarket, Fertilizer, Lifestyle-related business
Materials & Real EstateTires, Lumber & building materials, Real estate funds & urban redevelopment projects, Office buildings & retail facilities leasing, Condominium sales
Overseas Subsidiaries and Branches
Financial & LogisticsCommodity trading, Direct investments & fund investments, Value-added logistics network
Machinery & ElectricInvestments in IPP/IWPP projects, Power plant EPC, Energy-saving & eco businesses
Media, Electronics & NetworkCable TV, Programming & content, IT solutions, EMS, Mobile communications
ChemicalBasic chemicals, Electronic & performance chemicals, Life science
Mineral Resources & EnergyCopper, Gold, Coal, Oil, Gas, LNG, Carbon
Basic Profit and Strategic Fields, by Segment
* Corporate and Eliminations (-0.5%) is not shown in this graph.
Risk-adjusted Return Ratio/Risk-adjusted Assets Targets, by Segment
* The starting points and the middle points of the arrows indicate results of the Step Up Plan and AA Plan respectively, while the ending points of the arrow indicate targets for the AG Plan. Risk-adjusted assets are as of the end of each plan, and risk-adjusted return ratios are two-year averages for each plan.
-2.0
4.0
2.0
0
6.0
8.0
10.0
12.0
14.0
16.0
18.0
20.0
0 20 40 60 80 100 120 140 160 180
7.5%
Risk-adjusted Assets (Billions of yen)
Risk-adjusted Return Ratio (%)
Metal Products
Transportation & Construction Systems
Materials & Real Estate
Domestic Regional Business Units and Offices
Overseas Subsidiaries and Branches
Financial & Logistics
Media, Electronics & Network
Mineral Resources & Energy
ChemicalMachinery & Electric
Consumer Goods & Service
Our Business Structure
We operate in diverse business fields and regions through nine Business Units as well as domestic and overseas regional segments. For each
segment, we select and cultivate core businesses. The strength of our business portfolio lies in the establishment of a well-balanced earnings
base. Through the various pillars of profit, we are able to maintain stable earnings even under a fluctuating business environment.
Our Current TargetIn securing profitability that covers shareholders’ capital cost, our current challenge is the expansion of our business base to create greater
value. From fiscal year 2005, through the implementation of our new medium-term management plan, the AG Plan, we will continue to review
our business portfolio and aim to achieve a risk-adjusted return ratio of over 7.5% in all Business Units. For those that are already achieving high
profitability, we will accelerate the expansion of our business base in anticipation of further future growth. Under the AG Plan, we are planning to
increase risk-adjusted assets by ¥340 billion in two years, and expecting a two-year average risk-adjusted return ratio of 10.2%.
AG Plan Targets
• Risk-adjusted return ratio: Over 7.5% (each year)
• Net income: 230 billion yen (two-year total)
FY2005 110 billion yen
FY2006 120 billion yen
4 Sumitomo Corporation Annual Report 2005
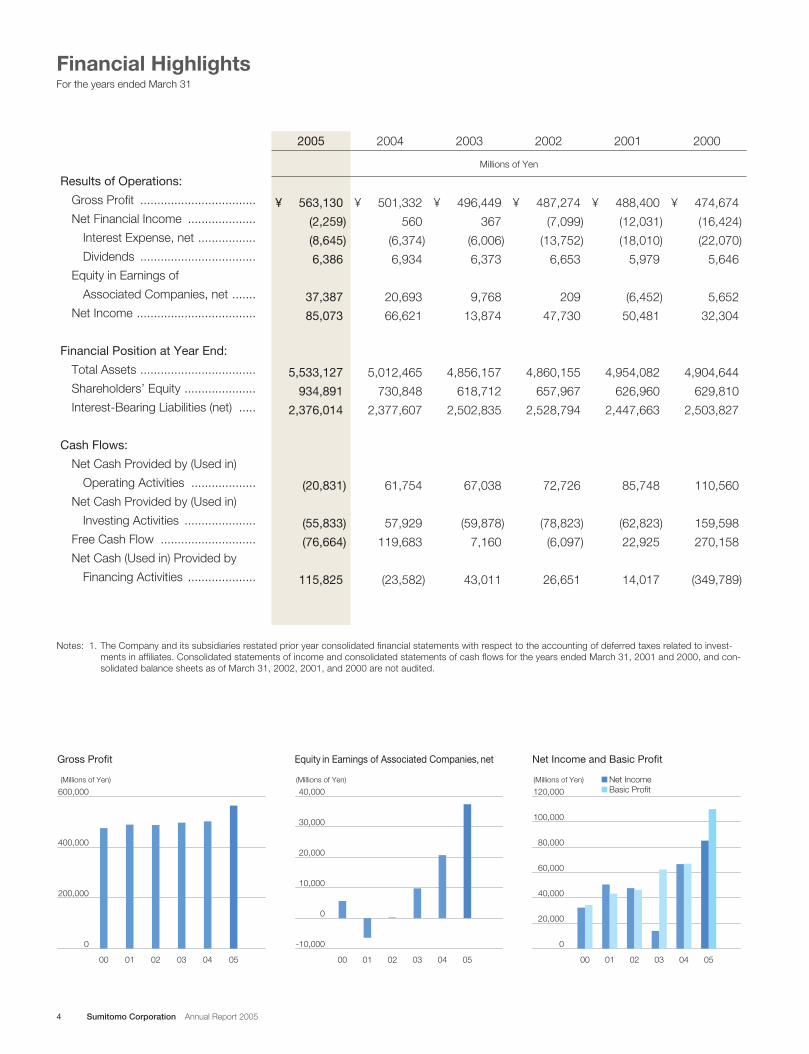
Financial HighlightsFor the years ended March 31
(Millions of Yen)
Gross Profit
600,000
400,000
200,000
0
050402 030100
Net Income and Basic Profit
Net IncomeBasic Profit
(Millions of Yen)
120,000
100,000
80,000
60,000
40,000
20,000
0
050402 030100
Equity in Earnings of Associated Companies, net
(Millions of Yen)
40,000
30,000
20,000
10,000
0
-10,000
050402 030100
Notes: 1. The Company and its subsidiaries restated prior year consolidated financial statements with respect to the accounting of deferred taxes related to invest-ments in affiliates. Consolidated statements of income and consolidated statements of cash flows for the years ended March 31, 2001 and 2000, and con-solidated balance sheets as of March 31, 2002, 2001, and 2000 are not audited.
Results of Operations:
Gross Profit ..................................
Net Financial Income ....................
Interest Expense, net .................
Dividends ..................................
Equity in Earnings of
Associated Companies, net .......
Net Income ...................................
Financial Position at Year End:
Total Assets ..................................
Shareholders’ Equity .....................
Interest-Bearing Liabilities (net) .....
Cash Flows:
Net Cash Provided by (Used in)
Operating Activities ...................
Net Cash Provided by (Used in)
Investing Activities .....................
Free Cash Flow ............................
Net Cash (Used in) Provided by
Financing Activities ....................
2005
Millions of Yen
2004 2003
¥ 501,332
560
(6,374)
6,934
20,693
66,621
5,012,465
730,848
2,377,607
61,754
57,929
119,683
(23,582)
¥ 563,130
(2,259)
(8,645)
6,386
37,387
85,073
5,533,127
934,891
2,376,014
(20,831)
(55,833)
(76,664)
115,825
¥ 496,449
367
(6,006)
6,373
9,768
13,874
4,856,157
618,712
2,502,835
67,038
(59,878)
7,160
43,011
¥ 487,274
(7,099)
(13,752)
6,653
209
47,730
4,860,155
657,967
2,528,794
72,726
(78,823)
(6,097)
26,651
2002 2001 2000
¥ 488,400
(12,031)
(18,010)
5,979
(6,452)
50,481
4,954,082
626,960
2,447,663
85,748
(62,823)
22,925
14,017
¥ 474,674
(16,424)
(22,070)
5,646
5,652
32,304
4,904,644
629,810
2,503,827
110,560
159,598
270,158
(349,789)
5
Total Assets and ROA
Total Assets (left)ROA (right)
(Millions of Yen)
6,000,000
4,500,000
1,500,000
0
2.0
1.5
0.5
3,000,000 1.0
0
050402 0300 01
(%)
Shareholders' Equity and ROE
Shareholders' Equity (left)ROE (right)
(Millions of Yen) (%) 1,000,000
800,000
600,000
400,000
200,000
0
12.5
10.0
7.5
5.0
2.5
0
050402 030100
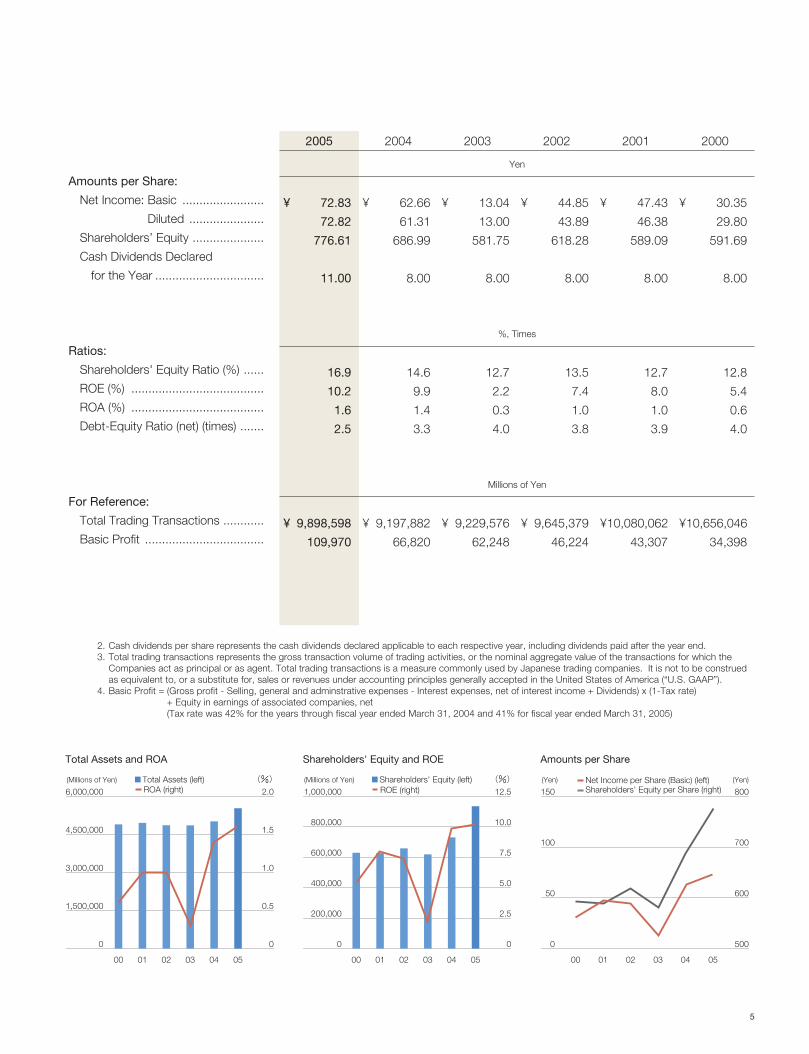
Amounts per Share
Net Income per Share (Basic) (left)Shareholders' Equity per Share (right)
(Yen) (Yen)
150
100
50
0
800
700
600
500
050402 030100
2. Cash dividends per share represents the cash dividends declared applicable to each respective year, including dividends paid after the year end.3. Total trading transactions represents the gross transaction volume of trading activities, or the nominal aggregate value of the transactions for which the
Companies act as principal or as agent. Total trading transactions is a measure commonly used by Japanese trading companies. It is not to be construedas equivalent to, or a substitute for, sales or revenues under accounting principles generally accepted in the United States of America (“U.S. GAAP”).
4. Basic Profit = (Gross profit - Selling, general and adminstrative expenses - Interest expenses, net of interest income + Dividends) x (1-Tax rate) + Equity in earnings of associated companies, net(Tax rate was 42% for the years through fiscal year ended March 31, 2004 and 41% for fiscal year ended March 31, 2005)
Amounts per Share:
Net Income: Basic ........................
Diluted ......................
Shareholders’ Equity .....................
Cash Dividends Declared
for the Year ................................
Ratios:
Shareholders' Equity Ratio (%) ......
ROE (%) .......................................
ROA (%) .......................................
Debt-Equity Ratio (net) (times) .......
For Reference:
Total Trading Transactions ............
Basic Profit ...................................
2005
Yen
2004 2003
¥ 62.66
61.31
686.99
8.00
14.6
9.9
1.4
3.3
¥ 9,197,882
66,820
¥ 72.83
72.82
776.61
11.00
16.9
10.2
1.6
2.5
¥ 9,898,598
109,970
¥ 13.04
13.00
581.75
8.00
12.7
2.2
0.3
4.0
¥ 9,229,576
62,248
¥ 44.85
43.89
618.28
8.00
13.5
7.4
1.0
3.8
¥ 9,645,379
46,224
2002 2001 2000
¥ 47.43
46.38
589.09
8.00
12.7
8.0
1.0
3.9
¥10,080,062
43,307
¥ 30.35
29.80
591.69
8.00
12.8
5.4
0.6
4.0
¥10,656,046
34,398
Millions of Yen
%, Times
Fiscal Year 2004 in Review
Second Successive Year of Record-High
Profits
In f iscal year 2004, ended March 2005, the
Sumitomo Corporation Group reported consoli-
dated net income of ¥85.1 billion, up 28% from
the previous year and a record-high level for the
second consecutive year. Basic profit,** a meas-
ure used to assess earning power, jumped 65%,
to ¥110.0 billion. All Business Units posted higher
basic profit, each steadily reinforcing its existing
earnings base and securing new earnings base
through acquisitions and other means, while also
taking advantage of global economic growth.
Steady Growth in Each Segment’s Earnings
Base
Let’s take a look at some businesses that con-
tributed significantly to results in each segment.
These include steel service center operations, cen-
tering on Asia (Metal Products), automobile busi-
nesses in Japan and elsewhere in Asia
(Transportation & Construction Systems), and
power plant EPC business (Machinery & Electric).
Other solid performers were our media business
(Media, Electronics & Network), copper and gold
mining project and coal business (Mineral
Resources & Energy), food supermarket opera-
tions, including Summit, Inc. (Consumer Goods &
Service), and condominium sales (Materials & Real
Estate). Overseas, our metals and chemicals trad-
ing business performed well, mainly in the United
6 Sumitomo Corporation Annual Report 2005
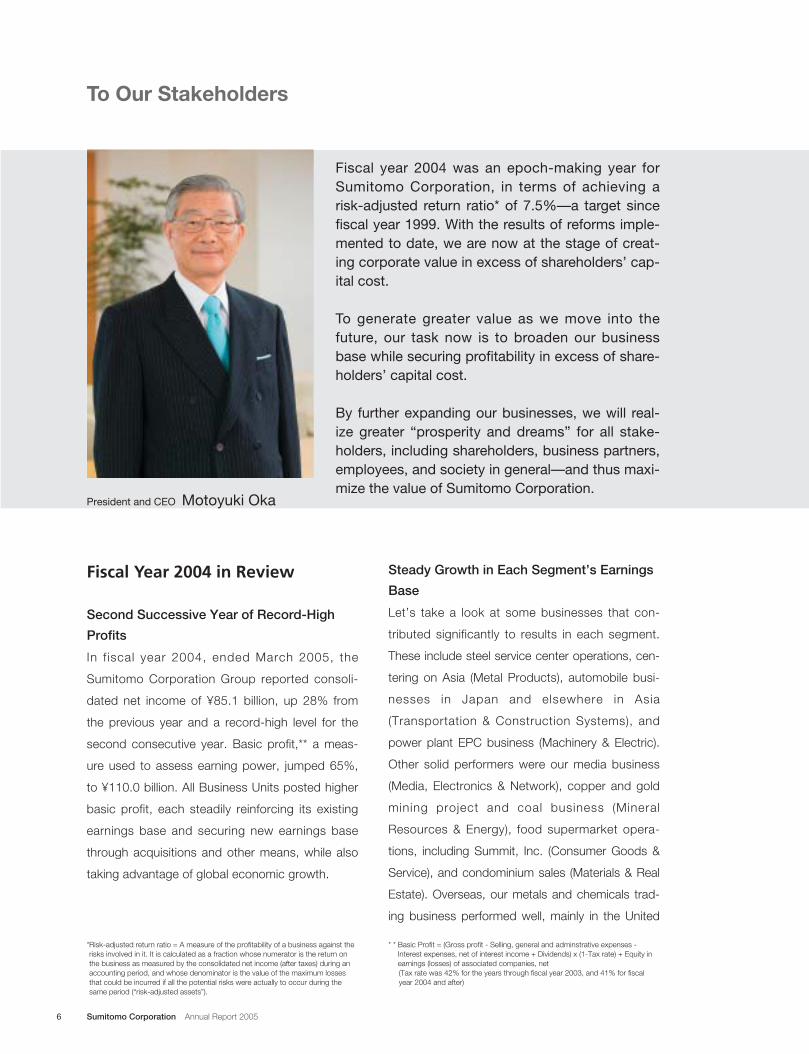
To Our Stakeholders
Fiscal year 2004 was an epoch-making year forSumitomo Corporation, in terms of achieving arisk-adjusted return ratio* of 7.5%—a target sincefiscal year 1999. With the results of reforms imple-mented to date, we are now at the stage of creat-ing corporate value in excess of shareholders’ cap-ital cost.
To generate greater value as we move into thefuture, our task now is to broaden our businessbase while securing profitability in excess of share-holders’ capital cost.
By further expanding our businesses, we will real-ize greater “prosperity and dreams” for all stake-holders, including shareholders, business partners,employees, and society in general—and thus maxi-mize the value of Sumitomo Corporation.
President and CEO Motoyuki Oka
*Risk-adjusted return ratio = A measure of the profitability of a business against therisks involved in it. It is calculated as a fraction whose numerator is the return onthe business as measured by the consolidated net income (after taxes) during anaccounting period, and whose denominator is the value of the maximum lossesthat could be incurred if all the potential risks were actually to occur during thesame period (“risk-adjusted assets”).
* * Basic Profit = (Gross profit - Selling, general and adminstrative expenses -Interest expenses, net of interest income + Dividends) x (1-Tax rate) + Equity inearnings (losses) of associated companies, net(Tax rate was 42% for the years through fiscal year 2003, and 41% for fiscalyear 2004 and after)
7
States. In addition, acquisitions made during the
fiscal year—such as The Hartz Mountain
Corporation, a pet care business—made a swift
contribution to our results.
Stronger Financial Position
Total assets at fiscal year-end were ¥520.7 billion
higher than a year earlier. This stemmed from a rise
in operating assets resulting from increased trading
transactions, as well as strategic investments. Total
shareholders’ equity grew ¥204.0 billion, due to
increased earnings and the issuance of new shares
in July 2004, raising the shareholders’ equity ratio
to 16.9%, up 2.3 percentage points from previous
year-end. Total interest-bearing liabilities (net)
remained mostly unchanged (edging down ¥1.6 bil-
lion), and the debt-equity ratio (net) declined to 2.5
times, from 3.3 times a year earlier. In summary,
therefore, we further reinforced our financial posi-
tion. Moreover, the substantial increase in net
income exceeded the rise in shareholders’ equity
stemming from the share issue and retained earn-
ings, improving return on equity (ROE) by 0.3 per-
centage point, to 10.2%.
Progress and Results ofManagement Plans
Improved Profitability and Broader Earnings
Base
In fiscal year 1999, when it commenced its man-
agement reforms, Sumitomo Corporation had a
number of unprofitable businesses and financial
performance was ailing, after facing difficult condi-
tions stemming from the Asian currency crisis and
instability in the domestic financial system. Our first
challenge, therefore, was to improve profitability.
We set a risk-adjusted return ratio target of 7.5% to
cover shareholders’ capital cost, regarding this tar-
get as a necessary requirement for a “leading glob-
al company.” We began by comprehensively cut-
ting unprofitable businesses and replacing our
assets to improve our corporate strength amid a
depressed domestic economy and deflationary fac-
tors. Under the AA (“Approach for Achievement”)
Plan, covering fiscal years 2003 and 2004, we
switched to an offense-oriented approach and
focused on increasing profitable assets, with a view
to further boosting profitability while strengthening
our business base.
Achievement of Risk-Adjusted Return Ratio
Target
Our reforms did not always proceed smoothly. In
the first four years, in particular, business condi-
tions were tough for Japanese companies, who
faced major obstacles. When our Reform Package
began in fiscal year 1999, our risk-adjusted return
ratio was 3.7%. However, under the Step Up Plan,
which started in fiscal year 2001, the ratio at one
Not only the favorable external environment,
but also resolute actions to broaden our earnings
base, represented the driving force behind our
record-high profits.
time fell to 3.0%, due to a drastic stock market
decline and depressed real estate prices. Despite
the challenges, we steadily enhanced the quality of
our portfolio, and under the AA Plan, which began
in fiscal year 2003, we achieved a risk-adjusted
return ratio of 8.2%—exceeding our 7.5% target
with the fair wind of a turnaround in operating envi-
ronment.
Broader Earnings Base and Stronger
Corporate Strength—Growth through Both
Offensive and Defensive Strategies
Our record shows that our growth has been well
balanced between expansion of our earnings base
and reinforcement of our corporate strength.
Between fiscal year 1999 and fiscal year 2004, total
assets grew from ¥4,904.6 billion to ¥5,533.1 bil-
lion, a 13% increase. During the same period, total
shareholders’ equity increased from ¥629.8 billion
to ¥934.9 billion, a 1.5-fold rise, and net income
surged 2.6-fold, raising ROE from 5.4% to
10.5%—almost double. Meanwhile, we reduced
net interest-bearing liabilities, from ¥2,503.8 billion
to ¥2,376.0 billion, improving our debt-equity ratio
(net) from 4.0 times to 2.5 times. In addition to the
net income increase, we raised approximately ¥100
billion by issuing new shares in July 2004. As a
result, our financial position has been fortified.
Thus, we have built a solid foundation for further
increasing profitable assets and expediting growth
strategies.
Progressive Improvements in Management
Quality
The results of our management reforms are not lim-
ited to improvements in quantitative areas. Back in
1999, we introduced the risk-adjusted return con-
cept, an innovative indicator for companies at the
time, and sought to enhance our own manage-
ment. To ensure stability, we embraced a manage-
ment policy of balancing company-wide risks and
buffers. According to risk-adjusted return measure-
ments, we then efficiently allocated management
resources and introduced business portfolio man-
agement based on “Plan, Do, and See” cycles.
While steadily improving our financial performance
by broadening our earnings base, we strove to
reinforce our corporate strength and successfully
built a framework allowing sustained growth into
the future. These achievements represent the
progress of our reforms implemented to date.
8 Sumitomo Corporation Annual Report 2005
Sumitomo Corporation’s reforms have
brought not only quantitative improvements
but also progresses in advancing manage-
ment quality and forming a framework for
sustained future growth.
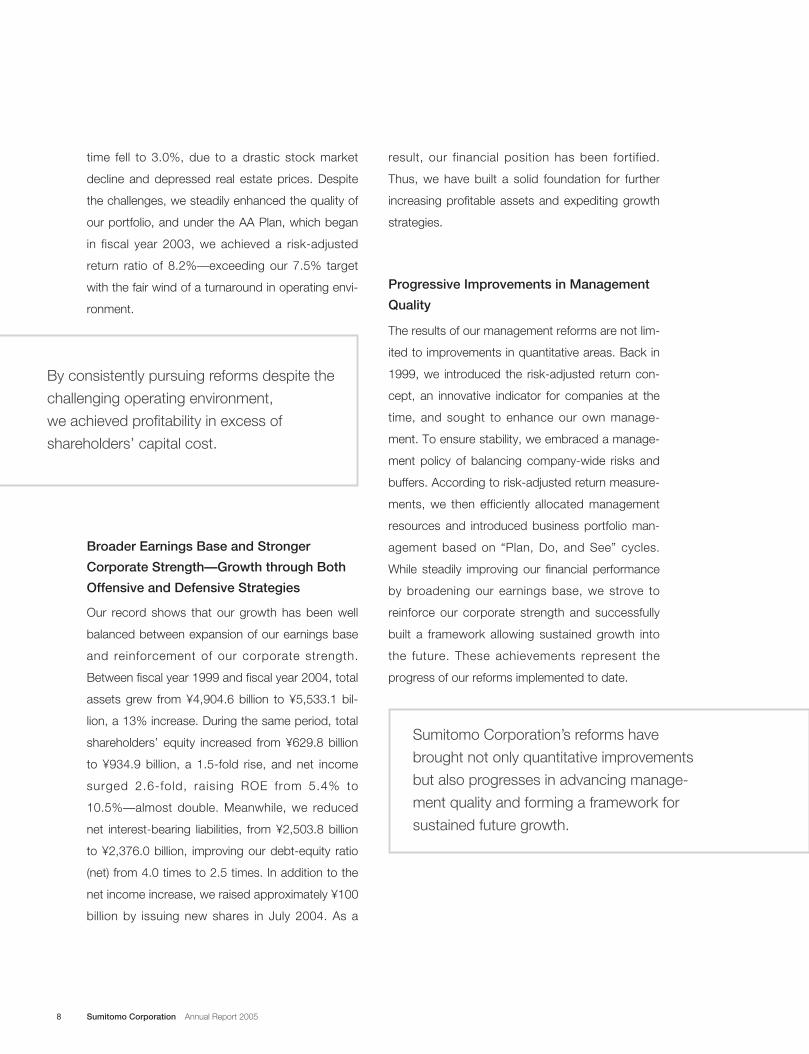
By consistently pursuing reforms despite the
challenging operating environment,
we achieved profitability in excess of
shareholders’ capital cost.
9
Overview of New Medium-TermManagement Plan: AG Plan
Expand Business Scope While Maintaining
Profitability
The AG (“Achievement & Growth”) Plan, our new
medium-term management plan, covers fiscal
years 2005 and 2006. Under the plan, we are tar-
geting net income of ¥230 billion (two-year total).
Building on progress made by the previous AA
Plan, through which we raised the risk-adjusted
return ratio by increasing profitable assets, we will
accelerate expansion of our earnings base, aiming
for further growth while securing a risk-adjusted
return ratio of 7.5%.
Important Steps for Stronger Future Growth
To maintain strong growth in the future, our impor-
tant task is to broaden our business base. Under
the AG Plan, nine Business Units will secure risk-
adjusted returns of 7.5% and put their dynamic
growth strategies into action. Each Business Unit
wil l proceed with strategic investments and
replacement of assets depending on their specific
conditions. Once all Business Units and regional
operations accomplish their plans, our business
base will be broadened and the two-year average
risk-adjusted return ratio will have improved to
10.2% as a result.
Accelerate Increasing Risk-Adjusted Assets
Under the AG Plan, we will undertake strategic
investments and steadily broaden our earnings
base. These actions will center on existing core
businesses, where we have already built solid
foundations by exerting our integrated corporate
strengths, as well as on areas peripheral to our
core businesses. Under the previous AA Plan, we
increased profitable risk-adjusted assets worth
¥240 billion. At the same time, we actively with-
drew or downsized businesses as appropriate,
which led to a ¥100 billion decline in risk-adjusted
assets. After also taking into account a decrease of
¥50 billion due to a reassessment of risk weight-
ing—such as reflecting improvements in country
risks—there was a ¥90 billion net increase in risk-
adjusted assets. Moving from the AA Plan to the
AG Plan, we have accelerated our growth strate-
gies, targeting a further increase of ¥340 billion in
risk-adjusted assets over the next two years.
Fully Mobilize Company-wide Support
Functions
Each Business Unit and regional operations will
seek to invest in profitable risk-adjusted assets
according to its own business and geographic
strategies. To achieve more dynamic growth, how-
ever, we must complement such segment-specific
initiatives by broadening our earnings base across
segment boundaries. To this end, we have formed
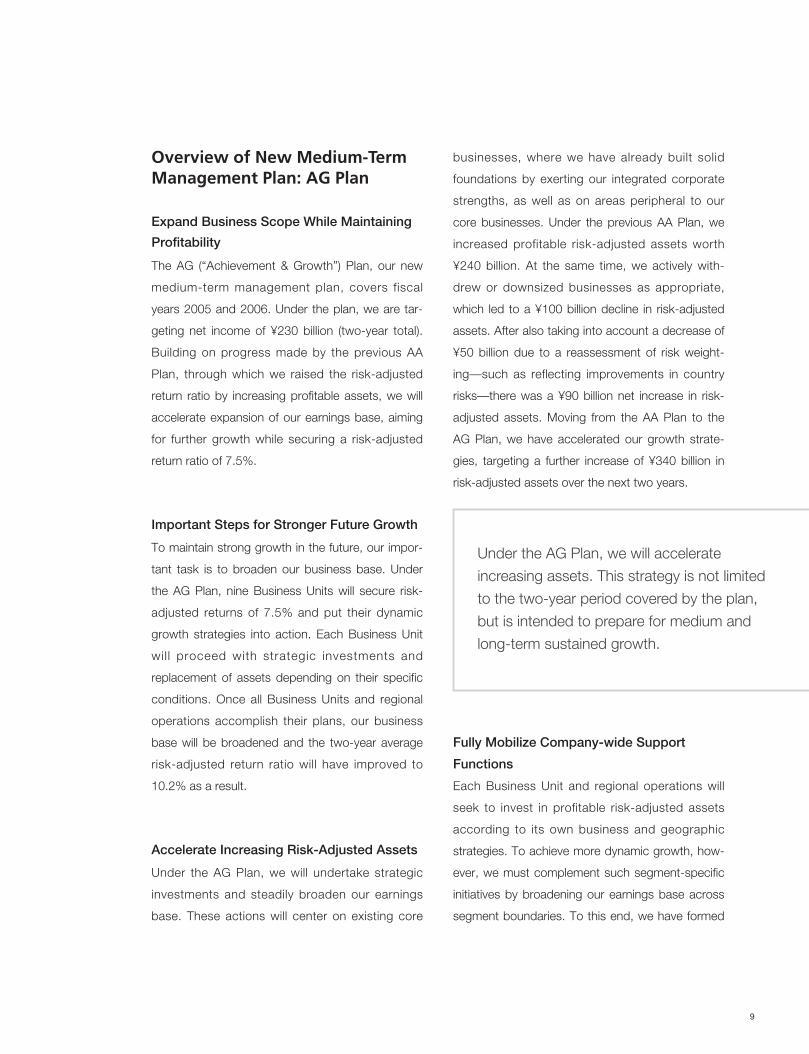
Under the AG Plan, we will accelerate
increasing assets. This strategy is not limited
to the two-year period covered by the plan,
but is intended to prepare for medium and
long-term sustained growth.
new entities, such as the “Company-wide Project
Promotion & Support Committee,” to support
large-scale projects and cross-organizational proj-
ects, and the “M&A Promotion Support Team,” to
support M&A deals for each segment by special-
ists. These entities, together with the existing “New
Technologies Committee,” will support the entry of
each segment into new fields, regions, and tech-
nologies, as well as the increase of investments in
core businesses. For these initiatives, we have
budgeted “AG Plan Growth Support Package” of
¥5 billion for fiscal year 2005.
Effective Use of Human Resources—Key for
Successful Growth Strategies
Successfully investing in new businesses and
expanding our earnings base require more than
capital alone. Expediting growth depends on com-
petent human resources—our most valuable man-
agement resources. We must seize new business
opportunities and make investments after identify-
ing and evaluating new projects. We must also
manage business risks and cultivate our business
to make it grow larger. To this end, we must secure
highly competent human resources and foster
them for maximum effectiveness. Therefore, we
established a “Human Resources Management
Committee” in each Business Unit and formulated
a long-term human resources plan matching our
growth strategies. Adopting company-wide per-
spectives, the “H.R.D. Committee,” chaired by
myself, examines from various angles how to foster
human resources and provide working environ-
ments that motivate all employees to develop their
full potential.
Management Structure Conducive to
Growth Strategies
Maintaining appropriate control frameworks is
clearly becoming more important for stepping up
our aggressive management focus. Recognizing
that business and risk management are insepara-
ble, we have worked to upgrade our risk manage-
ment systems and ensure compliance awareness.
We also understand that no system is perfect, and
for this reason we are making constant reviews and
enhancements to further raise the stability of our
operations. One noteworthy initiative is that we are
in the process of introducing an internal control
system based on the COSO* Framework, and we
are planning to extend this system across the
Group.
* COSO: The Committee of Sponsoring Organizations of the Treadway Commission
Maintain Profitability and Stability While
Expediting Growth
Over the two-year period covered by the AG Plan,
the Sumitomo Corporation Group is targeting net
income of ¥230 billion, compared with ¥151.7 bil-
lion achieved under AA Plan. Total assets at the
end of fiscal year 2006 are expected to exceed ¥6
trillion, up from ¥5.5 trillion at fiscal 2004 year-end.
At the same time, we will keep our debt-equity ratio
(net) to 3 times or below, thereby maintaining a
sound financial position. As for profitability, ROE is
expected to be 10% or above. For more informa-
10 Sumitomo Corporation Annual Report 2005
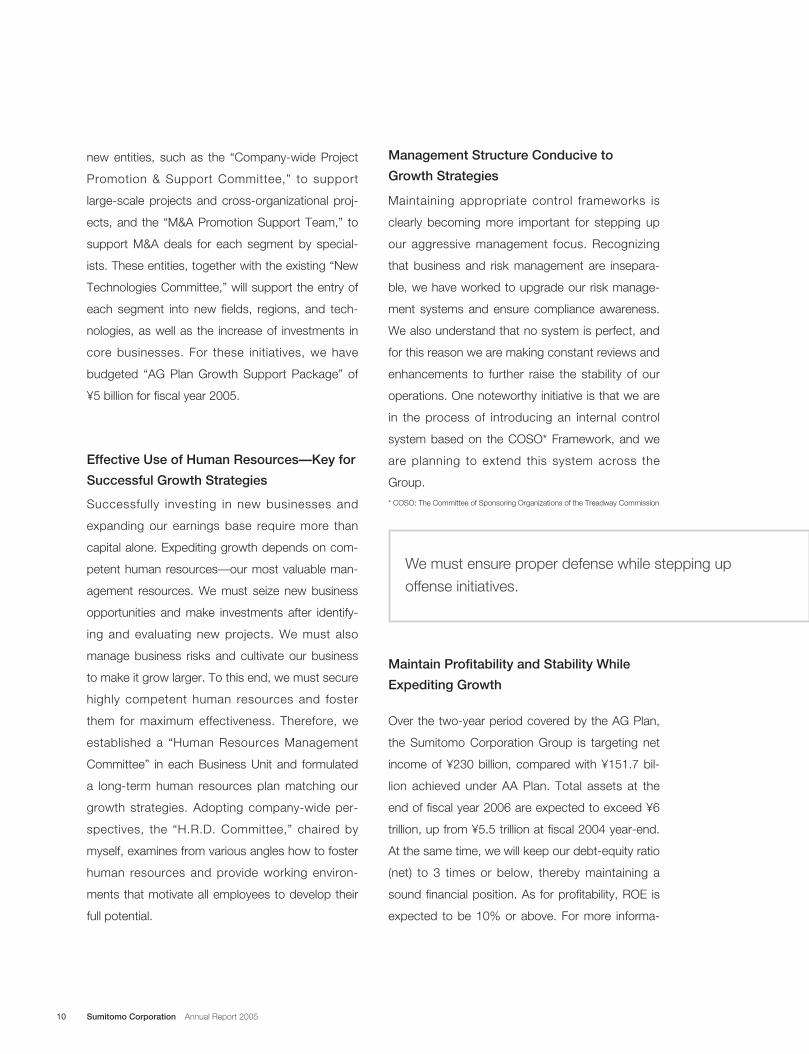
We must ensure proper defense while stepping up
offense initiatives.
11
tion about strategies and specific initiatives of the
AG Plan, please refer to the following sections of
this report: Special Feature (page 13), Overview of
Operations (page 21), and Sumitomo Corporation’s
Management System (page 45).
Corporate Value According toSumitomo Corporation
Balance of Three Key Elements to Support
Sustained Growth
To achieve sustained growth and generate new
levels of value, a corporation must pursue a bal-
anced mix of profitability, growth potential, and sta-
bility. We are building a business portfolio empha-
sizing not only profitability and growth potential but
also stability. At present, for instance, rising com-
modities prices are one favorable influence on our
financial results. However, business conditions
change from time to time, and we cannot grow if
we rely on unvarying circumstances. With nine
Business Units and regional operations, we are
involved in diverse business fields with global eco-
nomic coverage. By promoting growth strategies
that anticipate changes in the operating environ-
ment, we will seize broader income opportunities
and expand our core businesses. Through this bal-
anced approach to business development, we will
be prepared for stable growth.
Maximizing Corporate Value Utilizing Our
Core Competence
It is important to recognize that all corporations
have core competences, but if they fail to take
advantage of those competences, they will be
unable to create satisfactory levels of value.
Sumitomo Corporation is an integrated trading
company with a core competence not found in
other industries. Our competence lies in our busi-
ness foundation (global network, global relations,
trust, and intellectual capital) and our functions (risk
management, IT solutions, intelligence gathering
and analysis, business development, financial serv-
ices, and logistics solutions). By integrating our
business foundation and functions organically and
strategically, we will exert our integrated corporate
strength and realize higher levels of profitability and
growth.
Corporate Value As We See It
We are devoted to meeting the expectations of
shareholders by exerting our core competence and
thus creating greater levels of value. Through our
business activities, as well, we will contribute to our
business partners and society in general, which in
turn will provide opportunities to our employees for
self-development. In these ways, we will fulfill our
corporate social responsibility (CSR) and thus “real-
ize prosperity and dreams” for all our stakeholders,
in our quest to create even higher levels of corpo-
rate value.
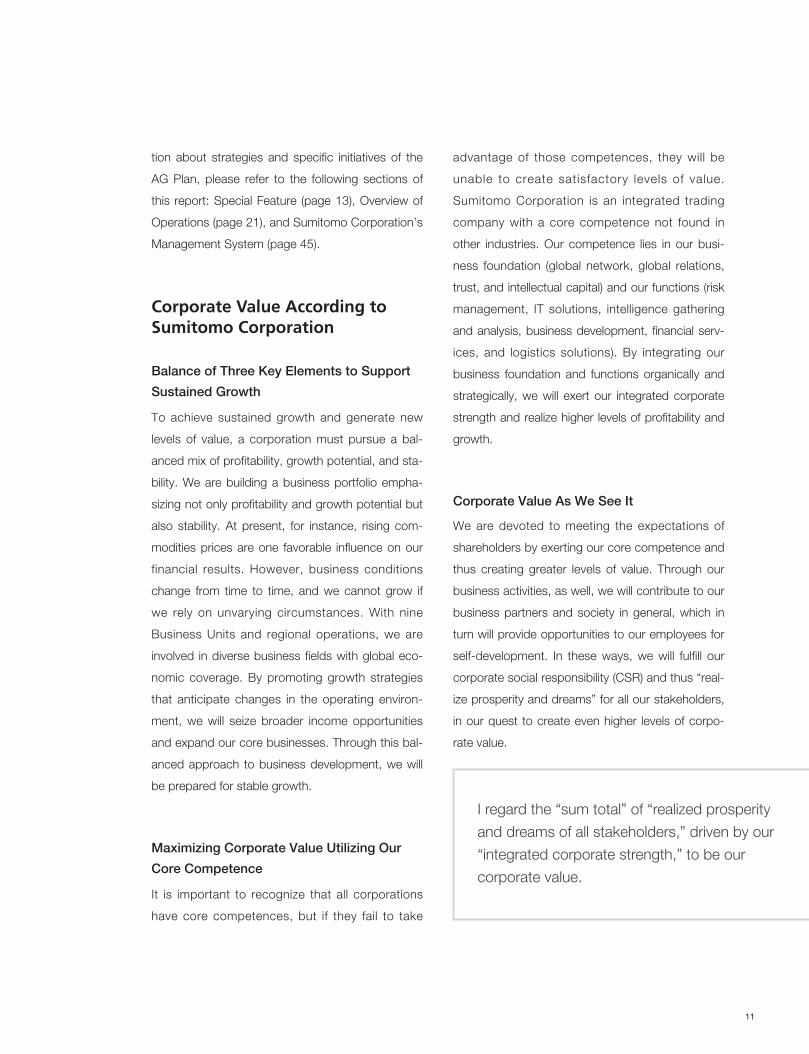
I regard the “sum total” of “realized prosperity
and dreams of all stakeholders,” driven by our
“integrated corporate strength,” to be our
corporate value.
12 Sumitomo Corporation Annual Report 2005
Return to Shareholders
Our responsibility as a corporation is to ensure that
value thus created is properly returned to our
shareholders. Until fiscal year 2003, our basic poli-
cy was to ensure stable dividends. In the latter half
of fiscal year 2004, we complemented this policy
with the introduction of a dividend reflecting our
consolidated financial results. We believe that
accelerating growth, while securing risk-adjusted
return above shareholders’ capital cost, will provide
ample returns in the future. Moreover, in considera-
tion of securing funds for growth under the AG
Plan, we have set the payout ratio at around 20%.
As a result, for fiscal year 2004, we have raised the
annual dividend by ¥3, to ¥11 per share. If we
achieve our net income target of ¥110 billion in fis-
cal year 2005, the first year of the AG Plan, we
intend a further ¥7 increase in the dividend, to ¥18
per share. Hereafter, we will consider appropriate
dividend levels while evaluating progress in
expanding our earnings base and external circum-
stances.
In Conclusion
I have outl ined the progress of Sumitomo
Corporation’s reforms and described our strategies
for the future. However, there is something more
important than management telling their company’s
corporate philosophies and management strate-
gies. All employees at the front line of business
activities must share a common view of these
philosophies and strategies and implement them
accordingly. A company’s management must talk
directly with employees to explain management
policy, the background and essence of manage-
ment plans, as well as the importance of risk man-
agement and compliance awareness. Then, they
must obtain employee’s sincere agreement and
translate strategies into actions. I regularly stress
the importance of direct contact with employees
and work hard to ensure that top priority is placed
on direct communication. Through these initiatives,
we are committed to “realizing prosperity and
dreams” for all stakeholders.
We look forward to your continued understanding
and support.
Motoyuki OkaPresident and CEO
July 2005
Philosophies and strategies, no matter how
excellent, have no meaning unless they are
translated into concrete actions at the busi-
ness level. By bringing strategies to all our
business fronts, we, the management and
employees, stand united in our quest to
maximize corporate value.
Special Feature
Under the AA Plan, which began in fiscal year 2003, we shifted to an
aggressive business stance and actively increased profitable assets.
As a result, we achieved a risk-adjusted return ratio of 7.5%, our target
since 1999, which covers our shareholders’ capital cost.
Under the new AG Plan, we will solidify our operating base for
future growth by expanding in scale. We will accelerate investing in
businesses with growth potential, while securing a risk-adjusted return
ratio of at least 7.5%.
SpecialFeature
1Boosting Our Expansion Strategy—New Medium-Term Management Plan “AG Plan”
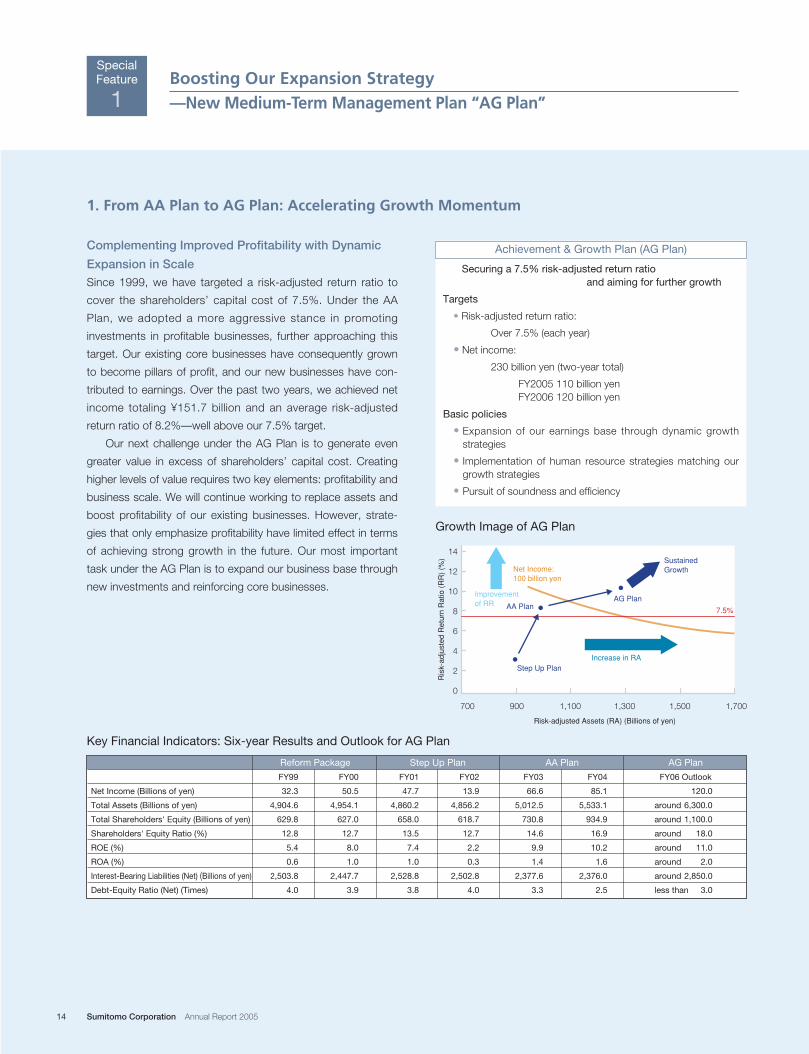
Complementing Improved Profitability with Dynamic
Expansion in ScaleSince 1999, we have targeted a risk-adjusted return ratio to
cover the shareholders’ capital cost of 7.5%. Under the AA
Plan, we adopted a more aggressive stance in promoting
investments in profitable businesses, further approaching this
target. Our existing core businesses have consequently grown
to become pillars of profit, and our new businesses have con-
tributed to earnings. Over the past two years, we achieved net
income totaling ¥151.7 billion and an average risk-adjusted
return ratio of 8.2%—well above our 7.5% target.
Our next challenge under the AG Plan is to generate even
greater value in excess of shareholders’ capital cost. Creating
higher levels of value requires two key elements: profitability and
business scale. We will continue working to replace assets and
boost profitability of our existing businesses. However, strate-
gies that only emphasize profitability have limited effect in terms
of achieving strong growth in the future. Our most important
task under the AG Plan is to expand our business base through
new investments and reinforcing core businesses.
Securing a 7.5% risk-adjusted return ratio and aiming for further growth
Targets
• Risk-adjusted return ratio:
Over 7.5% (each year)
• Net income:
230 billion yen (two-year total)
FY2005 110 billion yenFY2006 120 billion yen
Basic policies
• Expansion of our earnings base through dynamic growthstrategies
• Implementation of human resource strategies matching ourgrowth strategies
• Pursuit of soundness and efficiency
Achievement & Growth Plan (AG Plan)
1. From AA Plan to AG Plan: Accelerating Growth Momentum
Key Financial Indicators: Six-year Results and Outlook for AG Plan
7.5%
Net Income: 100 billion yen
Improvement of RR
Increase in RAStep Up Plan
Ris
k-ad
just
ed R
etur
n R
atio
(R
R)
(%)
700
0
2
4
6
8
10
12
14
900 1,100 1,300 1,500 1,700
Risk-adjusted Assets (RA) (Billions of yen)
AA PlanAG Plan
Sustained Growth
Growth Image of AG Plan
Reform Package Step Up Plan AA Plan AG Plan
FY99 FY00 FY01 FY02 FY03 FY04 FY06 Outlook
Net Income (Billions of yen) 32.3 50.5 47.7 13.9 66.6 85.1 120.0
Total Assets (Billions of yen) 4,904.6 4,954.1 4,860.2 4,856.2 5,012.5 5,533.1 around 6,300.0
Total Shareholders' Equity (Billions of yen) 629.8 627.0 658.0 618.7 730.8 934.9 around 1,100.0
Shareholders' Equity Ratio (%) 12.8 12.7 13.5 12.7 14.6 16.9 around 18.0
ROE (%) 5.4 8.0 7.4 2.2 9.9 10.2 around 11.0
ROA (%) 0.6 1.0 1.0 0.3 1.4 1.6 around 2.0
Interest-Bearing Liabilities (Net) (Billions of yen) 2,503.8 2,447.7 2,528.8 2,502.8 2,377.6 2,376.0 around 2,850.0
Debt-Equity Ratio (Net) (Times) 4.0 3.9 3.8 4.0 3.3 2.5 less than 3.0
14 Sumitomo Corporation Annual Report 2005
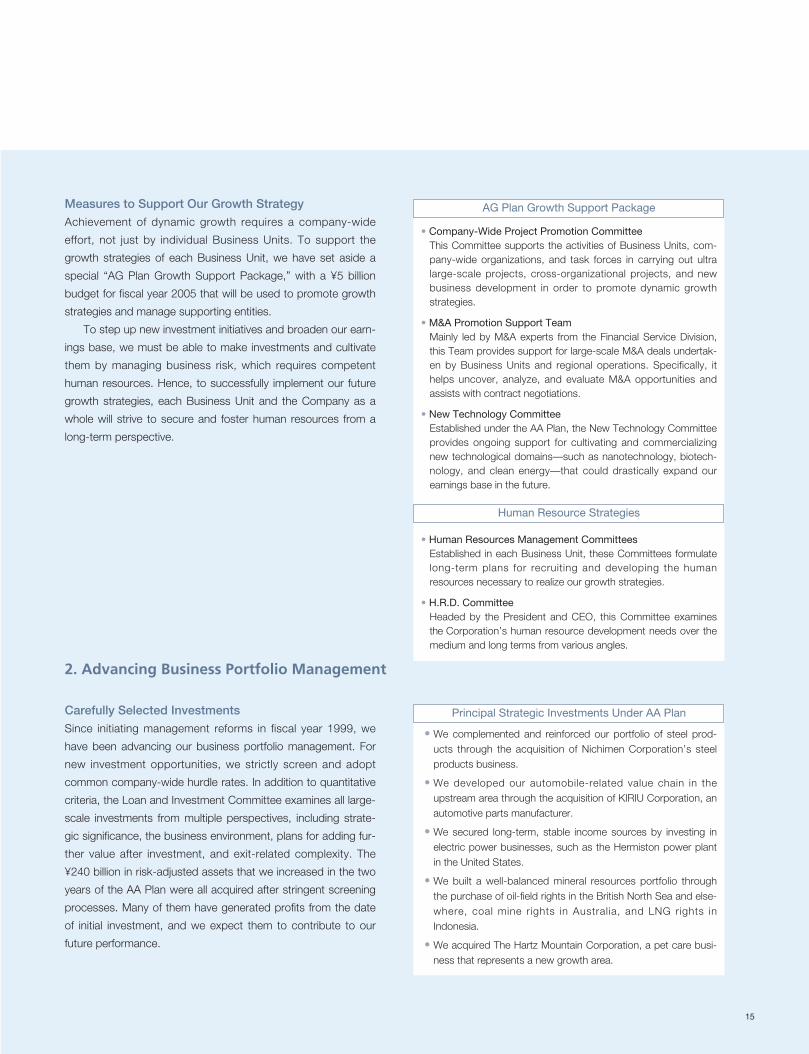
Measures to Support Our Growth StrategyAchievement of dynamic growth requires a company-wide
effort, not just by individual Business Units. To support the
growth strategies of each Business Unit, we have set aside a
special “AG Plan Growth Support Package,” with a ¥5 billion
budget for fiscal year 2005 that will be used to promote growth
strategies and manage supporting entities.
To step up new investment initiatives and broaden our earn-
ings base, we must be able to make investments and cultivate
them by managing business risk, which requires competent
human resources. Hence, to successfully implement our future
growth strategies, each Business Unit and the Company as a
whole will strive to secure and foster human resources from a
long-term perspective.
Carefully Selected InvestmentsSince initiating management reforms in fiscal year 1999, we
have been advancing our business portfolio management. For
new investment opportunities, we strictly screen and adopt
common company-wide hurdle rates. In addition to quantitative
criteria, the Loan and Investment Committee examines all large-
scale investments from multiple perspectives, including strate-
gic significance, the business environment, plans for adding fur-
ther value after investment, and exit-related complexity. The
¥240 billion in risk-adjusted assets that we increased in the two
years of the AA Plan were all acquired after stringent screening
processes. Many of them have generated profits from the date
of initial investment, and we expect them to contribute to our
future performance.
2. Advancing Business Portfolio Management
• We complemented and reinforced our portfolio of steel prod-ucts through the acquisition of Nichimen Corporation’s steelproducts business.
• We developed our automobile-related value chain in theupstream area through the acquisition of KIRIU Corporation, anautomotive parts manufacturer.
• We secured long-term, stable income sources by investing inelectric power businesses, such as the Hermiston power plantin the United States.
• We built a well-balanced mineral resources portfolio throughthe purchase of oil-field rights in the British North Sea and else-where, coal mine rights in Australia, and LNG rights inIndonesia.
• We acquired The Hartz Mountain Corporation, a pet care busi-ness that represents a new growth area.
Principal Strategic Investments Under AA Plan
15
• Company-Wide Project Promotion CommitteeThis Committee supports the activities of Business Units, com-pany-wide organizations, and task forces in carrying out ultralarge-scale projects, cross-organizational projects, and newbusiness development in order to promote dynamic growthstrategies.
• M&A Promotion Support TeamMainly led by M&A experts from the Financial Service Division,this Team provides support for large-scale M&A deals undertak-en by Business Units and regional operations. Specifically, ithelps uncover, analyze, and evaluate M&A opportunities andassists with contract negotiations.
• New Technology CommitteeEstablished under the AA Plan, the New Technology Committeeprovides ongoing support for cultivating and commercializingnew technological domains—such as nanotechnology, biotech-nology, and clean energy—that could drastically expand ourearnings base in the future.
• Human Resources Management CommitteesEstablished in each Business Unit, these Committees formulatelong-term plans for recruiting and developing the humanresources necessary to realize our growth strategies.
• H.R.D. CommitteeHeaded by the President and CEO, this Committee examinesthe Corporation’s human resource development needs over themedium and long terms from various angles.
AG Plan Growth Support Package
Human Resource Strategies
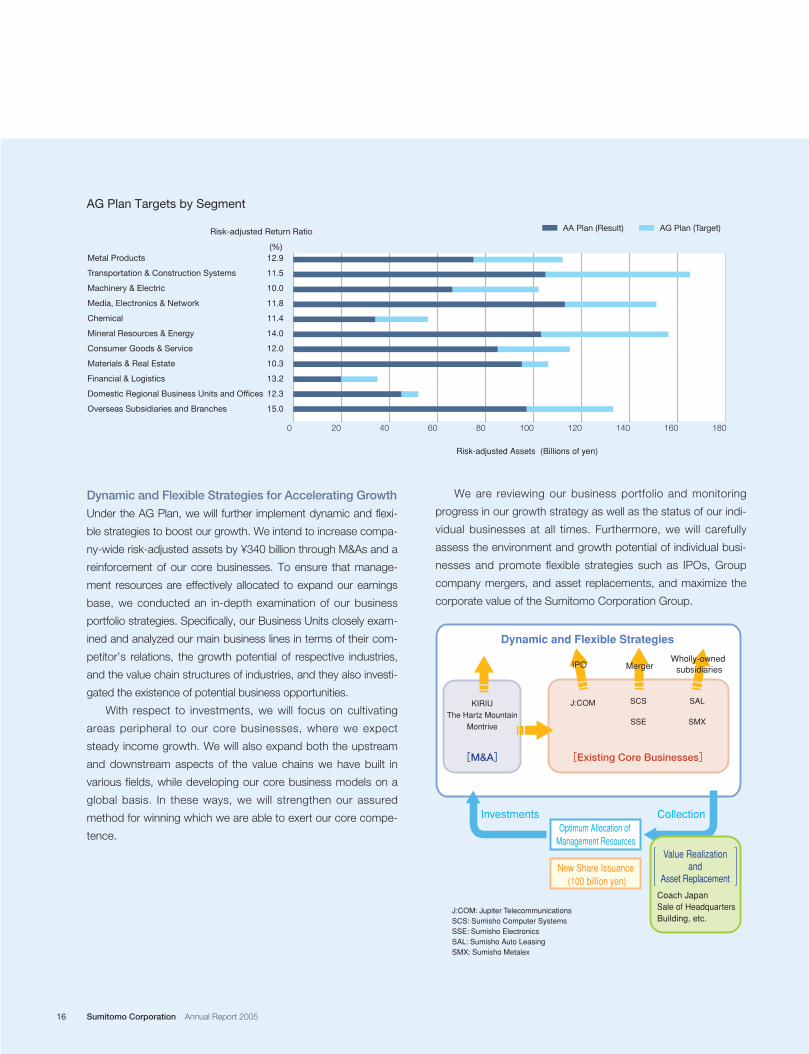
Dynamic and Flexible Strategies for Accelerating GrowthUnder the AG Plan, we will further implement dynamic and flexi-
ble strategies to boost our growth. We intend to increase compa-
ny-wide risk-adjusted assets by ¥340 billion through M&As and a
reinforcement of our core businesses. To ensure that manage-
ment resources are effectively allocated to expand our earnings
base, we conducted an in-depth examination of our business
portfolio strategies. Specifically, our Business Units closely exam-
ined and analyzed our main business lines in terms of their com-
petitor’s relations, the growth potential of respective industries,
and the value chain structures of industries, and they also investi-
gated the existence of potential business opportunities.
With respect to investments, we will focus on cultivating
areas peripheral to our core businesses, where we expect
steady income growth. We will also expand both the upstream
and downstream aspects of the value chains we have built in
various fields, while developing our core business models on a
global basis. In these ways, we will strengthen our assured
method for winning which we are able to exert our core compe-
tence.
We are reviewing our business portfolio and monitoring
progress in our growth strategy as well as the status of our indi-
vidual businesses at all times. Furthermore, we will carefully
assess the environment and growth potential of individual busi-
nesses and promote flexible strategies such as IPOs, Group
company mergers, and asset replacements, and maximize the
corporate value of the Sumitomo Corporation Group.
AG Plan Targets by Segment
0 20 40 60 80 100 120 140 160 180
Metal Products
Transportation & Construction Systems
Machinery & Electric
Media, Electronics & Network
Chemical
Mineral Resources & Energy
Consumer Goods & Service
Materials & Real Estate
Financial & Logistics
Domestic Regional Business Units and Offices
Overseas Subsidiaries and Branches
12.9
11.5
10.0
11.8
11.4
14.0
12.0
10.3
13.2
12.3
15.0
Risk-adjusted Assets (Billions of yen)
Risk-adjusted Return Ratio
(%)
AA Plan (Result) AG Plan (Target)
Dynamic and Flexible Strategies
KIRIU
The Hartz Mountain
Montrive
[M&A] [Existing Core Businesses]
Value Realization and
Asset Replacement
Coach JapanSale of Headquarters Building, etc.
New Share Issuance (100 billion yen)
Optimum Allocation of Management Resources
CollectionInvestments
J:COM SCS
SSE
J:COM: Jupiter TelecommunicationsSCS: Sumisho Computer SystemsSSE: Sumisho ElectronicsSAL: Sumisho Auto LeasingSMX: Sumisho Metalex
SAL
SMX
IPO MergerWholly-owned
subsidiaries
16 Sumitomo Corporation Annual Report 2005
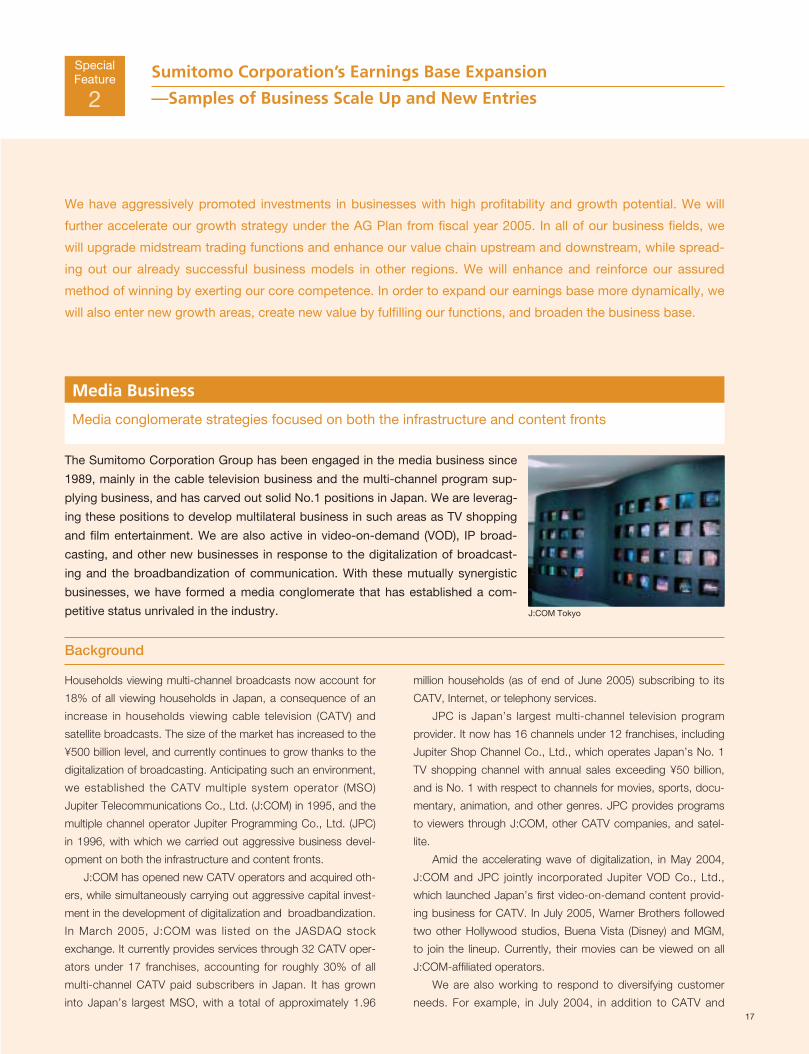
Media conglomerate strategies focused on both the infrastructure and content fronts
Media Business
We have aggressively promoted investments in businesses with high profitability and growth potential. We will
further accelerate our growth strategy under the AG Plan from fiscal year 2005. In all of our business fields, we
will upgrade midstream trading functions and enhance our value chain upstream and downstream, while spread-
ing out our already successful business models in other regions. We will enhance and reinforce our assured
method of winning by exerting our core competence. In order to expand our earnings base more dynamically, we
will also enter new growth areas, create new value by fulfilling our functions, and broaden the business base.
J:COM Tokyo
Households viewing multi-channel broadcasts now account for
18% of all viewing households in Japan, a consequence of an
increase in households viewing cable television (CATV) and
satellite broadcasts. The size of the market has increased to the
¥500 billion level, and currently continues to grow thanks to the
digitalization of broadcasting. Anticipating such an environment,
we established the CATV multiple system operator (MSO)
Jupiter Telecommunications Co., Ltd. (J:COM) in 1995, and the
multiple channel operator Jupiter Programming Co., Ltd. (JPC)
in 1996, with which we carried out aggressive business devel-
opment on both the infrastructure and content fronts.
J:COM has opened new CATV operators and acquired oth-
ers, while simultaneously carrying out aggressive capital invest-
ment in the development of digitalization and broadbandization.
In March 2005, J:COM was listed on the JASDAQ stock
exchange. It currently provides services through 32 CATV oper-
ators under 17 franchises, accounting for roughly 30% of all
multi-channel CATV paid subscribers in Japan. It has grown
into Japan’s largest MSO, with a total of approximately 1.96
million households (as of end of June 2005) subscribing to its
CATV, Internet, or telephony services.
JPC is Japan’s largest multi-channel television program
provider. It now has 16 channels under 12 franchises, including
Jupiter Shop Channel Co., Ltd., which operates Japan’s No. 1
TV shopping channel with annual sales exceeding ¥50 billion,
and is No. 1 with respect to channels for movies, sports, docu-
mentary, animation, and other genres. JPC provides programs
to viewers through J:COM, other CATV companies, and satel-
lite.
Amid the accelerating wave of digitalization, in May 2004,
J:COM and JPC jointly incorporated Jupiter VOD Co., Ltd.,
which launched Japan’s first video-on-demand content provid-
ing business for CATV. In July 2005, Warner Brothers followed
two other Hollywood studios, Buena Vista (Disney) and MGM,
to join the lineup. Currently, their movies can be viewed on all
J:COM-affiliated operators.
We are also working to respond to diversifying customer
needs. For example, in July 2004, in addition to CATV and
SpecialFeature
2Sumitomo Corporation’s Earnings Base Expansion
—Samples of Business Scale Up and New Entries
Background
17
The Sumitomo Corporation Group has been engaged in the media business since
1989, mainly in the cable television business and the multi-channel program sup-
plying business, and has carved out solid No.1 positions in Japan. We are leverag-
ing these positions to develop multilateral business in such areas as TV shopping
and film entertainment. We are also active in video-on-demand (VOD), IP broad-
casting, and other new businesses in response to the digitalization of broadcast-
ing and the broadbandization of communication. With these mutually synergistic
businesses, we have formed a media conglomerate that has established a com-
petitive status unrivaled in the industry.
18 Sumitomo Corporation Annual Report 2005
satellite broadcasts, we started providing programs via Internet
broadband through our On-line TV Co., Ltd.
As for our film entertainment business, we are also carrying
out multilateral development that ranges from production
investment to film distribution and exhibition. Our investments to
date have achieved brilliant results, with five of the films in which
we have invested receiving Picture of the Year honors at the
Japan Academy Awards. In 1999, we entered the cineplex
business by establishing United Cinemas Co., Ltd., which we
made into a subsidiary in 2004. And in 2005, we acquired
Japan AMC Theatres, Inc. through United Cinemas. As a result,
we have grown into an influential player currently operating 15
theaters throughout Japan.
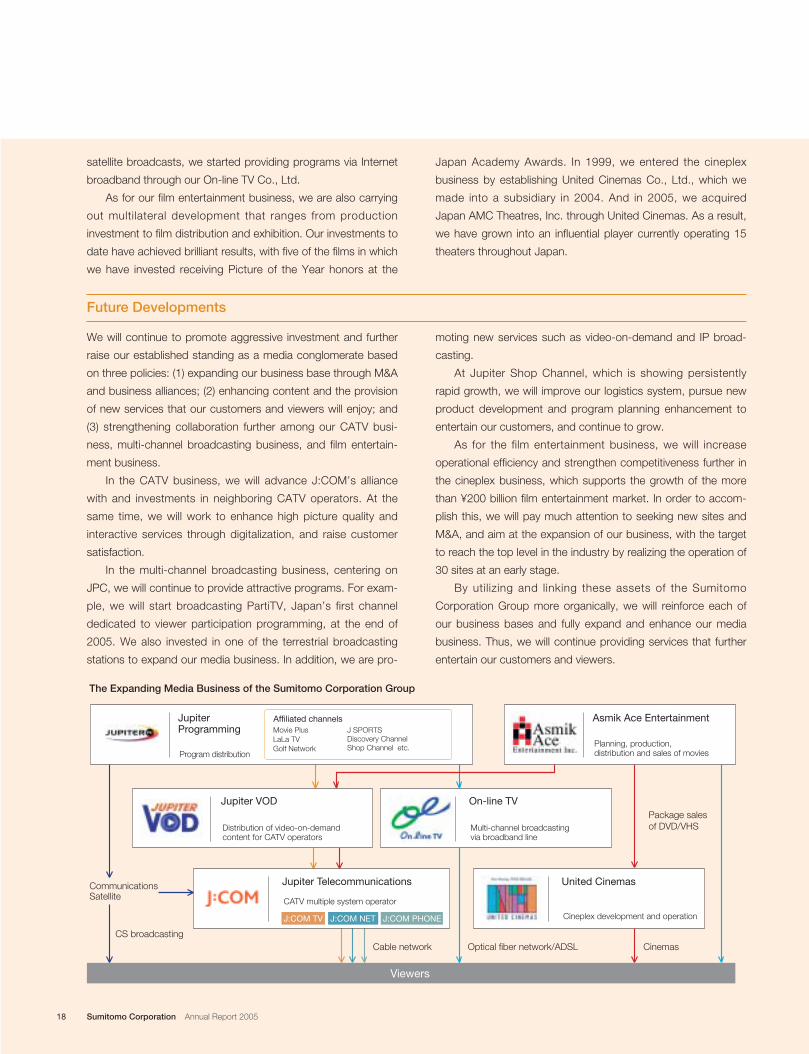
JupiterProgramming
CommunicationsSatellite
CS broadcastingCable network CinemasOptical fiber network/ADSL
The Expanding Media Business of the Sumitomo Corporation Group
Viewers
Program distribution
Affiliated channelsJ SPORTSDiscovery ChannelShop Channel etc.
Movie PlusLaLa TVGolf Network
Package salesof DVD/VHS
Asmik Ace Entertainment
Planning, production, distribution and sales of movies
Jupiter VOD
Distribution of video-on-demand content for CATV operators
On-line TV
Multi-channel broadcasting via broadband line
United Cinemas
Cineplex development and operation
Jupiter Telecommunications
J:COM TV J:COM NET J:COM PHONE
CATV multiple system operator
Future Developments
We will continue to promote aggressive investment and further
raise our established standing as a media conglomerate based
on three policies: (1) expanding our business base through M&A
and business alliances; (2) enhancing content and the provision
of new services that our customers and viewers will enjoy; and
(3) strengthening collaboration further among our CATV busi-
ness, multi-channel broadcasting business, and film entertain-
ment business.
In the CATV business, we will advance J:COM’s alliance
with and investments in neighboring CATV operators. At the
same time, we will work to enhance high picture quality and
interactive services through digitalization, and raise customer
satisfaction.
In the multi-channel broadcasting business, centering on
JPC, we will continue to provide attractive programs. For exam-
ple, we will start broadcasting PartiTV, Japan’s first channel
dedicated to viewer participation programming, at the end of
2005. We also invested in one of the terrestrial broadcasting
stations to expand our media business. In addition, we are pro-
moting new services such as video-on-demand and IP broad-
casting.
At Jupiter Shop Channel, which is showing persistently
rapid growth, we will improve our logistics system, pursue new
product development and program planning enhancement to
entertain our customers, and continue to grow.
As for the film entertainment business, we will increase
operational efficiency and strengthen competitiveness further in
the cineplex business, which supports the growth of the more
than ¥200 billion film entertainment market. In order to accom-
plish this, we will pay much attention to seeking new sites and
M&A, and aim at the expansion of our business, with the target
to reach the top level in the industry by realizing the operation of
30 sites at an early stage.
By utilizing and linking these assets of the Sumitomo
Corporation Group more organically, we will reinforce each of
our business bases and fully expand and enhance our media
business. Thus, we will continue providing services that further
entertain our customers and viewers.
19
We have developed our business base in distribution areas
such as the export of automobiles, the overseas wholesale (dis-
tributor) business, and the retail (dealership) business, as well as
downstream areas centered on auto loans, leasing, and other
financing. In 2004, we also entered upstream areas with the
acquisit ion of KIRIU Corporation through SC-ABeam
Automotive Consulting, a think-tank specializing in the automo-
bile industry. KIRIU is an automotive parts manufacturer that
has established unique product development and design capa-
bilities, in particular for brake drums and brake rotors.
As for financing, Sumisho Auto Leasing Corporation offers
comprehensive services in Japan, including not only leasing but
also maintenance and insurance. As a result of aggressive
M&A, it is further cementing its No. 2 status in the Japanese
auto leasing industry where reorganization is progressing.
Overseas, we strengthened our business bases of the
Indonesian auto financing company P.T. Oto Multiartha and the
two-wheeled vehicle financing company P.T. Summit Oto
Finance. In fiscal year 2004, we entered the financing business
in Jordan and Slovakia, and built a new business model in
Germany—an operation that combines used car distribution
with the financing and insurance business.
In these ways, Sumitomo Corporation is addressing the
needs and business environment of automobile markets around
the world as we develop a global value chain.
We seek to expand our value chain and continue to invest our
management resources in building new business bases in Asia
and other growing markets, aiming to become “a group of con-
tinually evolving, distinctive automobile professionals.”
Domestically, we made Sumisho Auto Leasing a wholly
owned subsidiary and will promote integrated operations with
Sumitomo Corporation to further upgrade and differentiate serv-
ices by leveraging the Group’s integrated corporate strength. In
addition, we seek to expand its scale of operations through fur-
ther M&A to solidify its market position and raise efficiency. As
to the upstream areas of our value chain, we will also seek to
acquire other automotive parts manufacturers, following on the
acquisition of KIRIU.
Overseas, we will utilize the expertise we have accumulated
to newly develop value chains in Vietnam and other ASEAN
countries, as well as in China and India. We will also seek to
expand the financing business specialized for two-wheeled
vehicles that we launched in Indonesia in fiscal year 2003. In
Europe, we will promote vertical and horizontal development of
the new business model we initiated last year in Germany.
We will keep a constant and close watch for business
opportunities from our foothold within the greatly expanded
automobile industry, and continue to build a stronger and
broader-ranging value chain.
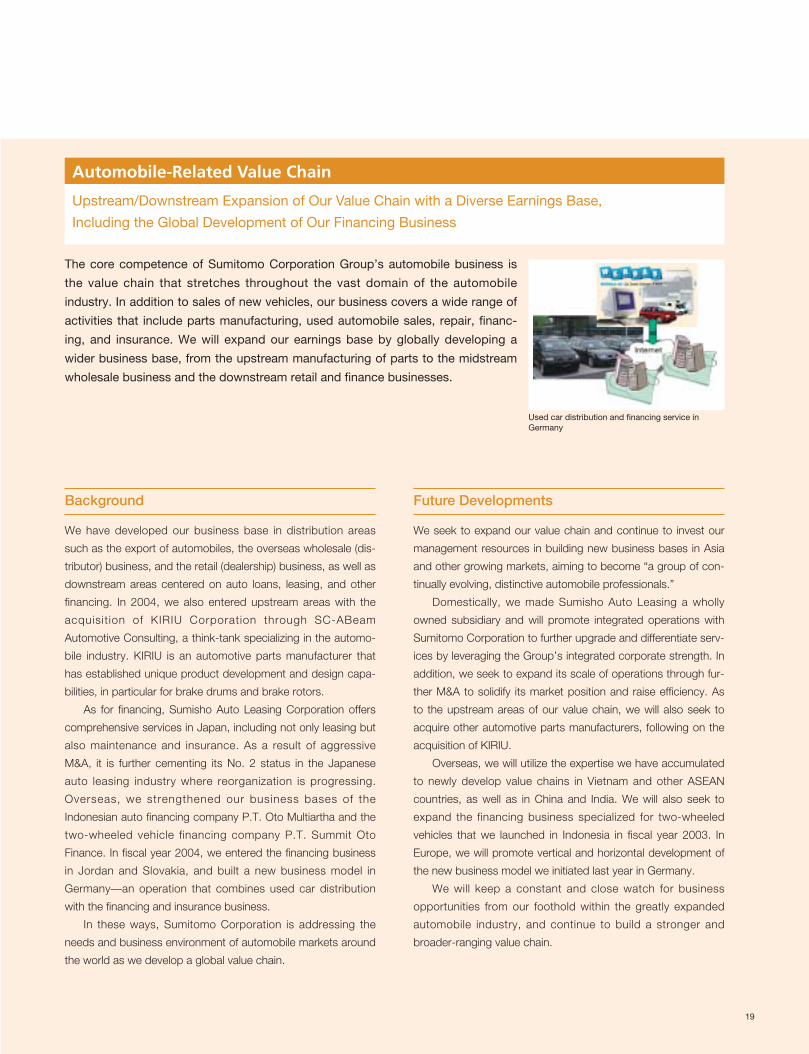
Upstream/Downstream Expansion of Our Value Chain with a Diverse Earnings Base,
Including the Global Development of Our Financing Business
Automobile-Related Value Chain
Background Future Developments
Used car distribution and financing service inGermany
The core competence of Sumitomo Corporation Group’s automobile business is
the value chain that stretches throughout the vast domain of the automobile
industry. In addition to sales of new vehicles, our business covers a wide range of
activities that include parts manufacturing, used automobile sales, repair, financ-
ing, and insurance. We will expand our earnings base by globally developing a
wider business base, from the upstream manufacturing of parts to the midstream
wholesale business and the downstream retail and finance businesses.
20 Sumitomo Corporation Annual Report 2005
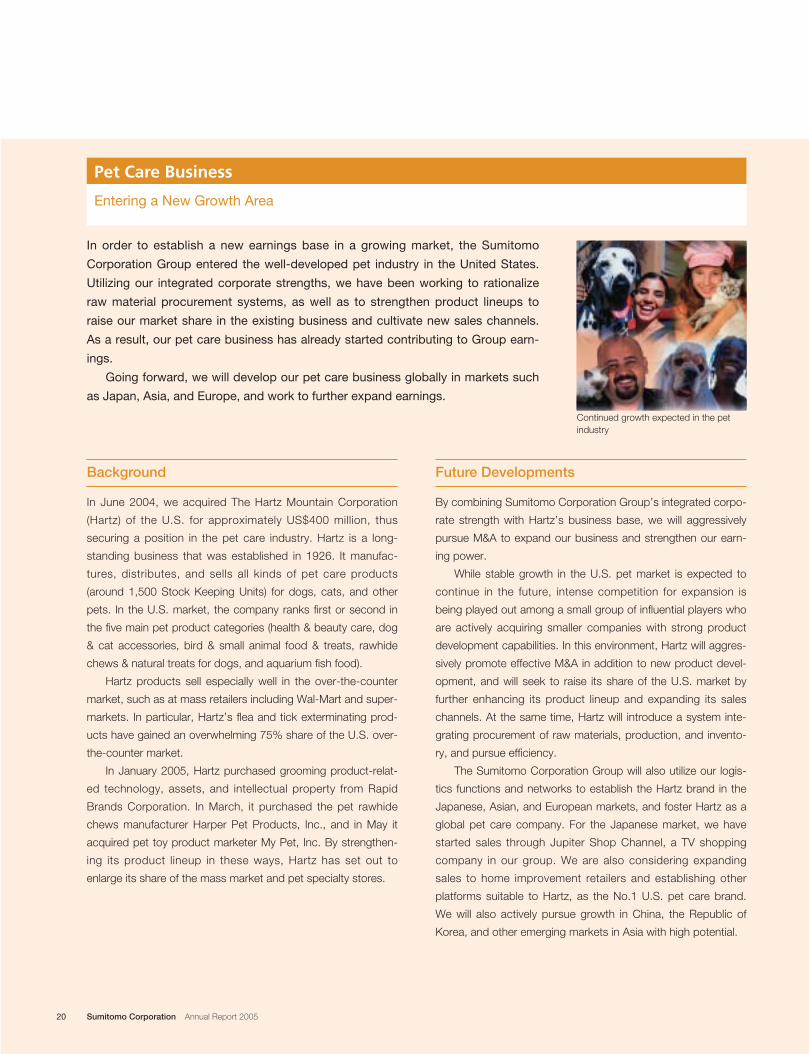
In order to establish a new earnings base in a growing market, the Sumitomo
Corporation Group entered the well-developed pet industry in the United States.
Utilizing our integrated corporate strengths, we have been working to rationalize
raw material procurement systems, as well as to strengthen product lineups to
raise our market share in the existing business and cultivate new sales channels.
As a result, our pet care business has already started contributing to Group earn-
ings.
Going forward, we will develop our pet care business globally in markets such
as Japan, Asia, and Europe, and work to further expand earnings.
Entering a New Growth Area
Pet Care Business
Continued growth expected in the petindustry
In June 2004, we acquired The Hartz Mountain Corporation
(Hartz) of the U.S. for approximately US$400 million, thus
securing a position in the pet care industry. Hartz is a long-
standing business that was established in 1926. It manufac-
tures, distributes, and sells all kinds of pet care products
(around 1,500 Stock Keeping Units) for dogs, cats, and other
pets. In the U.S. market, the company ranks first or second in
the five main pet product categories (health & beauty care, dog
& cat accessories, bird & small animal food & treats, rawhide
chews & natural treats for dogs, and aquarium fish food).
Hartz products sell especially well in the over-the-counter
market, such as at mass retailers including Wal-Mart and super-
markets. In particular, Hartz’s flea and tick exterminating prod-
ucts have gained an overwhelming 75% share of the U.S. over-
the-counter market.
In January 2005, Hartz purchased grooming product-relat-
ed technology, assets, and intellectual property from Rapid
Brands Corporation. In March, it purchased the pet rawhide
chews manufacturer Harper Pet Products, Inc., and in May it
acquired pet toy product marketer My Pet, Inc. By strengthen-
ing its product lineup in these ways, Hartz has set out to
enlarge its share of the mass market and pet specialty stores.
By combining Sumitomo Corporation Group’s integrated corpo-
rate strength with Hartz’s business base, we will aggressively
pursue M&A to expand our business and strengthen our earn-
ing power.
While stable growth in the U.S. pet market is expected to
continue in the future, intense competition for expansion is
being played out among a small group of influential players who
are actively acquiring smaller companies with strong product
development capabilities. In this environment, Hartz will aggres-
sively promote effective M&A in addition to new product devel-
opment, and will seek to raise its share of the U.S. market by
further enhancing its product lineup and expanding its sales
channels. At the same time, Hartz will introduce a system inte-
grating procurement of raw materials, production, and invento-
ry, and pursue efficiency.
The Sumitomo Corporation Group will also utilize our logis-
tics functions and networks to establish the Hartz brand in the
Japanese, Asian, and European markets, and foster Hartz as a
global pet care company. For the Japanese market, we have
started sales through Jupiter Shop Channel, a TV shopping
company in our group. We are also considering expanding
sales to home improvement retailers and establishing other
platforms suitable to Hartz, as the No.1 U.S. pet care brand.
We will also actively pursue growth in China, the Republic of
Korea, and other emerging markets in Asia with high potential.
Background Future Developments
Overview of Operations
22 Sumitomo Corporation Annual Report 2005
Metal Products
Transportation & Construction Systems
Machinery & Electric
Media, Electronics & Network
Billions of yen
0 5.0 10.0 15.0
FY04
Ratio to Total Basic Profit (FY04) Changes in Basic Profit Strategic Fields
FY01
FY02
FY03
Billions of yen
0 5.0 20.010.0 15.0 25.0
FY04
Ratio to Total Basic Profit (FY04) Changes in Basic Profit Strategic Fields
FY01
FY02
FY03
Billions of yen
0 2.0 4.0 8.06.0
FY04
Ratio to Total Basic Profit (FY04) Changes in Basic Profit Strategic Fields
FY01
FY02
FY03
Billions of yen
-10.0 -5.0 0 5.0 10.0
FY04
Ratio to Total Basic Profit (FY04)
Basic Profit = (Gross profit - Selling, general and adminstrative expenses - Interest expenses, net of interest income + Dividends) x (1-Tax rate) + Equity in earnings of associated companies, net(Tax rate was 42% for the years through fiscal year 2003, and 41% for fiscal year 2004 and after)
Changes in Basic Profit Strategic Fields
FY01
FY02
FY03
14.0
6.1
7.1
7.9
6.7
14.8
7.6
4.6
4.6
5.1
9.4
-8.4
7.8
20.6
11.2
0.6
12.7%
18.7%
6.9%
8.5%
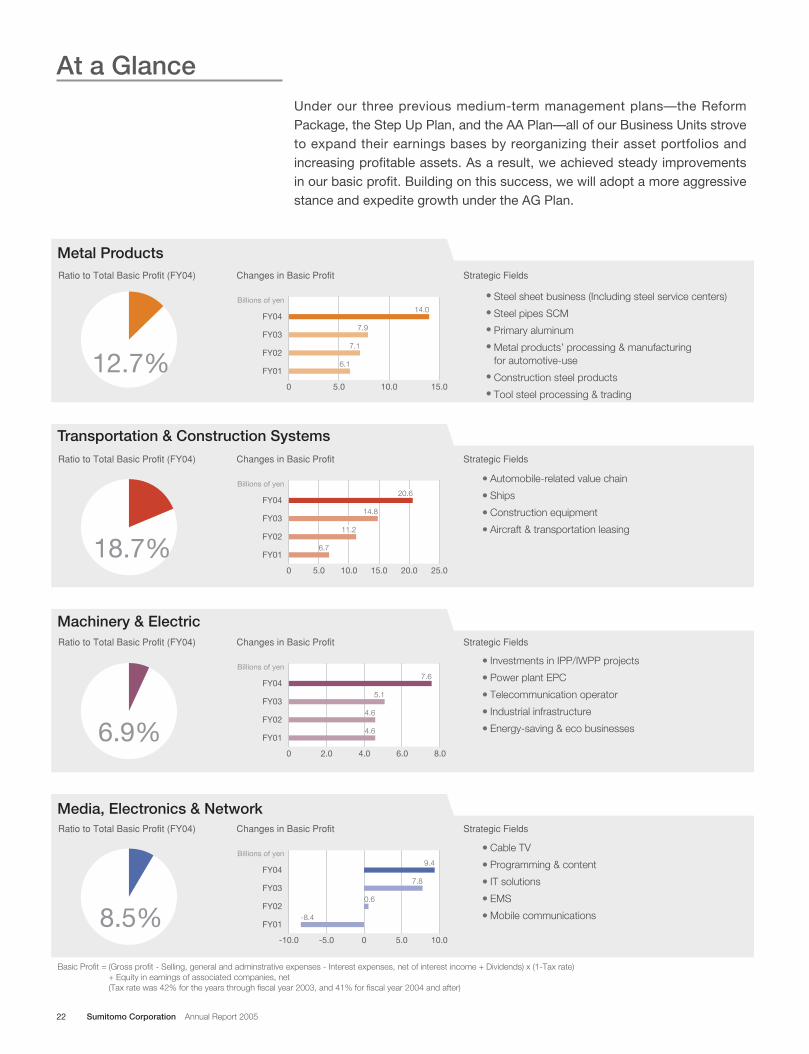
● Steel sheet business (Including steel service centers)● Steel pipes SCM● Primary aluminum● Metal products’ processing & manufacturing
for automotive-use● Construction steel products● Tool steel processing & trading
● Automobile-related value chain ● Ships● Construction equipment● Aircraft & transportation leasing
● Investments in IPP/IWPP projects● Power plant EPC● Telecommunication operator● Industrial infrastructure ● Energy-saving & eco businesses
● Cable TV● Programming & content ● IT solutions ● EMS● Mobile communications
Under our three previous medium-term management plans—the ReformPackage, the Step Up Plan, and the AA Plan—all of our Business Units stroveto expand their earnings bases by reorganizing their asset portfolios andincreasing profitable assets. As a result, we achieved steady improvementsin our basic profit. Building on this success, we will adopt a more aggressivestance and expedite growth under the AG Plan.
At a Glance
Mineral Resources & Energy
Chemical
Consumer Goods & Service
Materials & Real Estate
Financial & Logistics
0 1.0 2.0 3.0
FY04
Ratio to Total Basic Profit (FY04) Changes in Basic Profit Strategic Fields
FY01
FY02
FY03
Billions of yen
Billions of yen
0 4.02.0 6.0 8.0
FY04
Ratio to Total Basic Profit (FY04) Changes in Basic Profit Strategic Fields
FY01
FY02
FY03
Billions of yen
0 4.02.0 6.0 8.0
FY04
Ratio to Total Basic Profit (FY04) Changes in Basic Profit Strategic Fields
FY01
FY02
FY03
Billions of yen
0 5.0 10.0 15.0
FY04
Ratio to Total Basic Profit (FY04) Changes in Basic Profit Strategic Fields
FY01
FY02
FY03
Billions of yen
0 2.0 4.0 6.0
FY04
Ratio to Total Basic Profit (FY04) Changes in Basic Profit Strategic Fields
FY01
FY02
FY03
3.1
4.5
6.6
6.5
4.5
5.9
5.8
5.9
6.6
2.8
1.9
4.5
1.7
2.0
2.0
2.1
2.3
15.0
2.0
2.0
13.6%
4.1%
5.9%
5.4%
2.5%
2323
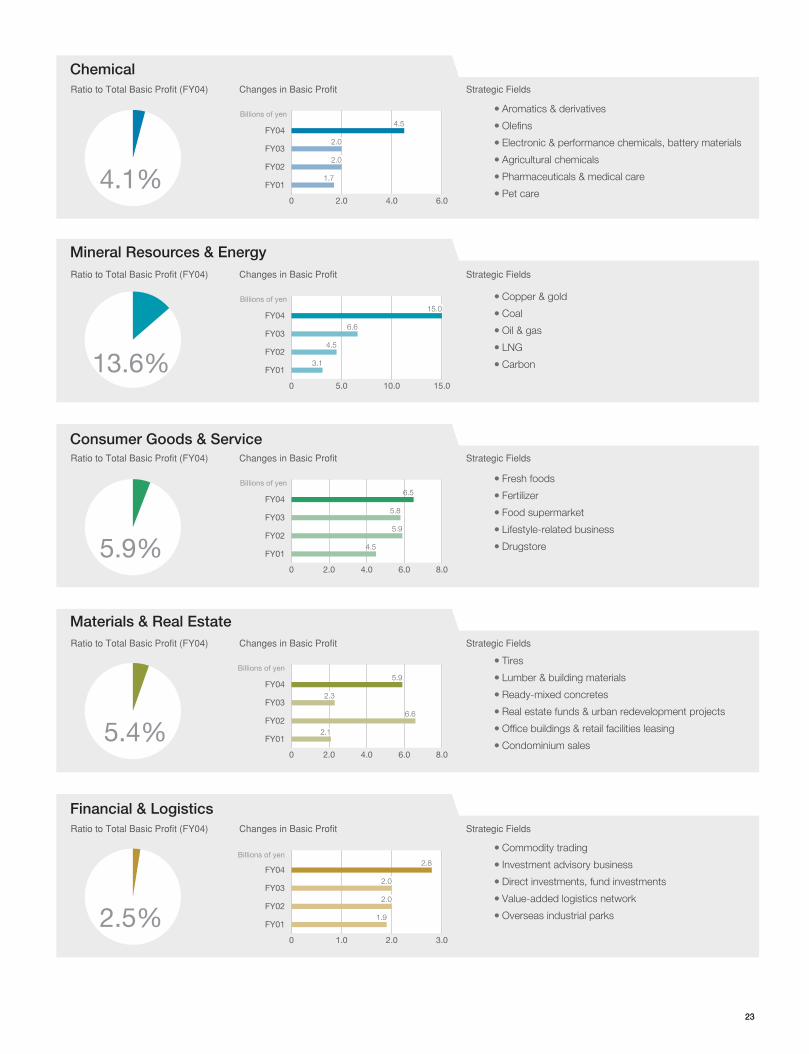
● Copper & gold● Coal● Oil & gas● LNG● Carbon
● Aromatics & derivatives● Olefins● Electronic & performance chemicals, battery materials● Agricultural chemicals ● Pharmaceuticals & medical care● Pet care
● Fresh foods● Fertilizer● Food supermarket● Lifestyle-related business● Drugstore
● Tires● Lumber & building materials● Ready-mixed concretes● Real estate funds & urban redevelopment projects● Office buildings & retail facilities leasing● Condominium sales
● Commodity trading● Investment advisory business● Direct investments, fund investments● Value-added logistics network● Overseas industrial parks
24 Sumitomo Corporation Annual Report 2005
Value-added, Innovative Services, Reflecting Customer Needs
A special feature of our business unit is the development of a variety of operations
in addition to our usual trade of metal products, such as steel sheets, steel pipes,
and other steel products, as well as aluminum products and ingots. Such activities
demonstrate our innovative services in response to the diverse needs of our cus-
tomers. Taking the example of steel sheets, we have established a steel service
center network close to our customer’s production site, offering supply chain
management (SCM) services in response to the customer’s precise needs. We
operate steel service centers in 41 locations around the globe, including Japan,
China, Southeast Asia, North America, and Europe. The annual processing capac-
ity of around six million tons for these centers is the largest among trading com-
panies. Furthermore, steel pipe SCM centered on Oil Country Tubular Goods
(OCTG) provides a total service covering areas ranging from the supply of steel
pipes to inventory control, as well as processing, inspection, transport, and main-
tenance, all of which are supported by our Tubular Information Management
System (TIMS), a proprietary online SCM system. As a result, oil and natural gas
corporations worldwide highly evaluate our service.
Kenzo OkuboGeneral Manager, Metal Products Business Unit
Metal Products Business Unit
Business Environment and AG Plan Strategies and Policies
Broadening the Business Base throughM&A and Value Chain Expansion
The steel and aluminum industries antici-pate favorable demand both domesticallyand internationally. In terms of steelsheets, we expect expanded exports ofhigh-quality steel products from Japan,driven by the expansion of the automo-bile and home electronics industries inChina. For steel pipes and plates as well,plant and other energy-related demandsare expected to remain favorable, ridingon the strength of high prices for crudeoil and gas over the medium-term.
In this environment, we are aiming tobe a leader in the steel and aluminum dis-tribution industries, based on our busi-ness strategy of an “expanding earningsbase through a proactive increase of prof-
itable risk-adjusted assets” and “strength-ening earning power from domestic busi-ness.”
Priority sectors for increasing profitablerisk-adjusted assets are steel manufac-turing businesses upstream such as gal-vanized sheet, and wholesales and pro-cessing operations downstream. Throughthe acquisition of these businesses, weaim to expand the value chain of particularmaterials such as steel and aluminum.Furthermore, in our core strategic region ofChina, we are further developing steelservice centers, thereby enhancing oursteel sheet-related business, and proac-tively developing new business inresponse to the overseas advancementof automobile manufacturers. In addition,we intend to increase our risk-adjustedassets through the enhancement of steelpipe SCM, with the aim to establish aninternational service network of OCTG foroil and gas pipes, as well as the equity
acquisition of aluminum smelter.As to our domestic business, we do
not anticipate an overall expansion ofscale, as the market is mature. However,we aim to broaden our business basethrough M&A, and increase our compet-itiveness by strengthening our capabilityas a trading company and enhancing theadded value of our services.
These policies are intended to increaseour risk-adjusted assets during the AGPlan period by ¥37.0 billion, with a goalof ¥112.0 billion by the end of fiscal year2006. We are also planning to achieve atwo-year average risk-adjusted return ratioof 12.9%.
2525
0 60 120 180
(Billions of yen)
Net Income Risk-adjusted Return Ratio and Risk-adjusted Assets
FY01 FY02 FY03 FY04 Risk-adjusted Assets(Billions of yen)
Ris
k-ad
just
ed R
etur
n R
atio
(%)15
12
9
6
3
0
14.0
12.0
10.0
8.0
6.0
4.0
2.0
0.0
16.0
Step Up Plan(Result)
AA Plan(Result)
AG Plan(Target)
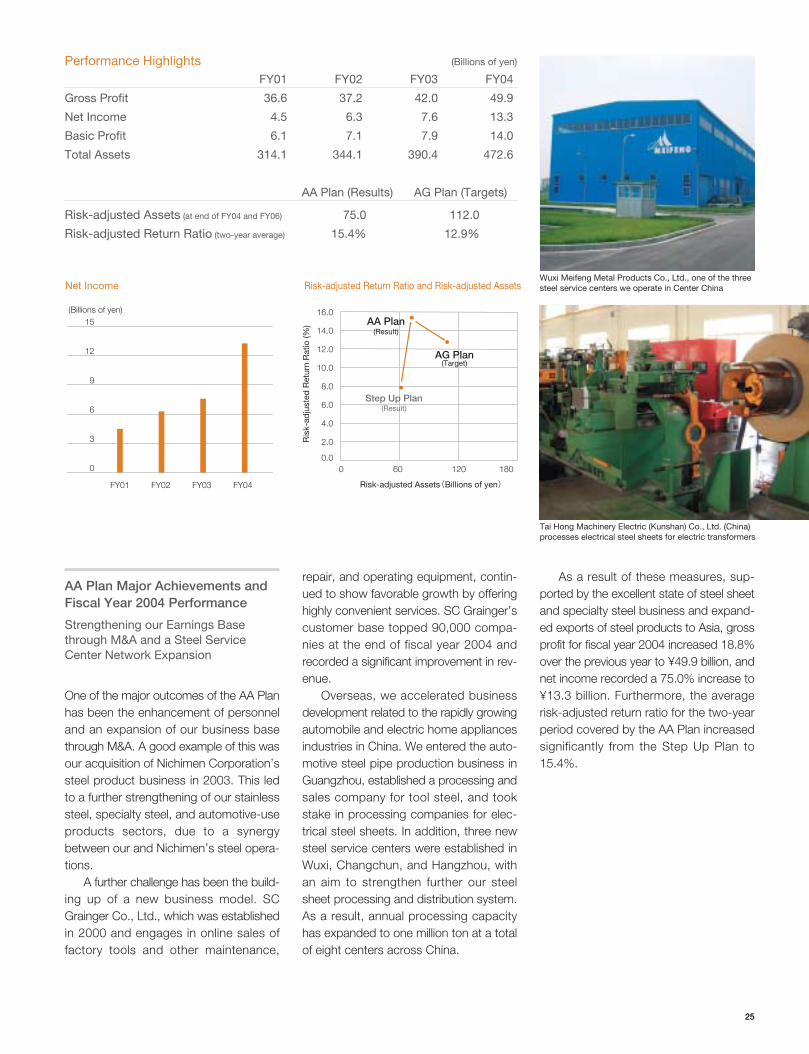
Wuxi Meifeng Metal Products Co., Ltd., one of the threesteel service centers we operate in Center China
AA Plan Major Achievements andFiscal Year 2004 Performance
Strengthening our Earnings Basethrough M&A and a Steel ServiceCenter Network Expansion
One of the major outcomes of the AA Planhas been the enhancement of personneland an expansion of our business basethrough M&A. A good example of this wasour acquisition of Nichimen Corporation’ssteel product business in 2003. This ledto a further strengthening of our stainlesssteel, specialty steel, and automotive-useproducts sectors, due to a synergybetween our and Nichimen’s steel opera-tions.
A further challenge has been the build-ing up of a new business model. SCGrainger Co., Ltd., which was establishedin 2000 and engages in online sales offactory tools and other maintenance,
repair, and operating equipment, contin-ued to show favorable growth by offeringhighly convenient services. SC Grainger’scustomer base topped 90,000 compa-nies at the end of fiscal year 2004 andrecorded a significant improvement in rev-enue.
Overseas, we accelerated businessdevelopment related to the rapidly growingautomobile and electric home appliancesindustries in China. We entered the auto-motive steel pipe production business inGuangzhou, established a processing andsales company for tool steel, and tookstake in processing companies for elec-trical steel sheets. In addition, three newsteel service centers were established inWuxi, Changchun, and Hangzhou, withan aim to strengthen further our steelsheet processing and distribution system.As a result, annual processing capacityhas expanded to one million ton at a totalof eight centers across China.
As a result of these measures, sup-ported by the excellent state of steel sheetand specialty steel business and expand-ed exports of steel products to Asia, grossprofit for fiscal year 2004 increased 18.8%over the previous year to ¥49.9 billion, andnet income recorded a 75.0% increase to¥13.3 billion. Furthermore, the averagerisk-adjusted return ratio for the two-yearperiod covered by the AA Plan increasedsignificantly from the Step Up Plan to15.4%.
FY01 FY02 FY03 FY04
Gross Profit 36.6 37.2 42.0 49.9
Net Income 4.5 6.3 7.6 13.3
Basic Profit 6.1 7.1 7.9 14.0
Total Assets 314.1 344.1 390.4 472.6
AA Plan (Results) AG Plan (Targets)
Risk-adjusted Assets (at end of FY04 and FY06) 75.0 112.0
Risk-adjusted Return Ratio (two-year average) 15.4% 12.9%
Performance Highlights (Billions of yen)
Tai Hong Machinery Electric (Kunshan) Co., Ltd. (China)processes electrical steel sheets for electric transformers
26 Sumitomo Corporation Annual Report 2005
Business Environment and AG Plan Strategies and Policies
Further Expansion of Our CompetitiveAdvantage and New BusinessDevelopment
The automobile market is likely to main-tain its growth momentum primarily inAsia, while market expansion for con-struction equipment is expected to con-tinue mainly in North America, Europe,and Australia. In addition, robust new ship-building demand and shipping freight ratesare also favorable for our businesses. Onthe other hand, we must pay due attentionto intensifying competition in automobilefinance and construction equipment aswell as a weakening of market conditionsfor shipbuilding and shipping freight rates.
In this business climate, we aim toachieve a consolidated net income of ¥20billion in the post-AG Plan, with the AG
Plan as the “strength-buildup period.” Wewill thoroughly bolster our existing corebusinesses by leveraging our competitiveadvantage, and at the same time accel-erate our entry into new business areas.
In the automobile finance business,we will seek to expand our scale of oper-ations domestically by making SumishoAuto Leasing Corporation a wholly ownedsubsidiary and also through flexible andagile M&A activities. In overseas markets,we will accelerate operations centering onChina, India, and ASEAN countries, whererapid market expansion is likely. We willalso work on new M&A in the automotiveparts manufacturing business. In the shipsand aircraft businesses, we will expandthe portfolio of our own assets, while inthe construction equipment business, wewill push ahead with the expansion ofdealerships in the U.S. and Europethrough M&A.
In new business areas, we will contin-
ue to proactively develop value chainoperations in Europe, including the afore-mentioned German projects. Another planis to expand assets in freight car, con-tainer, and aircraft engine leasing busi-nesses.
Through these plans and steps, weare targeting a ¥60.0 billion increase inrisk-adjusted assets to ¥165.0 billion bythe end of fiscal year 2006 and an averagerisk-adjusted return ratio of 11.5% for thetwo-year period under the AG Plan.
A Wide-Ranging Value Chain in Automobile-Related Business
Our main areas of focus are transportation equipment, including automobiles, ships,
and aircraft, and construction equipment. We are expanding our business sphere
from midstream activities to both downstream and upstream operations.
Our core automobile-related business operates in more than 30 countries. We
have formed a value chain covering a broad range of business groups, from auto-
motive parts manufacturing to automobile dealerships and finance. Sumisho Auto
Leasing Corporation holds the second position in Japan’s auto leasing industry, and
another subsidiary, P.T. Oto Multiartha, is now one of the three largest players in
Indonesia’s auto finance industry. We are also developing new business areas such
as automobile-related consulting services through SC-ABeam Automotive Consulting
and used car distribution and financing service businesses in Germany.
In the ships business, we have an equity investment in Oshima Shipbuilding
Co., Ltd. We are the only Japanese integrated trading company engaged in the
shipbuilding business. Our activities in this business area are wide-ranging, includ-
ing our own ship chartering business.
With respect to construction equipment, we lead all other Japanese trading
companies. Our particular strength is in overseas operations, handling mainly
Komatsu products.
Shuji HiroseGeneral Manager, Transportation & Construction Systems Business Unit
Transportation & ConstructionSystems Business Unit
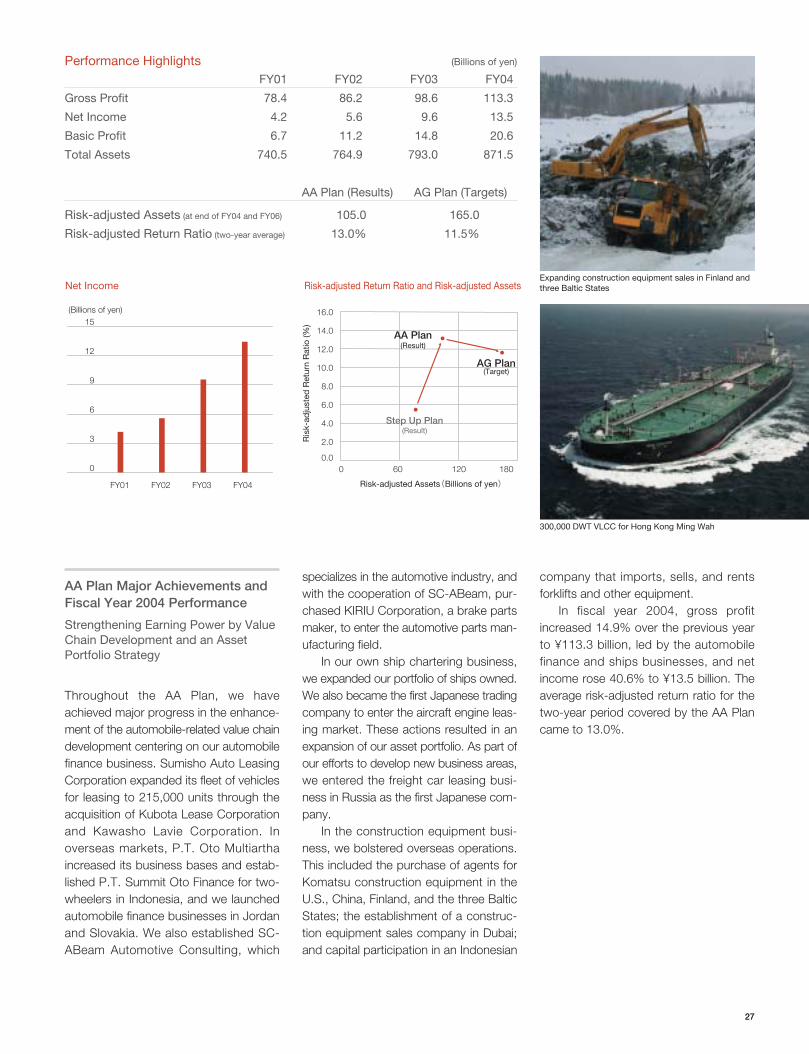
2727
AA Plan Major Achievements andFiscal Year 2004 Performance
Strengthening Earning Power by ValueChain Development and an AssetPortfolio Strategy
Throughout the AA Plan, we haveachieved major progress in the enhance-ment of the automobile-related value chaindevelopment centering on our automobilefinance business. Sumisho Auto LeasingCorporation expanded its fleet of vehiclesfor leasing to 215,000 units through theacquisition of Kubota Lease Corporationand Kawasho Lavie Corporation. Inoverseas markets, P.T. Oto Multiarthaincreased its business bases and estab-lished P.T. Summit Oto Finance for two-wheelers in Indonesia, and we launchedautomobile finance businesses in Jordanand Slovakia. We also established SC-ABeam Automotive Consulting, which
specializes in the automotive industry, andwith the cooperation of SC-ABeam, pur-chased KIRIU Corporation, a brake partsmaker, to enter the automotive parts man-ufacturing field.
In our own ship chartering business,we expanded our portfolio of ships owned.We also became the first Japanese tradingcompany to enter the aircraft engine leas-ing market. These actions resulted in anexpansion of our asset portfolio. As part ofour efforts to develop new business areas,we entered the freight car leasing busi-ness in Russia as the first Japanese com-pany.
In the construction equipment busi-ness, we bolstered overseas operations.This included the purchase of agents forKomatsu construction equipment in theU.S., China, Finland, and the three BalticStates; the establishment of a construc-tion equipment sales company in Dubai;and capital participation in an Indonesian
company that imports, sells, and rentsforklifts and other equipment.
In fiscal year 2004, gross profitincreased 14.9% over the previous yearto ¥113.3 billion, led by the automobilefinance and ships businesses, and netincome rose 40.6% to ¥13.5 billion. Theaverage risk-adjusted return ratio for thetwo-year period covered by the AA Plancame to 13.0%.
Expanding construction equipment sales in Finland andthree Baltic States
300,000 DWT VLCC for Hong Kong Ming Wah
0 60 120 180
(Billions of yen)
Net Income Risk-adjusted Return Ratio and Risk-adjusted Assets
FY01 FY02 FY03 FY04 Risk-adjusted Assets(Billions of yen)
Ris
k-ad
just
ed R
etur
n R
atio
(%)15
12
9
6
3
0
14.0
12.0
10.0
8.0
6.0
4.0
2.0
0.0
16.0
Step Up Plan(Result)
AA Plan(Result)
AG Plan(Target)
FY01 FY02 FY03 FY04
Gross Profit 78.4 86.2 98.6 113.3
Net Income 4.2 5.6 9.6 13.5
Basic Profit 6.7 11.2 14.8 20.6
Total Assets 740.5 764.9 793.0 871.5
AA Plan (Results) AG Plan (Targets)
Risk-adjusted Assets (at end of FY04 and FY06) 105.0 165.0
Risk-adjusted Return Ratio (two-year average) 13.0% 11.5%
Performance Highlights (Billions of yen)
28 Sumitomo Corporation Annual Report 2005
Business Environment and AG Plan Strategies and Policies
Diverse Capabilities Contribute to theAdvancement of Key Infrastructure
The expansion of electric power demandmainly in Asia and the Middle East andprogress in deregulation within the elec-tric power industry, as well as continuedgrowth in broadband communications andmobile phones are the following wind toour business. In addition, moves towardstrengthening environmental regulationsand enhancing various subsidy programsprovide good opportunities for the expan-sion of energy-saving and environment-friendly projects.
Under these circumstances, we willstrengthen our earnings base in line with astrategy of procuring sustained orders ofEPC projects and expanding investmentsmainly in infrastructure-related projects.
In the EPC business, we aim to obtainnew orders for electric power plants inAsia and the Middle East. Toward thisgoal, we are enhancing our expertise andcapabilities in business development,financing arrangement, risk management,business management, as well as opera-tion and maintenance, while strengthen-ing our cost competitiveness. As forinvestments in overseas electric powerprojects, we will concentrate on the inde-pendent power producer (IPP) and inde-pendent water and power producer(IWPP) projects, particularly those in theU.S., Asia, and the Middle East, with aview to increasing our retained power-generation capacity to 6,300 megawattsby 2010. In the telecommunications field,we will expand our existing businesseswhile implementing strategic projects inthe mobile telecommunications field inregions including the CIS , Asia, and theMiddle East. We will also actively work on
projects mainly in Asia associated withJapanese companies’ overseas expan-sion, by way of means such as supplyingequipment and facilities in the countriesconcerned. Our objective is to stand atthe forefront of the infrastructure businessaiming to be a “functional organization thatcontributes to society through the devel-opment and upgrading of infrastructure.”
In our energy-saving and eco busi-nesses, we also conduct projects such asenergy service, recycling and waste treat-ment, and solar power and wind-gener-ated power in Japan as well as overseasto contribute to the prevention of globalwarming.
The above activities are expected toresult in a ¥36.0 billion increase in risk-adjusted assets to ¥102.0 billion by theend of fiscal year 2006 and an averagerisk-adjusted return ratio of 10% for thetwo-year period under the AG Plan.
Strong Performance in Power Plant EPC, Especially in Asia
Our principal areas of involvement are electric power, water, energy, telecom-
munications, and industrial infrastructure, as well as areas that offer growth poten-
tial such as energy-saving and eco technologies, medical care, and life sciences.
We will foster the selection and consolidation of business by realizing the optimal
combination of trading and investments as well as blending with regional strate-
gies.
The bulk of our earnings are derived from overseas projects related to electric
power, telecommunications, and energy, in which we have demonstrated our
capabilities in project organization and execution, as well as from investments in
electric power, water, telecommunications, and other businesses. We are partic-
ularly strong in engineering, procurement, and construction (EPC) projects, offer-
ing comprehensive handling capabilities. For power plant EPC projects, in par-
ticular, we boast an unrivalled track record among Japan’s general trading com-
panies, with a total power-generation capacity handled to date of 42,000
megawatts. We are aggressively expanding our investment in electric power proj-
ects using the expertise acquired through power plant EPC.
Michio OgimuraGeneral Manager, Machinery & Electric Business Unit
Machinery & Electric Business Unit
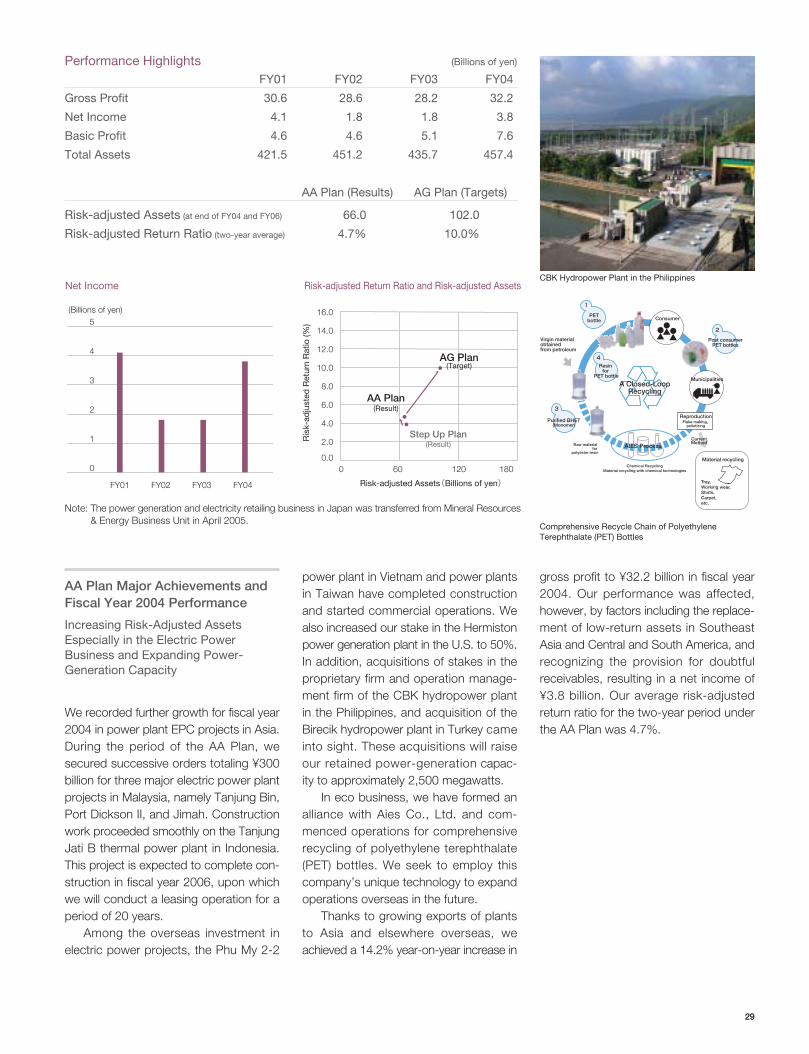
29
AA Plan Major Achievements andFiscal Year 2004 Performance
Increasing Risk-Adjusted AssetsEspecially in the Electric PowerBusiness and Expanding Power-Generation Capacity
We recorded further growth for fiscal year2004 in power plant EPC projects in Asia.During the period of the AA Plan, wesecured successive orders totaling ¥300billion for three major electric power plantprojects in Malaysia, namely Tanjung Bin,Port Dickson II, and Jimah. Constructionwork proceeded smoothly on the TanjungJati B thermal power plant in Indonesia.This project is expected to complete con-struction in fiscal year 2006, upon whichwe will conduct a leasing operation for aperiod of 20 years.
Among the overseas investment inelectric power projects, the Phu My 2-2
power plant in Vietnam and power plantsin Taiwan have completed constructionand started commercial operations. Wealso increased our stake in the Hermistonpower generation plant in the U.S. to 50%.In addition, acquisitions of stakes in theproprietary firm and operation manage-ment firm of the CBK hydropower plantin the Philippines, and acquisition of theBirecik hydropower plant in Turkey cameinto sight. These acquisitions will raiseour retained power-generation capac-ity to approximately 2,500 megawatts.
In eco business, we have formed analliance with Aies Co., Ltd. and com-menced operations for comprehensiverecycling of polyethylene terephthalate(PET) bottles. We seek to employ thiscompany’s unique technology to expandoperations overseas in the future.
Thanks to growing exports of plantsto Asia and elsewhere overseas, weachieved a 14.2% year-on-year increase in
gross profit to ¥32.2 billion in fiscal year2004. Our performance was affected,however, by factors including the replace-ment of low-return assets in SoutheastAsia and Central and South America, andrecognizing the provision for doubtfulreceivables, resulting in a net income of¥3.8 billion. Our average risk-adjustedreturn ratio for the two-year period underthe AA Plan was 4.7%.
29
Material recycling
Virgin material obtained from petroleum
PETbottle
Post consumerPET bottles
Chemical RecyclingMaterial recycling with chemical technologies
Raw material for
polyester resin
Consumer
Municipalities
4
Resin for
PET bottle
3
Purified BHET (Monomer)
A Closed-LoopRecycling
ReproductionFlake making,
pelletizing
AIES ProcessCurrentMethod
2
1
Tray, Working wear, Shirts, Carpet, etc.
Comprehensive Recycle Chain of PolyethyleneTerephthalate (PET) Bottles
CBK Hydropower Plant in the Philippines
0 60 120 180
(Billions of yen)
Net Income Risk-adjusted Return Ratio and Risk-adjusted Assets
FY01 FY02 FY03 FY04 Risk-adjusted Assets(Billions of yen)
Ris
k-ad
just
ed R
etur
n R
atio
(%)5
4
3
2
1
0
14.0
12.0
10.0
8.0
6.0
4.0
2.0
0.0
16.0
AA Plan(Result)
Step Up Plan(Result)
AG Plan(Target)
FY01 FY02 FY03 FY04
Gross Profit 30.6 28.6 28.2 32.2
Net Income 4.1 1.8 1.8 3.8
Basic Profit 4.6 4.6 5.1 7.6
Total Assets 421.5 451.2 435.7 457.4
AA Plan (Results) AG Plan (Targets)
Risk-adjusted Assets (at end of FY04 and FY06) 66.0 102.0
Risk-adjusted Return Ratio (two-year average) 4.7% 10.0%
Performance Highlights (Billions of yen)
Note: The power generation and electricity retailing business in Japan was transferred from Mineral Resources& Energy Business Unit in April 2005.
30 Sumitomo Corporation Annual Report 2005
Shingo YoshiiGeneral Manager, Media, Electronics & Network Business Unit
Media, Electronics & Network Business Unit
Business Environment and AG Plan Strategies and Policies
Expanding Operation in the RapidlyChanging Business Environment
The media, network, and electronics busi-nesses show tremendous growth potentialand are undergoing a rapid change. Underthe AG Plan, we intend to turn the rapidlychanging business environment into newbusiness opportunities and expand ourearnings base.
In the media business, the trend ofdigitalization and broadbandization bringsus numerous opportunities to offer newservices. Under such circumstances,J:COM plans to increase its number ofsubscribers by expanding digital serviceson a regional scale through investmentsin neighboring cable TV operators andalliances with other operators. On theother hand, JPC is facilitating an expan-
sion of its business base through an M&Aof CS broadcast programming compa-nies and is developing new businessessuch as video-on-demand (VOD) servic-es, Internet Protocol (IP) broadcasts, andinteractive programs.
In the network business, SCS, carryingout software development capabilities, andSSE, featuring network integration andmarketing capabilities, merged in August2005. As a new organization, it will targetto become the leading IT solutionsprovider. In the mobile communicationsbusiness, MSCOM plans to expand andenhance its business through M&A.
In the electronics business, we arestepping up efforts to expand our EMSoperation and enhance its functions,in response to growing outsourcingdemands among computer peripheralsand digital home appliance manufactur-ers. To this end, we will be further pro-moting alliances with printed circuit board
assemblers mainly in China. As for elec-tronic materials, we will more actively focuson new technologies to explore new busi-ness segments, especially blue and whiteLEDs as well as carbon nanotubes, whosemarket is expected to expand.
Based on these strategies, we intendto increase risk-adjusted assets by ¥38.0billion to ¥151.0 billion by the end of fiscalyear 2006 and achieve an average risk-adjusted return ratio of 11.8% for the two-year period under the AG Plan.
Becoming the No. 1 Company in the Industry
Our core Group companies in the media, electronics, and network business areas
have leading positions, each cooperating and taking full advantage of synergies
within the Group.
In the media business, we provide services on both the infrastructure and
content fronts. Among our Group companies are Jupiter Telecommunications
Co., Ltd. (J:COM), the largest cable TV operator in Japan, and Jupiter Programming
Co., Ltd. (JPC), the largest multichannel television programming and content
provider in Japan.
In the network business, in which we are also targeting the top positions,
Sumisho Computer Systems Corporation (SCS), Sumisho Electronics Co., Ltd.
(SSE), and Nissho Electronics Corporation closely collaborate in providing IT solu-
tions services, and MS Communications Co., Ltd. (MSCOM) promotes the mobile
communications business.
In the electronics business, the Sumitronics Group operates the largest elec-
tronic manufacturing services (EMS) business in Japan and Asia. Furthermore,
in the electronic materials business, Sumitomo Corporation serves as the sole
distributor of LEDs manufactured by Cree, Inc. (NASDAQ: CREE), which has a
25% share of the Japanese market.
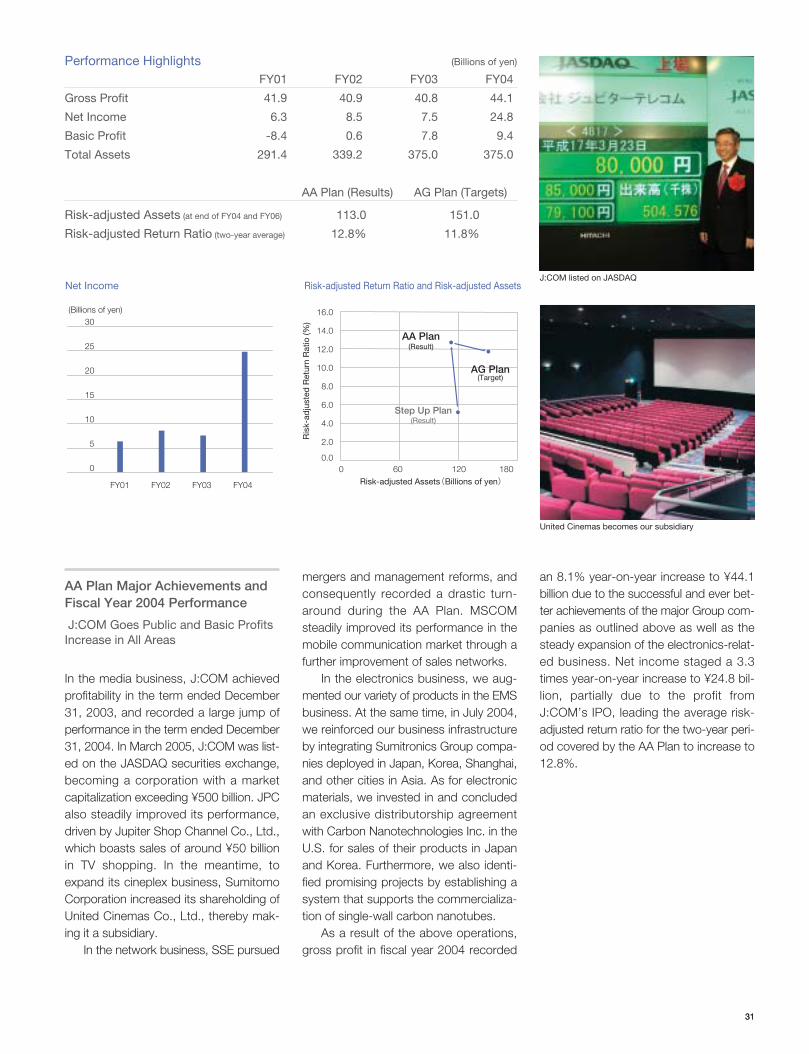
3131
J:COM listed on JASDAQ
United Cinemas becomes our subsidiary
AA Plan Major Achievements andFiscal Year 2004 Performance
J:COM Goes Public and Basic ProfitsIncrease in All Areas
In the media business, J:COM achievedprofitability in the term ended December31, 2003, and recorded a large jump ofperformance in the term ended December31, 2004. In March 2005, J:COM was list-ed on the JASDAQ securities exchange,becoming a corporation with a marketcapitalization exceeding ¥500 billion. JPCalso steadily improved its performance,driven by Jupiter Shop Channel Co., Ltd.,which boasts sales of around ¥50 billionin TV shopping. In the meantime, toexpand its cineplex business, SumitomoCorporation increased its shareholding ofUnited Cinemas Co., Ltd., thereby mak-ing it a subsidiary.
In the network business, SSE pursued
mergers and management reforms, andconsequently recorded a drastic turn-around during the AA Plan. MSCOMsteadily improved its performance in themobile communication market through afurther improvement of sales networks.
In the electronics business, we aug-mented our variety of products in the EMSbusiness. At the same time, in July 2004,we reinforced our business infrastructureby integrating Sumitronics Group compa-nies deployed in Japan, Korea, Shanghai,and other cities in Asia. As for electronicmaterials, we invested in and concludedan exclusive distributorship agreementwith Carbon Nanotechnologies Inc. in theU.S. for sales of their products in Japanand Korea. Furthermore, we also identi-fied promising projects by establishing asystem that supports the commercializa-tion of single-wall carbon nanotubes.
As a result of the above operations,gross profit in fiscal year 2004 recorded
an 8.1% year-on-year increase to ¥44.1billion due to the successful and ever bet-ter achievements of the major Group com-panies as outlined above as well as thesteady expansion of the electronics-relat-ed business. Net income staged a 3.3times year-on-year increase to ¥24.8 bil-lion, partially due to the profit fromJ:COM’s IPO, leading the average risk-adjusted return ratio for the two-year peri-od covered by the AA Plan to increase to12.8%.
0 60 120 180
(Billions of yen)
Net Income Risk-adjusted Return Ratio and Risk-adjusted Assets
FY01 FY02 FY03 FY04 Risk-adjusted Assets(Billions of yen)
Ris
k-ad
just
ed R
etur
n R
atio
(%)30
25
20
15
10
0
5
14.0
12.0
10.0
8.0
6.0
4.0
2.0
0.0
16.0
AA Plan(Result)
Step Up Plan(Result)
AG Plan(Target)
FY01 FY02 FY03 FY04
Gross Profit 41.9 40.9 40.8 44.1
Net Income 6.3 8.5 7.5 24.8
Basic Profit -8.4 0.6 7.8 9.4
Total Assets 291.4 339.2 375.0 375.0
AA Plan (Results) AG Plan (Targets)
Risk-adjusted Assets (at end of FY04 and FY06) 113.0 151.0
Risk-adjusted Return Ratio (two-year average) 12.8% 11.8%
Performance Highlights (Billions of yen)

32 Sumitomo Corporation Annual Report 2005
Nobuo KitagawaGeneral Manager, Chemical Business Unit
Chemical Business Unit
Business Environment and AG Plan Strategies and Policies
Accelerating Selection andConcentration
In April 2005, we reviewed our businesslines in terms of products and capabilities,and reorganized our business into twodivisions: Basic & Performance Chemicalsand Life Science. Under this new system,we seek to solidify our already strong tradebusiness and accelerate strategic invest-ments in highly profitable projects. Ouraim is to increase risk-adjusted assets by¥22.0 billion to ¥56.0 billion by the end offiscal year 2006, and achieve a targetaverage risk-adjusted return ratio of 11.4%for the two-year period covered under theAG Plan.
In the basic chemicals field, we willstrengthen our tie-ups with the U.S. andEuropean manufacturers and upgrade
trade through location swaps among theU.S., Europe, and Asia, and tolling con-version to enhance our trade business.We will also strive to improve competi-tiveness by investing in ships and tankfacilities. In resource-based inorganicchemicals, we will vigorously invest inmines and aim to increase and stabilizeour earnings. As for plastics, we intend toencourage investment through partner-ships with leading Japanese processingmanufacturers to boost earnings in theprocessing field.
In electronic and performance chemi-cals, we aim to expand our line of chemi-cal products, such as materials for flexi-ble printed circuit boards, display panelsand batteries as well as special gases. Atthe same time, we will upgrade our func-tions in the SCM and fabless manufactur-ing businesses.
With respect to life science, we willpromote further the expansion of our value
chain in agri-science businesses. Throughthe acquisition of agricultural chemicalsmanufacturers and agricultural chemicalsbusinesses overseas, we will secure ourown product line and expand our agricul-tural materials distribution networks.
In pharmaceuticals and medical care,we aim to make further inroads into thedomestic medical market by tying-up withuniversities and promoting the electronicmedical records business of Apius Co.,Ltd. In China, having acquired an equitystake in Henan Topfond PharmaceuticalCo., Ltd., we plan to export and promotedomestic sales of the company’s phar-maceuticals.
In addition, we aim to advance our petsupplies business by strengthening andexpanding the business base of The HartzMountain Corporation (Hartz) in the U.S.and to enter the markets in Japan, Asiaand Europe.
Global Expansion of Chemicals Business
The chemicals business is a wide-ranging field closely linked to a variety of indus-
tries. We conduct a global operation employing supply chain management (SCM)
and logistics functions that focus on the following three business areas: (1) basic
chemicals, such as plastics, organic chemicals (ethylene, phenol, etc.) and
resource-based inorganic chemicals (sulfuric acid, soda ash); (2) electronic and per-
formance chemicals, including materials for semiconductors, liquid crystal dis-
plays (LCDs), paper and battery materials; and (3) life sciences, in fields such as
pharmaceuticals, medical care, agricultural chemicals, antibiotics, and pet supplies.
Utilizing our global network, we have established the number one position in the
industry with our ethylene business centering on Asia, our phenol business span-
ning Japan, Asia, Europe, and the U.S., and our worldwide sulfuric acid and agri-
cultural chemicals businesses. We are also the industry leader in the greenhouse
gas emissions credit business, promoting it in such countries as India and South
Africa.
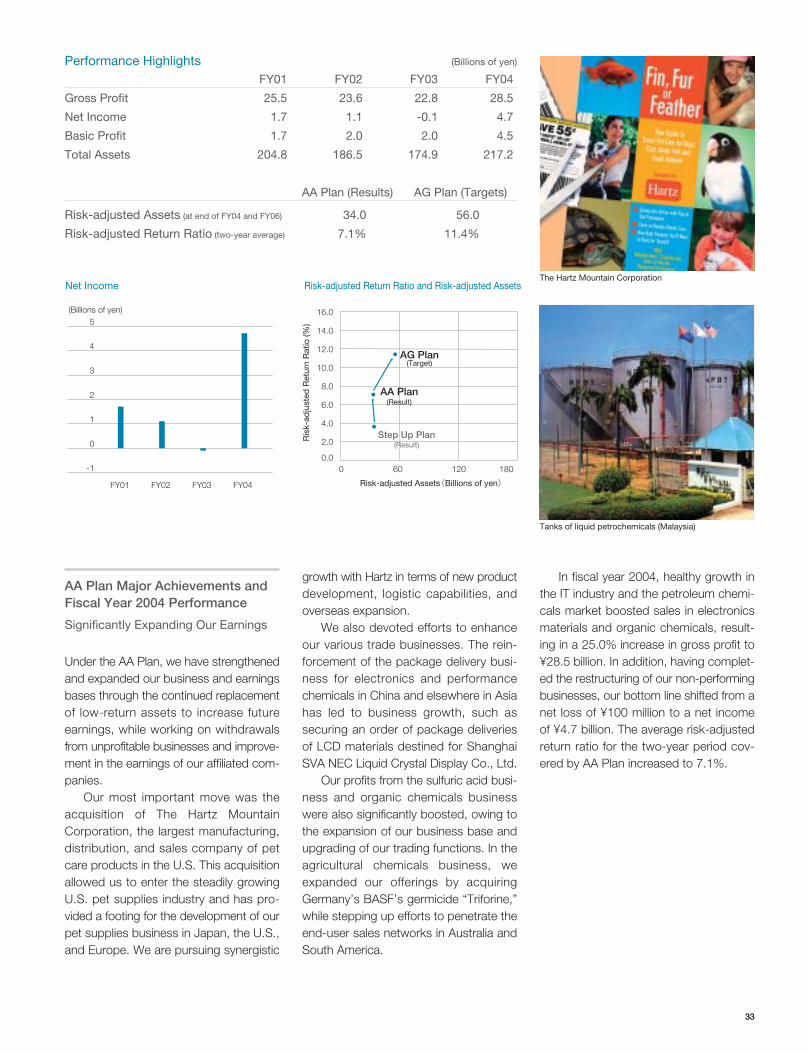
3333
The Hartz Mountain Corporation
Tanks of liquid petrochemicals (Malaysia)
AA Plan Major Achievements andFiscal Year 2004 Performance
Significantly Expanding Our Earnings
Under the AA Plan, we have strengthenedand expanded our business and earningsbases through the continued replacementof low-return assets to increase futureearnings, while working on withdrawalsfrom unprofitable businesses and improve-ment in the earnings of our affiliated com-panies.
Our most important move was theacquisition of The Hartz MountainCorporation, the largest manufacturing,distribution, and sales company of petcare products in the U.S. This acquisitionallowed us to enter the steadily growingU.S. pet supplies industry and has pro-vided a footing for the development of ourpet supplies business in Japan, the U.S.,and Europe. We are pursuing synergistic
growth with Hartz in terms of new productdevelopment, logistic capabilities, andoverseas expansion.
We also devoted efforts to enhanceour various trade businesses. The rein-forcement of the package delivery busi-ness for electronics and performancechemicals in China and elsewhere in Asiahas led to business growth, such assecuring an order of package deliveriesof LCD materials destined for ShanghaiSVA NEC Liquid Crystal Display Co., Ltd.
Our profits from the sulfuric acid busi-ness and organic chemicals businesswere also significantly boosted, owing tothe expansion of our business base andupgrading of our trading functions. In theagricultural chemicals business, weexpanded our offerings by acquiringGermany’s BASF’s germicide “Triforine,”while stepping up efforts to penetrate theend-user sales networks in Australia andSouth America.
In fiscal year 2004, healthy growth inthe IT industry and the petroleum chemi-cals market boosted sales in electronicsmaterials and organic chemicals, result-ing in a 25.0% increase in gross profit to¥28.5 billion. In addition, having complet-ed the restructuring of our non-performingbusinesses, our bottom line shifted from anet loss of ¥100 million to a net incomeof ¥4.7 billion. The average risk-adjustedreturn ratio for the two-year period cov-ered by AA Plan increased to 7.1%.
0 60 120 180
(Billions of yen)
Net Income Risk-adjusted Return Ratio and Risk-adjusted Assets
FY01 FY02 FY03 FY04 Risk-adjusted Assets(Billions of yen)
Ris
k-ad
just
ed R
etur
n R
atio
(%)5
4
3
2
0
1
-1
14.0
12.0
10.0
8.0
6.0
4.0
2.0
0.0
16.0
AA Plan(Result)
Step Up Plan(Result)
AG Plan(Target)
FY01 FY02 FY03 FY04
Gross Profit 25.5 23.6 22.8 28.5
Net Income 1.7 1.1 -0.1 4.7
Basic Profit 1.7 2.0 2.0 4.5
Total Assets 204.8 186.5 174.9 217.2
AA Plan (Results) AG Plan (Targets)
Risk-adjusted Assets (at end of FY04 and FY06) 34.0 56.0
Risk-adjusted Return Ratio (two-year average) 7.1% 11.4%
Performance Highlights (Billions of yen)
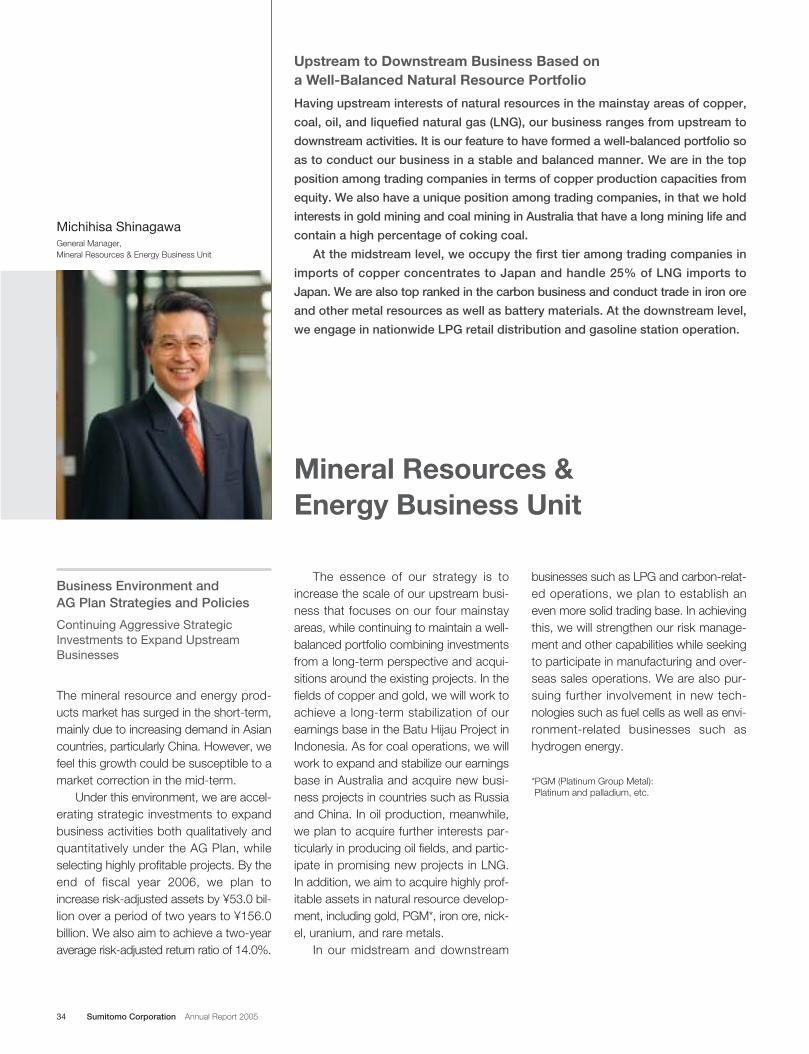
34 Sumitomo Corporation Annual Report 2005
Michihisa ShinagawaGeneral Manager, Mineral Resources & Energy Business Unit
Mineral Resources & Energy Business Unit
Business Environment and AG Plan Strategies and Policies
Continuing Aggressive StrategicInvestments to Expand UpstreamBusinesses
The mineral resource and energy prod-ucts market has surged in the short-term,mainly due to increasing demand in Asiancountries, particularly China. However, wefeel this growth could be susceptible to amarket correction in the mid-term.
Under this environment, we are accel-erating strategic investments to expandbusiness activities both qualitatively andquantitatively under the AG Plan, whileselecting highly profitable projects. By theend of fiscal year 2006, we plan toincrease risk-adjusted assets by ¥53.0 bil-lion over a period of two years to ¥156.0billion. We also aim to achieve a two-yearaverage risk-adjusted return ratio of 14.0%.
The essence of our strategy is toincrease the scale of our upstream busi-ness that focuses on our four mainstayareas, while continuing to maintain a well-balanced portfolio combining investmentsfrom a long-term perspective and acqui-sitions around the existing projects. In thefields of copper and gold, we will work toachieve a long-term stabilization of ourearnings base in the Batu Hijau Project inIndonesia. As for coal operations, we willwork to expand and stabilize our earningsbase in Australia and acquire new busi-ness projects in countries such as Russiaand China. In oil production, meanwhile,we plan to acquire further interests par-ticularly in producing oil fields, and partic-ipate in promising new projects in LNG.In addition, we aim to acquire highly prof-itable assets in natural resource develop-ment, including gold, PGM*, iron ore, nick-el, uranium, and rare metals.
In our midstream and downstream
businesses such as LPG and carbon-relat-ed operations, we plan to establish aneven more solid trading base. In achievingthis, we will strengthen our risk manage-ment and other capabilities while seekingto participate in manufacturing and over-seas sales operations. We are also pur-suing further involvement in new tech-nologies such as fuel cells as well as envi-ronment-related businesses such ashydrogen energy.
*PGM (Platinum Group Metal): Platinum and palladium, etc.
Upstream to Downstream Business Based on a Well-Balanced Natural Resource Portfolio
Having upstream interests of natural resources in the mainstay areas of copper,
coal, oil, and liquefied natural gas (LNG), our business ranges from upstream to
downstream activities. It is our feature to have formed a well-balanced portfolio so
as to conduct our business in a stable and balanced manner. We are in the top
position among trading companies in terms of copper production capacities from
equity. We also have a unique position among trading companies, in that we hold
interests in gold mining and coal mining in Australia that have a long mining life and
contain a high percentage of coking coal.
At the midstream level, we occupy the first tier among trading companies in
imports of copper concentrates to Japan and handle 25% of LNG imports to
Japan. We are also top ranked in the carbon business and conduct trade in iron ore
and other metal resources as well as battery materials. At the downstream level,
we engage in nationwide LPG retail distribution and gasoline station operation.
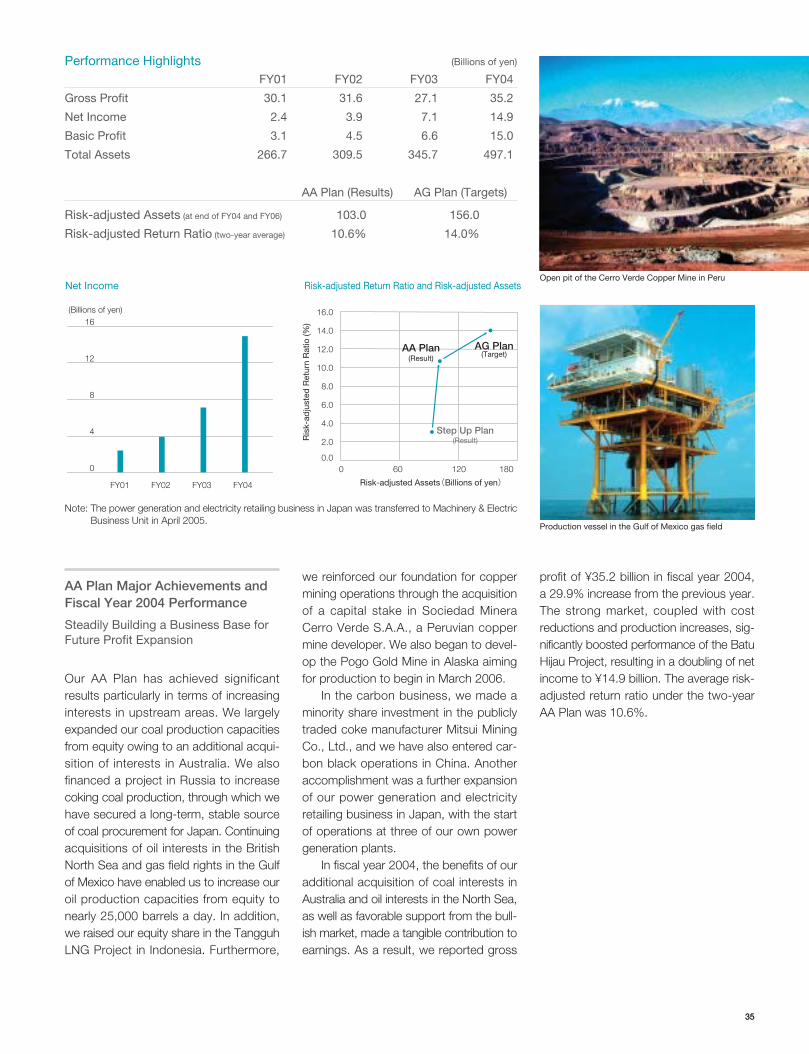
3535
Open pit of the Cerro Verde Copper Mine in Peru
AA Plan Major Achievements andFiscal Year 2004 Performance
Steadily Building a Business Base forFuture Profit Expansion
Our AA Plan has achieved significantresults particularly in terms of increasinginterests in upstream areas. We largelyexpanded our coal production capacitiesfrom equity owing to an additional acqui-sition of interests in Australia. We alsofinanced a project in Russia to increasecoking coal production, through which wehave secured a long-term, stable sourceof coal procurement for Japan. Continuingacquisitions of oil interests in the BritishNorth Sea and gas field rights in the Gulfof Mexico have enabled us to increase ouroil production capacities from equity tonearly 25,000 barrels a day. In addition,we raised our equity share in the TangguhLNG Project in Indonesia. Furthermore,
we reinforced our foundation for coppermining operations through the acquisitionof a capital stake in Sociedad MineraCerro Verde S.A.A., a Peruvian coppermine developer. We also began to devel-op the Pogo Gold Mine in Alaska aimingfor production to begin in March 2006.
In the carbon business, we made aminority share investment in the publiclytraded coke manufacturer Mitsui MiningCo., Ltd., and we have also entered car-bon black operations in China. Anotheraccomplishment was a further expansionof our power generation and electricityretailing business in Japan, with the startof operations at three of our own powergeneration plants.
In fiscal year 2004, the benefits of ouradditional acquisition of coal interests inAustralia and oil interests in the North Sea,as well as favorable support from the bull-ish market, made a tangible contribution toearnings. As a result, we reported gross
profit of ¥35.2 billion in fiscal year 2004,a 29.9% increase from the previous year.The strong market, coupled with costreductions and production increases, sig-nificantly boosted performance of the BatuHijau Project, resulting in a doubling of netincome to ¥14.9 billion. The average risk-adjusted return ratio under the two-yearAA Plan was 10.6%.
Production vessel in the Gulf of Mexico gas field
Note: The power generation and electricity retailing business in Japan was transferred to Machinery & ElectricBusiness Unit in April 2005.
0 60 120 180
(Billions of yen)
Net Income Risk-adjusted Return Ratio and Risk-adjusted Assets
FY01 FY02 FY03 FY04 Risk-adjusted Assets(Billions of yen)
Ris
k-ad
just
ed R
etur
n R
atio
(%)16
12
8
4
0
14.0
12.0
10.0
8.0
6.0
4.0
2.0
0.0
16.0
AA Plan(Result)
Step Up Plan(Result)
AG Plan(Target)
FY01 FY02 FY03 FY04
Gross Profit 30.1 31.6 27.1 35.2
Net Income 2.4 3.9 7.1 14.9
Basic Profit 3.1 4.5 6.6 15.0
Total Assets 266.7 309.5 345.7 497.1
AA Plan (Results) AG Plan (Targets)
Risk-adjusted Assets (at end of FY04 and FY06) 103.0 156.0
Risk-adjusted Return Ratio (two-year average) 10.6% 14.0%
Performance Highlights (Billions of yen)
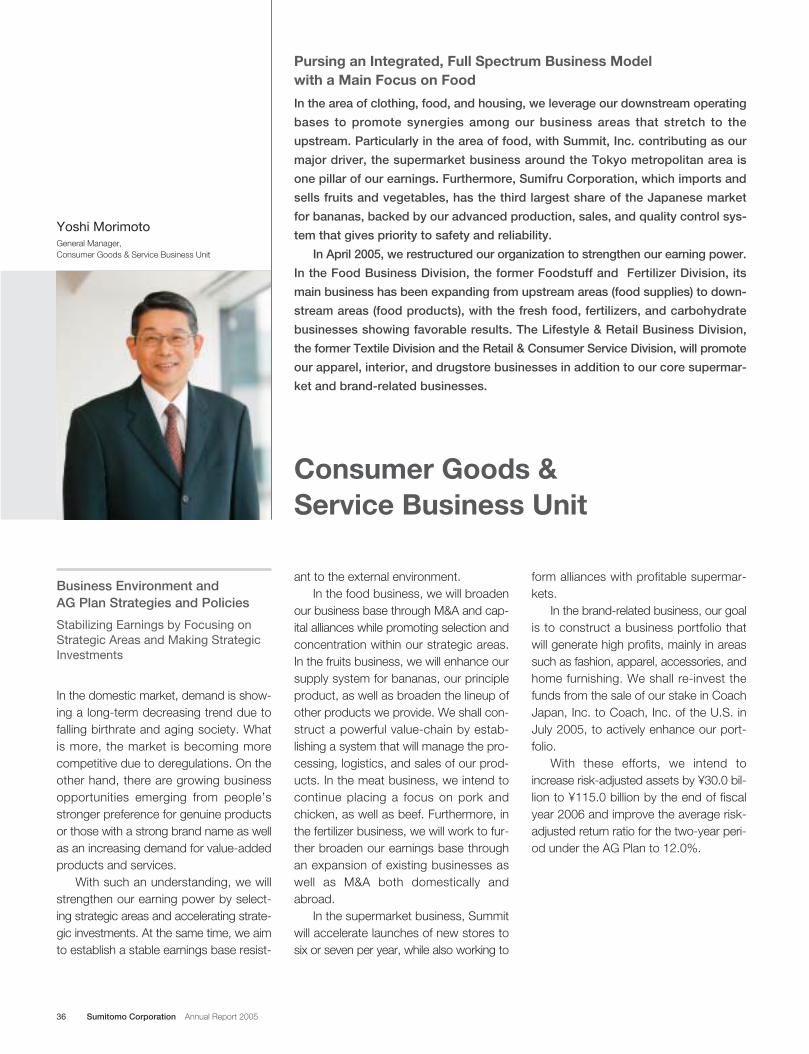
36 Sumitomo Corporation Annual Report 2005
Yoshi MorimotoGeneral Manager, Consumer Goods & Service Business Unit
Consumer Goods & Service Business Unit
Business Environment and AG Plan Strategies and Policies
Stabilizing Earnings by Focusing onStrategic Areas and Making StrategicInvestments
In the domestic market, demand is show-ing a long-term decreasing trend due tofalling birthrate and aging society. Whatis more, the market is becoming morecompetitive due to deregulations. On theother hand, there are growing businessopportunities emerging from people’sstronger preference for genuine productsor those with a strong brand name as wellas an increasing demand for value-addedproducts and services.
With such an understanding, we willstrengthen our earning power by select-ing strategic areas and accelerating strate-gic investments. At the same time, we aimto establish a stable earnings base resist-
ant to the external environment. In the food business, we will broaden
our business base through M&A and cap-ital alliances while promoting selection andconcentration within our strategic areas.In the fruits business, we will enhance oursupply system for bananas, our principleproduct, as well as broaden the lineup ofother products we provide. We shall con-struct a powerful value-chain by estab-lishing a system that will manage the pro-cessing, logistics, and sales of our prod-ucts. In the meat business, we intend tocontinue placing a focus on pork andchicken, as well as beef. Furthermore, inthe fertilizer business, we will work to fur-ther broaden our earnings base throughan expansion of existing businesses aswell as M&A both domestically andabroad.
In the supermarket business, Summitwill accelerate launches of new stores tosix or seven per year, while also working to
form alliances with profitable supermar-kets.
In the brand-related business, our goalis to construct a business portfolio thatwill generate high profits, mainly in areassuch as fashion, apparel, accessories, andhome furnishing. We shall re-invest thefunds from the sale of our stake in CoachJapan, Inc. to Coach, Inc. of the U.S. inJuly 2005, to actively enhance our port-folio.
With these efforts, we intend toincrease risk-adjusted assets by ¥30.0 bil-lion to ¥115.0 billion by the end of fiscalyear 2006 and improve the average risk-adjusted return ratio for the two-year peri-od under the AG Plan to 12.0%.
Pursing an Integrated, Full Spectrum Business Model with a Main Focus on Food
In the area of clothing, food, and housing, we leverage our downstream operating
bases to promote synergies among our business areas that stretch to the
upstream. Particularly in the area of food, with Summit, Inc. contributing as our
major driver, the supermarket business around the Tokyo metropolitan area is
one pillar of our earnings. Furthermore, Sumifru Corporation, which imports and
sells fruits and vegetables, has the third largest share of the Japanese market
for bananas, backed by our advanced production, sales, and quality control sys-
tem that gives priority to safety and reliability.
In April 2005, we restructured our organization to strengthen our earning power.
In the Food Business Division, the former Foodstuff and Fertilizer Division, its
main business has been expanding from upstream areas (food supplies) to down-
stream areas (food products), with the fresh food, fertilizers, and carbohydrate
businesses showing favorable results. The Lifestyle & Retail Business Division,
the former Textile Division and the Retail & Consumer Service Division, will promote
our apparel, interior, and drugstore businesses in addition to our core supermar-
ket and brand-related businesses.
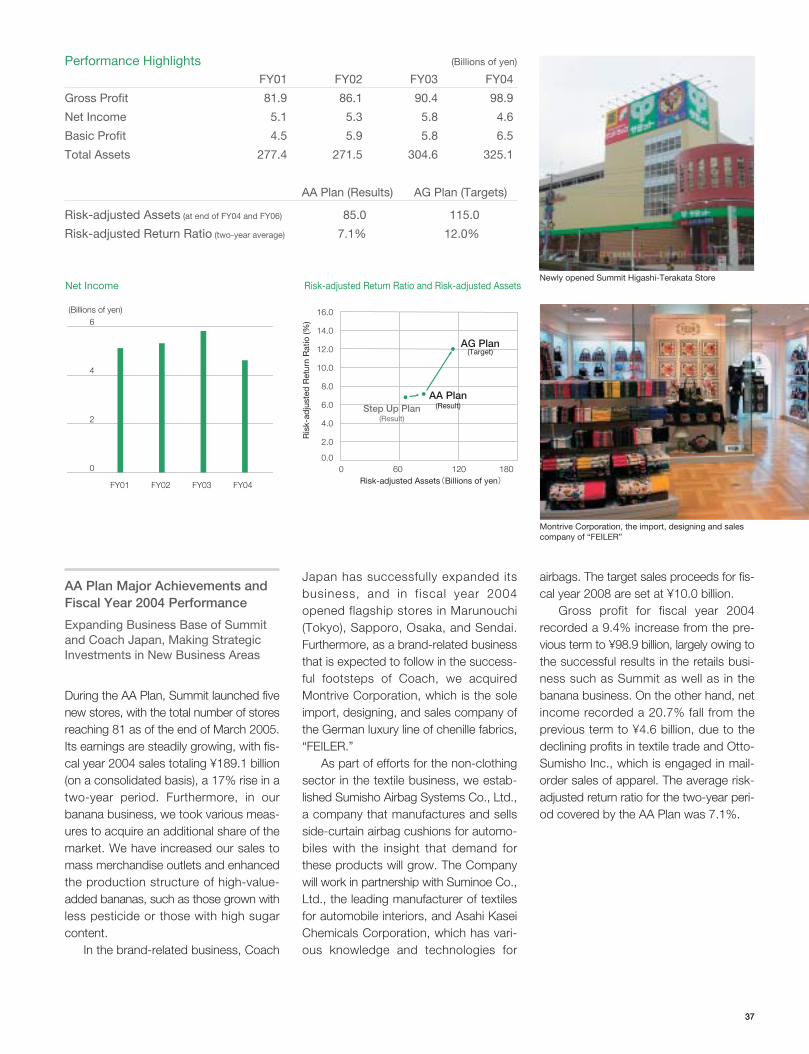
3737
Newly opened Summit Higashi-Terakata Store
Montrive Corporation, the import, designing and salescompany of “FEILER”
AA Plan Major Achievements andFiscal Year 2004 Performance
Expanding Business Base of Summitand Coach Japan, Making StrategicInvestments in New Business Areas
During the AA Plan, Summit launched fivenew stores, with the total number of storesreaching 81 as of the end of March 2005.Its earnings are steadily growing, with fis-cal year 2004 sales totaling ¥189.1 billion(on a consolidated basis), a 17% rise in atwo-year period. Furthermore, in ourbanana business, we took various meas-ures to acquire an additional share of themarket. We have increased our sales tomass merchandise outlets and enhancedthe production structure of high-value-added bananas, such as those grown withless pesticide or those with high sugarcontent.
In the brand-related business, Coach
Japan has successfully expanded itsbusiness, and in f iscal year 2004opened flagship stores in Marunouchi(Tokyo), Sapporo, Osaka, and Sendai.Furthermore, as a brand-related businessthat is expected to follow in the success-ful footsteps of Coach, we acquiredMontrive Corporation, which is the soleimport, designing, and sales company ofthe German luxury line of chenille fabrics,“FEILER.”
As part of efforts for the non-clothingsector in the textile business, we estab-lished Sumisho Airbag Systems Co., Ltd.,a company that manufactures and sellsside-curtain airbag cushions for automo-biles with the insight that demand forthese products will grow. The Companywill work in partnership with Suminoe Co.,Ltd., the leading manufacturer of textilesfor automobile interiors, and Asahi KaseiChemicals Corporation, which has vari-ous knowledge and technologies for
airbags. The target sales proceeds for fis-cal year 2008 are set at ¥10.0 billion.
Gross profit for fiscal year 2004recorded a 9.4% increase from the pre-vious term to ¥98.9 billion, largely owing tothe successful results in the retails busi-ness such as Summit as well as in thebanana business. On the other hand, netincome recorded a 20.7% fall from theprevious term to ¥4.6 billion, due to thedeclining profits in textile trade and Otto-Sumisho Inc., which is engaged in mail-order sales of apparel. The average risk-adjusted return ratio for the two-year peri-od covered by the AA Plan was 7.1%.
0 60 120 180
(Billions of yen)
Net Income Risk-adjusted Return Ratio and Risk-adjusted Assets
FY01 FY02 FY03 FY04 Risk-adjusted Assets(Billions of yen)
Ris
k-ad
just
ed R
etur
n R
atio
(%)6
4
2
0
14.0
12.0
10.0
8.0
6.0
4.0
2.0
0.0
16.0
AA Plan(Result)Step Up Plan
(Result)
AG Plan(Target)
FY01 FY02 FY03 FY04
Gross Profit 81.9 86.1 90.4 98.9
Net Income 5.1 5.3 5.8 4.6
Basic Profit 4.5 5.9 5.8 6.5
Total Assets 277.4 271.5 304.6 325.1
AA Plan (Results) AG Plan (Targets)
Risk-adjusted Assets (at end of FY04 and FY06) 85.0 115.0
Risk-adjusted Return Ratio (two-year average) 7.1% 12.0%
Performance Highlights (Billions of yen)
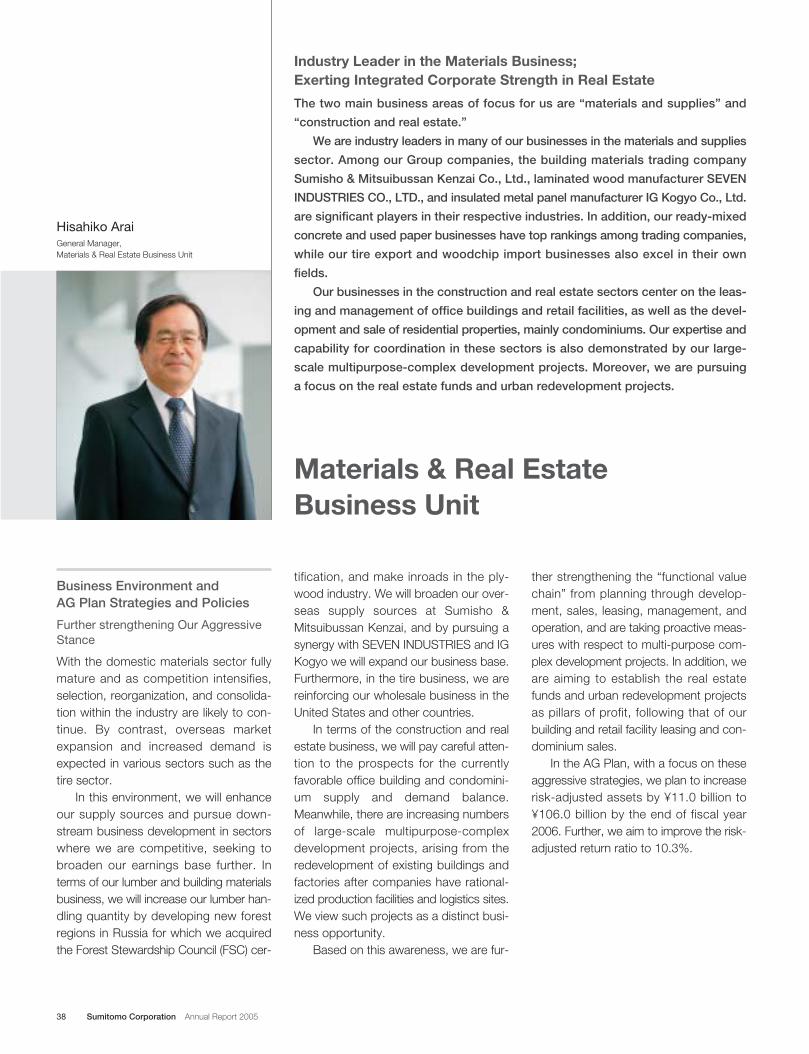
38 Sumitomo Corporation Annual Report 2005
Materials & Real Estate Business Unit
Hisahiko AraiGeneral Manager, Materials & Real Estate Business Unit
Business Environment and AG Plan Strategies and Policies
Further strengthening Our AggressiveStance
With the domestic materials sector fullymature and as competition intensifies,selection, reorganization, and consolida-tion within the industry are likely to con-tinue. By contrast, overseas marketexpansion and increased demand isexpected in various sectors such as thetire sector.
In this environment, we will enhanceour supply sources and pursue down-stream business development in sectorswhere we are competitive, seeking tobroaden our earnings base further. Interms of our lumber and building materialsbusiness, we will increase our lumber han-dling quantity by developing new forestregions in Russia for which we acquiredthe Forest Stewardship Council (FSC) cer-
tification, and make inroads in the ply-wood industry. We will broaden our over-seas supply sources at Sumisho &Mitsuibussan Kenzai, and by pursuing asynergy with SEVEN INDUSTRIES and IGKogyo we will expand our business base.Furthermore, in the tire business, we arereinforcing our wholesale business in theUnited States and other countries.
In terms of the construction and realestate business, we will pay careful atten-tion to the prospects for the currentlyfavorable office building and condomini-um supply and demand balance.Meanwhile, there are increasing numbersof large-scale multipurpose-complexdevelopment projects, arising from theredevelopment of existing buildings andfactories after companies have rational-ized production facilities and logistics sites.We view such projects as a distinct busi-ness opportunity.
Based on this awareness, we are fur-
ther strengthening the “functional valuechain” from planning through develop-ment, sales, leasing, management, andoperation, and are taking proactive meas-ures with respect to multi-purpose com-plex development projects. In addition, weare aiming to establish the real estatefunds and urban redevelopment projectsas pillars of profit, following that of ourbuilding and retail facility leasing and con-dominium sales.
In the AG Plan, with a focus on theseaggressive strategies, we plan to increaserisk-adjusted assets by ¥11.0 billion to¥106.0 billion by the end of fiscal year2006. Further, we aim to improve the risk-adjusted return ratio to 10.3%.
Industry Leader in the Materials Business; Exerting Integrated Corporate Strength in Real Estate
The two main business areas of focus for us are “materials and supplies” and
“construction and real estate.”
We are industry leaders in many of our businesses in the materials and supplies
sector. Among our Group companies, the building materials trading company
Sumisho & Mitsuibussan Kenzai Co., Ltd., laminated wood manufacturer SEVEN
INDUSTRIES CO., LTD., and insulated metal panel manufacturer IG Kogyo Co., Ltd.
are significant players in their respective industries. In addition, our ready-mixed
concrete and used paper businesses have top rankings among trading companies,
while our tire export and woodchip import businesses also excel in their own
fields.
Our businesses in the construction and real estate sectors center on the leas-
ing and management of office buildings and retail facilities, as well as the devel-
opment and sale of residential properties, mainly condominiums. Our expertise and
capability for coordination in these sectors is also demonstrated by our large-
scale multipurpose-complex development projects. Moreover, we are pursuing
a focus on the real estate funds and urban redevelopment projects.
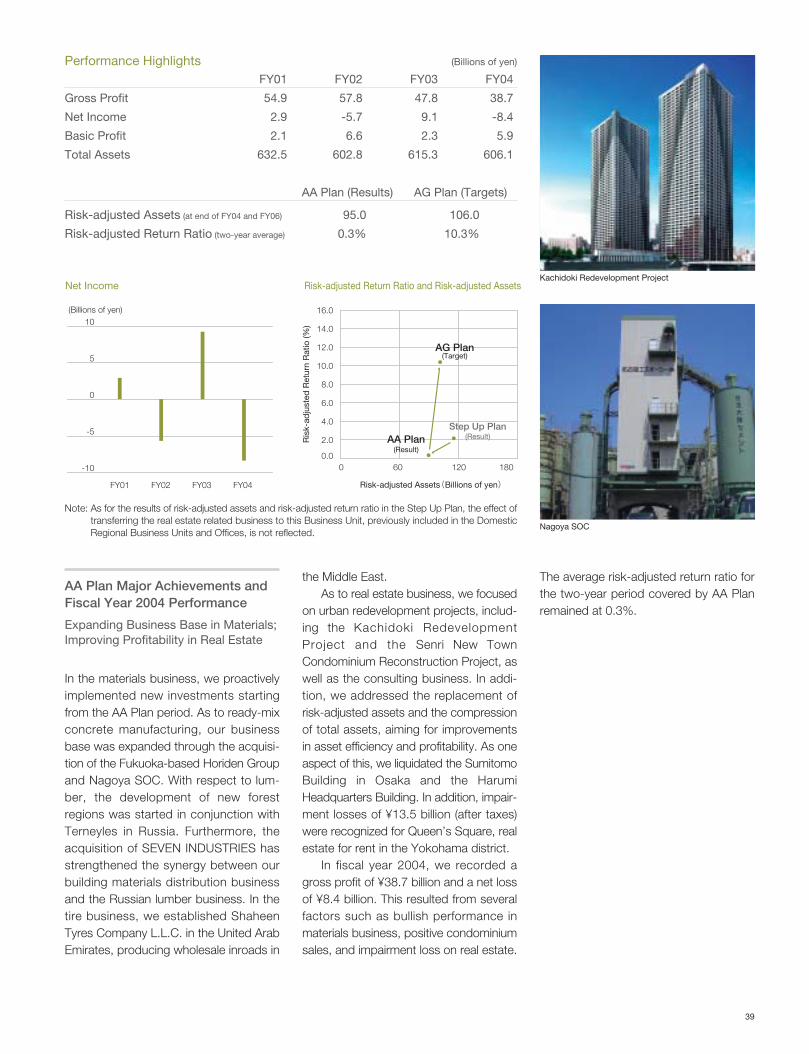
39
Kachidoki Redevelopment Project
Nagoya SOC
AA Plan Major Achievements andFiscal Year 2004 Performance
Expanding Business Base in Materials;Improving Profitability in Real Estate
In the materials business, we proactivelyimplemented new investments startingfrom the AA Plan period. As to ready-mixconcrete manufacturing, our businessbase was expanded through the acquisi-tion of the Fukuoka-based Horiden Groupand Nagoya SOC. With respect to lum-ber, the development of new forestregions was started in conjunction withTerneyles in Russia. Furthermore, theacquisition of SEVEN INDUSTRIES hasstrengthened the synergy between ourbuilding materials distribution businessand the Russian lumber business. In thetire business, we established ShaheenTyres Company L.L.C. in the United ArabEmirates, producing wholesale inroads in
the Middle East.As to real estate business, we focused
on urban redevelopment projects, includ-ing the Kachidoki RedevelopmentProject and the Senri New TownCondominium Reconstruction Project, aswell as the consulting business. In addi-tion, we addressed the replacement ofrisk-adjusted assets and the compressionof total assets, aiming for improvementsin asset efficiency and profitability. As oneaspect of this, we liquidated the SumitomoBuilding in Osaka and the HarumiHeadquarters Building. In addition, impair-ment losses of ¥13.5 billion (after taxes)were recognized for Queen’s Square, realestate for rent in the Yokohama district.
In fiscal year 2004, we recorded agross profit of ¥38.7 billion and a net lossof ¥8.4 billion. This resulted from severalfactors such as bullish performance inmaterials business, positive condominiumsales, and impairment loss on real estate.
The average risk-adjusted return ratio forthe two-year period covered by AA Planremained at 0.3%.
Note: As for the results of risk-adjusted assets and risk-adjusted return ratio in the Step Up Plan, the effect oftransferring the real estate related business to this Business Unit, previously included in the DomesticRegional Business Units and Offices, is not reflected.
0 60 120 180
(Billions of yen)
Net Income Risk-adjusted Return Ratio and Risk-adjusted Assets
FY01 FY02 FY03 FY04 Risk-adjusted Assets(Billions of yen)
Ris
k-ad
just
ed R
etur
n R
atio
(%)10
5
-5
0
-10
14.0
12.0
10.0
8.0
6.0
4.0
2.0
0.0
16.0
AA Plan(Result)
Step Up Plan(Result)
AG Plan(Target)
FY01 FY02 FY03 FY04
Gross Profit 54.9 57.8 47.8 38.7
Net Income 2.9 -5.7 9.1 -8.4
Basic Profit 2.1 6.6 2.3 5.9
Total Assets 632.5 602.8 615.3 606.1
AA Plan (Results) AG Plan (Targets)
Risk-adjusted Assets (at end of FY04 and FY06) 95.0 106.0
Risk-adjusted Return Ratio (two-year average) 0.3% 10.3%
Performance Highlights (Billions of yen)
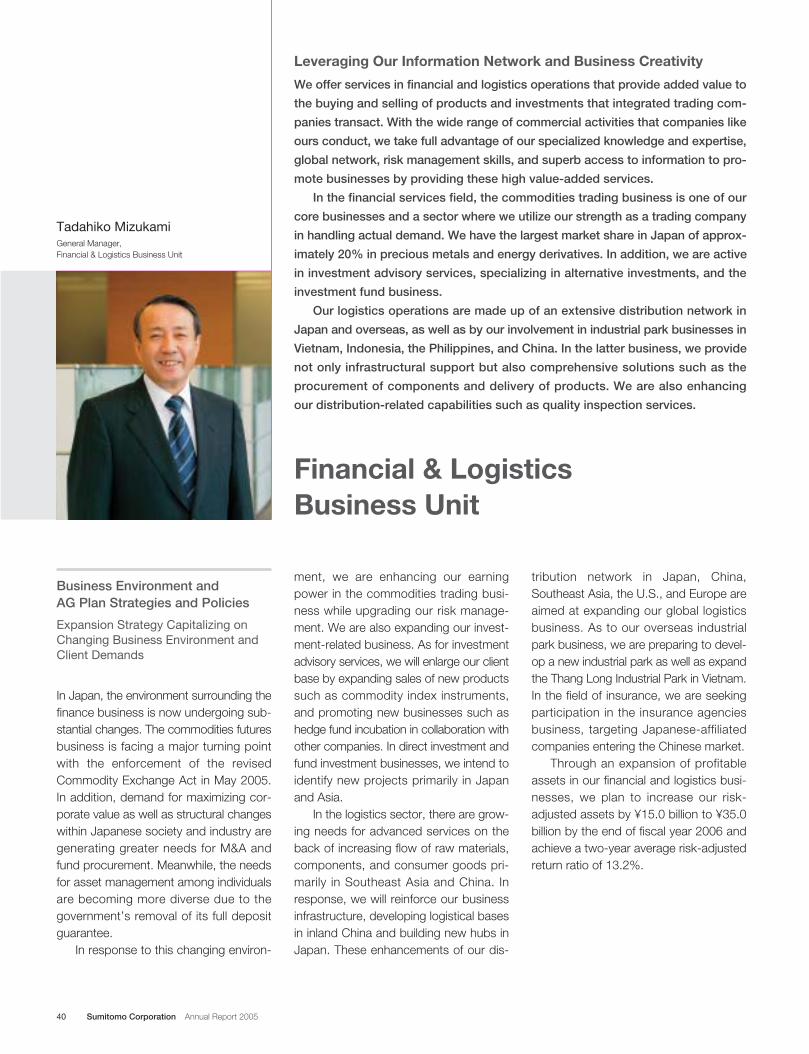
40 Sumitomo Corporation Annual Report 2005
Financial & Logistics Business Unit
Tadahiko MizukamiGeneral Manager, Financial & Logistics Business Unit
Business Environment and AG Plan Strategies and Policies
Expansion Strategy Capitalizing onChanging Business Environment andClient Demands
In Japan, the environment surrounding thefinance business is now undergoing sub-stantial changes. The commodities futuresbusiness is facing a major turning pointwith the enforcement of the revisedCommodity Exchange Act in May 2005.In addition, demand for maximizing cor-porate value as well as structural changeswithin Japanese society and industry aregenerating greater needs for M&A andfund procurement. Meanwhile, the needsfor asset management among individualsare becoming more diverse due to thegovernment’s removal of its full depositguarantee.
In response to this changing environ-
ment, we are enhancing our earningpower in the commodities trading busi-ness while upgrading our risk manage-ment. We are also expanding our invest-ment-related business. As for investmentadvisory services, we will enlarge our clientbase by expanding sales of new productssuch as commodity index instruments,and promoting new businesses such ashedge fund incubation in collaboration withother companies. In direct investment andfund investment businesses, we intend toidentify new projects primarily in Japanand Asia.
In the logistics sector, there are grow-ing needs for advanced services on theback of increasing flow of raw materials,components, and consumer goods pri-marily in Southeast Asia and China. Inresponse, we will reinforce our businessinfrastructure, developing logistical basesin inland China and building new hubs inJapan. These enhancements of our dis-
tribution network in Japan, China,Southeast Asia, the U.S., and Europe areaimed at expanding our global logisticsbusiness. As to our overseas industrialpark business, we are preparing to devel-op a new industrial park as well as expandthe Thang Long Industrial Park in Vietnam.In the field of insurance, we are seekingparticipation in the insurance agenciesbusiness, targeting Japanese-affiliatedcompanies entering the Chinese market.
Through an expansion of profitableassets in our financial and logistics busi-nesses, we plan to increase our risk-adjusted assets by ¥15.0 billion to ¥35.0billion by the end of fiscal year 2006 andachieve a two-year average risk-adjustedreturn ratio of 13.2%.
Leveraging Our Information Network and Business Creativity
We offer services in financial and logistics operations that provide added value to
the buying and selling of products and investments that integrated trading com-
panies transact. With the wide range of commercial activities that companies like
ours conduct, we take full advantage of our specialized knowledge and expertise,
global network, risk management skills, and superb access to information to pro-
mote businesses by providing these high value-added services.
In the financial services field, the commodities trading business is one of our
core businesses and a sector where we utilize our strength as a trading company
in handling actual demand. We have the largest market share in Japan of approx-
imately 20% in precious metals and energy derivatives. In addition, we are active
in investment advisory services, specializing in alternative investments, and the
investment fund business.
Our logistics operations are made up of an extensive distribution network in
Japan and overseas, as well as by our involvement in industrial park businesses in
Vietnam, Indonesia, the Philippines, and China. In the latter business, we provide
not only infrastructural support but also comprehensive solutions such as the
procurement of components and delivery of products. We are also enhancing
our distribution-related capabilities such as quality inspection services.
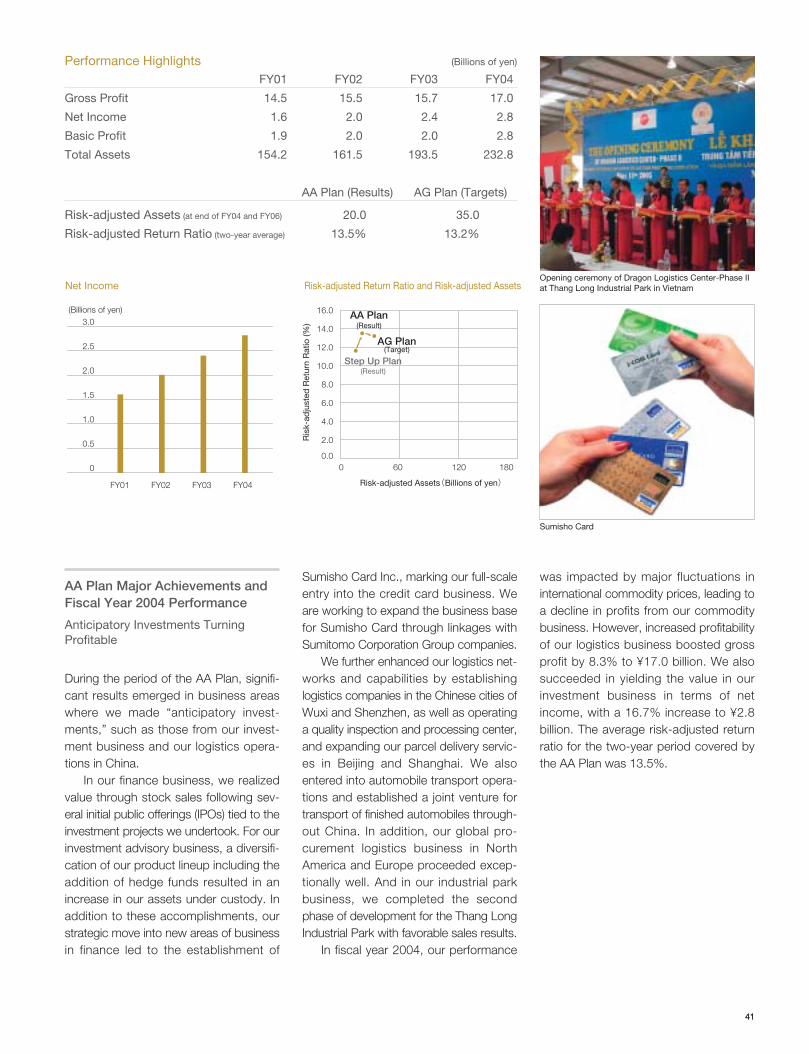
4141
Opening ceremony of Dragon Logistics Center-Phase IIat Thang Long Industrial Park in Vietnam
Sumisho Card
AA Plan Major Achievements andFiscal Year 2004 Performance
Anticipatory Investments Turning Profitable
During the period of the AA Plan, signifi-cant results emerged in business areaswhere we made “anticipatory invest-ments,” such as those from our invest-ment business and our logistics opera-tions in China.
In our finance business, we realizedvalue through stock sales following sev-eral initial public offerings (IPOs) tied to theinvestment projects we undertook. For ourinvestment advisory business, a diversifi-cation of our product lineup including theaddition of hedge funds resulted in anincrease in our assets under custody. Inaddition to these accomplishments, ourstrategic move into new areas of businessin finance led to the establishment of
Sumisho Card Inc., marking our full-scaleentry into the credit card business. Weare working to expand the business basefor Sumisho Card through linkages withSumitomo Corporation Group companies.
We further enhanced our logistics net-works and capabilities by establishinglogistics companies in the Chinese cities ofWuxi and Shenzhen, as well as operatinga quality inspection and processing center,and expanding our parcel delivery servic-es in Beijing and Shanghai. We alsoentered into automobile transport opera-tions and established a joint venture fortransport of finished automobiles through-out China. In addition, our global pro-curement logistics business in NorthAmerica and Europe proceeded excep-tionally well. And in our industrial parkbusiness, we completed the secondphase of development for the Thang LongIndustrial Park with favorable sales results.
In fiscal year 2004, our performance
was impacted by major fluctuations ininternational commodity prices, leading toa decline in profits from our commoditybusiness. However, increased profitabilityof our logistics business boosted grossprofit by 8.3% to ¥17.0 billion. We alsosucceeded in yielding the value in ourinvestment business in terms of netincome, with a 16.7% increase to ¥2.8billion. The average risk-adjusted returnratio for the two-year period covered bythe AA Plan was 13.5%.
0 60 120 180
(Billions of yen)
Net Income
Risk-adjusted Assets(Billions of yen)
Risk-adjusted Return Ratio and Risk-adjusted Assets
FY01 FY02 FY03 FY04
Ris
k-ad
just
ed R
etur
n R
atio
(%)3.0
2.5
2.0
1.5
1.0
0.5
0
14.0
12.0
10.0
8.0
6.0
4.0
2.0
0.0
16.0 AA Plan(Result)
Step Up Plan(Result)
AG Plan(Target)
FY01 FY02 FY03 FY04
Gross Profit 14.5 15.5 15.7 17.0
Net Income 1.6 2.0 2.4 2.8
Basic Profit 1.9 2.0 2.0 2.8
Total Assets 154.2 161.5 193.5 232.8
AA Plan (Results) AG Plan (Targets)
Risk-adjusted Assets (at end of FY04 and FY06) 20.0 35.0
Risk-adjusted Return Ratio (two-year average) 13.5% 13.2%
Performance Highlights (Billions of yen)
42 Sumitomo Corporation Annual Report 2005
Region-wide business division system
EuropeWide-zone operations under General Manager for CIS
CIS
Region-wide business division system introduced in January 2005
China Region-wide business division system
Americas
General Manager for South America appointed (under General Manager for Americas) in January 2005
South America
Enhanced collaboration among offices in the region
Middle East
General Manger for Southeast Asia appointed in April 2005
Southeast Asia
Global Strategy
Promoting Globalization
Sumitomo Corporation’s global network, encompassing 150 busi-
ness operations (26 in Japan and 124 overseas) and more than 800
consolidated companies worldwide, is a key foundation underpin-
ning our integrated corporate strength. We have nine Business Units
involved in varying fields, as well as regional organizations covering
Japan and overseas. The Business Units and regional organizations
work together to pursue business opportunities globally.
Our growth strategy, which follows from the AA Plan to the AG
Plan, is to expedite expansion of our earnings base on a global
scale. The objectives to achieve this are to reinforce mutual ties
under a common strategy between Business Units and regional
organizations so that total benefits reaped are more valuable than
the sum of their parts. The other is to formulate strategies based on
global perspectives and optimally allocating management resources
in order to maximize our strength. Interaction between Business
Units and regional organizations is becoming more important from
the perspective of ensuring proper internal controls of the Group as
a whole, including consolidated companies.
Our domestic and overseas regional organizations play a very
important role in devising growth strategies tailored to their specific
regional attributes—by seizing growth momentum in their respective
markets—and in taking a multifaceted approach to local business
partners. In order to further broaden our business base and ensure
more dynamic growth, we will strive to develop locally based global
businesses in each country and region. At the same time, our
domestic and overseas subsidiaries and other operations will accord
high importance to maintaining a strong corporate presence with
close ties to local communities.
To address various issues in this regard, we set up the
“Globalization Promotion Committee” under the AA Plan. The
Committee works with the Business Units which develop global
product strategies in each business field, and with our regional
organizations which maintain close local ties, with the aim of “rein-
forcing earnings based on an integration of regional and product
strategies.” Thus, we have been working to strengthen ties between
Business Units and regional organizations and reinforce the capabili-
ties of regional organizations.
For example, when forming management plans by segment, we
have endeavored to clarify and share our global strategies across all
Business Units by blending Business Unit strategies with the basic
policies of each regional organization. On the structural side, we
have adopted region-wide business division systems based on a
horizontal unification of operations by product. We have also
strengthened our operations by appointing general managers for
each region. In addition, we have encouraged regional organizations
to participate in the management of companies belonging to
Business Units. At the business front level, we have been strength-
ening capabilities of local staff in overseas operations and promoting
them to management positions, while reinforcing our support infra-
structure by upgrading our global intranet. In these ways, we are
pursuing progressive initiatives at all levels, from company-wide to
business fronts.
Through the initiatives taken under the AA Plan, our information-
sharing has advanced and businesses cooperated between
Business Units and regional organizations are increasing. Under the
AG Plan, we will continue with these actions so that regional organi-
zations will further proactively contribute to expansion of our earn-
ings base.
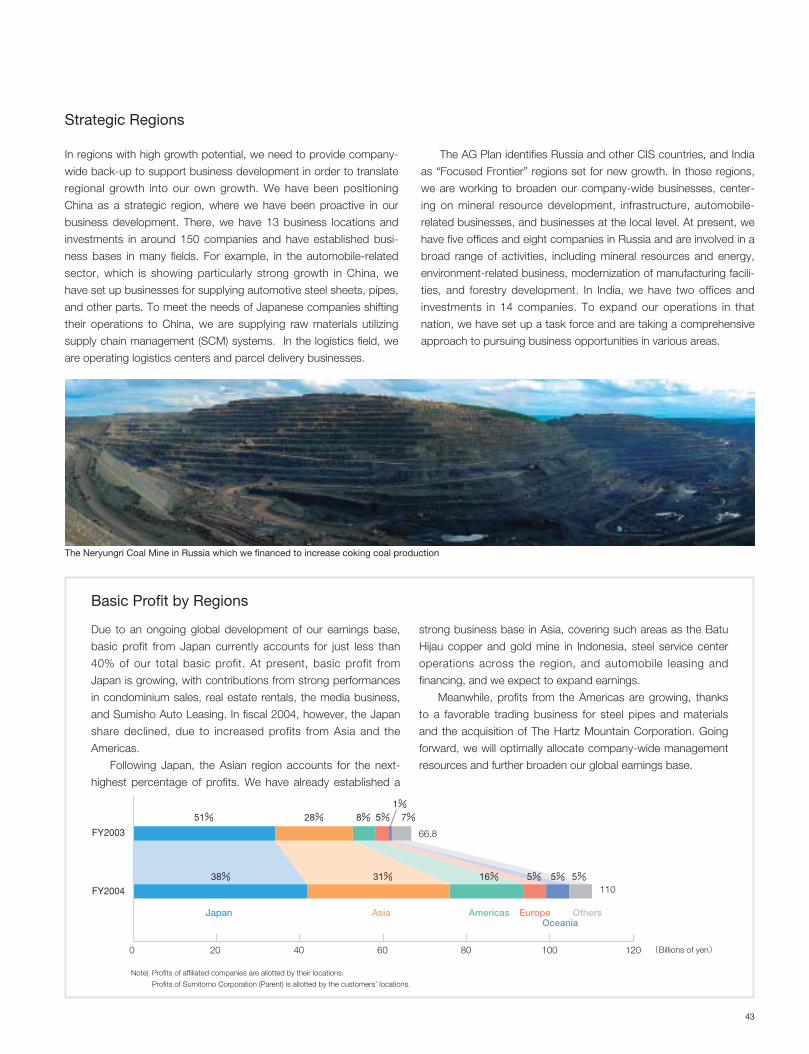
43
In regions with high growth potential, we need to provide company-
wide back-up to support business development in order to translate
regional growth into our own growth. We have been positioning
China as a strategic region, where we have been proactive in our
business development. There, we have 13 business locations and
investments in around 150 companies and have established busi-
ness bases in many fields. For example, in the automobile-related
sector, which is showing particularly strong growth in China, we
have set up businesses for supplying automotive steel sheets, pipes,
and other parts. To meet the needs of Japanese companies shifting
their operations to China, we are supplying raw materials utilizing
supply chain management (SCM) systems. In the logistics field, we
are operating logistics centers and parcel delivery businesses.
The AG Plan identifies Russia and other CIS countries, and India
as “Focused Frontier” regions set for new growth. In those regions,
we are working to broaden our company-wide businesses, center-
ing on mineral resource development, infrastructure, automobile-
related businesses, and businesses at the local level. At present, we
have five offices and eight companies in Russia and are involved in a
broad range of activities, including mineral resources and energy,
environment-related business, modernization of manufacturing facili-
ties, and forestry development. In India, we have two offices and
investments in 14 companies. To expand our operations in that
nation, we have set up a task force and are taking a comprehensive
approach to pursuing business opportunities in various areas.
Strategic Regions
66.8
51%
38%
Japan Asia Americas Europe OthersOceania
31% 16% 5% 5% 5%
28% 8% 5% 1% 7%
FY2003
FY2004
Note) Profits of affiliated companies are allotted by their locations.
Profits of Sumitomo Corporation (Parent) is allotted by the customers’ locations.
(Billions of yen)
110
0 12010080604020
Basic Profit by Regions
Due to an ongoing global development of our earnings base,
basic profit from Japan currently accounts for just less than
40% of our total basic profit. At present, basic profit from
Japan is growing, with contributions from strong performances
in condominium sales, real estate rentals, the media business,
and Sumisho Auto Leasing. In fiscal 2004, however, the Japan
share declined, due to increased profits from Asia and the
Americas.
Following Japan, the Asian region accounts for the next-
highest percentage of profits. We have already established a
strong business base in Asia, covering such areas as the Batu
Hijau copper and gold mine in Indonesia, steel service center
operations across the region, and automobile leasing and
financing, and we expect to expand earnings.
Meanwhile, profits from the Americas are growing, thanks
to a favorable trading business for steel pipes and materials
and the acquisition of The Hartz Mountain Corporation. Going
forward, we will optimally allocate company-wide management
resources and further broaden our global earnings base.
The Neryungri Coal Mine in Russia which we financed to increase coking coal production
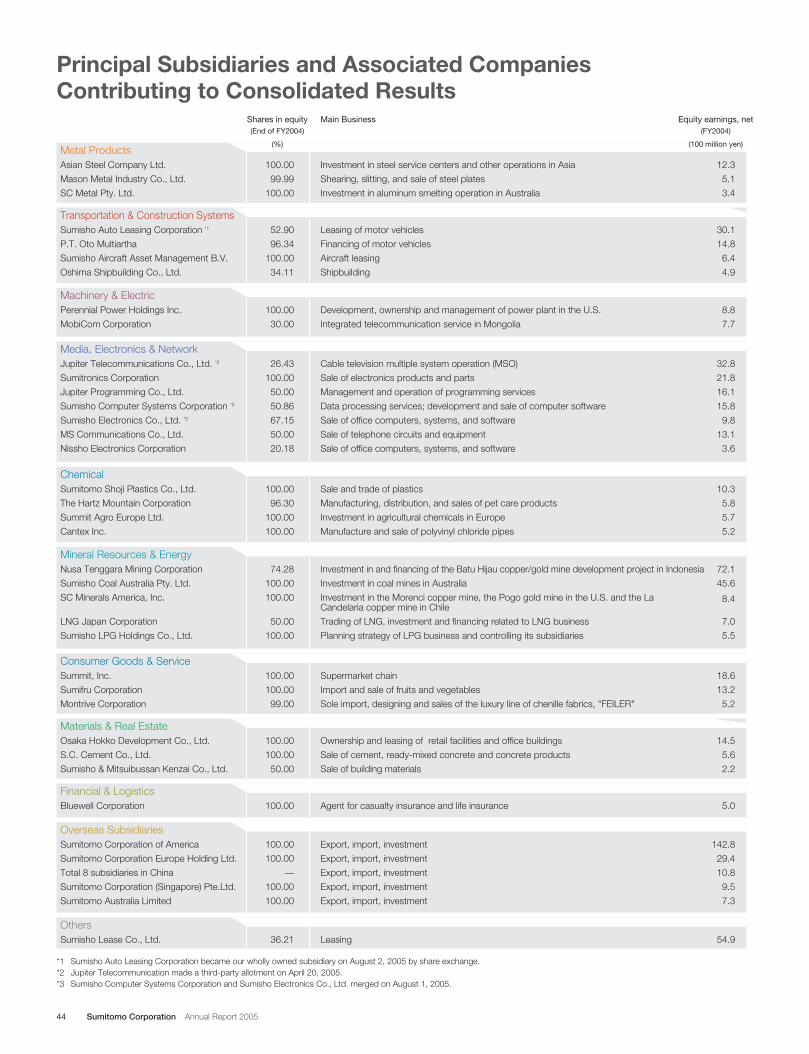
44 Sumitomo Corporation Annual Report 2005
Principal Subsidiaries and Associated Companies Contributing to Consolidated Results
Metal ProductsAsian Steel Company Ltd. 100.00 Investment in steel service centers and other operations in Asia 12.3
Mason Metal Industry Co., Ltd. 99.99 Shearing, slitting, and sale of steel plates 5.1
SC Metal Pty. Ltd. 100.00 Investment in aluminum smelting operation in Australia 3.4
Transportation & Construction SystemsSumisho Auto Leasing Corporation *1 52.90 Leasing of motor vehicles 30.1
P.T. Oto Multiartha 96.34 Financing of motor vehicles 14.8
Sumisho Aircraft Asset Management B.V. 100.00 Aircraft leasing 6.4
Oshima Shipbuilding Co., Ltd. 34.11 Shipbuilding 4.9
Machinery & ElectricPerennial Power Holdings Inc. 100.00 Development, ownership and management of power plant in the U.S. 8.8
MobiCom Corporation 30.00 Integrated telecommunication service in Mongolia 7.7
Media, Electronics & NetworkJupiter Telecommunications Co., Ltd. *2 26.43 Cable television multiple system operation (MSO) 32.8
Sumitronics Corporation 100.00 Sale of electronics products and parts 21.8
Jupiter Programming Co., Ltd. 50.00 Management and operation of programming services 16.1
Sumisho Computer Systems Corporation *3 50.86 Data processing services; development and sale of computer software 15.8
Sumisho Electronics Co., Ltd. *3 67.15 Sale of office computers, systems, and software 9.8
MS Communications Co., Ltd. 50.00 Sale of telephone circuits and equipment 13.1
Nissho Electronics Corporation 20.18 Sale of office computers, systems, and software 3.6
ChemicalSumitomo Shoji Plastics Co., Ltd. 100.00 Sale and trade of plastics 10.3
The Hartz Mountain Corporation 96.30 Manufacturing, distribution, and sales of pet care products 5.8
Summit Agro Europe Ltd. 100.00 Investment in agricultural chemicals in Europe 5.7
Cantex Inc. 100.00 Manufacture and sale of polyvinyl chloride pipes 5.2
Mineral Resources & EnergyNusa Tenggara Mining Corporation 74.28 Investment in and financing of the Batu Hijau copper/gold mine development project in Indonesia 72.1
Sumisho Coal Australia Pty. Ltd. 100.00 Investment in coal mines in Australia 45.6
SC Minerals America, Inc. 100.00 Investment in the Morenci copper mine, the Pogo gold mine in the U.S. and the La Candelaria copper mine in Chile
8.4
LNG Japan Corporation 50.00 Trading of LNG, investment and financing related to LNG business 7.0
Sumisho LPG Holdings Co., Ltd. 100.00 Planning strategy of LPG business and controlling its subsidiaries 5.5
Consumer Goods & ServiceSummit, Inc. 100.00 Supermarket chain 18.6
Sumifru Corporation 100.00 Import and sale of fruits and vegetables 13.2
Montrive Corporation 99.00 Sole import, designing and sales of the luxury line of chenille fabrics, "FEILER" 5.2
Materials & Real EstateOsaka Hokko Development Co., Ltd. 100.00 Ownership and leasing of retail facilities and office buildings 14.5
S.C. Cement Co., Ltd. 100.00 Sale of cement, ready-mixed concrete and concrete products 5.6
Sumisho & Mitsuibussan Kenzai Co., Ltd. 50.00 Sale of building materials 2.2
Financial & LogisticsBluewell Corporation 100.00 Agent for casualty insurance and life insurance 5.0
Overseas SubsidiariesSumitomo Corporation of America 100.00 Export, import, investment 142.8
Sumitomo Corporation Europe Holding Ltd. 100.00 Export, import, investment 29.4
Total 8 subsidiaries in China — Export, import, investment 10.8
Sumitomo Corporation (Singapore) Pte.Ltd. 100.00 Export, import, investment 9.5
Sumitomo Australia Limited 100.00 Export, import, investment 7.3
OthersSumisho Lease Co., Ltd. 36.21 Leasing 54.9
Shares in equity Main Business Equity earnings, net(End of FY2004) (FY2004)
(%) (100 million yen)
*1 Sumisho Auto Leasing Corporation became our wholly owned subsidiary on August 2, 2005 by share exchange.*2 Jupiter Telecommunication made a third-party allotment on April 20, 2005.*3 Sumisho Computer Systems Corporation and Sumisho Electronics Co., Ltd. merged on August 1, 2005.
4545
Sumitomo Corporation’sManagement System
Maintaining Growth and Stability Together
— Our Management System
Will Continue to Evolve
To achieve dynamic growth, not only further expanding our
business base but also recruitment, training, and utilization of
the human resources who support it are also essential.
Moreover, we need to further reinforce our “defense” simulta-
neously with accelerating our “offense.” We will thereby con-
tinually work to attain full compliance awareness, advance
risk management, and improve business quality and efficien-
cy. At the same time, we will promote the enhancement of
our governance framework and the introduction of an internal
control system to further upgrade our auditing and checking
functions. Through these efforts, we will manage our busi-
ness in a sound manner, considering environmental friendli-
ness and contributions to society.
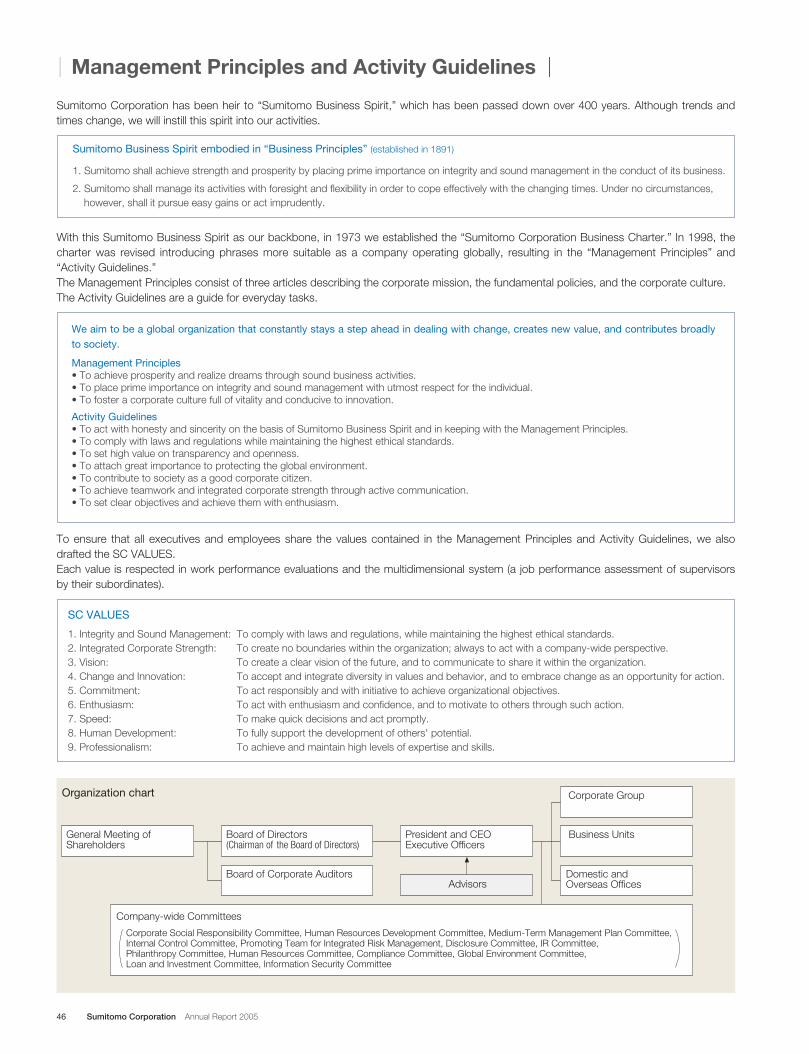
46 Sumitomo Corporation Annual Report 2005
Management Principles and Activity Guidelines
Sumitomo Business Spirit embodied in “Business Principles” (established in 1891)
1. Sumitomo shall achieve strength and prosperity by placing prime importance on integrity and sound management in the conduct of its business.
2. Sumitomo shall manage its activities with foresight and flexibility in order to cope effectively with the changing times. Under no circumstances,however, shall it pursue easy gains or act imprudently.
General Meeting of Shareholders
Board of Corporate Auditors
Board of Directors (Chairman of the Board of Directors)
President and CEOExecutive Officers
Advisors
Corporate Group
Business Units
Domestic and Overseas Offices
Organization chart
Company-wide Committees
Corporate Social Responsibility Committee, Human Resources Development Committee, Medium-Term Management Plan Committee, Internal Control Committee, Promoting Team for Integrated Risk Management, Disclosure Committee, IR Committee, Philanthropy Committee, Human Resources Committee, Compliance Committee, Global Environment Committee, Loan and Investment Committee, Information Security Committee
With this Sumitomo Business Spirit as our backbone, in 1973 we established the “Sumitomo Corporation Business Charter.” In 1998, thecharter was revised introducing phrases more suitable as a company operating globally, resulting in the “Management Principles” and“Activity Guidelines.”The Management Principles consist of three articles describing the corporate mission, the fundamental policies, and the corporate culture.The Activity Guidelines are a guide for everyday tasks.
Sumitomo Corporation has been heir to “Sumitomo Business Spirit,” which has been passed down over 400 years. Although trends andtimes change, we will instill this spirit into our activities.
We aim to be a global organization that constantly stays a step ahead in dealing with change, creates new value, and contributes broadlyto society.
Management Principles • To achieve prosperity and realize dreams through sound business activities. • To place prime importance on integrity and sound management with utmost respect for the individual.• To foster a corporate culture full of vitality and conducive to innovation.
Activity Guidelines• To act with honesty and sincerity on the basis of Sumitomo Business Spirit and in keeping with the Management Principles. • To comply with laws and regulations while maintaining the highest ethical standards. • To set high value on transparency and openness.• To attach great importance to protecting the global environment. • To contribute to society as a good corporate citizen. • To achieve teamwork and integrated corporate strength through active communication.• To set clear objectives and achieve them with enthusiasm.
To ensure that all executives and employees share the values contained in the Management Principles and Activity Guidelines, we alsodrafted the SC VALUES.Each value is respected in work performance evaluations and the multidimensional system (a job performance assessment of supervisorsby their subordinates).
SC VALUES
1. Integrity and Sound Management: To comply with laws and regulations, while maintaining the highest ethical standards.2. Integrated Corporate Strength: To create no boundaries within the organization; always to act with a company-wide perspective.3. Vision: To create a clear vision of the future, and to communicate to share it within the organization.4. Change and Innovation: To accept and integrate diversity in values and behavior, and to embrace change as an opportunity for action.5. Commitment: To act responsibly and with initiative to achieve organizational objectives.6. Enthusiasm: To act with enthusiasm and confidence, and to motivate to others through such action.7. Speed: To make quick decisions and act promptly.8. Human Development: To fully support the development of others' potential.9. Professionalism: To achieve and maintain high levels of expertise and skills.
47
Corporate Governance
Basic Principles
We have stipulated in our Corporate Governance Principles
(established in April 2003) that, ultimately, we view corporate gov-
ernance as “improving management efficiency” and “maintaining
sound management,” as well as “securing a high level of manage-
ment transparency” required to achieve the first two goals.
Framework and Operation
At Sumitomo Corporation, the General Meeting of Shareholders
serves as the Company’s supreme decision-making body, under
which the Board of Directors makes important business decisions
and the Board of Corporate Auditors monitors the performance of
directors. Moreover, we are introducing diverse management per-
spectives from external advisors as well as external corporate
auditors.
uEnhancement of the Corporate Auditing Framework
The Board of Corporate Auditors together with the Board of
Directors monitors the performance of directors. It is made up of
five corporate auditors, of which three are external (two legal
experts and one accounting expert), and practices an auditing
framework with diverse perspectives. Corporate auditors attend
all important internal meetings and exchange opinions monthly
on material issues regarding management policy and auditing
with the Chairman of the Board of Directors and the President
and CEO. Furthermore, to ensure that the auditing system func-
tions effectively, we have developed an assistance framework
for the corporate auditors, and the Internal Auditing Department
frequently provides information.
uAppointment of External Advisors
To incorporate outside perspectives into our management deci-
sion making, we have formed a team of external advisors con-
sisting of four specialists, which includes women and foreign
nationals. At semiannual meetings with the Board members, the
external advisors provide us with advice from diverse perspec-
tives on various themes regarding management issues. They
also give us speeches and lectures in the areas of each advi-
sor’s expertise, such as leadership and career development.
Enhancement of Corporate Auditing Framework and Introduction of Diverse Perspectives in Management
uRightsizing the Board of Directors
The number of Board members was halved from 24 in June 2003
in order to facilitate substantial and active discussions as well as
to promote greater efficiency and effectiveness in decision mak-
ing. The number of Board members as of July 2005 is 13.
Furthermore, the term of directors was reduced from two
years to one year at the General Meeting of Shareholders in
June 2005.
uIntroduction of the Executive Officer System
We have introduced the executive officer system with the aim of
clarifying the responsibility and authority of execution as well as
strengthening the Board of Directors’ monitoring function. By
having Business Unit General Managers concurrently serve as
executive officers and Board members, we aim to prevent gaps
between decisions made at Board of Directors meetings and
the execution of those decisions.
uTerm Limits for the Chairman of the Board of Directors and
the President and CEO
In principle, we have established six years as the maximum term
for the Chairman of the Board of Directors and the President
and CEO. We have thus eliminated the possibility of governance
problems by limiting the tenure of top management.
Basic Policy on Information Disclosure
The Corporate Governance Principles stipulates that “in an effort
to bring an accurate understanding of the company’s manage-
ment policies and business activities to all stakeholders, the com-
pany shall strive to make full disclosure, not limiting itself to the
disclosure of information required by law, but also actively pursu-
ing the voluntary disclosure of information.”
In line with this policy, we established the Information
Disclosure Committee in April 2005. The Committee will be
responsible for gathering important information that shall be dis-
closed and considering policy governing its disclosure, and for
raising awareness among our groups on information disclosure.
We are striving to build an optimal corporate governance framework by taking into consideration changes to Japan’sCommercial Code and by observing the benefits of corporate governance frameworks in other countries, while preservingthe positive aspects of traditional Japanese corporate management principles.
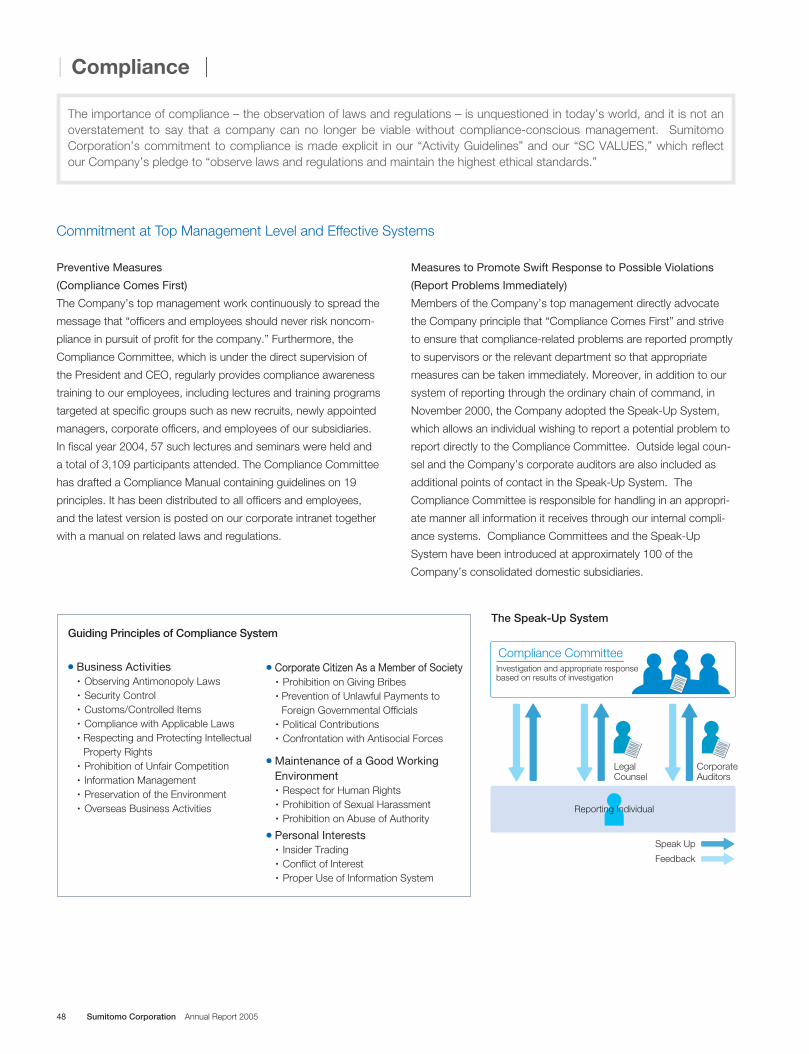
48 Sumitomo Corporation Annual Report 2005
The importance of compliance – the observation of laws and regulations – is unquestioned in today’s world, and it is not anoverstatement to say that a company can no longer be viable without compliance-conscious management. SumitomoCorporation’s commitment to compliance is made explicit in our “Activity Guidelines” and our “SC VALUES,” which reflectour Company’s pledge to “observe laws and regulations and maintain the highest ethical standards.”
Compliance
Preventive Measures
(Compliance Comes First)
The Company’s top management work continuously to spread the
message that “officers and employees should never risk noncom-
pliance in pursuit of profit for the company.” Furthermore, the
Compliance Committee, which is under the direct supervision of
the President and CEO, regularly provides compliance awareness
training to our employees, including lectures and training programs
targeted at specific groups such as new recruits, newly appointed
managers, corporate officers, and employees of our subsidiaries.
In fiscal year 2004, 57 such lectures and seminars were held and
a total of 3,109 participants attended. The Compliance Committee
has drafted a Compliance Manual containing guidelines on 19
principles. It has been distributed to all officers and employees,
and the latest version is posted on our corporate intranet together
with a manual on related laws and regulations.
Commitment at Top Management Level and Effective Systems
Measures to Promote Swift Response to Possible Violations
(Report Problems Immediately)
Members of the Company’s top management directly advocate
the Company principle that “Compliance Comes First” and strive
to ensure that compliance-related problems are reported promptly
to supervisors or the relevant department so that appropriate
measures can be taken immediately. Moreover, in addition to our
system of reporting through the ordinary chain of command, in
November 2000, the Company adopted the Speak-Up System,
which allows an individual wishing to report a potential problem to
report directly to the Compliance Committee. Outside legal coun-
sel and the Company’s corporate auditors are also included as
additional points of contact in the Speak-Up System. The
Compliance Committee is responsible for handling in an appropri-
ate manner all information it receives through our internal compli-
ance systems. Compliance Committees and the Speak-Up
System have been introduced at approximately 100 of the
Company’s consolidated domestic subsidiaries.
Compliance Committee Investigation and appropriate response based on results of investigation
Reporting Individual
Feedback
Speak Up
Legal Counsel
Corporate Auditors
Guiding Principles of Compliance SystemThe Speak-Up System
● Business Activities・Observing Antimonopoly Laws・Security Control・Customs/Controlled Items・Compliance with Applicable Laws・Respecting and Protecting Intellectual
Property Rights・Prohibition of Unfair Competition・ Information Management・Preservation of the Environment・Overseas Business Activities
● Corporate Citizen As a Member of Society・Prohibition on Giving Bribes・Prevention of Unlawful Payments to
Foreign Governmental Officials・Political Contributions・Confrontation with Antisocial Forces
● Maintenance of a Good WorkingEnvironment・Respect for Human Rights・Prohibition of Sexual Harassment・Prohibition on Abuse of Authority
● Personal Interests・ Insider Trading・Conflict of Interest・Proper Use of Information System
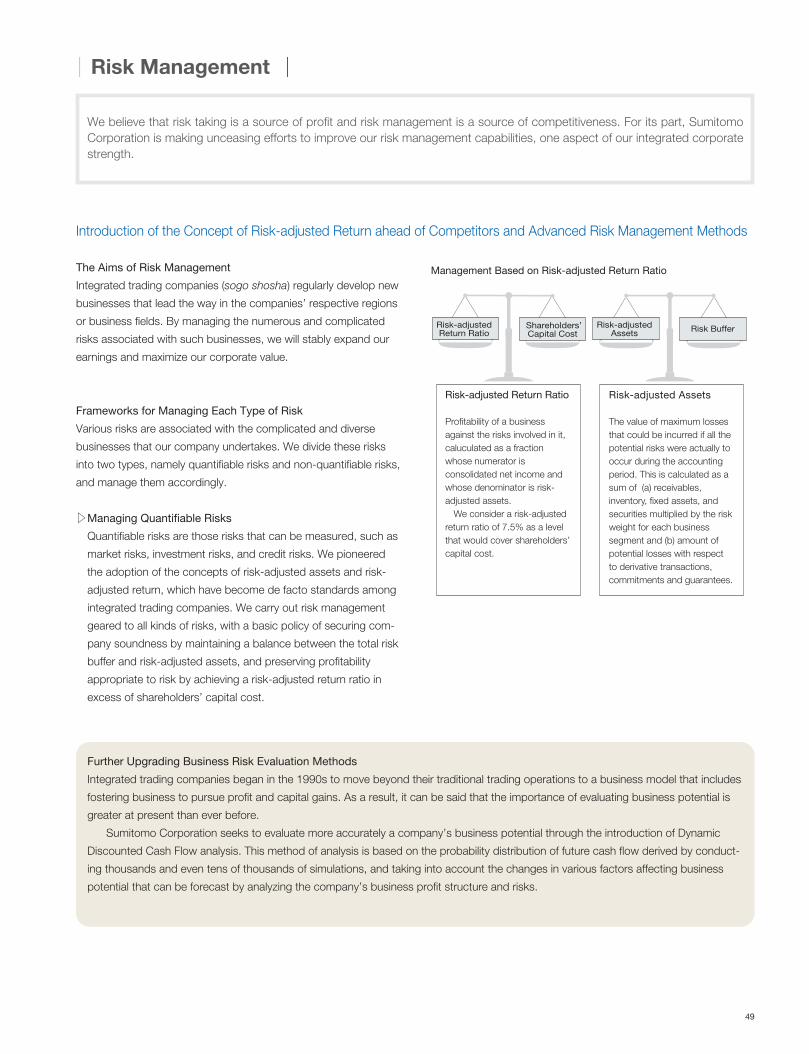
49
Risk Management
We believe that risk taking is a source of profit and risk management is a source of competitiveness. For its part, SumitomoCorporation is making unceasing efforts to improve our risk management capabilities, one aspect of our integrated corporatestrength.
The Aims of Risk Management
Integrated trading companies (sogo shosha) regularly develop new
businesses that lead the way in the companies’ respective regions
or business fields. By managing the numerous and complicated
risks associated with such businesses, we will stably expand our
earnings and maximize our corporate value.
Frameworks for Managing Each Type of Risk
Various risks are associated with the complicated and diverse
businesses that our company undertakes. We divide these risks
into two types, namely quantifiable risks and non-quantifiable risks,
and manage them accordingly.
uManaging Quantifiable Risks
Quantifiable risks are those risks that can be measured, such as
market risks, investment risks, and credit risks. We pioneered
the adoption of the concepts of risk-adjusted assets and risk-
adjusted return, which have become de facto standards among
integrated trading companies. We carry out risk management
geared to all kinds of risks, with a basic policy of securing com-
pany soundness by maintaining a balance between the total risk
buffer and risk-adjusted assets, and preserving profitability
appropriate to risk by achieving a risk-adjusted return ratio in
excess of shareholders’ capital cost.
Introduction of the Concept of Risk-adjusted Return ahead of Competitors and Advanced Risk Management Methods
Risk-adjusted Return Ratio
Risk-adjusted Return Ratio
Profitability of a business against the risks involved in it, caluculated as a fraction whose numerator is consolidated net income and whose denominator is risk-adjusted assets. We consider a risk-adjusted return ratio of 7.5% as a level that would cover shareholders’ capital cost.
Risk-adjusted Assets
The value of maximum losses that could be incurred if all the potential risks were actually to occur during the accounting period. This is calculated as a sum of (a) receivables, inventory, fixed assets, and securities multiplied by the risk weight for each business segment and (b) amount of potential losses with respect to derivative transactions, commitments and guarantees.
Shareholders’Capital Cost
Risk-adjusted Assets Risk Buffer
Management Based on Risk-adjusted Return Ratio
Further Upgrading Business Risk Evaluation Methods
Integrated trading companies began in the 1990s to move beyond their traditional trading operations to a business model that includes
fostering business to pursue profit and capital gains. As a result, it can be said that the importance of evaluating business potential is
greater at present than ever before.
Sumitomo Corporation seeks to evaluate more accurately a company’s business potential through the introduction of Dynamic
Discounted Cash Flow analysis. This method of analysis is based on the probability distribution of future cash flow derived by conduct-
ing thousands and even tens of thousands of simulations, and taking into account the changes in various factors affecting business
potential that can be forecast by analyzing the company’s business profit structure and risks.
50 Sumitomo Corporation Annual Report 2005
Risk Management
uManaging Non-Quantifiable Risks
Non-quantifiable risks such as natural disasters, administrative
errors, and fraud are risks that must be borne, but for which we
cannot expect returns. Furthermore, some of those risks involve
events that do not occur frequently but can have a major nega-
tive impact on our operations when they do occur. Sumitomo
Corporation manages such risks on an ongoing basis through
its dedicated departments within the Corporate Group and each
business line.
At the same time, company-wide efforts are made by the
Promoting Team for Integrated Risk Management established in
2002, which prioritizes non-quantifiable risks according to their
importance, reviews the status of the Company’s response to
these risks, and works to improve them. The team’s findings are
incorporated into the new Internal Control Project.
Risk Management Structure
Risk management at the Business Unit level is implemented under
the principles of autonomous management and independent
responsibility, within the company-wide risk management frame-
work. Such activities are supported by staff dedicated to risk man-
agement in each Business Unit’s Planning and Administration
Department and are carried out in a precise and timely manner in
close contact with frontline business operations.
At the company-wide level, dedicated departments within the
Corporate Group are responsible for the establishment and
sophistication of a framework common to the whole company,
and for the monitoring of risk-adjusted assets.
In addition, the Loan and Investment Committee analyzes proj-
ect risks from a specialist viewpoint and assesses whether to go
ahead with large and important projects that could have a major
impact on the entire company, thereby providing an appropriate
checking function.
Enhancing Risk Awareness
As stated in the beginning, risk management is a source of competitiveness, and superior risk management is the key to business
success. For this purpose, we believe that the construction of a superior risk management framework and the actions and aware-
ness of all officers and employees to assure an effective framework are essential.
As a member of the Sumitomo Group, which has a history of over 400 years, Sumitomo Corporation has a corporate culture
based on “integrity” and “sound management.” Yet, through repeatedly explaining the importance of risk management from the
top down, we are propagating risk management in our frontline business operations and achieving an enhanced sense of risk
management awareness in our employees. Our officers and employees also cross-departmentally share lessons and know-how
gained from cases of past failures, and a manual filled with risk management knowledge accumulated in the past is distributed
company wide. Through these efforts, we aim to improve the risk management capabilities of each employee and enhance the
competitiveness of the entire company.
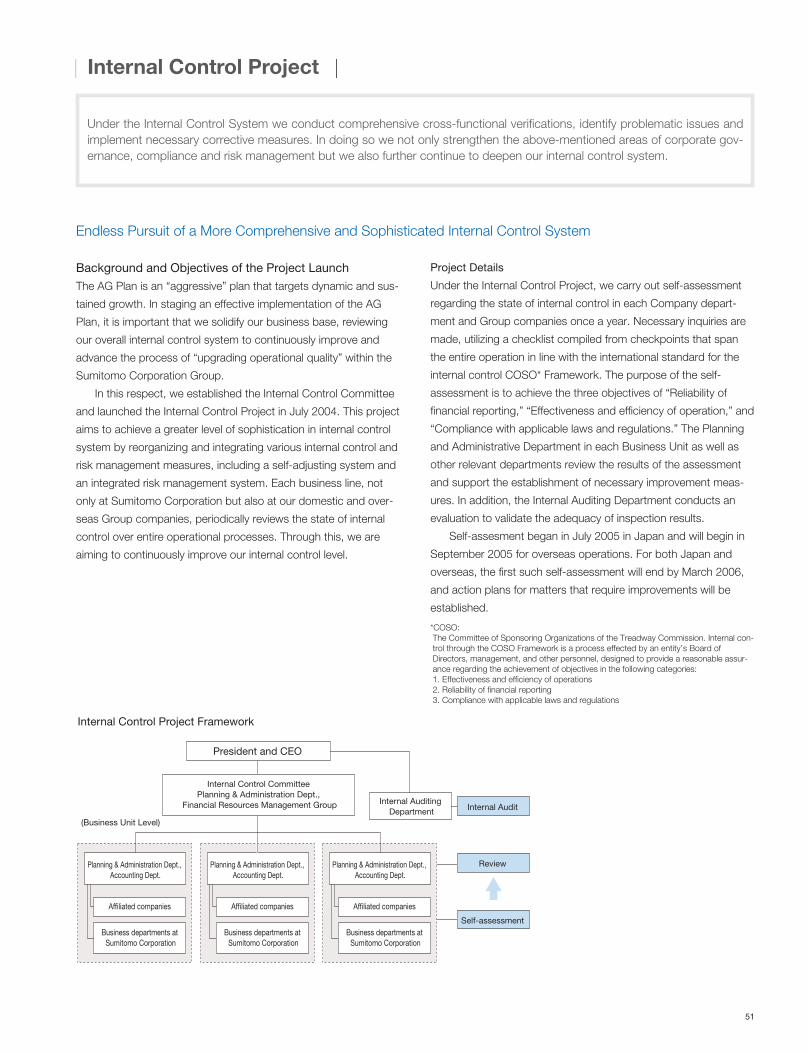
51
Internal Control Project
Background and Objectives of the Project Launch
The AG Plan is an “aggressive” plan that targets dynamic and sus-
tained growth. In staging an effective implementation of the AG
Plan, it is important that we solidify our business base, reviewing
our overall internal control system to continuously improve and
advance the process of “upgrading operational quality” within the
Sumitomo Corporation Group.
In this respect, we established the Internal Control Committee
and launched the Internal Control Project in July 2004. This project
aims to achieve a greater level of sophistication in internal control
system by reorganizing and integrating various internal control and
risk management measures, including a self-adjusting system and
an integrated risk management system. Each business line, not
only at Sumitomo Corporation but also at our domestic and over-
seas Group companies, periodically reviews the state of internal
control over entire operational processes. Through this, we are
aiming to continuously improve our internal control level.
Endless Pursuit of a More Comprehensive and Sophisticated Internal Control System
Under the Internal Control System we conduct comprehensive cross-functional verifications, identify problematic issues andimplement necessary corrective measures. In doing so we not only strengthen the above-mentioned areas of corporate gov-ernance, compliance and risk management but we also further continue to deepen our internal control system.
Internal Control Project Framework
(Business Unit Level)
Internal Auditing Department
Review
Self-assessment
Affiliated companies
Business departments at Sumitomo Corporation
Planning & Administration Dept., Accounting Dept.
Internal Audit
Internal Control CommitteePlanning & Administration Dept.,
Financial Resources Management Group
President and CEO
Affiliated companies
Business departments at Sumitomo Corporation
Planning & Administration Dept., Accounting Dept.
Affiliated companies
Business departments at Sumitomo Corporation
Planning & Administration Dept., Accounting Dept.
Project Details
Under the Internal Control Project, we carry out self-assessment
regarding the state of internal control in each Company depart-
ment and Group companies once a year. Necessary inquiries are
made, utilizing a checklist compiled from checkpoints that span
the entire operation in line with the international standard for the
internal control COSO* Framework. The purpose of the self-
assessment is to achieve the three objectives of “Reliability of
financial reporting,” “Effectiveness and efficiency of operation,” and
“Compliance with applicable laws and regulations.” The Planning
and Administrative Department in each Business Unit as well as
other relevant departments review the results of the assessment
and support the establishment of necessary improvement meas-
ures. In addition, the Internal Auditing Department conducts an
evaluation to validate the adequacy of inspection results.
Self-assesment began in July 2005 in Japan and will begin in
September 2005 for overseas operations. For both Japan and
overseas, the first such self-assessment will end by March 2006,
and action plans for matters that require improvements will be
established.
*COSO:The Committee of Sponsoring Organizations of the Treadway Commission. Internal con-trol through the COSO Framework is a process effected by an entity’s Board ofDirectors, management, and other personnel, designed to provide a reasonable assur-ance regarding the achievement of objectives in the following categories: 1. Effectiveness and efficiency of operations2. Reliability of financial reporting3. Compliance with applicable laws and regulations

52 Sumitomo Corporation Annual Report 2005
The Right People in the Right Places
Our policy is to appoint motivated people to jobs that proactively
challenge their capabilities and take them to new heights. This
approach engenders a mutually beneficial stimulus for each
employee and the organization to which he or she belongs. To
place the right people in the right place and stimulate the organiza-
tion, we established a Human Resources Management Committee
in each Business Unit to promote the cultivation and utilization of
human resources. As to human resources allocation, our strategy
is to rotate employees through various parts of the Corporation, as
well as to utilize self-application systems, which encourage
employees to take responsibility for their own career development.
To diversify our recruitment of human resources, we carry out
mid-career recruitment throughout the year. In addition, we will uti-
lize our existing staff including the senior staff, and augment our
management personnel overseas.
Cultivating Professionals and Leaders
Our human resources development is driven by onsite activities.
We set goals and provide feedback on the evaluation that is
focused on each individual, and through job placement rotation
and training programs specific to each business line, we endeavor
to cultivate professionals with specialized expertise and leaders
with clear vision.
In addition, the Sumisho Business College provides a compa-
ny-wide educational infrastructure designed to improve the practi-
cal knowledge and skills of our people at all levels, from new
employees to managers. Additionally, we are undertaking such
training programs as the Business Creator Program, which is
Strategic Training and Placement of Human Resources, Diversification of Recruitment and “Work & Life Balance”
geared toward boosting business creativity. Furthermore, in
December 2004, we established a Human Resources
Development Committee chaired by the President and CEO as a
venture to widely discuss and propose measures concerning
human resources development from a long-term perspective.
Personnel around the Globe
To further cultivate business operations with close ties to local
communities and to strengthen the capabilities of each overseas
operation, we encourage the promotion of locally hired staff to key
positions at our overseas offices, and actively foster and utilize
highly talented staff. In addition, our headquarters hosts group
training sessions for overseas staff at every level, and each year
we have approximately 100 participants. Our main objective is to
improve their business skills as well as to deepen their under-
standing of Japanese culture and the business strategies of the
company through interaction with headquarters staff.
Work & Life Balance
We incorporate the concept of “Work & Life Balance” into our
human resources management. This concept states that ensuring
balance and fulfillment in life including work is the key to maximiz-
ing individual performance.
We have established a company-wide team to develop a busi-
ness environment where employees can work to their best poten-
tial with peace of mind. Based on our employees’ needs, the team
will work to permeate the concept of “Work & Life Balance,” and
continuously deliberate and promote measures such as enriching
child-care and family-care leave systems, reducing the amount of
overtime work, and promoting the utilization of paid holidays.
Supporting the Mental Health of Our Employees
To enable our employees to work in vigor while maintaining sound
mental health, we also established a SCG Counseling Center in
our Harumi headquarters in April 2005. Our exclusive counselors
will give advice about appropriate labor management from the per-
spective of supporting the mental health of our employees and will
ensure that all potential barriers to one’s work are quickly identified
and resolved.
Human Resources Management
Human resources strategies matching our growth strategies are one of the basic policies of the AG Plan. We will proactivelywork on human resources management and promote recruitment, training, and placement of human resources with the aimof realizing sustained growth and development through our offensive management plan.
Training session for staffs at our overseas operations
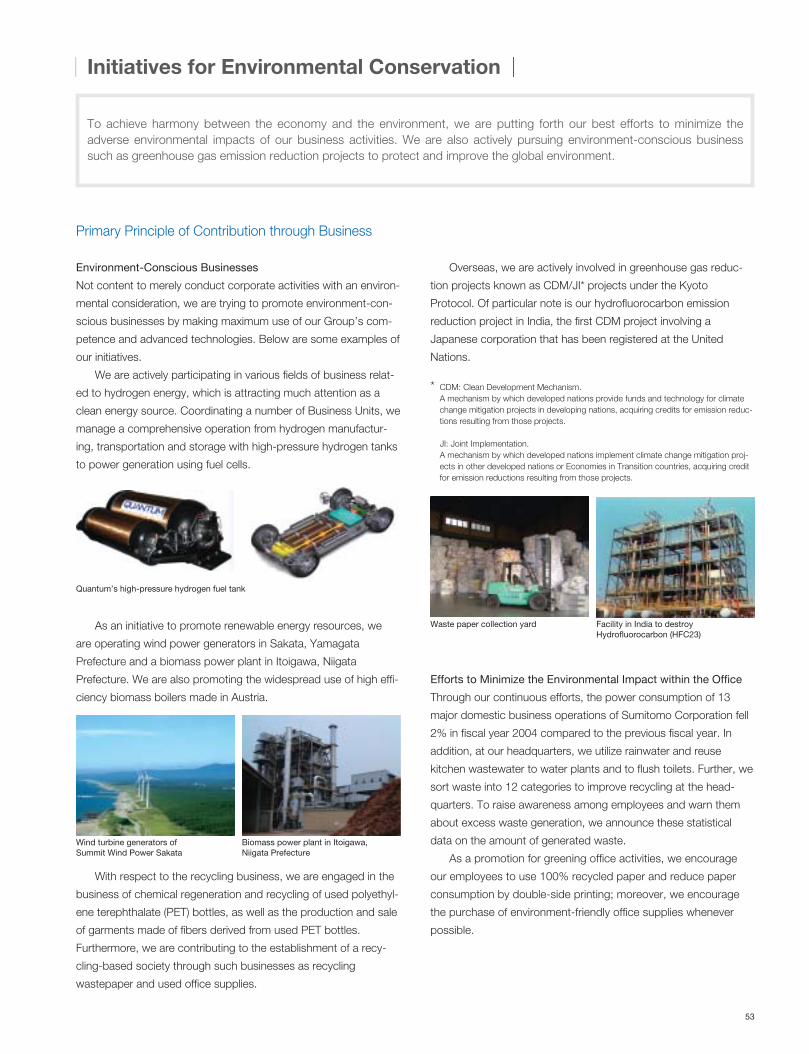
53
Initiatives for Environmental Conservation
Environment-Conscious Businesses
Not content to merely conduct corporate activities with an environ-
mental consideration, we are trying to promote environment-con-
scious businesses by making maximum use of our Group’s com-
petence and advanced technologies. Below are some examples of
our initiatives.
We are actively participating in various fields of business relat-
ed to hydrogen energy, which is attracting much attention as a
clean energy source. Coordinating a number of Business Units, we
manage a comprehensive operation from hydrogen manufactur-
ing, transportation and storage with high-pressure hydrogen tanks
to power generation using fuel cells.
As an initiative to promote renewable energy resources, we
are operating wind power generators in Sakata, Yamagata
Prefecture and a biomass power plant in Itoigawa, Niigata
Prefecture. We are also promoting the widespread use of high effi-
ciency biomass boilers made in Austria.
With respect to the recycling business, we are engaged in the
business of chemical regeneration and recycling of used polyethyl-
ene terephthalate (PET) bottles, as well as the production and sale
of garments made of fibers derived from used PET bottles.
Furthermore, we are contributing to the establishment of a recy-
cling-based society through such businesses as recycling
wastepaper and used office supplies.
Primary Principle of Contribution through Business
Overseas, we are actively involved in greenhouse gas reduc-
tion projects known as CDM/JI* projects under the Kyoto
Protocol. Of particular note is our hydrofluorocarbon emission
reduction project in India, the first CDM project involving a
Japanese corporation that has been registered at the United
Nations.
* CDM: Clean Development Mechanism. A mechanism by which developed nations provide funds and technology for climatechange mitigation projects in developing nations, acquiring credits for emission reduc-tions resulting from those projects.
JI: Joint Implementation. A mechanism by which developed nations implement climate change mitigation proj-ects in other developed nations or Economies in Transition countries, acquiring creditfor emission reductions resulting from those projects.
Efforts to Minimize the Environmental Impact within the Office
Through our continuous efforts, the power consumption of 13
major domestic business operations of Sumitomo Corporation fell
2% in fiscal year 2004 compared to the previous fiscal year. In
addition, at our headquarters, we utilize rainwater and reuse
kitchen wastewater to water plants and to flush toilets. Further, we
sort waste into 12 categories to improve recycling at the head-
quarters. To raise awareness among employees and warn them
about excess waste generation, we announce these statistical
data on the amount of generated waste.
As a promotion for greening office activities, we encourage
our employees to use 100% recycled paper and reduce paper
consumption by double-side printing; moreover, we encourage
the purchase of environment-friendly office supplies whenever
possible.
To achieve harmony between the economy and the environment, we are putting forth our best efforts to minimize theadverse environmental impacts of our business activities. We are also actively pursuing environment-conscious businesssuch as greenhouse gas emission reduction projects to protect and improve the global environment.
Facility in India to destroyHydrofluorocarbon (HFC23)
Quantum’s high-pressure hydrogen fuel tank
Waste paper collection yard
Biomass power plant in Itoigawa, Niigata Prefecture
Wind turbine generators of Summit Wind Power Sakata
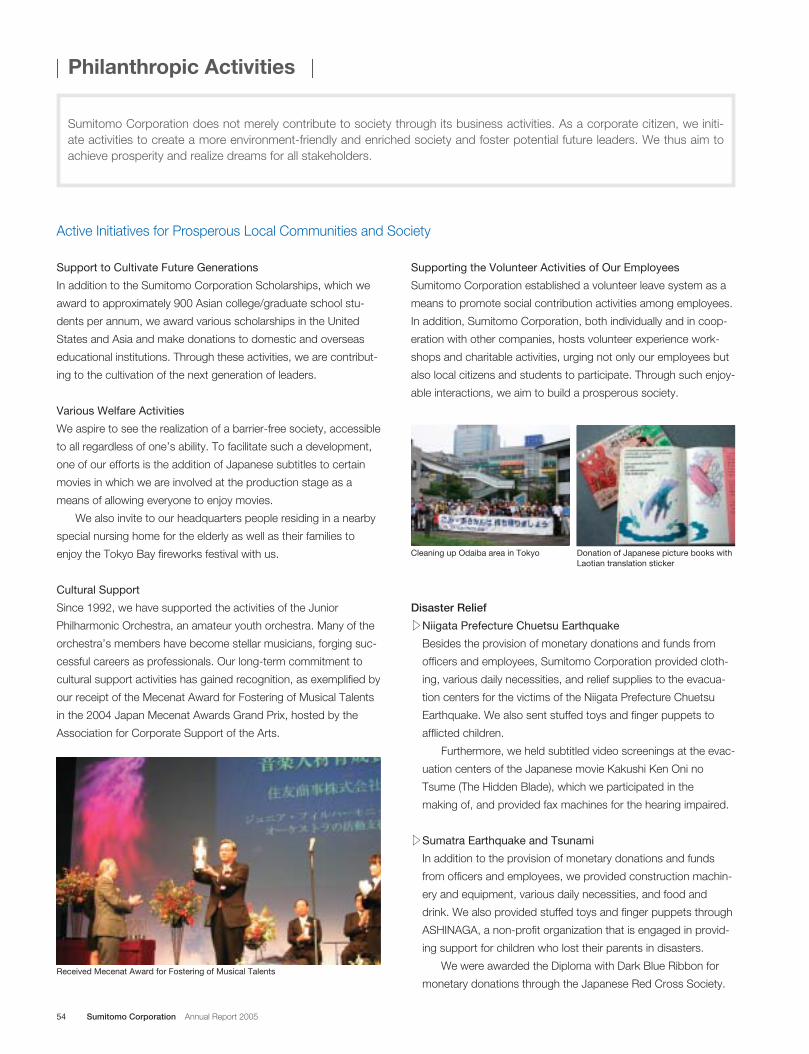
54 Sumitomo Corporation Annual Report 2005
Philanthropic Activities
Sumitomo Corporation does not merely contribute to society through its business activities. As a corporate citizen, we initi-ate activities to create a more environment-friendly and enriched society and foster potential future leaders. We thus aim toachieve prosperity and realize dreams for all stakeholders.
Support to Cultivate Future Generations
In addition to the Sumitomo Corporation Scholarships, which we
award to approximately 900 Asian college/graduate school stu-
dents per annum, we award various scholarships in the United
States and Asia and make donations to domestic and overseas
educational institutions. Through these activities, we are contribut-
ing to the cultivation of the next generation of leaders.
Various Welfare Activities
We aspire to see the realization of a barrier-free society, accessible
to all regardless of one’s ability. To facilitate such a development,
one of our efforts is the addition of Japanese subtitles to certain
movies in which we are involved at the production stage as a
means of allowing everyone to enjoy movies.
We also invite to our headquarters people residing in a nearby
special nursing home for the elderly as well as their families to
enjoy the Tokyo Bay fireworks festival with us.
Cultural Support
Since 1992, we have supported the activities of the Junior
Philharmonic Orchestra, an amateur youth orchestra. Many of the
orchestra’s members have become stellar musicians, forging suc-
cessful careers as professionals. Our long-term commitment to
cultural support activities has gained recognition, as exemplified by
our receipt of the Mecenat Award for Fostering of Musical Talents
in the 2004 Japan Mecenat Awards Grand Prix, hosted by the
Association for Corporate Support of the Arts.
Active Initiatives for Prosperous Local Communities and Society
Supporting the Volunteer Activities of Our Employees
Sumitomo Corporation established a volunteer leave system as a
means to promote social contribution activities among employees.
In addition, Sumitomo Corporation, both individually and in coop-
eration with other companies, hosts volunteer experience work-
shops and charitable activities, urging not only our employees but
also local citizens and students to participate. Through such enjoy-
able interactions, we aim to build a prosperous society.
Disaster Relief
uNiigata Prefecture Chuetsu Earthquake
Besides the provision of monetary donations and funds from
officers and employees, Sumitomo Corporation provided cloth-
ing, various daily necessities, and relief supplies to the evacua-
tion centers for the victims of the Niigata Prefecture Chuetsu
Earthquake. We also sent stuffed toys and finger puppets to
afflicted children.
Furthermore, we held subtitled video screenings at the evac-
uation centers of the Japanese movie Kakushi Ken Oni no
Tsume (The Hidden Blade), which we participated in the
making of, and provided fax machines for the hearing impaired.
uSumatra Earthquake and Tsunami
In addition to the provision of monetary donations and funds
from officers and employees, we provided construction machin-
ery and equipment, various daily necessities, and food and
drink. We also provided stuffed toys and finger puppets through
ASHINAGA, a non-profit organization that is engaged in provid-
ing support for children who lost their parents in disasters.
We were awarded the Diploma with Dark Blue Ribbon for
monetary donations through the Japanese Red Cross Society.Received Mecenat Award for Fostering of Musical Talents
Donation of Japanese picture books withLaotian translation sticker
Cleaning up Odaiba area in Tokyo
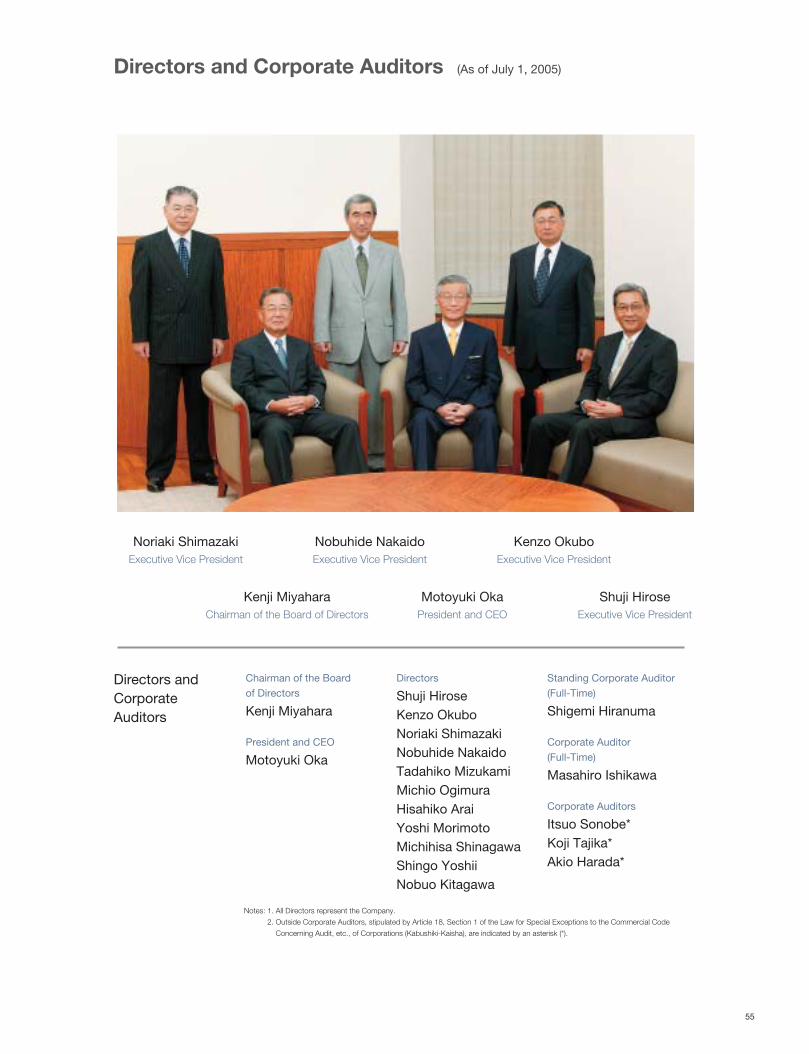
55
Directors and Corporate Auditors (As of July 1, 2005)
Directors andCorporate Auditors
Chairman of the Board of Directors
Kenji Miyahara
President and CEO
Motoyuki Oka
Directors
Shuji HiroseKenzo OkuboNoriaki ShimazakiNobuhide NakaidoTadahiko MizukamiMichio OgimuraHisahiko AraiYoshi MorimotoMichihisa ShinagawaShingo YoshiiNobuo Kitagawa
Standing Corporate Auditor(Full-Time)
Shigemi Hiranuma
Corporate Auditor(Full-Time)
Masahiro Ishikawa
Corporate Auditors
Itsuo Sonobe*Koji Tajika*Akio Harada*
Notes: 1. All Directors represent the Company.
2. Outside Corporate Auditors, stipulated by Article 18, Section 1 of the Law for Special Exceptions to the Commercial Code
Concerning Audit, etc., of Corporations (Kabushiki-Kaisha), are indicated by an asterisk (*).
Noriaki ShimazakiExecutive Vice President
Nobuhide NakaidoExecutive Vice President
Kenzo OkuboExecutive Vice President
Kenji MiyaharaChairman of the Board of Directors
Motoyuki OkaPresident and CEO
Shuji HiroseExecutive Vice President
56 Sumitomo Corporation Annual Report 2005
Executive Officers (As of July 1, 2005)
President and CEO
Motoyuki Oka*
Executive Vice President
Shuji Hirose*General Manager, Transportation & Construction Systems Business Unit
Kenzo Okubo*General Manager, Metal Products Business Unit
Noriaki Shimazaki*Responsible for Internal Auditing Department
Responsible for Human Resources Development &Information Management Group
Responsible for Financial Resources ManagementGroup
Nobuhide Nakaido*General Manager, Corporate Planning & Coordination Office
Senior Managing Executive Officer
Tadahiko Mizukami*General Manager, Financial & Logistics Business Unit
Shizuka TamuraGeneral Manager for China
CEO, Sumitomo Corporation (China) Group
Director & President, Sumitomo Corporation (China) Holding Ltd.
Katsuichi KobayashiGeneral Manager, Chubu Regional Business Unit
Susumu KatoGeneral Manager for the Americas
Director & President, Sumitomo Corporation of America
Michio Ogimura*General Manager, Machinery & Electric Business Unit
Managing Executive Officer
Hisahiko Arai*General Manager, Materials & Real Estate Business Unit
Yoshi Morimoto*General Manager, Consumer Goods & Service Business Unit
Makoto ShibaharaAssistant General Manager, Financial & Logistics Business Unit
General Manager, Financial Service Division
Michihisa Shinagawa*General Manager, Mineral Resources & Energy Business Unit
Shingo Yoshii*General Manager, Media, Electronics & Network Business Unit
Shuichi MoriGeneral Manager for Europe
CEO, Sumitomo Corporation Europe Group
Director & President,Sumitomo Corporation Europe Holding Limited
Chairman, President & Director, Sumitomo Corporation Europe Plc
Kazuo OhmoriAssistant General Manager, Transportation & Construction Systems Business Unit
General Manager, Ship, Aerospace & Transportation Systems Division
Kentaro IshimotoAssistant General Manager, Consumer Goods & Service Business Unit
General Manager, Food Business Division
Shunichi AraiGeneral Manager, Kansai Regional Business Unit
Nobuo Kitagawa*General Manager, Chemical Business Unit
Executive Officer
Yoshihiko ShimazuGeneral Manager for CIS
Assistant General Manager for Europe
Kenji KajiwaraGeneral Manager, Lifestyle & Retail Business Division
Makoto SatoGeneral Manager, Motor Vehicles Business Division
Toyosaku HamadaGeneral Manager, Financial Resources Management Group
Tsuneo NaitoGeneral Manager, Logistics & Insurance Business Division
Takahiro MoriyamaGeneral Manager, Power & Energy Project Division
Ichiro MiuraGeneral Manager, Human Resources Development & Information Management Group
Takashi KanoGeneral Manager, Construction & Real Estate Division
General Manager, General Construction Development & CoordinationDepartment
Kuniharu NakamuraGeneral Manager, Corporate Planning & Coordination Department
Shinichi SasakiGeneral Manager, Tubular Products Division
Takuro Kawahara General Manager, Legal Department
Yoshio OsawaGeneral Manager, Network Division
Note: Representative Directors are indicated by an asterisk (*).
57
Business Operating Structure
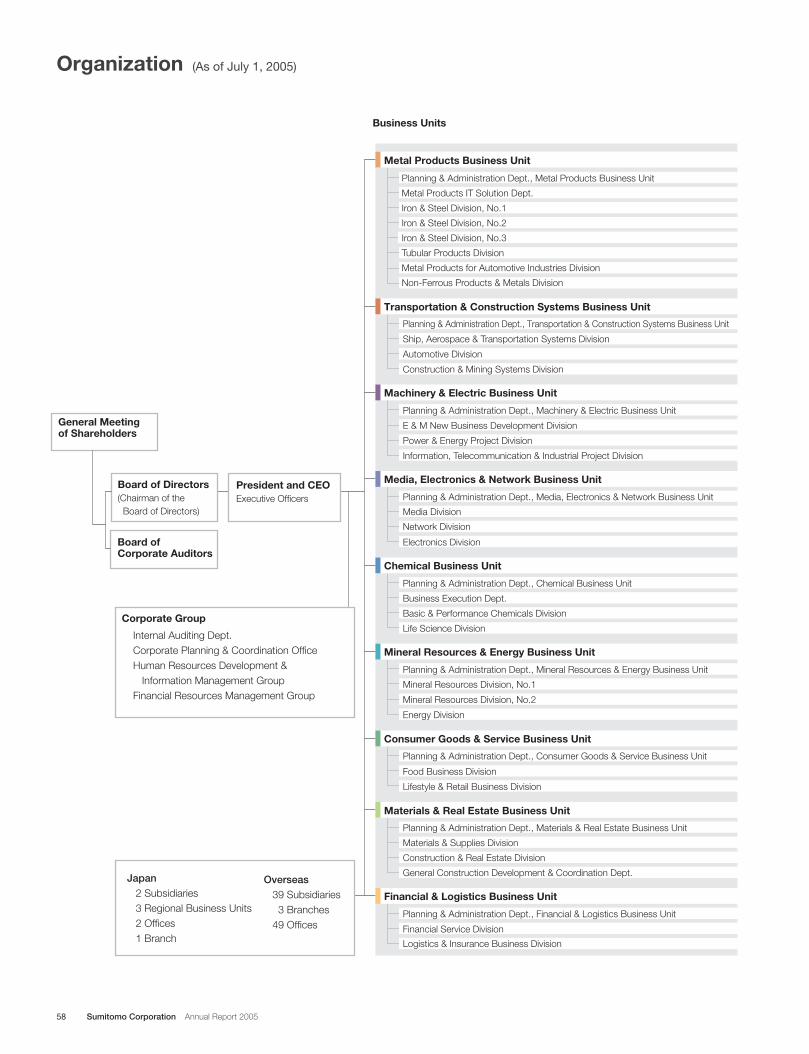
Business Units
General Meeting of Shareholders
Board of Corporate Auditors
Board of Directors(Chairman of the Board of Directors)
President and CEOExecutive Officers
Corporate Group Internal Auditing Dept. Corporate Planning & Coordination Office Human Resources Development & Information Management Group Financial Resources Management Group
Japan 2 Subsidiaries 3 Regional Business Units 2 Offices 1 Branch
Overseas 39 Subsidiaries 3 Branches 49 Offices
金属事業部門
鉄鋼第一本部
金属ITソリューション部
金属総括部
鉄鋼第二本部
鋼管本部
自動車金属製品本部
非鉄金属製品本部
鉄鋼第三本部
Transportation & Construction Systems Business Unit
Ship, Aerospace & Transportation Systems Division
Planning & Administration Dept., Transportation & Construction Systems Business Unit
Automotive Division
Construction & Mining Systems Division
Machinery & Electric Business Unit
E & M New Business Development Division
Planning & Administration Dept., Machinery & Electric Business Unit
Power & Energy Project Division
Information, Telecommunication & Industrial Project Division
Media, Electronics & Network Business Unit
Media Division
Planning & Administration Dept., Media, Electronics & Network Business Unit
Network Division
Electronics Division
Chemical Business Unit
Basic & Performance Chemicals Division
Planning & Administration Dept., Chemical Business Unit
Business Execution Dept.
Life Science Division
Mineral Resources & Energy Business Unit
Mineral Resources Division, No.1
Planning & Administration Dept., Mineral Resources & Energy Business Unit
Mineral Resources Division, No.2
Energy Division
Consumer Goods & Service Business Unit
Food Business Division
Planning & Administration Dept., Consumer Goods & Service Business Unit
Lifestyle & Retail Business Division
Materials & Real Estate Business Unit
Materials & Supplies Division
Planning & Administration Dept., Materials & Real Estate Business Unit
Construction & Real Estate Division
General Construction Development & Coordination Dept.
Financial & Logistics Business Unit
Financial Service Division
Planning & Administration Dept., Financial & Logistics Business Unit
Logistics & Insurance Business Division
Metal Products Business Unit
Iron & Steel Division, No.1
Metal Products IT Solution Dept.
Planning & Administration Dept., Metal Products Business Unit
Iron & Steel Division, No.2
Tubular Products Division
Metal Products for Automotive Industries Division
Non-Ferrous Products & Metals Division
Iron & Steel Division, No.3
58 Sumitomo Corporation Annual Report 2005
Organization (As of July 1, 2005)
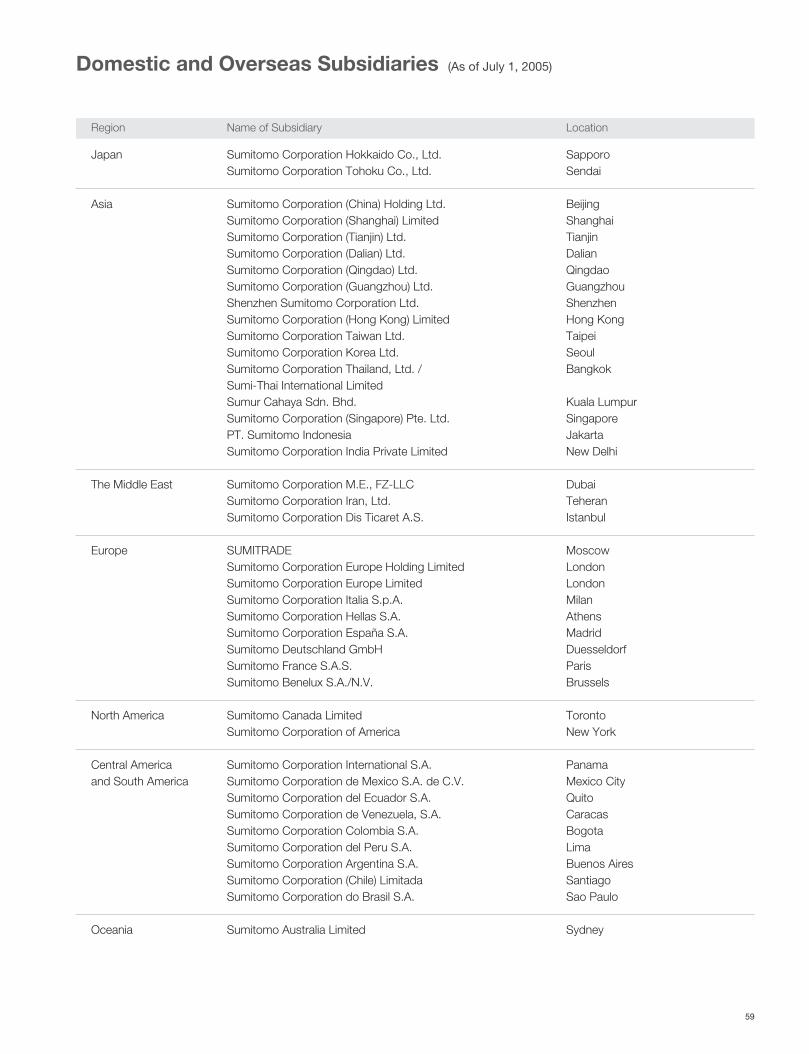
59
Domestic and Overseas Subsidiaries (As of July 1, 2005)
Region Name of Subsidiary Location
Japan Sumitomo Corporation Hokkaido Co., Ltd. SapporoSumitomo Corporation Tohoku Co., Ltd. Sendai
Asia Sumitomo Corporation (China) Holding Ltd. BeijingSumitomo Corporation (Shanghai) Limited Shanghai Sumitomo Corporation (Tianjin) Ltd. TianjinSumitomo Corporation (Dalian) Ltd. DalianSumitomo Corporation (Qingdao) Ltd. QingdaoSumitomo Corporation (Guangzhou) Ltd. Guangzhou Shenzhen Sumitomo Corporation Ltd. ShenzhenSumitomo Corporation (Hong Kong) Limited Hong KongSumitomo Corporation Taiwan Ltd. Taipei Sumitomo Corporation Korea Ltd. SeoulSumitomo Corporation Thailand, Ltd. / BangkokSumi-Thai International LimitedSumur Cahaya Sdn. Bhd. Kuala LumpurSumitomo Corporation (Singapore) Pte. Ltd. SingaporePT. Sumitomo Indonesia Jakarta Sumitomo Corporation India Private Limited New Delhi
The Middle East Sumitomo Corporation M.E., FZ-LLC DubaiSumitomo Corporation Iran, Ltd. TeheranSumitomo Corporation Dis Ticaret A.S. Istanbul
Europe SUMITRADE MoscowSumitomo Corporation Europe Holding Limited London Sumitomo Corporation Europe Limited London Sumitomo Corporation Italia S.p.A. Milan Sumitomo Corporation Hellas S.A. AthensSumitomo Corporation España S.A. Madrid Sumitomo Deutschland GmbH DuesseldorfSumitomo France S.A.S. ParisSumitomo Benelux S.A./N.V. Brussels
North America Sumitomo Canada Limited TorontoSumitomo Corporation of America New York
Central America Sumitomo Corporation International S.A. Panamaand South America Sumitomo Corporation de Mexico S.A. de C.V. Mexico City
Sumitomo Corporation del Ecuador S.A. QuitoSumitomo Corporation de Venezuela, S.A. CaracasSumitomo Corporation Colombia S.A. BogotaSumitomo Corporation del Peru S.A. LimaSumitomo Corporation Argentina S.A. Buenos AiresSumitomo Corporation (Chile) Limitada SantiagoSumitomo Corporation do Brasil S.A. Sao Paulo
Oceania Sumitomo Australia Limited Sydney
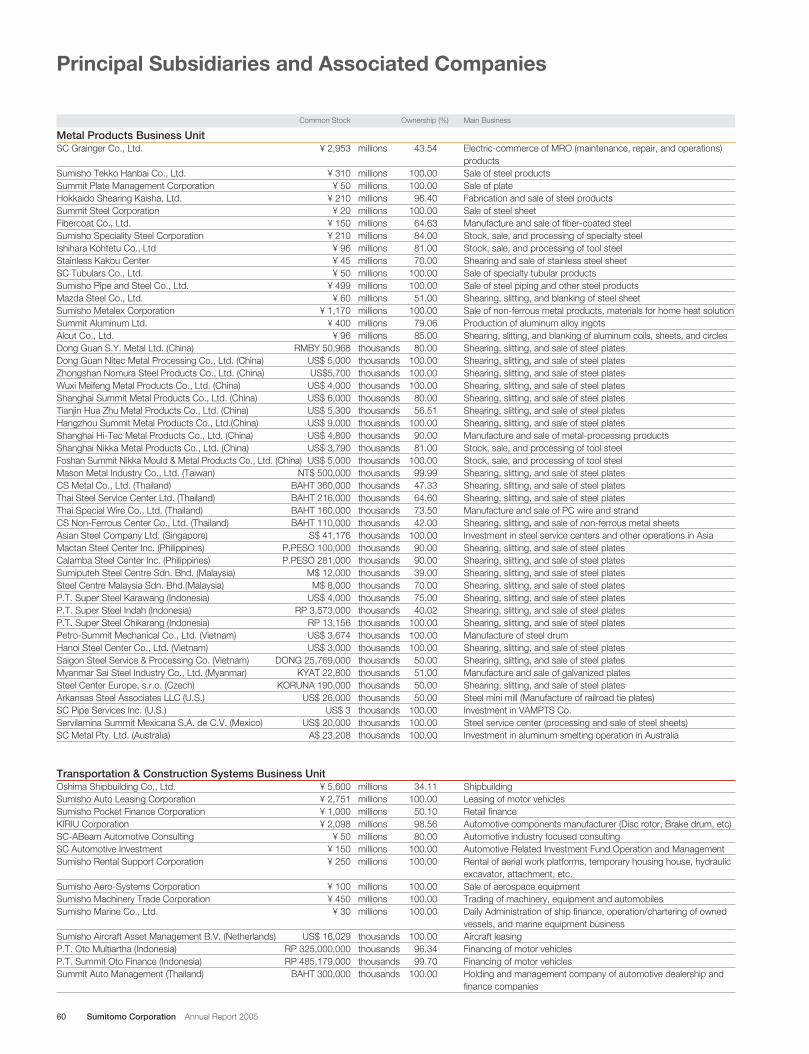
60 Sumitomo Corporation Annual Report 2005
Principal Subsidiaries and Associated Companies
Metal Products Business UnitSC Grainger Co., Ltd. ¥ 2,953 millions 43.54 Electric-commerce of MRO (maintenance, repair, and operations)
productsSumisho Tekko Hanbai Co., Ltd. ¥ 310 millions 100.00 Sale of steel productsSummit Plate Management Corporation ¥ 50 millions 100.00 Sale of plateHokkaido Shearing Kaisha, Ltd. ¥ 210 millions 96.40 Fabrication and sale of steel productsSummit Steel Corporation ¥ 20 millions 100.00 Sale of steel sheetFibercoat Co., Ltd. ¥ 150 millions 64.63 Manufacture and sale of fiber-coated steelSumisho Speciality Steel Corporation ¥ 210 millions 84.00 Stock, sale, and processing of specialty steelIshihara Kohtetu Co., Ltd ¥ 96 millions 81.00 Stock, sale, and processing of tool steelStainless Kakou Center ¥ 45 millions 70.00 Shearing and sale of stainless steel sheetSC Tubulars Co., Ltd. ¥ 50 millions 100.00 Sale of specialty tubular products Sumisho Pipe and Steel Co., Ltd. ¥ 499 millions 100.00 Sale of steel piping and other steel products Mazda Steel Co., Ltd. ¥ 60 millions 51.00 Shearing, slitting, and blanking of steel sheetSumisho Metalex Corporation ¥ 1,170 millions 100.00 Sale of non-ferrous metal products, materials for home heat solutionSummit Aluminum Ltd. ¥ 400 millions 79.06 Production of aluminum alloy ingotsAlcut Co., Ltd. ¥ 96 millions 85.00 Shearing, slitting, and blanking of aluminum coils, sheets, and circlesDong Guan S.Y. Metal Ltd. (China) RMBY 50,968 thousands 80.00 Shearing, slitting, and sale of steel platesDong Guan Nitec Metal Processing Co., Ltd. (China) US$ 5,000 thousands 100.00 Shearing, slitting, and sale of steel platesZhongshan Nomura Steel Products Co., Ltd. (China) US$5,700 thousands 100.00 Shearing, slitting, and sale of steel platesWuxi Meifeng Metal Products Co., Ltd. (China) US$ 4,000 thousands 100.00 Shearing, slitting, and sale of steel platesShanghai Summit Metal Products Co., Ltd. (China) US$ 6,000 thousands 80.00 Shearing, slitting, and sale of steel platesTianjin Hua Zhu Metal Products Co., Ltd. (China) US$ 5,300 thousands 56.51 Shearing, slitting, and sale of steel platesHangzhou Summit Metal Products Co., Ltd.(China) US$ 9,000 thousands 100.00 Shearing, slitting, and sale of steel platesShanghai Hi-Tec Metal Products Co., Ltd. (China) US$ 4,800 thousands 90.00 Manufacture and sale of metal-processing productsShanghai Nikka Metal Products Co., Ltd. (China) US$ 3,790 thousands 81.00 Stock, sale, and processing of tool steelFoshan Summit Nikka Mould & Metal Products Co., Ltd. (China) US$ 5,000 thousands 100.00 Stock, sale, and processing of tool steelMason Metal Industry Co., Ltd. (Taiwan) NT$ 500,000 thousands 99.99 Shearing, slitting, and sale of steel platesCS Metal Co., Ltd. (Thailand) BAHT 360,000 thousands 47.33 Shearing, slitting, and sale of steel platesThai Steel Service Center Ltd. (Thailand) BAHT 216,000 thousands 64.60 Shearing, slitting, and sale of steel platesThai Special Wire Co., Ltd. (Thailand) BAHT 160,000 thousands 73.50 Manufacture and sale of PC wire and strandCS Non-Ferrous Center Co., Ltd. (Thailand) BAHT 110,000 thousands 42.00 Shearing, slitting, and sale of non-ferrous metal sheetsAsian Steel Company Ltd. (Singapore) S$ 41,176 thousands 100.00 Investment in steel service centers and other operations in AsiaMactan Steel Center Inc. (Philippines) P.PESO 100,000 thousands 90.00 Shearing, slitting, and sale of steel platesCalamba Steel Center Inc. (Philippines) P.PESO 281,000 thousands 90.00 Shearing, slitting, and sale of steel platesSumiputeh Steel Centre Sdn. Bhd. (Malaysia) M$ 12,000 thousands 39.00 Shearing, slitting, and sale of steel platesSteel Centre Malaysia Sdn. Bhd.(Malaysia) M$ 8,000 thousands 70.00 Shearing, slitting, and sale of steel platesP.T. Super Steel Karawang (Indonesia) US$ 4,000 thousands 75.00 Shearing, slitting, and sale of steel platesP.T. Super Steel Indah (Indonesia) RP 3,573,000 thousands 40.02 Shearing, slitting, and sale of steel platesP.T. Super Steel Chikarang (Indonesia) RP 13,156 thousands 100.00 Shearing, slitting, and sale of steel platesPetro-Summit Mechanical Co., Ltd. (Vietnam) US$ 3,674 thousands 100.00 Manufacture of steel drumHanoi Steel Center Co., Ltd. (Vietnam) US$ 3,000 thousands 100.00 Shearing, slitting, and sale of steel platesSaigon Steel Service & Processing Co. (Vietnam) DONG 25,769,000 thousands 50.00 Shearing, slitting, and sale of steel platesMyanmar Sai Steel Industry Co., Ltd. (Myanmar) KYAT 22,800 thousands 51.00 Manufacture and sale of galvanized platesSteel Center Europe, s.r.o. (Czech) KORUNA 190,000 thousands 50.00 Shearing, slitting, and sale of steel platesArkansas Steel Associates LLC (U.S.) US$ 26,000 thousands 50.00 Steel mini mill (Manufacture of railroad tie plates)SC Pipe Services Inc. (U.S.) US$ 3 thousands 100.00 Investment in VAMPTS Co.Servilamina Summit Mexicana S.A. de C.V. (Mexico) US$ 20,000 thousands 100.00 Steel service center (processing and sale of steel sheets)SC Metal Pty. Ltd. (Australia) A$ 23,208 thousands 100.00 Investment in aluminum smelting operation in Australia
Transportation & Construction Systems Business UnitOshima Shipbuilding Co., Ltd. ¥ 5,600 millions 34.11 ShipbuildingSumisho Auto Leasing Corporation ¥ 2,751 millions 100.00 Leasing of motor vehiclesSumisho Pocket Finance Corporation ¥ 1,000 millions 50.10 Retail financeKIRIU Corporation ¥ 2,098 millions 98.56 Automotive components manufacturer (Disc rotor, Brake drum, etc) SC-ABeam Automotive Consulting ¥ 50 millions 80.00 Automotive industry focused consultingSC Automotive Investment ¥ 150 millions 100.00 Automotive Related Investment Fund Operation and ManagementSumisho Rental Support Corporation ¥ 250 millions 100.00 Rental of aerial work platforms, temporary housing house, hydraulic
excavator, attachment, etc.Sumisho Aero-Systems Corporation ¥ 100 millions 100.00 Sale of aerospace equipmentSumisho Machinery Trade Corporation ¥ 450 millions 100.00 Trading of machinery, equipment and automobilesSumisho Marine Co., Ltd. ¥ 30 millions 100.00 Daily Administration of ship finance, operation/chartering of owned
vessels, and marine equipment businessSumisho Aircraft Asset Management B.V. (Netherlands) US$ 16,029 thousands 100.00 Aircraft leasingP.T. Oto Multiartha (Indonesia) RP 325,000,000 thousands 96.34 Financing of motor vehiclesP.T. Summit Oto Finance (Indonesia) RP 485,179,000 thousands 99.70 Financing of motor vehiclesSummit Auto Management (Thailand) BAHT 300,000 thousands 100.00 Holding and management company of automotive dealership and
finance companies
Common Stock Ownership (%) Main Business
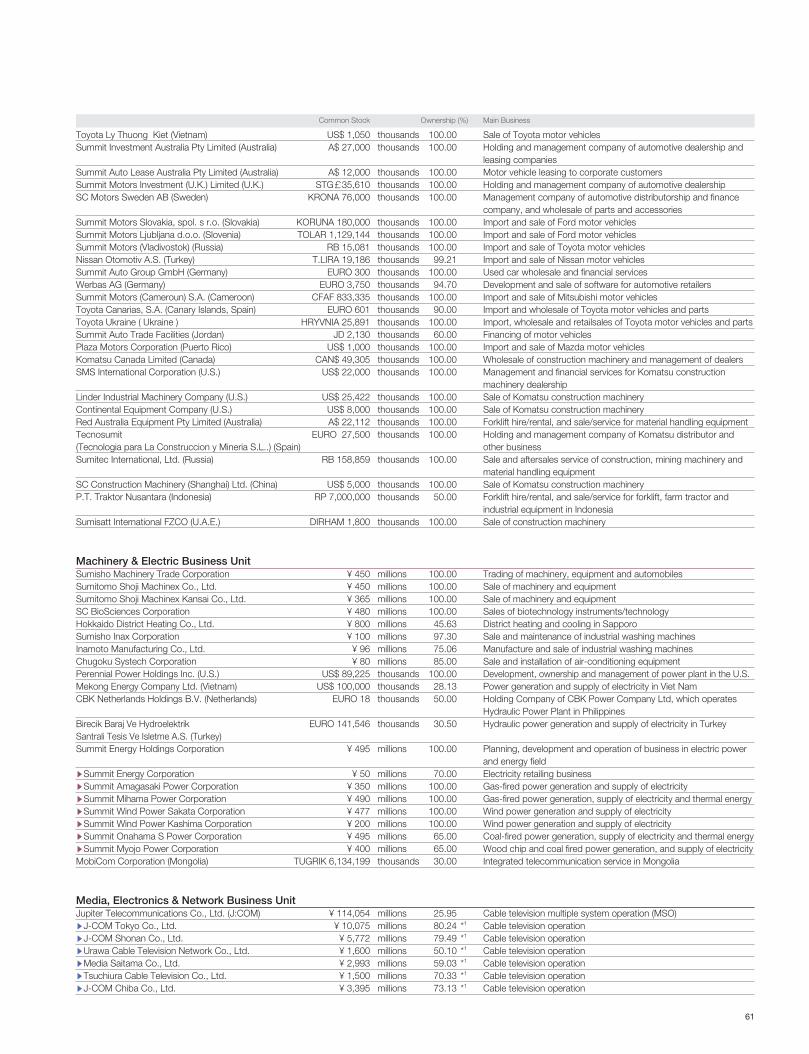
61
Toyota Ly Thuong Kiet (Vietnam) US$ 1,050 thousands 100.00 Sale of Toyota motor vehiclesSummit Investment Australia Pty Limited (Australia) A$ 27,000 thousands 100.00 Holding and management company of automotive dealership and
leasing companiesSummit Auto Lease Australia Pty Limited (Australia) A$ 12,000 thousands 100.00 Motor vehicle leasing to corporate customersSummit Motors Investment (U.K.) Limited (U.K.) STG£35,610 thousands 100.00 Holding and management company of automotive dealershipSC Motors Sweden AB (Sweden) KRONA 76,000 thousands 100.00 Management company of automotive distributorship and finance
company, and wholesale of parts and accessoriesSummit Motors Slovakia, spol. s r.o. (Slovakia) KORUNA 180,000 thousands 100.00 Import and sale of Ford motor vehiclesSummit Motors Ljubljana d.o.o. (Slovenia) TOLAR 1,129,144 thousands 100.00 Import and sale of Ford motor vehiclesSummit Motors (Vladivostok) (Russia) RB 15,081 thousands 100.00 Import and sale of Toyota motor vehiclesNissan Otomotiv A.S. (Turkey) T.LIRA 19,186 thousands 99.21 Import and sale of Nissan motor vehiclesSummit Auto Group GmbH (Germany) EURO 300 thousands 100.00 Used car wholesale and financial servicesWerbas AG (Germany) EURO 3,750 thousands 94.70 Development and sale of software for automotive retailersSummit Motors (Cameroun) S.A. (Cameroon) CFAF 833,335 thousands 100.00 Import and sale of Mitsubishi motor vehiclesToyota Canarias, S.A. (Canary Islands, Spain) EURO 601 thousands 90.00 Import and wholesale of Toyota motor vehicles and parts Toyota Ukraine ( Ukraine ) HRYVNIA 25,891 thousands 100.00 Import, wholesale and retailsales of Toyota motor vehicles and partsSummit Auto Trade Facilities (Jordan) JD 2,130 thousands 60.00 Financing of motor vehiclesPlaza Motors Corporation (Puerto Rico) US$ 1,000 thousands 100.00 Import and sale of Mazda motor vehiclesKomatsu Canada Limited (Canada) CAN$ 49,305 thousands 100.00 Wholesale of construction machinery and management of dealersSMS International Corporation (U.S.) US$ 22,000 thousands 100.00 Management and financial services for Komatsu construction
machinery dealershipLinder Industrial Machinery Company (U.S.) US$ 25,422 thousands 100.00 Sale of Komatsu construction machineryContinental Equipment Company (U.S.) US$ 8,000 thousands 100.00 Sale of Komatsu construction machineryRed Australia Equipment Pty Limited (Australia) A$ 22,112 thousands 100.00 Forklift hire/rental, and sale/service for material handling equipmentTecnosumit EURO 27,500 thousands 100.00 Holding and management company of Komatsu distributor and(Tecnologia para La Construccion y Mineria S.L..) (Spain) other businessSumitec International, Ltd. (Russia) RB 158,859 thousands 100.00 Sale and aftersales service of construction, mining machinery and
material handling equipmentSC Construction Machinery (Shanghai) Ltd. (China) US$ 5,000 thousands 100.00 Sale of Komatsu construction machineryP.T. Traktor Nusantara (Indonesia) RP 7,000,000 thousands 50.00 Forklift hire/rental, and sale/service for forklift, farm tractor and
industrial equipment in IndonesiaSumisatt International FZCO (U.A.E.) DIRHAM 1,800 thousands 100.00 Sale of construction machinery
Machinery & Electric Business UnitSumisho Machinery Trade Corporation ¥ 450 millions 100.00 Trading of machinery, equipment and automobilesSumitomo Shoji Machinex Co., Ltd. ¥ 450 millions 100.00 Sale of machinery and equipmentSumitomo Shoji Machinex Kansai Co., Ltd. ¥ 365 millions 100.00 Sale of machinery and equipmentSC BioSciences Corporation ¥ 480 millions 100.00 Sales of biotechnology instruments/technologyHokkaido District Heating Co., Ltd. ¥ 800 millions 45.63 District heating and cooling in SapporoSumisho Inax Corporation ¥ 100 millions 97.30 Sale and maintenance of industrial washing machinesInamoto Manufacturing Co., Ltd. ¥ 96 millions 75.06 Manufacture and sale of industrial washing machinesChugoku Systech Corporation ¥ 80 millions 85.00 Sale and installation of air-conditioning equipmentPerennial Power Holdings Inc. (U.S.) US$ 89,225 thousands 100.00 Development, ownership and management of power plant in the U.S.Mekong Energy Company Ltd. (Vietnam) US$ 100,000 thousands 28.13 Power generation and supply of electricity in Viet NamCBK Netherlands Holdings B.V. (Netherlands) EURO 18 thousands 50.00 Holding Company of CBK Power Company Ltd, which operates
Hydraulic Power Plant in PhilippinesBirecik Baraj Ve Hydroelektrik EURO 141,546 thousands 30.50 Hydraulic power generation and supply of electricity in TurkeySantrali Tesis Ve Isletme A.S. (Turkey)Summit Energy Holdings Corporation ¥ 495 millions 100.00 Planning, development and operation of business in electric power
and energy field sSummit Energy Corporation ¥ 50 millions 70.00 Electricity retailing businesssSummit Amagasaki Power Corporation ¥ 350 millions 100.00 Gas-fired power generation and supply of electricitysSummit Mihama Power Corporation ¥ 490 millions 100.00 Gas-fired power generation, supply of electricity and thermal energysSummit Wind Power Sakata Corporation ¥ 477 millions 100.00 Wind power generation and supply of electricitysSummit Wind Power Kashima Corporation ¥ 200 millions 100.00 Wind power generation and supply of electricitysSummit Onahama S Power Corporation ¥ 495 millions 65.00 Coal-fired power generation, supply of electricity and thermal energysSummit Myojo Power Corporation ¥ 400 millions 65.00 Wood chip and coal fired power generation, and supply of electricityMobiCom Corporation (Mongolia) TUGRIK 6,134,199 thousands 30.00 Integrated telecommunication service in Mongolia
Media, Electronics & Network Business UnitJupiter Telecommunications Co., Ltd. (J:COM) ¥ 114,054 millions 25.95 Cable television multiple system operation (MSO)sJ-COM Tokyo Co., Ltd. ¥ 10,075 millions 80.24 *1 Cable television operationsJ-COM Shonan Co., Ltd. ¥ 5,772 millions 79.49 *1 Cable television operationsUrawa Cable Television Network Co., Ltd. ¥ 1,600 millions 50.10 *1 Cable television operationsMedia Saitama Co., Ltd. ¥ 2,993 millions 59.03 *1 Cable television operationsTsuchiura Cable Television Co., Ltd. ¥ 1,500 millions 70.33 *1 Cable television operationsJ-COM Chiba Co., Ltd. ¥ 3,395 millions 73.13 *1 Cable television operation
Common Stock Ownership (%) Main Business
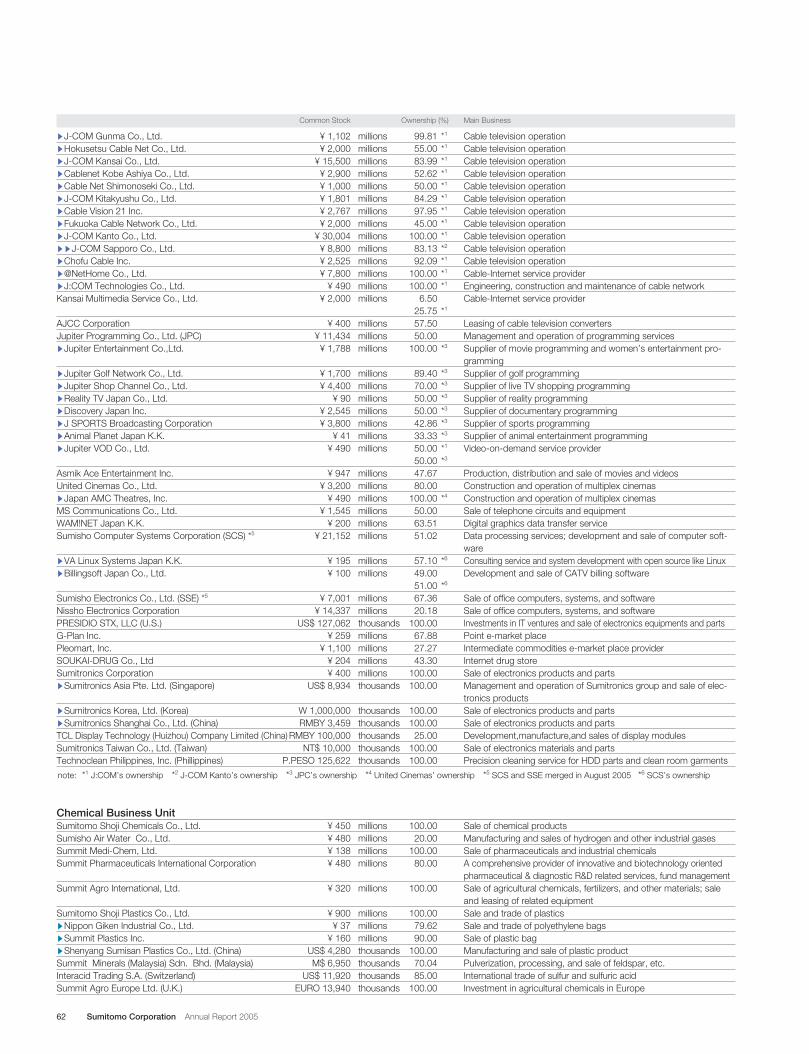
62 Sumitomo Corporation Annual Report 2005
sJ-COM Gunma Co., Ltd. ¥ 1,102 millions 99.81 *1 Cable television operationsHokusetsu Cable Net Co., Ltd. ¥ 2,000 millions 55.00 *1 Cable television operationsJ-COM Kansai Co., Ltd. ¥ 15,500 millions 83.99 *1 Cable television operationsCablenet Kobe Ashiya Co., Ltd. ¥ 2,900 millions 52.62 *1 Cable television operationsCable Net Shimonoseki Co., Ltd. ¥ 1,000 millions 50.00 *1 Cable television operationsJ-COM Kitakyushu Co., Ltd. ¥ 1,801 millions 84.29 *1 Cable television operationsCable Vision 21 Inc. ¥ 2,767 millions 97.95 *1 Cable television operationsFukuoka Cable Network Co., Ltd. ¥ 2,000 millions 45.00 *1 Cable television operationsJ-COM Kanto Co., Ltd. ¥ 30,004 millions 100.00 *1 Cable television operationssJ-COM Sapporo Co., Ltd. ¥ 8,800 millions 83.13 *2 Cable television operationsChofu Cable Inc. ¥ 2,525 millions 92.09 *1 Cable television operations@NetHome Co., Ltd. ¥ 7,800 millions 100.00 *1 Cable-Internet service providersJ:COM Technologies Co., Ltd. ¥ 490 millions 100.00 *1 Engineering, construction and maintenance of cable network Kansai Multimedia Service Co., Ltd. ¥ 2,000 millions 6.50 Cable-Internet service provider
25.75 *1
AJCC Corporation ¥ 400 millions 57.50 Leasing of cable television convertersJupiter Programming Co., Ltd. (JPC) ¥ 11,434 millions 50.00 Management and operation of programming servicessJupiter Entertainment Co.,Ltd. ¥ 1,788 millions 100.00 *3 Supplier of movie programming and women’s entertainment pro-
grammingsJupiter Golf Network Co., Ltd. ¥ 1,700 millions 89.40 *3 Supplier of golf programmingsJupiter Shop Channel Co., Ltd. ¥ 4,400 millions 70.00 *3 Supplier of live TV shopping programmingsReality TV Japan Co., Ltd. ¥ 90 millions 50.00 *3 Supplier of reality programmingsDiscovery Japan Inc. ¥ 2,545 millions 50.00 *3 Supplier of documentary programmingsJ SPORTS Broadcasting Corporation ¥ 3,800 millions 42.86 *3 Supplier of sports programmingsAnimal Planet Japan K.K. ¥ 41 millions 33.33 *3 Supplier of animal entertainment programmingsJupiter VOD Co., Ltd. ¥ 490 millions 50.00 *1 Video-on-demand service provider
50.00 *3
Asmik Ace Entertainment Inc. ¥ 947 millions 47.67 Production, distribution and sale of movies and videos United Cinemas Co., Ltd. ¥ 3,200 millions 80.00 Construction and operation of multiplex cinemassJapan AMC Theatres, Inc. ¥ 490 millions 100.00 *4 Construction and operation of multiplex cinemasMS Communications Co., Ltd. ¥ 1,545 millions 50.00 Sale of telephone circuits and equipmentWAM!NET Japan K.K. ¥ 200 millions 63.51 Digital graphics data transfer serviceSumisho Computer Systems Corporation (SCS) *5 ¥ 21,152 millions 51.02 Data processing services; development and sale of computer soft-
waresVA Linux Systems Japan K.K. ¥ 195 millions 57.10 *6 Consulting service and system development with open source like LinuxsBillingsoft Japan Co., Ltd. ¥ 100 millions 49.00 Development and sale of CATV billing software
51.00 *6
Sumisho Electronics Co., Ltd. (SSE) *5 ¥ 7,001 millions 67.36 Sale of office computers, systems, and softwareNissho Electronics Corporation ¥ 14,337 millions 20.18 Sale of office computers, systems, and softwarePRESIDIO STX, LLC (U.S.) US$ 127,062 thousands 100.00 Investments in IT ventures and sale of electronics equipments and partsG-Plan Inc. ¥ 259 millions 67.88 Point e-market placePleomart, Inc. ¥ 1,100 millions 27.27 Intermediate commodities e-market place providerSOUKAI-DRUG Co., Ltd ¥ 204 millions 43.30 Internet drug storeSumitronics Corporation ¥ 400 millions 100.00 Sale of electronics products and partssSumitronics Asia Pte. Ltd. (Singapore) US$ 8,934 thousands 100.00 Management and operation of Sumitronics group and sale of elec-
tronics productssSumitronics Korea, Ltd. (Korea) W 1,000,000 thousands 100.00 Sale of electronics products and partssSumitronics Shanghai Co., Ltd. (China) RMBY 3,459 thousands 100.00 Sale of electronics products and partsTCL Display Technology (Huizhou) Company Limited (China) RMBY 100,000 thousands 25.00 Development,manufacture,and sales of display modulesSumitronics Taiwan Co., Ltd. (Taiwan) NT$ 10,000 thousands 100.00 Sale of electronics materials and partsTechnoclean Philippines, Inc. (Phillippines) P.PESO 125,622 thousands 100.00 Precision cleaning service for HDD parts and clean room garments
Chemical Business UnitSumitomo Shoji Chemicals Co., Ltd. ¥ 450 millions 100.00 Sale of chemical productsSumisho Air Water Co., Ltd. ¥ 480 millions 20.00 Manufacturing and sales of hydrogen and other industrial gasesSummit Medi-Chem, Ltd. ¥ 138 millions 100.00 Sale of pharmaceuticals and industrial chemicalsSummit Pharmaceuticals International Corporation ¥ 480 millions 80.00 A comprehensive provider of innovative and biotechnology oriented
pharmaceutical & diagnostic R&D related services, fund managementSummit Agro International, Ltd. ¥ 320 millions 100.00 Sale of agricultural chemicals, fertilizers, and other materials; sale
and leasing of related equipmentSumitomo Shoji Plastics Co., Ltd. ¥ 900 millions 100.00 Sale and trade of plasticssNippon Giken Industrial Co., Ltd. ¥ 37 millions 79.62 Sale and trade of polyethylene bagssSummit Plastics Inc. ¥ 160 millions 90.00 Sale of plastic bagsShenyang Sumisan Plastics Co., Ltd. (China) US$ 4,280 thousands 100.00 Manufacturing and sale of plastic productSummit Minerals (Malaysia) Sdn. Bhd. (Malaysia) M$ 6,950 thousands 70.04 Pulverization, processing, and sale of feldspar, etc.Interacid Trading S.A. (Switzerland) US$ 11,920 thousands 85.00 International trade of sulfur and sulfuric acid Summit Agro Europe Ltd. (U.K.) EURO 13,940 thousands 100.00 Investment in agricultural chemicals in Europe
note: *1 J:COM’s ownership *2 J-COM Kanto’s ownership *3 JPC’s ownership *4 United Cinemas’ ownership *5 SCS and SSE merged in August 2005 *6 SCS’s ownership
Common Stock Ownership (%) Main Business
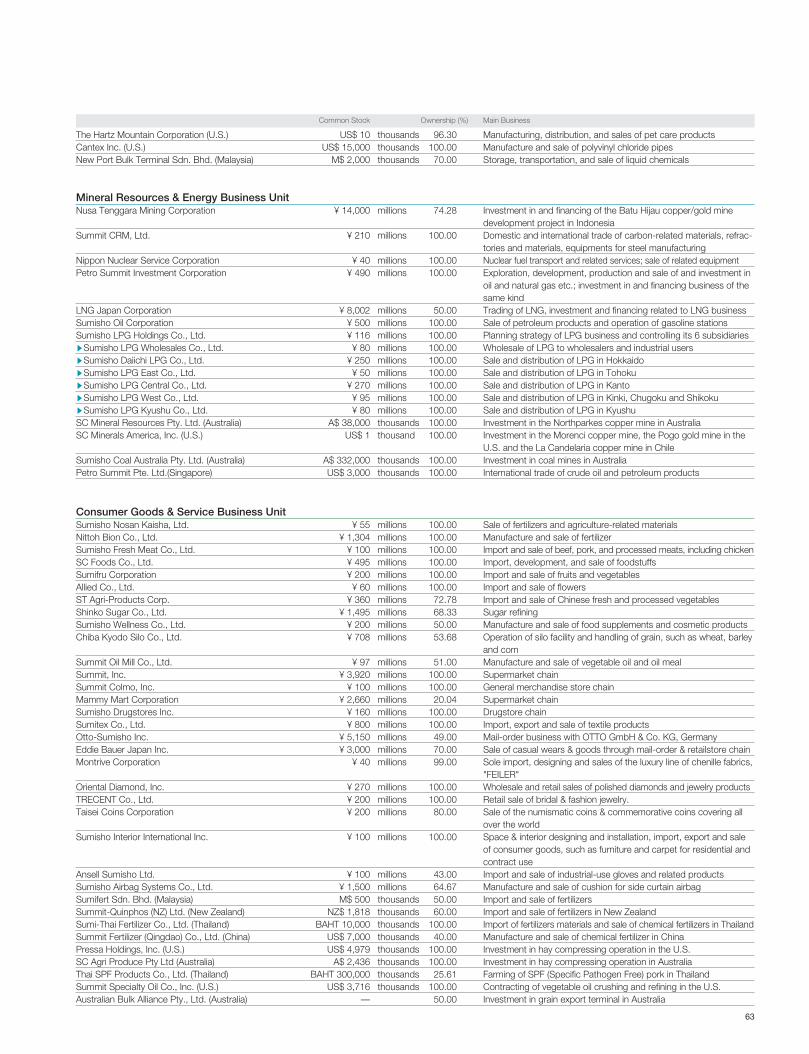
63
The Hartz Mountain Corporation (U.S.) US$ 10 thousands 96.30 Manufacturing, distribution, and sales of pet care productsCantex Inc. (U.S.) US$ 15,000 thousands 100.00 Manufacture and sale of polyvinyl chloride pipesNew Port Bulk Terminal Sdn. Bhd. (Malaysia) M$ 2,000 thousands 70.00 Storage, transportation, and sale of liquid chemicals
Mineral Resources & Energy Business UnitNusa Tenggara Mining Corporation ¥ 14,000 millions 74.28 Investment in and financing of the Batu Hijau copper/gold mine
development project in IndonesiaSummit CRM, Ltd. ¥ 210 millions 100.00 Domestic and international trade of carbon-related materials, refrac-
tories and materials, equipments for steel manufacturingNippon Nuclear Service Corporation ¥ 40 millions 100.00 Nuclear fuel transport and related services; sale of related equipmentPetro Summit Investment Corporation ¥ 490 millions 100.00 Exploration, development, production and sale of and investment in
oil and natural gas etc.; investment in and financing business of thesame kind
LNG Japan Corporation ¥ 8,002 millions 50.00 Trading of LNG, investment and financing related to LNG businessSumisho Oil Corporation ¥ 500 millions 100.00 Sale of petroleum products and operation of gasoline stationsSumisho LPG Holdings Co., Ltd. ¥ 116 millions 100.00 Planning strategy of LPG business and controlling its 6 subsidiariessSumisho LPG Wholesales Co., Ltd. ¥ 80 millions 100.00 Wholesale of LPG to wholesalers and industrial userssSumisho Daiichi LPG Co., Ltd. ¥ 250 millions 100.00 Sale and distribution of LPG in HokkaidosSumisho LPG East Co., Ltd. ¥ 50 millions 100.00 Sale and distribution of LPG in TohokusSumisho LPG Central Co., Ltd. ¥ 270 millions 100.00 Sale and distribution of LPG in KantosSumisho LPG West Co., Ltd. ¥ 95 millions 100.00 Sale and distribution of LPG in Kinki, Chugoku and ShikokusSumisho LPG Kyushu Co., Ltd. ¥ 80 millions 100.00 Sale and distribution of LPG in KyushuSC Mineral Resources Pty. Ltd. (Australia) A$ 38,000 thousands 100.00 Investment in the Northparkes copper mine in AustraliaSC Minerals America, Inc. (U.S.) US$ 1 thousand 100.00 Investment in the Morenci copper mine, the Pogo gold mine in the
U.S. and the La Candelaria copper mine in ChileSumisho Coal Australia Pty. Ltd. (Australia) A$ 332,000 thousands 100.00 Investment in coal mines in AustraliaPetro Summit Pte. Ltd.(Singapore) US$ 3,000 thousands 100.00 International trade of crude oil and petroleum products
Consumer Goods & Service Business UnitSumisho Nosan Kaisha, Ltd. ¥ 55 millions 100.00 Sale of fertilizers and agriculture-related materialsNittoh Bion Co., Ltd. ¥ 1,304 millions 100.00 Manufacture and sale of fertilizerSumisho Fresh Meat Co., Ltd. ¥ 100 millions 100.00 Import and sale of beef, pork, and processed meats, including chickenSC Foods Co., Ltd. ¥ 495 millions 100.00 Import, development, and sale of foodstuffsSumifru Corporation ¥ 200 millions 100.00 Import and sale of fruits and vegetablesAllied Co., Ltd. ¥ 60 millions 100.00 Import and sale of flowersST Agri-Products Corp. ¥ 360 millions 72.78 Import and sale of Chinese fresh and processed vegetables Shinko Sugar Co., Ltd. ¥ 1,495 millions 68.33 Sugar refiningSumisho Wellness Co., Ltd. ¥ 200 millions 50.00 Manufacture and sale of food supplements and cosmetic productsChiba Kyodo Silo Co., Ltd. ¥ 708 millions 53.68 Operation of silo facility and handling of grain, such as wheat, barley
and cornSummit Oil Mill Co., Ltd. ¥ 97 millions 51.00 Manufacture and sale of vegetable oil and oil mealSummit, Inc. ¥ 3,920 millions 100.00 Supermarket chainSummit Colmo, Inc. ¥ 100 millions 100.00 General merchandise store chainMammy Mart Corporation ¥ 2,660 millions 20.04 Supermarket chainSumisho Drugstores Inc. ¥ 160 millions 100.00 Drugstore chainSumitex Co., Ltd. ¥ 800 millions 100.00 Import, export and sale of textile productsOtto-Sumisho Inc. ¥ 5,150 millions 49.00 Mail-order business with OTTO GmbH & Co. KG, GermanyEddie Bauer Japan Inc. ¥ 3,000 millions 70.00 Sale of casual wears & goods through mail-order & retailstore chainMontrive Corporation ¥ 40 millions 99.00 Sole import, designing and sales of the luxury line of chenille fabrics,
"FEILER" Oriental Diamond, Inc. ¥ 270 millions 100.00 Wholesale and retail sales of polished diamonds and jewelry productsTRECENT Co., Ltd. ¥ 200 millions 100.00 Retail sale of bridal & fashion jewelry.Taisei Coins Corporation ¥ 200 millions 80.00 Sale of the numismatic coins & commemorative coins covering all
over the worldSumisho Interior International Inc. ¥ 100 millions 100.00 Space & interior designing and installation, import, export and sale
of consumer goods, such as furniture and carpet for residential andcontract use
Ansell Sumisho Ltd. ¥ 100 millions 43.00 Import and sale of industrial-use gloves and related productsSumisho Airbag Systems Co., Ltd. ¥ 1,500 millions 64.67 Manufacture and sale of cushion for side curtain airbagSumifert Sdn. Bhd. (Malaysia) M$ 500 thousands 50.00 Import and sale of fertilizersSummit-Quinphos (NZ) Ltd. (New Zealand) NZ$ 1,818 thousands 60.00 Import and sale of fertilizers in New ZealandSumi-Thai Fertilizer Co., Ltd. (Thailand) BAHT 10,000 thousands 100.00 Import of fertilizers materials and sale of chemical fertilizers in ThailandSummit Fertilizer (Qingdao) Co., Ltd. (China) US$ 7,000 thousands 40.00 Manufacture and sale of chemical fertilizer in ChinaPressa Holdings, Inc. (U.S.) US$ 4,979 thousands 100.00 Investment in hay compressing operation in the U.S.SC Agri Produce Pty Ltd (Australia) A$ 2,436 thousands 100.00 Investment in hay compressing operation in AustraliaThai SPF Products Co., Ltd. (Thailand) BAHT 300,000 thousands 25.61 Farming of SPF (Specific Pathogen Free) pork in ThailandSummit Specialty Oil Co., Inc. (U.S.) US$ 3,716 thousands 100.00 Contracting of vegetable oil crushing and refining in the U.S.Australian Bulk Alliance Pty., Ltd. (Australia) — 50.00 Investment in grain export terminal in Australia
Common Stock Ownership (%) Main Business
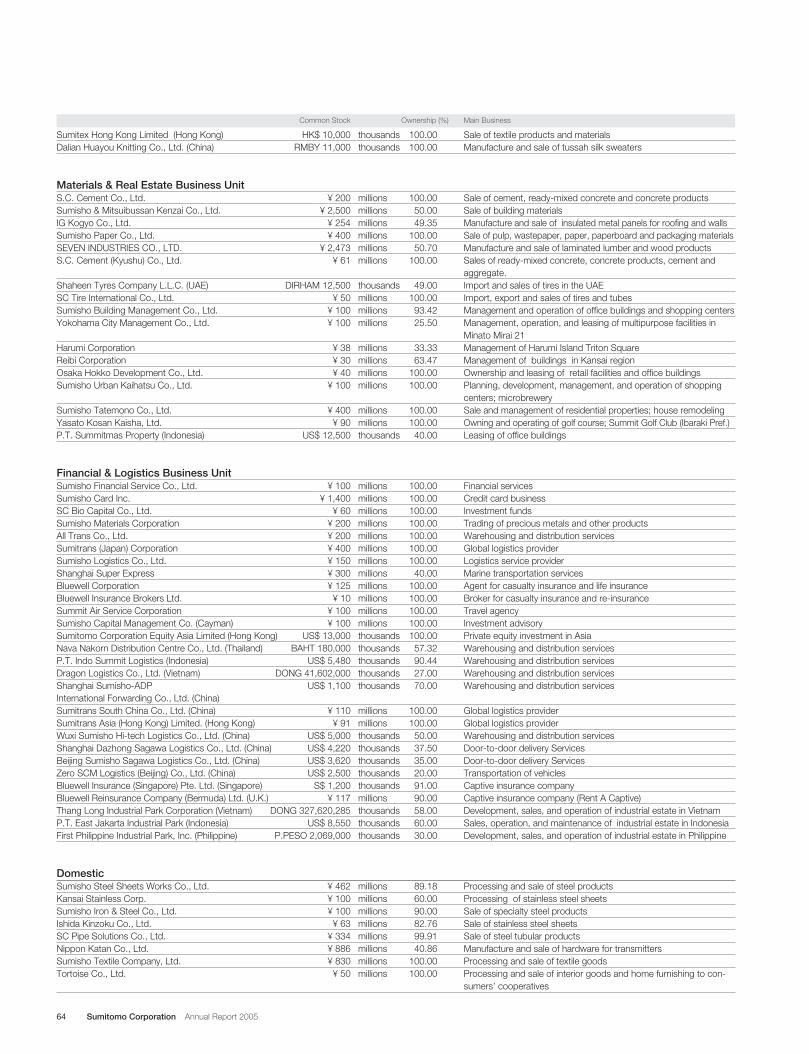
64 Sumitomo Corporation Annual Report 2005
Sumitex Hong Kong Limited (Hong Kong) HK$ 10,000 thousands 100.00 Sale of textile products and materialsDalian Huayou Knitting Co., Ltd. (China) RMBY 11,000 thousands 100.00 Manufacture and sale of tussah silk sweaters
Materials & Real Estate Business UnitS.C. Cement Co., Ltd. ¥ 200 millions 100.00 Sale of cement, ready-mixed concrete and concrete productsSumisho & Mitsuibussan Kenzai Co., Ltd. ¥ 2,500 millions 50.00 Sale of building materialsIG Kogyo Co., Ltd. ¥ 254 millions 49.35 Manufacture and sale of insulated metal panels for roofing and wallsSumisho Paper Co., Ltd. ¥ 400 millions 100.00 Sale of pulp, wastepaper, paper, paperboard and packaging materialsSEVEN INDUSTRIES CO., LTD. ¥ 2,473 millions 50.70 Manufacture and sale of laminated lumber and wood productsS.C. Cement (Kyushu) Co., Ltd. ¥ 61 millions 100.00 Sales of ready-mixed concrete, concrete products, cement and
aggregate.Shaheen Tyres Company L.L.C. (UAE) DIRHAM 12,500 thousands 49.00 Import and sales of tires in the UAESC Tire International Co., Ltd. ¥ 50 millions 100.00 Import, export and sales of tires and tubesSumisho Building Management Co., Ltd. ¥ 100 millions 93.42 Management and operation of office buildings and shopping centersYokohama City Management Co., Ltd. ¥ 100 millions 25.50 Management, operation, and leasing of multipurpose facilities in
Minato Mirai 21Harumi Corporation ¥ 38 millions 33.33 Management of Harumi Island Triton SquareReibi Corporation ¥ 30 millions 63.47 Management of buildings in Kansai regionOsaka Hokko Development Co., Ltd. ¥ 40 millions 100.00 Ownership and leasing of retail facilities and office buildingsSumisho Urban Kaihatsu Co., Ltd. ¥ 100 millions 100.00 Planning, development, management, and operation of shopping
centers; microbrewery Sumisho Tatemono Co., Ltd. ¥ 400 millions 100.00 Sale and management of residential properties; house remodeling Yasato Kosan Kaisha, Ltd. ¥ 90 millions 100.00 Owning and operating of golf course; Summit Golf Club (Ibaraki Pref.)P.T. Summitmas Property (Indonesia) US$ 12,500 thousands 40.00 Leasing of office buildings
Financial & Logistics Business UnitSumisho Financial Service Co., Ltd. ¥ 100 millions 100.00 Financial servicesSumisho Card Inc. ¥ 1,400 millions 100.00 Credit card businessSC Bio Capital Co., Ltd. ¥ 60 millions 100.00 Investment fundsSumisho Materials Corporation ¥ 200 millions 100.00 Trading of precious metals and other productsAll Trans Co., Ltd. ¥ 200 millions 100.00 Warehousing and distribution servicesSumitrans (Japan) Corporation ¥ 400 millions 100.00 Global logistics providerSumisho Logistics Co., Ltd. ¥ 150 millions 100.00 Logistics service providerShanghai Super Express ¥ 300 millions 40.00 Marine transportation servicesBluewell Corporation ¥ 125 millions 100.00 Agent for casualty insurance and life insuranceBluewell Insurance Brokers Ltd. ¥ 10 millions 100.00 Broker for casualty insurance and re-insuranceSummit Air Service Corporation ¥ 100 millions 100.00 Travel agencySumisho Capital Management Co. (Cayman) ¥ 100 millions 100.00 Investment advisorySumitomo Corporation Equity Asia Limited (Hong Kong) US$ 13,000 thousands 100.00 Private equity investment in AsiaNava Nakorn Distribution Centre Co., Ltd. (Thailand) BAHT 180,000 thousands 57.32 Warehousing and distribution servicesP.T. Indo Summit Logistics (Indonesia) US$ 5,480 thousands 90.44 Warehousing and distribution servicesDragon Logistics Co., Ltd. (Vietnam) DONG 41,602,000 thousands 27.00 Warehousing and distribution servicesShanghai Sumisho-ADP US$ 1,100 thousands 70.00 Warehousing and distribution servicesInternational Forwarding Co., Ltd. (China)Sumitrans South China Co., Ltd. (China) ¥ 110 millions 100.00 Global logistics providerSumitrans Asia (Hong Kong) Limited. (Hong Kong) ¥ 91 millions 100.00 Global logistics providerWuxi Sumisho Hi-tech Logistics Co., Ltd. (China) US$ 5,000 thousands 50.00 Warehousing and distribution servicesShanghai Dazhong Sagawa Logistics Co., Ltd. (China) US$ 4,220 thousands 37.50 Door-to-door delivery ServicesBeijing Sumisho Sagawa Logistics Co., Ltd. (China) US$ 3,620 thousands 35.00 Door-to-door delivery ServicesZero SCM Logistics (Beijing) Co., Ltd. (China) US$ 2,500 thousands 20.00 Transportation of vehiclesBluewell Insurance (Singapore) Pte. Ltd. (Singapore) S$ 1,200 thousands 91.00 Captive insurance companyBluewell Reinsurance Company (Bermuda) Ltd. (U.K.) ¥ 117 millions 90.00 Captive insurance company (Rent A Captive)Thang Long Industrial Park Corporation (Vietnam) DONG 327,620,285 thousands 58.00 Development, sales, and operation of industrial estate in VietnamP.T. East Jakarta Industrial Park (Indonesia) US$ 8,550 thousands 60.00 Sales, operation, and maintenance of industrial estate in IndonesiaFirst Philippine Industrial Park, Inc. (Philippine) P.PESO 2,069,000 thousands 30.00 Development, sales, and operation of industrial estate in Philippine
DomesticSumisho Steel Sheets Works Co., Ltd. ¥ 462 millions 89.18 Processing and sale of steel productsKansai Stainless Corp. ¥ 100 millions 60.00 Processing of stainless steel sheetsSumisho Iron & Steel Co., Ltd. ¥ 100 millions 90.00 Sale of specialty steel productsIshida Kinzoku Co., Ltd. ¥ 63 millions 82.76 Sale of stainless steel sheetsSC Pipe Solutions Co., Ltd. ¥ 334 millions 99.91 Sale of steel tubular productsNippon Katan Co., Ltd. ¥ 886 millions 40.86 Manufacture and sale of hardware for transmittersSumisho Textile Company, Ltd. ¥ 830 millions 100.00 Processing and sale of textile goodsTortoise Co., Ltd. ¥ 50 millions 100.00 Processing and sale of interior goods and home furnishing to con-
sumers’ cooperatives
Common Stock Ownership (%) Main Business
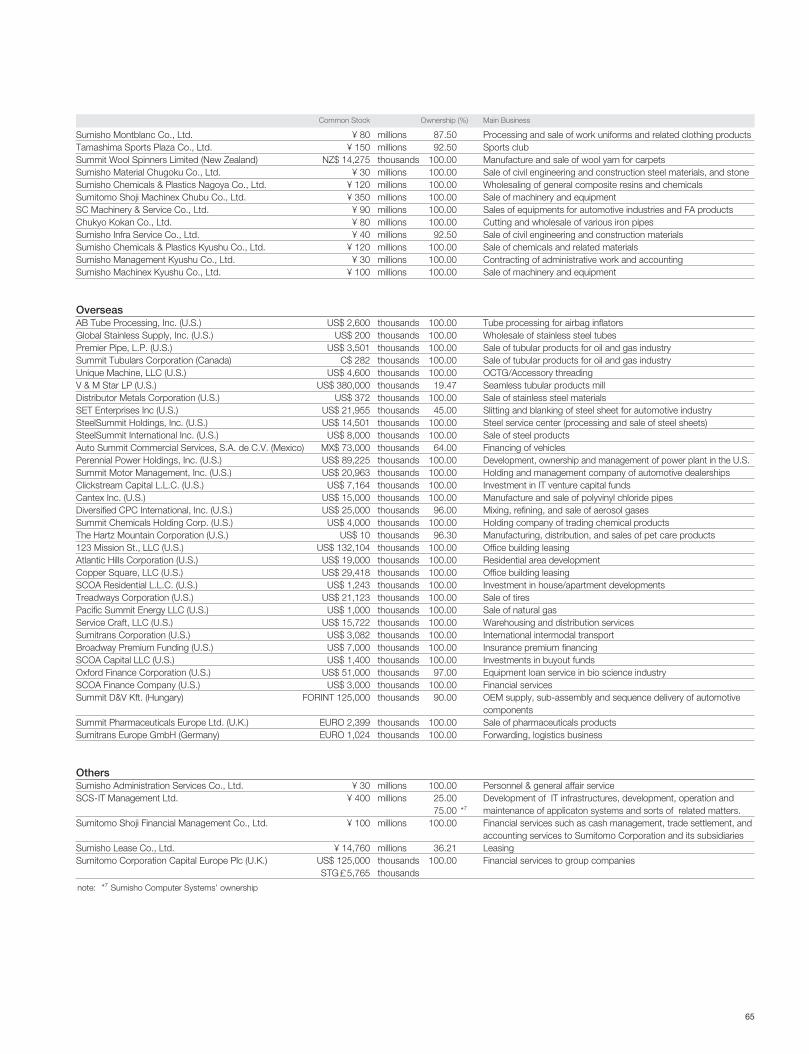
65
Sumisho Montblanc Co., Ltd. ¥ 80 millions 87.50 Processing and sale of work uniforms and related clothing productsTamashima Sports Plaza Co., Ltd. ¥ 150 millions 92.50 Sports clubSummit Wool Spinners Limited (New Zealand) NZ$ 14,275 thousands 100.00 Manufacture and sale of wool yarn for carpetsSumisho Material Chugoku Co., Ltd. ¥ 30 millions 100.00 Sale of civil engineering and construction steel materials, and stoneSumisho Chemicals & Plastics Nagoya Co., Ltd. ¥ 120 millions 100.00 Wholesaling of general composite resins and chemicalsSumitomo Shoji Machinex Chubu Co., Ltd. ¥ 350 millions 100.00 Sale of machinery and equipmentSC Machinery & Service Co., Ltd. ¥ 90 millions 100.00 Sales of equipments for automotive industries and FA products Chukyo Kokan Co., Ltd. ¥ 80 millions 100.00 Cutting and wholesale of various iron pipesSumisho Infra Service Co., Ltd. ¥ 40 millions 92.50 Sale of civil engineering and construction materialsSumisho Chemicals & Plastics Kyushu Co., Ltd. ¥ 120 millions 100.00 Sale of chemicals and related materialsSumisho Management Kyushu Co., Ltd. ¥ 30 millions 100.00 Contracting of administrative work and accountingSumisho Machinex Kyushu Co., Ltd. ¥ 100 millions 100.00 Sale of machinery and equipment
OverseasAB Tube Processing, Inc. (U.S.) US$ 2,600 thousands 100.00 Tube processing for airbag inflatorsGlobal Stainless Supply, Inc. (U.S.) US$ 200 thousands 100.00 Wholesale of stainless steel tubesPremier Pipe, L.P. (U.S.) US$ 3,501 thousands 100.00 Sale of tubular products for oil and gas industry Summit Tubulars Corporation (Canada) C$ 282 thousands 100.00 Sale of tubular products for oil and gas industryUnique Machine, LLC (U.S.) US$ 4,600 thousands 100.00 OCTG/Accessory threadingV & M Star LP (U.S.) US$ 380,000 thousands 19.47 Seamless tubular products millDistributor Metals Corporation (U.S.) US$ 372 thousands 100.00 Sale of stainless steel materialsSET Enterprises Inc (U.S.) US$ 21,955 thousands 45.00 Slitting and blanking of steel sheet for automotive industrySteelSummit Holdings, Inc. (U.S.) US$ 14,501 thousands 100.00 Steel service center (processing and sale of steel sheets)SteelSummit International Inc. (U.S.) US$ 8,000 thousands 100.00 Sale of steel productsAuto Summit Commercial Services, S.A. de C.V. (Mexico) MX$ 73,000 thousands 64.00 Financing of vehiclesPerennial Power Holdings, Inc. (U.S.) US$ 89,225 thousands 100.00 Development, ownership and management of power plant in the U.S.Summit Motor Management, Inc. (U.S.) US$ 20,963 thousands 100.00 Holding and management company of automotive dealershipsClickstream Capital L.L.C. (U.S.) US$ 7,164 thousands 100.00 Investment in IT venture capital fundsCantex Inc. (U.S.) US$ 15,000 thousands 100.00 Manufacture and sale of polyvinyl chloride pipesDiversified CPC International, Inc. (U.S.) US$ 25,000 thousands 96.00 Mixing, refining, and sale of aerosol gasesSummit Chemicals Holding Corp. (U.S.) US$ 4,000 thousands 100.00 Holding company of trading chemical productsThe Hartz Mountain Corporation (U.S.) US$ 10 thousands 96.30 Manufacturing, distribution, and sales of pet care products123 Mission St., LLC (U.S.) US$ 132,104 thousands 100.00 Office building leasingAtlantic Hills Corporation (U.S.) US$ 19,000 thousands 100.00 Residential area development Copper Square, LLC (U.S.) US$ 29,418 thousands 100.00 Office building leasingSCOA Residential L.L.C. (U.S.) US$ 1,243 thousands 100.00 Investment in house/apartment developmentsTreadways Corporation (U.S.) US$ 21,123 thousands 100.00 Sale of tiresPacific Summit Energy LLC (U.S.) US$ 1,000 thousands 100.00 Sale of natural gasService Craft, LLC (U.S.) US$ 15,722 thousands 100.00 Warehousing and distribution servicesSumitrans Corporation (U.S.) US$ 3,082 thousands 100.00 International intermodal transportBroadway Premium Funding (U.S.) US$ 7,000 thousands 100.00 Insurance premium financingSCOA Capital LLC (U.S.) US$ 1,400 thousands 100.00 Investments in buyout fundsOxford Finance Corporation (U.S.) US$ 51,000 thousands 97.00 Equipment loan service in bio science industrySCOA Finance Company (U.S.) US$ 3,000 thousands 100.00 Financial servicesSummit D&V Kft. (Hungary) FORINT 125,000 thousands 90.00 OEM supply, sub-assembly and sequence delivery of automotive
componentsSummit Pharmaceuticals Europe Ltd. (U.K.) EURO 2,399 thousands 100.00 Sale of pharmaceuticals productsSumitrans Europe GmbH (Germany) EURO 1,024 thousands 100.00 Forwarding, logistics business
OthersSumisho Administration Services Co., Ltd. ¥ 30 millions 100.00 Personnel & general affair serviceSCS • IT Management Ltd. ¥ 400 millions 25.00 Development of IT infrastructures, development, operation and
75.00 *7 maintenance of applicaton systems and sorts of related matters.Sumitomo Shoji Financial Management Co., Ltd. ¥ 100 millions 100.00 Financial services such as cash management, trade settlement, and
accounting services to Sumitomo Corporation and its subsidiariesSumisho Lease Co., Ltd. ¥ 14,760 millions 36.21 LeasingSumitomo Corporation Capital Europe Plc (U.K.) US$ 125,000 thousands 100.00 Financial services to group companies
STG£5,765 thousands
note: *7 Sumisho Computer Systems’ ownership
Common Stock Ownership (%) Main Business
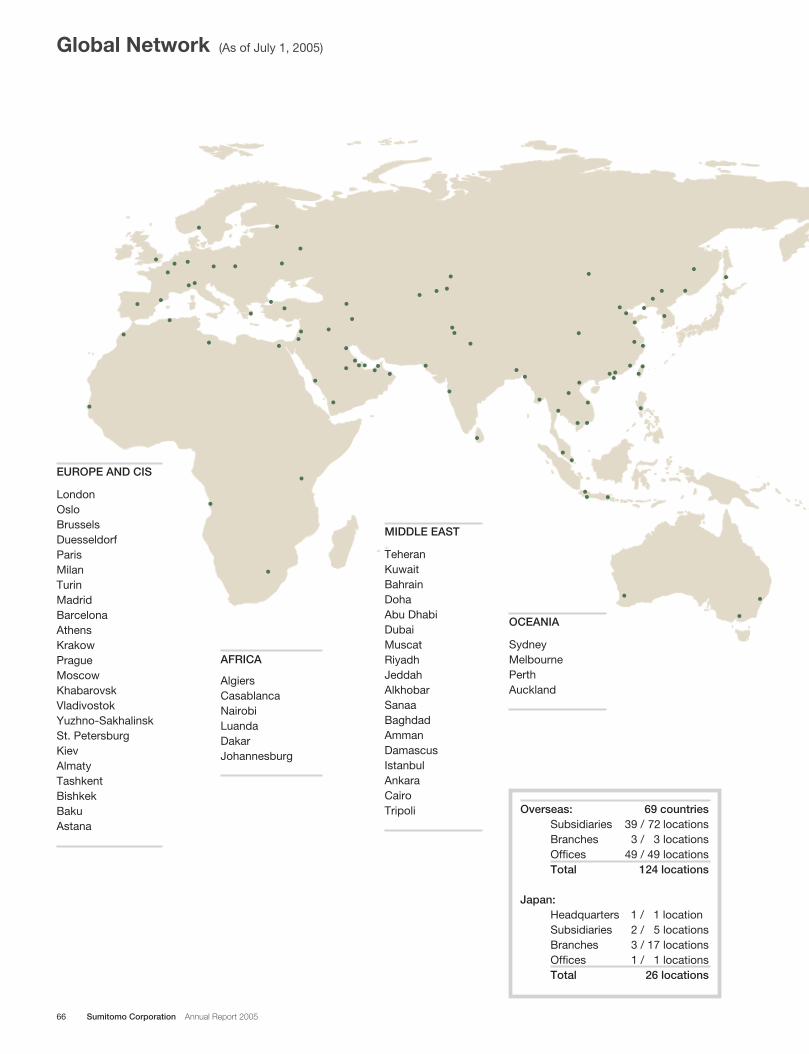
66 Sumitomo Corporation Annual Report 2005
Global Network (As of July 1, 2005)
AlgiersCasablancaNairobiLuandaDakarJohannesburg
AFRICA
OCEANIA
SydneyMelbournePerthAuckland
EUROPE AND CIS
LondonOsloBrusselsDuesseldorfParisMilanTurinMadridBarcelonaAthensKrakowPragueMoscowKhabarovskVladivostokYuzhno-SakhalinskSt. PetersburgKievAlmatyTashkentBishkekBakuAstana
MIDDLE EAST
TeheranKuwaitBahrainDohaAbu DhabiDubaiMuscatRiyadhJeddahAlkhobarSanaaBaghdadAmmanDamascusIstanbulAnkaraCairoTripoli Overseas: 69 countries
Subsidiaries 39 / 72 locationsBranches 3 / 3 locationsOffices 49 / 49 locationsTotal 124 locations
Japan: Headquarters 1 / 1 locationSubsidiaries 2 / 5 locationsBranches 3 / 17 locationsOffices 1 / 1 locationsTotal 26 locations

67
BeijingShanghaiChangchunDalianShenyangTianjinQingdaoNanjingChengduGuangzhouXiamenShenzhenHong KongTaipeiKaohsiungSeoulUlaanbaatarBangkokSingapore
ManilaKuala LumpurJakartaSurabayaBandungHanoiHo Chi Minh CityDanangPhnom PenhVientianeYangonNew DelhiMumbaiKarachiLahoreIslamabadColomboDhakaChittagong
ASIA
TokyoSapporoTomakomaiMuroranSendaiNiigataIbarakiToyamaShizuokaHamamatsuNagoyaKyoto
OsakaKobeHiroshimaTakamatsuNiihamaKita-KyushuFukuokaOitaNagasakiKumamotoKagoshimaNaha
JAPAN
New YorkDetroitPittsburghWashington, D.C.AtlantaChicagoHoustonPortlandLos AngelesVancouverCalgaryTorontoMontreal
NORTH AMERICA
Mexico CityMonterreyGuatemalaSan SalvadorHavanaPanamaQuitoCaracasBogotaLimaBuenos AiresSantiagoSao PauloRio de JaneiroPorto AlegreRecife
CENTRAL AMERICAANDSOUTH AMERICA

68 Sumitomo Corporation Annual Report 2005
69
Financial Section
70 Six-Year Financial Summary
72 Management’s Discussion and Analysis of Financial Condition andResults of Operations
86 Consolidated Balance Sheets
88 Consolidated Statements of Income
89 Consolidated Statements of Shareholders’ Equity andComprehensive Income
90 Consolidated Statements of Cash Flows
91 Notes to Consolidated Financial Statements
131 Independent Auditors’ Report
(Reference Information)
132 Risk Factors
Contents
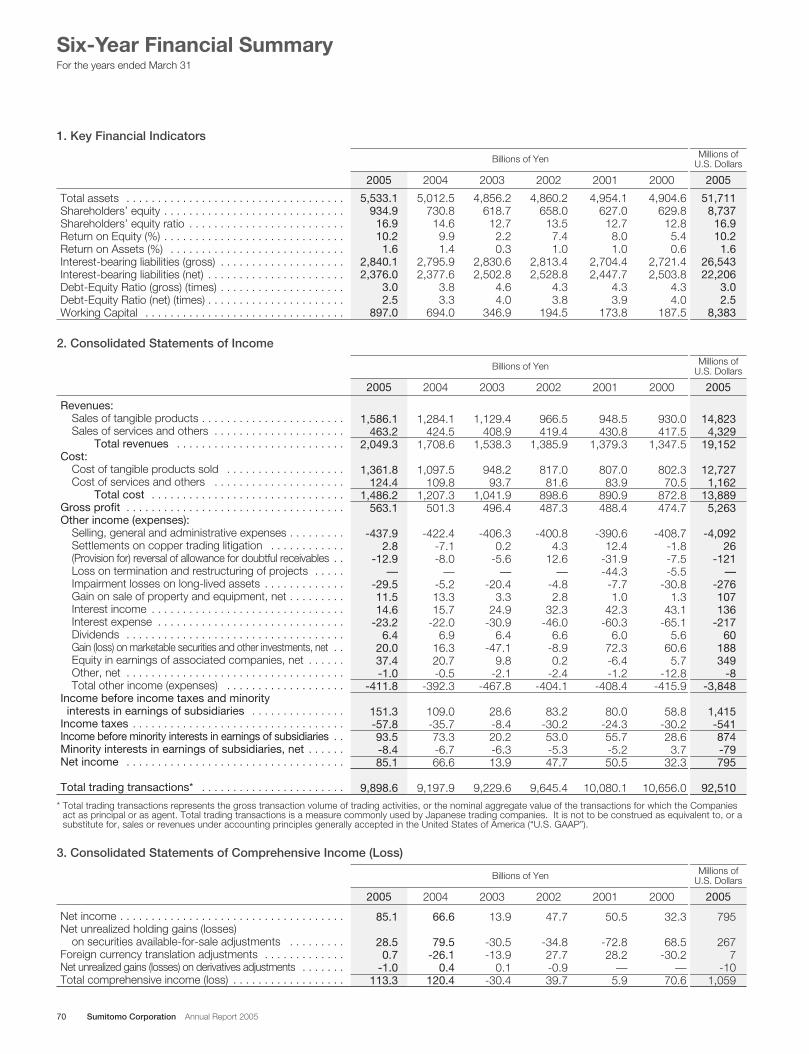
70 Sumitomo Corporation Annual Report 2005
Revenues:Sales of tangible products . . . . . . . . . . . . . . . . . . . . . . .Sales of services and others . . . . . . . . . . . . . . . . . . . . .
Total revenues . . . . . . . . . . . . . . . . . . . . . . . . . . .Cost:
Cost of tangible products sold . . . . . . . . . . . . . . . . . . .Cost of services and others . . . . . . . . . . . . . . . . . . . . .
Total cost . . . . . . . . . . . . . . . . . . . . . . . . . . . . . . .Gross profit . . . . . . . . . . . . . . . . . . . . . . . . . . . . . . . . . . .Other income (expenses):
Selling, general and administrative expenses . . . . . . . . .Settlements on copper trading litigation . . . . . . . . . . . .(Provision for) reversal of allowance for doubtful receivables . .Loss on termination and restructuring of projects . . . . .Impairment losses on long-lived assets . . . . . . . . . . . . .Gain on sale of property and equipment, net . . . . . . . . .Interest income . . . . . . . . . . . . . . . . . . . . . . . . . . . . . . .Interest expense . . . . . . . . . . . . . . . . . . . . . . . . . . . . . .Dividends . . . . . . . . . . . . . . . . . . . . . . . . . . . . . . . . . . .Gain (loss) on marketable securities and other investments, net . .Equity in earnings of associated companies, net . . . . . .Other, net . . . . . . . . . . . . . . . . . . . . . . . . . . . . . . . . . . .Total other income (expenses) . . . . . . . . . . . . . . . . . . .
Income before income taxes and minorityinterests in earnings of subsidiaries . . . . . . . . . . . . . . .
Income taxes . . . . . . . . . . . . . . . . . . . . . . . . . . . . . . . . . .Income before minority interests in earnings of subsidiaries . .Minority interests in earnings of subsidiaries, net . . . . . .Net income . . . . . . . . . . . . . . . . . . . . . . . . . . . . . . . . . . .
Total trading transactions* . . . . . . . . . . . . . . . . . . . . . . .
Total assets . . . . . . . . . . . . . . . . . . . . . . . . . . . . . . . . . . .Shareholders’ equity . . . . . . . . . . . . . . . . . . . . . . . . . . . . .Shareholders’ equity ratio . . . . . . . . . . . . . . . . . . . . . . . . .Return on Equity (%) . . . . . . . . . . . . . . . . . . . . . . . . . . . . .Return on Assets (%) . . . . . . . . . . . . . . . . . . . . . . . . . . . .Interest-bearing liabilities (gross) . . . . . . . . . . . . . . . . . . . .Interest-bearing liabilities (net) . . . . . . . . . . . . . . . . . . . . . .Debt-Equity Ratio (gross) (times) . . . . . . . . . . . . . . . . . . . .Debt-Equity Ratio (net) (times) . . . . . . . . . . . . . . . . . . . . . .Working Capital . . . . . . . . . . . . . . . . . . . . . . . . . . . . . . . .
Net income . . . . . . . . . . . . . . . . . . . . . . . . . . . . . . . . . . . .Net unrealized holding gains (losses)
on securities available-for-sale adjustments . . . . . . . . .Foreign currency translation adjustments . . . . . . . . . . . . .Net unrealized gains (losses) on derivatives adjustments . . . . . . .Total comprehensive income (loss) . . . . . . . . . . . . . . . . . .
Six-Year Financial SummaryFor the years ended March 31
32.3
68.5 -30.2
—70.6
795
267 7
-10 1,059
2001
50.5
-72.8 28.2
—5.9
2002
47.7
-34.8 27.7 -0.9 39.7
2003
13.9
-30.5 -13.9
0.1 -30.4
20042005 2000
Billions of Yen
4,904.6629.8
12.85.40.6
2,721.42,503.8
4.34.0
187.5
4,856.2618.7
12.72.20.3
2,830.62,502.8
4.64.0
346.9
20042005 2001
4,954.1627.0
12.78.01.0
2,704.42,447.7
4.33.9
173.8
2002
4,860.2658.0
13.57.41.0
2,813.42,528.8
4.33.8
194.5
2003 2000
Billions of Yen
930.0417.5
1,347.5
802.370.5
872.8474.7
-408.7-1.8-7.5-5.5
-30.81.3
43.1-65.1
5.660.6
5.7-12.8
-415.9
58.8-30.228.6
3.732.3
10,656.0
51,7118,737
16.910.2
1.626,54322,206
3.02.5
8,383
14,823 4,329
19,152
12,727 1,162
13,889 5,263
-4,092 26
-121 —
-276 107 136
-217 60
188 349
-8 -3,848
1,415 -541 874 -79 795
92,510
2001
948.5430.8
1,379.3
807.083.9
890.9488.4
-390.612.4
-31.9-44.3
-7.71.0
42.3-60.3
6.072.3-6.4-1.2
-408.4
80.0-24.355.7-5.250.5
10,080.1
2002
966.5419.4
1,385.9
817.081.6
898.6487.3
-400.84.3
12.6—
-4.82.8
32.3-46.0
6.6-8.90.2
-2.4-404.1
83.2-30.253.0-5.347.7
9,645.4
2003
1,129.4408.9
1,538.3
948.293.7
1,041.9496.4
-406.30.2
-5.6—
-20.43.3
24.9-30.9
6.4-47.1
9.8-2.1
-467.8
28.6-8.420.2-6.313.9
9,229.6
20042005 2000
2005
2005
2005
Billions of Yen
1. Key Financial Indicators
2. Consolidated Statements of Income
3. Consolidated Statements of Comprehensive Income (Loss)
5,012.5730.8
14.69.91.4
2,795.92,377.6
3.83.3
694.0
5,533.1934.9
16.910.2
1.62,840.12,376.0
3.02.5
897.0
1,284.1424.5
1,708.6
1,097.5109.8
1,207.3501.3
-422.4-7.1-8.0
—-5.213.315.7
-22.06.9
16.320.7-0.5
-392.3
109.0-35.773.3-6.766.6
9,197.9
1,586.1463.2
2,049.3
1,361.8124.4
1,486.2563.1
-437.92.8
-12.9—
-29.511.514.6
-23.26.4
20.037.4-1.0
-411.8
151.3-57.893.5-8.485.1
9,898.6
66.6
79.5 -26.1
0.4 120.4
85.1
28.5 0.7
-1.0 113.3
Millions ofU.S. Dollars
Millions ofU.S. Dollars
Millions ofU.S. Dollars
* Total trading transactions represents the gross transaction volume of trading activities, or the nominal aggregate value of the transactions for which the Companiesact as principal or as agent. Total trading transactions is a measure commonly used by Japanese trading companies. It is not to be construed as equivalent to, or asubstitute for, sales or revenues under accounting principles generally accepted in the United States of America (“U.S. GAAP”).
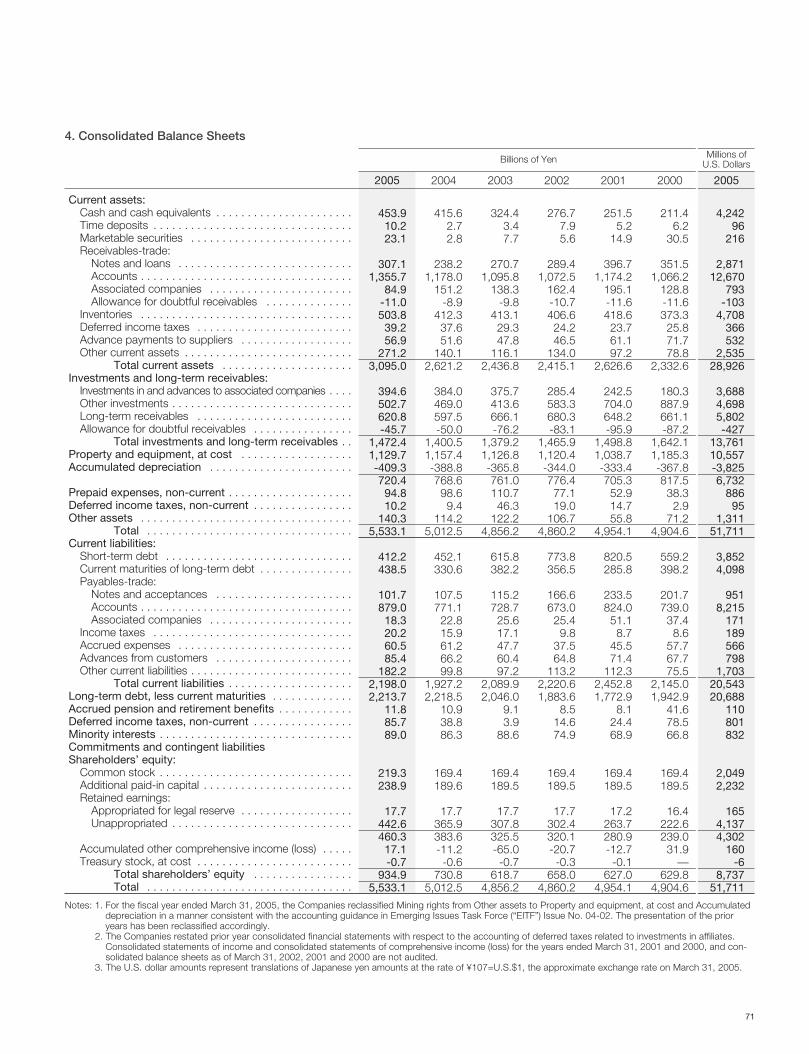
71
Current assets:Cash and cash equivalents . . . . . . . . . . . . . . . . . . . . . .Time deposits . . . . . . . . . . . . . . . . . . . . . . . . . . . . . . . .Marketable securities . . . . . . . . . . . . . . . . . . . . . . . . . .Receivables-trade:
Notes and loans . . . . . . . . . . . . . . . . . . . . . . . . . . . .Accounts . . . . . . . . . . . . . . . . . . . . . . . . . . . . . . . . . .Associated companies . . . . . . . . . . . . . . . . . . . . . . .Allowance for doubtful receivables . . . . . . . . . . . . . .
Inventories . . . . . . . . . . . . . . . . . . . . . . . . . . . . . . . . . .Deferred income taxes . . . . . . . . . . . . . . . . . . . . . . . . .Advance payments to suppliers . . . . . . . . . . . . . . . . . .Other current assets . . . . . . . . . . . . . . . . . . . . . . . . . . .
Total current assets . . . . . . . . . . . . . . . . . . . . .Investments and long-term receivables:
Investments in and advances to associated companies . . . .Other investments . . . . . . . . . . . . . . . . . . . . . . . . . . . . .Long-term receivables . . . . . . . . . . . . . . . . . . . . . . . . .Allowance for doubtful receivables . . . . . . . . . . . . . . . .
Total investments and long-term receivables . .Property and equipment, at cost . . . . . . . . . . . . . . . . . .Accumulated depreciation . . . . . . . . . . . . . . . . . . . . . . .
Prepaid expenses, non-current . . . . . . . . . . . . . . . . . . . .Deferred income taxes, non-current . . . . . . . . . . . . . . . .Other assets . . . . . . . . . . . . . . . . . . . . . . . . . . . . . . . . . .
Total . . . . . . . . . . . . . . . . . . . . . . . . . . . . . . . . .Current liabilities:
Short-term debt . . . . . . . . . . . . . . . . . . . . . . . . . . . . . .Current maturities of long-term debt . . . . . . . . . . . . . . .Payables-trade:
Notes and acceptances . . . . . . . . . . . . . . . . . . . . . .Accounts . . . . . . . . . . . . . . . . . . . . . . . . . . . . . . . . . .Associated companies . . . . . . . . . . . . . . . . . . . . . . .
Income taxes . . . . . . . . . . . . . . . . . . . . . . . . . . . . . . . .Accrued expenses . . . . . . . . . . . . . . . . . . . . . . . . . . . .Advances from customers . . . . . . . . . . . . . . . . . . . . . .Other current liabilities . . . . . . . . . . . . . . . . . . . . . . . . . .
Total current liabilities . . . . . . . . . . . . . . . . . . . .Long-term debt, less current maturities . . . . . . . . . . . . .Accrued pension and retirement benefits . . . . . . . . . . . .Deferred income taxes, non-current . . . . . . . . . . . . . . . .Minority interests . . . . . . . . . . . . . . . . . . . . . . . . . . . . . . .Commitments and contingent liabilitiesShareholders’ equity:
Common stock . . . . . . . . . . . . . . . . . . . . . . . . . . . . . . .Additional paid-in capital . . . . . . . . . . . . . . . . . . . . . . . .Retained earnings:
Appropriated for legal reserve . . . . . . . . . . . . . . . . . .Unappropriated . . . . . . . . . . . . . . . . . . . . . . . . . . . . .
Accumulated other comprehensive income (loss) . . . . .Treasury stock, at cost . . . . . . . . . . . . . . . . . . . . . . . . .
Total shareholders’ equity . . . . . . . . . . . . . . . .Total . . . . . . . . . . . . . . . . . . . . . . . . . . . . . . . . .
211.4 6.2
30.5
351.5 1,066.2
128.8 -11.6 373.3
25.8 71.7 78.8
2,332.6
180.3 887.9 661.1 -87.2
1,642.1 1,185.3 -367.8 817.5
38.3 2.9
71.2 4,904.6
559.2 398.2
201.7 739.0
37.4 8.6
57.7 67.7 75.5
2,145.0 1,942.9
41.6 78.5 66.8
169.4 189.5
16.4 222.6 239.0
31.9 —
629.8 4,904.6
324.4 3.4 7.7
270.7 1,095.8
138.3 -9.8
413.1 29.3 47.8
116.1 2,436.8
375.7 413.6 666.1 -76.2
1,379.2 1,126.8 -365.8 761.0 110.7
46.3 122.2
4,856.2
615.8 382.2
115.2 728.7
25.6 17.1 47.7 60.4 97.2
2,089.9 2,046.0
9.1 3.9
88.6
169.4 189.5
17.7 307.8 325.5 -65.0
-0.7 618.7
4,856.2
20042005 2001
251.5 5.2
14.9
396.7 1,174.2
195.1 -11.6 418.6
23.7 61.1 97.2
2,626.6
242.5 704.0 648.2 -95.9
1,498.8 1,038.7 -333.4 705.3
52.9 14.7 55.8
4,954.1
820.5 285.8
233.5 824.0
51.1 8.7
45.5 71.4
112.3 2,452.8 1,772.9
8.1 24.4 68.9
169.4 189.5
17.2 263.7 280.9 -12.7
-0.1 627.0
4,954.1
2002
276.7 7.9 5.6
289.4 1,072.5
162.4 -10.7 406.6
24.2 46.5
134.0 2,415.1
285.4 583.3 680.3 -83.1
1,465.9 1,120.4 -344.0 776.4
77.1 19.0
106.7 4,860.2
773.8 356.5
166.6 673.0
25.4 9.8
37.5 64.8
113.2 2,220.6 1,883.6
8.5 14.6 74.9
169.4 189.5
17.7 302.4 320.1 -20.7
-0.3 658.0
4,860.2
2003 2000
Billions of Yen Millions ofU.S. Dollars
4,242 96
216
2,871 12,670
793 -103
4,708 366 532
2,535 28,926
3,688 4,698 5,802 -427
13,761 10,557 -3,825 6,732
886 95
1,311 51,711
3,852 4,098
951 8,215
171 189 566 798
1,703 20,543 20,688
110 801 832
2,049 2,232
165 4,137 4,302
160 -6
8,737 51,711
2005
4. Consolidated Balance Sheets
415.6 2.7 2.8
238.2 1,178.0
151.2 -8.9
412.3 37.6 51.6
140.1 2,621.2
384.0 469.0 597.5 -50.0
1,400.5 1,157.4 -388.8 768.6
98.6 9.4
114.2 5,012.5
452.1 330.6
107.5 771.1
22.8 15.9 61.2 66.2 99.8
1,927.2 2,218.5
10.9 38.8 86.3
169.4 189.6
17.7 365.9 383.6 -11.2
-0.6 730.8
5,012.5
453.9 10.2 23.1
307.1 1,355.7
84.9 -11.0 503.8
39.2 56.9
271.2 3,095.0
394.6 502.7 620.8 -45.7
1,472.4 1,129.7 -409.3 720.4
94.8 10.2
140.3 5,533.1
412.2 438.5
101.7 879.0
18.3 20.2 60.5 85.4
182.2 2,198.0 2,213.7
11.8 85.7 89.0
219.3 238.9
17.7 442.6 460.3
17.1 -0.7
934.9 5,533.1
Notes: 1. For the fiscal year ended March 31, 2005, the Companies reclassified Mining rights from Other assets to Property and equipment, at cost and Accumulateddepreciation in a manner consistent with the accounting guidance in Emerging Issues Task Force (“EITF”) Issue No. 04-02. The presentation of the prioryears has been reclassified accordingly.
2. The Companies restated prior year consolidated financial statements with respect to the accounting of deferred taxes related to investments in affiliates.Consolidated statements of income and consolidated statements of comprehensive income (loss) for the years ended March 31, 2001 and 2000, and con-solidated balance sheets as of March 31, 2002, 2001 and 2000 are not audited.
3. The U.S. dollar amounts represent translations of Japanese yen amounts at the rate of ¥107=U.S.$1, the approximate exchange rate on March 31, 2005.
72 Sumitomo Corporation Annual Report 2005
We are an integrated trading company (sogo shosha). Through ourworldwide network, we engage in general trading, including the pur-chase, supply, distribution and marketing of a wide range of goods andcommodities, including metals, machinery, electronics, energy and min-eral resources, chemicals, textiles, food products and consumer goodsin Japan, North America, Asia and other areas in the world. We act asboth principal and agent in these trading transactions. We also provide arange of services for a variety of industries, such as: financing for cus-tomers and suppliers; planning, coordination and operation of urban andindustrial infrastructure projects; consulting in areas such as system inte-gration and technology development; and transportation and logistics. Inaddition, we engage in other diverse business activities, including invest-ing in a variety of industries ranging from biotechnology to communica-tions; developing natural resources; manufacturing and processingproducts such as steel products and textiles; developing and managingreal estate; and operating retail stores.
We conduct our business through nine industry-based business seg-ments and two sets of regional operations (domestic and overseas) thatcorrespond to the operating segments monitored by the chief operatingdecision makers. Our industry-based business segments are:
• Metal Products• Transportation & Construction Systems• Machinery & Electric• Media, Electronics & Network• Chemical• Mineral Resources & Energy• Consumer Goods & Service• Materials & Real Estate• Financial & Logistics
1. Introduction
Each business unit operates with a degree of autonomy in pursuing itsstrategic goals, managing operations and ensuring accountability. Eachbusiness unit also has its own planning and administration department toenable prompt decision-making and facilitate efficient operation. Intoday’s increasingly global business environment, our worldwide networkof offices, subsidiaries and associated companies, and our global rela-tionships with customers, suppliers and business partners have allowedus to conduct and expand our operations around the world. Our nineindustry-based business units and domestic and overseas operationsregularly collaborate with one another to leverage their combinedstrengths to conduct their respective businesses more effectively as wellas to meet our corporate targets and goals. We have designed our infra-structure to centralize and consolidate information from all of our busi-ness units and domestic and overseas operations to facilitate properintegration and risk control.
As of March 31, 2005, we had total assets of ¥5,533.1 billion and39,797 employees worldwide. For the fiscal year ended March 31,2005, our consolidated net income was ¥85.1 billion.
2. Our Medium-Term Targets
The following discussion of our medium-term targets contains forward-looking statements and measures that have been calculated based on anumber of judgments, estimates and assumptions.
In recent years, we have been setting targets for, and monitoring theprogress of, our businesses and operations by establishing medium-termplans. Under the AA Plan, covering the period from April 2003 to March2005 we have sought to expand our profitability and earnings base bymaximizing our integrated corporate strength and to strengthen ourfinancial condition by enhancing our management efficiency and sound-ness. Under this plan we have raised quantitative targets of a consoli-dated risk-adjusted return ratio of 6% or more on a two year average
basis and consolidated net income of ¥60 billion for fiscal year 2003 and¥70 billion in fiscal year 2004, for a two-year total of ¥130 billion. Wewere able to achieve each of these targets.
Under the medium-term management plan for the two years startingthis April — the AG Plan (Achievement & Growth Plan : FY2005-2006),we will work on a globally consolidated basis to expand our earningsbase through dynamic growth strategies, implement human resourcestrategies matching our growth strategies, and continue the pursuit ofsoundness and efficiency in management. We also aim to achieve thequantitative targets of a consolidated risk-adjusted return ratio of 7.5%or above for each year of the plan, and make strategic moves for furthergrowth and development.
Management’s Discussion and Analysisof Financial Condition and Results of Operations
73
The following is a description of certain line items in our consolidatedstatements of income:
Revenues. We categorize our revenues into sales of tangible productsand sales of services and others. We generate revenue from sales of tan-gible products:
• in connection with our wholesale, retail, manufacturing and process-ing operations;
• in connection with our real estate operations; and• under long-term construction type arrangements.
We also enter into transactions that include multiple element arrange-ments, which may include any combination of products, equipment andinstallation services. We also generate revenue from sale of services andothers in connection with:
• customized software development services contracts and other soft-ware related services;
• direct financing and operating leases of commercial real estate, auto-mobiles, vessels and aircraft; and
• other service arrangements, such as arranging finance and coordi-nating logistics in connection with trading activities.
Gross Profit. Gross profit primarily consists of:• gross profit on transactions for which we act as a principal; and• fees and commissions received on transactions for which we act as
an agent.To the extent revenues are recorded on a gross basis, any expenses orcommissions or other payments to third parties that are directly attributa-ble to the sales are recorded as cost of sales. Gross profit reflects the netamount of gross revenues after cost of sales. As part of sales of servicesand others, we recognize revenues from fees and commissions on a netbasis. As a result, sales of services and others contribute a larger portionof our gross profit than they do our revenues. For the fiscal year endedMarch 31, 2005, sales of services and others accounted for 22.6% of ourtotal revenues, but the gross profit from sales of services and othersaccounted for 60.2% of our gross profit.
Settlements on Copper Trading Litigation. Since 1996, we havebeen involved in a number of legal proceedings relating to unauthorizedcopper trading by a former employee. Any settlement in connection withthe copper trading litigation are reported as settlements on copper trad-ing litigation.
Provision for Doubtful Receivables. Provision for doubtful receivablesrepresents additions to the valuation allowance provided for probablelosses inherent in the trade receivables and long-term loans portfolio. Incases where we are able to collect on such receivables and loans due tochanges in circumstances, we subsequently record a reversal ofallowance for doubtful receivables. See “6—Critical AccountingPolicies—Collectibility of Receivables.”
Impairment Losses on Long-Lived Assets. To operate our globalbusiness, we maintain a significant amount of long-lived assets. A largeportion of such long-lived assets are our real estate holdings. Mainly dueto the dramatic decline in the Japanese real estate market, we have, ifnecessary, reviewed for impairment and recorded impairment losses withrespect to our real estate assets. For a detailed discussion of ouraccounting policy with respect to such impairment losses, see “6—Critical Accounting Policies—Recoverability of Long-Lived Assets.”
Gain on Sale of Property and Equipment, Net. As a result of strate-gic and aggressive replacement of our asset portfolio, we may, at times,recognize gains and losses on sales of some of our real estate assets.
Dividends. Dividends reflect dividends declared by companies inwhich we hold interests other than our consolidated subsidiaries or asso-ciated companies.
Other than Temporary Impairment Losses on Securities. In order tosupplement our trading activities, we maintain a significant level of invest-ments. When the fair value of our investments deemed to have sufferedan other-than-temporary decline in value, we recognize impairmentlosses on such investments. For a detailed discussion of our accountingpolicy with respect to our marketable securities and other investments,see “6—Critical Accounting Policies—Impairment of Investments inMarketable Securities and Other Investments.”
Gain on Sale of Marketable Securities and Other Investments, Net. Inorder to supplement our trading activities, we maintain a significant level ofinvestments. We recognize gains on sales of our marketable securities andother investments when we elect to sell some of such investment holdings.
Gain on Issuances of Stock by Subsidiaries and AssociatedCompanies. If an affiliate company issue shares to a third party, we mayrecognize gain based on the effect of the difference in our book value pershare in the investment and the price at which shares are sold to thethird party.
Equity in Earnings of Associated Companies, Net. In connectionwith our investment strategy and the development of business opportuni-
4. Certain Line Items in Our Consolidated Statements of Income
3. Economic Environment
During the period under review, there was concern about the possibleimpact on the global economy from the shift to monetary policy tighten-ing in the United States and the restraints on investment by the authori-ties in China, but growth continued to be strong. Prices on internationalcommodity markets, particularly the price of crude oil, stayed high,reflecting the lively expansion of demand.
The Japanese economy continued to enjoy strong growth of exports,especially to other markets in East Asia, and capital investment and other
areas of domestic demand also showed signs of recovery. In addition,the employment situation clearly improved, and the environment for con-sumer spending became more solid. In the second half of the fiscal year,however, the expansion seemed to be taking a pause; unseasonableweather and the Niigata Prefecture (Chuetsu) earthquake had a negativeimpact, as did inventory adjustment by companies in the fields of digitalappliances and information technology.
74 Sumitomo Corporation Annual Report 2005
ties, we may, from time to time, acquire or make investments in newlyestablished or existing companies, enter into joint ventures with otherentities or form strategic business alliances with industry participants, ineach case in a variety of business segments. In general, we account forthe earnings or losses of such investee under the equity method whenthe level of the investment is between 20% and 50% of the total votingequity of the investee.
Total Trading Transactions. Total trading transactions is a voluntarydisclosure and represents the gross transaction volume of trading trans-actions, or the nominal aggregate value of the transactions for which weact as principal or as agent. Total trading transactions is not meant to
represent sales or revenues in accordance with U.S. GAAP. Total tradingtransactions should not be construed as equivalent to, or a substitute orproxy for, revenues, or as an indicator of our operating performance, liq-uidity or cash flows generated by operating, investing or financing activi-ties. A substantial part of total trading transactions representstransactions in which we participate without physical acquisition of goodsor without significant inventory risk. We have included the informationconcerning total trading transactions because it is used by similarJapanese trading companies as an industry benchmark, and we believeit is a useful supplement to results of operations data as a measure ofour performance compared to other similar Japanese trading companies.
5. Effects of Recent Transactions on Our Consolidated Statements of Income
6. Critical Accounting Policies
On May 27, 2004, we and Sumitomo Corporation of America, our U.S.subsidiary, entered into an agreement to purchase JWC Hartz Holdings,Inc., the holding company of The Hartz Mountain Corporation (“Hartz”), aU.S. pet supplies company, from J. W. Childs Equity Partners II, L.P., forapproximately $400 million. The purchase was consummated on June21, 2004. After this purchase, Hartz merged with JWC Hartz Holdings,Inc. As of the end of March 2005, we had a 96.3% ownership of the vot-ing shares of Hartz, including a 56.3% ownership interest held directly bySumitomo Corporation of America.
Hartz produces and sells pet supplies, with six manufacturing facilitiesin the U.S. and Brazil and three distribution centers in North America.This purchase provides us an entry into the U.S. pet supplies businessand a base for further development of that business in Japan, Europe,and the Americas, taking advantage of our international distribution andsourcing capabilities. The consolidated financial statements for the yearended March 31, 2005 include the operating results of Hartz from thedate of purchase.
The preparation of our consolidated financial statements in accordancewith U.S. GAAP requires management to make estimates and assump-tions that affect the reported amounts of assets and liabilities and disclo-sure of contingent assets and liabilities at the date of the financialstatements and the reported amounts of revenues and expenses duringthe reporting period. On an ongoing basis, we evaluate our estimates,which are based on historical experience and on various other assump-tions that are believed to be reasonable under the circumstances. Theresults of these evaluations form the basis for making judgments aboutthe carrying values of assets and liabilities and the reported amounts ofrevenues and expenses that are not readily apparent from other sources.Actual results may differ from those estimates under different assump-tions. For a summary of our significant accounting policies, including thecritical accounting policies discussed below, see note 2 to our consoli-dated financial statements.
The following are the critical accounting policies that are important toour financial condition and results of operations and require significantmanagement judgments and estimates:
Revenue Presentation — Gross Versus NetActing as an intermediary in executing transactions with third parties is adistinctive role of an integrated trading company (sogo shosha). In recog-nizing revenue from transactions, we must determine whether we are act-ing as a “principal” in the transaction, and should report revenue on agross basis based on the sales amount of the transaction, or acting as an“agent” in the transaction, and should recognize net fees or commissionsearned. The evaluation of the relevant factors in making this determinationis subject to significant subjective judgments. In certain situations, othersmight make a different determination. Similarly, if our risks and obligationsin a certain type of transaction change, the determination of whether rev-enue should be recognized on a net or gross basis for that type of trans-action may also change. Revenues related to a substantial portion of thetrading transactions in all our business segments are recognized on a netbasis. The amounts of gross profit and net income are not affected bywhether revenue is reported on a gross or net basis.
Factors that indicate that we are acting as a principal, and thus shouldrecognize revenue on a gross basis include:
75
• we are the primary obligor in the arrangement; • we have general inventory risk (before customer order is placed or
upon customer return);• we have physical loss inventory risk (after customer order or during
shipping); • we have latitude in establishing price; • we change the product or perform part of the services; • we have discretion in supplier selection; • we are involved in the determination of product or service specifica-
tions; and• we have credit risk.
Factors that indicate that we are acting as an agent, and thus shouldrecognize revenue on a net basis relative to the service offered include:
• the supplier (not us) is the primary obligor in the arrangement; • the amount we earn is fixed; and • the supplier (not us) has credit risk.
Revenue RecognitionMost of our revenues are the result of ( i ) the sale of tangible products inconnection with our wholesale, retail, manufacturing, and processingoperations from which revenue is recognized based on the transfer of title,deliver or shipment, or the attainment of customer acceptance, or ( ii ) fromthe provision of services, from which revenue is recognized based on thedelivery of services. Revenue recognition in these situations does notinvolve difficult, subjective or complex judgments or estimations.
Recognition of revenue using the percentage-of-completion methodfor certain long-term construction-type arrangements is based on theratio that costs incurred bear to total estimated project costs and isdependent on our ability to estimate these costs reliably. The impact ofrevisions of profit estimates on fixed price contracts is recognized in theperiod in which the revisions are made; anticipated losses on fixed pricecontracts are charged to earnings when losses can be estimated; andprovisions are made for contingencies in the period in which theybecome known and losses are estimable.
Collectibility of ReceivablesWe engage in a variety of businesses and carry substantial notes andloans receivable, accounts receivable, receivables for associated compa-nies, and long-term receivables. In maintaining our allowance for doubtfulreceivables, our estimate of probable losses requires consideration ofhistorical loss experience, adjusted for current conditions, and judgmentsabout the probable effects of relevant observable data, including presenteconomic conditions such as delinquency rates, financial health of spe-cific customers and market sectors, collateral values, and the presentand expected future levels of interest rates. This estimation requires us tomake assumptions and judgments about inherently uncertain matters,and we cannot predict with absolute certainty the amount of lossesinherent in the portfolio.
Operating segments that hold greater amounts of long-term receiv-ables than other segments are Transportation & Construction Systemsand Machinery & Electric Business Units.
Recoverability of Long-Lived AssetsWe maintain significant long-lived assets in the operation of our globalbusiness. We review long-lived assets, such as real estate and aircraft,for impairment whenever events or changes in circumstances suggestthat the carrying amount of such assets may not be recoverable.Determining whether impairment has occurred typically requires variousestimates and assumptions, including determining whether cash flowsare directly related to the potentially impaired asset, the useful life overwhich cash flows will occur, their amount, and the asset’s residual value,if any. In turn, measurement of an impairment loss requires a determina-tion of fair value, which is based on the best information available. Weuse internal discounted cash flow estimates, quoted market prices, whenavailable, and independent appraisals, as appropriate, to determine fairvalue. We derive cash flow estimates from our historical experience andour internal business plans, and apply an appropriate discount rate.Changes in strategy or in market conditions could significantly affectthese determinations.
Impairment of Investments in Marketable Securities andOther InvestmentsWe regularly review investment securities for impairment based on criteriathat include the extent to which the investment’s carrying value exceedsits market value, the duration of the market decline, our ability to hold torecovery, and the financial strength and specific prospects of the issuerof the security. We monitor market conditions and the performance ofthe investees to identify potentially impaired investments. The fair value ofnon-marketable securities for which impairment losses are recognized isdetermined based on estimated discounted future cash flows, or otherappropriate valuation methods.
Tax Asset Valuation A valuation allowance is established on deferred tax assets when, inmanagement’s judgment, it is more likely than not, that the deferred taxasset, or a portion thereof, will not be realized. In assessing the realizabil-ity of deferred tax assets, we must determine whether we will be able togenerate adequate future taxable income in the tax jurisdictions that giverise to the deferred tax assets during the periods in which the underlyingtemporary differences become deductible or before tax net operatingloss carryforwards expire. We consider all available evidence, both posi-tive and negative, in making this assessment. Determination of theallowance is based on estimates and judgment. A change in the ability ofour operations to generate future taxable income in the tax jurisdictionsthat give rise to the deferred tax assets could change our assessment asto the realizability of these assets.
76 Sumitomo Corporation Annual Report 2005
7. Results of Operations
Fiscal Year Ended March 31, 2005 Compared to FiscalYear Ended March 31, 2004
Total Revenues. Total revenues increased by ¥340.7 billion, or19.9%, from ¥1,708.6 billion in the fiscal year ended March 31, 2004, to¥2,049.3 billion in the fiscal year ended March 31, 2005. The increasewas mainly due to the acquisition of Hartz and the increase of plantexport volume mainly to Asia.
Gross Profit. Gross profit increased by ¥61.8 billion, or 12.3%, from¥501.3 billion in the fiscal year ended March 31, 2004 to ¥563.1 billion inthe fiscal year ended March 31, 2005. The increase in gross profit wasmainly due to the acquisition of Hartz, the increase of plant export vol-ume mainly to Asia and the acquisition of a coal business in Australia.The increase was partially offset by a decline in revenue resulting fromthe impact of the stronger yen which reduced the yen value of foreigncurrency denominated revenue.
Selling, General and Administrative Expenses. Selling, general andadministrative expenses increased by ¥15.5 billion, or 3.7%, from ¥422.4billion in the fiscal year ended March 31, 2004 to ¥437.9 billion in the fis-cal year ended March 31, 2005. This was mainly due to an increase inpersonnel expenses resulting from the acquisition of Hartz, the expansionof the business activities of our subsidiaries such as Summit, Inc., andthe increase in the amortization charges resulting from our computer sys-tem upgrades.
Settlements on Copper Trading Litigation. In the fiscal year endedMarch 31, 2005, we gained ¥2.8 billion from settlements on copper trad-ing litigation compared to a net expense of ¥7.1 billion on settlements oncopper trading litigation in the fiscal year ended March 31, 2004.
Provision for Doubtful Receivables. The provision for doubtful receiv-ables increased by ¥4.9 billion, or 61.3%, to ¥12.9 billion in the fiscal yearended March 31, 2005, compared to ¥8.0 billion in the fiscal year endedMarch 31, 2004. This was mainly due to the receivables from a telecom-munication project in South America and other transactions under legalliquidation.
Impairment Losses on Long-Lived Assets. Impairment losses onlong-lived assets increased by ¥24.3 billion, from ¥5.2 billion in the fiscalyear ended March 31, 2004 to ¥29.5 billion in the fiscal year endedMarch 31, 2005. This was mainly due to the recognition of impairmentloss on real estate in the Yokohama area.
Gain on Sale of Property and Equipment, Net. Gain on sale of prop-erty and equipment decreased by ¥1.8 billion, or 13.5%, from ¥13.3 bil-lion in the fiscal year ended March 31, 2004 to ¥11.5 billion in the fiscalyear ended March 31, 2005. We recognized a gain on the sale of anoffice building belonging to Sumitomo Corporation of America in the fis-cal year ended March 31, 2005.
Interest Income. Interest income decreased by ¥1.1 billion, or 7.0%,from ¥15.7 billion in the fiscal year ended March 31, 2004 to ¥14.6 billionin the fiscal year ended March 31, 2005. This was mainly due to thedecrease in loans to associated companies.
Interest Expense. Interest expense increased by ¥1.2 billion, or 5.5%,from ¥22.0 billion in the fiscal year ended March 31, 2004 to ¥23.2 billionin the fiscal year ended March 31, 2005. The increase was primarily dueto the acquisition of businesses for the expansion of the earnings baseand higher U.S. interest rates.
Dividends. Total dividend income decreased by ¥0.5 billion, or 7.2%,from ¥6.9 billion in the fiscal year ended March 31, 2004 to ¥6.4 billion inthe fiscal year ended March 31, 2005. This was mainly due to the saleof equity securities.
Other than Temporary Impairment Losses on Securities. Other thantemporary impairment losses on securities decreased by ¥14.3 billion, or61.6%, from ¥23.2 billion in the fiscal year ended March 31, 2004 to¥8.9 billion in the fiscal year ended March 31, 2005.
Gain on Sale of Marketable Securities and Other Investments, Net.Gain on sale of marketable securities and other investments decreasedby ¥23.2 billion, or 58.7%, from ¥39.5 billion for the fiscal year endedMarch 31, 2004 to ¥16.3 billion for the fiscal year ended March 31,2005.
Gain on issuances of stock by subsidiaries and associated compa-nies. In March, 2005, Jupiter Telecommunications Co., Ltd. was listedon the Jasdaq Securities Exchange and shares were sold to the public.As a result of this offering, we recognized a gain of ¥12.6 billion for thefiscal year ended March 31, 2005.
Equity in Earnings of Associated Companies, Net. Equity in earningsof associated companies increased by ¥16.7 billion, or 80.7%, from¥20.7 billion in the fiscal year ended March 31, 2004 to ¥37.4 billion inthe fiscal year ended March 31, 2005. The increase was mainly due tothe improvements in profitability at the Batu Hijau copper & gold mineproject and Jupiter Telecommunications Co., Ltd., and continuousstrong performances by Sumisho Lease Co., Ltd. and JupiterProgramming Co., Ltd.
Income Taxes. Income taxes increased by ¥22.1 billion, or 61.9%,from ¥35.7 billion in the fiscal year ended March 31, 2004 to ¥57.8 billionin the fiscal year ended March 31, 2005. The increase was primarily dueto increase of income before income taxes and minority interests in earn-ings of subsidiaries.
Minority Interests in Earnings of Subsidiaries, Net. Minority interestsin earnings of subsidiaries increased by ¥1.7 billion, or 25.4%, from ¥6.7billion in the fiscal year ended March 31, 2004 to ¥8.4 billion in the fiscalyear ended March 31, 2005. The increase was attributable to theincreased profitability of Sumisho Auto Leasing.

77
563.1
496.4
5.695.38 5.45
2005
501.3
2003 2004
600
400
500
300
100
200
0
6.0
4.0
5.0
3.0
1.0
2.0
0
(Billions of Yen) (%)
Gross Profit & Gross Profit Ratio
Gross Profit RatioGross Profit
Net Income & Return on Equity
Return on EquityNet Income
20052003 2004
85.1
13.9
10.2
2.2
9.9
66.6
12.5
10.0
5.0
7.5
2.5
0
100
80
60
40
20
0
(Billions of Yen) (%)
8. Operating Segment Analysis
We manage and assess our business through 11 operating segments,including nine operating segments based on industries and two operat-ing segments based on a geographical focus.
We conduct our business through nine business units based on indus-tries. Our business units consist of: Metal Products; Transportation &Construction Systems; Machinery & Electric; Media, Electronics &Network; Chemical; Mineral Resources & Energy; Consumer Goods &Service; Materials & Real Estate; and Financial & Logistics.
In addition, we conduct our business through the regional operations—domestic and overseas. Domestically, in addition to our subsidiaries andoffices throughout Japan, we have three regional business units, whichare distinct from the industry-based business units, that oversee activities
in the Kansai, Chubu and Kyushu-Okinawa regions. Our overseas opera-tions are conducted by our overseas subsidiaries, such as SumitomoCorporation of America, Inc., and branch offices. These regional opera-tions conduct trading activities in all industry sectors based on their spe-cialized knowledge of the regions. In addition, they work together oncertain projects with our industry-based business units in order to developproducts and services that are more focused for any particular region. Insuch cases, revenue and expenses are shared by the units based on theirrespective roles. These regional operations constitute the “DomesticRegional Business Units and Offices” and “Overseas Subsidiaries andBranches” segments in our consolidated financial statements.
Net Income. As a result of the factors discussed above, netincome increased by ¥18.5 billion, or 27.8%, from ¥66.6 billion in thefiscal year ended March 31, 2004 to ¥85.1 billion in the fiscal yearended March 31, 2005.
Total Trading Transactions. Total trading transactions increased
¥700.7 billion, or 7.6%, from ¥9,197.9 billion in the fiscal year endedMarch 31, 2004 to ¥9,898.6 billion in the fiscal year ended March 31,2005. This was mainly due to the increase in oil and organic chemicaltransactions reflecting the strong market and the increase of plant exportvolume mainly to Asia.
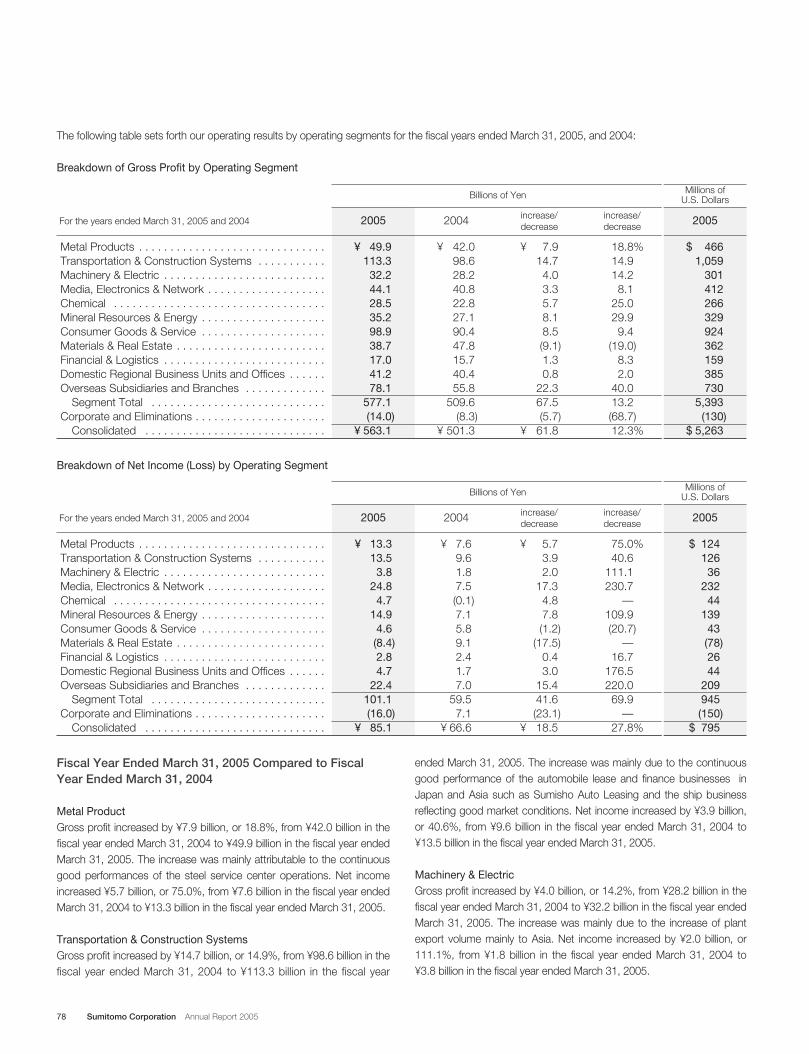
78 Sumitomo Corporation Annual Report 2005
The following table sets forth our operating results by operating segments for the fiscal years ended March 31, 2005, and 2004:
Breakdown of Gross Profit by Operating Segment
Metal Products . . . . . . . . . . . . . . . . . . . . . . . . . . . . . .Transportation & Construction Systems . . . . . . . . . . .Machinery & Electric . . . . . . . . . . . . . . . . . . . . . . . . . .Media, Electronics & Network . . . . . . . . . . . . . . . . . . .Chemical . . . . . . . . . . . . . . . . . . . . . . . . . . . . . . . . . .Mineral Resources & Energy . . . . . . . . . . . . . . . . . . . .Consumer Goods & Service . . . . . . . . . . . . . . . . . . . .Materials & Real Estate . . . . . . . . . . . . . . . . . . . . . . . .Financial & Logistics . . . . . . . . . . . . . . . . . . . . . . . . . .Domestic Regional Business Units and Offices . . . . . .Overseas Subsidiaries and Branches . . . . . . . . . . . . .
Segment Total . . . . . . . . . . . . . . . . . . . . . . . . . . . .Corporate and Eliminations . . . . . . . . . . . . . . . . . . . . .
Consolidated . . . . . . . . . . . . . . . . . . . . . . . . . . . . .
¥ 49.9 113.3
32.2 44.1 28.5 35.2 98.9 38.7 17.0 41.2 78.1
577.1 (14.0)
¥ 563.1
¥ 42.0 98.6 28.2 40.8 22.8 27.1 90.4 47.8 15.7 40.4 55.8
509.6 (8.3)
¥ 501.3
18.8%14.9 14.2
8.1 25.0 29.9
9.4 (19.0)
8.3 2.0
40.0 13.2 (68.7)12.3%
increase/decrease
2005
$ 466 1,059
301 412 266 329 924 362 159 385 730
5,393 (130)
$ 5,263
2005For the years ended March 31, 2005 and 2004 2004
¥ 7.9 14.7
4.0 3.3 5.7 8.1 8.5 (9.1)1.3 0.8
22.3 67.5 (5.7)
¥ 61.8
increase/decrease
Billions of Yen
Breakdown of Net Income (Loss) by Operating Segment
Metal Products . . . . . . . . . . . . . . . . . . . . . . . . . . . . . .Transportation & Construction Systems . . . . . . . . . . .Machinery & Electric . . . . . . . . . . . . . . . . . . . . . . . . . .Media, Electronics & Network . . . . . . . . . . . . . . . . . . .Chemical . . . . . . . . . . . . . . . . . . . . . . . . . . . . . . . . . .Mineral Resources & Energy . . . . . . . . . . . . . . . . . . . .Consumer Goods & Service . . . . . . . . . . . . . . . . . . . .Materials & Real Estate . . . . . . . . . . . . . . . . . . . . . . . .Financial & Logistics . . . . . . . . . . . . . . . . . . . . . . . . . .Domestic Regional Business Units and Offices . . . . . .Overseas Subsidiaries and Branches . . . . . . . . . . . . .
Segment Total . . . . . . . . . . . . . . . . . . . . . . . . . . . .Corporate and Eliminations . . . . . . . . . . . . . . . . . . . . .
Consolidated . . . . . . . . . . . . . . . . . . . . . . . . . . . . .
¥ 13.3 13.5
3.8 24.8
4.7 14.9
4.6 (8.4)2.8 4.7
22.4 101.1 (16.0)
¥ 85.1
¥ 7.6 9.6 1.8 7.5 (0.1)7.1 5.8 9.1 2.4 1.7 7.0
59.5 7.1
¥ 66.6
75.0%40.6
111.1 230.7
—109.9 (20.7)
—16.7
176.5 220.0
69.9 —
27.8%
increase/decrease
2005
$ 124 126
36 232
44 139
43 (78)26 44
209 945 (150)
$ 795
2005For the years ended March 31, 2005 and 2004 2004
¥ 5.7 3.9 2.0
17.3 4.8 7.8 (1.2)
(17.5)0.4 3.0
15.4 41.6 (23.1)
¥ 18.5
increase/decrease
Billions of Yen
Millions ofU.S. Dollars
Millions ofU.S. Dollars
Fiscal Year Ended March 31, 2005 Compared to FiscalYear Ended March 31, 2004
Metal ProductGross profit increased by ¥7.9 billion, or 18.8%, from ¥42.0 billion in thefiscal year ended March 31, 2004 to ¥49.9 billion in the fiscal year endedMarch 31, 2005. The increase was mainly attributable to the continuousgood performances of the steel service center operations. Net incomeincreased ¥5.7 billion, or 75.0%, from ¥7.6 billion in the fiscal year endedMarch 31, 2004 to ¥13.3 billion in the fiscal year ended March 31, 2005.
Transportation & Construction SystemsGross profit increased by ¥14.7 billion, or 14.9%, from ¥98.6 billion in thefiscal year ended March 31, 2004 to ¥113.3 billion in the fiscal year
ended March 31, 2005. The increase was mainly due to the continuousgood performance of the automobile lease and finance businesses inJapan and Asia such as Sumisho Auto Leasing and the ship businessreflecting good market conditions. Net income increased by ¥3.9 billion,or 40.6%, from ¥9.6 billion in the fiscal year ended March 31, 2004 to¥13.5 billion in the fiscal year ended March 31, 2005.
Machinery & ElectricGross profit increased by ¥4.0 billion, or 14.2%, from ¥28.2 billion in thefiscal year ended March 31, 2004 to ¥32.2 billion in the fiscal year endedMarch 31, 2005. The increase was mainly due to the increase of plantexport volume mainly to Asia. Net income increased by ¥2.0 billion, or111.1%, from ¥1.8 billion in the fiscal year ended March 31, 2004 to¥3.8 billion in the fiscal year ended March 31, 2005.
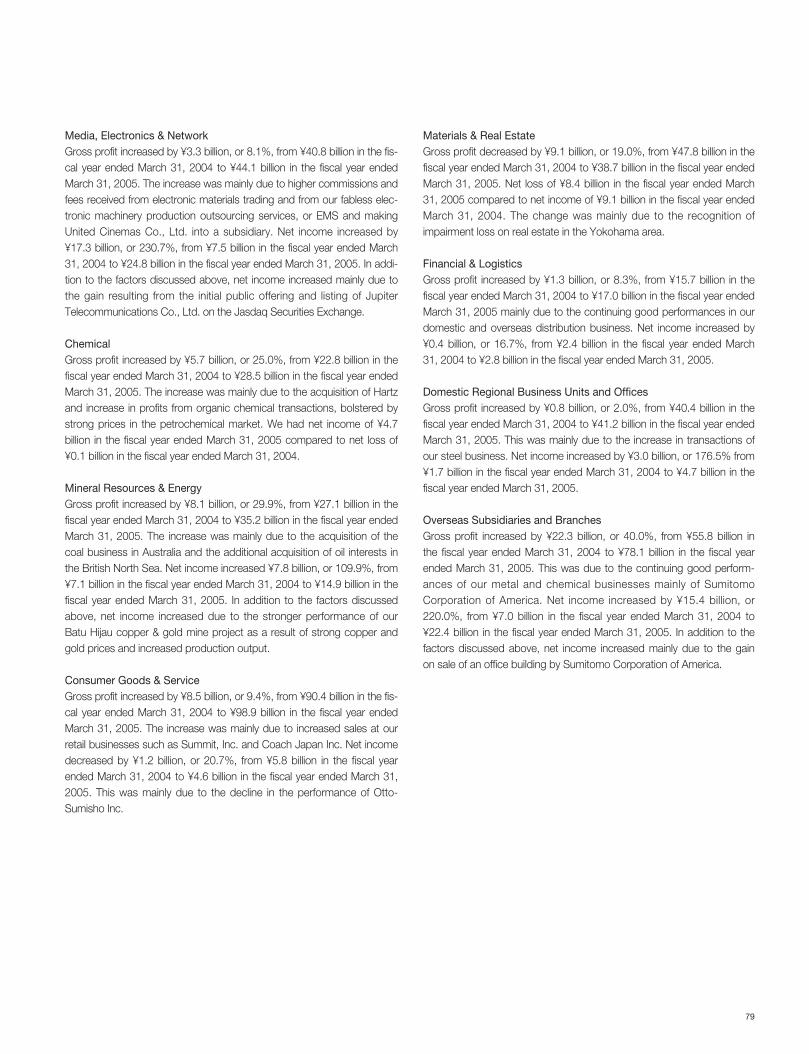
79
Media, Electronics & NetworkGross profit increased by ¥3.3 billion, or 8.1%, from ¥40.8 billion in the fis-cal year ended March 31, 2004 to ¥44.1 billion in the fiscal year endedMarch 31, 2005. The increase was mainly due to higher commissions andfees received from electronic materials trading and from our fabless elec-tronic machinery production outsourcing services, or EMS and makingUnited Cinemas Co., Ltd. into a subsidiary. Net income increased by¥17.3 billion, or 230.7%, from ¥7.5 billion in the fiscal year ended March31, 2004 to ¥24.8 billion in the fiscal year ended March 31, 2005. In addi-tion to the factors discussed above, net income increased mainly due tothe gain resulting from the initial public offering and listing of JupiterTelecommunications Co., Ltd. on the Jasdaq Securities Exchange.
ChemicalGross profit increased by ¥5.7 billion, or 25.0%, from ¥22.8 billion in thefiscal year ended March 31, 2004 to ¥28.5 billion in the fiscal year endedMarch 31, 2005. The increase was mainly due to the acquisition of Hartzand increase in profits from organic chemical transactions, bolstered bystrong prices in the petrochemical market. We had net income of ¥4.7billion in the fiscal year ended March 31, 2005 compared to net loss of¥0.1 billion in the fiscal year ended March 31, 2004.
Mineral Resources & EnergyGross profit increased by ¥8.1 billion, or 29.9%, from ¥27.1 billion in thefiscal year ended March 31, 2004 to ¥35.2 billion in the fiscal year endedMarch 31, 2005. The increase was mainly due to the acquisition of thecoal business in Australia and the additional acquisition of oil interests inthe British North Sea. Net income increased ¥7.8 billion, or 109.9%, from¥7.1 billion in the fiscal year ended March 31, 2004 to ¥14.9 billion in thefiscal year ended March 31, 2005. In addition to the factors discussedabove, net income increased due to the stronger performance of ourBatu Hijau copper & gold mine project as a result of strong copper andgold prices and increased production output.
Consumer Goods & ServiceGross profit increased by ¥8.5 billion, or 9.4%, from ¥90.4 billion in the fis-cal year ended March 31, 2004 to ¥98.9 billion in the fiscal year endedMarch 31, 2005. The increase was mainly due to increased sales at ourretail businesses such as Summit, Inc. and Coach Japan Inc. Net incomedecreased by ¥1.2 billion, or 20.7%, from ¥5.8 billion in the fiscal yearended March 31, 2004 to ¥4.6 billion in the fiscal year ended March 31,2005. This was mainly due to the decline in the performance of Otto-Sumisho Inc.
Materials & Real EstateGross profit decreased by ¥9.1 billion, or 19.0%, from ¥47.8 billion in thefiscal year ended March 31, 2004 to ¥38.7 billion in the fiscal year endedMarch 31, 2005. Net loss of ¥8.4 billion in the fiscal year ended March31, 2005 compared to net income of ¥9.1 billion in the fiscal year endedMarch 31, 2004. The change was mainly due to the recognition ofimpairment loss on real estate in the Yokohama area.
Financial & LogisticsGross profit increased by ¥1.3 billion, or 8.3%, from ¥15.7 billion in thefiscal year ended March 31, 2004 to ¥17.0 billion in the fiscal year endedMarch 31, 2005 mainly due to the continuing good performances in ourdomestic and overseas distribution business. Net income increased by¥0.4 billion, or 16.7%, from ¥2.4 billion in the fiscal year ended March31, 2004 to ¥2.8 billion in the fiscal year ended March 31, 2005.
Domestic Regional Business Units and OfficesGross profit increased by ¥0.8 billion, or 2.0%, from ¥40.4 billion in thefiscal year ended March 31, 2004 to ¥41.2 billion in the fiscal year endedMarch 31, 2005. This was mainly due to the increase in transactions ofour steel business. Net income increased by ¥3.0 billion, or 176.5% from¥1.7 billion in the fiscal year ended March 31, 2004 to ¥4.7 billion in thefiscal year ended March 31, 2005.
Overseas Subsidiaries and BranchesGross profit increased by ¥22.3 billion, or 40.0%, from ¥55.8 billion inthe fiscal year ended March 31, 2004 to ¥78.1 billion in the fiscal yearended March 31, 2005. This was due to the continuing good perform-ances of our metal and chemical businesses mainly of SumitomoCorporation of America. Net income increased by ¥15.4 billion, or220.0%, from ¥7.0 billion in the fiscal year ended March 31, 2004 to¥22.4 billion in the fiscal year ended March 31, 2005. In addition to thefactors discussed above, net income increased mainly due to the gainon sale of an office building by Sumitomo Corporation of America.
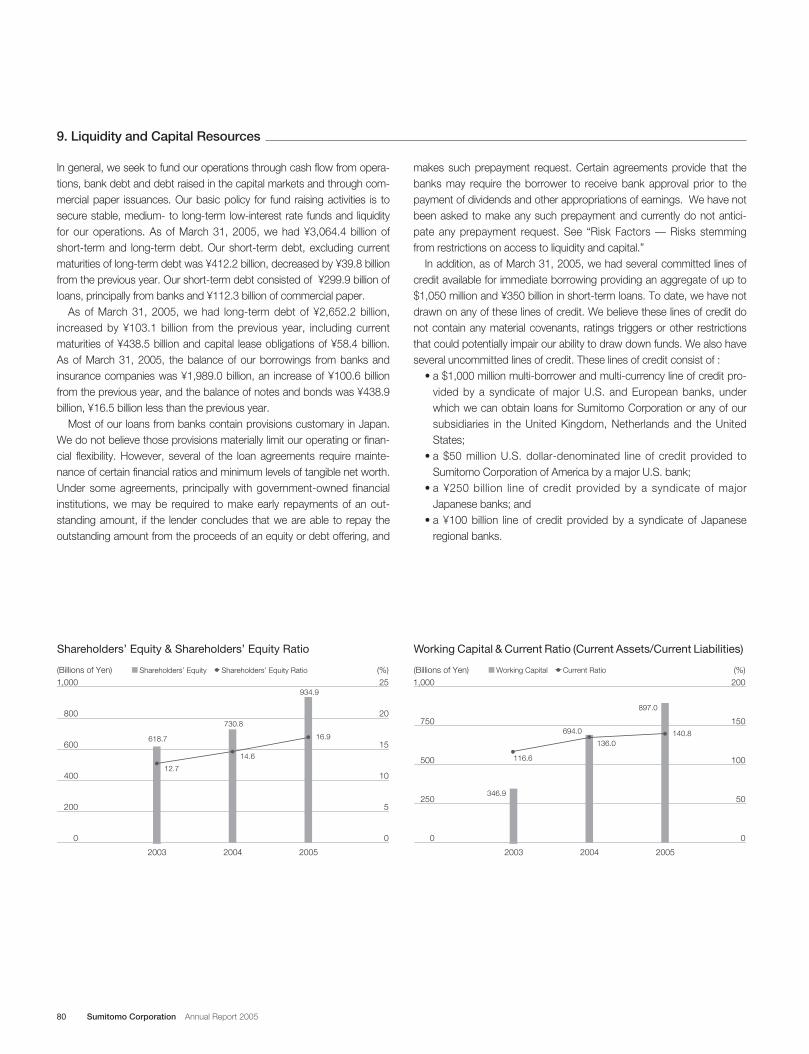
80 Sumitomo Corporation Annual Report 2005
In general, we seek to fund our operations through cash flow from opera-tions, bank debt and debt raised in the capital markets and through com-mercial paper issuances. Our basic policy for fund raising activities is tosecure stable, medium- to long-term low-interest rate funds and liquidityfor our operations. As of March 31, 2005, we had ¥3,064.4 billion ofshort-term and long-term debt. Our short-term debt, excluding currentmaturities of long-term debt was ¥412.2 billion, decreased by ¥39.8 billionfrom the previous year. Our short-term debt consisted of ¥299.9 billion ofloans, principally from banks and ¥112.3 billion of commercial paper.
As of March 31, 2005, we had long-term debt of ¥2,652.2 billion,increased by ¥103.1 billion from the previous year, including currentmaturities of ¥438.5 billion and capital lease obligations of ¥58.4 billion.As of March 31, 2005, the balance of our borrowings from banks andinsurance companies was ¥1,989.0 billion, an increase of ¥100.6 billionfrom the previous year, and the balance of notes and bonds was ¥438.9billion, ¥16.5 billion less than the previous year.
Most of our loans from banks contain provisions customary in Japan.We do not believe those provisions materially limit our operating or finan-cial flexibility. However, several of the loan agreements require mainte-nance of certain financial ratios and minimum levels of tangible net worth.Under some agreements, principally with government-owned financialinstitutions, we may be required to make early repayments of an out-standing amount, if the lender concludes that we are able to repay theoutstanding amount from the proceeds of an equity or debt offering, and
makes such prepayment request. Certain agreements provide that thebanks may require the borrower to receive bank approval prior to thepayment of dividends and other appropriations of earnings. We have notbeen asked to make any such prepayment and currently do not antici-pate any prepayment request. See “Risk Factors — Risks stemmingfrom restrictions on access to liquidity and capital.”
In addition, as of March 31, 2005, we had several committed lines ofcredit available for immediate borrowing providing an aggregate of up to$1,050 million and ¥350 billion in short-term loans. To date, we have notdrawn on any of these lines of credit. We believe these lines of credit donot contain any material covenants, ratings triggers or other restrictionsthat could potentially impair our ability to draw down funds. We also haveseveral uncommitted lines of credit. These lines of credit consist of :
• a $1,000 million multi-borrower and multi-currency line of credit pro-vided by a syndicate of major U.S. and European banks, underwhich we can obtain loans for Sumitomo Corporation or any of oursubsidiaries in the United Kingdom, Netherlands and the UnitedStates;
• a $50 million U.S. dollar-denominated line of credit provided toSumitomo Corporation of America by a major U.S. bank;
• a ¥250 billion line of credit provided by a syndicate of majorJapanese banks; and
• a ¥100 billion line of credit provided by a syndicate of Japaneseregional banks.
9. Liquidity and Capital Resources
Shareholders’ Equity & Shareholders’ Equity Ratio
Shareholders’ Equity RatioShareholders’ Equity
20052003 2004
16.9
12.7
934.9
618.7
14.6
730.8
25
10
15
5
0
1,000
20800
600
400
200
0
(Billions of Yen) (%)
Working Capital & Current Ratio (Current Assets/Current Liabilities)
Current RatioWorking Capital
20052003 2004
116.6
346.9
136.0
694.0
200
100
150
50
0
1,000
750
500
250
0
(Billions of Yen) (%)
140.8
897.0
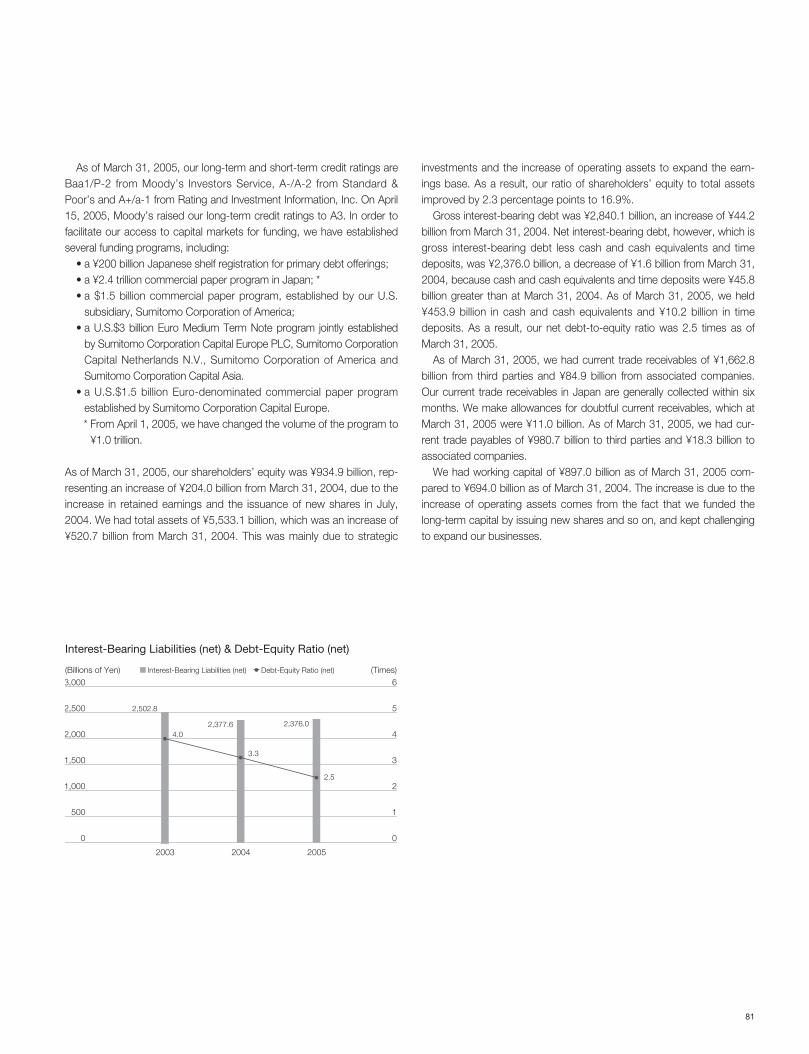
81
As of March 31, 2005, our long-term and short-term credit ratings areBaa1/P-2 from Moody’s Investors Service, A-/A-2 from Standard &Poor’s and A+/a-1 from Rating and Investment Information, Inc. On April15, 2005, Moody’s raised our long-term credit ratings to A3. In order tofacilitate our access to capital markets for funding, we have establishedseveral funding programs, including:
• a ¥200 billion Japanese shelf registration for primary debt offerings;• a ¥2.4 trillion commercial paper program in Japan; *• a $1.5 billion commercial paper program, established by our U.S.
subsidiary, Sumitomo Corporation of America;• a U.S.$3 billion Euro Medium Term Note program jointly established
by Sumitomo Corporation Capital Europe PLC, Sumitomo CorporationCapital Netherlands N.V., Sumitomo Corporation of America andSumitomo Corporation Capital Asia.
• a U.S.$1.5 billion Euro-denominated commercial paper programestablished by Sumitomo Corporation Capital Europe.* From April 1, 2005, we have changed the volume of the program to
¥1.0 trillion.
As of March 31, 2005, our shareholders’ equity was ¥934.9 billion, rep-resenting an increase of ¥204.0 billion from March 31, 2004, due to theincrease in retained earnings and the issuance of new shares in July,2004. We had total assets of ¥5,533.1 billion, which was an increase of¥520.7 billion from March 31, 2004. This was mainly due to strategic
investments and the increase of operating assets to expand the earn-ings base. As a result, our ratio of shareholders’ equity to total assetsimproved by 2.3 percentage points to 16.9%.
Gross interest-bearing debt was ¥2,840.1 billion, an increase of ¥44.2billion from March 31, 2004. Net interest-bearing debt, however, which isgross interest-bearing debt less cash and cash equivalents and timedeposits, was ¥2,376.0 billion, a decrease of ¥1.6 billion from March 31,2004, because cash and cash equivalents and time deposits were ¥45.8billion greater than at March 31, 2004. As of March 31, 2005, we held¥453.9 billion in cash and cash equivalents and ¥10.2 billion in timedeposits. As a result, our net debt-to-equity ratio was 2.5 times as ofMarch 31, 2005.
As of March 31, 2005, we had current trade receivables of ¥1,662.8billion from third parties and ¥84.9 billion from associated companies.Our current trade receivables in Japan are generally collected within sixmonths. We make allowances for doubtful current receivables, which atMarch 31, 2005 were ¥11.0 billion. As of March 31, 2005, we had cur-rent trade payables of ¥980.7 billion to third parties and ¥18.3 billion toassociated companies.
We had working capital of ¥897.0 billion as of March 31, 2005 com-pared to ¥694.0 billion as of March 31, 2004. The increase is due to theincrease of operating assets comes from the fact that we funded thelong-term capital by issuing new shares and so on, and kept challengingto expand our businesses.
Interest-Bearing Liabilities (net) & Debt-Equity Ratio (net)
Debt-Equity Ratio (net)Interest-Bearing Liabilities (net)
20052003 2004
4.0
2,502.8
3.3
2,377.6
6
4
5
3
1
2
0
3,000
2,000
2,500
1,500
500
1,000
0
(Billions of Yen) (Times)
2.5
2,376.0
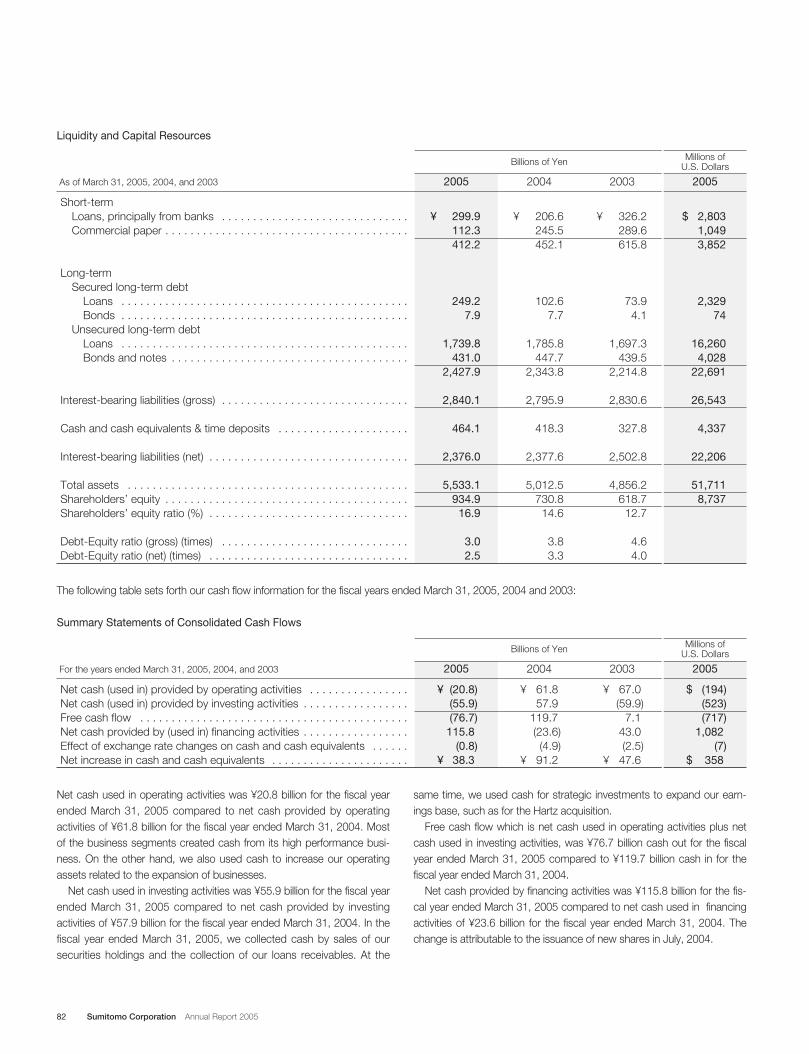
82 Sumitomo Corporation Annual Report 2005
The following table sets forth our cash flow information for the fiscal years ended March 31, 2005, 2004 and 2003:
Liquidity and Capital Resources
Short-termLoans, principally from banks . . . . . . . . . . . . . . . . . . . . . . . . . . . . . .Commercial paper . . . . . . . . . . . . . . . . . . . . . . . . . . . . . . . . . . . . . . .
Long-termSecured long-term debt
Loans . . . . . . . . . . . . . . . . . . . . . . . . . . . . . . . . . . . . . . . . . . . . . .Bonds . . . . . . . . . . . . . . . . . . . . . . . . . . . . . . . . . . . . . . . . . . . . . .
Unsecured long-term debtLoans . . . . . . . . . . . . . . . . . . . . . . . . . . . . . . . . . . . . . . . . . . . . . .Bonds and notes . . . . . . . . . . . . . . . . . . . . . . . . . . . . . . . . . . . . . .
Interest-bearing liabilities (gross) . . . . . . . . . . . . . . . . . . . . . . . . . . . . . .
Cash and cash equivalents & time deposits . . . . . . . . . . . . . . . . . . . . .
Interest-bearing liabilities (net) . . . . . . . . . . . . . . . . . . . . . . . . . . . . . . . .
Total assets . . . . . . . . . . . . . . . . . . . . . . . . . . . . . . . . . . . . . . . . . . . . .Shareholders’ equity . . . . . . . . . . . . . . . . . . . . . . . . . . . . . . . . . . . . . . .Shareholders’ equity ratio (%) . . . . . . . . . . . . . . . . . . . . . . . . . . . . . . . .
Debt-Equity ratio (gross) (times) . . . . . . . . . . . . . . . . . . . . . . . . . . . . . .Debt-Equity ratio (net) (times) . . . . . . . . . . . . . . . . . . . . . . . . . . . . . . . .
¥ 206.6245.5452.1
102.67.7
1,785.8447.7
2,343.8
2,795.9
418.3
2,377.6
5,012.5730.8
14.6
3.83.3
$ 2,8031,0493,852
2,32974
16,2604,028
22,691
26,543
4,337
22,206
51,7118,737
2005As of March 31, 2005, 2004, and 2003 2004
¥ 299.9112.3412.2
249.27.9
1,739.8431.0
2,427.9
2,840.1
464.1
2,376.0
5,533.1934.9
16.9
3.02.5
2005
¥ 326.2289.6615.8
73.94.1
1,697.3439.5
2,214.8
2,830.6
327.8
2,502.8
4,856.2618.7
12.7
4.64.0
2003
Billions of Yen Millions ofU.S. Dollars
Summary Statements of Consolidated Cash Flows
Net cash (used in) provided by operating activities . . . . . . . . . . . . . . . .Net cash (used in) provided by investing activities . . . . . . . . . . . . . . . . .Free cash flow . . . . . . . . . . . . . . . . . . . . . . . . . . . . . . . . . . . . . . . . . . .Net cash provided by (used in) financing activities . . . . . . . . . . . . . . . . .Effect of exchange rate changes on cash and cash equivalents . . . . . .Net increase in cash and cash equivalents . . . . . . . . . . . . . . . . . . . . . .
¥ 61.8 57.9
119.7 (23.6)
(4.9)¥ 91.2
$ (194)(523)(717)
1,082(7)
$ 358
2005For the years ended March 31, 2005, 2004, and 2003 2004
¥ (20.8)(55.9)(76.7)
115.8(0.8)
¥ 38.3
2005
¥ 67.0 (59.9)
7.1 43.0(2.5)
¥ 47.6
2003
Billions of Yen Millions ofU.S. Dollars
Net cash used in operating activities was ¥20.8 billion for the fiscal yearended March 31, 2005 compared to net cash provided by operatingactivities of ¥61.8 billion for the fiscal year ended March 31, 2004. Mostof the business segments created cash from its high performance busi-ness. On the other hand, we also used cash to increase our operatingassets related to the expansion of businesses.
Net cash used in investing activities was ¥55.9 billion for the fiscal yearended March 31, 2005 compared to net cash provided by investingactivities of ¥57.9 billion for the fiscal year ended March 31, 2004. In thefiscal year ended March 31, 2005, we collected cash by sales of oursecurities holdings and the collection of our loans receivables. At the
same time, we used cash for strategic investments to expand our earn-ings base, such as for the Hartz acquisition.
Free cash flow which is net cash used in operating activities plus netcash used in investing activities, was ¥76.7 billion cash out for the fiscalyear ended March 31, 2005 compared to ¥119.7 billion cash in for thefiscal year ended March 31, 2004.
Net cash provided by financing activities was ¥115.8 billion for the fis-cal year ended March 31, 2005 compared to net cash used in financingactivities of ¥23.6 billion for the fiscal year ended March 31, 2004. Thechange is attributable to the issuance of new shares in July, 2004.
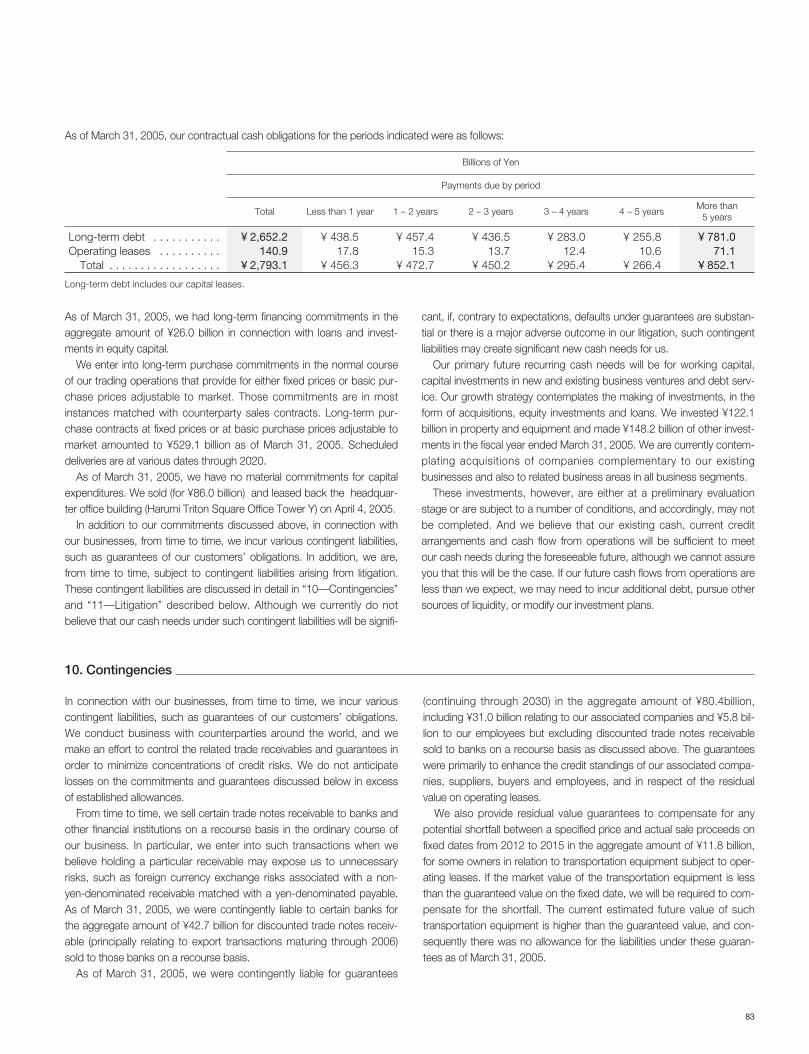
83
As of March 31, 2005, we had long-term financing commitments in theaggregate amount of ¥26.0 billion in connection with loans and invest-ments in equity capital.
We enter into long-term purchase commitments in the normal courseof our trading operations that provide for either fixed prices or basic pur-chase prices adjustable to market. Those commitments are in mostinstances matched with counterparty sales contracts. Long-term pur-chase contracts at fixed prices or at basic purchase prices adjustable tomarket amounted to ¥529.1 billion as of March 31, 2005. Scheduleddeliveries are at various dates through 2020.
As of March 31, 2005, we have no material commitments for capitalexpenditures. We sold (for ¥86.0 billion) and leased back the headquar-ter office building (Harumi Triton Square Office Tower Y) on April 4, 2005.
In addition to our commitments discussed above, in connection withour businesses, from time to time, we incur various contingent liabilities,such as guarantees of our customers’ obligations. In addition, we are,from time to time, subject to contingent liabilities arising from litigation.These contingent liabilities are discussed in detail in “10—Contingencies”and “11—Litigation” described below. Although we currently do notbelieve that our cash needs under such contingent liabilities will be signifi-
As of March 31, 2005, our contractual cash obligations for the periods indicated were as follows:
Long-term debt . . . . . . . . . . .Operating leases . . . . . . . . . .
Total . . . . . . . . . . . . . . . . . .
¥ 2,652.2140.9
¥ 2,793.1
¥ 438.517.8
¥ 456.3
¥ 255.810.6
¥ 266.4
4 – 5 yearsTotal
¥ 781.071.1
¥ 852.1
More than 5 years
Less than 1 year
¥ 283.012.4
¥ 295.4
3 – 4 years
¥ 436.513.7
¥ 450.2
2 – 3 years
¥ 457.415.3
¥ 472.7
1 – 2 years
Billions of Yen
Payments due by period
cant, if, contrary to expectations, defaults under guarantees are substan-tial or there is a major adverse outcome in our litigation, such contingentliabilities may create significant new cash needs for us.
Our primary future recurring cash needs will be for working capital,capital investments in new and existing business ventures and debt serv-ice. Our growth strategy contemplates the making of investments, in theform of acquisitions, equity investments and loans. We invested ¥122.1billion in property and equipment and made ¥148.2 billion of other invest-ments in the fiscal year ended March 31, 2005. We are currently contem-plating acquisitions of companies complementary to our existingbusinesses and also to related business areas in all business segments.
These investments, however, are either at a preliminary evaluationstage or are subject to a number of conditions, and accordingly, may notbe completed. And we believe that our existing cash, current creditarrangements and cash flow from operations will be sufficient to meetour cash needs during the foreseeable future, although we cannot assureyou that this will be the case. If our future cash flows from operations areless than we expect, we may need to incur additional debt, pursue othersources of liquidity, or modify our investment plans.
In connection with our businesses, from time to time, we incur variouscontingent liabilities, such as guarantees of our customers’ obligations.We conduct business with counterparties around the world, and wemake an effort to control the related trade receivables and guarantees inorder to minimize concentrations of credit risks. We do not anticipatelosses on the commitments and guarantees discussed below in excessof established allowances.
From time to time, we sell certain trade notes receivable to banks andother financial institutions on a recourse basis in the ordinary course ofour business. In particular, we enter into such transactions when webelieve holding a particular receivable may expose us to unnecessaryrisks, such as foreign currency exchange risks associated with a non-yen-denominated receivable matched with a yen-denominated payable.As of March 31, 2005, we were contingently liable to certain banks forthe aggregate amount of ¥42.7 billion for discounted trade notes receiv-able (principally relating to export transactions maturing through 2006)sold to those banks on a recourse basis.
As of March 31, 2005, we were contingently liable for guarantees
(continuing through 2030) in the aggregate amount of ¥80.4billion,including ¥31.0 billion relating to our associated companies and ¥5.8 bil-lion to our employees but excluding discounted trade notes receivablesold to banks on a recourse basis as discussed above. The guaranteeswere primarily to enhance the credit standings of our associated compa-nies, suppliers, buyers and employees, and in respect of the residualvalue on operating leases.
We also provide residual value guarantees to compensate for anypotential shortfall between a specified price and actual sale proceeds onfixed dates from 2012 to 2015 in the aggregate amount of ¥11.8 billion,for some owners in relation to transportation equipment subject to oper-ating leases. If the market value of the transportation equipment is lessthan the guaranteed value on the fixed date, we will be required to com-pensate for the shortfall. The current estimated future value of suchtransportation equipment is higher than the guaranteed value, and con-sequently there was no allowance for the liabilities under these guaran-tees as of March 31, 2005.
10. Contingencies
Long-term debt includes our capital leases.
84 Sumitomo Corporation Annual Report 2005
In June 1996, we announced that we had incurred significant lossesresulting from unauthorized copper trading by a former employee.Following the announcement, regulatory authorities in the United Statesand the United Kingdom conducted investigations into our copper trad-ing activities. Several lawsuits were also brought against us, alleging,among other things, manipulation of the price of copper. We reachedsettlements with the regulators in the United States and the UnitedKingdom, and reached settlements or otherwise resolved many of therelated civil lawsuits.
As of July 31, 2005, we have one class action lawsuit pending inCanada and one individual lawsuit pending in the United States related tothe copper trading incident.
In October 2004, we settled one case that we brought for the purposeof recovering losses arising from the unauthorized copper trading in theUnited Kingdom. As of July 31, 2005, we are suing one company inJapan for the same purpose.
11. Litigation
12. New Accounting Pronouncements
In the normal course of business, we are exposed to risks arising fromfluctuations in interest and currency exchange rates, commodity pricesand equity prices. In order to manage these risks, we use financial andcommodity derivative instruments including: foreign exchange forwards,currency swaps and options; interest rate swaps, futures and options;and commodity futures, forwards, swaps, and options. To a lesserdegree, we also use derivative commodity instruments for trading pur-poses within prescribed position limits and loss limits imposed under therisk management structure described below.
Interest Rate RiskOur business activities expose us to market risks arising from changesin interest rates, which we monitor and take measures to minimizethrough our Financial Resources Management Group. In particular,interest rate fluctuations will impact our borrowing costs because a sig-nificant amount of our outstanding debt instruments are floating rateinstruments and because we have short-term borrowings that we refi-nance from time to time. However, the impact on our borrowing costswill be partially offset by increased returns on some of our assets whichwill also be impacted by interest rate fluctuations. For example, we are
engaged in financing activities, such as automobile financing, whichcould be affected by interest rate fluctuations. To manage this risk, weenter into interest rate swap agreements, future contracts and optioncontracts which serve to modify and match the interest rate character-istics of our assets and liabilities.
Foreign Currency Exchange Rate RiskThe nature of our global operations expose us to market risks causedby fluctuations in foreign currency exchange rates related to imports,exports, financing, and investments in currencies other than the localcurrency. Each business department manages its foreign currencyexchange rate risk by entering into internal foreign exchange forwardcontracts with our Financial Resources Management Group. Throughthose internal transactions and otherwise, the Financial ResourcesManagement Group monitors the company-wide market risks arisingfrom the changes in foreign exchange rates associated with underlyingtransactions denominated in foreign currencies. The FinancialResources Management Group enters into foreign exchange forwardcontracts, currency swap agreements and currency option contractswith third parties for hedging purposes.
In December, 2004, FASB issued SFAS No. 123R, “Share-BasedPayment,” a revision to SFAS No. 123, “Accounting for Stock-BasedCompensation.” SFAS No. 123R focuses primarily on transactions inwhich an entity exchanges its equity instruments for employee services,requires all share-based payments to employees to be recognized inearnings based on their fair values, and generally establishes standards forthe accounting for transactions in which an entity obtains goods or serv-ices in share-based payment transactions. SFAS No. 123R is effectiveafter June 30, 2005 and we do not expect the adoption of SFAS No.123R will have a material impact on our consolidated financial statements.
In December, 2004, FASB issued SFAS No. 153, “Exchanges of
Nonmonetary Assets — an amendment of APB Opinion No. 29.” SFASNo. 153 eliminates the exception from fair value measurement for non-monetary exchange of similar productive assets in paragraph 21(b) ofAPB Opinion No. 29, “Accounting for Nonmonetary Transactions,” andreplaces it with an exception for exchanges that do not have commercialsubstance. SFAS No. 153 specifies that a nonmonetary exchange hascommercial substance if the future cash flows of the entity are expectedto change significantly as a result of the exchange. SFAS No. 153 is effec-tive for fiscal years beginning after June 15, 2005 and we do not expectthe adoption of SFAS No. 153 will have a material impact on our consoli-dated financial statements.
13. Quantitative and Qualitative Disclosure about Market Risk
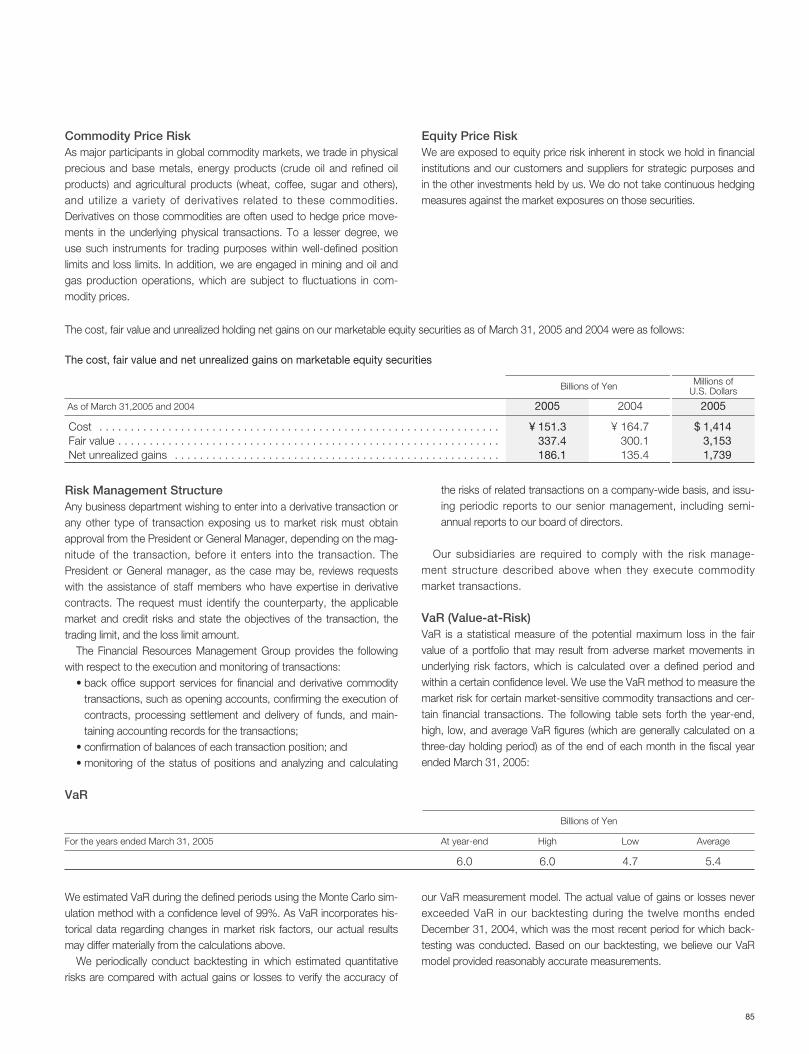
85
Risk Management StructureAny business department wishing to enter into a derivative transaction orany other type of transaction exposing us to market risk must obtainapproval from the President or General Manager, depending on the mag-nitude of the transaction, before it enters into the transaction. ThePresident or General manager, as the case may be, reviews requestswith the assistance of staff members who have expertise in derivativecontracts. The request must identify the counterparty, the applicablemarket and credit risks and state the objectives of the transaction, thetrading limit, and the loss limit amount.
The Financial Resources Management Group provides the followingwith respect to the execution and monitoring of transactions:
• back office support services for financial and derivative commoditytransactions, such as opening accounts, confirming the execution ofcontracts, processing settlement and delivery of funds, and main-taining accounting records for the transactions;
• confirmation of balances of each transaction position; and• monitoring of the status of positions and analyzing and calculating
The cost, fair value and unrealized holding net gains on our marketable equity securities as of March 31, 2005 and 2004 were as follows:
The cost, fair value and net unrealized gains on marketable equity securities
Cost . . . . . . . . . . . . . . . . . . . . . . . . . . . . . . . . . . . . . . . . . . . . . . . . . . . . . . . . . . . . . . . .Fair value . . . . . . . . . . . . . . . . . . . . . . . . . . . . . . . . . . . . . . . . . . . . . . . . . . . . . . . . . . . . .Net unrealized gains . . . . . . . . . . . . . . . . . . . . . . . . . . . . . . . . . . . . . . . . . . . . . . . . . . . .
¥ 164.7 300.1 135.4
2004
$ 1,4143,1531,739
2005As of March 31,2005 and 2004
¥ 151.3 337.4 186.1
2005
Billions of Yen Millions ofU.S. Dollars
the risks of related transactions on a company-wide basis, and issu-ing periodic reports to our senior management, including semi-annual reports to our board of directors.
Our subsidiaries are required to comply with the risk manage-ment structure described above when they execute commoditymarket transactions.
VaR (Value-at-Risk)VaR is a statistical measure of the potential maximum loss in the fairvalue of a portfolio that may result from adverse market movements inunderlying risk factors, which is calculated over a defined period andwithin a certain confidence level. We use the VaR method to measure themarket risk for certain market-sensitive commodity transactions and cer-tain financial transactions. The following table sets forth the year-end,high, low, and average VaR figures (which are generally calculated on athree-day holding period) as of the end of each month in the fiscal yearended March 31, 2005:
We estimated VaR during the defined periods using the Monte Carlo sim-ulation method with a confidence level of 99%. As VaR incorporates his-torical data regarding changes in market risk factors, our actual resultsmay differ materially from the calculations above.
We periodically conduct backtesting in which estimated quantitativerisks are compared with actual gains or losses to verify the accuracy of
VaR
5.4
AverageFor the years ended March 31, 2005
4.7
Low
6.0
High
6.0
At year-end
Billions of Yen
our VaR measurement model. The actual value of gains or losses neverexceeded VaR in our backtesting during the twelve months endedDecember 31, 2004, which was the most recent period for which back-testing was conducted. Based on our backtesting, we believe our VaRmodel provided reasonably accurate measurements.
Commodity Price RiskAs major participants in global commodity markets, we trade in physicalprecious and base metals, energy products (crude oil and refined oilproducts) and agricultural products (wheat, coffee, sugar and others),and utilize a variety of derivatives related to these commodities.Derivatives on those commodities are often used to hedge price move-ments in the underlying physical transactions. To a lesser degree, weuse such instruments for trading purposes within well-defined positionlimits and loss limits. In addition, we are engaged in mining and oil andgas production operations, which are subject to fluctuations in com-modity prices.
Equity Price RiskWe are exposed to equity price risk inherent in stock we hold in financialinstitutions and our customers and suppliers for strategic purposes andin the other investments held by us. We do not take continuous hedgingmeasures against the market exposures on those securities.
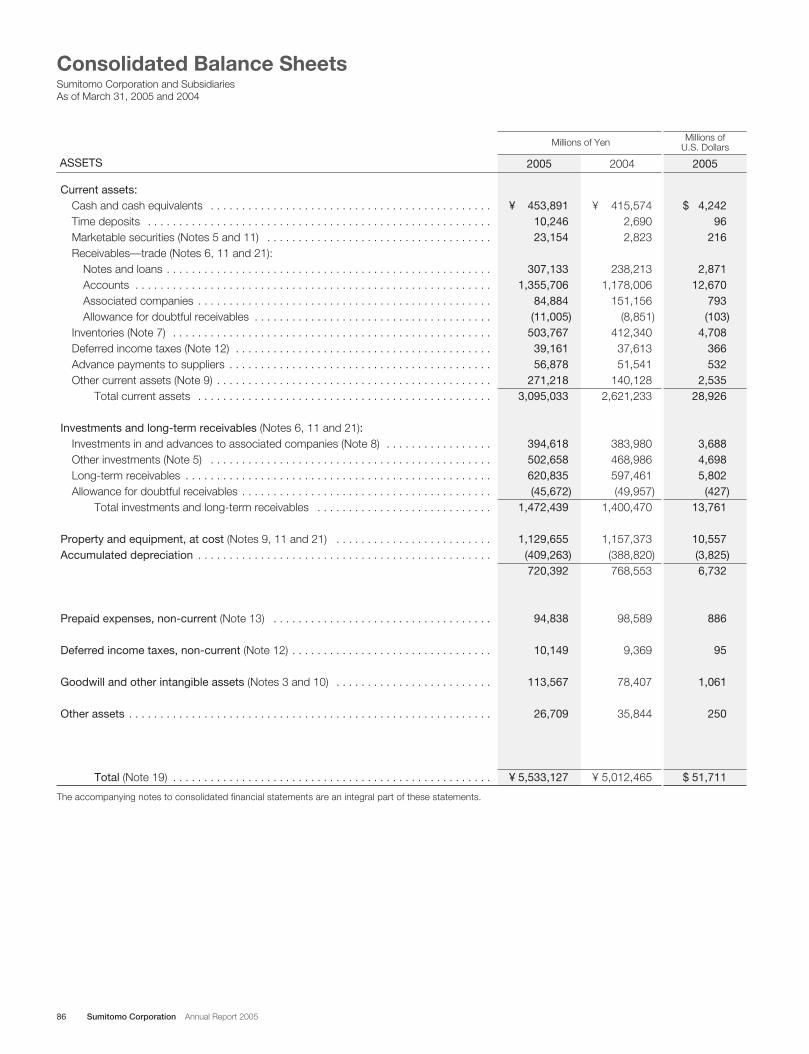
86 Sumitomo Corporation Annual Report 2005
Consolidated Balance SheetsSumitomo Corporation and SubsidiariesAs of March 31, 2005 and 2004
Current assets:Cash and cash equivalents . . . . . . . . . . . . . . . . . . . . . . . . . . . . . . . . . . . . . . . . . . . . .Time deposits . . . . . . . . . . . . . . . . . . . . . . . . . . . . . . . . . . . . . . . . . . . . . . . . . . . . . . .Marketable securities (Notes 5 and 11) . . . . . . . . . . . . . . . . . . . . . . . . . . . . . . . . . . . .Receivables—trade (Notes 6, 11 and 21):
Notes and loans . . . . . . . . . . . . . . . . . . . . . . . . . . . . . . . . . . . . . . . . . . . . . . . . . . . .Accounts . . . . . . . . . . . . . . . . . . . . . . . . . . . . . . . . . . . . . . . . . . . . . . . . . . . . . . . . .Associated companies . . . . . . . . . . . . . . . . . . . . . . . . . . . . . . . . . . . . . . . . . . . . . . .Allowance for doubtful receivables . . . . . . . . . . . . . . . . . . . . . . . . . . . . . . . . . . . . . .
Inventories (Note 7) . . . . . . . . . . . . . . . . . . . . . . . . . . . . . . . . . . . . . . . . . . . . . . . . . . .Deferred income taxes (Note 12) . . . . . . . . . . . . . . . . . . . . . . . . . . . . . . . . . . . . . . . . .Advance payments to suppliers . . . . . . . . . . . . . . . . . . . . . . . . . . . . . . . . . . . . . . . . . .Other current assets (Note 9) . . . . . . . . . . . . . . . . . . . . . . . . . . . . . . . . . . . . . . . . . . . .
Total current assets . . . . . . . . . . . . . . . . . . . . . . . . . . . . . . . . . . . . . . . . . . . . . . .
Investments and long-term receivables (Notes 6, 11 and 21):Investments in and advances to associated companies (Note 8) . . . . . . . . . . . . . . . . .Other investments (Note 5) . . . . . . . . . . . . . . . . . . . . . . . . . . . . . . . . . . . . . . . . . . . . .Long-term receivables . . . . . . . . . . . . . . . . . . . . . . . . . . . . . . . . . . . . . . . . . . . . . . . . .Allowance for doubtful receivables . . . . . . . . . . . . . . . . . . . . . . . . . . . . . . . . . . . . . . . .
Total investments and long-term receivables . . . . . . . . . . . . . . . . . . . . . . . . . . . .
Property and equipment, at cost (Notes 9, 11 and 21) . . . . . . . . . . . . . . . . . . . . . . . . .Accumulated depreciation . . . . . . . . . . . . . . . . . . . . . . . . . . . . . . . . . . . . . . . . . . . . . . .
Prepaid expenses, non-current (Note 13) . . . . . . . . . . . . . . . . . . . . . . . . . . . . . . . . . . .
Deferred income taxes, non-current (Note 12) . . . . . . . . . . . . . . . . . . . . . . . . . . . . . . . .
Goodwill and other intangible assets (Notes 3 and 10) . . . . . . . . . . . . . . . . . . . . . . . . .
Other assets . . . . . . . . . . . . . . . . . . . . . . . . . . . . . . . . . . . . . . . . . . . . . . . . . . . . . . . . . .
Total (Note 19) . . . . . . . . . . . . . . . . . . . . . . . . . . . . . . . . . . . . . . . . . . . . . . . . . . .
¥ 453,89110,24623,154
307,1331,355,706
84,884(11,005)
503,76739,16156,878
271,2183,095,033
394,618502,658620,835(45,672)
1,472,439
1,129,655(409,263)720,392
94,838
10,149
113,567
26,709
¥ 5,533,127
¥ 415,5742,6902,823
238,2131,178,006
151,156(8,851)
412,34037,61351,541
140,1282,621,233
383,980468,986597,461(49,957)
1,400,470
1,157,373(388,820)768,553
98,589
9,369
78,407
35,844
¥ 5,012,465
$ 4,24296
216
2,87112,670
793(103)
4,708366532
2,53528,926
3,6884,6985,802
(427)13,761
10,557(3,825)6,732
886
95
1,061
250
$ 51,711
20052005 2004
Millions of Yen Millions ofU.S. Dollars
ASSETS
The accompanying notes to consolidated financial statements are an integral part of these statements.
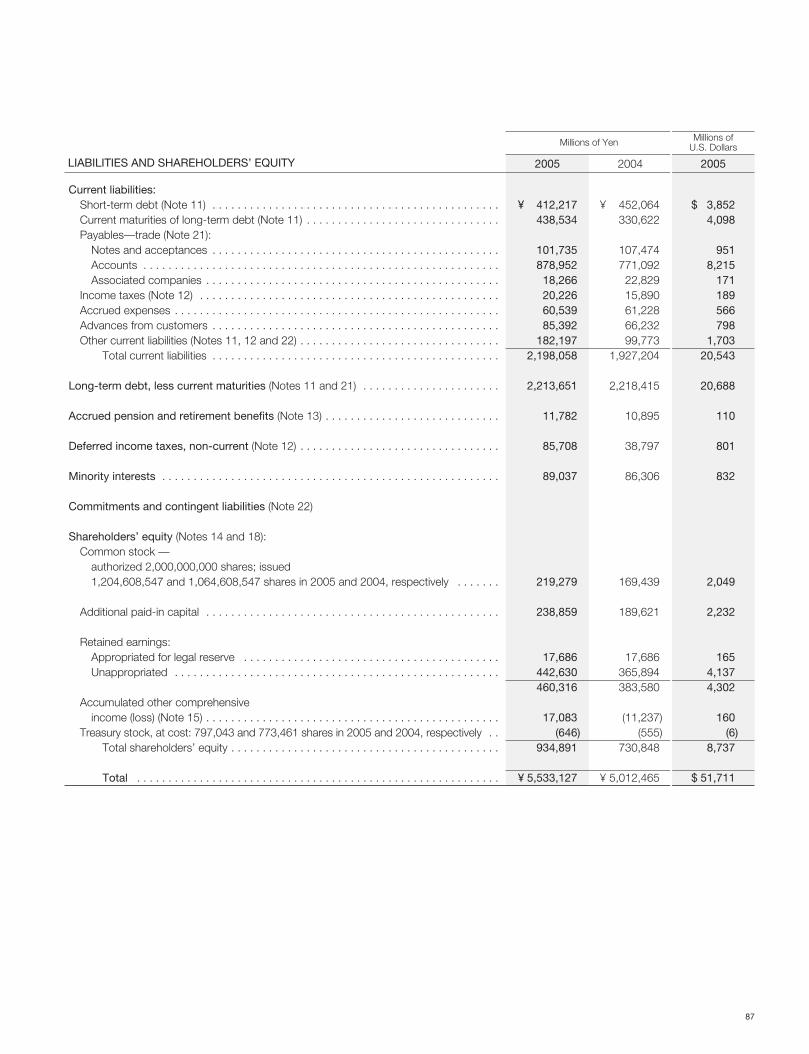
87
Current liabilities:Short-term debt (Note 11) . . . . . . . . . . . . . . . . . . . . . . . . . . . . . . . . . . . . . . . . . . . . . .Current maturities of long-term debt (Note 11) . . . . . . . . . . . . . . . . . . . . . . . . . . . . . . .Payables—trade (Note 21):
Notes and acceptances . . . . . . . . . . . . . . . . . . . . . . . . . . . . . . . . . . . . . . . . . . . . . .Accounts . . . . . . . . . . . . . . . . . . . . . . . . . . . . . . . . . . . . . . . . . . . . . . . . . . . . . . . . .Associated companies . . . . . . . . . . . . . . . . . . . . . . . . . . . . . . . . . . . . . . . . . . . . . . .
Income taxes (Note 12) . . . . . . . . . . . . . . . . . . . . . . . . . . . . . . . . . . . . . . . . . . . . . . . .Accrued expenses . . . . . . . . . . . . . . . . . . . . . . . . . . . . . . . . . . . . . . . . . . . . . . . . . . . .Advances from customers . . . . . . . . . . . . . . . . . . . . . . . . . . . . . . . . . . . . . . . . . . . . . .Other current liabilities (Notes 11, 12 and 22) . . . . . . . . . . . . . . . . . . . . . . . . . . . . . . . .
Total current liabilities . . . . . . . . . . . . . . . . . . . . . . . . . . . . . . . . . . . . . . . . . . . . . .
Long-term debt, less current maturities (Notes 11 and 21) . . . . . . . . . . . . . . . . . . . . . .
Accrued pension and retirement benefits (Note 13) . . . . . . . . . . . . . . . . . . . . . . . . . . . .
Deferred income taxes, non-current (Note 12) . . . . . . . . . . . . . . . . . . . . . . . . . . . . . . . .
Minority interests . . . . . . . . . . . . . . . . . . . . . . . . . . . . . . . . . . . . . . . . . . . . . . . . . . . . . .
Commitments and contingent liabilities (Note 22)
Shareholders’ equity (Notes 14 and 18):Common stock —
authorized 2,000,000,000 shares; issued 1,204,608,547 and 1,064,608,547 shares in 2005 and 2004, respectively . . . . . . .
Additional paid-in capital . . . . . . . . . . . . . . . . . . . . . . . . . . . . . . . . . . . . . . . . . . . . . . .
Retained earnings:Appropriated for legal reserve . . . . . . . . . . . . . . . . . . . . . . . . . . . . . . . . . . . . . . . . .Unappropriated . . . . . . . . . . . . . . . . . . . . . . . . . . . . . . . . . . . . . . . . . . . . . . . . . . . .
Accumulated other comprehensive income (loss) (Note 15) . . . . . . . . . . . . . . . . . . . . . . . . . . . . . . . . . . . . . . . . . . . . . . .
Treasury stock, at cost: 797,043 and 773,461 shares in 2005 and 2004, respectively . .Total shareholders’ equity . . . . . . . . . . . . . . . . . . . . . . . . . . . . . . . . . . . . . . . . . . .
Total . . . . . . . . . . . . . . . . . . . . . . . . . . . . . . . . . . . . . . . . . . . . . . . . . . . . . . . . . .
¥ 412,217438,534
101,735878,952
18,26620,22660,53985,392
182,1972,198,058
2,213,651
11,782
85,708
89,037
219,279
238,859
17,686442,630460,316
17,083(646)
934,891
¥ 5,533,127
¥ 452,064330,622
107,474771,092
22,82915,89061,22866,23299,773
1,927,204
2,218,415
10,895
38,797
86,306
169,439
189,621
17,686365,894383,580
(11,237)(555)
730,848
¥ 5,012,465
$ 3,8524,098
9518,215
171189566798
1,70320,543
20,688
110
801
832
2,049
2,232
1654,1374,302
160(6)
8,737
$ 51,711
20052005 2004
Millions of Yen Millions ofU.S. Dollars
LIABILITIES AND SHAREHOLDERS’ EQUITY

88 Sumitomo Corporation Annual Report 2005
Revenues (Note 19):Sales of tangible products . . . . . . . . . . . . . . . . . . . . . . . . . . . . . . . . .Sales of services and others . . . . . . . . . . . . . . . . . . . . . . . . . . . . . . .
Total revenues . . . . . . . . . . . . . . . . . . . . . . . . . . . . . . . . . . . . . . . .
Cost (Notes 9 and 20):Cost of tangible products sold . . . . . . . . . . . . . . . . . . . . . . . . . . . . . .Cost of services and others . . . . . . . . . . . . . . . . . . . . . . . . . . . . . . . .
Total cost . . . . . . . . . . . . . . . . . . . . . . . . . . . . . . . . . . . . . . . . . . .
Gross profit (Note 19) . . . . . . . . . . . . . . . . . . . . . . . . . . . . . . . . . . . . . .
Other income (expenses):Selling, general and administrative expenses (Notes 9, 10 and 13) . .Settlements on copper trading litigation (Note 22) . . . . . . . . . . . . . . .Provision for doubtful receivables (Note 6) . . . . . . . . . . . . . . . . . . . . .Impairment losses on long-lived assets (Notes 9 and 10) . . . . . . . . . .Gain on sale of property and equipment, net (Note 9) . . . . . . . . . . . .Interest income . . . . . . . . . . . . . . . . . . . . . . . . . . . . . . . . . . . . . . . . .Interest expense . . . . . . . . . . . . . . . . . . . . . . . . . . . . . . . . . . . . . . . .Dividends . . . . . . . . . . . . . . . . . . . . . . . . . . . . . . . . . . . . . . . . . . . . .Other than temporary impairment losses on securities . . . . . . . . . . .Gain on sale of marketable securities and other investments,
net (Note 5) . . . . . . . . . . . . . . . . . . . . . . . . . . . . . . . . . . . . . . . . . .Gain on issuances of stock by subsidiaries and associated companies
(Note 8) . . . . . . . . . . . . . . . . . . . . . . . . . . . . . . . . . . . . . . . . . . . . .Equity in earnings of associated companies, net (Notes 8 and 12) . . .Other, net . . . . . . . . . . . . . . . . . . . . . . . . . . . . . . . . . . . . . . . . . . . . .
Total other income (expenses) . . . . . . . . . . . . . . . . . . . . . . . . . . .
Income before income taxes and minority interests in earnings of subsidiaries (Note 12) . . . . . . . . . . . . . . . . . . . . . . . . . . . . . . . . . .
Income taxes (Note 12) . . . . . . . . . . . . . . . . . . . . . . . . . . . . . . . . . . . .
Income before minority interests in earnings of subsidiaries . . . . . . .
Minority interests in earnings of subsidiaries, net . . . . . . . . . . . . . . . .
Net income (Note 19) . . . . . . . . . . . . . . . . . . . . . . . . . . . . . . . . . . . . . .
Total trading transactions* (Note 19) . . . . . . . . . . . . . . . . . . . . . . . . . .
Net income per share of common stock (Note 18):Basic . . . . . . . . . . . . . . . . . . . . . . . . . . . . . . . . . . . . . . . . . . . . . . . . .Diluted . . . . . . . . . . . . . . . . . . . . . . . . . . . . . . . . . . . . . . . . . . . . . . . .
¥ 1,586,057463,242
2,049,299
1,361,767124,402
1,486,169
563,130
(437,849)2,815
(12,896)(29,548)11,46814,562(23,207)
6,386(8,927)
16,339
12,60337,387
(914)(411,781)
151,349
(57,849)
93,500
(8,427)
¥ 85,073
¥ 9,898,598
¥ 72.8372.82
¥ 1,284,117424,479
1,708,596
1,097,503109,761
1,207,264
501,332
(422,363)(7,139)(8,019)(5,178)
13,32015,684(22,058)
6,934(23,237)
39,557
—20,693
(491)(392,297)
109,035
(35,697)
73,338
(6,717)
¥ 66,621
¥ 9,197,882
¥ 62.6661.31
$ 14,8234,329
19,152
12,7271,162
13,889
5,263
(4,092)26
(121)(276)107136(217)
60(83)
153
118349
(8)(3,848)
1,415
(541)
874
(79)
$ 795
$ 92,510
$ 0.680.68
¥ 1,129,376408,952
1,538,328
948,20193,678
1,041,879
496,449
(406,334)192
(5,588)(20,371)
3,28324,895(30,901)
6,373(66,104)
18,979
— 9,768(2,040)
(467,848)
28,601
(8,374)
20,227
(6,353)
¥ 13,874
¥ 9,229,576
¥ 13.0413.00
Millions of Yen Millions ofU.S. Dollars
Consolidated Statements of IncomeSumitomo Corporation and SubsidiariesFor the years ended March 31, 2005, 2004 and 2003
Yen U.S. Dollars
20052005 20032004
* Total trading transactions represents the gross transaction volume of trading activities, or the nominal aggregate value of the transactions for which the Companiesact as principal or as agent. Total trading transactions is a measure commonly used by Japanese trading companies. It is not to be construed as equivalent to, or asubstitute for, sales or revenues under accounting principles generally accepted in the United States of America (“U.S. GAAP”).
The accompanying notes to consolidated financial statements are an integral part of these statements.
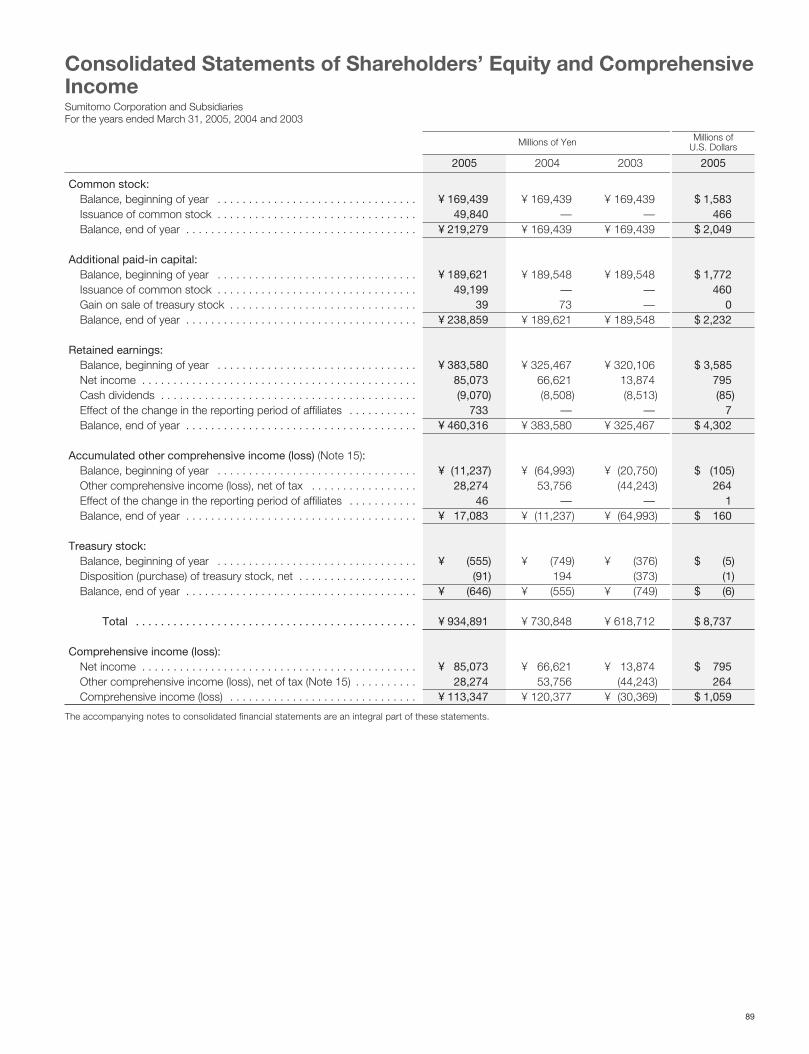
89
Common stock:Balance, beginning of year . . . . . . . . . . . . . . . . . . . . . . . . . . . . . . . .Issuance of common stock . . . . . . . . . . . . . . . . . . . . . . . . . . . . . . . .Balance, end of year . . . . . . . . . . . . . . . . . . . . . . . . . . . . . . . . . . . . .
Additional paid-in capital:Balance, beginning of year . . . . . . . . . . . . . . . . . . . . . . . . . . . . . . . .Issuance of common stock . . . . . . . . . . . . . . . . . . . . . . . . . . . . . . . .Gain on sale of treasury stock . . . . . . . . . . . . . . . . . . . . . . . . . . . . . .Balance, end of year . . . . . . . . . . . . . . . . . . . . . . . . . . . . . . . . . . . . .
Retained earnings:Balance, beginning of year . . . . . . . . . . . . . . . . . . . . . . . . . . . . . . . .Net income . . . . . . . . . . . . . . . . . . . . . . . . . . . . . . . . . . . . . . . . . . . .Cash dividends . . . . . . . . . . . . . . . . . . . . . . . . . . . . . . . . . . . . . . . . .Effect of the change in the reporting period of affiliates . . . . . . . . . . .Balance, end of year . . . . . . . . . . . . . . . . . . . . . . . . . . . . . . . . . . . . .
Accumulated other comprehensive income (loss) (Note 15):Balance, beginning of year . . . . . . . . . . . . . . . . . . . . . . . . . . . . . . . .Other comprehensive income (loss), net of tax . . . . . . . . . . . . . . . . .Effect of the change in the reporting period of affiliates . . . . . . . . . . .Balance, end of year . . . . . . . . . . . . . . . . . . . . . . . . . . . . . . . . . . . . .
Treasury stock:Balance, beginning of year . . . . . . . . . . . . . . . . . . . . . . . . . . . . . . . .Disposition (purchase) of treasury stock, net . . . . . . . . . . . . . . . . . . .Balance, end of year . . . . . . . . . . . . . . . . . . . . . . . . . . . . . . . . . . . . .
Total . . . . . . . . . . . . . . . . . . . . . . . . . . . . . . . . . . . . . . . . . . . . .
Comprehensive income (loss):Net income . . . . . . . . . . . . . . . . . . . . . . . . . . . . . . . . . . . . . . . . . . . .Other comprehensive income (loss), net of tax (Note 15) . . . . . . . . . .Comprehensive income (loss) . . . . . . . . . . . . . . . . . . . . . . . . . . . . . .
¥ 169,43949,840
¥ 219,279
¥ 189,62149,199
39¥ 238,859
¥ 383,58085,073(9,070)
733¥ 460,316
¥ (11,237)28,274
46¥ 17,083
¥ (555)(91)
¥ (646)
¥ 934,891
¥ 85,07328,274
¥ 113,347
¥ 169,439—
¥ 169,439
¥ 189,548—73
¥ 189,621
¥ 325,46766,621(8,508)
—¥ 383,580
¥ (64,993)53,756
—¥ (11,237)
¥ (749)194
¥ (555)
¥ 730,848
¥ 66,62153,756
¥ 120,377
$ 1,583466
$ 2,049
$ 1,772460
0$ 2,232
$ 3,585795(85)
7$ 4,302
$ (105)264
1$ 160
$ (5)(1)
$ (6)
$ 8,737
$ 795264
$ 1,059
¥ 169,439—
¥ 169,439
¥ 189,548— —
¥ 189,548
¥ 320,10613,874(8,513)
—¥ 325,467
¥ (20,750)(44,243)
—¥ (64,993)
¥ (376)(373)
¥ (749)
¥ 618,712
¥ 13,874(44,243)
¥ (30,369)
Consolidated Statements of Shareholders’ Equity and ComprehensiveIncomeSumitomo Corporation and SubsidiariesFor the years ended March 31, 2005, 2004 and 2003
Millions of Yen Millions ofU.S. Dollars
20052005 20032004
The accompanying notes to consolidated financial statements are an integral part of these statements.
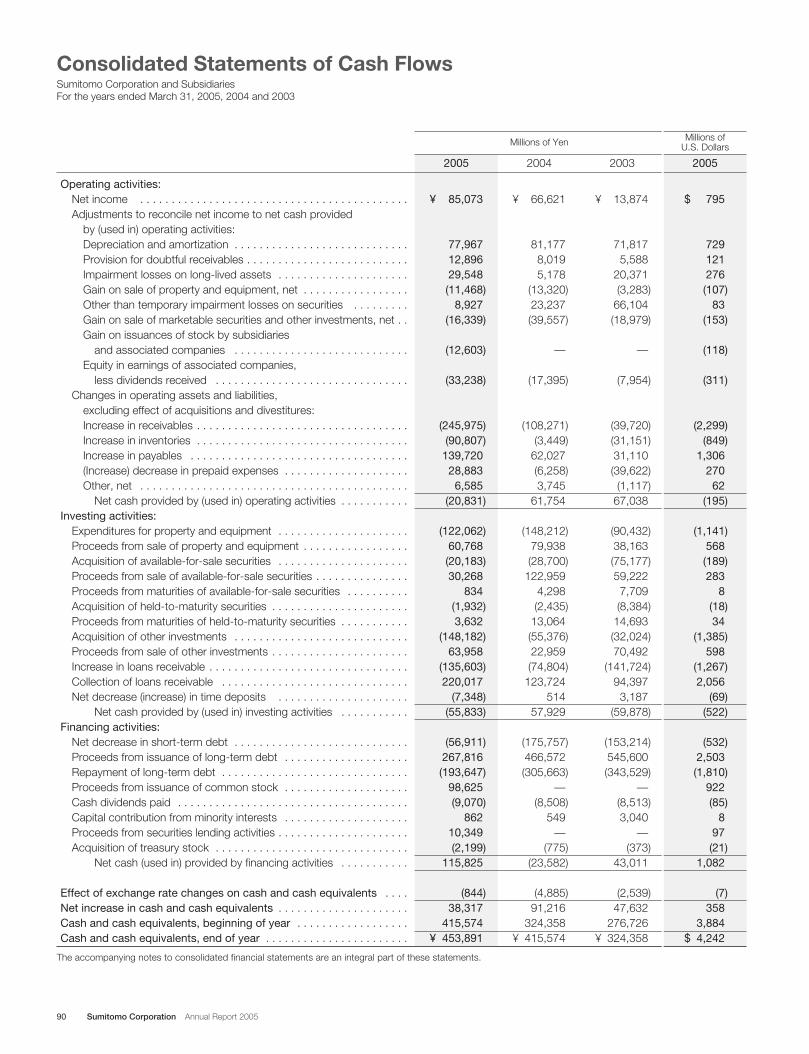
90 Sumitomo Corporation Annual Report 2005
Operating activities:Net income . . . . . . . . . . . . . . . . . . . . . . . . . . . . . . . . . . . . . . . . . . .Adjustments to reconcile net income to net cash provided
by (used in) operating activities:Depreciation and amortization . . . . . . . . . . . . . . . . . . . . . . . . . . . .Provision for doubtful receivables . . . . . . . . . . . . . . . . . . . . . . . . . .Impairment losses on long-lived assets . . . . . . . . . . . . . . . . . . . . .Gain on sale of property and equipment, net . . . . . . . . . . . . . . . . .Other than temporary impairment losses on securities . . . . . . . . .Gain on sale of marketable securities and other investments, net . .Gain on issuances of stock by subsidiaries
and associated companies . . . . . . . . . . . . . . . . . . . . . . . . . . . .Equity in earnings of associated companies,
less dividends received . . . . . . . . . . . . . . . . . . . . . . . . . . . . . . .Changes in operating assets and liabilities,
excluding effect of acquisitions and divestitures:Increase in receivables . . . . . . . . . . . . . . . . . . . . . . . . . . . . . . . . . .Increase in inventories . . . . . . . . . . . . . . . . . . . . . . . . . . . . . . . . . .Increase in payables . . . . . . . . . . . . . . . . . . . . . . . . . . . . . . . . . . .(Increase) decrease in prepaid expenses . . . . . . . . . . . . . . . . . . . .Other, net . . . . . . . . . . . . . . . . . . . . . . . . . . . . . . . . . . . . . . . . . . .
Net cash provided by (used in) operating activities . . . . . . . . . . .Investing activities:
Expenditures for property and equipment . . . . . . . . . . . . . . . . . . . . .Proceeds from sale of property and equipment . . . . . . . . . . . . . . . . .Acquisition of available-for-sale securities . . . . . . . . . . . . . . . . . . . . .Proceeds from sale of available-for-sale securities . . . . . . . . . . . . . . .Proceeds from maturities of available-for-sale securities . . . . . . . . . .Acquisition of held-to-maturity securities . . . . . . . . . . . . . . . . . . . . . .Proceeds from maturities of held-to-maturity securities . . . . . . . . . . .Acquisition of other investments . . . . . . . . . . . . . . . . . . . . . . . . . . . .Proceeds from sale of other investments . . . . . . . . . . . . . . . . . . . . . .Increase in loans receivable . . . . . . . . . . . . . . . . . . . . . . . . . . . . . . . .Collection of loans receivable . . . . . . . . . . . . . . . . . . . . . . . . . . . . . .Net decrease (increase) in time deposits . . . . . . . . . . . . . . . . . . . . .
Net cash provided by (used in) investing activities . . . . . . . . . . .Financing activities:
Net decrease in short-term debt . . . . . . . . . . . . . . . . . . . . . . . . . . . .Proceeds from issuance of long-term debt . . . . . . . . . . . . . . . . . . . .Repayment of long-term debt . . . . . . . . . . . . . . . . . . . . . . . . . . . . . .Proceeds from issuance of common stock . . . . . . . . . . . . . . . . . . . .Cash dividends paid . . . . . . . . . . . . . . . . . . . . . . . . . . . . . . . . . . . . .Capital contribution from minority interests . . . . . . . . . . . . . . . . . . . .Proceeds from securities lending activities . . . . . . . . . . . . . . . . . . . . .Acquisition of treasury stock . . . . . . . . . . . . . . . . . . . . . . . . . . . . . . .
Net cash (used in) provided by financing activities . . . . . . . . . . .
Effect of exchange rate changes on cash and cash equivalents . . . .Net increase in cash and cash equivalents . . . . . . . . . . . . . . . . . . . . .Cash and cash equivalents, beginning of year . . . . . . . . . . . . . . . . . .Cash and cash equivalents, end of year . . . . . . . . . . . . . . . . . . . . . . .
¥ 85,073
77,96712,89629,548(11,468)
8,927(16,339)
(12,603)
(33,238)
(245,975)(90,807)
139,72028,883
6,585(20,831)
(122,062)60,768(20,183)30,268
834(1,932)3,632
(148,182)63,958
(135,603)220,017
(7,348)(55,833)
(56,911)267,816(193,647)
98,625(9,070)
86210,349(2,199)
115,825
(844)38,317
415,574¥ 453,891
¥ 66,621
81,1778,0195,178
(13,320)23,237(39,557)
—
(17,395)
(108,271)(3,449)
62,027(6,258)3,745
61,754
(148,212)79,938(28,700)
122,9594,298(2,435)
13,064(55,376)22,959(74,804)
123,724514
57,929
(175,757)466,572(305,663)
—(8,508)
549—
(775)(23,582)
(4,885)91,216
324,358¥ 415,574
$ 795
729121276(107)
83(153)
(118)
(311)
(2,299)(849)
1,306270
62(195)
(1,141)568(189)283
8(18)34
(1,385)598
(1,267)2,056
(69)(522)
(532)2,503(1,810)
922(85)
897(21)
1,082
(7)358
3,884$ 4,242
¥ 13,874
71,8175,588
20,371(3,283)
66,104(18,979)
—
(7,954)
(39,720)(31,151)31,110(39,622)
(1,117)67,038
(90,432)38,163(75,177)59,222
7,709(8,384)
14,693(32,024)70,492
(141,724)94,397
3,187(59,878)
(153,214)545,600(343,529)
—(8,513)3,040
—(373)
43,011
(2,539)47,632
276,726¥ 324,358
Consolidated Statements of Cash FlowsSumitomo Corporation and SubsidiariesFor the years ended March 31, 2005, 2004 and 2003
Millions of Yen Millions ofU.S. Dollars
20052005 20032004
The accompanying notes to consolidated financial statements are an integral part of these statements.
91
1. Description of Business
Notes to Consolidated Financial StatementsSumitomo Corporation and SubsidiariesFor the years ended March 31, 2005, 2004 and 2003
Sumitomo Corporation (the “Company”) is an integrated trading com-pany (sogo shosha). Through their worldwide network, the Company andits subsidiaries (together, the “Companies”), engage in general trading,including the purchase, supply, distribution and marketing of a widerange of goods and commodities, including metals, machinery, electron-ics, energy and mineral resources, chemicals, textiles, food products andconsumer goods in Japan, North America, Asia and other areas in theworld. The Companies act as both principal and agent in these tradingtransactions. The Companies also provide a range of services for a vari-ety of industries, such as: financing for customers and suppliers; plan-ning, coordination and operation of urban and industrial infrastructureprojects; consulting in areas such as system integration and technologydevelopment; and transportation and logistics. In addition, theCompanies engage in other diverse business activities, including invest-ing in a variety of industries ranging from biotechnology to communica-tions; developing natural resources; manufacturing and processingproducts such as steel products and textiles; developing and managingreal estate; and operating retail stores.
The Companies conduct business through nine industry-based busi-ness segments and two sets of regional operations (domestic and over-seas) that correspond to the operating segments monitored by the chiefoperating decision makers (see Note 19). The Companies’ industry-based business segments are:
• Metal Products• Transportation & Construction Systems• Machinery & Electric• Media, Electronics & Network• Chemical• Mineral Resources & Energy• Consumer Goods & Service• Materials & Real Estate• Financial & Logistics
Each business segment operates with a degree of autonomy in pursuingstrategic goals, managing operations and ensuring accountability.
“Trading” as used in the following descriptions of the Companies’industry-based business segments represents sales transactions wherethe business segment acts as a principal or an agent. See revenuerecognition discussed in Note 2 (o).
Metal Products— The Metal Products Business Unit segment engages inglobal trading, processing, manufacturing and investment activitiesinvolving ferrous and non-ferrous metal products. In addition to continu-ally seeking to enhance operational efficiency, the segment also pursuesnew opportunities such as online sales of maintenance, repair and oper-ating supplies including factory tools. This segment is comprised of twoIron Steel Divisions, the Tubular Products Division, the Non-FerrousProducts & Metals Division and the Metal Products for AutomotiveIndustries Division.
Transportation & Construction Systems— The Transportation &
Construction Systems Business Unit segment engages in global transac-tions involving ships, aircraft, transportation systems, motor vehicles,construction equipment and related components and parts. Activities ofthis segment range from trading, leasing and financing to designing andarranging the construction of public transportation systems. This seg-ment consists of the Ship, Aerospace & Transportation Systems Division,the Motor Vehicles Business Division and the Construction & MiningSystems Division.
Machinery & Electric— The Machinery & Electric Business Unit segmentengages in a wide range of large-scale infrastructure development proj-ects relating to, among other things, power generation, telecommunica-tions facilities, water and sewage facilities and natural gas and oilpipelines. Activities of this segment include planning, developing andmanaging as well as investing in and financing, infrastructure projects inemerging markets and supplying manufacturing equipment and systemsfor various domestic industries. This segment is also engaged in tradingand investing in businesses such as telecommunications and informationtechnology, energy-saving and environment-friendly technology, andmedical and life science products. This segment consists of the E&M(Electric and Machinery) New Business Development Division, the Power& Energy Project Division and the Information, Telecommunication &Industrial Project Division.
Media, Electronics & Network— The Media, Electronics & NetworkBusiness Unit segment engages in a range of media and communicationsactivities, including cable TV operations; production and distribution ofprogramming and content; and development and sales of telecommuni-cations and electronics equipment and related components, systems anddevices. In addition to the Companies’ investments, the Companies pro-vide services such as marketing and strategic development, technologytransfer and manufacturing and engineering support. The Companies alsosupply various materials and components to electronics manufacturers,including silicon wafers, LED chips and assembled printed circuit boards.This segment consists of the Media Division, the Network Division and theElectronics Division.
Chemical— The Chemical Business Unit segment engages in the tradingof source materials, products and semi-finished goods as well as otherrelated businesses, involving a variety of chemicals including inorganicchemicals, specialty chemicals, pharmaceuticals, agricultural chemicals,pet supplies, synthetic resins and organic chemicals. Activities of thissegment range from distribution of chemicals to research and develop-ment of life science products and investment in and financing of newventures. This segment consists of the Performance Chemicals Divisionand the Plastics & Organic Chemicals Division.
Mineral Resources & Energy— The Mineral Resources & Energy BusinessUnit segment develops and trades various mineral and energy sourcesincluding coal, iron ore, non-ferrous metal, noble metal, petroleum, natu-ral gas and liquefied natural gas (LNG). This segment also trades ferrousand non-ferrous raw materials, petroleum products, liquefied petroleum
92 Sumitomo Corporation Annual Report 2005
2. Summary of Significant Accounting Policies
gas (LPG), solar and storage batteries, carbon products and nuclearfuels. In addition, this segment engages in retail sales of electricity inJapan. This segment consists of the Mineral Resources Division and twoEnergy Divisions.
Consumer Goods & Service— The Consumer Goods & Service BusinessUnit segment engages in trading, production, processing, distribution offood commodities, textiles, clothing and other consumer goods. In addi-tion, activities of this segment include the distribution of fertilizers and theoperation of retail businesses such as supermarkets, drugstores, direct-marketing and a high-end brand name clothing and accessories. Thissegment consists of the Retail & Consumer Services Division, theFoodstuff & Fertilizer Division and the Textile Division.
Materials & Real Estate— The Materials & Real Estate Business Unit seg-ment engages in trading, marketing and distribution of raw materials andother products such as cement, timber, wood-chips, paper pulp, used
paper and tires, and in manufacturing and sale of ready-mixed concreteand building materials. This segment is also engaged in a variety of realestate activities relating to office buildings and commercial and residentialreal property. This segment consists of the Materials & Supplies Divisionand the Construction & Real Estate Division.
Financial & Logistics— Financial & Logistics Business Unit segmentengages in such finance-related businesses as commodity futures trad-ing, derivative transactions, private equity investments, mergers andacquisition-related activities, consumer and small-business financing, andthe development and marketing of alternative investment instruments,and in logistics services ranging from delivery, customs clearance andtransportation services to the development and operation of industrialparks. Acting as a broker, this segment also arranges for insurance inconnection with trading conducted by other business segments. Thissegment consists of the Financial Service Division and the Logistics &Insurance Division.
Significant accounting policies applied in the preparation of the accom-panying consolidated financial statements are summarized below:
(a) Principles of Presentation and ConsolidationThe accompanying consolidated financial statements are stated inJapanese yen, the currency of the country in which the Company isincorporated and principally operates. The translation of Japanese yenamounts into United States dollars for the year ended March 31, 2005 isincluded solely for the convenience of readers and has been made at therate of ¥107 = U.S.$1, the approximate exchange rate prevailing at theFederal Reserve Bank of New York on March 31, 2005. Such translationshould not be construed as a representation that the Japanese yenamounts have been, or could in the future be converted into UnitedStates dollars at that or any other rate.
The accompanying consolidated financial statements have been pre-pared on the basis of accounting principles generally accepted in theUnited States of America (“U.S. GAAP”). The Company and most of itssubsidiaries’ accounting records are maintained principally in accordancewith accounting practices prevailing in the countries of domicile.Adjustments to those records have been made to present these consoli-dated financial statements in accordance with U.S. GAAP. The significantadjustments include those relating to the accounting for the valuation ofcertain investment securities, impairment losses on long-lived assets andloans receivable, pension costs, accrual of certain expenses and losses,derivative instruments and hedging activities, leases, business combina-tions, and deferred taxes.
The consolidated financial statements include the accounts of theCompany and its majority-owned subsidiaries. Associated companiesconsist of companies and corporate joint ventures owned 20% to 50%,or those owned less than 20% in the case where the Companies havethe ability to exercise significant influence over operating and financialpolicies. Investments in associated companies are accounted for by the
equity method. All significant intercompany accounts and transactionshave been eliminated. The accounts of certain subsidiaries that have afiscal year end within three months prior to March 31 have been includedin the consolidated financial statements based on their fiscal year.
During the fiscal year ended March 31, 2005, some associated com-panies changed their reporting periods to March 31. The effect ofchange was charged directly to the accompanying ConsolidatedStatements of Shareholders’ Equity and Comprehensive Income classi-fied as “Effect of the change in the reporting period of affiliates.”
The Companies also consolidate variable interest entities for whichthey are the primary beneficiary, in accordance with FASB InterpretationNo. 46R, “Consolidation of Variable Interest Entities (“FIN 46R”).”
(b) Cash EquivalentsThe Companies consider highly liquid investments, including short-termtime deposits, with an original maturity of three months or less, to becash equivalents.
(c) Foreign Currency TranslationThe Company’s functional and reporting currency is Japanese yen.Under the provision of Statements of Financial Accounting Standards(“SFAS”) No. 52, “Foreign Currency Transactions,” assets and liabilitiesdenominated in foreign currencies are translated into Japanese yen atthe respective year-end exchange rates. All income and expenseaccounts are translated at the average rates of exchange prevailing dur-ing each fiscal year in consolidating the financial statements of overseassubsidiaries whose functional currency is other than Japanese yen. Theresulting accumulated translation adjustments are included in a separatecomponent of accumulated other comprehensive income (loss) in theaccompanying consolidated balance sheets. All foreign currency transac-tion gains and losses are included in income in the period incurred.
93
(d) InventoriesInventories mainly consist of commodities, materials and real estate heldfor development and resale. The cost of inventories is determined basedon the moving average basis or specific-identification basis. Preciousmetals that have immediate marketability at quoted market prices are val-ued at market value with unrealized gains and losses included in earn-ings. Other commodities and materials are stated at the lower of averagecost or market. Real estate held for development and resale are stated atthe lower of cost or net realizable value.
(e) Marketable Securities and Other InvestmentsSFAS No. 115, “Accounting for Certain Investments in Debt and EquitySecurities” requires all investments in debt and marketable equity securi-ties to be classified as either trading, available-for-sale, or held-to-matu-rity securities. As of March 31, 2005 and 2004, all of the Companies’investments in debt securities and marketable equity securities are classi-fied as either ( i ) trading securities, which are accounted for at fair valuewith unrealized gains and losses included in earnings, ( ii ) available-for-sale securities, which are accounted for at fair value with unrealized gainsand losses excluded from earnings and reported in a separate compo-nent of accumulated other comprehensive income (loss), net of relatedtaxes in the accompanying consolidated balance sheets, or ( iii ) held-to-maturity securities, which are accounted for at amortized cost. Thosesecurities that mature or are expected to be sold in one year are classi-fied as current assets.
A decline in fair value of any available-for-sale or held-to-maturity secu-rity below the amortized cost basis that is deemed to be other than tem-porary results in a write-down of the amortized cost basis to fair value as anew cost basis and the amount of the write-down is included in earnings.
On a continuous basis, but no less frequently than at the end of eachsemi-annual period, the Companies evaluate the cost basis of available-for-sale securities for possible impairment. Factors considered inassessing whether an indication of other than temporary impairmentexists include: the degree of change in the ratio of market prices pershare to book value per share at date of evaluation compared to that atdate of acquisition, the financial condition and prospects of eachinvestee company, industry conditions in which the investee companyoperates, the fair value of an available-for-sale security relative to thecost basis of the investment, the period of time the fair value of an avail-able-for-sale security has been below the cost basis of the investmentand other relevant factors.
The Companies evaluate the cost basis of held-to-maturity securitiesfor possible impairment by taking into consideration the financial condi-tion, business prospects and credit worthiness of the issuer.
Impairment to be recognized is measured based on the amount bywhich the carrying amount of the investment exceeds the fair value of theinvestment. Fair value is determined based on quoted market prices.
The cost of securities sold is determined based on the average cost ofall the shares of such security held at the time of sale.
Non-marketable securities held as investments are carried at cost.Management semi-annually assesses the result of the underlying compa-nies, the performance of the underlying companies relative to plan,industry conditions, financial condition and prospects and determines
whether any events or changes in circumstances that might have a sig-nificant adverse effect on fair value are identified. When events orchanges in circumstances that might have a significant adverse effect onfair value are identified, management assesses whether the fair value ofthe investment has declined below its carrying amount. If a decline in fairvalue below cost is judged to be other than temporary, after consideringthe period of time that the estimated fair value has been below the carry-ing amount of the investment, the carrying value of the investment is writ-ten down to its estimated fair value. Fair value is determined based onanalysis of discounted estimated cash flows, valuation models based onrevenues, profitability and net worth, market value of comparable compa-nies, and other valuation approaches.
(f) Allowance for Doubtful ReceivablesAn allowance for doubtful receivables is maintained at the level which, inthe judgment of management, is adequate to provide for probable lossesthat can be reasonably estimated. Management considers individual cus-tomers’ risk factors such as historical performance, recent develop-ments, changes in original terms, internal risk-ratings, industry trends,and other specific factors applicable to the customer as well as generalrisk factors including, but not limited to, sovereign risk of the countrywhere the customer resides.
The Companies maintain a specific allowance for impaired loans. Aloan is considered impaired pursuant to SFAS No. 114, “Accounting byCreditors for Impairment of a Loan.” Pursuant to SFAS No. 114, a loan isimpaired if it is probable that the Companies will not collect all principaland interest due. An impairment allowance is recognized equal to the dif-ference between the loan’s book value and either the present value ofexpected future cash flows discounted at the loan’s effective interestrate, the loan’s market price if available, or the fair value of collateral if theloan is collateral dependent. In addition to the specific allowance, anallowance is established for probable losses that are not individually iden-tified but are expected to have occurred that are inherent in portfolios ofsimilar loans. This allowance for losses is based on relevant observabledata that include, but are not limited to, historical experience, delinquen-cies, loan stratification by portfolio, and when applicable, geography, col-lateral type, and size of the loan balance. Past due balances are reviewedindividually for collectibility. Account balances are charged off against theallowance after all means of collection have been exhausted and thepotential for recovery is considered remote.
(g) Property and EquipmentProperty and equipment is stated at cost less accumulated depreciation.Depreciation is computed principally under the declining-balance methodfor assets in Japan, and under the straight-line method for assets locatedoutside Japan, over their estimated useful lives.
SFAS No. 143, “Accounting for Asset Retirement Obligations”addresses the financial accounting and reporting for obligations associ-ated with the retirement of tangible long-lived assets and the associatedasset retirement costs. SFAS No. 143 applies to the legal obligationsassociated with the retirement of long-lived assets that result from theacquisition, construction, development, and/or the normal operation of along-lived asset. A legal obligation is an obligation that a party is required
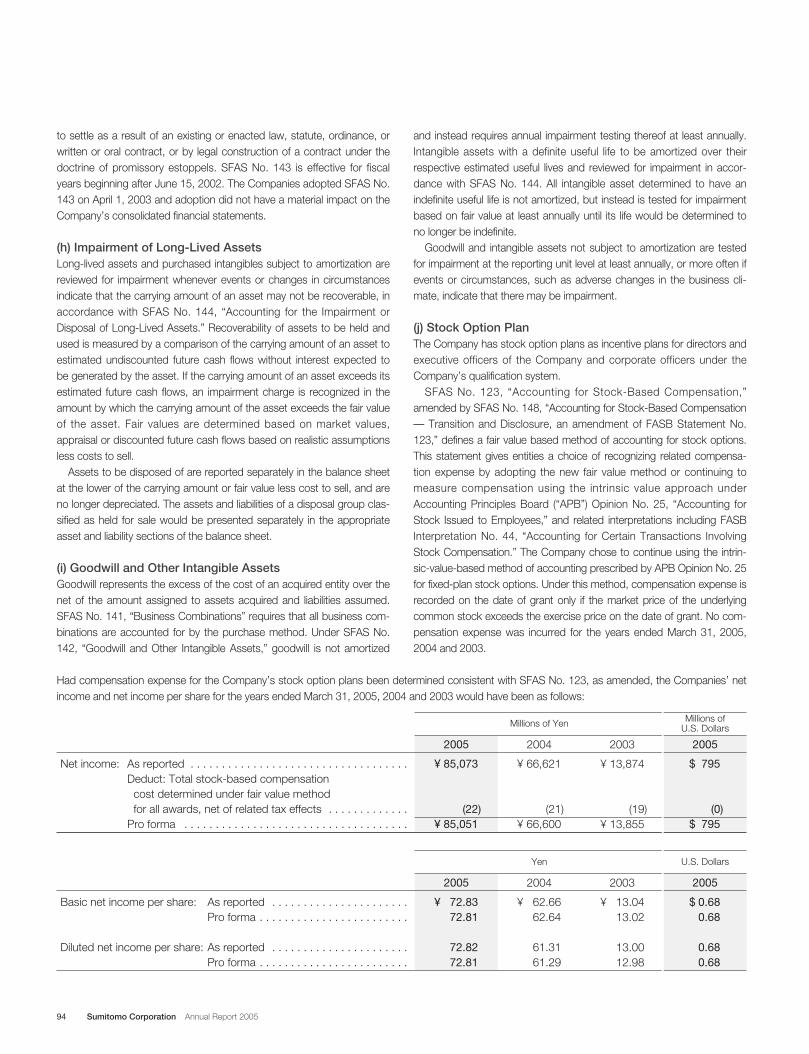
94 Sumitomo Corporation Annual Report 2005
to settle as a result of an existing or enacted law, statute, ordinance, orwritten or oral contract, or by legal construction of a contract under thedoctrine of promissory estoppels. SFAS No. 143 is effective for fiscalyears beginning after June 15, 2002. The Companies adopted SFAS No.143 on April 1, 2003 and adoption did not have a material impact on theCompany’s consolidated financial statements.
(h) Impairment of Long-Lived AssetsLong-lived assets and purchased intangibles subject to amortization arereviewed for impairment whenever events or changes in circumstancesindicate that the carrying amount of an asset may not be recoverable, inaccordance with SFAS No. 144, “Accounting for the Impairment orDisposal of Long-Lived Assets.” Recoverability of assets to be held andused is measured by a comparison of the carrying amount of an asset toestimated undiscounted future cash flows without interest expected tobe generated by the asset. If the carrying amount of an asset exceeds itsestimated future cash flows, an impairment charge is recognized in theamount by which the carrying amount of the asset exceeds the fair valueof the asset. Fair values are determined based on market values,appraisal or discounted future cash flows based on realistic assumptionsless costs to sell.
Assets to be disposed of are reported separately in the balance sheetat the lower of the carrying amount or fair value less cost to sell, and areno longer depreciated. The assets and liabilities of a disposal group clas-sified as held for sale would be presented separately in the appropriateasset and liability sections of the balance sheet.
(i) Goodwill and Other Intangible AssetsGoodwill represents the excess of the cost of an acquired entity over thenet of the amount assigned to assets acquired and liabilities assumed.SFAS No. 141, “Business Combinations” requires that all business com-binations are accounted for by the purchase method. Under SFAS No.142, “Goodwill and Other Intangible Assets,” goodwill is not amortized
and instead requires annual impairment testing thereof at least annually.Intangible assets with a definite useful life to be amortized over theirrespective estimated useful lives and reviewed for impairment in accor-dance with SFAS No. 144. All intangible asset determined to have anindefinite useful life is not amortized, but instead is tested for impairmentbased on fair value at least annually until its life would be determined tono longer be indefinite.
Goodwill and intangible assets not subject to amortization are testedfor impairment at the reporting unit level at least annually, or more often ifevents or circumstances, such as adverse changes in the business cli-mate, indicate that there may be impairment.
(j) Stock Option PlanThe Company has stock option plans as incentive plans for directors andexecutive officers of the Company and corporate officers under theCompany’s qualification system.
SFAS No. 123, “Accounting for Stock-Based Compensation,”amended by SFAS No. 148, “Accounting for Stock-Based Compensation— Transition and Disclosure, an amendment of FASB Statement No.123,” defines a fair value based method of accounting for stock options.This statement gives entities a choice of recognizing related compensa-tion expense by adopting the new fair value method or continuing tomeasure compensation using the intrinsic value approach underAccounting Principles Board (“APB”) Opinion No. 25, “Accounting forStock Issued to Employees,” and related interpretations including FASBInterpretation No. 44, “Accounting for Certain Transactions InvolvingStock Compensation.” The Company chose to continue using the intrin-sic-value-based method of accounting prescribed by APB Opinion No. 25for fixed-plan stock options. Under this method, compensation expense isrecorded on the date of grant only if the market price of the underlyingcommon stock exceeds the exercise price on the date of grant. No com-pensation expense was incurred for the years ended March 31, 2005,2004 and 2003.
Had compensation expense for the Company’s stock option plans been determined consistent with SFAS No. 123, as amended, the Companies’ netincome and net income per share for the years ended March 31, 2005, 2004 and 2003 would have been as follows:
Net income: As reported . . . . . . . . . . . . . . . . . . . . . . . . . . . . . . . . . . .Deduct: Total stock-based compensation cost determined under fair value method for all awards, net of related tax effects . . . . . . . . . . . . .
Pro forma . . . . . . . . . . . . . . . . . . . . . . . . . . . . . . . . . . . .
¥ 85,073
(22)¥ 85,051
¥ 66,621
(21)¥ 66,600
$ 795
(0)$ 795
20052005 2004
¥ 13,874
(19)¥ 13,855
2003
Millions of Yen Millions ofU.S. Dollars
Basic net income per share: As reported . . . . . . . . . . . . . . . . . . . . . .Pro forma . . . . . . . . . . . . . . . . . . . . . . . .
Diluted net income per share: As reported . . . . . . . . . . . . . . . . . . . . . .Pro forma . . . . . . . . . . . . . . . . . . . . . . . .
¥ 72.8372.81
72.8272.81
¥ 62.6662.64
61.3161.29
$ 0.680.68
0.680.68
20052005 2004
¥ 13.0413.02
13.0012.98
2003
Yen U.S. Dollars
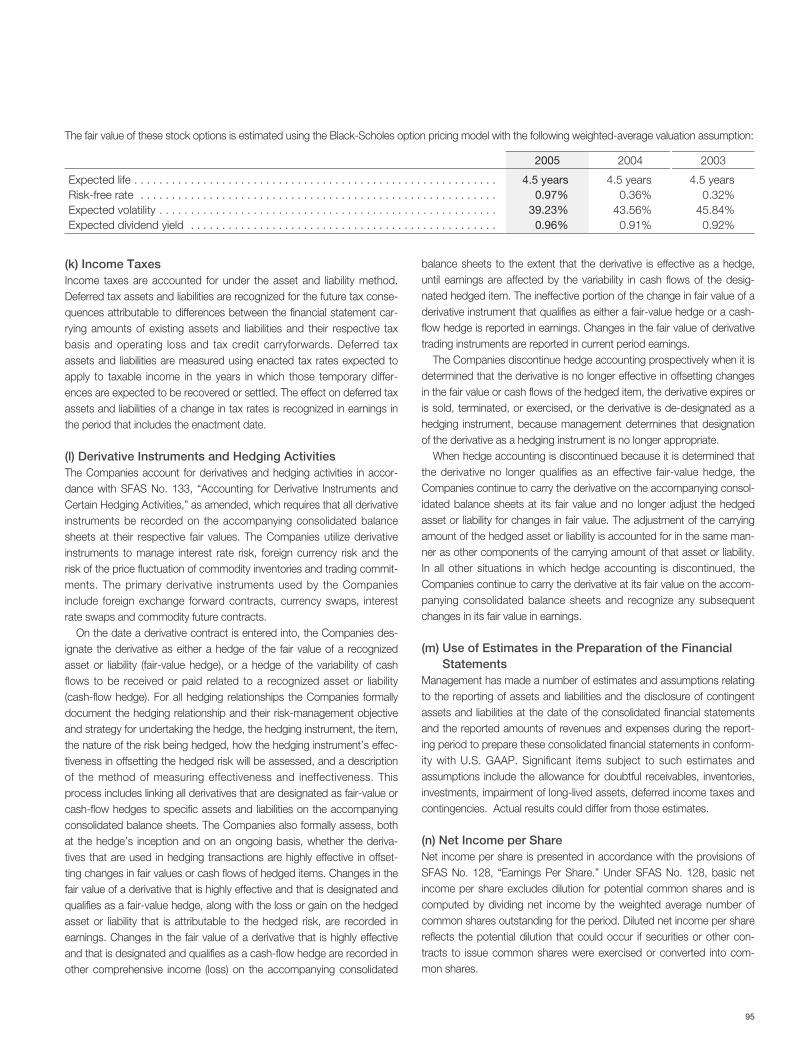
95
The fair value of these stock options is estimated using the Black-Scholes option pricing model with the following weighted-average valuation assumption:
Expected life . . . . . . . . . . . . . . . . . . . . . . . . . . . . . . . . . . . . . . . . . . . . . . . . . . . . . . . . . .Risk-free rate . . . . . . . . . . . . . . . . . . . . . . . . . . . . . . . . . . . . . . . . . . . . . . . . . . . . . . . . .Expected volatility . . . . . . . . . . . . . . . . . . . . . . . . . . . . . . . . . . . . . . . . . . . . . . . . . . . . . .Expected dividend yield . . . . . . . . . . . . . . . . . . . . . . . . . . . . . . . . . . . . . . . . . . . . . . . . .
4.5 years0.97%
39.23%0.96%
4.5 years0.36%
43.56%0.91%
4.5 years0.32%
45.84%0.92%
20032005 2004
(k) Income TaxesIncome taxes are accounted for under the asset and liability method.Deferred tax assets and liabilities are recognized for the future tax conse-quences attributable to differences between the financial statement car-rying amounts of existing assets and liabilities and their respective taxbasis and operating loss and tax credit carryforwards. Deferred taxassets and liabilities are measured using enacted tax rates expected toapply to taxable income in the years in which those temporary differ-ences are expected to be recovered or settled. The effect on deferred taxassets and liabilities of a change in tax rates is recognized in earnings inthe period that includes the enactment date.
(l) Derivative Instruments and Hedging ActivitiesThe Companies account for derivatives and hedging activities in accor-dance with SFAS No. 133, “Accounting for Derivative Instruments andCertain Hedging Activities,” as amended, which requires that all derivativeinstruments be recorded on the accompanying consolidated balancesheets at their respective fair values. The Companies utilize derivativeinstruments to manage interest rate risk, foreign currency risk and therisk of the price fluctuation of commodity inventories and trading commit-ments. The primary derivative instruments used by the Companiesinclude foreign exchange forward contracts, currency swaps, interestrate swaps and commodity future contracts.
On the date a derivative contract is entered into, the Companies des-ignate the derivative as either a hedge of the fair value of a recognizedasset or liability (fair-value hedge), or a hedge of the variability of cashflows to be received or paid related to a recognized asset or liability(cash-flow hedge). For all hedging relationships the Companies formallydocument the hedging relationship and their risk-management objectiveand strategy for undertaking the hedge, the hedging instrument, the item,the nature of the risk being hedged, how the hedging instrument’s effec-tiveness in offsetting the hedged risk will be assessed, and a descriptionof the method of measuring effectiveness and ineffectiveness. Thisprocess includes linking all derivatives that are designated as fair-value orcash-flow hedges to specific assets and liabilities on the accompanyingconsolidated balance sheets. The Companies also formally assess, bothat the hedge’s inception and on an ongoing basis, whether the deriva-tives that are used in hedging transactions are highly effective in offset-ting changes in fair values or cash flows of hedged items. Changes in thefair value of a derivative that is highly effective and that is designated andqualifies as a fair-value hedge, along with the loss or gain on the hedgedasset or liability that is attributable to the hedged risk, are recorded inearnings. Changes in the fair value of a derivative that is highly effectiveand that is designated and qualifies as a cash-flow hedge are recorded inother comprehensive income (loss) on the accompanying consolidated
balance sheets to the extent that the derivative is effective as a hedge,until earnings are affected by the variability in cash flows of the desig-nated hedged item. The ineffective portion of the change in fair value of aderivative instrument that qualifies as either a fair-value hedge or a cash-flow hedge is reported in earnings. Changes in the fair value of derivativetrading instruments are reported in current period earnings.
The Companies discontinue hedge accounting prospectively when it isdetermined that the derivative is no longer effective in offsetting changesin the fair value or cash flows of the hedged item, the derivative expires oris sold, terminated, or exercised, or the derivative is de-designated as ahedging instrument, because management determines that designationof the derivative as a hedging instrument is no longer appropriate.
When hedge accounting is discontinued because it is determined thatthe derivative no longer qualifies as an effective fair-value hedge, theCompanies continue to carry the derivative on the accompanying consol-idated balance sheets at its fair value and no longer adjust the hedgedasset or liability for changes in fair value. The adjustment of the carryingamount of the hedged asset or liability is accounted for in the same man-ner as other components of the carrying amount of that asset or liability.In all other situations in which hedge accounting is discontinued, theCompanies continue to carry the derivative at its fair value on the accom-panying consolidated balance sheets and recognize any subsequentchanges in its fair value in earnings.
(m) Use of Estimates in the Preparation of the FinancialStatements
Management has made a number of estimates and assumptions relatingto the reporting of assets and liabilities and the disclosure of contingentassets and liabilities at the date of the consolidated financial statementsand the reported amounts of revenues and expenses during the report-ing period to prepare these consolidated financial statements in conform-ity with U.S. GAAP. Significant items subject to such estimates andassumptions include the allowance for doubtful receivables, inventories,investments, impairment of long-lived assets, deferred income taxes andcontingencies. Actual results could differ from those estimates.
(n) Net Income per ShareNet income per share is presented in accordance with the provisions ofSFAS No. 128, “Earnings Per Share.” Under SFAS No. 128, basic netincome per share excludes dilution for potential common shares and iscomputed by dividing net income by the weighted average number ofcommon shares outstanding for the period. Diluted net income per sharereflects the potential dilution that could occur if securities or other con-tracts to issue common shares were exercised or converted into com-mon shares.
96 Sumitomo Corporation Annual Report 2005
(o) Revenue RecognitionThe Companies recognize revenue when it is realized or realizable andearned. The Companies consider revenue realized or realizable andearned when it has persuasive evidence of an arrangement, the goodshave been delivered or the services have been rendered to the cus-tomer, the sales price is fixed or determinable, and collectibility is rea-sonably assured.
Gross versus Net. In the normal course of business, the Companies fre-quently act as an intermediary or agent in executing transactions withthird parties. In these arrangements, the Companies determine whetherto report revenue based on the “gross” amount billed to the ultimate cus-tomer for goods or services provided or on the “net” amount receivedfrom the customer after commissions and other payments to third par-ties. However, the amounts of gross profit and net income are notaffected by whether revenue is reported on a gross or net basis.
Determining whether revenue should be reported gross or net is basedon an assessment of whether the Companies are acting as a “principal”or an “agent” in a transaction. Accordingly, to the extent that theCompanies are acting as a principal in a transaction, the Companiesreport revenue on a gross basis and to the extent that the Companiesare acting as an agent in a transaction, the Companies report revenue ona net basis. The determination of whether the Companies are acting as aprincipal or an agent in a transaction involves judgment and is based onan evaluation of the terms of an arrangement.
Factors that indicate that the Companies act as a principal, and thusrecognize revenue on a gross basis include: ( i ) the Companies are theprimary obligor in the arrangement, ( ii ) the Companies have generalinventory risk (before customer order is placed or upon customer return),( iii ) the Companies have physical loss inventory risk (after customer orderor during shipping), ( iv ) the Companies have latitude in establishing price,(v) the Companies change the product or perform part of the services,( vi ) the Companies have discretion in supplier selection, ( vii ) theCompanies are involved in the determination of product or service speci-fications, and (viii ) the Companies have credit risk.
Factors that indicate that the Companies act as an agent, and thusrecognize revenue on a net basis relative to the service offered include:( i ) the supplier (not the Companies) is the primary obligor in the arrange-ment, ( ii ) the amount the Companies earn is fixed, and ( iii ) the supplier(not the Companies) has credit risk.
Total Trading Transactions. Total trading transactions is a voluntary dis-closure and represents the gross transaction volume of trading transac-tions, or the nominal aggregate value of the transactions for which theCompanies act as principal or as agent. Total trading transactions is notmeant to represent sales or revenues in accordance with U.S. GAAP.Total trading transactions should not be construed as equivalent to, or asubstitute or proxy for, revenues, or as an indicator of our operating per-formance, liquidity or cash flows generated by operating, investing orfinancing activities. A substantial part of total trading transactions repre-sents transactions in which the Companies participate without physicalacquisition of goods or without significant inventory risk. The Companieshave included the information concerning total trading transactionsbecause it is used by similar Japanese trading companies as an industry
benchmark, and the Companies believe it is a useful supplement toresults of operations data as a measure of the Companies’ performancecompared to other similar Japanese trading companies.
Revenue from sales of tangible productsThe Companies generate revenue from sales of tangible products ( i ) inconnection with the Companies’ wholesale, retail, manufacturing andprocessing operations, ( ii ) in connection with the Companies’ real estateoperations, and ( iii ) under long-term construction type arrangements.The Companies also enter into transactions that include multiple elementarrangements, which may include any combination of products, equip-ment, and installation services. In accordance with the FASB’s EITF No.00-21, “Guide to Accounting for Revenue Arrangements with MultipleDeliverables,” if certain elements are delivered prior to others in thearrangement, revenue is deferred until the delivery of the last element,unless transactions are such that the price of a deliverable, when it isregularly sold on a standalone basis of the undelivered elements, is avail-able and the functionality of the delivered element is not dependent onthe undelivered elements. The Companies allocate revenue involvingmultiple elements to each element based on its relative fair value.
The Companies recognize revenue from sales of tangible products inconnection with the Companies’ wholesale, retail, manufacturing and pro-cessing operations when title and risk of loss have been transferred to thecustomer. Depending upon the terms of the contract, this may occur atthe time of delivery or shipment or upon the attainment of customeracceptance. The conditions of acceptance are governed by the terms ofthe contract or customer arrangement and those not meeting the prede-termined specifications are not recognized as revenue until the attainmentof customer acceptance. The Companies’ policy is not to accept productreturns unless the products are defective. The Companies have no mate-rial exposure to losses under warranty provisions on transactions withwhich the Companies are involved. Such losses are recognized whenprobable and estimable. The effects of rebate and discount programs arerecognized as a reduction of revenue. The effects of such programs arenot material. The Companies recognize revenue upon delivery, shipment,or upon the attainment of customer acceptance for steel service centeroperations in which the Companies process and cut steel sheets to cus-tomer specifications [Metal Products], dealership operations in which theCompanies sell automobiles to general consumers and distribute con-struction equipment and machinery to construction companies[Transportation & Construction Systems], plastic products [Chemical],service station operations in which the Companies provide petroleum forautomobiles [Mineral Resources & Energy], and retail business operationssuch as supermarkets and drugstores [Consumer Goods & Service].
Revenues from sale of land, office-buildings, and condominiums arerecognized using the full accrual method provided that various criteriarelating to the terms of the transactions are met. These criteria deal withwhether ( i ) a sale is consummated, ( ii ) the buyer’s initial and continuinginvestments are adequate, ( iii ) the seller’s receivable is not subject tofuture subordination, and ( iv ) the seller has transferred to the buyer theusual risks and rewards of ownership and does not have a substantialcontinuing involvement with the property. Revenues relating to transac-tions that do not meet the established criteria are defined and recognizedwhen the criteria are met or using the installment or cost recovery meth-
97
ods as appropriate in the circumstances. The Companies generate revenue from sales of tangible products
under long-term construction type arrangements, principally in connectionwith the construction of power plants in which the Companies provideengineering, procurement and construction [Machinery & Electric] underthe percentage-of-completion method as prescribed by AICPA Statementof Position (“SOP”) No. 81-1, “Accounting for Performance ofConstruction-Type and Certain Production-Type Contracts.” Progresstoward completion is measured using the cost-to-cost method. Under thecost-to-cost method, revenues are recognized based on the ratio thatcosts incurred bear to total estimated costs. The Companies review costperformance and estimate to complete projections on its contracts atleast quarterly, and in many cases, more frequently. The impact of revi-sions of profit estimates on fixed price contracts are recognized in theperiod in which the revisions are made. Anticipated losses on fixed pricecontracts are charged to earnings when such losses can be estimated.Provisions are made for contingencies in the period in which they becomeknown pursuant to specific contract terms and conditions are estimable.
Revenue from sales of services and othersThe Companies also generate revenue from sales of services and othersin connection with ( i ) customized software development services con-tracts and other software related services, ( ii ) direct financing and oper-ating leases of automobiles, vessels, and aircrafts, and ( iii ) all otherservice arrangements such as arranging finance and coordinating logis-tics in connection with trading activities.
The Companies recognize revenue from customized software develop-ment services contracts and other software related services in accordancewith the provisions of SOP No. 97-2, “Software Revenue Recognition,” asamended by SOP No. 98-9, “Modification of SOP No. 97-2, SoftwareRevenue Recognition, With Respect to Certain Transactions.” Revenuefrom the customized software services contracts that require theCompanies to develop, manufacture or modify information technology (IT)systems to a customer’s specification, and to provide services related tothe performance of such contracts, is recognized upon customer accept-ance if pricing is fixed and determinable and collectibility is probable. Theterms of such service contracts range less than one year. Revenue frommaintenance is recognized over the contractual period or as the servicesare performed [Media, Electronics & Network].
The Companies recognize revenue from direct financing leases usingmethods that approximate the interest method. Related origination andother non-refundable fees and direct origination costs are deferred andamortized as an adjustment of interest and direct financing lease incomeover the contractual lines of the arrangements. Rental income on operat-ing leases is recognized on an accrual basis.
The accrual of interest income on direct financing leases is generallysuspended and an account placed on non-accrual status when paymentof principal on interest is contractually delinquent for ninety days or more,or earlier when in the opinion of management, full collection of principaland interest is doubtful. To the extent that the estimated value of collat-eral does not satisfy both the principal and accrued income receivables,previously accrued interest is reversed. Proceeds received on non-accrued loans are applied to the outstanding principal balance until such
time as the outstanding receivable is collected, charged off, on returnedto accrual status.
Direct financing leases are recorded at the aggregate future minimumlease payments plus estimated residual values less unearned financeincome. Operating lease equipment is carried at cost less accumulateddepreciation and is depreciated to estimated residual value using thestraight-line method over the projected economic life of the asset.Equipment acquired in satisfaction of loans and subsequently placed onoperating lease is recorded at the lower of carrying value or estimated fairvalue when acquired. Management performs periodic reviews of the esti-mated residual values and recognizes impairment losses in the periodthey are determined to occur. The Companies recognize revenue fromoperating leases in connection with automobiles leased to consumers,vessels leased to shipping companies, aircrafts leased to airlines[Transportation & Construction Systems], and rental of commercial realestate [Materials & Real Estate].
Revenue from all other service arrangements include transactions inwhich the Companies act between customer and supplier as agent orbroker to provide such services as arranging finance or coordinating logis-tics in connection with trading activities. Such revenues are recognizedwhen the contracted services are rendered to third-party customers.
(p) Issuance of Stock by Subsidiaries and AssociatedCompanies
The Company recognizes a gain or loss when a subsidiary or an associ-ated company issues its shares to third parties at amounts in excess orless than the Company’s average carrying value. Such a gain or loss isrecognized only when the realization of a gain or loss is reasonablyassured and the value of the proceeds can be objectively determined.
(q) Capitalized Software CostsThe Companies capitalize certain costs incurred to purchase or developsoftware for internal-use. Costs incurred to develop software for internal-use are expensed as incurred during the preliminary project stage, whichincludes costs for making strategic decisions about the project, deter-mining performance and system requirements and vendor demonstrationcost. Costs incurred subsequent to the preliminary project stage throughimplementation are capitalized. The Companies also expense costsincurred for internal-use software projects in the post implement stagesuch as costs for training and maintenance.
Costs incurred to develop software to be sold are capitalized subse-quent to the attainment of technological feasibility in the form of detailedprogram design. Those costs include coding and testing performed sub-sequent to establishing technological feasibility. Costs incurred prior toreaching technological feasibility are expensed as incurred. Capitalizedsoftware costs are amortized on a product-by-product basis. The annualamortization is the greater of the amount computed using ( i ) the ratiothat current gross revenues for a product bear to the total of current andanticipated future gross revenues for that product or ( ii ) the straight-linemethod over the remaining estimated economic life of the productincluding the period being reported on. Amortization starts when theproduct is available for general release to customers.
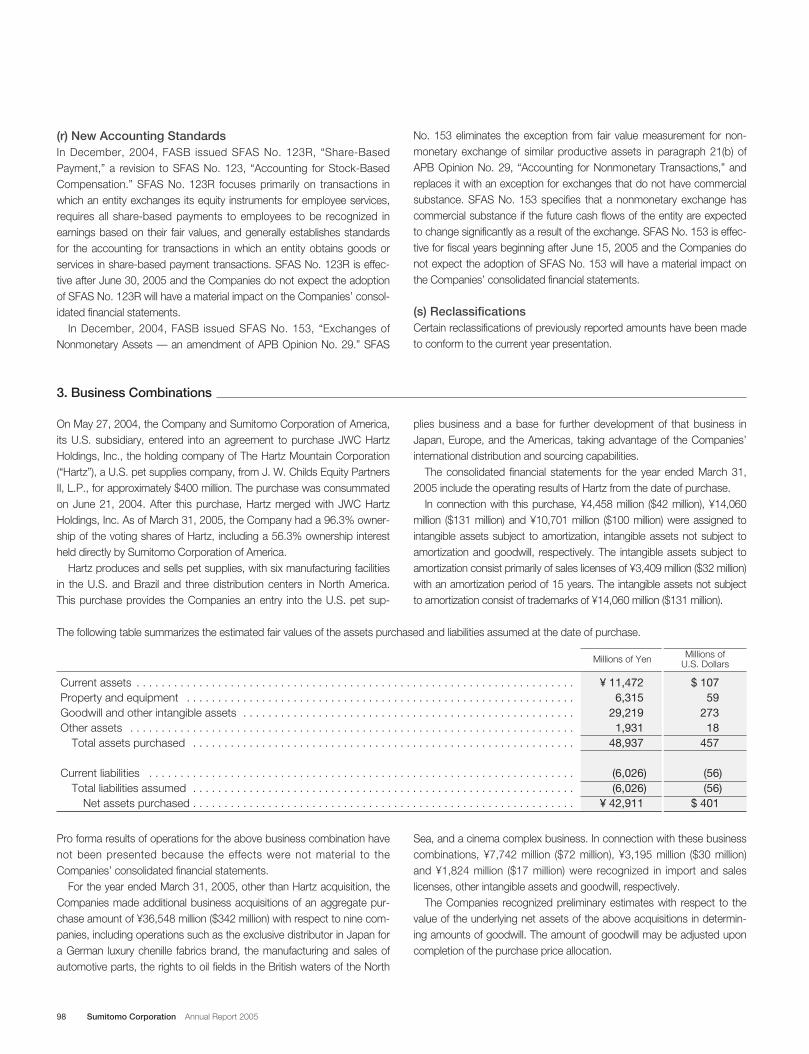
98 Sumitomo Corporation Annual Report 2005
(r) New Accounting StandardsIn December, 2004, FASB issued SFAS No. 123R, “Share-BasedPayment,” a revision to SFAS No. 123, “Accounting for Stock-BasedCompensation.” SFAS No. 123R focuses primarily on transactions inwhich an entity exchanges its equity instruments for employee services,requires all share-based payments to employees to be recognized inearnings based on their fair values, and generally establishes standardsfor the accounting for transactions in which an entity obtains goods orservices in share-based payment transactions. SFAS No. 123R is effec-tive after June 30, 2005 and the Companies do not expect the adoptionof SFAS No. 123R will have a material impact on the Companies’ consol-idated financial statements.
In December, 2004, FASB issued SFAS No. 153, “Exchanges ofNonmonetary Assets — an amendment of APB Opinion No. 29.” SFAS
No. 153 eliminates the exception from fair value measurement for non-monetary exchange of similar productive assets in paragraph 21(b) ofAPB Opinion No. 29, “Accounting for Nonmonetary Transactions,” andreplaces it with an exception for exchanges that do not have commercialsubstance. SFAS No. 153 specifies that a nonmonetary exchange hascommercial substance if the future cash flows of the entity are expectedto change significantly as a result of the exchange. SFAS No. 153 is effec-tive for fiscal years beginning after June 15, 2005 and the Companies donot expect the adoption of SFAS No. 153 will have a material impact onthe Companies’ consolidated financial statements.
(s) ReclassificationsCertain reclassifications of previously reported amounts have been madeto conform to the current year presentation.
On May 27, 2004, the Company and Sumitomo Corporation of America,its U.S. subsidiary, entered into an agreement to purchase JWC HartzHoldings, Inc., the holding company of The Hartz Mountain Corporation(“Hartz”), a U.S. pet supplies company, from J. W. Childs Equity PartnersII, L.P., for approximately $400 million. The purchase was consummatedon June 21, 2004. After this purchase, Hartz merged with JWC HartzHoldings, Inc. As of March 31, 2005, the Company had a 96.3% owner-ship of the voting shares of Hartz, including a 56.3% ownership interestheld directly by Sumitomo Corporation of America.
Hartz produces and sells pet supplies, with six manufacturing facilitiesin the U.S. and Brazil and three distribution centers in North America.This purchase provides the Companies an entry into the U.S. pet sup-
plies business and a base for further development of that business inJapan, Europe, and the Americas, taking advantage of the Companies’international distribution and sourcing capabilities.
The consolidated financial statements for the year ended March 31,2005 include the operating results of Hartz from the date of purchase.
In connection with this purchase, ¥4,458 million ($42 million), ¥14,060million ($131 million) and ¥10,701 million ($100 million) were assigned tointangible assets subject to amortization, intangible assets not subject toamortization and goodwill, respectively. The intangible assets subject toamortization consist primarily of sales licenses of ¥3,409 million ($32 million)with an amortization period of 15 years. The intangible assets not subjectto amortization consist of trademarks of ¥14,060 million ($131 million).
3. Business Combinations
The following table summarizes the estimated fair values of the assets purchased and liabilities assumed at the date of purchase.
Current assets . . . . . . . . . . . . . . . . . . . . . . . . . . . . . . . . . . . . . . . . . . . . . . . . . . . . . . . . . . . . . . . . . . . . . .Property and equipment . . . . . . . . . . . . . . . . . . . . . . . . . . . . . . . . . . . . . . . . . . . . . . . . . . . . . . . . . . . . . .Goodwill and other intangible assets . . . . . . . . . . . . . . . . . . . . . . . . . . . . . . . . . . . . . . . . . . . . . . . . . . . . .Other assets . . . . . . . . . . . . . . . . . . . . . . . . . . . . . . . . . . . . . . . . . . . . . . . . . . . . . . . . . . . . . . . . . . . . . . .
Total assets purchased . . . . . . . . . . . . . . . . . . . . . . . . . . . . . . . . . . . . . . . . . . . . . . . . . . . . . . . . . . . . .
Current liabilities . . . . . . . . . . . . . . . . . . . . . . . . . . . . . . . . . . . . . . . . . . . . . . . . . . . . . . . . . . . . . . . . . . . .Total liabilities assumed . . . . . . . . . . . . . . . . . . . . . . . . . . . . . . . . . . . . . . . . . . . . . . . . . . . . . . . . . . . . .
Net assets purchased . . . . . . . . . . . . . . . . . . . . . . . . . . . . . . . . . . . . . . . . . . . . . . . . . . . . . . . . . . . . .
¥ 11,4726,315
29,2191,931
48,937
(6,026)(6,026)
¥ 42,911
$ 10759
27318
457
(56)(56)
$ 401
Millions of Yen Millions ofU.S. Dollars
Pro forma results of operations for the above business combination havenot been presented because the effects were not material to theCompanies’ consolidated financial statements.
For the year ended March 31, 2005, other than Hartz acquisition, theCompanies made additional business acquisitions of an aggregate pur-chase amount of ¥36,548 million ($342 million) with respect to nine com-panies, including operations such as the exclusive distributor in Japan fora German luxury chenille fabrics brand, the manufacturing and sales ofautomotive parts, the rights to oil fields in the British waters of the North
Sea, and a cinema complex business. In connection with these businesscombinations, ¥7,742 million ($72 million), ¥3,195 million ($30 million)and ¥1,824 million ($17 million) were recognized in import and saleslicenses, other intangible assets and goodwill, respectively.
The Companies recognized preliminary estimates with respect to thevalue of the underlying net assets of the above acquisitions in determin-ing amounts of goodwill. The amount of goodwill may be adjusted uponcompletion of the purchase price allocation.
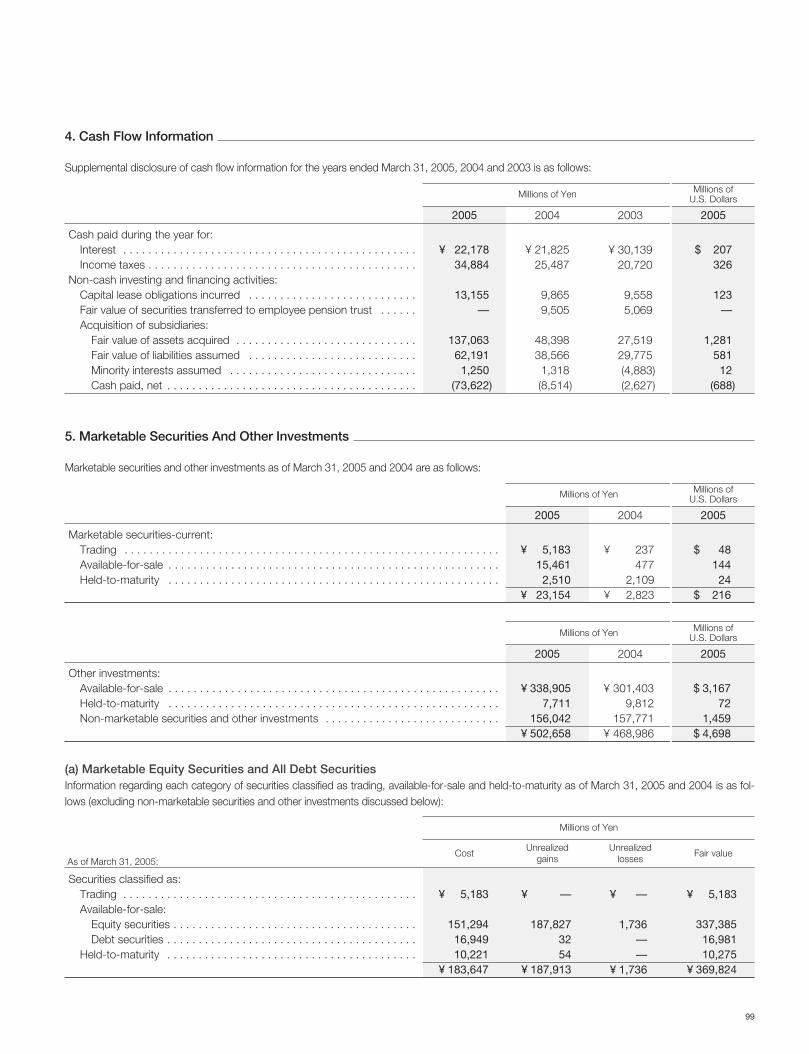
99
Supplemental disclosure of cash flow information for the years ended March 31, 2005, 2004 and 2003 is as follows:
Cash paid during the year for:Interest . . . . . . . . . . . . . . . . . . . . . . . . . . . . . . . . . . . . . . . . . . . . . . .Income taxes . . . . . . . . . . . . . . . . . . . . . . . . . . . . . . . . . . . . . . . . . . .
Non-cash investing and financing activities:Capital lease obligations incurred . . . . . . . . . . . . . . . . . . . . . . . . . . .Fair value of securities transferred to employee pension trust . . . . . .Acquisition of subsidiaries:
Fair value of assets acquired . . . . . . . . . . . . . . . . . . . . . . . . . . . . .Fair value of liabilities assumed . . . . . . . . . . . . . . . . . . . . . . . . . . .Minority interests assumed . . . . . . . . . . . . . . . . . . . . . . . . . . . . . .Cash paid, net . . . . . . . . . . . . . . . . . . . . . . . . . . . . . . . . . . . . . . . .
¥ 22,17834,884
13,155—
137,06362,191
1,250(73,622)
¥ 21,82525,487
9,8659,505
48,39838,566
1,318(8,514)
$ 207326
123—
1,281581
12(688)
20052005 2004
¥ 30,13920,720
9,5585,069
27,51929,775(4,883)(2,627)
2003
Millions of Yen Millions ofU.S. Dollars
4. Cash Flow Information
Other investments:Available-for-sale . . . . . . . . . . . . . . . . . . . . . . . . . . . . . . . . . . . . . . . . . . . . . . . . . . . . .Held-to-maturity . . . . . . . . . . . . . . . . . . . . . . . . . . . . . . . . . . . . . . . . . . . . . . . . . . . . .Non-marketable securities and other investments . . . . . . . . . . . . . . . . . . . . . . . . . . . .
¥ 338,9057,711
156,042¥ 502,658
¥ 301,4039,812
157,771¥ 468,986
$ 3,16772
1,459$ 4,698
20052005 2004
Millions of Yen Millions ofU.S. Dollars
Marketable securities and other investments as of March 31, 2005 and 2004 are as follows:
5. Marketable Securities And Other Investments
Marketable securities-current:Trading . . . . . . . . . . . . . . . . . . . . . . . . . . . . . . . . . . . . . . . . . . . . . . . . . . . . . . . . . . . .Available-for-sale . . . . . . . . . . . . . . . . . . . . . . . . . . . . . . . . . . . . . . . . . . . . . . . . . . . . .Held-to-maturity . . . . . . . . . . . . . . . . . . . . . . . . . . . . . . . . . . . . . . . . . . . . . . . . . . . . .
¥ 5,18315,461
2,510¥ 23,154
¥ 237477
2,109¥ 2,823
$ 48144
24$ 216
20052005 2004
Millions of Yen Millions ofU.S. Dollars
(a) Marketable Equity Securities and All Debt SecuritiesInformation regarding each category of securities classified as trading, available-for-sale and held-to-maturity as of March 31, 2005 and 2004 is as fol-lows (excluding non-marketable securities and other investments discussed below):
Securities classified as:Trading . . . . . . . . . . . . . . . . . . . . . . . . . . . . . . . . . . . . . . . . . . . . . . .Available-for-sale:
Equity securities . . . . . . . . . . . . . . . . . . . . . . . . . . . . . . . . . . . . . . .Debt securities . . . . . . . . . . . . . . . . . . . . . . . . . . . . . . . . . . . . . . . .
Held-to-maturity . . . . . . . . . . . . . . . . . . . . . . . . . . . . . . . . . . . . . . . .
¥ 5,183
151,29416,94910,221
¥ 183,647
¥ —
187,8273254
¥ 187,913
¥ 5,183
337,38516,98110,275
¥ 369,824
Fair valueCostUnrealized
gains
¥ —
1,736——
¥ 1,736
Unrealized losses
Millions of Yen
As of March 31, 2005:
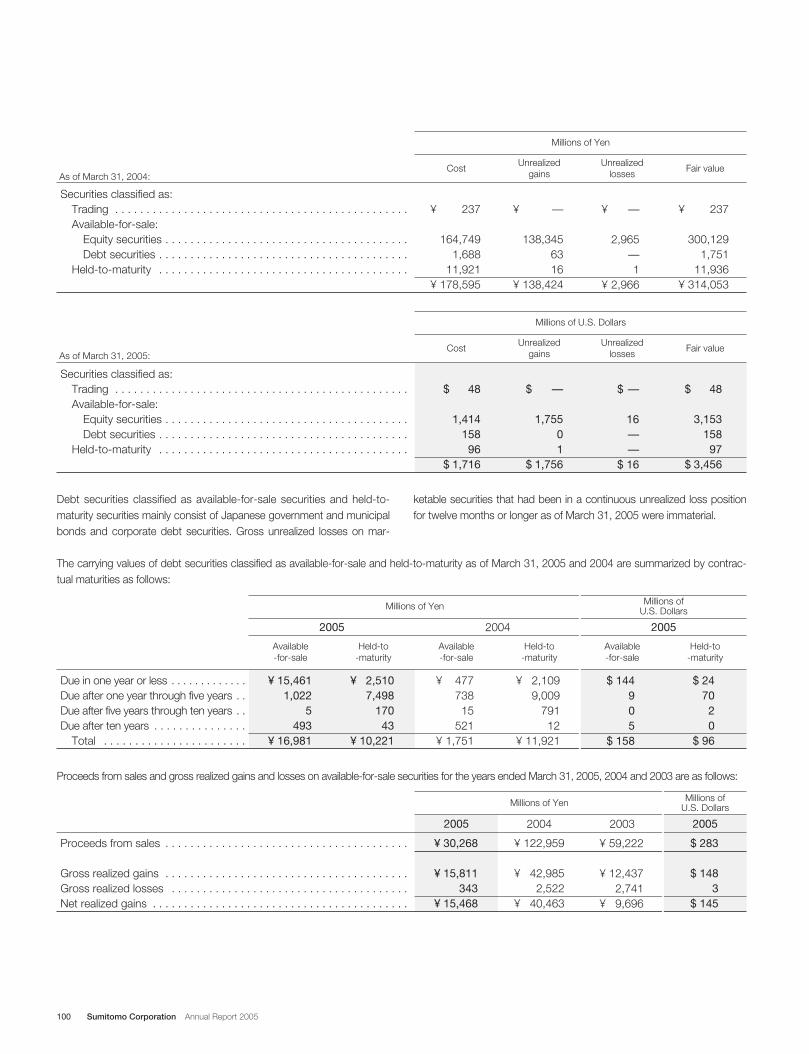
100 Sumitomo Corporation Annual Report 2005
Securities classified as:Trading . . . . . . . . . . . . . . . . . . . . . . . . . . . . . . . . . . . . . . . . . . . . . . .Available-for-sale:
Equity securities . . . . . . . . . . . . . . . . . . . . . . . . . . . . . . . . . . . . . . .Debt securities . . . . . . . . . . . . . . . . . . . . . . . . . . . . . . . . . . . . . . . .
Held-to-maturity . . . . . . . . . . . . . . . . . . . . . . . . . . . . . . . . . . . . . . . .
¥ 237
164,7491,688
11,921¥ 178,595
¥ —
138,3456316
¥ 138,424
¥ 237
300,1291,751
11,936¥ 314,053
Fair valueCostUnrealized
gains
¥ —
2,965—1
¥ 2,966
Unrealized losses
Millions of Yen
Securities classified as:Trading . . . . . . . . . . . . . . . . . . . . . . . . . . . . . . . . . . . . . . . . . . . . . . .Available-for-sale:
Equity securities . . . . . . . . . . . . . . . . . . . . . . . . . . . . . . . . . . . . . . .Debt securities . . . . . . . . . . . . . . . . . . . . . . . . . . . . . . . . . . . . . . . .
Held-to-maturity . . . . . . . . . . . . . . . . . . . . . . . . . . . . . . . . . . . . . . . .
$ 48
1,414158
96$ 1,716
$ —
1,75501
$ 1,756
$ 48
3,153158
97$ 3,456
Fair valueCostUnrealized
gains
$ —
16——
$ 16
Unrealized losses
Millions of U.S. Dollars
As of March 31, 2005:
As of March 31, 2004:
Debt securities classified as available-for-sale securities and held-to-maturity securities mainly consist of Japanese government and municipalbonds and corporate debt securities. Gross unrealized losses on mar-
ketable securities that had been in a continuous unrealized loss positionfor twelve months or longer as of March 31, 2005 were immaterial.
Due in one year or less . . . . . . . . . . . . .Due after one year through five years . .Due after five years through ten years . .Due after ten years . . . . . . . . . . . . . . .
Total . . . . . . . . . . . . . . . . . . . . . . .
¥ 477738
15521
¥ 1,751
¥ 2,1099,009
79112
¥ 11,921
$ 2470
20
$ 96
Held-to -maturity
2004
¥ 15,4611,022
5493
¥ 16,981
¥ 2,5107,498
17043
¥ 10,221
2005
$ 144905
$ 158
2005
Available-for-sale
Held-to -maturity
Available-for-sale
Held-to -maturity
Available-for-sale
Millions of Yen Millions ofU.S. Dollars
The carrying values of debt securities classified as available-for-sale and held-to-maturity as of March 31, 2005 and 2004 are summarized by contrac-tual maturities as follows:
Proceeds from sales and gross realized gains and losses on available-for-sale securities for the years ended March 31, 2005, 2004 and 2003 are as follows:
Proceeds from sales . . . . . . . . . . . . . . . . . . . . . . . . . . . . . . . . . . . . . . .
Gross realized gains . . . . . . . . . . . . . . . . . . . . . . . . . . . . . . . . . . . . . . .Gross realized losses . . . . . . . . . . . . . . . . . . . . . . . . . . . . . . . . . . . . . .Net realized gains . . . . . . . . . . . . . . . . . . . . . . . . . . . . . . . . . . . . . . . . .
¥ 30,268
¥ 15,811343
¥ 15,468
¥ 122,959
¥ 42,9852,522
¥ 40,463
$ 283
$ 1483
$ 145
20052005 2004
¥ 59,222
¥ 12,4372,741
¥ 9,696
2003
Millions of Yen Millions ofU.S. Dollars
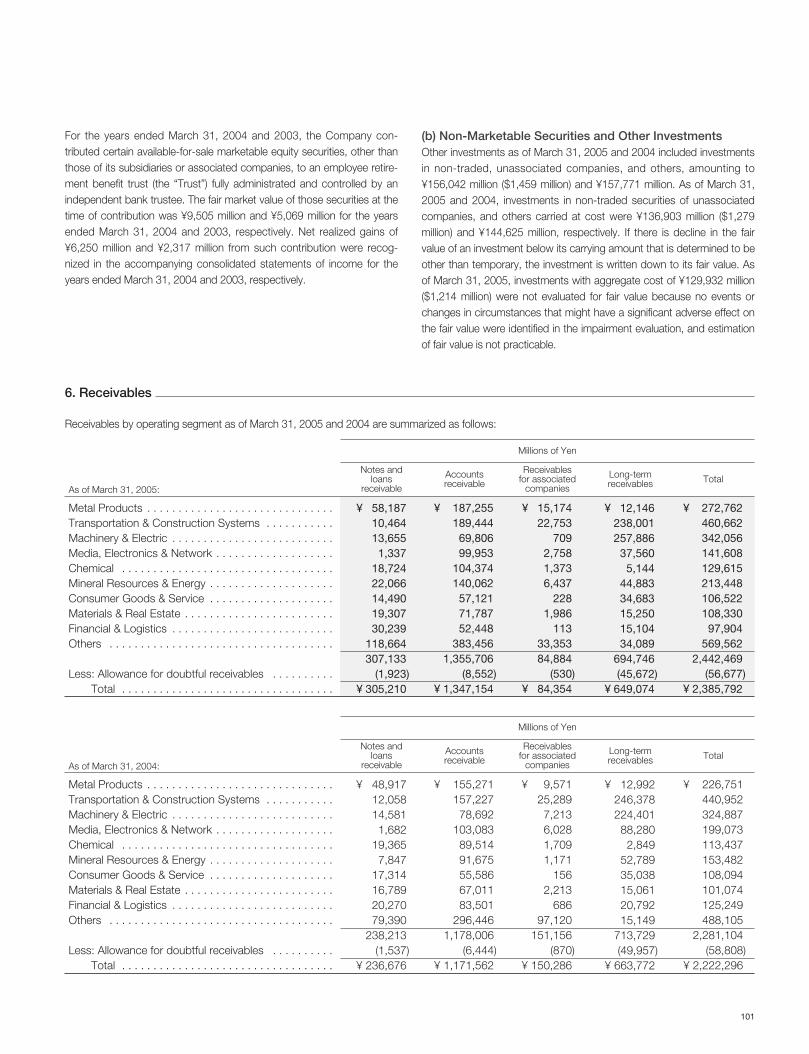
101
For the years ended March 31, 2004 and 2003, the Company con-tributed certain available-for-sale marketable equity securities, other thanthose of its subsidiaries or associated companies, to an employee retire-ment benefit trust (the “Trust”) fully administrated and controlled by anindependent bank trustee. The fair market value of those securities at thetime of contribution was ¥9,505 million and ¥5,069 million for the yearsended March 31, 2004 and 2003, respectively. Net realized gains of¥6,250 million and ¥2,317 million from such contribution were recog-nized in the accompanying consolidated statements of income for theyears ended March 31, 2004 and 2003, respectively.
(b) Non-Marketable Securities and Other InvestmentsOther investments as of March 31, 2005 and 2004 included investmentsin non-traded, unassociated companies, and others, amounting to¥156,042 million ($1,459 million) and ¥157,771 million. As of March 31,2005 and 2004, investments in non-traded securities of unassociatedcompanies, and others carried at cost were ¥136,903 million ($1,279million) and ¥144,625 million, respectively. If there is decline in the fairvalue of an investment below its carrying amount that is determined to beother than temporary, the investment is written down to its fair value. Asof March 31, 2005, investments with aggregate cost of ¥129,932 million($1,214 million) were not evaluated for fair value because no events orchanges in circumstances that might have a significant adverse effect onthe fair value were identified in the impairment evaluation, and estimationof fair value is not practicable.
6. Receivables
Metal Products . . . . . . . . . . . . . . . . . . . . . . . . . . . . . .Transportation & Construction Systems . . . . . . . . . . .Machinery & Electric . . . . . . . . . . . . . . . . . . . . . . . . . .Media, Electronics & Network . . . . . . . . . . . . . . . . . . .Chemical . . . . . . . . . . . . . . . . . . . . . . . . . . . . . . . . . .Mineral Resources & Energy . . . . . . . . . . . . . . . . . . . .Consumer Goods & Service . . . . . . . . . . . . . . . . . . . .Materials & Real Estate . . . . . . . . . . . . . . . . . . . . . . . .Financial & Logistics . . . . . . . . . . . . . . . . . . . . . . . . . .Others . . . . . . . . . . . . . . . . . . . . . . . . . . . . . . . . . . . .
Less: Allowance for doubtful receivables . . . . . . . . . .Total . . . . . . . . . . . . . . . . . . . . . . . . . . . . . . . . . .
¥ 15,17422,753
7092,7581,3736,437
2281,986
11333,35384,884
(530)¥ 84,354
¥ 272,762460,662342,056141,608129,615213,448106,522108,330
97,904569,562
2,442,469(56,677)
¥ 2,385,792
Total
¥ 12,146238,001257,886
37,5605,144
44,88334,68315,25015,10434,089
694,746(45,672)
¥ 649,074
Long-termreceivables
¥ 187,255189,444
69,80699,953
104,374140,062
57,12171,78752,448
383,4561,355,706
(8,552)¥ 1,347,154
Accountsreceivable
¥ 58,18710,46413,655
1,33718,72422,06614,49019,30730,239
118,664307,133
(1,923)¥ 305,210
Notes andloans
receivable
Millions of Yen
Receivables by operating segment as of March 31, 2005 and 2004 are summarized as follows:
As of March 31, 2005:
Receivablesfor associated
companies
Metal Products . . . . . . . . . . . . . . . . . . . . . . . . . . . . . .Transportation & Construction Systems . . . . . . . . . . .Machinery & Electric . . . . . . . . . . . . . . . . . . . . . . . . . .Media, Electronics & Network . . . . . . . . . . . . . . . . . . .Chemical . . . . . . . . . . . . . . . . . . . . . . . . . . . . . . . . . .Mineral Resources & Energy . . . . . . . . . . . . . . . . . . . .Consumer Goods & Service . . . . . . . . . . . . . . . . . . . .Materials & Real Estate . . . . . . . . . . . . . . . . . . . . . . . .Financial & Logistics . . . . . . . . . . . . . . . . . . . . . . . . . .Others . . . . . . . . . . . . . . . . . . . . . . . . . . . . . . . . . . . .
Less: Allowance for doubtful receivables . . . . . . . . . .Total . . . . . . . . . . . . . . . . . . . . . . . . . . . . . . . . . .
¥ 9,57125,289
7,2136,0281,7091,171
1562,213
68697,120
151,156(870)
¥ 150,286
¥ 226,751440,952324,887199,073113,437153,482108,094101,074125,249488,105
2,281,104(58,808)
¥ 2,222,296
Total
¥ 12,992246,378224,401
88,2802,849
52,78935,03815,06120,79215,149
713,729(49,957)
¥ 663,772
Long-termreceivables
¥ 155,271157,227
78,692103,083
89,51491,67555,58667,01183,501
296,4461,178,006
(6,444)¥ 1,171,562
Accountsreceivable
¥ 48,91712,05814,581
1,68219,365
7,84717,31416,78920,27079,390
238,213(1,537)
¥ 236,676
Notes andloans
receivable
Millions of Yen
As of March 31, 2004:
Receivablesfor associated
companies
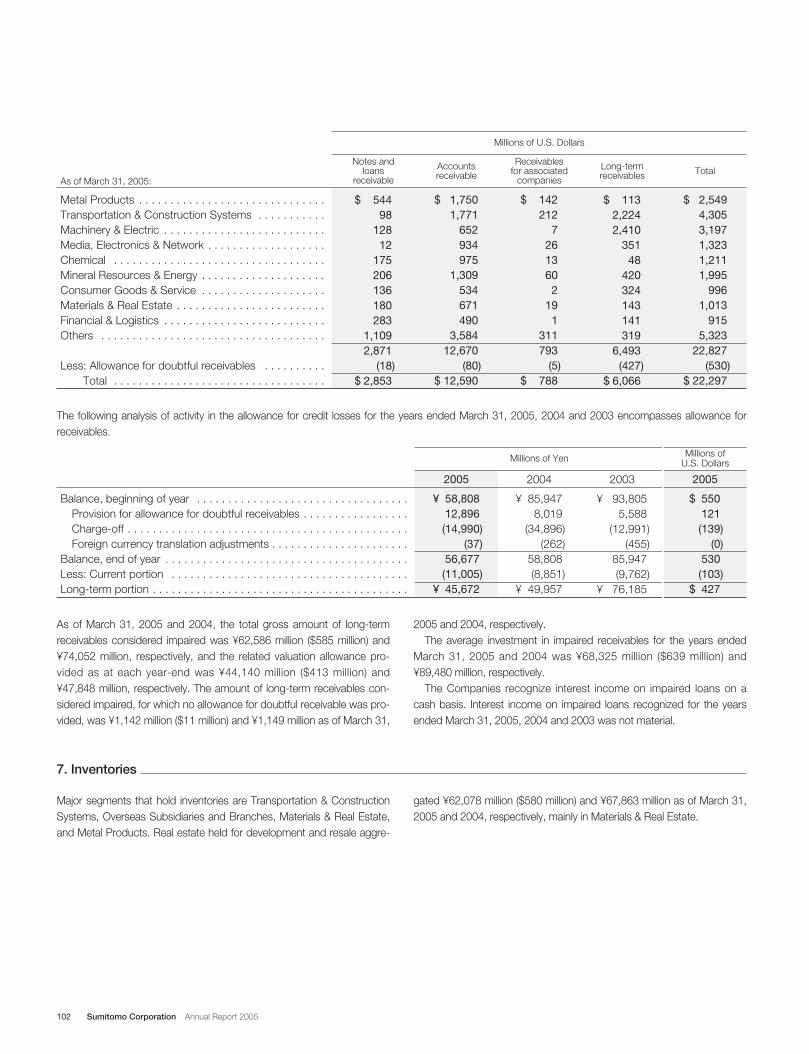
102 Sumitomo Corporation Annual Report 2005
The following analysis of activity in the allowance for credit losses for the years ended March 31, 2005, 2004 and 2003 encompasses allowance forreceivables.
Metal Products . . . . . . . . . . . . . . . . . . . . . . . . . . . . . .Transportation & Construction Systems . . . . . . . . . . .Machinery & Electric . . . . . . . . . . . . . . . . . . . . . . . . . .Media, Electronics & Network . . . . . . . . . . . . . . . . . . .Chemical . . . . . . . . . . . . . . . . . . . . . . . . . . . . . . . . . .Mineral Resources & Energy . . . . . . . . . . . . . . . . . . . .Consumer Goods & Service . . . . . . . . . . . . . . . . . . . .Materials & Real Estate . . . . . . . . . . . . . . . . . . . . . . . .Financial & Logistics . . . . . . . . . . . . . . . . . . . . . . . . . .Others . . . . . . . . . . . . . . . . . . . . . . . . . . . . . . . . . . . .
Less: Allowance for doubtful receivables . . . . . . . . . .Total . . . . . . . . . . . . . . . . . . . . . . . . . . . . . . . . . .
$ 142212
7261360
219
1311793
(5)$ 788
$ 2,5494,3053,1971,3231,2111,995
9961,013
9155,323
22,827(530)
$ 22,297
Total
$ 1132,2242,410
35148
420324143141319
6,493(427)
$ 6,066
Long-termreceivables
$ 1,7501,771
652934975
1,309534671490
3,58412,670
(80)$ 12,590
Accountsreceivable
$ 54498
12812
175206136180283
1,1092,871
(18)$ 2,853
Notes andloans
receivable
Millions of U.S. Dollars
As of March 31, 2005:
Receivablesfor associated
companies
Balance, beginning of year . . . . . . . . . . . . . . . . . . . . . . . . . . . . . . . . . .Provision for allowance for doubtful receivables . . . . . . . . . . . . . . . . .Charge-off . . . . . . . . . . . . . . . . . . . . . . . . . . . . . . . . . . . . . . . . . . . . .Foreign currency translation adjustments . . . . . . . . . . . . . . . . . . . . . .
Balance, end of year . . . . . . . . . . . . . . . . . . . . . . . . . . . . . . . . . . . . . . .Less: Current portion . . . . . . . . . . . . . . . . . . . . . . . . . . . . . . . . . . . . . .Long-term portion . . . . . . . . . . . . . . . . . . . . . . . . . . . . . . . . . . . . . . . . .
¥ 58,80812,896(14,990)
(37)56,677(11,005)
¥ 45,672
¥ 85,9478,019
(34,896)(262)
58,808(8,851)
¥ 49,957
$ 550121(139)
(0)530(103)
$ 427
20052005 2004
¥ 93,8055,588
(12,991)(455)
85,947(9,762)
¥ 76,185
2003
Millions of Yen Millions of U.S. Dollars
7. Inventories
Major segments that hold inventories are Transportation & ConstructionSystems, Overseas Subsidiaries and Branches, Materials & Real Estate,and Metal Products. Real estate held for development and resale aggre-
gated ¥62,078 million ($580 million) and ¥67,863 million as of March 31,2005 and 2004, respectively, mainly in Materials & Real Estate.
As of March 31, 2005 and 2004, the total gross amount of long-termreceivables considered impaired was ¥62,586 million ($585 million) and¥74,052 million, respectively, and the related valuation allowance pro-vided as at each year-end was ¥44,140 million ($413 million) and¥47,848 million, respectively. The amount of long-term receivables con-sidered impaired, for which no allowance for doubtful receivable was pro-vided, was ¥1,142 million ($11 million) and ¥1,149 million as of March 31,
2005 and 2004, respectively.The average investment in impaired receivables for the years ended
March 31, 2005 and 2004 was ¥68,325 million ($639 million) and¥89,480 million, respectively.
The Companies recognize interest income on impaired loans on acash basis. Interest income on impaired loans recognized for the yearsended March 31, 2005, 2004 and 2003 was not material.
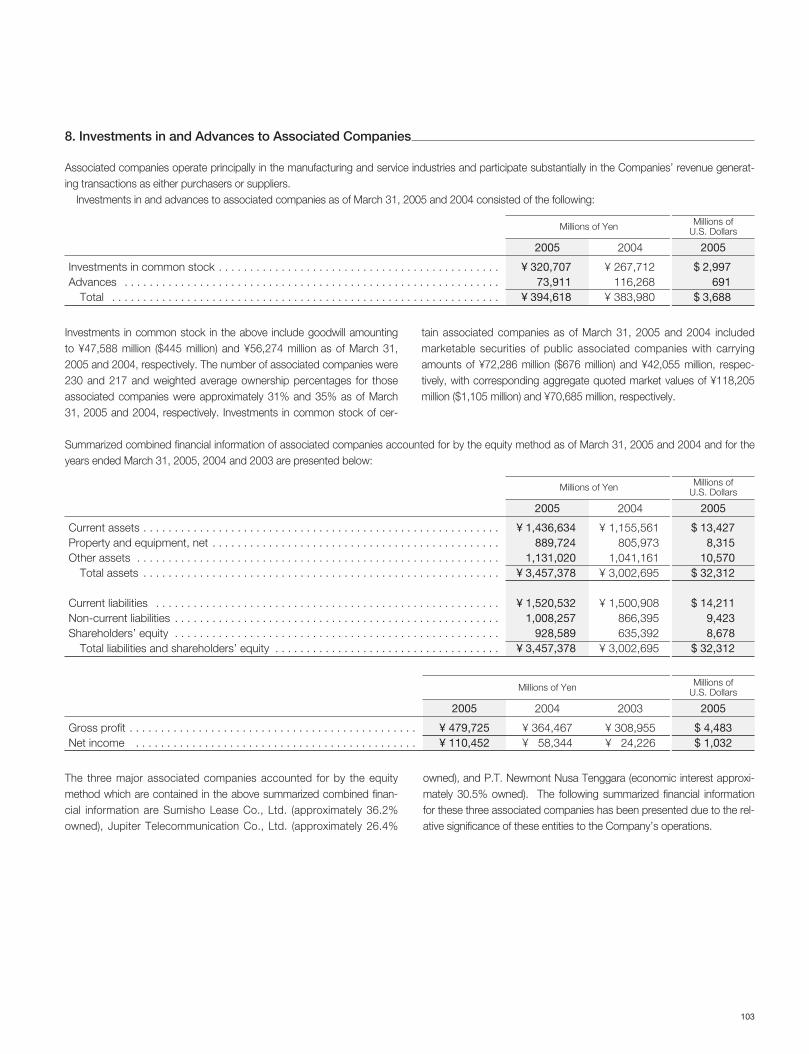
103
Investments in common stock . . . . . . . . . . . . . . . . . . . . . . . . . . . . . . . . . . . . . . . . . . . . .Advances . . . . . . . . . . . . . . . . . . . . . . . . . . . . . . . . . . . . . . . . . . . . . . . . . . . . . . . . . . . .
Total . . . . . . . . . . . . . . . . . . . . . . . . . . . . . . . . . . . . . . . . . . . . . . . . . . . . . . . . . . . . . .
¥ 320,70773,911
¥ 394,618
¥ 267,712116,268
¥ 383,980
$ 2,997691
$ 3,688
20052005 2004
Millions of Yen Millions ofU.S. Dollars
Gross profit . . . . . . . . . . . . . . . . . . . . . . . . . . . . . . . . . . . . . . . . . . . . . .Net income . . . . . . . . . . . . . . . . . . . . . . . . . . . . . . . . . . . . . . . . . . . . .
¥ 479,725¥ 110,452
¥ 364,467¥ 58,344
$ 4,483$ 1,032
20052005 2004
¥ 308,955¥ 24,226
2003
Millions of Yen Millions ofU.S. Dollars
Current assets . . . . . . . . . . . . . . . . . . . . . . . . . . . . . . . . . . . . . . . . . . . . . . . . . . . . . . . . .Property and equipment, net . . . . . . . . . . . . . . . . . . . . . . . . . . . . . . . . . . . . . . . . . . . . . .Other assets . . . . . . . . . . . . . . . . . . . . . . . . . . . . . . . . . . . . . . . . . . . . . . . . . . . . . . . . . .
Total assets . . . . . . . . . . . . . . . . . . . . . . . . . . . . . . . . . . . . . . . . . . . . . . . . . . . . . . . . .
Current liabilities . . . . . . . . . . . . . . . . . . . . . . . . . . . . . . . . . . . . . . . . . . . . . . . . . . . . . . .Non-current liabilities . . . . . . . . . . . . . . . . . . . . . . . . . . . . . . . . . . . . . . . . . . . . . . . . . . . .Shareholders’ equity . . . . . . . . . . . . . . . . . . . . . . . . . . . . . . . . . . . . . . . . . . . . . . . . . . . .
Total liabilities and shareholders’ equity . . . . . . . . . . . . . . . . . . . . . . . . . . . . . . . . . . . .
¥ 1,436,634889,724
1,131,020¥ 3,457,378
¥ 1,520,5321,008,257
928,589¥ 3,457,378
¥ 1,155,561805,973
1,041,161¥ 3,002,695
¥ 1,500,908866,395635,392
¥ 3,002,695
$ 13,4278,315
10,570$ 32,312
$ 14,2119,4238,678
$ 32,312
20052005 2004
Millions of Yen Millions ofU.S. Dollars
Investments in common stock in the above include goodwill amountingto ¥47,588 million ($445 million) and ¥56,274 million as of March 31,2005 and 2004, respectively. The number of associated companies were230 and 217 and weighted average ownership percentages for thoseassociated companies were approximately 31% and 35% as of March31, 2005 and 2004, respectively. Investments in common stock of cer-
tain associated companies as of March 31, 2005 and 2004 includedmarketable securities of public associated companies with carryingamounts of ¥72,286 million ($676 million) and ¥42,055 million, respec-tively, with corresponding aggregate quoted market values of ¥118,205million ($1,105 million) and ¥70,685 million, respectively.
Summarized combined financial information of associated companies accounted for by the equity method as of March 31, 2005 and 2004 and for theyears ended March 31, 2005, 2004 and 2003 are presented below:
8. Investments in and Advances to Associated Companies
Associated companies operate principally in the manufacturing and service industries and participate substantially in the Companies’ revenue generat-ing transactions as either purchasers or suppliers.
Investments in and advances to associated companies as of March 31, 2005 and 2004 consisted of the following:
The three major associated companies accounted for by the equitymethod which are contained in the above summarized combined finan-cial information are Sumisho Lease Co., Ltd. (approximately 36.2%owned), Jupiter Telecommunication Co., Ltd. (approximately 26.4%
owned), and P.T. Newmont Nusa Tenggara (economic interest approxi-mately 30.5% owned). The following summarized financial informationfor these three associated companies has been presented due to the rel-ative significance of these entities to the Company’s operations.
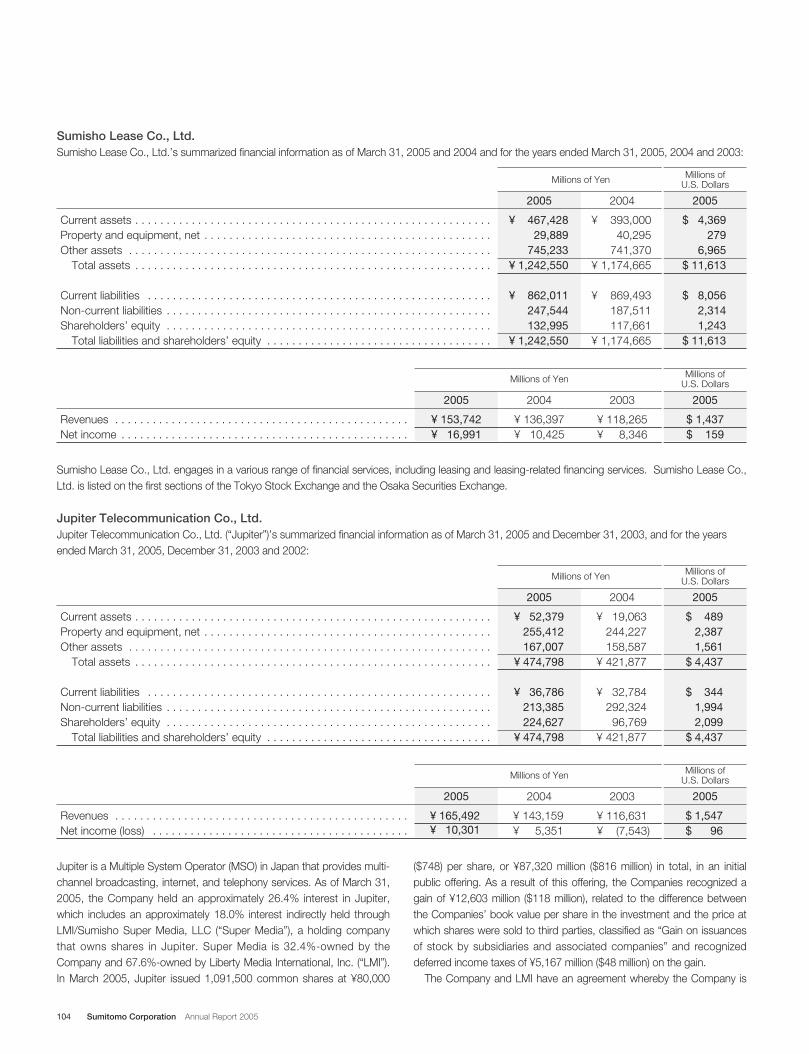
104 Sumitomo Corporation Annual Report 2005
Revenues . . . . . . . . . . . . . . . . . . . . . . . . . . . . . . . . . . . . . . . . . . . . . . .Net income . . . . . . . . . . . . . . . . . . . . . . . . . . . . . . . . . . . . . . . . . . . . . .
¥ 153,742¥ 16,991
¥ 136,397¥ 10,425
$ 1,437$ 159
20052005 2004
¥ 118,265¥ 8,346
2003
Millions of Yen Millions ofU.S. Dollars
Current assets . . . . . . . . . . . . . . . . . . . . . . . . . . . . . . . . . . . . . . . . . . . . . . . . . . . . . . . . .Property and equipment, net . . . . . . . . . . . . . . . . . . . . . . . . . . . . . . . . . . . . . . . . . . . . . .Other assets . . . . . . . . . . . . . . . . . . . . . . . . . . . . . . . . . . . . . . . . . . . . . . . . . . . . . . . . . .
Total assets . . . . . . . . . . . . . . . . . . . . . . . . . . . . . . . . . . . . . . . . . . . . . . . . . . . . . . . . .
Current liabilities . . . . . . . . . . . . . . . . . . . . . . . . . . . . . . . . . . . . . . . . . . . . . . . . . . . . . . .Non-current liabilities . . . . . . . . . . . . . . . . . . . . . . . . . . . . . . . . . . . . . . . . . . . . . . . . . . . .Shareholders’ equity . . . . . . . . . . . . . . . . . . . . . . . . . . . . . . . . . . . . . . . . . . . . . . . . . . . .
Total liabilities and shareholders’ equity . . . . . . . . . . . . . . . . . . . . . . . . . . . . . . . . . . . .
¥ 467,42829,889
745,233¥ 1,242,550
¥ 862,011247,544132,995
¥ 1,242,550
¥ 393,00040,295
741,370¥ 1,174,665
¥ 869,493187,511117,661
¥ 1,174,665
$ 4,369279
6,965$ 11,613
$ 8,0562,3141,243
$ 11,613
20052005 2004
Millions of Yen Millions ofU.S. Dollars
Sumisho Lease Co., Ltd.Sumisho Lease Co., Ltd.’s summarized financial information as of March 31, 2005 and 2004 and for the years ended March 31, 2005, 2004 and 2003:
Revenues . . . . . . . . . . . . . . . . . . . . . . . . . . . . . . . . . . . . . . . . . . . . . . .Net income (loss) . . . . . . . . . . . . . . . . . . . . . . . . . . . . . . . . . . . . . . . . .
¥ 165,492¥ 10,301
¥ 143,159¥ 5,351
$ 1,547$ 96
20052005 2004
¥ 116,631¥ (7,543)
2003
Millions of Yen Millions ofU.S. Dollars
Current assets . . . . . . . . . . . . . . . . . . . . . . . . . . . . . . . . . . . . . . . . . . . . . . . . . . . . . . . . .Property and equipment, net . . . . . . . . . . . . . . . . . . . . . . . . . . . . . . . . . . . . . . . . . . . . . .Other assets . . . . . . . . . . . . . . . . . . . . . . . . . . . . . . . . . . . . . . . . . . . . . . . . . . . . . . . . . .
Total assets . . . . . . . . . . . . . . . . . . . . . . . . . . . . . . . . . . . . . . . . . . . . . . . . . . . . . . . . .
Current liabilities . . . . . . . . . . . . . . . . . . . . . . . . . . . . . . . . . . . . . . . . . . . . . . . . . . . . . . .Non-current liabilities . . . . . . . . . . . . . . . . . . . . . . . . . . . . . . . . . . . . . . . . . . . . . . . . . . . .Shareholders’ equity . . . . . . . . . . . . . . . . . . . . . . . . . . . . . . . . . . . . . . . . . . . . . . . . . . . .
Total liabilities and shareholders’ equity . . . . . . . . . . . . . . . . . . . . . . . . . . . . . . . . . . . .
¥ 52,379255,412167,007
¥ 474,798
¥ 36,786213,385224,627
¥ 474,798
¥ 19,063244,227158,587
¥ 421,877
¥ 32,784292,324
96,769¥ 421,877
$ 4892,3871,561
$ 4,437
$ 3441,9942,099
$ 4,437
20052005 2004
Millions of Yen Millions ofU.S. Dollars
Jupiter Telecommunication Co., Ltd.Jupiter Telecommunication Co., Ltd. (“Jupiter”)’s summarized financial information as of March 31, 2005 and December 31, 2003, and for the yearsended March 31, 2005, December 31, 2003 and 2002:
Sumisho Lease Co., Ltd. engages in a various range of financial services, including leasing and leasing-related financing services. Sumisho Lease Co.,Ltd. is listed on the first sections of the Tokyo Stock Exchange and the Osaka Securities Exchange.
Jupiter is a Multiple System Operator (MSO) in Japan that provides multi-channel broadcasting, internet, and telephony services. As of March 31,2005, the Company held an approximately 26.4% interest in Jupiter,which includes an approximately 18.0% interest indirectly held throughLMI/Sumisho Super Media, LLC (“Super Media”), a holding companythat owns shares in Jupiter. Super Media is 32.4%-owned by theCompany and 67.6%-owned by Liberty Media International, Inc. (“LMI”).In March 2005, Jupiter issued 1,091,500 common shares at ¥80,000
($748) per share, or ¥87,320 million ($816 million) in total, in an initialpublic offering. As a result of this offering, the Companies recognized again of ¥12,603 million ($118 million), related to the difference betweenthe Companies’ book value per share in the investment and the price atwhich shares were sold to third parties, classified as “Gain on issuancesof stock by subsidiaries and associated companies” and recognizeddeferred income taxes of ¥5,167 million ($48 million) on the gain.
The Company and LMI have an agreement whereby the Company is
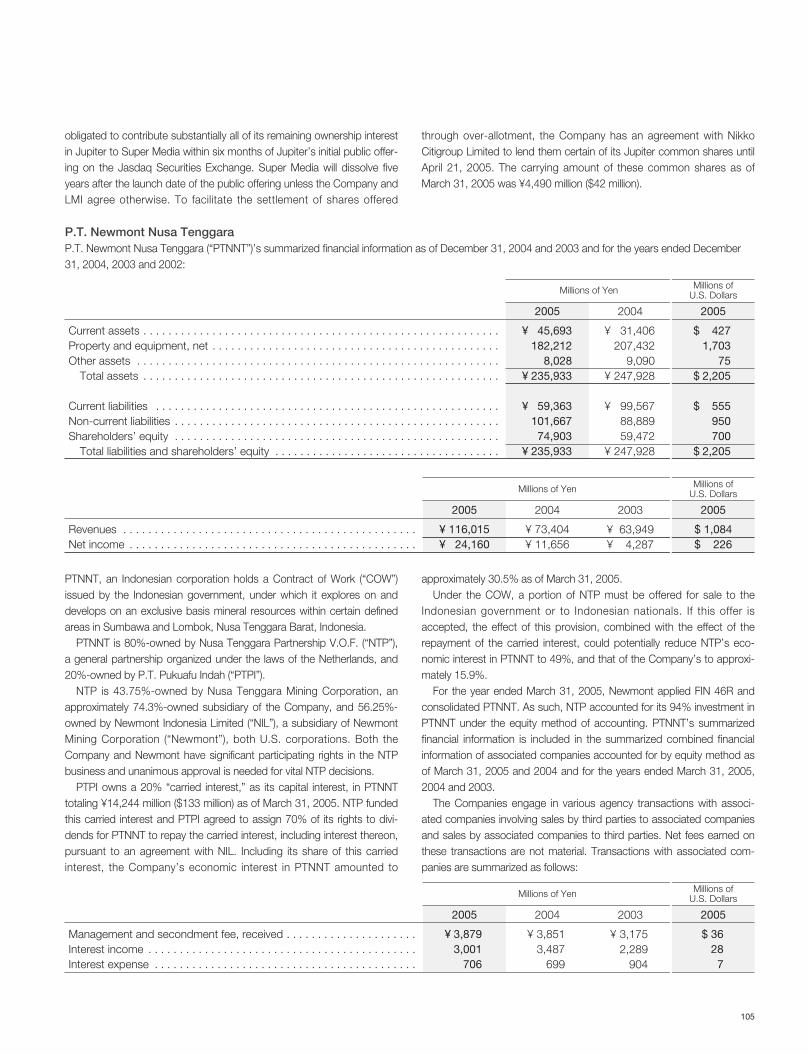
105
Revenues . . . . . . . . . . . . . . . . . . . . . . . . . . . . . . . . . . . . . . . . . . . . . . .Net income . . . . . . . . . . . . . . . . . . . . . . . . . . . . . . . . . . . . . . . . . . . . . .
¥ 116,015¥ 24,160
¥ 73,404¥ 11,656
$ 1,084$ 226
20052005 2004
¥ 63,949¥ 4,287
2003
Millions of Yen Millions ofU.S. Dollars
Current assets . . . . . . . . . . . . . . . . . . . . . . . . . . . . . . . . . . . . . . . . . . . . . . . . . . . . . . . . .Property and equipment, net . . . . . . . . . . . . . . . . . . . . . . . . . . . . . . . . . . . . . . . . . . . . . .Other assets . . . . . . . . . . . . . . . . . . . . . . . . . . . . . . . . . . . . . . . . . . . . . . . . . . . . . . . . . .
Total assets . . . . . . . . . . . . . . . . . . . . . . . . . . . . . . . . . . . . . . . . . . . . . . . . . . . . . . . . .
Current liabilities . . . . . . . . . . . . . . . . . . . . . . . . . . . . . . . . . . . . . . . . . . . . . . . . . . . . . . .Non-current liabilities . . . . . . . . . . . . . . . . . . . . . . . . . . . . . . . . . . . . . . . . . . . . . . . . . . . .Shareholders’ equity . . . . . . . . . . . . . . . . . . . . . . . . . . . . . . . . . . . . . . . . . . . . . . . . . . . .
Total liabilities and shareholders’ equity . . . . . . . . . . . . . . . . . . . . . . . . . . . . . . . . . . . .
¥ 45,693182,212
8,028¥ 235,933
¥ 59,363101,667
74,903¥ 235,933
¥ 31,406207,432
9,090¥ 247,928
¥ 99,56788,88959,472
¥ 247,928
$ 4271,703
75$ 2,205
$ 555950700
$ 2,205
20052005 2004
Millions of Yen Millions ofU.S. Dollars
P.T. Newmont Nusa TenggaraP.T. Newmont Nusa Tenggara (“PTNNT”)’s summarized financial information as of December 31, 2004 and 2003 and for the years ended December31, 2004, 2003 and 2002:
PTNNT, an Indonesian corporation holds a Contract of Work (“COW”)issued by the Indonesian government, under which it explores on anddevelops on an exclusive basis mineral resources within certain definedareas in Sumbawa and Lombok, Nusa Tenggara Barat, Indonesia.
PTNNT is 80%-owned by Nusa Tenggara Partnership V.O.F. (“NTP”),a general partnership organized under the laws of the Netherlands, and20%-owned by P.T. Pukuafu Indah (“PTPI”).
NTP is 43.75%-owned by Nusa Tenggara Mining Corporation, anapproximately 74.3%-owned subsidiary of the Company, and 56.25%-owned by Newmont Indonesia Limited (“NIL”), a subsidiary of NewmontMining Corporation (“Newmont”), both U.S. corporations. Both theCompany and Newmont have significant participating rights in the NTPbusiness and unanimous approval is needed for vital NTP decisions.
PTPI owns a 20% “carried interest,” as its capital interest, in PTNNTtotaling ¥14,244 million ($133 million) as of March 31, 2005. NTP fundedthis carried interest and PTPI agreed to assign 70% of its rights to divi-dends for PTNNT to repay the carried interest, including interest thereon,pursuant to an agreement with NIL. Including its share of this carriedinterest, the Company’s economic interest in PTNNT amounted to
approximately 30.5% as of March 31, 2005.Under the COW, a portion of NTP must be offered for sale to the
Indonesian government or to Indonesian nationals. If this offer isaccepted, the effect of this provision, combined with the effect of therepayment of the carried interest, could potentially reduce NTP’s eco-nomic interest in PTNNT to 49%, and that of the Company’s to approxi-mately 15.9%.
For the year ended March 31, 2005, Newmont applied FIN 46R andconsolidated PTNNT. As such, NTP accounted for its 94% investment inPTNNT under the equity method of accounting. PTNNT’s summarizedfinancial information is included in the summarized combined financialinformation of associated companies accounted for by equity method asof March 31, 2005 and 2004 and for the years ended March 31, 2005,2004 and 2003.
The Companies engage in various agency transactions with associ-ated companies involving sales by third parties to associated companiesand sales by associated companies to third parties. Net fees earned onthese transactions are not material. Transactions with associated com-panies are summarized as follows:
obligated to contribute substantially all of its remaining ownership interestin Jupiter to Super Media within six months of Jupiter’s initial public offer-ing on the Jasdaq Securities Exchange. Super Media will dissolve fiveyears after the launch date of the public offering unless the Company andLMI agree otherwise. To facilitate the settlement of shares offered
through over-allotment, the Company has an agreement with NikkoCitigroup Limited to lend them certain of its Jupiter common shares untilApril 21, 2005. The carrying amount of these common shares as ofMarch 31, 2005 was ¥4,490 million ($42 million).
Management and secondment fee, received . . . . . . . . . . . . . . . . . . . . .Interest income . . . . . . . . . . . . . . . . . . . . . . . . . . . . . . . . . . . . . . . . . . .Interest expense . . . . . . . . . . . . . . . . . . . . . . . . . . . . . . . . . . . . . . . . . .
¥ 3,8793,001
706
¥ 3,8513,487
699
$ 3628
7
20052005 2004
¥ 3,1752,289
904
2003
Millions of Yen Millions ofU.S. Dollars
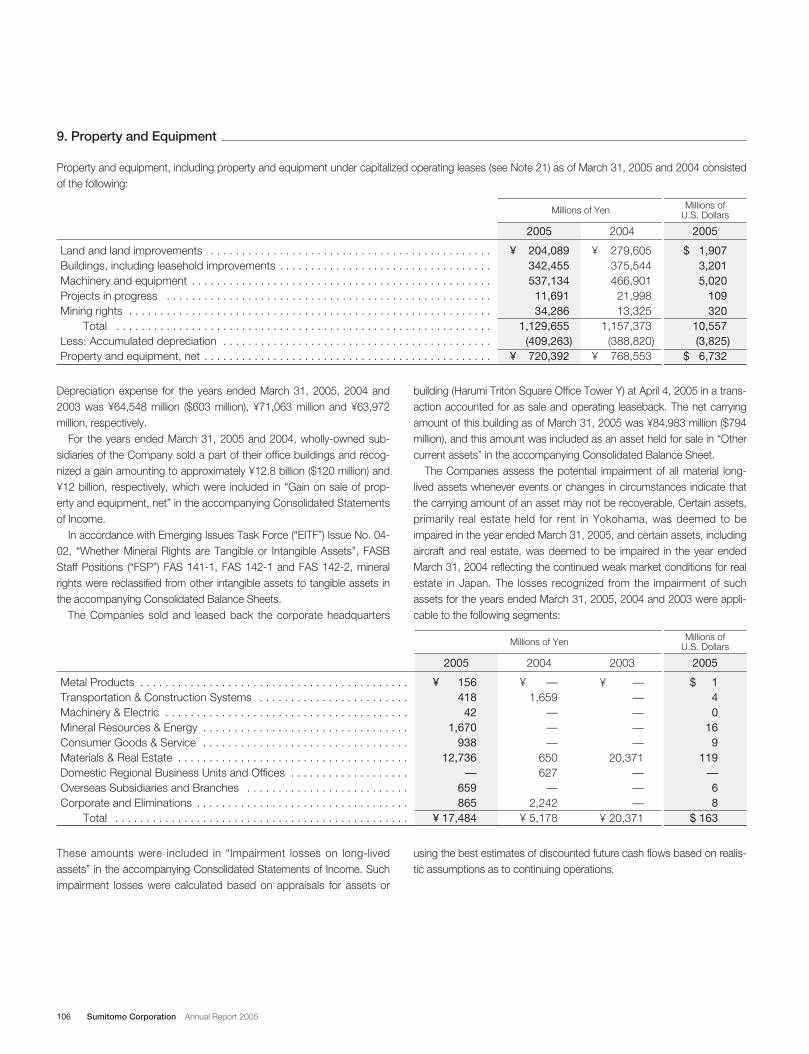
106 Sumitomo Corporation Annual Report 2005
9. Property and Equipment
Property and equipment, including property and equipment under capitalized operating leases (see Note 21) as of March 31, 2005 and 2004 consistedof the following:
Land and land improvements . . . . . . . . . . . . . . . . . . . . . . . . . . . . . . . . . . . . . . . . . . . . .Buildings, including leasehold improvements . . . . . . . . . . . . . . . . . . . . . . . . . . . . . . . . . .Machinery and equipment . . . . . . . . . . . . . . . . . . . . . . . . . . . . . . . . . . . . . . . . . . . . . . . .Projects in progress . . . . . . . . . . . . . . . . . . . . . . . . . . . . . . . . . . . . . . . . . . . . . . . . . . . .Mining rights . . . . . . . . . . . . . . . . . . . . . . . . . . . . . . . . . . . . . . . . . . . . . . . . . . . . . . . . . .
Total . . . . . . . . . . . . . . . . . . . . . . . . . . . . . . . . . . . . . . . . . . . . . . . . . . . . . . . . . . . .Less: Accumulated depreciation . . . . . . . . . . . . . . . . . . . . . . . . . . . . . . . . . . . . . . . . . . .Property and equipment, net . . . . . . . . . . . . . . . . . . . . . . . . . . . . . . . . . . . . . . . . . . . . . .
¥ 204,089342,455537,134
11,69134,286
1,129,655(409,263)
¥ 720,392
¥ 279,605375,544466,901
21,99813,325
1,157,373(388,820)
¥ 768,553
$ 1,9073,2015,020
109320
10,557(3,825)
$ 6,732
20052005 2004
Millions of Yen Millions ofU.S. Dollars
Metal Products . . . . . . . . . . . . . . . . . . . . . . . . . . . . . . . . . . . . . . . . . . .Transportation & Construction Systems . . . . . . . . . . . . . . . . . . . . . . . .Machinery & Electric . . . . . . . . . . . . . . . . . . . . . . . . . . . . . . . . . . . . . . .Mineral Resources & Energy . . . . . . . . . . . . . . . . . . . . . . . . . . . . . . . . .Consumer Goods & Service . . . . . . . . . . . . . . . . . . . . . . . . . . . . . . . . .Materials & Real Estate . . . . . . . . . . . . . . . . . . . . . . . . . . . . . . . . . . . . .Domestic Regional Business Units and Offices . . . . . . . . . . . . . . . . . . .Overseas Subsidiaries and Branches . . . . . . . . . . . . . . . . . . . . . . . . . .Corporate and Eliminations . . . . . . . . . . . . . . . . . . . . . . . . . . . . . . . . . .
Total . . . . . . . . . . . . . . . . . . . . . . . . . . . . . . . . . . . . . . . . . . . . . . .
¥ 156418
42 1,670
938 12,736
— 659 865
¥ 17,484
¥ — 1,659
— — —
650627
— 2,242
¥ 5,178
$ 140
169
119—68
$ 163
20052005 2004
¥ — — — — —
20,371— — —
¥ 20,371
2003
Millions of Yen Millions ofU.S. Dollars
Depreciation expense for the years ended March 31, 2005, 2004 and2003 was ¥64,548 million ($603 million), ¥71,063 million and ¥63,972million, respectively.
For the years ended March 31, 2005 and 2004, wholly-owned sub-sidiaries of the Company sold a part of their office buildings and recog-nized a gain amounting to approximately ¥12.8 billion ($120 million) and¥12 billion, respectively, which were included in “Gain on sale of prop-erty and equipment, net” in the accompanying Consolidated Statementsof Income.
In accordance with Emerging Issues Task Force (“EITF”) Issue No. 04-02, “Whether Mineral Rights are Tangible or Intangible Assets”, FASBStaff Positions (“FSP”) FAS 141-1, FAS 142-1 and FAS 142-2, mineralrights were reclassified from other intangible assets to tangible assets inthe accompanying Consolidated Balance Sheets.
The Companies sold and leased back the corporate headquarters
building (Harumi Triton Square Office Tower Y) at April 4, 2005 in a trans-action accounted for as sale and operating leaseback. The net carryingamount of this building as of March 31, 2005 was ¥84,983 million ($794million), and this amount was included as an asset held for sale in “Othercurrent assets” in the accompanying Consolidated Balance Sheet.
The Companies assess the potential impairment of all material long-lived assets whenever events or changes in circumstances indicate thatthe carrying amount of an asset may not be recoverable. Certain assets,primarily real estate held for rent in Yokohama, was deemed to beimpaired in the year ended March 31, 2005, and certain assets, includingaircraft and real estate, was deemed to be impaired in the year endedMarch 31, 2004 reflecting the continued weak market conditions for realestate in Japan. The losses recognized from the impairment of suchassets for the years ended March 31, 2005, 2004 and 2003 were appli-cable to the following segments:
These amounts were included in “Impairment losses on long-livedassets” in the accompanying Consolidated Statements of Income. Suchimpairment losses were calculated based on appraisals for assets or
using the best estimates of discounted future cash flows based on realis-tic assumptions as to continuing operations.
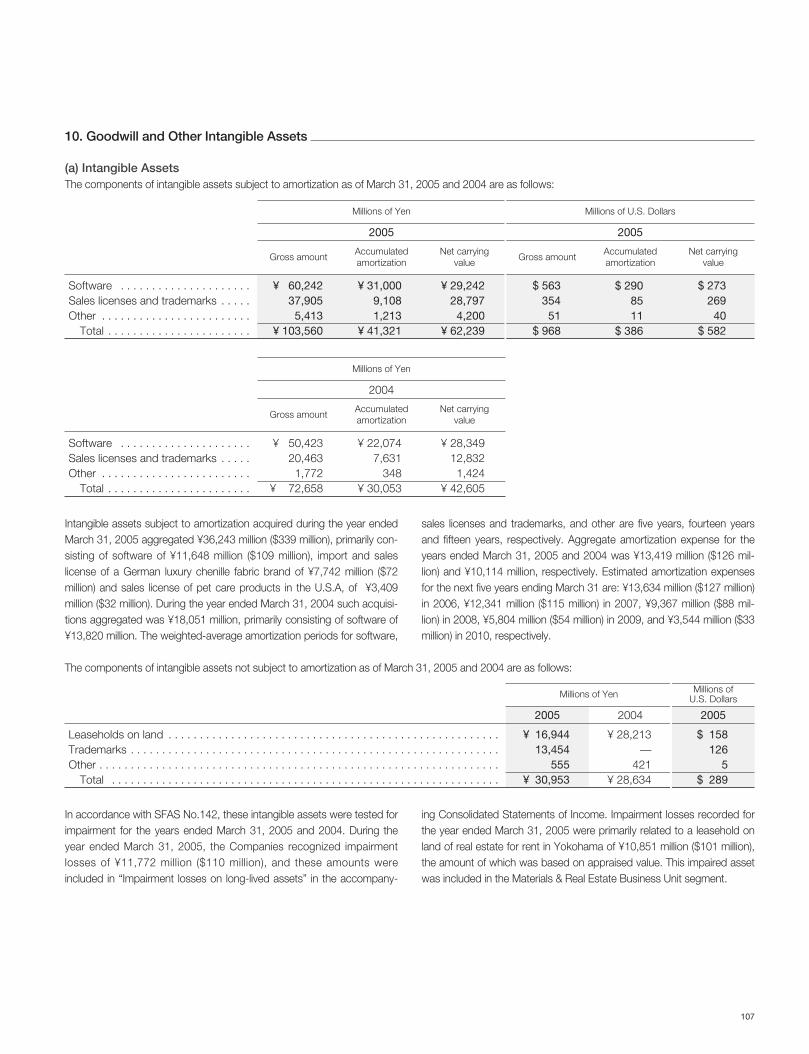
107
10. Goodwill and Other Intangible Assets
(a) Intangible AssetsThe components of intangible assets subject to amortization as of March 31, 2005 and 2004 are as follows:
Software . . . . . . . . . . . . . . . . . . . . .Sales licenses and trademarks . . . . .Other . . . . . . . . . . . . . . . . . . . . . . . .
Total . . . . . . . . . . . . . . . . . . . . . . .
¥ 29,24228,797
4,200¥ 62,239
$ 563354
51$ 968
$ 273269
40$ 582
Net carrying value
¥ 60,24237,905
5,413¥ 103,560
¥ 31,0009,1081,213
¥ 41,321
2005
$ 2908511
$ 386
2005
Net carrying value
Gross amountGross amountAccumulated amortization
Accumulated amortization
Millions of Yen Millions of U.S. Dollars
Software . . . . . . . . . . . . . . . . . . . . .Sales licenses and trademarks . . . . .Other . . . . . . . . . . . . . . . . . . . . . . . .
Total . . . . . . . . . . . . . . . . . . . . . . .
¥ 28,34912,832
1,424¥ 42,605
¥ 50,42320,463
1,772¥ 72,658
¥ 22,0747,631
348¥ 30,053
2004
Net carrying value
Gross amountAccumulated amortization
Millions of Yen
Intangible assets subject to amortization acquired during the year endedMarch 31, 2005 aggregated ¥36,243 million ($339 million), primarily con-sisting of software of ¥11,648 million ($109 million), import and saleslicense of a German luxury chenille fabric brand of ¥7,742 million ($72million) and sales license of pet care products in the U.S.A, of ¥3,409million ($32 million). During the year ended March 31, 2004 such acquisi-tions aggregated was ¥18,051 million, primarily consisting of software of¥13,820 million. The weighted-average amortization periods for software,
sales licenses and trademarks, and other are five years, fourteen yearsand fifteen years, respectively. Aggregate amortization expense for theyears ended March 31, 2005 and 2004 was ¥13,419 million ($126 mil-lion) and ¥10,114 million, respectively. Estimated amortization expensesfor the next five years ending March 31 are: ¥13,634 million ($127 million)in 2006, ¥12,341 million ($115 million) in 2007, ¥9,367 million ($88 mil-lion) in 2008, ¥5,804 million ($54 million) in 2009, and ¥3,544 million ($33million) in 2010, respectively.
The components of intangible assets not subject to amortization as of March 31, 2005 and 2004 are as follows:
Leaseholds on land . . . . . . . . . . . . . . . . . . . . . . . . . . . . . . . . . . . . . . . . . . . . . . . . . . . . .Trademarks . . . . . . . . . . . . . . . . . . . . . . . . . . . . . . . . . . . . . . . . . . . . . . . . . . . . . . . . . . .Other . . . . . . . . . . . . . . . . . . . . . . . . . . . . . . . . . . . . . . . . . . . . . . . . . . . . . . . . . . . . . . . .
Total . . . . . . . . . . . . . . . . . . . . . . . . . . . . . . . . . . . . . . . . . . . . . . . . . . . . . . . . . . . . . .
¥ 16,94413,454
555¥ 30,953
¥ 28,213—
421¥ 28,634
$ 158126
5$ 289
20052005 2004
Millions of Yen Millions ofU.S. Dollars
In accordance with SFAS No.142, these intangible assets were tested forimpairment for the years ended March 31, 2005 and 2004. During theyear ended March 31, 2005, the Companies recognized impairmentlosses of ¥11,772 million ($110 million), and these amounts wereincluded in “Impairment losses on long-lived assets” in the accompany-
ing Consolidated Statements of Income. Impairment losses recorded forthe year ended March 31, 2005 were primarily related to a leasehold onland of real estate for rent in Yokohama of ¥10,851 million ($101 million),the amount of which was based on appraised value. This impaired assetwas included in the Materials & Real Estate Business Unit segment.
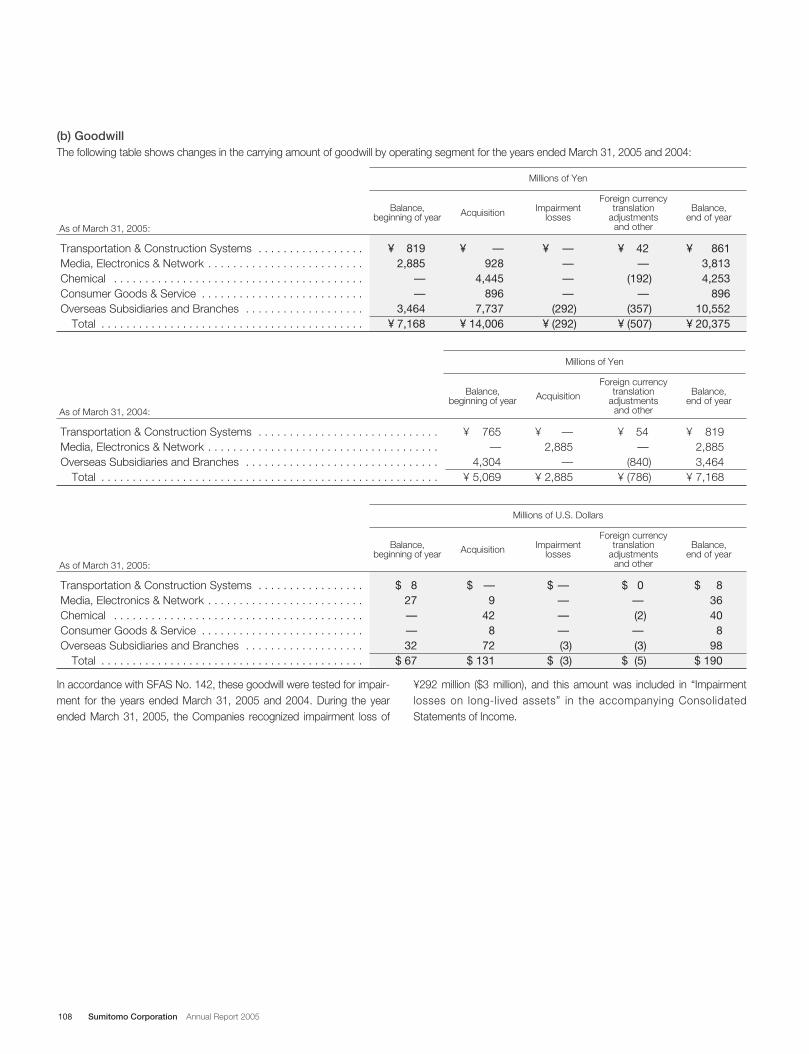
108 Sumitomo Corporation Annual Report 2005
Transportation & Construction Systems . . . . . . . . . . . . . . . . .Media, Electronics & Network . . . . . . . . . . . . . . . . . . . . . . . . .Chemical . . . . . . . . . . . . . . . . . . . . . . . . . . . . . . . . . . . . . . . .Consumer Goods & Service . . . . . . . . . . . . . . . . . . . . . . . . . .Overseas Subsidiaries and Branches . . . . . . . . . . . . . . . . . . .
Total . . . . . . . . . . . . . . . . . . . . . . . . . . . . . . . . . . . . . . . . . .
¥ 42—
(192)—
(357)¥ (507)
¥ —928
4,445896
7,737¥ 14,006
¥ 8192,885
——
3,464¥ 7,168
¥ 8613,8134,253
89610,552
¥ 20,375
Foreign currencytranslation
adjustments and other
Balance, end of year
Balance, beginning of year Acquisition
¥ ————
(292)¥ (292)
Impairment losses
Millions of Yen
(b) GoodwillThe following table shows changes in the carrying amount of goodwill by operating segment for the years ended March 31, 2005 and 2004:
As of March 31, 2005:
Transportation & Construction Systems . . . . . . . . . . . . . . . . . . . . . . . . . . . . .Media, Electronics & Network . . . . . . . . . . . . . . . . . . . . . . . . . . . . . . . . . . . . .Overseas Subsidiaries and Branches . . . . . . . . . . . . . . . . . . . . . . . . . . . . . . .
Total . . . . . . . . . . . . . . . . . . . . . . . . . . . . . . . . . . . . . . . . . . . . . . . . . . . . . .
¥ 54—
(840)¥ (786)
¥ —2,885
—¥ 2,885
¥ 765—
4,304¥ 5,069
¥ 8192,8853,464
¥ 7,168
Foreign currencytranslation
adjustments and other
Balance, end of year
Balance, beginning of year Acquisition
Millions of Yen
As of March 31, 2004:
Transportation & Construction Systems . . . . . . . . . . . . . . . . .Media, Electronics & Network . . . . . . . . . . . . . . . . . . . . . . . . .Chemical . . . . . . . . . . . . . . . . . . . . . . . . . . . . . . . . . . . . . . . .Consumer Goods & Service . . . . . . . . . . . . . . . . . . . . . . . . . .Overseas Subsidiaries and Branches . . . . . . . . . . . . . . . . . . .
Total . . . . . . . . . . . . . . . . . . . . . . . . . . . . . . . . . . . . . . . . . .
$ 0—(2)—(3)
$ (5)
$ —9
428
72$ 131
$ 827——32
$ 67
$ 83640
898
$ 190
Foreign currencytranslation
adjustments and other
Balance, end of year
Balance, beginning of year Acquisition
$ ————(3)
$ (3)
Impairment losses
Millions of U.S. Dollars
As of March 31, 2005:
In accordance with SFAS No. 142, these goodwill were tested for impair-ment for the years ended March 31, 2005 and 2004. During the yearended March 31, 2005, the Companies recognized impairment loss of
¥292 million ($3 million), and this amount was included in “Impairmentlosses on long-lived assets” in the accompanying ConsolidatedStatements of Income.
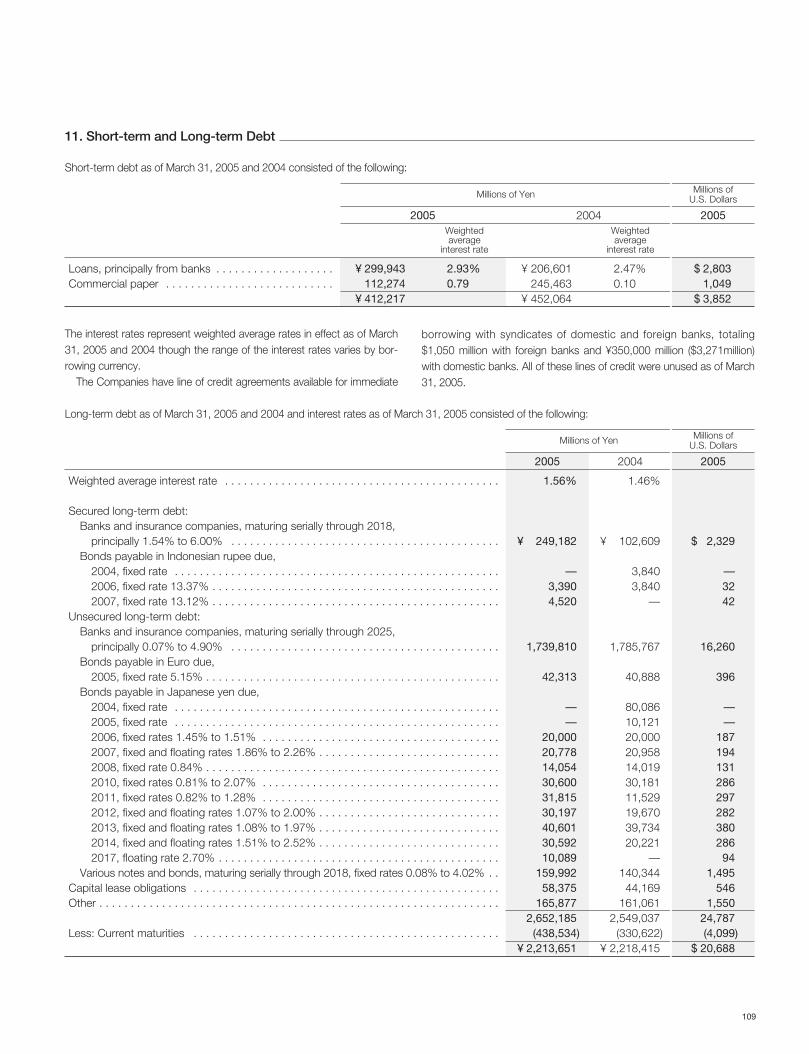
109
Weighted average
interest rate
11. Short-term and Long-term Debt
Short-term debt as of March 31, 2005 and 2004 consisted of the following:
Loans, principally from banks . . . . . . . . . . . . . . . . . . .Commercial paper . . . . . . . . . . . . . . . . . . . . . . . . . . .
2.93%0.79
¥ 206,601245,463
¥ 452,064
$ 2,8031,049
$ 3,852
¥ 299,943112,274
¥ 412,217
2005 2004
2.47%0.10
2005Weighted average
interest rate
Millions of Yen Millions of U.S. Dollars
The interest rates represent weighted average rates in effect as of March31, 2005 and 2004 though the range of the interest rates varies by bor-rowing currency.
The Companies have line of credit agreements available for immediate
borrowing with syndicates of domestic and foreign banks, totaling$1,050 million with foreign banks and ¥350,000 million ($3,271million)with domestic banks. All of these lines of credit were unused as of March31, 2005.
Long-term debt as of March 31, 2005 and 2004 and interest rates as of March 31, 2005 consisted of the following:
Weighted average interest rate . . . . . . . . . . . . . . . . . . . . . . . . . . . . . . . . . . . . . . . . . . . .
Secured long-term debt:Banks and insurance companies, maturing serially through 2018,
principally 1.54% to 6.00% . . . . . . . . . . . . . . . . . . . . . . . . . . . . . . . . . . . . . . . . . . .Bonds payable in Indonesian rupee due,
2004, fixed rate . . . . . . . . . . . . . . . . . . . . . . . . . . . . . . . . . . . . . . . . . . . . . . . . . . . .2006, fixed rate 13.37% . . . . . . . . . . . . . . . . . . . . . . . . . . . . . . . . . . . . . . . . . . . . . .2007, fixed rate 13.12% . . . . . . . . . . . . . . . . . . . . . . . . . . . . . . . . . . . . . . . . . . . . . .
Unsecured long-term debt:Banks and insurance companies, maturing serially through 2025,
principally 0.07% to 4.90% . . . . . . . . . . . . . . . . . . . . . . . . . . . . . . . . . . . . . . . . . . .Bonds payable in Euro due,
2005, fixed rate 5.15% . . . . . . . . . . . . . . . . . . . . . . . . . . . . . . . . . . . . . . . . . . . . . . .Bonds payable in Japanese yen due,
2004, fixed rate . . . . . . . . . . . . . . . . . . . . . . . . . . . . . . . . . . . . . . . . . . . . . . . . . . . .2005, fixed rate . . . . . . . . . . . . . . . . . . . . . . . . . . . . . . . . . . . . . . . . . . . . . . . . . . . .2006, fixed rates 1.45% to 1.51% . . . . . . . . . . . . . . . . . . . . . . . . . . . . . . . . . . . . . .2007, fixed and floating rates 1.86% to 2.26% . . . . . . . . . . . . . . . . . . . . . . . . . . . . .2008, fixed rate 0.84% . . . . . . . . . . . . . . . . . . . . . . . . . . . . . . . . . . . . . . . . . . . . . . .2010, fixed rates 0.81% to 2.07% . . . . . . . . . . . . . . . . . . . . . . . . . . . . . . . . . . . . . .2011, fixed rates 0.82% to 1.28% . . . . . . . . . . . . . . . . . . . . . . . . . . . . . . . . . . . . . .2012, fixed and floating rates 1.07% to 2.00% . . . . . . . . . . . . . . . . . . . . . . . . . . . . .2013, fixed and floating rates 1.08% to 1.97% . . . . . . . . . . . . . . . . . . . . . . . . . . . . .2014, fixed and floating rates 1.51% to 2.52% . . . . . . . . . . . . . . . . . . . . . . . . . . . . .2017, floating rate 2.70% . . . . . . . . . . . . . . . . . . . . . . . . . . . . . . . . . . . . . . . . . . . . .
Various notes and bonds, maturing serially through 2018, fixed rates 0.08% to 4.02% . .Capital lease obligations . . . . . . . . . . . . . . . . . . . . . . . . . . . . . . . . . . . . . . . . . . . . . . . . .Other . . . . . . . . . . . . . . . . . . . . . . . . . . . . . . . . . . . . . . . . . . . . . . . . . . . . . . . . . . . . . . . .
Less: Current maturities . . . . . . . . . . . . . . . . . . . . . . . . . . . . . . . . . . . . . . . . . . . . . . . . .
1.56%
¥ 249,182
—3,3904,520
1,739,810
42,313
——
20,00020,77814,05430,60031,81530,19740,60130,59210,089
159,99258,375
165,8772,652,185
(438,534)¥ 2,213,651
1.46%
¥ 102,609
3,8403,840
—
1,785,767
40,888
80,08610,12120,00020,95814,01930,18111,52919,67039,73420,221
—140,344
44,169161,061
2,549,037(330,622)
¥ 2,218,415
$ 2,329
—3242
16,260
396
——
187194131286297282380286
941,495
5461,550
24,787(4,099)
$ 20,688
20052005 2004
Millions of Yen Millions ofU.S. Dollars

110 Sumitomo Corporation Annual Report 2005
2006 . . . . . . . . . . . . . . . . . . . . . . . . . . . . . . . . . . . . . . . . . . . . . . . . . . . . . . . . . . . . . . . . . . . . . . . . . . . . .2007 . . . . . . . . . . . . . . . . . . . . . . . . . . . . . . . . . . . . . . . . . . . . . . . . . . . . . . . . . . . . . . . . . . . . . . . . . . . . .2008 . . . . . . . . . . . . . . . . . . . . . . . . . . . . . . . . . . . . . . . . . . . . . . . . . . . . . . . . . . . . . . . . . . . . . . . . . . . . .2009 . . . . . . . . . . . . . . . . . . . . . . . . . . . . . . . . . . . . . . . . . . . . . . . . . . . . . . . . . . . . . . . . . . . . . . . . . . . . .2010 . . . . . . . . . . . . . . . . . . . . . . . . . . . . . . . . . . . . . . . . . . . . . . . . . . . . . . . . . . . . . . . . . . . . . . . . . . . . .2011 and thereafter . . . . . . . . . . . . . . . . . . . . . . . . . . . . . . . . . . . . . . . . . . . . . . . . . . . . . . . . . . . . . . . . . .
Total . . . . . . . . . . . . . . . . . . . . . . . . . . . . . . . . . . . . . . . . . . . . . . . . . . . . . . . . . . . . . . . . . . . . . . . . . .
¥ 438,534457,397436,498282,983255,791780,982
¥ 2,652,185
$ 4,0994,2754,0792,6452,3917,298
$ 24,787
Millions of Yen Millions ofU.S. DollarsYear ending March 31,
Annual maturities of long-term debt as of March 31, 2005 are as follows:
Most of short-term and long-term loans from banks contain certaincovenants. The banks may, under certain conditions, require theCompanies to provide collateral (or additional collateral) or guarantors.The banks may treat any collateral as collateral for all indebtedness tosuch banks. Several of the loan agreements require maintenance of cer-tain financial ratios and minimum levels of tangible net worth. Default pro-visions of certain agreements grant certain rights of possession to thebanks. The borrower may be required to make early repayments of out-standing amounts under some agreements, principally with government-owned financial institutions, if the lender concludes that the borrower isable to repay the outstanding amount through improved earnings or from
the proceeds of an equity or debt offering, and makes such prepaymentrequest. Certain agreements provide that the banks may require the bor-rower to receive bank approval prior to the payment of dividends andother appropriations of earnings, before presentation to the shareholders.The Companies have not been asked to make any such prepaymentduring the years ended March 31, 2005, 2004 and 2003 and currentlydo not anticipate any prepayment request.
The Companies have been in compliance with all of the short-termborrowing and long-term debt obligation covenants for the years endedMarch 31, 2005, 2004 and 2003.
Pledged assetsThe following table summarizes the book value of assets pledged as collateral for short-term debt, other current liabilities and long-term debt, includingcurrent maturities of long-term debt of the Companies as of March 31, 2005:
Marketable securities and investments . . . . . . . . . . . . . . . . . . . . . . . . . . . . . . . . . . . . . . . . . . . . . . . . . . . .Trade receivables and long-term receivables . . . . . . . . . . . . . . . . . . . . . . . . . . . . . . . . . . . . . . . . . . . . . . .Property and equipment, net . . . . . . . . . . . . . . . . . . . . . . . . . . . . . . . . . . . . . . . . . . . . . . . . . . . . . . . . . . .
¥ 58,932226,456
93,325¥ 378,713
$ 5512,116
872$ 3,539
Millions of Yen Millions ofU.S. Dollars
Such collateral secured the following obligations:
Short-term debt . . . . . . . . . . . . . . . . . . . . . . . . . . . . . . . . . . . . . . . . . . . . . . . . . . . . . . . . . . . . . . . . . . . . .Other current liabilities . . . . . . . . . . . . . . . . . . . . . . . . . . . . . . . . . . . . . . . . . . . . . . . . . . . . . . . . . . . . . . . .Long-term debt, including current maturities of long-term debt . . . . . . . . . . . . . . . . . . . . . . . . . . . . . . . . .
¥ 9,31710,349
282,369¥ 302,035
$ 8797
2,639$ 2,823
Millions of Yen Millions ofU.S. Dollars
Trust receipts issued under customary import financing arrangementsgive recipient banks a security interest in the merchandise importedand/or the accounts receivable or sales proceeds resulting from the saleof such merchandise. The Companies repay the related notes and
acceptances payable at the maturity dates without applying the salesproceeds to specific notes or acceptances. The large number of transac-tions makes it impracticable to determine the aggregate amounts ofassets covered by outstanding trust receipts.
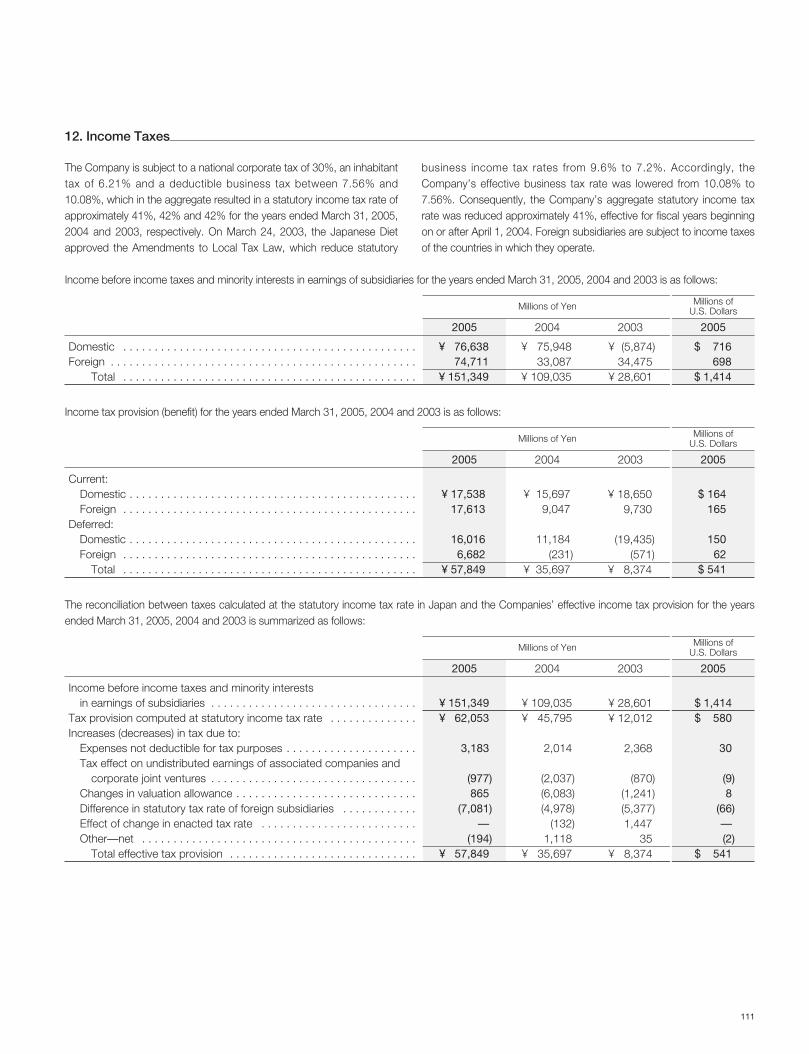
111
12. Income Taxes
The Company is subject to a national corporate tax of 30%, an inhabitanttax of 6.21% and a deductible business tax between 7.56% and10.08%, which in the aggregate resulted in a statutory income tax rate ofapproximately 41%, 42% and 42% for the years ended March 31, 2005,2004 and 2003, respectively. On March 24, 2003, the Japanese Dietapproved the Amendments to Local Tax Law, which reduce statutory
business income tax rates from 9.6% to 7.2%. Accordingly, theCompany’s effective business tax rate was lowered from 10.08% to7.56%. Consequently, the Company’s aggregate statutory income taxrate was reduced approximately 41%, effective for fiscal years beginningon or after April 1, 2004. Foreign subsidiaries are subject to income taxesof the countries in which they operate.
Domestic . . . . . . . . . . . . . . . . . . . . . . . . . . . . . . . . . . . . . . . . . . . . . . .Foreign . . . . . . . . . . . . . . . . . . . . . . . . . . . . . . . . . . . . . . . . . . . . . . . . .
Total . . . . . . . . . . . . . . . . . . . . . . . . . . . . . . . . . . . . . . . . . . . . . . .
¥ 76,63874,711
¥ 151,349
¥ 75,94833,087
¥ 109,035
$ 716698
$ 1,414
20052005 2004
¥ (5,874)34,475
¥ 28,601
2003
Millions of Yen Millions ofU.S. Dollars
Income before income taxes and minority interests in earnings of subsidiaries for the years ended March 31, 2005, 2004 and 2003 is as follows:
Current:Domestic . . . . . . . . . . . . . . . . . . . . . . . . . . . . . . . . . . . . . . . . . . . . . .Foreign . . . . . . . . . . . . . . . . . . . . . . . . . . . . . . . . . . . . . . . . . . . . . . .
Deferred: Domestic . . . . . . . . . . . . . . . . . . . . . . . . . . . . . . . . . . . . . . . . . . . . . .Foreign . . . . . . . . . . . . . . . . . . . . . . . . . . . . . . . . . . . . . . . . . . . . . . .
Total . . . . . . . . . . . . . . . . . . . . . . . . . . . . . . . . . . . . . . . . . . . . . . .
¥ 17,53817,613
16,0166,682
¥ 57,849
¥ 15,6979,047
11,184(231)
¥ 35,697
$ 164165
15062
$ 541
20052005 2004
¥ 18,6509,730
(19,435)(571)
¥ 8,374
2003
Millions of Yen Millions ofU.S. Dollars
Income tax provision (benefit) for the years ended March 31, 2005, 2004 and 2003 is as follows:
The reconciliation between taxes calculated at the statutory income tax rate in Japan and the Companies’ effective income tax provision for the yearsended March 31, 2005, 2004 and 2003 is summarized as follows:
Income before income taxes and minority interests in earnings of subsidiaries . . . . . . . . . . . . . . . . . . . . . . . . . . . . . . . . .
Tax provision computed at statutory income tax rate . . . . . . . . . . . . . .Increases (decreases) in tax due to:
Expenses not deductible for tax purposes . . . . . . . . . . . . . . . . . . . . .Tax effect on undistributed earnings of associated companies and
corporate joint ventures . . . . . . . . . . . . . . . . . . . . . . . . . . . . . . . . .Changes in valuation allowance . . . . . . . . . . . . . . . . . . . . . . . . . . . . .Difference in statutory tax rate of foreign subsidiaries . . . . . . . . . . . .Effect of change in enacted tax rate . . . . . . . . . . . . . . . . . . . . . . . . .Other—net . . . . . . . . . . . . . . . . . . . . . . . . . . . . . . . . . . . . . . . . . . . .
Total effective tax provision . . . . . . . . . . . . . . . . . . . . . . . . . . . . . .
¥ 151,349¥ 62,053
3,183
(977)865
(7,081)—
(194)¥ 57,849
¥ 109,035¥ 45,795
2,014
(2,037)(6,083)(4,978)
(132) 1,118
¥ 35,697
$ 1,414$ 580
30
(9)8
(66)—(2)
$ 541
20052005 2004
¥ 28,601¥ 12,012
2,368
(870)(1,241)(5,377)1,447
35¥ 8,374
2003
Millions of Yen Millions ofU.S. Dollars
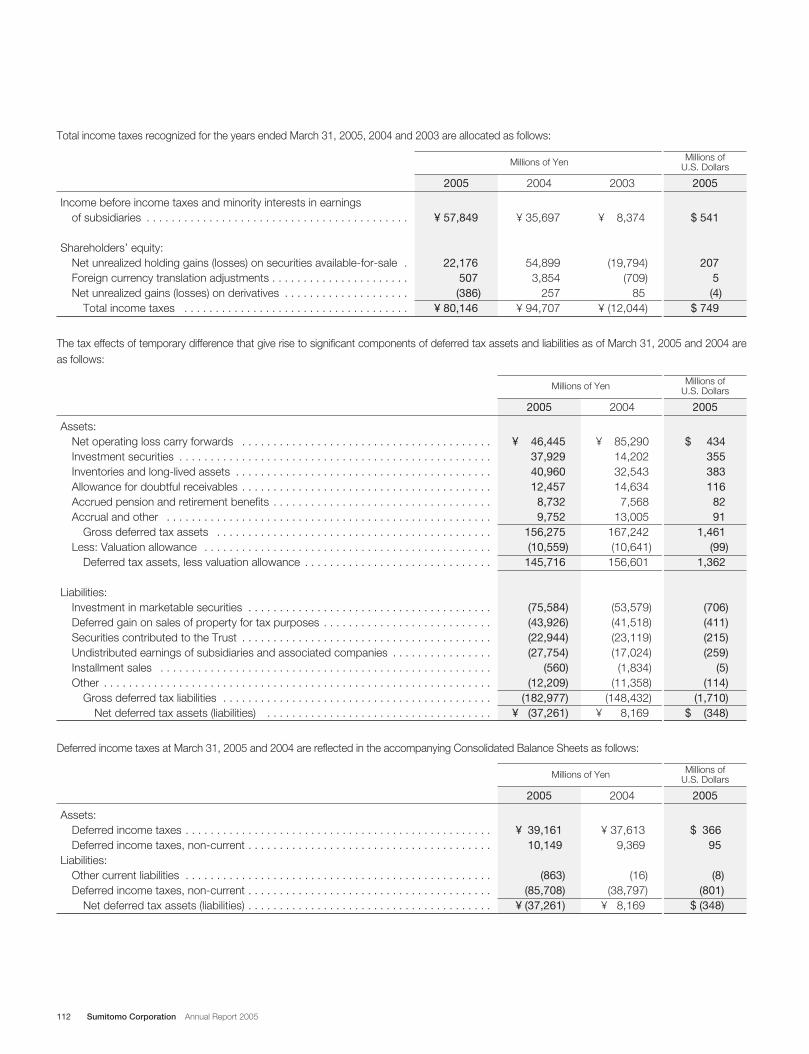
112 Sumitomo Corporation Annual Report 2005
The tax effects of temporary difference that give rise to significant components of deferred tax assets and liabilities as of March 31, 2005 and 2004 areas follows:
Assets:Net operating loss carry forwards . . . . . . . . . . . . . . . . . . . . . . . . . . . . . . . . . . . . . . . .Investment securities . . . . . . . . . . . . . . . . . . . . . . . . . . . . . . . . . . . . . . . . . . . . . . . . . .Inventories and long-lived assets . . . . . . . . . . . . . . . . . . . . . . . . . . . . . . . . . . . . . . . . .Allowance for doubtful receivables . . . . . . . . . . . . . . . . . . . . . . . . . . . . . . . . . . . . . . . .Accrued pension and retirement benefits . . . . . . . . . . . . . . . . . . . . . . . . . . . . . . . . . . .Accrual and other . . . . . . . . . . . . . . . . . . . . . . . . . . . . . . . . . . . . . . . . . . . . . . . . . . . .
Gross deferred tax assets . . . . . . . . . . . . . . . . . . . . . . . . . . . . . . . . . . . . . . . . . . . .Less: Valuation allowance . . . . . . . . . . . . . . . . . . . . . . . . . . . . . . . . . . . . . . . . . . . . . .
Deferred tax assets, less valuation allowance . . . . . . . . . . . . . . . . . . . . . . . . . . . . . .
Liabilities:Investment in marketable securities . . . . . . . . . . . . . . . . . . . . . . . . . . . . . . . . . . . . . . .Deferred gain on sales of property for tax purposes . . . . . . . . . . . . . . . . . . . . . . . . . . .Securities contributed to the Trust . . . . . . . . . . . . . . . . . . . . . . . . . . . . . . . . . . . . . . . .Undistributed earnings of subsidiaries and associated companies . . . . . . . . . . . . . . . .Installment sales . . . . . . . . . . . . . . . . . . . . . . . . . . . . . . . . . . . . . . . . . . . . . . . . . . . . .Other . . . . . . . . . . . . . . . . . . . . . . . . . . . . . . . . . . . . . . . . . . . . . . . . . . . . . . . . . . . . . .
Gross deferred tax liabilities . . . . . . . . . . . . . . . . . . . . . . . . . . . . . . . . . . . . . . . . . . .Net deferred tax assets (liabilities) . . . . . . . . . . . . . . . . . . . . . . . . . . . . . . . . . . . .
¥ 46,44537,92940,96012,457
8,7329,752
156,275(10,559)
145,716
(75,584)(43,926)(22,944)(27,754)
(560)(12,209)
(182,977)¥ (37,261)
¥ 85,29014,20232,54314,634
7,56813,005
167,242(10,641)
156,601
(53,579)(41,518)(23,119)(17,024)
(1,834)(11,358)
(148,432)¥ 8,169
$ 434355383116
8291
1,461(99)
1,362
(706)(411)(215)(259)
(5)(114)
(1,710)$ (348)
20052005 2004
Millions of Yen Millions ofU.S. Dollars
Deferred income taxes at March 31, 2005 and 2004 are reflected in the accompanying Consolidated Balance Sheets as follows:
Assets:Deferred income taxes . . . . . . . . . . . . . . . . . . . . . . . . . . . . . . . . . . . . . . . . . . . . . . . . .Deferred income taxes, non-current . . . . . . . . . . . . . . . . . . . . . . . . . . . . . . . . . . . . . . .
Liabilities:Other current liabilities . . . . . . . . . . . . . . . . . . . . . . . . . . . . . . . . . . . . . . . . . . . . . . . . .Deferred income taxes, non-current . . . . . . . . . . . . . . . . . . . . . . . . . . . . . . . . . . . . . . .
Net deferred tax assets (liabilities) . . . . . . . . . . . . . . . . . . . . . . . . . . . . . . . . . . . . . . .
¥ 39,16110,149
(863)(85,708)
¥ (37,261)
¥ 37,6139,369
(16)(38,797)
¥ 8,169
$ 36695
(8)(801)
$ (348)
20052005 2004
Millions of Yen Millions ofU.S. Dollars
Total income taxes recognized for the years ended March 31, 2005, 2004 and 2003 are allocated as follows:
Income before income taxes and minority interests in earnings of subsidiaries . . . . . . . . . . . . . . . . . . . . . . . . . . . . . . . . . . . . . . . . . .
Shareholders’ equity:Net unrealized holding gains (losses) on securities available-for-sale .Foreign currency translation adjustments . . . . . . . . . . . . . . . . . . . . . .Net unrealized gains (losses) on derivatives . . . . . . . . . . . . . . . . . . . .
Total income taxes . . . . . . . . . . . . . . . . . . . . . . . . . . . . . . . . . . . .
¥ 57,849
22,176507(386)
¥ 80,146
¥ 35,697
54,8993,854
257¥ 94,707
$ 541
2075(4)
$ 749
20052005 2004
¥ 8,374
(19,794)(709)
85¥ (12,044)
2003
Millions of Yen Millions ofU.S. Dollars
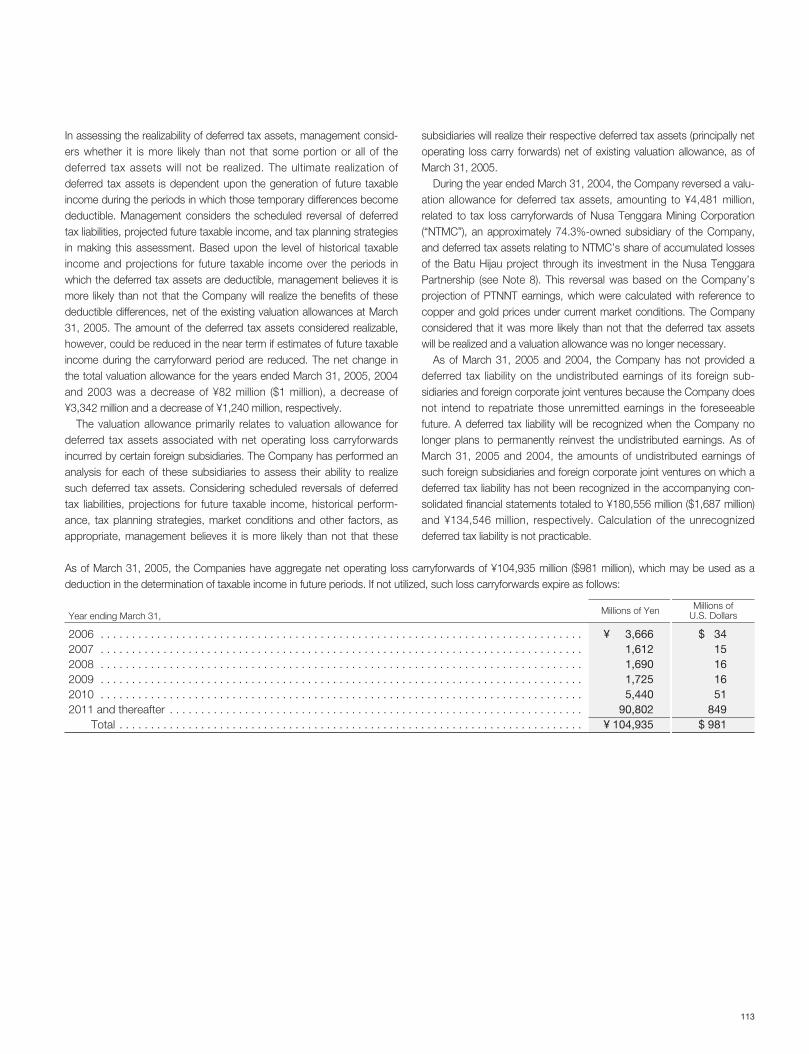
113
In assessing the realizability of deferred tax assets, management consid-ers whether it is more likely than not that some portion or all of thedeferred tax assets will not be realized. The ultimate realization ofdeferred tax assets is dependent upon the generation of future taxableincome during the periods in which those temporary differences becomedeductible. Management considers the scheduled reversal of deferredtax liabilities, projected future taxable income, and tax planning strategiesin making this assessment. Based upon the level of historical taxableincome and projections for future taxable income over the periods inwhich the deferred tax assets are deductible, management believes it ismore likely than not that the Company will realize the benefits of thesedeductible differences, net of the existing valuation allowances at March31, 2005. The amount of the deferred tax assets considered realizable,however, could be reduced in the near term if estimates of future taxableincome during the carryforward period are reduced. The net change inthe total valuation allowance for the years ended March 31, 2005, 2004and 2003 was a decrease of ¥82 million ($1 million), a decrease of¥3,342 million and a decrease of ¥1,240 million, respectively.
The valuation allowance primarily relates to valuation allowance fordeferred tax assets associated with net operating loss carryforwardsincurred by certain foreign subsidiaries. The Company has performed ananalysis for each of these subsidiaries to assess their ability to realizesuch deferred tax assets. Considering scheduled reversals of deferredtax liabilities, projections for future taxable income, historical perform-ance, tax planning strategies, market conditions and other factors, asappropriate, management believes it is more likely than not that these
subsidiaries will realize their respective deferred tax assets (principally netoperating loss carry forwards) net of existing valuation allowance, as ofMarch 31, 2005.
During the year ended March 31, 2004, the Company reversed a valu-ation allowance for deferred tax assets, amounting to ¥4,481 million,related to tax loss carryforwards of Nusa Tenggara Mining Corporation(“NTMC”), an approximately 74.3%-owned subsidiary of the Company,and deferred tax assets relating to NTMC’s share of accumulated lossesof the Batu Hijau project through its investment in the Nusa TenggaraPartnership (see Note 8). This reversal was based on the Company’sprojection of PTNNT earnings, which were calculated with reference tocopper and gold prices under current market conditions. The Companyconsidered that it was more likely than not that the deferred tax assetswill be realized and a valuation allowance was no longer necessary.
As of March 31, 2005 and 2004, the Company has not provided adeferred tax liability on the undistributed earnings of its foreign sub-sidiaries and foreign corporate joint ventures because the Company doesnot intend to repatriate those unremitted earnings in the foreseeablefuture. A deferred tax liability will be recognized when the Company nolonger plans to permanently reinvest the undistributed earnings. As ofMarch 31, 2005 and 2004, the amounts of undistributed earnings ofsuch foreign subsidiaries and foreign corporate joint ventures on which adeferred tax liability has not been recognized in the accompanying con-solidated financial statements totaled to ¥180,556 million ($1,687 million)and ¥134,546 million, respectively. Calculation of the unrecognizeddeferred tax liability is not practicable.
2006 . . . . . . . . . . . . . . . . . . . . . . . . . . . . . . . . . . . . . . . . . . . . . . . . . . . . . . . . . . . . . . . . . . . . . . . . . . . . .2007 . . . . . . . . . . . . . . . . . . . . . . . . . . . . . . . . . . . . . . . . . . . . . . . . . . . . . . . . . . . . . . . . . . . . . . . . . . . . .2008 . . . . . . . . . . . . . . . . . . . . . . . . . . . . . . . . . . . . . . . . . . . . . . . . . . . . . . . . . . . . . . . . . . . . . . . . . . . . .2009 . . . . . . . . . . . . . . . . . . . . . . . . . . . . . . . . . . . . . . . . . . . . . . . . . . . . . . . . . . . . . . . . . . . . . . . . . . . . .2010 . . . . . . . . . . . . . . . . . . . . . . . . . . . . . . . . . . . . . . . . . . . . . . . . . . . . . . . . . . . . . . . . . . . . . . . . . . . . .2011 and thereafter . . . . . . . . . . . . . . . . . . . . . . . . . . . . . . . . . . . . . . . . . . . . . . . . . . . . . . . . . . . . . . . . . .
Total . . . . . . . . . . . . . . . . . . . . . . . . . . . . . . . . . . . . . . . . . . . . . . . . . . . . . . . . . . . . . . . . . . . . . . . . . .
¥ 3,6661,6121,6901,7255,440
90,802¥ 104,935
$ 3415161651
849$ 981
Millions of Yen Millions ofU.S. DollarsYear ending March 31,
As of March 31, 2005, the Companies have aggregate net operating loss carryforwards of ¥104,935 million ($981 million), which may be used as adeduction in the determination of taxable income in future periods. If not utilized, such loss carryforwards expire as follows:
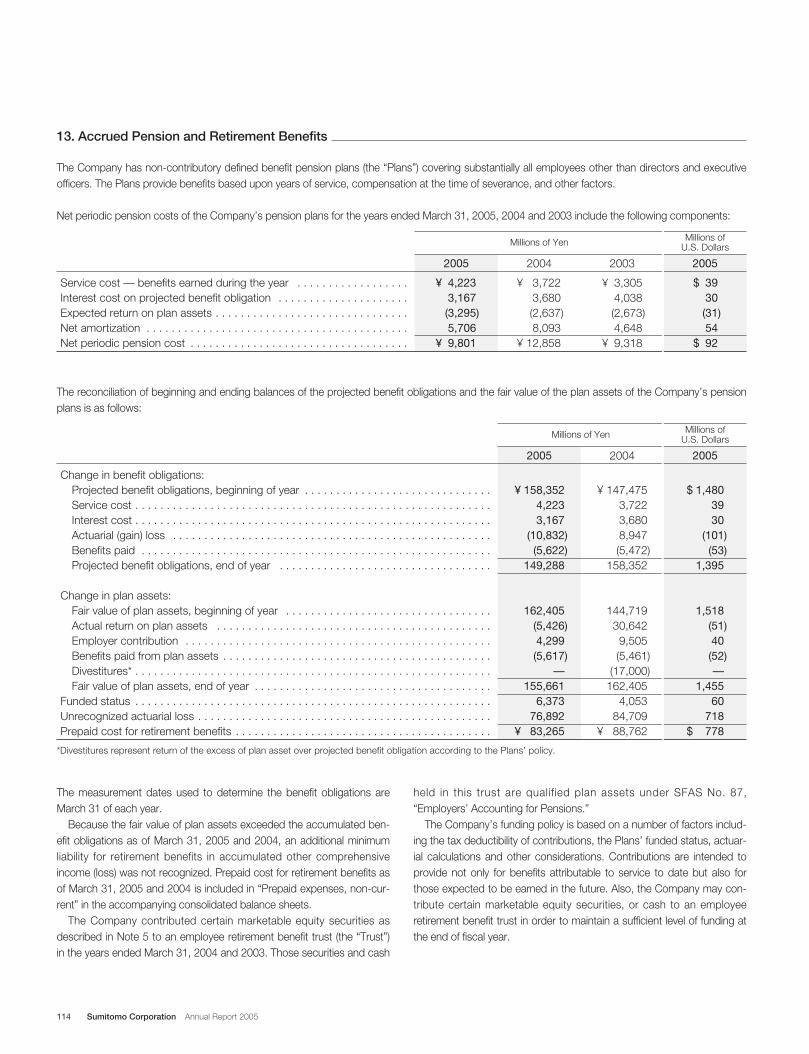
114 Sumitomo Corporation Annual Report 2005
The reconciliation of beginning and ending balances of the projected benefit obligations and the fair value of the plan assets of the Company’s pensionplans is as follows:
Change in benefit obligations:Projected benefit obligations, beginning of year . . . . . . . . . . . . . . . . . . . . . . . . . . . . . .Service cost . . . . . . . . . . . . . . . . . . . . . . . . . . . . . . . . . . . . . . . . . . . . . . . . . . . . . . . . .Interest cost . . . . . . . . . . . . . . . . . . . . . . . . . . . . . . . . . . . . . . . . . . . . . . . . . . . . . . . . .Actuarial (gain) loss . . . . . . . . . . . . . . . . . . . . . . . . . . . . . . . . . . . . . . . . . . . . . . . . . . .Benefits paid . . . . . . . . . . . . . . . . . . . . . . . . . . . . . . . . . . . . . . . . . . . . . . . . . . . . . . . .Projected benefit obligations, end of year . . . . . . . . . . . . . . . . . . . . . . . . . . . . . . . . . .
Change in plan assets:Fair value of plan assets, beginning of year . . . . . . . . . . . . . . . . . . . . . . . . . . . . . . . . .Actual return on plan assets . . . . . . . . . . . . . . . . . . . . . . . . . . . . . . . . . . . . . . . . . . . .Employer contribution . . . . . . . . . . . . . . . . . . . . . . . . . . . . . . . . . . . . . . . . . . . . . . . . .Benefits paid from plan assets . . . . . . . . . . . . . . . . . . . . . . . . . . . . . . . . . . . . . . . . . . .Divestitures* . . . . . . . . . . . . . . . . . . . . . . . . . . . . . . . . . . . . . . . . . . . . . . . . . . . . . . . . .Fair value of plan assets, end of year . . . . . . . . . . . . . . . . . . . . . . . . . . . . . . . . . . . . . .
Funded status . . . . . . . . . . . . . . . . . . . . . . . . . . . . . . . . . . . . . . . . . . . . . . . . . . . . . . . . .Unrecognized actuarial loss . . . . . . . . . . . . . . . . . . . . . . . . . . . . . . . . . . . . . . . . . . . . . . .Prepaid cost for retirement benefits . . . . . . . . . . . . . . . . . . . . . . . . . . . . . . . . . . . . . . . . .
¥ 158,3524,2233,167
(10,832)(5,622)
149,288
162,405(5,426)4,299(5,617)
—155,661
6,37376,892
¥ 83,265
¥ 147,4753,7223,6808,947(5,472)
158,352
144,71930,642
9,505(5,461)
(17,000)162,405
4,05384,709
¥ 88,762
$ 1,4803930
(101)(53)
1,395
1,518(51)40(52)—
1,45560
718$ 778
20052005 2004
Millions of Yen Millions ofU.S. Dollars
*Divestitures represent return of the excess of plan asset over projected benefit obligation according to the Plans’ policy.
The measurement dates used to determine the benefit obligations areMarch 31 of each year.
Because the fair value of plan assets exceeded the accumulated ben-efit obligations as of March 31, 2005 and 2004, an additional minimumliability for retirement benefits in accumulated other comprehensiveincome (loss) was not recognized. Prepaid cost for retirement benefits asof March 31, 2005 and 2004 is included in “Prepaid expenses, non-cur-rent” in the accompanying consolidated balance sheets.
The Company contributed certain marketable equity securities asdescribed in Note 5 to an employee retirement benefit trust (the “Trust”)in the years ended March 31, 2004 and 2003. Those securities and cash
held in this trust are qualified plan assets under SFAS No. 87,“Employers’ Accounting for Pensions.”
The Company’s funding policy is based on a number of factors includ-ing the tax deductibility of contributions, the Plans’ funded status, actuar-ial calculations and other considerations. Contributions are intended toprovide not only for benefits attributable to service to date but also forthose expected to be earned in the future. Also, the Company may con-tribute certain marketable equity securities, or cash to an employeeretirement benefit trust in order to maintain a sufficient level of funding atthe end of fiscal year.
13. Accrued Pension and Retirement Benefits
The Company has non-contributory defined benefit pension plans (the “Plans”) covering substantially all employees other than directors and executiveofficers. The Plans provide benefits based upon years of service, compensation at the time of severance, and other factors.
Net periodic pension costs of the Company’s pension plans for the years ended March 31, 2005, 2004 and 2003 include the following components:
Service cost — benefits earned during the year . . . . . . . . . . . . . . . . . .Interest cost on projected benefit obligation . . . . . . . . . . . . . . . . . . . . .Expected return on plan assets . . . . . . . . . . . . . . . . . . . . . . . . . . . . . . .Net amortization . . . . . . . . . . . . . . . . . . . . . . . . . . . . . . . . . . . . . . . . . .Net periodic pension cost . . . . . . . . . . . . . . . . . . . . . . . . . . . . . . . . . . .
¥ 4,2233,167(3,295)5,706
¥ 9,801
¥ 3,7223,680(2,637)8,093
¥ 12,858
$ 3930(31)54
$ 92
20052005 2004
¥ 3,3054,038(2,673)4,648
¥ 9,318
2003
Millions of Yen Millions ofU.S. Dollars
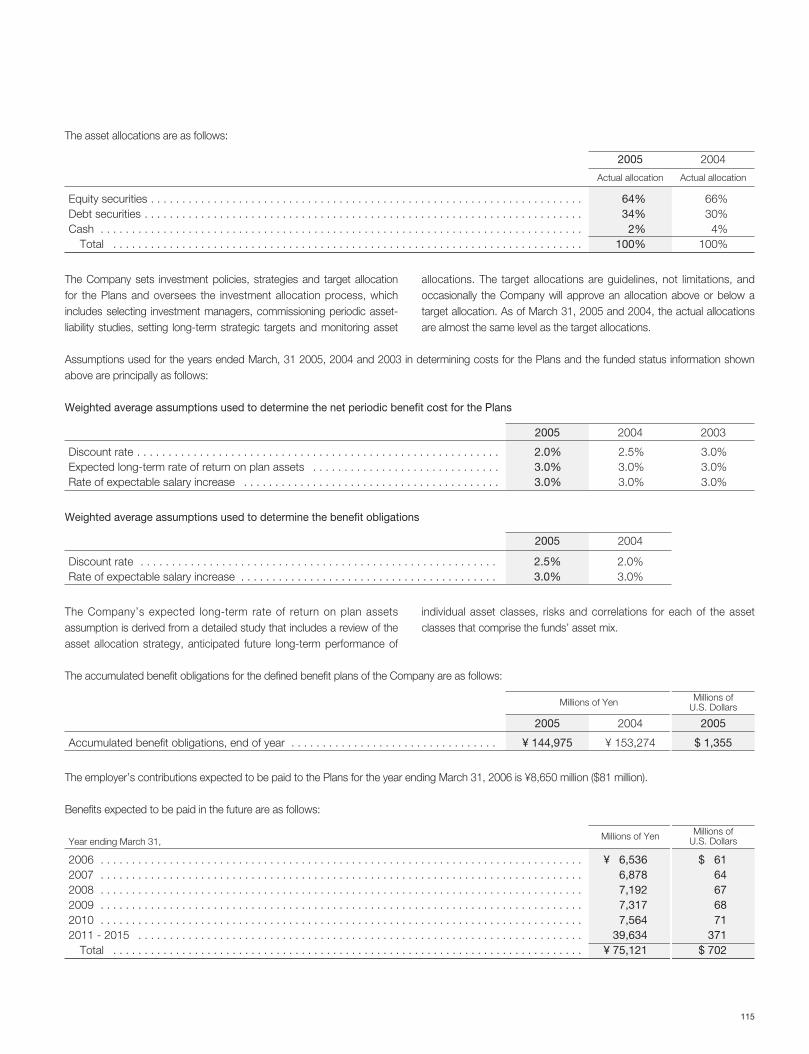
115
The asset allocations are as follows:
Equity securities . . . . . . . . . . . . . . . . . . . . . . . . . . . . . . . . . . . . . . . . . . . . . . . . . . . . . . . . . . . . . . . . . . . . .Debt securities . . . . . . . . . . . . . . . . . . . . . . . . . . . . . . . . . . . . . . . . . . . . . . . . . . . . . . . . . . . . . . . . . . . . . .Cash . . . . . . . . . . . . . . . . . . . . . . . . . . . . . . . . . . . . . . . . . . . . . . . . . . . . . . . . . . . . . . . . . . . . . . . . . . . . .
Total . . . . . . . . . . . . . . . . . . . . . . . . . . . . . . . . . . . . . . . . . . . . . . . . . . . . . . . . . . . . . . . . . . . . . . . . . . .
64%34%
2%100%
66%30%
4%100%
2005 2004
Actual allocation Actual allocation
The Company sets investment policies, strategies and target allocationfor the Plans and oversees the investment allocation process, whichincludes selecting investment managers, commissioning periodic asset-liability studies, setting long-term strategic targets and monitoring asset
allocations. The target allocations are guidelines, not limitations, andoccasionally the Company will approve an allocation above or below atarget allocation. As of March 31, 2005 and 2004, the actual allocationsare almost the same level as the target allocations.
Assumptions used for the years ended March, 31 2005, 2004 and 2003 in determining costs for the Plans and the funded status information shownabove are principally as follows:
Weighted average assumptions used to determine the net periodic benefit cost for the Plans
Discount rate . . . . . . . . . . . . . . . . . . . . . . . . . . . . . . . . . . . . . . . . . . . . . . . . . . . . . . . . . .Expected long-term rate of return on plan assets . . . . . . . . . . . . . . . . . . . . . . . . . . . . . .Rate of expectable salary increase . . . . . . . . . . . . . . . . . . . . . . . . . . . . . . . . . . . . . . . . .
2.0%3.0%3.0%
2.5%3.0%3.0%
3.0%3.0%3.0%
20032005 2004
Discount rate . . . . . . . . . . . . . . . . . . . . . . . . . . . . . . . . . . . . . . . . . . . . . . . . . . . . . . . . .Rate of expectable salary increase . . . . . . . . . . . . . . . . . . . . . . . . . . . . . . . . . . . . . . . . .
2.5%3.0%
2.0%3.0%
2005 2004
Weighted average assumptions used to determine the benefit obligations
The Company’s expected long-term rate of return on plan assetsassumption is derived from a detailed study that includes a review of theasset allocation strategy, anticipated future long-term performance of
individual asset classes, risks and correlations for each of the assetclasses that comprise the funds’ asset mix.
The accumulated benefit obligations for the defined benefit plans of the Company are as follows:
Accumulated benefit obligations, end of year . . . . . . . . . . . . . . . . . . . . . . . . . . . . . . . . . ¥ 144,975 ¥ 153,274 $ 1,355
20052005 2004
Millions of Yen Millions ofU.S. Dollars
2006 . . . . . . . . . . . . . . . . . . . . . . . . . . . . . . . . . . . . . . . . . . . . . . . . . . . . . . . . . . . . . . . . . . . . . . . . . . . . .2007 . . . . . . . . . . . . . . . . . . . . . . . . . . . . . . . . . . . . . . . . . . . . . . . . . . . . . . . . . . . . . . . . . . . . . . . . . . . . .2008 . . . . . . . . . . . . . . . . . . . . . . . . . . . . . . . . . . . . . . . . . . . . . . . . . . . . . . . . . . . . . . . . . . . . . . . . . . . . .2009 . . . . . . . . . . . . . . . . . . . . . . . . . . . . . . . . . . . . . . . . . . . . . . . . . . . . . . . . . . . . . . . . . . . . . . . . . . . . .2010 . . . . . . . . . . . . . . . . . . . . . . . . . . . . . . . . . . . . . . . . . . . . . . . . . . . . . . . . . . . . . . . . . . . . . . . . . . . . .2011 - 2015 . . . . . . . . . . . . . . . . . . . . . . . . . . . . . . . . . . . . . . . . . . . . . . . . . . . . . . . . . . . . . . . . . . . . . . .
Total . . . . . . . . . . . . . . . . . . . . . . . . . . . . . . . . . . . . . . . . . . . . . . . . . . . . . . . . . . . . . . . . . . . . . . . . . . .
¥ 6,5366,8787,1927,3177,564
39,634¥ 75,121
$ 6164676871
371$ 702
Millions of Yen Millions ofU.S. DollarsYear ending March 31,
The employer’s contributions expected to be paid to the Plans for the year ending March 31, 2006 is ¥8,650 million ($81 million).
Benefits expected to be paid in the future are as follows:
116 Sumitomo Corporation Annual Report 2005
Most of the subsidiaries have unfunded retirement benefit plans and/orfunded pension plans. Employees, other than directors, are entitled to,under most circumstances, upon mandatory retirement at normal retire-ment age or earlier termination of employment, lump-sum retirementbenefits based on compensation at the time of retirement, years of serv-ice and other factors. As of March 31, 2005 and 2004, the benefit obliga-tion of subsidiaries under these plans were ¥39,636 million ($370 million)at a discount rate of mainly 2.8% and at an expectable salary increaserate of mainly 1.8% and ¥32,653 million at a discount rate of mainly 2.5%and at an expectable salary increase rate of mainly 1.5%, which wereapproximately equal to the aggregated fair value of plan assets andaccrued pension and retirement benefits.
The total amounts charged to income by subsidiaries for the yearsended March 31, 2005, 2004 and 2003 were ¥4,489 million ($42 million),¥4,932 million and ¥3,746 million, respectively.
In addition to unfunded retirement benefit plans or funded pensionplans, certain domestic subsidiaries and associated companies also par-ticipate in a multiemployer defined benefit pension plan, recognizing therequired contributions for a period as net pension cost and recognizingany contributions due and unpaid as a liability. The total amount of thedomestic subsidiaries’ contributions to the plan for the years endedMarch 31, 2005, 2004 and 2003 were ¥823 million ($8 million), ¥1,431million and ¥1,589 million, respectively.
14. Shareholders’ Equity
(a) Common Stock and Additional Paid-in CapitalUnder the Commercial Code of Japan (“the Code”), at least 50% of theproceeds of certain issues of common shares, including exercise of war-rants, shall be credited to the common stock account. The remainder ofthe proceeds shall be credited to the additional paid-in capital. The Codepermits, upon approval of the Board of Directors, transfer of amountsfrom additional paid-in capital to the common stock account.
(b) Appropriated for Legal ReserveThe Code provides that at least 10% of all cash dividend payments andbonuses to directors, made as an appropriation of retained earningsapplicable to each fiscal period, shall be appropriated as a legal reserveuntil an aggregate amount of additional paid-in capital and legal reserveequals 25% of common stock. The legal reserve may be used to elimi-nate or reduce a deficit, transferred to common stock, or transferred toretained earnings until an aggregate amount of additional paid-in capitaland the legal reserve equals 25% of common stock, by resolution of theshareholders.
(c) Unappropriated Retained Earnings and DividendsRetained earnings available for dividends under the Code is based on theamount recorded in the Company’s general accounting records main-tained in accordance with accounting principles generally accepted inJapan. The U.S. GAAP adjustments included in the accompanying con-solidated financial statements but not recorded in the general accountingrecords, as explained under “Summary of Significant Accounting Policies”in Note 2, have no effect in determining retained earnings available for divi-dends under the Code.
The Code limits the amount of retained earnings available for divi-dends. Retained earnings of ¥154,177 million ($1,441 million) and¥148,392 million, shown by the Company’s accounting records as ofMarch 31, 2005 and 2004, respectively, exclusive of the amount previ-ously appropriated for legal reserve, were not restricted by the limitationsunder the Code.
The Code permits transfers, upon shareholder approval, of a portion ofunappropriated retained earnings available for dividends to commonstock without issuance of any shares.
Dividends are approved by the shareholders at the meeting held sub-sequent to the statutory fiscal period to which the dividends are payableto shareholders. Interim dividends are approved by the Board ofDirectors for the interim six-month period. Dividends are reported in theaccompanying Consolidated Statements of Shareholders’ Equity andComprehensive Income when approved.
The Board of Directors intends to recommend to the shareholders, atthe general meeting to be held on June 24, 2005, the declaration of acash dividend to shareholders of record as of March 31, 2005 of ¥7($0.07) per share for a total of ¥8,427 million ($79 million).
(d) Stock Option PlanThe Company has stock option plans for directors, executive officers ofthe Company, and corporate officers under the Company’s qualificationsystem. Under the plans, each stock option granted entitles the recipientto acquire 1,000 shares of common stock at an exercise price equal tothe greater of ( i ) 105% of the average closing market price of theCompany’s common stock on the Tokyo Stock Exchange for the calen-dar month before the grant date (excluding days when there were notransactions), or ( ii ) the closing market price of the Company’s commonstock on the Tokyo Stock Exchange on the grant date (or the closingmarket price on the day immediately preceding such date, if there wereno transactions on such date).
The options granted vested 100% at grant date. The options grantedare exercisable starting April 1 of the fiscal year after the fiscal year inwhich they are granted. They are exercisable for four years and threemonths from that date. The Company recognized no compensationexpense related to the fixed price stock option plans for the years endedMarch 31, 2005, 2004 and 2003, because no options were granted at aprice below the market price on grant date.
On June 22, 2004, the shareholders authorized the issue of new stockoptions up to 184,000 shares of common stock before the next share-holders meeting. Options for 181,000 shares were granted under thisauthorization. The Board intends to propose to the shareholders at thegeneral meeting to be held on June 24, 2005, the authorization of anadditional issue of new stock options for up to 177,000 shares of com-mon stock.
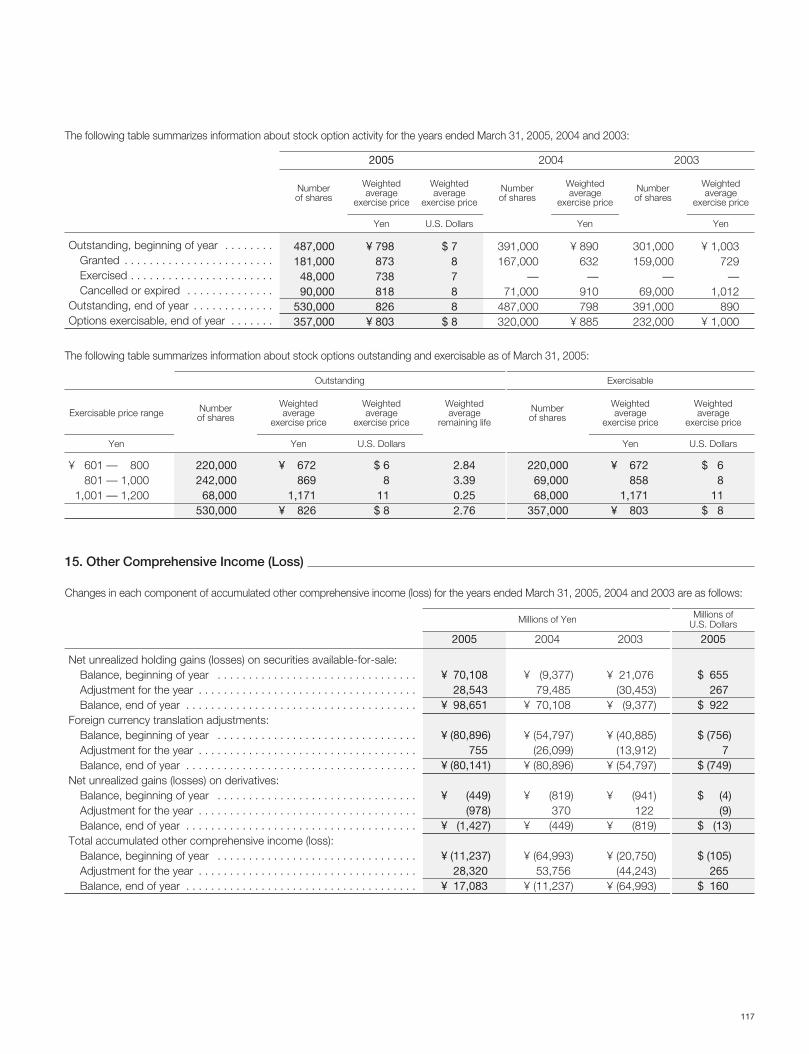
117
Weighted average
exercise price
The following table summarizes information about stock option activity for the years ended March 31, 2005, 2004 and 2003:
Outstanding, beginning of year . . . . . . . .Granted . . . . . . . . . . . . . . . . . . . . . . . .Exercised . . . . . . . . . . . . . . . . . . . . . . .Cancelled or expired . . . . . . . . . . . . . .
Outstanding, end of year . . . . . . . . . . . . .Options exercisable, end of year . . . . . . .
¥ 798 873738818826
¥ 803
¥ 890632
—910798
¥ 885
487,000181,000
48,00090,000
530,000357,000
391,000167,000
—71,000
487,000320,000
¥ 1,003729
—1,012
890¥ 1,000
Weighted average
exercise price
$ 7 8788
$ 8
2005
301,000159,000
—69,000
391,000232,000
2004 2003
Weighted average
exercise price
Weighted average
exercise price
Number of shares
Yen Yen YenU.S. Dollars
Number of shares
Number of shares
The following table summarizes information about stock options outstanding and exercisable as of March 31, 2005:
¥ 601 — 800801 — 1,000
1,001 — 1,200
¥ 672869
1,171¥ 826
220,00069,00068,000
357,000
220,000242,000
68,000530,000
2.843.390.252.76
$ 68
11$ 8
Weighted average
exercise price
$ 68
11$ 8
Outstanding
¥ 672858
1,171¥ 803
Exercisable
Weighted average
exercise price
Weighted average
exercise priceExercisable price range
Weighted average
exercise price
YenYen U.S. Dollars Yen U.S. Dollars
Numberof shares
Weighted average
remaining life
Numberof shares
15. Other Comprehensive Income (Loss)
Changes in each component of accumulated other comprehensive income (loss) for the years ended March 31, 2005, 2004 and 2003 are as follows:
Net unrealized holding gains (losses) on securities available-for-sale:Balance, beginning of year . . . . . . . . . . . . . . . . . . . . . . . . . . . . . . . .Adjustment for the year . . . . . . . . . . . . . . . . . . . . . . . . . . . . . . . . . . .Balance, end of year . . . . . . . . . . . . . . . . . . . . . . . . . . . . . . . . . . . . .
Foreign currency translation adjustments:Balance, beginning of year . . . . . . . . . . . . . . . . . . . . . . . . . . . . . . . .Adjustment for the year . . . . . . . . . . . . . . . . . . . . . . . . . . . . . . . . . . .Balance, end of year . . . . . . . . . . . . . . . . . . . . . . . . . . . . . . . . . . . . .
Net unrealized gains (losses) on derivatives:Balance, beginning of year . . . . . . . . . . . . . . . . . . . . . . . . . . . . . . . .Adjustment for the year . . . . . . . . . . . . . . . . . . . . . . . . . . . . . . . . . . .Balance, end of year . . . . . . . . . . . . . . . . . . . . . . . . . . . . . . . . . . . . .
Total accumulated other comprehensive income (loss):Balance, beginning of year . . . . . . . . . . . . . . . . . . . . . . . . . . . . . . . .Adjustment for the year . . . . . . . . . . . . . . . . . . . . . . . . . . . . . . . . . . .Balance, end of year . . . . . . . . . . . . . . . . . . . . . . . . . . . . . . . . . . . . .
¥ 70,10828,543
¥ 98,651
¥ (80,896)755
¥ (80,141)
¥ (449)(978)
¥ (1,427)
¥ (11,237)28,320
¥ 17,083
¥ (9,377)79,485
¥ 70,108
¥ (54,797)(26,099)
¥ (80,896)
¥ (819) 370
¥ (449)
¥ (64,993)53,756
¥ (11,237)
$ 655267
$ 922
$ (756)7
$ (749)
$ (4)(9)
$ (13)
$ (105)265
$ 160
20052005 2004
¥ 21,076(30,453)
¥ (9,377)
¥ (40,885)(13,912)
¥ (54,797)
¥ (941)122
¥ (819)
¥ (20,750)(44,243)
¥ (64,993)
2003
Millions of Yen Millions ofU.S. Dollars
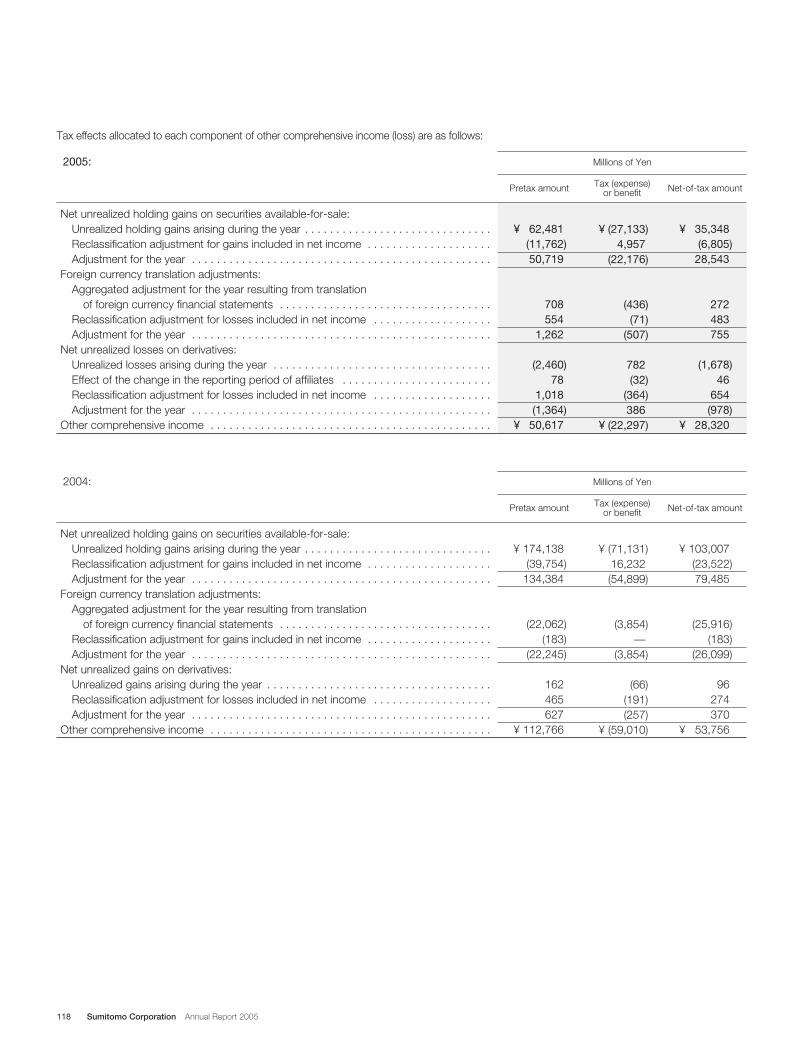
118 Sumitomo Corporation Annual Report 2005
Tax effects allocated to each component of other comprehensive income (loss) are as follows:
Net unrealized holding gains on securities available-for-sale:Unrealized holding gains arising during the year . . . . . . . . . . . . . . . . . . . . . . . . . . . . . .Reclassification adjustment for gains included in net income . . . . . . . . . . . . . . . . . . . .Adjustment for the year . . . . . . . . . . . . . . . . . . . . . . . . . . . . . . . . . . . . . . . . . . . . . . . .
Foreign currency translation adjustments:Aggregated adjustment for the year resulting from translation
of foreign currency financial statements . . . . . . . . . . . . . . . . . . . . . . . . . . . . . . . . . .Reclassification adjustment for gains included in net income . . . . . . . . . . . . . . . . . . . .Adjustment for the year . . . . . . . . . . . . . . . . . . . . . . . . . . . . . . . . . . . . . . . . . . . . . . . .
Net unrealized gains on derivatives:Unrealized gains arising during the year . . . . . . . . . . . . . . . . . . . . . . . . . . . . . . . . . . . .Reclassification adjustment for losses included in net income . . . . . . . . . . . . . . . . . . .Adjustment for the year . . . . . . . . . . . . . . . . . . . . . . . . . . . . . . . . . . . . . . . . . . . . . . . .
Other comprehensive income . . . . . . . . . . . . . . . . . . . . . . . . . . . . . . . . . . . . . . . . . . . . .
¥ 174,138(39,754)
134,384
(22,062)(183)
(22,245)
162465627
¥ 112,766
¥ 103,007 (23,522)79,485
(25,916)(183)
(26,099)
96274370
¥ 53,756
Net-of-tax amountPretax amount
¥ (71,131) 16,232(54,899)
(3,854)—
(3,854)
(66)(191)(257)
¥ (59,010)
Tax (expense) or benefit
Millions of Yen2004:
Net unrealized holding gains on securities available-for-sale:Unrealized holding gains arising during the year . . . . . . . . . . . . . . . . . . . . . . . . . . . . . .Reclassification adjustment for gains included in net income . . . . . . . . . . . . . . . . . . . .Adjustment for the year . . . . . . . . . . . . . . . . . . . . . . . . . . . . . . . . . . . . . . . . . . . . . . . .
Foreign currency translation adjustments:Aggregated adjustment for the year resulting from translation
of foreign currency financial statements . . . . . . . . . . . . . . . . . . . . . . . . . . . . . . . . . .Reclassification adjustment for losses included in net income . . . . . . . . . . . . . . . . . . .Adjustment for the year . . . . . . . . . . . . . . . . . . . . . . . . . . . . . . . . . . . . . . . . . . . . . . . .
Net unrealized losses on derivatives:Unrealized losses arising during the year . . . . . . . . . . . . . . . . . . . . . . . . . . . . . . . . . . .Effect of the change in the reporting period of affiliates . . . . . . . . . . . . . . . . . . . . . . . .Reclassification adjustment for losses included in net income . . . . . . . . . . . . . . . . . . .Adjustment for the year . . . . . . . . . . . . . . . . . . . . . . . . . . . . . . . . . . . . . . . . . . . . . . . .
Other comprehensive income . . . . . . . . . . . . . . . . . . . . . . . . . . . . . . . . . . . . . . . . . . . . .
¥ 62,481(11,762)50,719
708554
1,262
(2,460)78
1,018(1,364)
¥ 50,617
¥ 35,348(6,805)
28,543
272483755
(1,678)46
654(978)
¥ 28,320
Net-of-tax amountPretax amount
¥ (27,133)4,957
(22,176)
(436)(71)
(507)
782(32)
(364)386
¥ (22,297)
Tax (expense) or benefit
Millions of Yen2005:

119
Net unrealized holding losses on securities available-for-sale:Unrealized holding losses arising during the year . . . . . . . . . . . . . . . . . . . . . . . . . . . . .Reclassification adjustment for losses included in net income . . . . . . . . . . . . . . . . . . .Adjustment for the year . . . . . . . . . . . . . . . . . . . . . . . . . . . . . . . . . . . . . . . . . . . . . . . .
Foreign currency translation adjustments:Aggregated adjustment for the year resulting from translation
of foreign currency financial statements . . . . . . . . . . . . . . . . . . . . . . . . . . . . . . . . . .Reclassification adjustment for losses included in net income . . . . . . . . . . . . . . . . . . .Adjustment for the year . . . . . . . . . . . . . . . . . . . . . . . . . . . . . . . . . . . . . . . . . . . . . . . .
Net unrealized gains on derivatives:Unrealized losses arising during the year . . . . . . . . . . . . . . . . . . . . . . . . . . . . . . . . . . .Reclassification adjustment for losses included in net income . . . . . . . . . . . . . . . . . . .Adjustment for the year . . . . . . . . . . . . . . . . . . . . . . . . . . . . . . . . . . . . . . . . . . . . . . . .
Other comprehensive loss . . . . . . . . . . . . . . . . . . . . . . . . . . . . . . . . . . . . . . . . . . . . . . . .
¥ (92,777) 42,530(50,247)
(17,370)2,749
(14,621)
(335)542207
¥ (64,661)
¥ (55,831) 25,378(30,453)
(16,661)2,749
(13,912)
(198)320122
¥ (44,243)
Net-of-tax amountPretax amount
¥ 36,946(17,152)19,794
709—
709
137(222)
(85)¥ 20,418
Tax (expense) or benefit
Millions of Yen2003:
Net unrealized holding gains on securities available-for-sale:Unrealized holding gains arising during the year . . . . . . . . . . . . . . . . . . . . . . . . . . . . . .Reclassification adjustment for gains included in net income . . . . . . . . . . . . . . . . . . . .Adjustment for the year . . . . . . . . . . . . . . . . . . . . . . . . . . . . . . . . . . . . . . . . . . . . . . . .
Foreign currency translation adjustments:Aggregated adjustment for the year resulting from translation
of foreign currency financial statements . . . . . . . . . . . . . . . . . . . . . . . . . . . . . . . . . .Reclassification adjustment for losses included in net income . . . . . . . . . . . . . . . . . . .Adjustment for the year . . . . . . . . . . . . . . . . . . . . . . . . . . . . . . . . . . . . . . . . . . . . . . . .
Net unrealized losses on derivatives:Unrealized losses arising during the year . . . . . . . . . . . . . . . . . . . . . . . . . . . . . . . . . . .Effect of the change in the reporting period of affiliates . . . . . . . . . . . . . . . . . . . . . . . .Reclassification adjustment for losses included in net income . . . . . . . . . . . . . . . . . . .Adjustment for the year . . . . . . . . . . . . . . . . . . . . . . . . . . . . . . . . . . . . . . . . . . . . . . . .
Other comprehensive income . . . . . . . . . . . . . . . . . . . . . . . . . . . . . . . . . . . . . . . . . . . . .
$ 584(110)474
75
12
(23)19
(13)$ 473
$ 331(64)
267
347
(16)16(9)
$ 265
Net-of-tax amountPretax amount
$ (253)46
(207)
(4)(1)(5)
7(0)(3)4
$ (208)
Tax (expense) or benefit
Millions of U.S. Dollars2005:
120 Sumitomo Corporation Annual Report 2005
16. Derivatives and Hedging Activities
Risk management policyThe Companies operate internationally, exposing them to the risk ofchanges in foreign exchange rates, interest rates and commodity prices.Derivative financial instruments are comprised principally of foreignexchange contracts, interest rate swaps and commodity future contractsutilized by the Company and certain of its subsidiaries to reduce theserisks. The Companies assess foreign currency exchange rate risk, inter-est rate risk and commodity price risk by continually monitoring changesin these exposures and by evaluating hedging opportunities. TheCompanies hold or issue commodity derivatives for trading purposes.The Companies are also exposed to credit-related losses in the event ofnon-performance by counterparties to derivative financial instruments,but it is not expected that any counterparties will fail to meet their obliga-tions, because most of the counterparties are internationally recognizedfinancial institutions and contracts are diversified across a number ofmajor financial institutions.
Foreign currency exchange rate risk managementThe Companies operate internationally and are exposed to foreign cur-rency risks related to purchasing, selling, financing and investing in cur-rencies other than the local currencies in which the Companies operate.The Companies’ strategy to manage foreign currency risks is to net for-eign currency exposures on recognized assets, liabilities and unrecog-nized firm commitments by taking advantage of natural offsets, andpurchase foreign exchange forward contracts and other contracts to pre-serve the economic value of cash flows in non-functional currencies.
Interest rate risk managementThe Companies’ exposure to the market risk of changes in interest ratesrelate primarily to its debt obligations. The fixed-rate debt obligationsexpose the Companies to variability in their fair values due to changes ininterest rates. To manage the variability in fair values caused by interestrate changes, the Companies enter into interest rate swaps when it isdetermined to be appropriate based on market conditions. The interestrate swaps change the fixed-rate debt obligations to variable-rate debtobligations by entering into receive-fixed, pay-variable interest rateswaps. The hedging relationship between the interest rate swaps and thehedged debt obligations is highly effective in achieving offsetting changesin fair values resulting from interest rate risk.
Commodity price risk managementThe Companies are exposed to price fluctuations of commodities used intheir trading and other operating activities. To hedge the variability incommodity prices, the Companies enter into commodity futures, for-wards and swaps contracts. These contracts relate principally to pre-cious metals, nonferrous metals, crude oil and agricultural products.
Fair-value hedgesFair-value hedges are hedges that eliminate the risk of changes in the fairvalues of assets and liabilities. The Companies use interest rate swaps tohedge the change of fair value on fixed-rate borrowings used to fundassets earning interest at variable rates. Changes in the fair value ofderivatives designated as fair-value hedges are recorded in earnings andare offset by corresponding changes in the fair value of the hedged itemto the extent of hedge effectiveness.
Cash-flow hedgesCash-flow hedges are hedges that use derivatives to offset the variabilityof expected future cash flows. The Companies use interest rate swaps tohedge the variability of cash flows related to floating-rate borrowings. TheCompanies record changes in the fair value of the interest rate swaps inother comprehensive income (loss) as a separate component of share-holders’ equity. Such amounts are released to earnings contemporane-ously when the hedged item affects earnings. For the year ended March31, 2005, net derivative losses of ¥654 million ($6 million), net of relatedincome tax benefit of ¥364 million ($3 million), were reclassified into earn-ings. For the year ended March 31, 2004, net derivative losses of ¥274million, net of related income tax benefit of ¥191 million, were likewisereclassified. As of March 31, 2005, the amount that was expected to bereclassified into earnings, net of the related tax benefit, within the next fis-cal year was ¥635 million ($6 million).
Derivatives not designated as hedgesSFAS No. 133 specifies criteria that must be met in order to apply hedgeaccounting. For example, hedge accounting is not permitted for hedgeditems that are remeasured with the changes in fair-value attributable tothe hedged risk reported currently in earnings. The Companies use deriv-atives to hedge exposures when it makes economic sense to do so,including circumstances in which the hedging relationship does not qual-ify for hedge accounting.
The Companies use foreign exchange forward contracts to economi-cally hedge the fluctuations of foreign exchange rates on foreign currencyassets, liabilities and unrecognized firm commitments. The Companiesalso enter into commodity forwards, futures and swap contracts to eco-nomically hedge their inventories and unrecognized firm commitmentsagainst market price fluctuations. Certain commodity derivatives areentered into for trading purposes in extent of an approval of the manage-ment. These derivatives do not qualify for hedge accounting and anychanges in their fair value are recognized to earnings.
121
17. Financial Instruments
In accordance with the requirements of SFAS No. 107, “Disclosuresabout Fair Value of Financial Instruments,” the Companies have providedthe following fair value estimates and information about valuationmethodologies.
Quoted market prices, where available, are used to estimate fair valuesof financial instruments. However, quoted market prices are not availablefor a substantial portion of the Companies’ financial instruments, and,therefore, fair values for such financial instruments are estimated usingdiscounted cash flow analysis or other valuation techniques as deemedappropriate.
Cash, Cash Equivalents, Short-Term Investments,Accounts Receivable, Accounts Payable and Note PayableThe carrying amount approximates fair value of these instrumentsbecause of their short-term maturities.
Marketable Securities and Other InvestmentsThe fair values of marketable securities are estimated using quoted mar-ket prices. Other investments include investments in common stock ofnon-traded and unaffiliated companies such as customers and suppliers,and investments in non-listed preferred stock of certain financial institu-tions. It is not practicable to estimate the fair value of investments inunlisted common stock because of the lack of a market price and diffi-culty in estimating fair value without incurring excessive cost (see Note 5).
Non-Current Trade Receivables and Advances toAssociated CompaniesThe fair values of non-current trade receivables including long-term loansreceivable, except for loans with floating rates whose carrying amount
approximates fair value, are estimated by discounted cash flow analysis,using interest rates currently being offered for loans or accounts receiv-able with similar terms to borrowers or customers of similar credit qualityand remaining maturities.
Long-Term DebtThe fair values of long-term debt, except for debt with floating rateswhose carrying amount approximates fair value, are estimated by dis-counted cash flow analysis, using rates currently available for similartypes of borrowings with similar terms and remaining maturities.
Guarantee of Third Party DebtAs a result of the adoption of FASB Interpretation No. 45, “Guarantor’sAccounting and Disclosure Requirements for Guarantees, IncludingIndirect Guarantees of Indebtedness of Others,” the fair values of financialguarantees are estimated based on the premiums received or receiv-ables by guarantors in an arm’s length transactions with unrelated parties(see Note 22).
Interest Rate Swaps, Currency Swap Agreements andCurrency Option ContractsThe fair values of interest rate swaps, currency swap agreements andcurrency option contracts are estimated by obtaining quotes from bro-kers and other appropriate valuation techniques based on informationavailable to the Companies.
Foreign Exchange Forward Contracts The fair values of foreign exchange forward contracts are estimatedbased on market prices for contracts with similar terms.
Earnings effects of derivativesFor the years ended March 31, 2005, 2004 and 2003, the amount ofhedge ineffectiveness recognized on fair-value hedges was gains of ¥3million ($0 million), losses of ¥2 million and gains of ¥6 million, respectively.There were no gains or losses excluded from the assessment of hedgeeffectiveness for the years ended March 31, 2005, 2004 and 2003.
In the context of hedging relationships, “Effectiveness” refers to thedegree of achieving offsetting changes in fair value or offsetting the vari-ability in cash flows attributable to the risk being hedged.
Management continuously assesses effectiveness of these derivativetransactions and market risks surrounding these transactions to formu-late the Companies’ policy regarding derivative transactions.
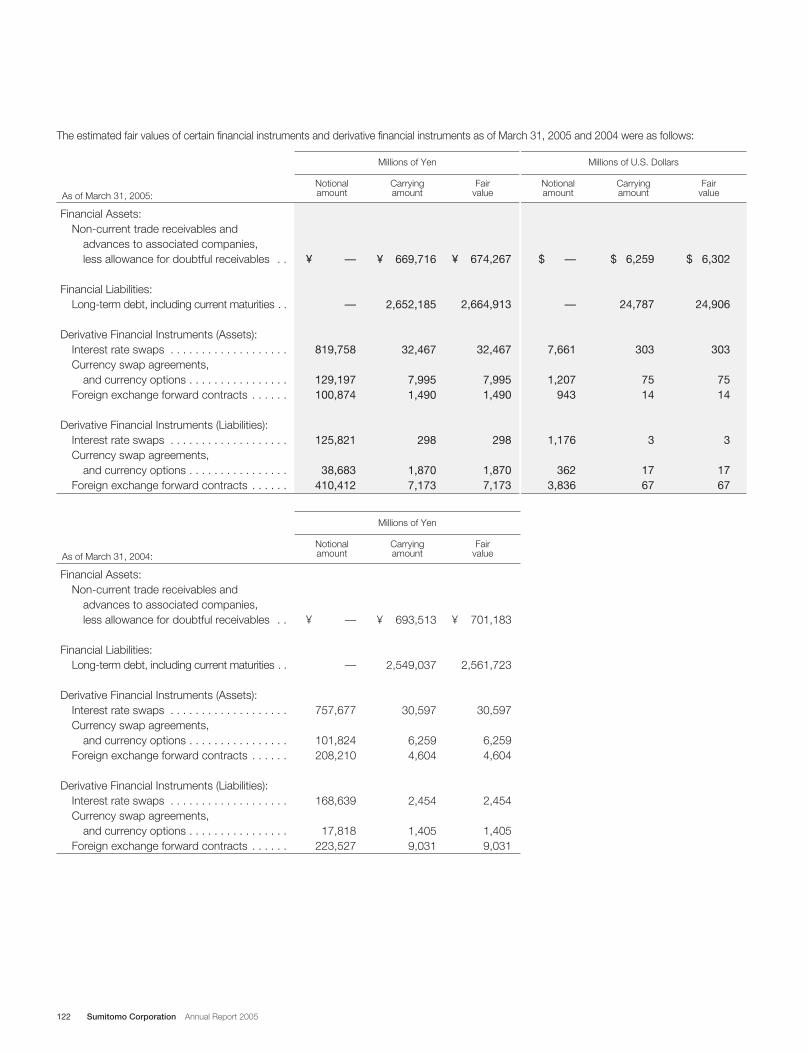
122 Sumitomo Corporation Annual Report 2005
Financial Assets:Non-current trade receivables and
advances to associated companies, less allowance for doubtful receivables . .
Financial Liabilities:Long-term debt, including current maturities . .
Derivative Financial Instruments (Assets):Interest rate swaps . . . . . . . . . . . . . . . . . . .Currency swap agreements,
and currency options . . . . . . . . . . . . . . . .Foreign exchange forward contracts . . . . . .
Derivative Financial Instruments (Liabilities):Interest rate swaps . . . . . . . . . . . . . . . . . . .Currency swap agreements,
and currency options . . . . . . . . . . . . . . . .Foreign exchange forward contracts . . . . . .
¥ —
—
757,677
101,824208,210
168,639
17,818223,527
¥ 701,183
2,561,723
30,597
6,2594,604
2,454
1,4059,031
Fairvalue
Notionalamount
¥ 693,513
2,549,037
30,597
6,2594,604
2,454
1,4059,031
Carryingamount
Millions of Yen
As of March 31, 2004:
The estimated fair values of certain financial instruments and derivative financial instruments as of March 31, 2005 and 2004 were as follows:
Financial Assets:Non-current trade receivables and
advances to associated companies, less allowance for doubtful receivables . .
Financial Liabilities:Long-term debt, including current maturities . .
Derivative Financial Instruments (Assets):Interest rate swaps . . . . . . . . . . . . . . . . . . .Currency swap agreements,
and currency options . . . . . . . . . . . . . . . .Foreign exchange forward contracts . . . . . .
Derivative Financial Instruments (Liabilities):Interest rate swaps . . . . . . . . . . . . . . . . . . .Currency swap agreements,
and currency options . . . . . . . . . . . . . . . .Foreign exchange forward contracts . . . . . .
$ —
—
7,661
1,207943
1,176
3623,836
$ 6,302
24,906
303
7514
3
1767
Fairvalue
Notionalamount
$ 6,259
24,787
303
7514
3
1767
Carryingamount
Millions of U.S. Dollars
¥ —
—
819,758
129,197100,874
125,821
38,683410,412
¥ 674,267
2,664,913
32,467
7,9951,490
298
1,8707,173
Fairvalue
Notionalamount
¥ 669,716
2,652,185
32,467
7,9951,490
298
1,8707,173
Carryingamount
Millions of Yen
As of March 31, 2005:
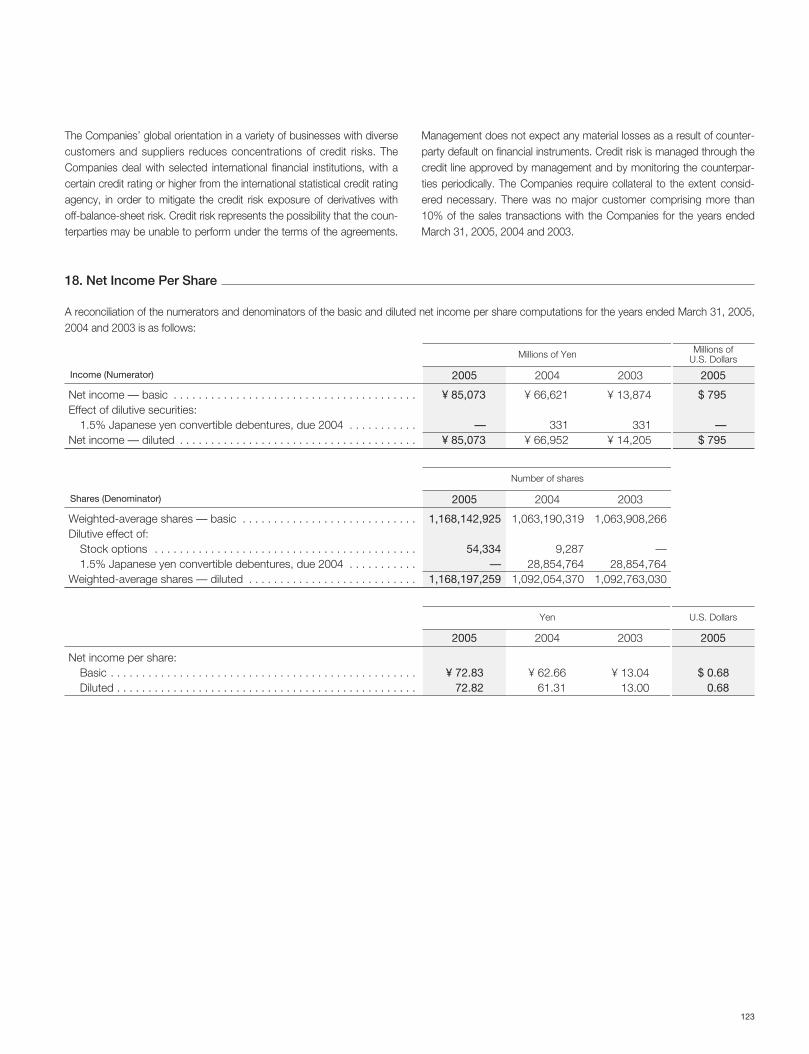
123
The Companies’ global orientation in a variety of businesses with diversecustomers and suppliers reduces concentrations of credit risks. TheCompanies deal with selected international financial institutions, with acertain credit rating or higher from the international statistical credit ratingagency, in order to mitigate the credit risk exposure of derivatives withoff-balance-sheet risk. Credit risk represents the possibility that the coun-terparties may be unable to perform under the terms of the agreements.
Management does not expect any material losses as a result of counter-party default on financial instruments. Credit risk is managed through thecredit line approved by management and by monitoring the counterpar-ties periodically. The Companies require collateral to the extent consid-ered necessary. There was no major customer comprising more than10% of the sales transactions with the Companies for the years endedMarch 31, 2005, 2004 and 2003.
18. Net Income Per Share
A reconciliation of the numerators and denominators of the basic and diluted net income per share computations for the years ended March 31, 2005,2004 and 2003 is as follows:
Net income — basic . . . . . . . . . . . . . . . . . . . . . . . . . . . . . . . . . . . . . . .Effect of dilutive securities:
1.5% Japanese yen convertible debentures, due 2004 . . . . . . . . . . .Net income — diluted . . . . . . . . . . . . . . . . . . . . . . . . . . . . . . . . . . . . . .
¥ 85,073
—¥ 85,073
¥ 66,621
331¥ 66,952
$ 795
—$ 795
20052005Income (Numerator)
Shares (Denominator)
2004
¥ 13,874
331¥ 14,205
2003
Millions of Yen Millions of U.S. Dollars
Weighted-average shares — basic . . . . . . . . . . . . . . . . . . . . . . . . . . . .Dilutive effect of:
Stock options . . . . . . . . . . . . . . . . . . . . . . . . . . . . . . . . . . . . . . . . . .1.5% Japanese yen convertible debentures, due 2004 . . . . . . . . . . .
Weighted-average shares — diluted . . . . . . . . . . . . . . . . . . . . . . . . . . .
1,168,142,925
54,334—
1,168,197,259
1,063,190,319
9,28728,854,764
1,092,054,370
2005 2004
1,063,908,266
—28,854,764
1,092,763,030
2003
Number of shares
Net income per share:Basic . . . . . . . . . . . . . . . . . . . . . . . . . . . . . . . . . . . . . . . . . . . . . . . . .Diluted . . . . . . . . . . . . . . . . . . . . . . . . . . . . . . . . . . . . . . . . . . . . . . . .
¥ 72.83 72.82
¥ 62.6661.31
$ 0.680.68
¥ 13.0413.00
Yen U.S. Dollars
20052005 2004 2003
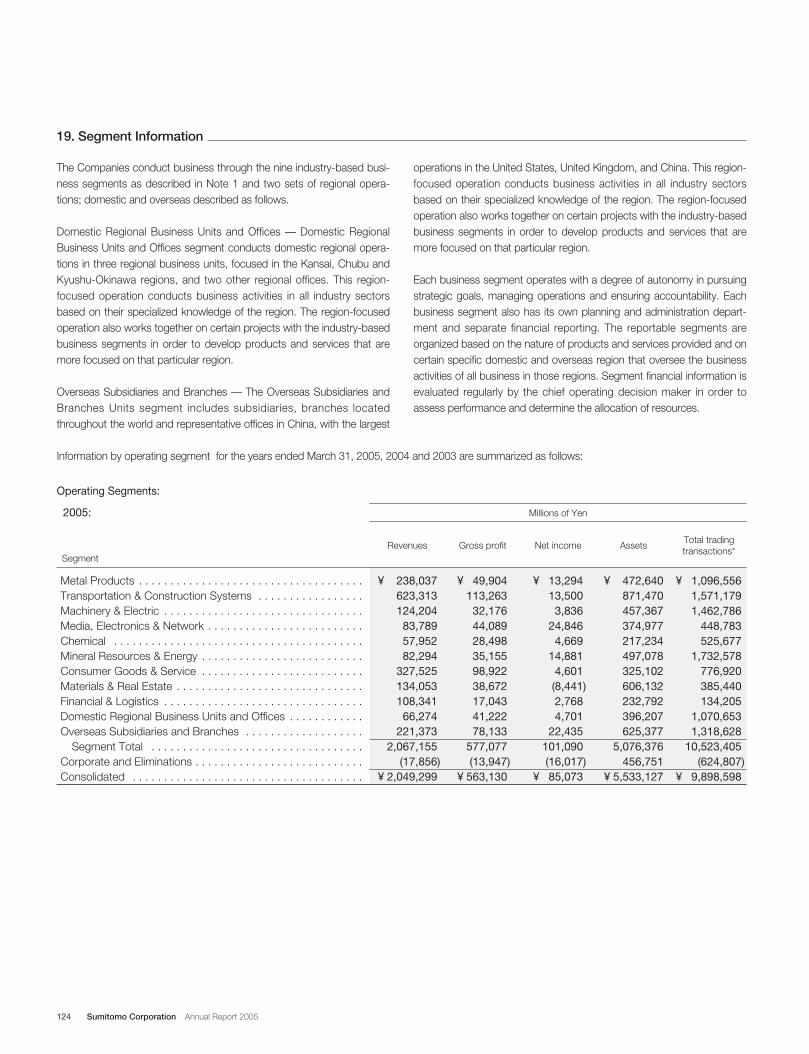
124 Sumitomo Corporation Annual Report 2005
19. Segment Information
The Companies conduct business through the nine industry-based busi-ness segments as described in Note 1 and two sets of regional opera-tions; domestic and overseas described as follows.
Domestic Regional Business Units and Offices — Domestic RegionalBusiness Units and Offices segment conducts domestic regional opera-tions in three regional business units, focused in the Kansai, Chubu andKyushu-Okinawa regions, and two other regional offices. This region-focused operation conducts business activities in all industry sectorsbased on their specialized knowledge of the region. The region-focusedoperation also works together on certain projects with the industry-basedbusiness segments in order to develop products and services that aremore focused on that particular region.
Overseas Subsidiaries and Branches — The Overseas Subsidiaries andBranches Units segment includes subsidiaries, branches locatedthroughout the world and representative offices in China, with the largest
operations in the United States, United Kingdom, and China. This region-focused operation conducts business activities in all industry sectorsbased on their specialized knowledge of the region. The region-focusedoperation also works together on certain projects with the industry-basedbusiness segments in order to develop products and services that aremore focused on that particular region.
Each business segment operates with a degree of autonomy in pursuingstrategic goals, managing operations and ensuring accountability. Eachbusiness segment also has its own planning and administration depart-ment and separate financial reporting. The reportable segments areorganized based on the nature of products and services provided and oncertain specific domestic and overseas region that oversee the businessactivities of all business in those regions. Segment financial information isevaluated regularly by the chief operating decision maker in order toassess performance and determine the allocation of resources.
Metal Products . . . . . . . . . . . . . . . . . . . . . . . . . . . . . . . . . . . .Transportation & Construction Systems . . . . . . . . . . . . . . . . .Machinery & Electric . . . . . . . . . . . . . . . . . . . . . . . . . . . . . . . .Media, Electronics & Network . . . . . . . . . . . . . . . . . . . . . . . . .Chemical . . . . . . . . . . . . . . . . . . . . . . . . . . . . . . . . . . . . . . . .Mineral Resources & Energy . . . . . . . . . . . . . . . . . . . . . . . . . .Consumer Goods & Service . . . . . . . . . . . . . . . . . . . . . . . . . .Materials & Real Estate . . . . . . . . . . . . . . . . . . . . . . . . . . . . . .Financial & Logistics . . . . . . . . . . . . . . . . . . . . . . . . . . . . . . . .Domestic Regional Business Units and Offices . . . . . . . . . . . .Overseas Subsidiaries and Branches . . . . . . . . . . . . . . . . . . .
Segment Total . . . . . . . . . . . . . . . . . . . . . . . . . . . . . . . . . .Corporate and Eliminations . . . . . . . . . . . . . . . . . . . . . . . . . . .Consolidated . . . . . . . . . . . . . . . . . . . . . . . . . . . . . . . . . . . . .
¥ 49,904113,263
32,17644,08928,49835,15598,92238,67217,04341,22278,133
577,077(13,947)
¥ 563,130
¥ 238,037623,313124,204
83,78957,95282,294
327,525134,053108,341
66,274221,373
2,067,155(17,856)
¥ 2,049,299
¥ 472,640871,470457,367374,977217,234497,078325,102606,132232,792396,207625,377
5,076,376456,751
¥ 5,533,127
¥ 1,096,5561,571,1791,462,786
448,783525,677
1,732,578776,920385,440134,205
1,070,6531,318,628
10,523,405(624,807)
¥ 9,898,598
Total trading transactions*
¥ 13,29413,500
3,83624,846
4,66914,881
4,601(8,441)2,7684,701
22,435101,090(16,017)
¥ 85,073
2005:
Operating Segments:
Millions of Yen
AssetsGross profit Net income RevenuesSegment
Information by operating segment for the years ended March 31, 2005, 2004 and 2003 are summarized as follows:
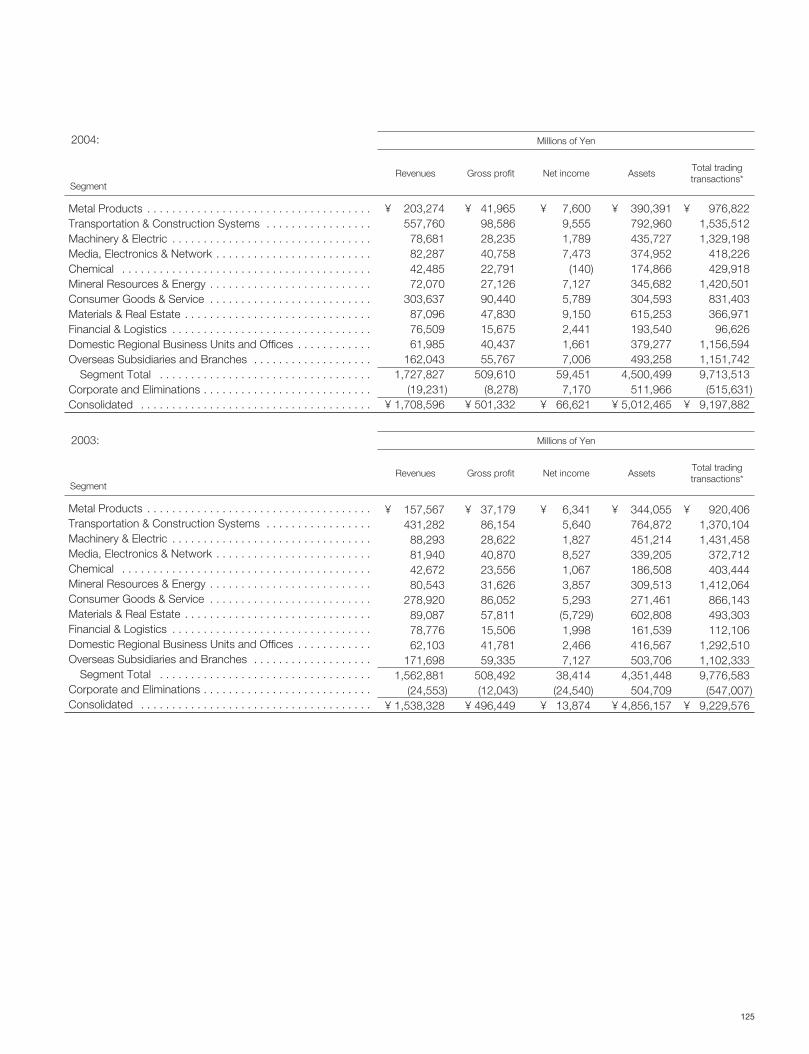
125
Metal Products . . . . . . . . . . . . . . . . . . . . . . . . . . . . . . . . . . . .Transportation & Construction Systems . . . . . . . . . . . . . . . . .Machinery & Electric . . . . . . . . . . . . . . . . . . . . . . . . . . . . . . . .Media, Electronics & Network . . . . . . . . . . . . . . . . . . . . . . . . .Chemical . . . . . . . . . . . . . . . . . . . . . . . . . . . . . . . . . . . . . . . .Mineral Resources & Energy . . . . . . . . . . . . . . . . . . . . . . . . . .Consumer Goods & Service . . . . . . . . . . . . . . . . . . . . . . . . . .Materials & Real Estate . . . . . . . . . . . . . . . . . . . . . . . . . . . . . .Financial & Logistics . . . . . . . . . . . . . . . . . . . . . . . . . . . . . . . .Domestic Regional Business Units and Offices . . . . . . . . . . . .Overseas Subsidiaries and Branches . . . . . . . . . . . . . . . . . . .
Segment Total . . . . . . . . . . . . . . . . . . . . . . . . . . . . . . . . . .Corporate and Eliminations . . . . . . . . . . . . . . . . . . . . . . . . . . .Consolidated . . . . . . . . . . . . . . . . . . . . . . . . . . . . . . . . . . . . .
¥ 41,96598,58628,23540,75822,79127,12690,44047,83015,67540,43755,767
509,610(8,278)
¥ 501,332
¥ 203,274557,760
78,68182,28742,48572,070
303,63787,09676,50961,985
162,0431,727,827
(19,231)¥ 1,708,596
¥ 390,391792,960435,727374,952174,866345,682304,593615,253193,540379,277493,258
4,500,499511,966
¥ 5,012,465
¥ 976,8221,535,5121,329,198
418,226429,918
1,420,501831,403366,971
96,6261,156,5941,151,7429,713,513
(515,631)¥ 9,197,882
Total trading transactions*
¥ 7,6009,5551,7897,473
(140)7,1275,7899,1502,4411,6617,006
59,4517,170
¥ 66,621
2004: Millions of Yen
AssetsGross profit Net income RevenuesSegment
Metal Products . . . . . . . . . . . . . . . . . . . . . . . . . . . . . . . . . . . .Transportation & Construction Systems . . . . . . . . . . . . . . . . .Machinery & Electric . . . . . . . . . . . . . . . . . . . . . . . . . . . . . . . .Media, Electronics & Network . . . . . . . . . . . . . . . . . . . . . . . . .Chemical . . . . . . . . . . . . . . . . . . . . . . . . . . . . . . . . . . . . . . . .Mineral Resources & Energy . . . . . . . . . . . . . . . . . . . . . . . . . .Consumer Goods & Service . . . . . . . . . . . . . . . . . . . . . . . . . .Materials & Real Estate . . . . . . . . . . . . . . . . . . . . . . . . . . . . . .Financial & Logistics . . . . . . . . . . . . . . . . . . . . . . . . . . . . . . . .Domestic Regional Business Units and Offices . . . . . . . . . . . .Overseas Subsidiaries and Branches . . . . . . . . . . . . . . . . . . .
Segment Total . . . . . . . . . . . . . . . . . . . . . . . . . . . . . . . . . .Corporate and Eliminations . . . . . . . . . . . . . . . . . . . . . . . . . . .Consolidated . . . . . . . . . . . . . . . . . . . . . . . . . . . . . . . . . . . . .
¥ 37,17986,15428,62240,87023,55631,62686,05257,81115,50641,78159,335
508,492(12,043)
¥ 496,449
¥ 157,567431,282
88,29381,94042,67280,543
278,92089,08778,77662,103
171,6981,562,881
(24,553)¥ 1,538,328
¥ 344,055764,872451,214339,205186,508309,513271,461602,808161,539416,567503,706
4,351,448504,709
¥ 4,856,157
¥ 920,4061,370,1041,431,458
372,712403,444
1,412,064866,143493,303112,106
1,292,5101,102,3339,776,583
(547,007)¥ 9,229,576
Total trading transactions*
¥ 6,3415,6401,8278,5271,0673,8575,293(5,729)1,9982,4667,127
38,414(24,540)
¥ 13,874
2003: Millions of Yen
AssetsGross profit Net income RevenuesSegment
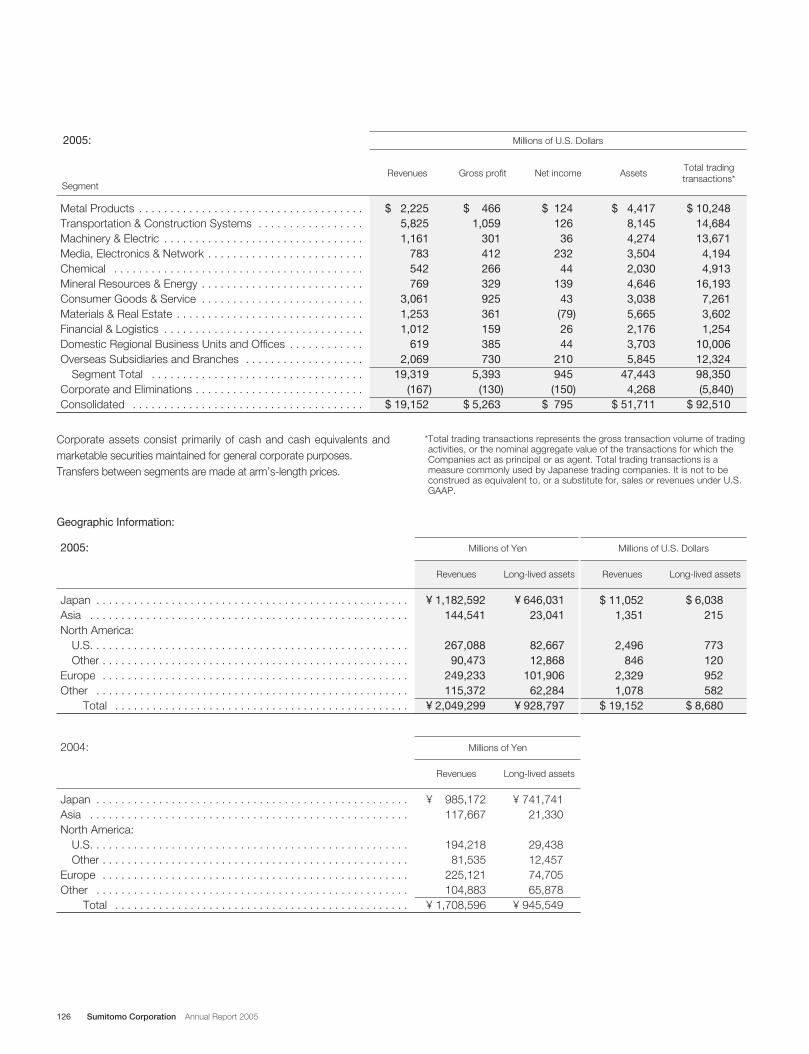
126 Sumitomo Corporation Annual Report 2005
Metal Products . . . . . . . . . . . . . . . . . . . . . . . . . . . . . . . . . . . .Transportation & Construction Systems . . . . . . . . . . . . . . . . .Machinery & Electric . . . . . . . . . . . . . . . . . . . . . . . . . . . . . . . .Media, Electronics & Network . . . . . . . . . . . . . . . . . . . . . . . . .Chemical . . . . . . . . . . . . . . . . . . . . . . . . . . . . . . . . . . . . . . . .Mineral Resources & Energy . . . . . . . . . . . . . . . . . . . . . . . . . .Consumer Goods & Service . . . . . . . . . . . . . . . . . . . . . . . . . .Materials & Real Estate . . . . . . . . . . . . . . . . . . . . . . . . . . . . . .Financial & Logistics . . . . . . . . . . . . . . . . . . . . . . . . . . . . . . . .Domestic Regional Business Units and Offices . . . . . . . . . . . .Overseas Subsidiaries and Branches . . . . . . . . . . . . . . . . . . .
Segment Total . . . . . . . . . . . . . . . . . . . . . . . . . . . . . . . . . .Corporate and Eliminations . . . . . . . . . . . . . . . . . . . . . . . . . . .Consolidated . . . . . . . . . . . . . . . . . . . . . . . . . . . . . . . . . . . . .
$ 4661,059
301412266329925361159385730
5,393(130)
$ 5,263
$ 2,2255,8251,161
783542769
3,0611,2531,012
6192,069
19,319(167)
$ 19,152
$ 4,4178,1454,2743,5042,0304,6463,0385,6652,1763,7035,845
47,4434,268
$ 51,711
$ 10,24814,68413,671
4,1944,913
16,1937,2613,6021,254
10,00612,32498,350(5,840)
$ 92,510
Total trading transactions*
$ 124126
36232
44139
43(79)2644
210945(150)
$ 795
2005: Millions of U.S. Dollars
AssetsGross profit Net income RevenuesSegment
Corporate assets consist primarily of cash and cash equivalents andmarketable securities maintained for general corporate purposes.Transfers between segments are made at arm’s-length prices.
*Total trading transactions represents the gross transaction volume of tradingactivities, or the nominal aggregate value of the transactions for which theCompanies act as principal or as agent. Total trading transactions is ameasure commonly used by Japanese trading companies. It is not to beconstrued as equivalent to, or a substitute for, sales or revenues under U.S.GAAP.
Geographic Information:
Japan . . . . . . . . . . . . . . . . . . . . . . . . . . . . . . . . . . . . . . . . . . . . . . . . . .Asia . . . . . . . . . . . . . . . . . . . . . . . . . . . . . . . . . . . . . . . . . . . . . . . . . . .North America:
U.S. . . . . . . . . . . . . . . . . . . . . . . . . . . . . . . . . . . . . . . . . . . . . . . . . . .Other . . . . . . . . . . . . . . . . . . . . . . . . . . . . . . . . . . . . . . . . . . . . . . . . .
Europe . . . . . . . . . . . . . . . . . . . . . . . . . . . . . . . . . . . . . . . . . . . . . . . . .Other . . . . . . . . . . . . . . . . . . . . . . . . . . . . . . . . . . . . . . . . . . . . . . . . . .
Total . . . . . . . . . . . . . . . . . . . . . . . . . . . . . . . . . . . . . . . . . . . . . . .
¥ 646,03123,041
82,66712,868
101,90662,284
¥ 928,797
$ 6,038215
773120952582
$ 8,680
Long-lived assetsLong-lived assets
$ 11,0521,351
2,496846
2,3291,078
$ 19,152
Revenues
Millions of U.S. Dollars
¥ 1,182,592144,541
267,08890,473
249,233115,372
¥ 2,049,299
Revenues
Millions of Yen2005:
Japan . . . . . . . . . . . . . . . . . . . . . . . . . . . . . . . . . . . . . . . . . . . . . . . . . .Asia . . . . . . . . . . . . . . . . . . . . . . . . . . . . . . . . . . . . . . . . . . . . . . . . . . .North America:
U.S. . . . . . . . . . . . . . . . . . . . . . . . . . . . . . . . . . . . . . . . . . . . . . . . . . .Other . . . . . . . . . . . . . . . . . . . . . . . . . . . . . . . . . . . . . . . . . . . . . . . . .
Europe . . . . . . . . . . . . . . . . . . . . . . . . . . . . . . . . . . . . . . . . . . . . . . . . .Other . . . . . . . . . . . . . . . . . . . . . . . . . . . . . . . . . . . . . . . . . . . . . . . . . .
Total . . . . . . . . . . . . . . . . . . . . . . . . . . . . . . . . . . . . . . . . . . . . . . .
¥ 741,74121,330
29,43812,45774,70565,878
¥ 945,549
Long-lived assets
¥ 985,172117,667
194,21881,535
225,121104,883
¥ 1,708,596
Revenues
Millions of Yen2004:
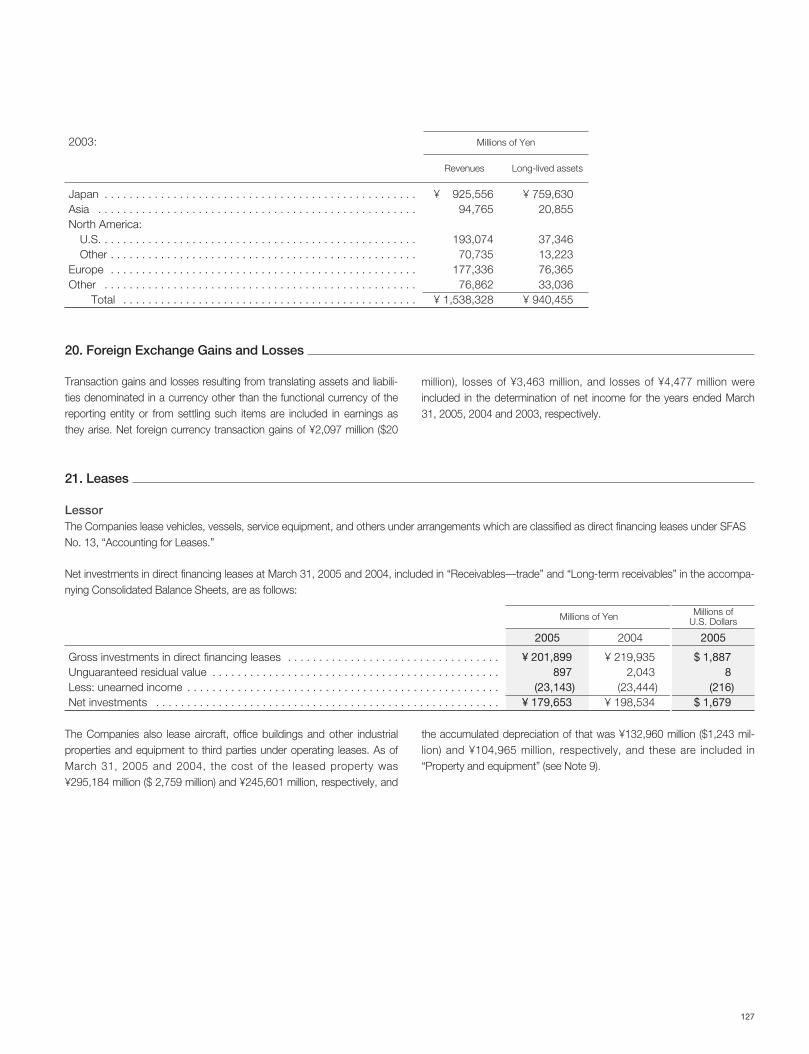
127
Japan . . . . . . . . . . . . . . . . . . . . . . . . . . . . . . . . . . . . . . . . . . . . . . . . . .Asia . . . . . . . . . . . . . . . . . . . . . . . . . . . . . . . . . . . . . . . . . . . . . . . . . . .North America:
U.S. . . . . . . . . . . . . . . . . . . . . . . . . . . . . . . . . . . . . . . . . . . . . . . . . . .Other . . . . . . . . . . . . . . . . . . . . . . . . . . . . . . . . . . . . . . . . . . . . . . . . .
Europe . . . . . . . . . . . . . . . . . . . . . . . . . . . . . . . . . . . . . . . . . . . . . . . . .Other . . . . . . . . . . . . . . . . . . . . . . . . . . . . . . . . . . . . . . . . . . . . . . . . . .
Total . . . . . . . . . . . . . . . . . . . . . . . . . . . . . . . . . . . . . . . . . . . . . . .
¥ 759,63020,855
37,34613,22376,36533,036
¥ 940,455
Long-lived assets
¥ 925,55694,765
193,07470,735
177,33676,862
¥ 1,538,328
Revenues
Millions of Yen2003:
20. Foreign Exchange Gains and Losses
Transaction gains and losses resulting from translating assets and liabili-ties denominated in a currency other than the functional currency of thereporting entity or from settling such items are included in earnings asthey arise. Net foreign currency transaction gains of ¥2,097 million ($20
million), losses of ¥3,463 million, and losses of ¥4,477 million wereincluded in the determination of net income for the years ended March31, 2005, 2004 and 2003, respectively.
21. Leases
LessorThe Companies lease vehicles, vessels, service equipment, and others under arrangements which are classified as direct financing leases under SFASNo. 13, “Accounting for Leases.”
Gross investments in direct financing leases . . . . . . . . . . . . . . . . . . . . . . . . . . . . . . . . . .Unguaranteed residual value . . . . . . . . . . . . . . . . . . . . . . . . . . . . . . . . . . . . . . . . . . . . . .Less: unearned income . . . . . . . . . . . . . . . . . . . . . . . . . . . . . . . . . . . . . . . . . . . . . . . . . .Net investments . . . . . . . . . . . . . . . . . . . . . . . . . . . . . . . . . . . . . . . . . . . . . . . . . . . . . . .
¥ 201,899897
(23,143)¥ 179,653
¥ 219,9352,043
(23,444)¥ 198,534
$ 1,8878
(216)$ 1,679
20052005 2004
Millions of Yen Millions ofU.S. Dollars
The Companies also lease aircraft, office buildings and other industrialproperties and equipment to third parties under operating leases. As ofMarch 31, 2005 and 2004, the cost of the leased property was¥295,184 million ($ 2,759 million) and ¥245,601 million, respectively, and
the accumulated depreciation of that was ¥132,960 million ($1,243 mil-lion) and ¥104,965 million, respectively, and these are included in“Property and equipment” (see Note 9).
Net investments in direct financing leases at March 31, 2005 and 2004, included in “Receivables—trade” and “Long-term receivables” in the accompa-nying Consolidated Balance Sheets, are as follows:
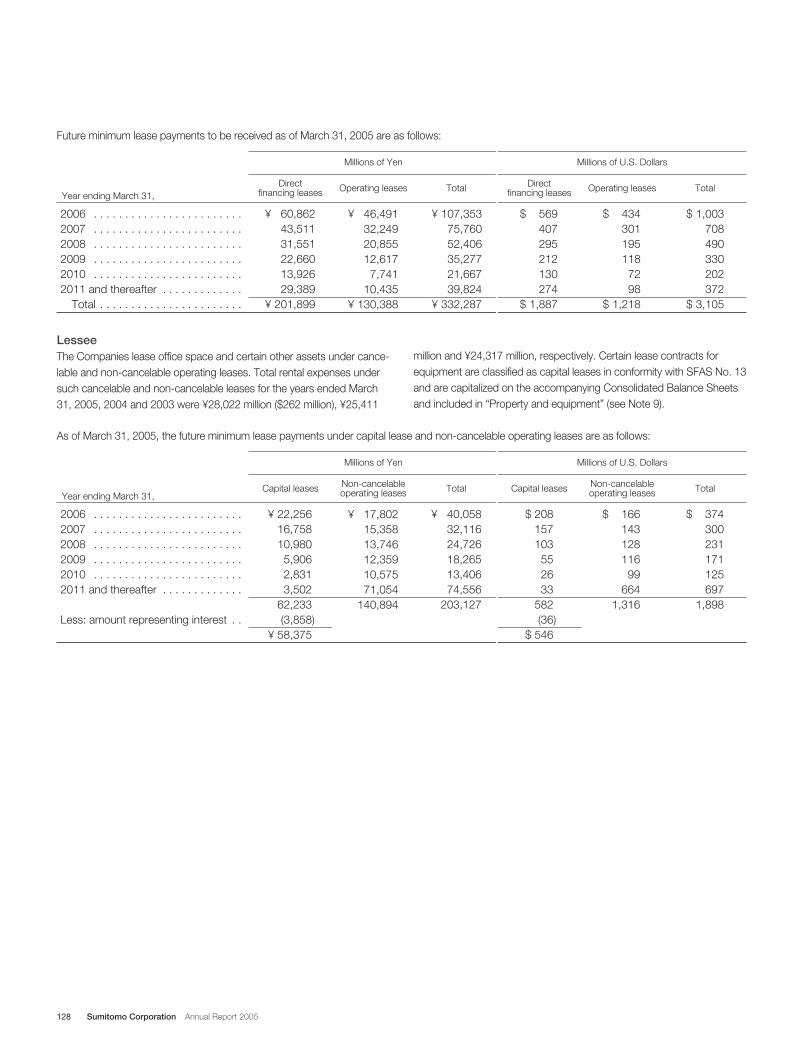
128 Sumitomo Corporation Annual Report 2005
Future minimum lease payments to be received as of March 31, 2005 are as follows:
2006 . . . . . . . . . . . . . . . . . . . . . . . .2007 . . . . . . . . . . . . . . . . . . . . . . . .2008 . . . . . . . . . . . . . . . . . . . . . . . .2009 . . . . . . . . . . . . . . . . . . . . . . . .2010 . . . . . . . . . . . . . . . . . . . . . . . .2011 and thereafter . . . . . . . . . . . . .
Total . . . . . . . . . . . . . . . . . . . . . . .
$ 569407295212130274
$ 1,887
$ 1,003708490330202372
$ 3,105
TotalDirect financing leases
$ 434301195118
7298
$ 1,218
Operating leases
Millions of U.S. Dollars
¥ 60,86243,51131,55122,66013,92629,389
¥ 201,899
¥ 107,35375,76052,40635,27721,66739,824
¥ 332,287
TotalDirect financing leases
¥ 46,49132,24920,85512,617
7,74110,435
¥ 130,388
Operating leases
Millions of Yen
Year ending March 31,
2006 . . . . . . . . . . . . . . . . . . . . . . . .2007 . . . . . . . . . . . . . . . . . . . . . . . .2008 . . . . . . . . . . . . . . . . . . . . . . . .2009 . . . . . . . . . . . . . . . . . . . . . . . .2010 . . . . . . . . . . . . . . . . . . . . . . . .2011 and thereafter . . . . . . . . . . . . .
Less: amount representing interest . .
$ 208157103
552633
582(36)
$ 546
$ 374300231171125697
1,898
TotalCapital leases
$ 166143128116
99664
1,316
Non-cancelableoperating leases
Millions of U.S. Dollars
¥ 22,25616,75810,980
5,9062,8313,502
62,233(3,858)
¥ 58,375
¥ 40,05832,11624,72618,26513,40674,556
203,127
TotalCapital leases
¥ 17,80215,35813,74612,35910,57571,054
140,894
Non-cancelableoperating leases
Millions of Yen
Year ending March 31,
LesseeThe Companies lease office space and certain other assets under cance-lable and non-cancelable operating leases. Total rental expenses undersuch cancelable and non-cancelable leases for the years ended March31, 2005, 2004 and 2003 were ¥28,022 million ($262 million), ¥25,411
million and ¥24,317 million, respectively. Certain lease contracts forequipment are classified as capital leases in conformity with SFAS No. 13and are capitalized on the accompanying Consolidated Balance Sheetsand included in “Property and equipment” (see Note 9).
As of March 31, 2005, the future minimum lease payments under capital lease and non-cancelable operating leases are as follows:
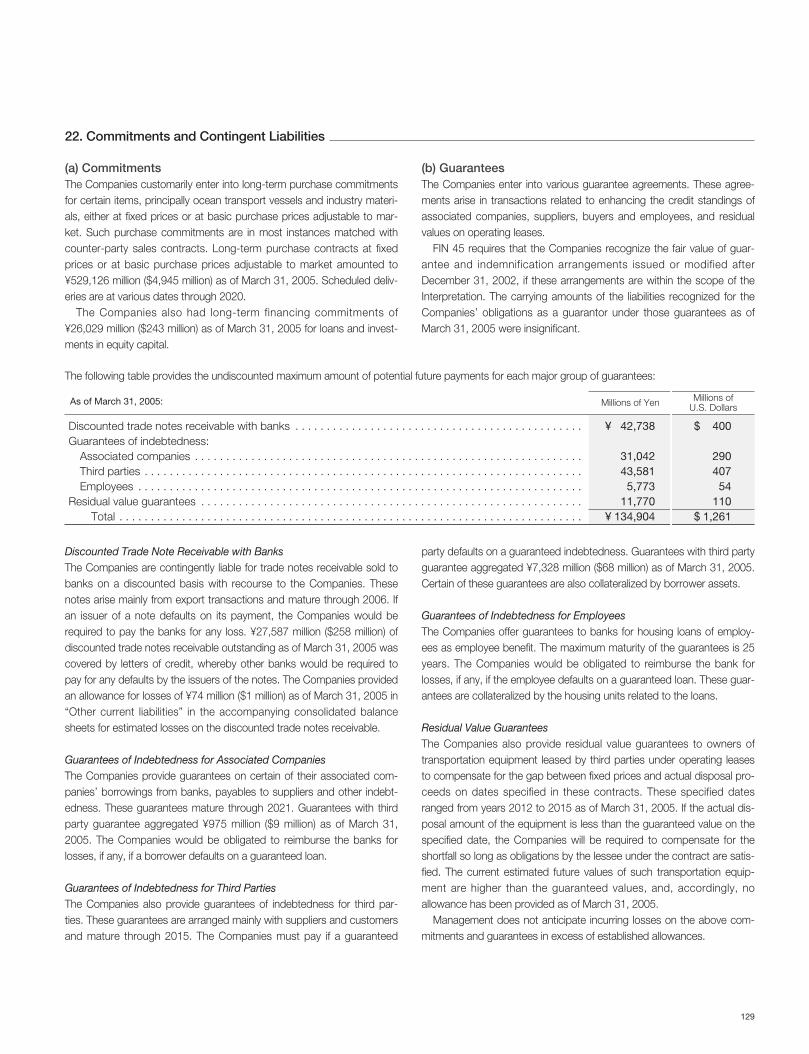
129
Discounted trade notes receivable with banks . . . . . . . . . . . . . . . . . . . . . . . . . . . . . . . . . . . . . . . . . . . . . .Guarantees of indebtedness:
Associated companies . . . . . . . . . . . . . . . . . . . . . . . . . . . . . . . . . . . . . . . . . . . . . . . . . . . . . . . . . . . . . .Third parties . . . . . . . . . . . . . . . . . . . . . . . . . . . . . . . . . . . . . . . . . . . . . . . . . . . . . . . . . . . . . . . . . . . . . .Employees . . . . . . . . . . . . . . . . . . . . . . . . . . . . . . . . . . . . . . . . . . . . . . . . . . . . . . . . . . . . . . . . . . . . . . .
Residual value guarantees . . . . . . . . . . . . . . . . . . . . . . . . . . . . . . . . . . . . . . . . . . . . . . . . . . . . . . . . . . . . .Total . . . . . . . . . . . . . . . . . . . . . . . . . . . . . . . . . . . . . . . . . . . . . . . . . . . . . . . . . . . . . . . . . . . . . . . . . .
¥ 42,738
31,04243,581
5,77311,770
¥ 134,904
$ 400
290407
54110
$ 1,261
Millions of Yen Millions ofU.S. Dollars
As of March 31, 2005:
Discounted Trade Note Receivable with BanksThe Companies are contingently liable for trade notes receivable sold tobanks on a discounted basis with recourse to the Companies. Thesenotes arise mainly from export transactions and mature through 2006. Ifan issuer of a note defaults on its payment, the Companies would berequired to pay the banks for any loss. ¥27,587 million ($258 million) ofdiscounted trade notes receivable outstanding as of March 31, 2005 wascovered by letters of credit, whereby other banks would be required topay for any defaults by the issuers of the notes. The Companies providedan allowance for losses of ¥74 million ($1 million) as of March 31, 2005 in“Other current liabilities” in the accompanying consolidated balancesheets for estimated losses on the discounted trade notes receivable.
Guarantees of Indebtedness for Associated CompaniesThe Companies provide guarantees on certain of their associated com-panies’ borrowings from banks, payables to suppliers and other indebt-edness. These guarantees mature through 2021. Guarantees with thirdparty guarantee aggregated ¥975 million ($9 million) as of March 31,2005. The Companies would be obligated to reimburse the banks forlosses, if any, if a borrower defaults on a guaranteed loan.
Guarantees of Indebtedness for Third PartiesThe Companies also provide guarantees of indebtedness for third par-ties. These guarantees are arranged mainly with suppliers and customersand mature through 2015. The Companies must pay if a guaranteed
party defaults on a guaranteed indebtedness. Guarantees with third partyguarantee aggregated ¥7,328 million ($68 million) as of March 31, 2005.Certain of these guarantees are also collateralized by borrower assets.
Guarantees of Indebtedness for EmployeesThe Companies offer guarantees to banks for housing loans of employ-ees as employee benefit. The maximum maturity of the guarantees is 25years. The Companies would be obligated to reimburse the bank forlosses, if any, if the employee defaults on a guaranteed loan. These guar-antees are collateralized by the housing units related to the loans.
Residual Value GuaranteesThe Companies also provide residual value guarantees to owners oftransportation equipment leased by third parties under operating leasesto compensate for the gap between fixed prices and actual disposal pro-ceeds on dates specified in these contracts. These specified datesranged from years 2012 to 2015 as of March 31, 2005. If the actual dis-posal amount of the equipment is less than the guaranteed value on thespecified date, the Companies will be required to compensate for theshortfall so long as obligations by the lessee under the contract are satis-fied. The current estimated future values of such transportation equip-ment are higher than the guaranteed values, and, accordingly, noallowance has been provided as of March 31, 2005.
Management does not anticipate incurring losses on the above com-mitments and guarantees in excess of established allowances.
The following table provides the undiscounted maximum amount of potential future payments for each major group of guarantees:
22. Commitments and Contingent Liabilities
(a) CommitmentsThe Companies customarily enter into long-term purchase commitmentsfor certain items, principally ocean transport vessels and industry materi-als, either at fixed prices or at basic purchase prices adjustable to mar-ket. Such purchase commitments are in most instances matched withcounter-party sales contracts. Long-term purchase contracts at fixedprices or at basic purchase prices adjustable to market amounted to¥529,126 million ($4,945 million) as of March 31, 2005. Scheduled deliv-eries are at various dates through 2020.
The Companies also had long-term financing commitments of¥26,029 million ($243 million) as of March 31, 2005 for loans and invest-ments in equity capital.
(b) GuaranteesThe Companies enter into various guarantee agreements. These agree-ments arise in transactions related to enhancing the credit standings ofassociated companies, suppliers, buyers and employees, and residualvalues on operating leases.
FIN 45 requires that the Companies recognize the fair value of guar-antee and indemnification arrangements issued or modified afterDecember 31, 2002, if these arrangements are within the scope of theInterpretation. The carrying amounts of the liabilities recognized for theCompanies’ obligations as a guarantor under those guarantees as ofMarch 31, 2005 were insignificant.
130 Sumitomo Corporation Annual Report 2005
(c) Litigation(1) The Copper-Related Litigation In June 1996, the Company announced that it had incurred significantlosses arising from the decade-long unauthorized copper trading by aformer employee.
As of March 31, 2005, the Company as a defendant is involved in oneclass action suit pending in Canada and one individual lawsuit pendingagainst it in the U.S. The class action suit purports to representCanadians and Canadian entities who purchased physical copper. Theplaintiff asserts damages for civil conspiracy and conduct that is contraryto the Canadian Competition Act et al, in the amount of CA$40 millionand punitive and exemplary damages in the amount of CA$10 million.The class action is now pending in Ontario Superior Court. The individuallawsuit in the U.S. has similar U.S. antitrust law claims, seeking at leastabout $355 million in damages (before trebling). In November 2003, theWisconsin federal court granted the motion to dismiss the case filed bythe Company and rendered an order dismissing the case. In March2004, the plaintiff appealed the case to the Court of Appeals for theSeventh Circuit. The Company expects to prevail as it has valid defenseto these actions and intends to vigorously defend itself. However, it is notpossible to predict or determine the outcome of such litigation, andaccordingly, the Company can provide no assurance that it will prevail.An unfavorable outcome could have a material adverse impact on its
consolidated results of operations, liquidity and financial position.In October 2004, the Company settled one case which it brought for
the purpose of recovering losses arising from the unauthorized coppertrading in the U.K. As of March 31, 2005, the Company is suing onecompany in Japan for the same purpose. Although in the lawsuit theCompany is seeking approximately ¥27.8 billion in damages, in May2004 the Tokyo District Court issued a judgment in favor of the defen-dant, and the Company has appealed to the Tokyo High Court. The suitis now pending in the High Court of Justice. No gain will be recognized inthe accompanying Consolidated Financial Statements until the recover-able amount has been determined, the legal process complete, and afavorable outcome is assured.
Settlement received and related attorney fees incurred for the yearended March 31, 2005 are recognized to earnings in “Settlements oncopper trading litigation” in the accompanying Consolidated Statementsof Income.
(2) Other Litigation In addition to the situation described in the preceding paragraph (1), theCompanies are also involved in certain legal actions and claims incidentalto its business. In the opinion of management, none of these actions orclaims will have a material adverse effect on the financial position onresult of operations of the Companies.
On April 28, 2005, the Company entered into a Share ExchangeAgreement with Sumisho Auto Leasing Corporation, a majority-ownedsubsidiary, pursuant to which the Company will exchange shares ofthe Company for shares of Sumisho Auto Leasing Corporation held byminority shareholders and Sumisho Auto Leasing Corporation willbecome a wholly-owned subsidiary of the Company. The shareexchange is expected to take place on August 2, 2005, and will beimplemented in accordance with Article 358 of the Code. For each
23. Subsequent Events
Sumisho Auto Leasing Corporation share, 5.03 shares of theCompany will be allotted. In connection with the share exchange, theCompany will issue 45,994,320 new shares. No allotment will bemade for the 10,271,000 shares of Sumisho Auto Leasing Corporationheld by the Company. There will be no increase in the Companies’“Common stock” but there will be an increase in the Companies’“Additional paid-in capital” on the Consolidated Balance Sheets as aresult of the share exchange.
131
Independent Auditors’ Report
Tokyo, JapanApril 28, 2005
The Board of Directors and ShareholdersSumitomo Corporation :
We have audited the accompanying consolidated balance sheets of Sumitomo Corporation and subsidiaries as of
March 31, 2005 and 2004, and the related consolidated statements of income, shareholders’ equity and compre-
hensive income, and cash flows for each of the years in the three-year period ended March 31, 2005, all expressed
in yen. These consolidated financial statements are the responsibility of the Company’s management. Our responsi-
bility is to express an opinion on these consolidated financial statements based on our audits.
We conducted our audits in accordance with auditing standards generally accepted in the United States of America.
Those standards require that we plan and perform the audit to obtain reasonable assurance about whether the
financial statements are free of material misstatement. An audit includes examining, on a test basis, evidence sup-
porting the amounts and disclosures in the financial statements. An audit also includes assessing the accounting
principles used and significant estimates made by management, as well as evaluating the overall financial statement
presentation. We believe that our audits provide a reasonable basis for our opinion.
In our opinion, the consolidated financial statements referred to above present fairly, in all material respects, the
financial position of Sumitomo Corporation and subsidiaries as of March 31, 2005 and 2004, and the results of their
operations and their cash flows for each of the years in the three-year period ended March 31, 2005, in conformity
with accounting principles generally accepted in the United States of America.
The accompanying consolidated financial statements as of and for the year ended March 31, 2005 have been
translated into United States dollars solely for the convenience of the reader. We have audited the translation and, in
our opinion, the consolidated financial statements expressed in Japanese yen have been translated into dollars on
the basis set forth in note 2 of the notes to the consolidated financial statements.

132 Sumitomo Corporation Annual Report 2005
The factors described below may conceivably materially affect
investors' decisions as risks relating to us and our subsidiaries. Unless
otherwise specified, information concerning the future presented herein
are forecasts based on our decisions, targets, certain premises or
assumptions as of the last day (March 31, 2005) of the consolidated
fiscal year and may differ materially from the actual results.
Risks Related to Our Business
The risk of our revenues and profitability fluctuating from
period to period unexpectedly
Our results of operations for any quarter or year are not necessarily
indicative of results to be expected in future periods. Our operating
results have historically been, and we expect they will continue to be,
subject to quarterly and yearly fluctuations as a result of a number of
factors, including:
• changes in prevailing economic and other conditions relating to our
businesses;
• variations in costs, sales prices and volume of our products and
services, and the mix of products and services we offer;
• changes in customer demand and/or our supply chains, which in
turn will often depend upon market conditions for the relevant
products, the success of our customers’ or suppliers’ businesses,
industry trends, and other factors;
• changes in the level of performance of our strategic investments,
which in turn will affect our gains and losses on sales of such
investments or may result in the write-off or impairment of such
investments;
• changes in our asset prices, including equity, real estate and
other assets, which in turn will affect our gains and losses on
sales of such assets or may result in the write-off or impairment of
such assets;
• changes in the financial and commodity markets; and
• changes in the credit quality of our customers.
As such, you should not rely on comparisons of our historical results of
operations as an indication of our future performance.
The risk that we may not be able to achieve the managerial
targets set forth in our medium-term business plans
As part of our efforts to strengthen our position as a leading global
business enterprise, we intend to increase our profitability and our
earnings base and to improve our financial strength and the efficiency
and effectiveness of our operations. As part of these continuing efforts,
we set and implement a medium-term business plan every two years.
In the medium-term business plan, we set certain quantitative and
qualitative targets and undertake efforts to achieve such targets while
monitoring the status of progress. The targets are set based on the
gathering and analysis of information deemed appropriate at the time of
such target-setting. However, since we may not be able to always
gather all the necessary information, we may not be able to achieve the
targets due to changes in the operating environment and other factors.
In our business plan, we use two key management measures that
we call “risk-adjusted assets” and “risk-adjusted return ratio,” which are
targets set for each of our industry-based business units and for our
company as a whole. These targets involve a certain statistical confi-
dence level, estimates and assumptions. Since they are different from
return on assets or any other measure of performance determined in
accordance with U.S. GAAP, they may not be useful to all investors in
making investment decisions.
The risk that economic conditions may change adversely
for our business
We undertake operations in over 70 countries, including Japan. Since
we are engaged in business activities and other transactions in a broad
range of industrial sectors in Japan and abroad, we are affected by not
only general Japanese economic conditions but also the economic
conditions of the relevant countries in which we operate and the world
economy as a whole.
Recently, economic conditions in key countries for our operations,
such as the United States, Russia, Indonesia and other countries in
Southeast Asia, have shown signs of recovery but have been adversely
impacted by events such as the continued fear of future terrorist
attacks and political instability. Although China has seen continuing
growth, there have been increasing concerns with respect to its ability
to maintain such growth. Some emerging markets in which we operate
have experienced hyperinflation, currency depreciation, and liquidity cri-
sis and may experience them again in the future.
As such, changes in economic conditions and consumer behavior in
key countries for our operations, including Japan, may adversely affect
our results of operations and financial condition.
Risks associated with intense competition
The markets for many of the industries in which we are involved are
intensely competitive. For many of our businesses, we are involved at
all levels of the supply chain and compete with companies that are
engaged in certain of the same businesses as we are, but that are
more concentrated in individual business segments. We also com-
pete with other integrated trading companies in Japan, which often
(Reference Information)
RISK FACTORSSumitomo Corporation and Subsidiaries
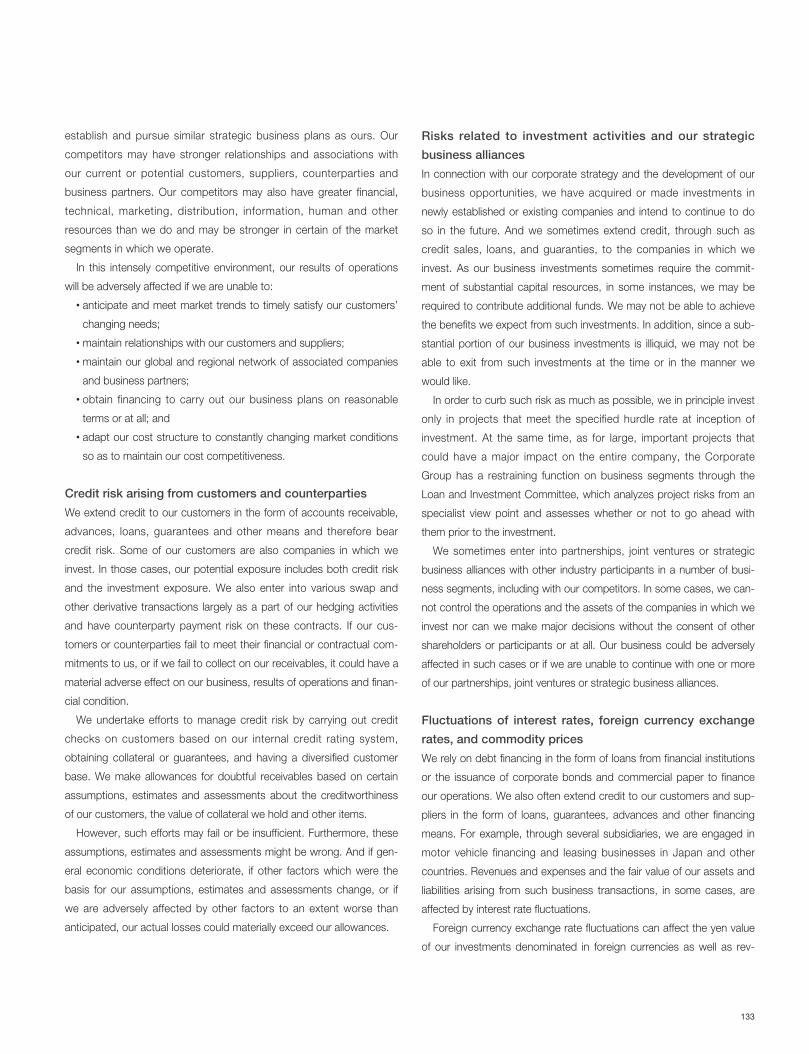
133
establish and pursue similar strategic business plans as ours. Our
competitors may have stronger relationships and associations with
our current or potential customers, suppliers, counterparties and
business partners. Our competitors may also have greater financial,
technical, marketing, distribution, information, human and other
resources than we do and may be stronger in certain of the market
segments in which we operate.
In this intensely competitive environment, our results of operations
will be adversely affected if we are unable to:
• anticipate and meet market trends to timely satisfy our customers’
changing needs;
• maintain relationships with our customers and suppliers;
• maintain our global and regional network of associated companies
and business partners;
• obtain financing to carry out our business plans on reasonable
terms or at all; and
• adapt our cost structure to constantly changing market conditions
so as to maintain our cost competitiveness.
Credit risk arising from customers and counterparties
We extend credit to our customers in the form of accounts receivable,
advances, loans, guarantees and other means and therefore bear
credit risk. Some of our customers are also companies in which we
invest. In those cases, our potential exposure includes both credit risk
and the investment exposure. We also enter into various swap and
other derivative transactions largely as a part of our hedging activities
and have counterparty payment risk on these contracts. If our cus-
tomers or counterparties fail to meet their financial or contractual com-
mitments to us, or if we fail to collect on our receivables, it could have a
material adverse effect on our business, results of operations and finan-
cial condition.
We undertake efforts to manage credit risk by carrying out credit
checks on customers based on our internal credit rating system,
obtaining collateral or guarantees, and having a diversified customer
base. We make allowances for doubtful receivables based on certain
assumptions, estimates and assessments about the creditworthiness
of our customers, the value of collateral we hold and other items.
However, such efforts may fail or be insufficient. Furthermore, these
assumptions, estimates and assessments might be wrong. And if gen-
eral economic conditions deteriorate, if other factors which were the
basis for our assumptions, estimates and assessments change, or if
we are adversely affected by other factors to an extent worse than
anticipated, our actual losses could materially exceed our allowances.
Risks related to investment activities and our strategic
business alliances
In connection with our corporate strategy and the development of our
business opportunities, we have acquired or made investments in
newly established or existing companies and intend to continue to do
so in the future. And we sometimes extend credit, through such as
credit sales, loans, and guaranties, to the companies in which we
invest. As our business investments sometimes require the commit-
ment of substantial capital resources, in some instances, we may be
required to contribute additional funds. We may not be able to achieve
the benefits we expect from such investments. In addition, since a sub-
stantial portion of our business investments is illiquid, we may not be
able to exit from such investments at the time or in the manner we
would like.
In order to curb such risk as much as possible, we in principle invest
only in projects that meet the specified hurdle rate at inception of
investment. At the same time, as for large, important projects that
could have a major impact on the entire company, the Corporate
Group has a restraining function on business segments through the
Loan and Investment Committee, which analyzes project risks from an
specialist view point and assesses whether or not to go ahead with
them prior to the investment.
We sometimes enter into partnerships, joint ventures or strategic
business alliances with other industry participants in a number of busi-
ness segments, including with our competitors. In some cases, we can-
not control the operations and the assets of the companies in which we
invest nor can we make major decisions without the consent of other
shareholders or participants or at all. Our business could be adversely
affected in such cases or if we are unable to continue with one or more
of our partnerships, joint ventures or strategic business alliances.
Fluctuations of interest rates, foreign currency exchange
rates, and commodity prices
We rely on debt financing in the form of loans from financial institutions
or the issuance of corporate bonds and commercial paper to finance
our operations. We also often extend credit to our customers and sup-
pliers in the form of loans, guarantees, advances and other financing
means. For example, through several subsidiaries, we are engaged in
motor vehicle financing and leasing businesses in Japan and other
countries. Revenues and expenses and the fair value of our assets and
liabilities arising from such business transactions, in some cases, are
affected by interest rate fluctuations.
Foreign currency exchange rate fluctuations can affect the yen value
of our investments denominated in foreign currencies as well as rev-
134 Sumitomo Corporation Annual Report 2005
enues and expenses and our foreign currency-denominated assets and
liabilities arising from business transactions and investments denomi-
nated in foreign currencies. Exchange rate fluctuations can also affect
the yen value of the foreign currency financial statements of our foreign
subsidiaries. Although we attempt to reduce such interest rate fluctua-
tions and foreign currency exchange risks, primarily by using various
derivative instruments, we are not able to fully insulate ourselves from
the effects of interest rate fluctuations and exchange rate fluctuations.
As a major participant in the global commodities markets, we trade
in a variety of commodities, including mineral, metal, chemical, energy
and agricultural products and invest in natural resource development
projects. As such, we may be adversely affected by the fluctuations in
the prices of the relevant commodities. Although we attempt to reduce
our exposure to price volatility by hedge-selling commodities, matching
the quantity and timing of buying and selling, and utilizing derivative
instruments for hedging purposes, we are not able to fully insulate our-
selves from the effects of commodity price movements.
Risks related to declines in Japanese real estate market or
impairment loss on fixed assets, etc.
Our real estate business involves developing, renting and managing of
and providing services to office buildings and commercial and residential
properties in Japan, especially in the Tokyo and Osaka metropolitan
areas. If the real estate market in Japan deteriorates, our results of oper-
ations and financial condition could be materially adversely affected.
Rent has started to rise in the Tokyo and Osaka metropolitan areas,
and land prices too are leveling off. These trends point to a recovery in
the real estate market. If land prices and rental values decline, however,
we may be forced to write down the value of our properties as well as
the value of land and buildings held for lease and land held for
development.
In addition to real estate, our property holdings are exposed to
impairment risk. As such, our business, operating results and financial
condition could be adversely affected.
Risks related to continued volatility of equity markets in
Japan and elsewhere
A significant portion of our investments consists of marketable equity
securities, particularly those of Japanese issuers. Our results of opera-
tion and financial conditions may be adversely affected if the Japanese
equity market declines in the future because we would incur impair-
ment losses for equity securities.
Risks regarding uncertainty about pension expenses
Declines in the Japanese stock market would reduce the value of our
pension plan assets, and could necessitate additional funding of the
plan by us and an increase in pension expenses. This could adversely
affect our results of operations and financial condition.
Concentration of risk exposure in specific fields
Some parts of our operations and businesses are concentrated in a few
particular markets, entities, and regions. As a result, if these operations
and businesses do not perform as we expect or if the economic condi-
tions in these markets and regions deteriorate unexpectedly, it could
have a disproportionately negative effect on our businesses and results
of operations. For example, we are involved in a large copper and gold
mine project, a large power plant project, the automobile lease and
finance business, liquefied natural gas projects and other business activ-
ities in Indonesia. As such, risk exposure is concentrated there.
Risks stemming from restrictions on access to liquidity
and capital
We rely on debt financing in the form of loans from financial institutions
or the issuance of corporate bonds and commercial paper etc. to
finance our operations. If financial markets are in turmoil and financial
institutions reduce their lendings to us and there is a significant down-
grade of our credit ratings by one or more credit rating agencies, we
may not be able to access funds when we need them on acceptable
terms, our access to debt capital markets may become more restricted
or the cost of financing our operations through indebtedness may
increase. This could adversely affect our results of operations and
financial condition.
Risks regarding laws and regulations
Our operations are subject to extensive laws and regulations covering a
wide range of fields in Japan and many other countries. These laws
and regulations govern, among other things, tariffs and other taxation,
repatriation of profits, business and investment approvals, import and
export activities (including restrictions based on national security inter-
ests), antitrust and competition, commercial activities, currency
exchange, distributor protection, consumer protection and environ-
mental protection. In some of the countries in which we operate, our
operations may subject us to additional or future relevant laws and reg-
ulations. Also particularly in developing countries with relatively nascent
legal systems, our burden of compliance may further increase due to
factors such as the lack of laws and regulations, unexpected interpre-
tations of existing laws and regulations and changing practices of regu-
135
latory, judicial and administrative bodies. Failure to comply with current
or future laws and regulations could lead to penalties and fines against
us and restrictions in our operations or damage to our reputation. If
that occurs, our business, results of operations and financial condition
could be materially adversely affected.
Risks related to legal actions, etc.
We are party to a number of legal actions and other disputes in Japan
and abroad. In performing our business, lawsuits arising incidentally and
claims that do not develop into lawsuits may be brought against us.
We incurred significant losses arising from the decade-long unautho-
rized copper trading by a former employee, which resulted in regulatory
investigations and civil lawsuits brought against us for claiming dam-
ages from us. We have already reached a settlement with regulators,
and investigations have been completed. Also, many of the civil law-
suits claiming damages have already been settled or resolved. And with
regard to those that are still pending, we think we can bring forward
sound counterarguments. We are vigorously litigating in these lawsuits
in seeking early resolutions of them. Due to the inherent uncertainty of
litigation, however, it is not possible to predict the ultimate outcome of
these actions at this time. There can be no assurance that we will pre-
vail in any action or that we will not be materially adversely affected by
such action in the future.
Risks regarding internal control over executives and
employees and regarding management of our information
and communications systems
Due to our size, as well as the diversity and geographic breadth of our
activities, our day-to-day operations are necessarily decentralized. The
nature of our operations requires extensive internal controls and man-
agement oversight to ensure compliance by our employees with appli-
cable laws and regulations and our internal policies. There can be no
assurance that we will succeed in preventing misconduct by our
employees or that such misconduct, if it should occur, will be detected
and remedied by our internal control and compliance systems.
Employee misconduct could have a material adverse effect on our
results of operations, expose us to legal and financial risks and com-
promise our reputation.
We are dependent on the proper functioning of our information and
communications systems to maintain our global operations. System
malfunction may result in disruptions of our operations. If we
encounter any problems with respect to our current information and
communications systems, our results of operations could be materially
adversely affected.
There is no assurance that our risk management systems
will effectively minimize various types of risks in our opera-
tions to appropriate levels.
Our extensive and diverse businesses expose us to various types of
risks. We conduct our business through nine industry-based business
units and two sets of regional operations, domestic and overseas. At
the same time, we are expanding our business activities into new areas.
Accordingly, in addition to the risks and uncertainties that we face as a
whole as an integrated trading company, each of our industry-based
business units and regional operations may be subject to risks inherent
in or relating to each industry, market and/or geographic focus.
Our existing risk management systems, which consist of various ele-
ments from risk measurement methodology and information system to
internal rule and organization structure, may not work satisfactorily with
respect to various risks. Furthermore, we may have no experience or
only limited experience with the risks relating to our new business activ-
ities, products and services.
In such cases, our new business activities, products and services
may require the introduction of more complex management systems
and additional management resources, such as human resources.
Moreover, a shortage of management resources, such as human
resources, may lead to a restriction of business operation.
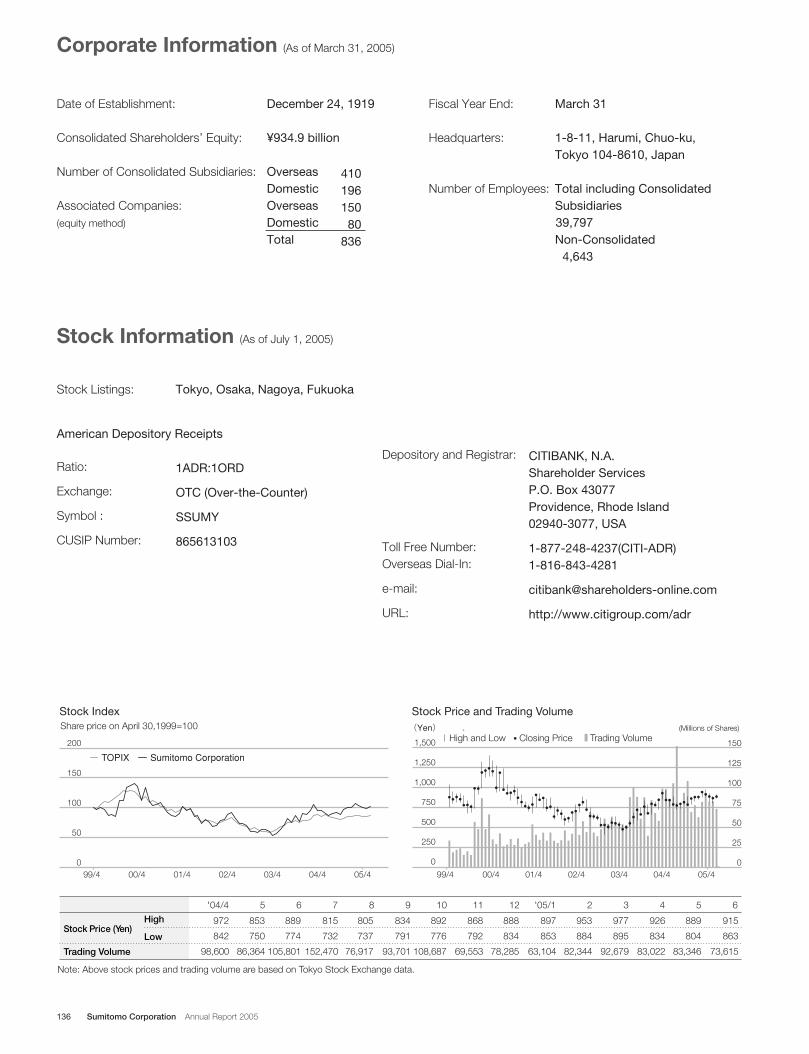
Date of Establishment:
Consolidated Shareholders’ Equity:
Number of Consolidated Subsidiaries:
Associated Companies: (equity method)
December 24, 1919
¥934.9 billion
OverseasDomestic OverseasDomesticTotal
Corporate Information (As of March 31, 2005)
'04/4 5 6 7 8 9 10 11 12 '05/1 2 3 4 5 6
Stock Price (Yen)
Note: Above stock prices and trading volume are based on Tokyo Stock Exchange data.
Trading Volume
High
Low
150
125
0
100
50
75
25
0
1,500
(Yen) (Millions of Shares)
1,250
1,000
750
500
250
0
200
150
100
50
Share price on April 30,1999=100
TOPIX
High and Low
Sumitomo Corporation
Closing Price Trading Volume
Stock Index Stock Price and Trading Volume
972 853 889 815 805 834 892 868 888 897 953 977 926 889 915
842 750 774 732 737 791 776 792 834 853 884 895 834 804 863
98,600 86,364 105,801 152,470 76,917 93,701 108,687 69,553 78,285 63,104 82,344 92,679 83,022 83,346 73,615
05/404/403/402/401/400/499/405/404/403/402/401/400/499/4
Stock Information (As of July 1, 2005)
410196150
80836
Fiscal Year End:
Headquarters:
Number of Employees:
March 31
1-8-11, Harumi, Chuo-ku, Tokyo 104-8610, Japan
Total including Consolidated Subsidiaries 39,797Non-Consolidated
4,643
Ratio:
Exchange:
Symbol :
CUSIP Number:
1ADR:1ORD
OTC (Over-the-Counter)
SSUMY
865613103
Stock Listings: Tokyo, Osaka, Nagoya, Fukuoka
Depository and Registrar:
Toll Free Number: Overseas Dial-In:
e-mail:
URL:
CITIBANK, N.A.Shareholder ServicesP.O. Box 43077Providence, Rhode Island02940-3077, USA
1-877-248-4237(CITI-ADR)1-816-843-4281
http://www.citigroup.com/adr
American Depository Receipts
136 Sumitomo Corporation Annual Report 2005

Sumitomo CorporationInvestor Relations Department
1-8-11, Harumi, Chuo-ku, Tokyo 104-8610, Japan
Telephone: 81(3)-5166-3522
Facsimile: 81(3)-5166-6292
e-mail: [email protected]
URL : http://www.sumitomocorp.co.jp/english/
For further information contact:

Printed in Japan
100% Recycled-content level�