sbi bluechip fund: an open ended growth scheme - feb 2016
TRANSCRIPT


SBI Blue Chip Fund
*Investors should consult their financial advisers if in doubt about whether the product is suitable for them.
Product LabelingThis product is suitable for investors
who are seeking*: Riskometer Long term investment. Investment in equity shares of companies
whose market capitalization is at least equal to or more than the least market capitalized stock of BSE 100 index to provide long term capital growth opportunities.
Index
• Why Large Caps & Why now?
• SBI Blue Chip Fund
• Investment Philosophy & Fund Details
• Why Invest?
• Performance

Why Large Caps?
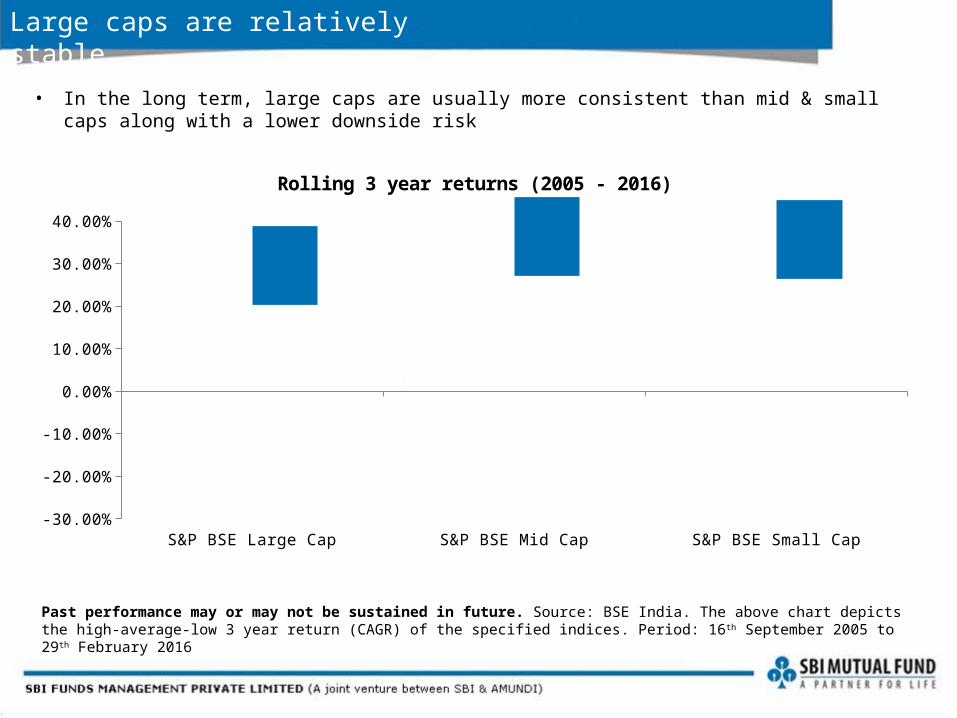
Large caps are relatively stable
• In the long term, large caps are usually more consistent than mid & small caps along with a lower downside risk
Past performance may or may not be sustained in future. Source: BSE India. The above chart depicts the high-average-low 3 year return (CAGR) of the specified indices. Period: 16th September 2005 to 29th February 2016
S&P BSE Large Cap S&P BSE Mid Cap S&P BSE Small Cap-30.00%
-20.00%
-10.00%
0.00%
10.00%
20.00%
30.00%
40.00%
Rolling 3 year returns (2005 - 2016)
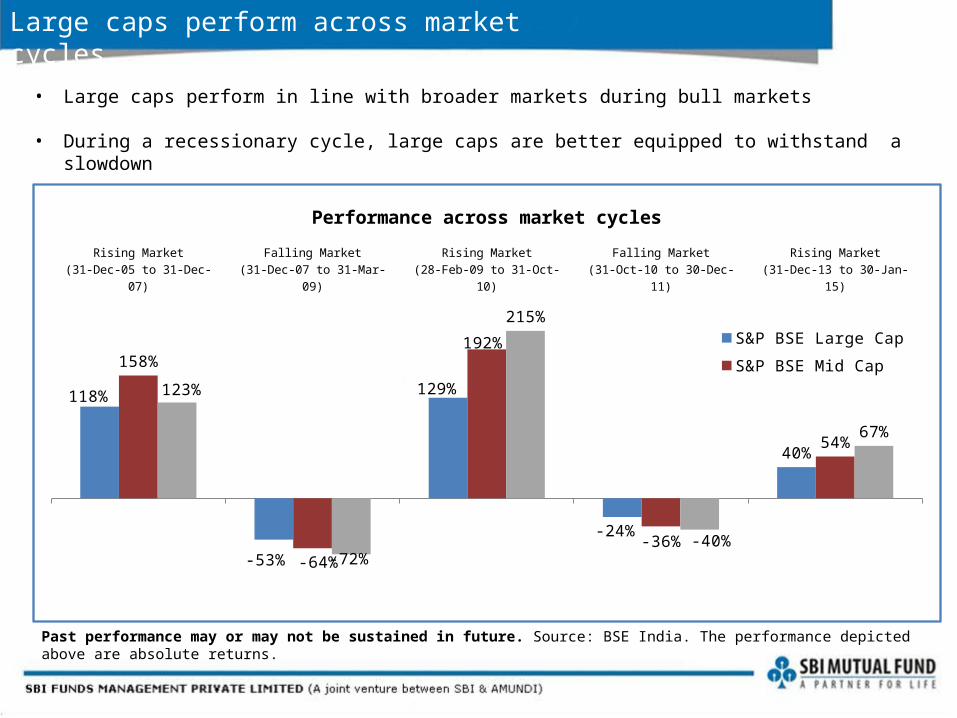
Large caps perform across market cycles
• Large caps perform in line with broader markets during bull markets
• During a recessionary cycle, large caps are better equipped to withstand a slowdown
Past performance may or may not be sustained in future. Source: BSE India. The performance depicted above are absolute returns.
Rising Market(31-Dec-05 to 31-Dec-07)
Falling Market(31-Dec-07 to 31-Mar-09)
Rising Market(28-Feb-09 to 31-Oct-10)
Falling Market(31-Oct-10 to 30-Dec-11)
Rising Market(31-Dec-13 to 30-Jan-15)
118%
-53%
129%
-24%
40%
158%
-64%
192%
-36%
54%
123%
-72%
215%
-40%
67%
Performance across market cycles
S&P BSE Large CapS&P BSE Mid CapS&P BSE Small Cap

Large caps have higher liquidity & lower drawdown
• Large caps are more widely traded making them more liquid than mid & small caps
• Large caps usually have lower drawdowns than mid & small caps restricting the fall in down markets
Source: Bloomberg. All listed Indian securities have been utilised for classifying market cap. The top 100 companies have been classified as large cap & the rest as mid & small cap. Data as on 29 th February 2016.
Maximum Drawdown (Sep 2005 – Feb-16)
S&P BSE Large Cap -61.6%
S&P BSE Mid Cap -71.0%
S&P BSE Small Cap -76.1%
Large Cap
Mid and Small Cap
0 10 20 30
25.58
3.37
Average Volume Traded (in lacs)
SBI Blue Chip Fund
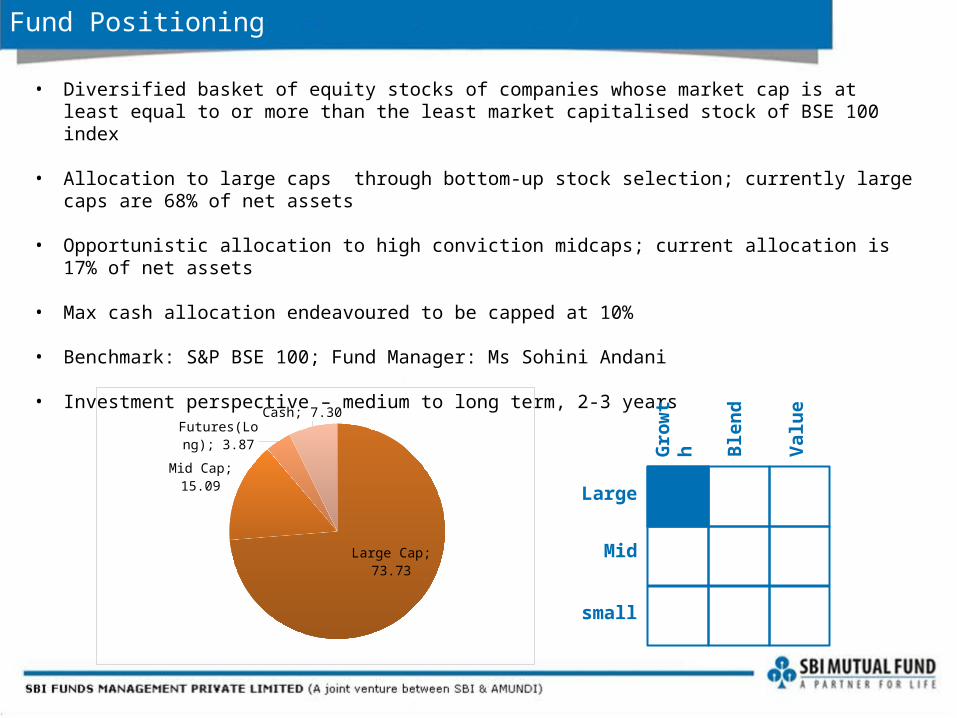
Fund Positioning
• Diversified basket of equity stocks of companies whose market cap is at least equal to or more than the least market capitalised stock of BSE 100 index
• Allocation to large caps through bottom-up stock selection; currently large caps are 68% of net assets
• Opportunistic allocation to high conviction midcaps; current allocation is 17% of net assets
• Max cash allocation endeavoured to be capped at 10%
• Benchmark: S&P BSE 100; Fund Manager: Ms Sohini Andani
• Investment perspective – medium to long term, 2-3 years
Grow
th
Blen
d
Valu
e
Large
Mid
small
Large Cap; 73.73
Mid Cap; 15.09
Futures(Long); 3.87
Cash; 7.30
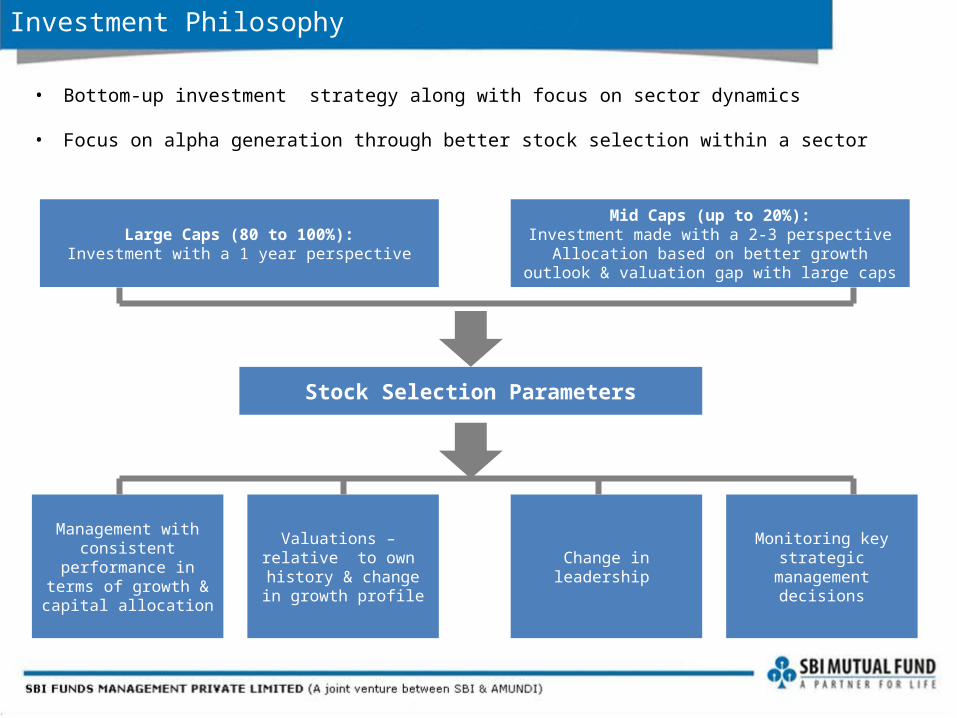
Investment Philosophy
Monitoring key strategic
management decisions
Stock Selection Parameters
Management with consistent
performance in terms of growth & capital allocation
Valuations – relative to own
history & change in growth profile
Change in leadership
Large Caps (80 to 100%):Investment with a 1 year perspective
Mid Caps (up to 20%):Investment made with a 2-3 perspective
Allocation based on better growth outlook & valuation gap with large caps
• Bottom-up investment strategy along with focus on sector dynamics
• Focus on alpha generation through better stock selection within a sector

Fund Details
Top 10 Sectors Top 10 Holdings
Sector %
FINANCIAL SERVICES 19.05
PHARMA 12.65
IT 9.70
AUTOMOBILE 8.98
ENERGY 6.85
CEMENT & CEMENT PRODUCTS 6.04
CONSUMER GOODS 6.01
INDUSTRIAL MANUFACTURING 5.71
CONSTRUCTION 4.21
FERTILISERS & PESTICIDES 3.13
Total 82.33
Holdings % HDFC BANK LTD. 5.89
SUN PHARMACEUTICALS INDUSTRIES LTD. 5.71
INFOSYS LTD. 5.45
RELIANCE INDUSTRIES LTD. 5.40
TATA CONSULTANCY SERVICES LTD. 3.08
MARUTI SUZUKI INDIA LTD. 2.72
THE RAMCO CEMENTS LTD. 2.58
ULTRATECH CEMENT LTD. 2.37
LARSEN & TOUBRO LTD. 2.33
YES BANK LTD. 2.21
Total 37.73
Data as on 29th February 2016
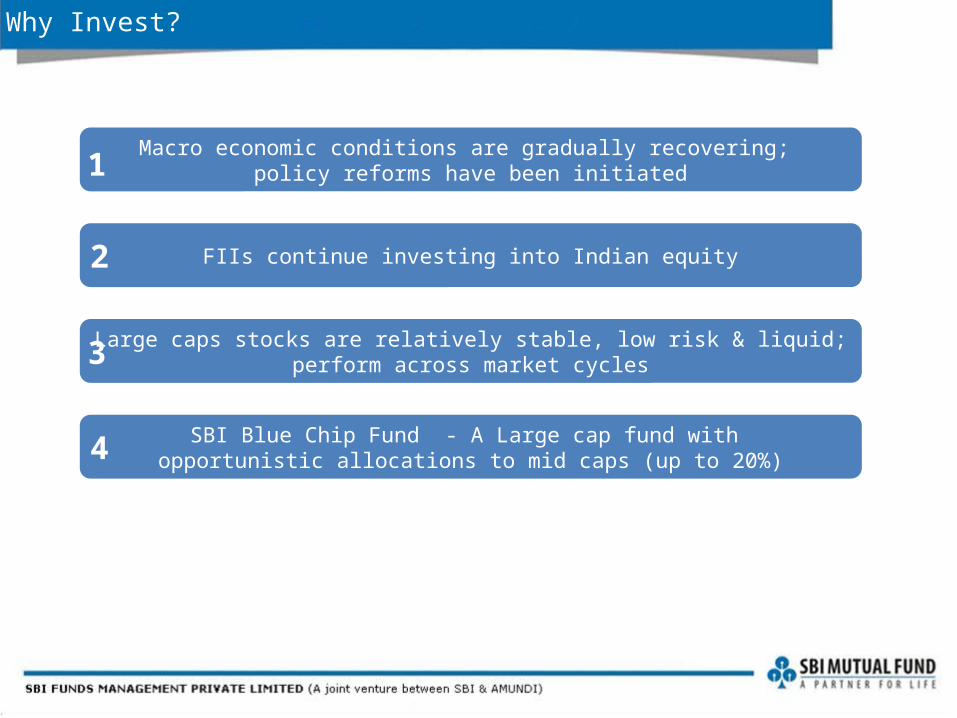
Why Invest?
Macro economic conditions are gradually recovering; policy reforms have been initiated
FIIs continue investing into Indian equity
Large caps stocks are relatively stable, low risk & liquid;perform across market cycles
SBI Blue Chip Fund - A Large cap fund with opportunistic allocations to mid caps (up to 20%)
1
2
3
4
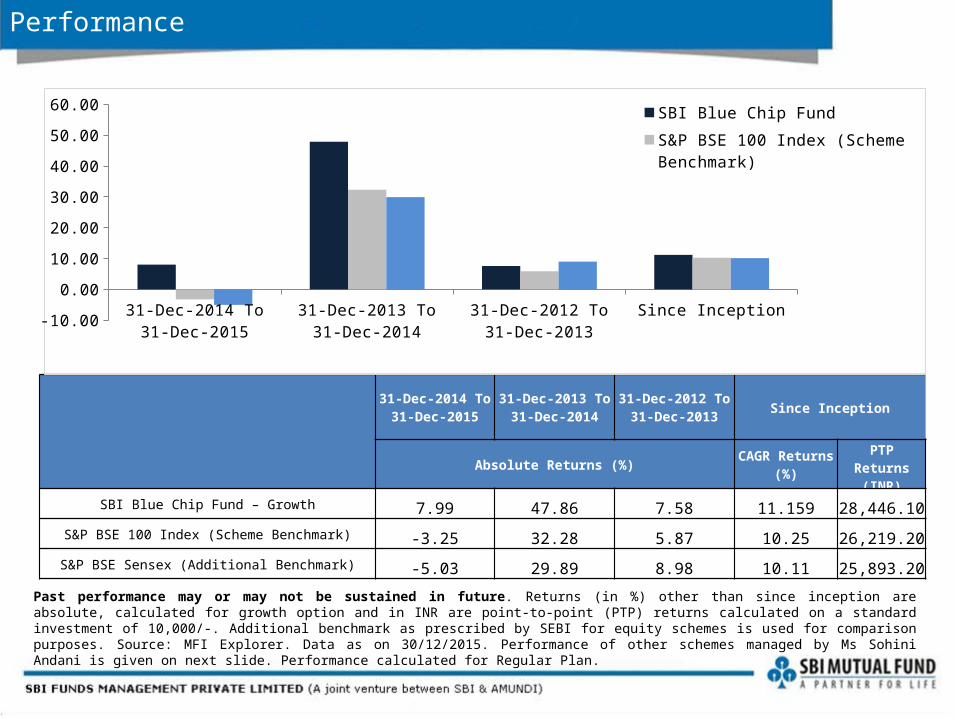
Past performance may or may not be sustained in future. Returns (in %) other than since inception are absolute, calculated for growth option and in INR are point-to-point (PTP) returns calculated on a standard investment of 10,000/-. Additional benchmark as prescribed by SEBI for equity schemes is used for comparison purposes. Source: MFI Explorer. Data as on 30/12/2015. Performance of other schemes managed by Ms Sohini Andani is given on next slide. Performance calculated for Regular Plan.
Performance
31-Dec-2014 To 31-Dec-2015
31-Dec-2013 To 31-Dec-2014
31-Dec-2012 To 31-Dec-2013 Since Inception
Absolute Returns (%) CAGR Returns (%)
PTP Returns
(INR)SBI Blue Chip Fund – Growth 7.99 47.86 7.58 11.159 28,446.10
S&P BSE 100 Index (Scheme Benchmark) -3.25 32.28 5.87 10.25 26,219.20S&P BSE Sensex (Additional Benchmark) -5.03 29.89 8.98 10.11 25,893.20
31-Dec-2014 To 31-Dec-2015
31-Dec-2013 To 31-Dec-2014
31-Dec-2012 To 31-Dec-2013
Since Inception-10.00
0.00
10.00
20.00
30.00
40.00
50.00
60.00 SBI Blue Chip FundS&P BSE 100 Index (Scheme Benchmark)S&P BSE SENSEX (Additional Benchmark)

Performance of Schemes Managed by Sohini Andani
Managing since Sep-2010
31-Dec-2014 to 31-Dec-
2015
31-Dec-2013 To 31-Dec-
201431-Dec-2012 To
31-Dec-2013 Since Inception
Absolute Returns (%) CAGR Returns (%)
PTP Returns (INR)
SBI Magnum Midcap Fund – Growth 14.92 71.94 13.57 18.42 61,736.30
S&P BSE Midcap Index (Scheme Benchmark)7.43 54.69 -5.73 13.05 37,439.50
S&P BSE Sensex (Additional Benchmark)-5.03 29.89 8.98 14.01 41,014.60
Past performance may or may not be sustained in future. Returns (in %) other than since inception are absolute, calculated for growth option and in INR are point-to-point (PTP) returns calculated on a standard investment of 10,000/-. Additional benchmark as prescribed by SEBI for equity schemes is used for comparison purposes. Source: MFI Explorer. Data as on 30/12/2015. Performance calculated for Regular Plan.
• Mr. Navneet Munot Mr. Navneet Munot joined SBI Funds Management Pvt. Ltd. as Chief Investment Officer in Dec. 2008.
Prior to SBIFM he was the Head of Multi Strategies fund at Morgan Stanley Investment Management before which he worked as the Chief Investment Officer (Fixed Income and Hybrid Funds) of Birla Sun Life Asset Management Company Ltd. Navneet has been associated with the financial services business of the Birla group for over 13 years and worked in various areas such as fixed income, equities and foreign exchange. His articles on matters related to financial markets have widely been published. Navneet holds a Masters in Commerce and is also a rank holder Chartered Accountant. He is a charter holder of Chartered Financial Analyst Institute, US and Chartered Alternative Analyst Institute, US. He has also done Financial Risk Management, FRM from Global Association of Risk Professionals (GARP).
• Ms. Sohini AndaniMs. Sohini Andani joined SBI Funds Management Pvt. Ltd. as Head of Research in 2007 and was subsequently promoted as a portfolio manager in 2010. Prior to joining SBIFM, Sohini was a senior research analyst at ING Investment Management. Sohini has over 11 years of experience in research on the sell side. Her previous assignments were with leading broking outfits like ASK Raymond James, LKP Shares and Securities, Advani Share Brokers and KR Choksey Shares and Securities. Sohini is a commerce graduate from Mumbai University and a Chartered Accountant from ICAI
Biographies
Disclaimer
Mutual Fund investments are subject to market risks, read all scheme related documents carefully.
This presentation is for information purposes only and is not an offer to sell or a solicitation to buy any mutual fund units/securities. The views expressed herein are based on the basis of internal data, publicly available information & other sources believed to be reliable. Any calculations made are approximations meant as guidelines only, which need to be confirmed before relying on them. These views alone are not sufficient and should not be used for the development or implementation of an investment strategy. It should not be construed as investment advice to any party. All opinions and estimates included here constitute our view as of this date and are subject to change without notice. Neither SBI Funds Management Private Limited, SBI Mutual Fund nor any person connected with it, accepts any liability arising from the use of this information. The recipient of this material should rely on their investigations and take their own professional advice