for personal use only · 2014. 3. 21. · keiran wulff, his management team and all our employees...
TRANSCRIPT

a
Annual ReportFor the six months ended 31 December 2013
ABN 71 130 651 437
For
per
sona
l use
onl
y

Contents
Chairman’s Letter 1
Managing Director’s Report 2
Review of Operations 4
Traditional Owners 14
Community 16
Corporate Governance Statement 19
Directors’ Report 27
Remuneration Report 33
Auditor’s Independence Declaration 40
Consolidated Statement of Financial Position 42
Consolidated Statement of Profit or Loss and Other Comprehensive Income 43
Consolidated Statement of Changes in Equity 44
Consolidated Statement of Cash Flows 45
Notes to the Financial Statements 46
Directors’ Declaration 84
Independent Audit Report 85
Additional ASX Information 87
Corporate Directory 89
Front cover: Enerdrill workover rig at Ungani production site
For
per
sona
l use
onl
y

1
In addition, Buru Energy’s Annual General Meetings will now occur in the first half of the calendar year, with our 2014 AGM scheduled for May.
During this six month period, Buru Energy completed the 3D seismic acquisition at Ungani and workovers of Ungani 1 and 2, which ultimately led to the recommencement of extended production testing. Ungani crude is now being exported through Wyndham and sold into the South East Asian market, which is a great achievement by Buru Energy’s operational and commercial teams.
Other milestones during this shortened reporting period included the mobilisation of a new rig into the Canning Basin to drill Ungani 3, the 2D seismic survey over the Ungani trend to firm up 2014 drilling targets, and the completion of a massive ~44,000 sq km
airborne geophysical survey over the Company’s eastern desert and central licenses.
On behalf of the Board, I wish to thank Keiran Wulff, his management team and all our employees and contractors for their hard work during the last six months of 2013. The Board looks forward enthusiastically to the 2014 calendar year.
Yours sincerely
Graham RileyChairman
Chairman’s Letter
On behalf of the Company, I am pleased to present to you Buru Energy Limited’s Financial Report for the period 1 July 2013 to 31 December 2013. Following the change last year of our financial year end from 30 June to 31 December, which aligns our Financial Statements with our Joint Ventures, we are required to provide a full financial report for the six month period ending 31 December 2013. Going forward, Buru Energy will release half year financial reports for each six month period ending 30 June, and Annual Reports will be prepared for each twelve month period ending 31 December.
For
per
sona
l use
onl
y

2
Managing Director’s Report
Despite it being only six months since we last reported to you, there have been considerable advances across all of the Company’s activities; in exploration, in development and most importantly in returning to production testing at Ungani. Highlights include:
• Completing the 3D seismic acquisition at Ungani
• Completing a 341km 2D seismic program to support 2014 drilling
• Recommencing Ungani Phase 1 extended production test
• First contract concluded for sale of approximately 40,000 barrels of Ungani crude into the Asian market
• Mobilisation of the Crusader 405 Rig to Ungani 3
• Finalisation of planning for the 2014 tight wet gas testing program and submission of our Environmental Plan for approval
To support the 2014 work program, a series of key corporate activities were undertaken during the period to enable us to progress our exploration and production plans.
• Completion of a $35 million fully underwritten Institutional Placement and an accompanying $5 million Share Purchase Plan
• Entering into an agreement with Mitsubishi Corporation to provide up to $27.5 million funding, contributing to Buru Energy’s share of costs for the development of the Ungani Field
• Mandating the National Australia Bank as Sole Lead Financier for an up to US $40 million reserve base loan facility for the Ungani Field development
The outlook for Buru Energy is very exciting. With oil production recommencing from the Ungani Field, our focus for 2014 is on securing a long term export facility in Broome to enable us to ramp up production to add value to the barrels we produce, continue to appraise the Ungani trend and identify potential Ungani lookalikes and carry out a definitive test program of the Laurel gas accumulation.
There have been considerable advances across all of the Company’s activities; in exploration, in development and most importantly in returning to production with export of the first shipment of Ungani crude.
• Entering into an agreement with Alcoa Australia to release up to $20 million for funding of Buru Energy’s share of the proposed Laurel Wet Gas accumulation appraisal program
In addition, we entered into agreements with Mitsubishi and Apache Energy, providing for Apache to farm-in to a number of joint venture exploration permits in the Canning Basin, primarily covering the Goldwyer Shale areas of the joint venture’s portfolio of assets.
For
per
sona
l use
onl
y

Oil Development
It was very pleasing to announce during the period that oil production from the Ungani Field had recommenced through an extended production test, in line with plans previously announced. The successful workover of Ungani 2 has seen oil flowing strongly, with flow rates up to 1,795 bopd. A significant milestone was achieved with the unloading of oil into storage tanks at the Wyndham Port facility in mid-December, and subsequently concluding the first contract for the sale of approximately 40,000 barrels of Ungani crude into the Asian market.
Production from the Ungani Field is planned to slowly ramp up through Q1 2014 and reach planned production levels in Q3 or Q4 2014.
Laurel Gas
The Laurel Formation contains a potentially world class regional basin centred continuous accumulation of wet gas that has significant value to all stakeholders and potentially could
create a very positive future for the people of the Kimberley region and all Western Australians. Significant work and progress towards environmental approvals has been undertaken during the period to prepare for a definitive test program of the Laurel Formation during 2014. If these initial evaluations are successful a structured testing program to define a pathway to commercialisation will be undertaken in 2015. The aim of the program is to have a definitive test of the ability of the Laurel Formation to flow gas at potentially commercial rates.
Exploration
During the period, Buru Energy’s exploration program focussed on remapping the Ungani to Yulleroo trend to identify priorities for the 2014 seismic program and the completion of the ~44,000 sq km airborne geophysical survey over the Company’s eastern desert and central licenses. The Company is planning to drill at least four exploration wells in 2014 and acquire both 2D and 3D seismic to support a very targeted program.
The outlook for Buru Energy is very exciting. With oil production recommencing from the Ungani Field, our focus for 2014 is on securing a long term export facility to enable us to ramp up production, continue to appraise the Ungani trend and identify potential Ungani lookalikes and carry out a definitive test program of Laurel Gas.
Managing Director’s Report
3
Safety
Safety is paramount to every activity we and our contractors undertake and during the period we continued to build our capability to ensure we could achieve an incident free operational culture, particularly during the recommencement of production at the Ungani Field. In addition we have made improvements in our safety systems, procedures and processes to support our operations.
Yours sincerely
Dr Keiran WulffManaging Director
For
per
sona
l use
onl
y
Review of Operations
4
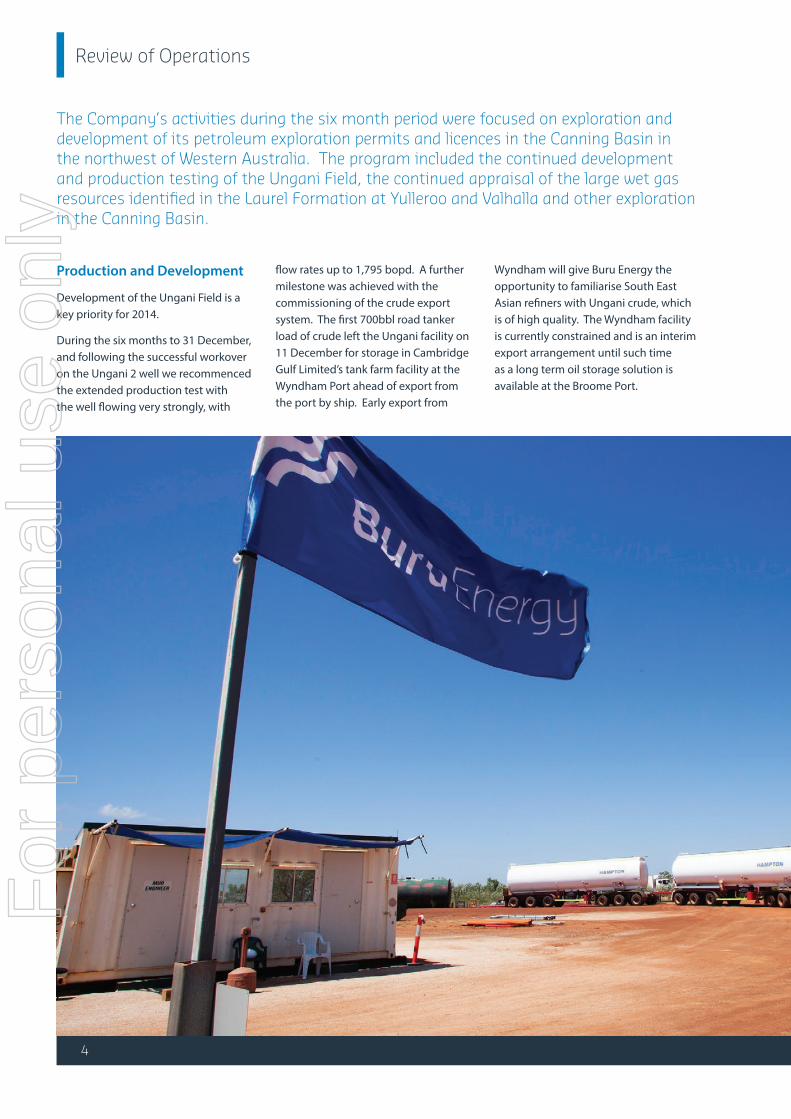
Wyndham will give Buru Energy the opportunity to familiarise South East Asian refiners with Ungani crude, which is of high quality. The Wyndham facility is currently constrained and is an interim export arrangement until such time as a long term oil storage solution is available at the Broome Port.
flow rates up to 1,795 bopd. A further milestone was achieved with the commissioning of the crude export system. The first 700bbl road tanker load of crude left the Ungani facility on 11 December for storage in Cambridge Gulf Limited’s tank farm facility at the Wyndham Port ahead of export from the port by ship. Early export from
Production and Development
Development of the Ungani Field is a key priority for 2014.
During the six months to 31 December, and following the successful workover on the Ungani 2 well we recommenced the extended production test with the well flowing very strongly, with
The Company’s activities during the six month period were focused on exploration and development of its petroleum exploration permits and licences in the Canning Basin in the northwest of Western Australia. The program included the continued development and production testing of the Ungani Field, the continued appraisal of the large wet gas resources identified in the Laurel Formation at Yulleroo and Valhalla and other exploration in the Canning Basin.
For
per
sona
l use
onl
y

Review of Operations
5
Construction works were completed during the period at the Port of Wyndham for the export of Ungani oil as part of Phase 1 of the Ungani development. This work was undertaken in co-operation with Cambridge Gulf Limited, the owner and operator of the Wyndham Port tank farm.
The Ungani 2 well has been producing strongly with the rate constrained as planned of up to 1,000 bopd to align with current trucking capacity. The well has substantially cleaned up and is now producing dry oil with very small amounts (<0.3% by volume) of the completion fluid used during the recent workover operations.
With the strong performance of the Ungani 2 well, the clean-up and flow testing of the Ungani 1 well will be undertaken as the well is needed for production.
As Ungani 1 is cleaned up and brought on line, additional trucking capacity will be brought on line with the objective of increasing production to the planned rate for this phase of the project of approximately 1,500 bopd.
The oil trucking and offloading system has been operating efficiently with no significant problems. Under the sale and purchase agreement with Mitsubishi, the first 40,000 barrels of Ungani oil was sold into the Asian market under a flexible delivery schedule in late December 2013 and the first export of Ungani crude oil from the Port of Wyndham took place in early February.
Blina and Sundown Oil Fields The Blina and Sundown Fields remained shut-in during the period. Continued remediation work has been undertaken during the period.
Analysis of the preliminary processed data has confirmed the potential of the Ungani Field discovered in 2011, and has highlighted a number of encouraging follow-up exploration prospects along the established Ungani structural trend. The data has also validated the Ungani North structure where oil was encountered by drilling in 2012. The 3D data will be used to determine locations for future development drilling.
Ungani Well WorkoversWorkovers of the Ungani 1 and Ungani 2 wells were completed in November. The operation to plug back the Ungani 2 well to mitigate water production was successful with the new bottom hole cement level 20m above the free water level. Ungani 1 has been recompleted as a dual production and water injection well.
To optimise cost and efficiency, the well test on Ungani North will occur in the second quarter of 2014 and will be linked to the mobilisation of equipment for the 2014 dry season activity. Preliminary results of the 3D seismic confirm that Ungani North is a well-defined structural closure and a long term production test tied to the Ungani facilities or drilling of a second well will be considered subject to the results of the test.
Ungani FieldThe Ungani Phase 1 Extended Production Test (EPT) recommenced during the period and is expected to continue through to the end of April 2014. This constitutes Phase 1 of the Ungani development.
The work required for start-up of the EPT primarily consisted of installation of water handling facilities and additional oil storage tanks, and the upgrading of control and monitoring systems. A training program and skills enhancement program was also undertaken with Buru Energy’s operators and supervisors to ensure readiness to operate and a strong focus on safety performance.
Buru Energy has also secured a trucking contract with Kimberley based transport company Hampton Transport. This is testament to regional suppliers being competitive, and we are pleased to be able to support local businesses.
Also during the reporting period we completed the acquisition and processing of the 3D seismic data over the Ungani Field and adjacent areas.
Ungani 3D Seismic ProgramData acquisition for the Ungani 3D seismic program recommenced on 6 September 2013 and was completed in October 2013. The completed survey size is some 241 sq km and was completed without any safety, heritage or environmental incidents.
A further milestone was achieved with the commissioning of the crude export system and the first 700bbl tanker load of crude left the Ungani facility
For
per
sona
l use
onl
y
Review of Operations
6
Dolomite reservoir at close to the prognosed depth, and was interpreted to have an oil column similar to the existing Ungani wells, but unfortunately the reservoir didn’t appear to have the same well developed vugular porosity as seen in the first two wells. The well was subsequently suspended for further evaluation.
Exploration
Frome Rocks 2D Data acquisition for the 341km Frome Rocks 2D seismic survey was completed during the period without safety, heritage or environmental incidents. The data will be processed in early 2014 and will provide additional 2D data along the Ungani trend. A number of attractive conventional structural leads have been identified along the trend from Ungani and the additional seismic data will help mature the leads to drillable status as well as identifying additional prospects.
exploration wells, horizontal oil and gas production wells and deep gas wells.
The Crusader 405 rig move from the southwest of Western Australia to the Ungani 3 site was completed during the period with the well spudding on 14 January 2014.
Ungani 3Subsequent to the end of the period, the Ungani 3 well was drilled in production application STP-PRA-0004 in exploration permit EP 391 some 100 kilometres to the east of Broome. The well location is some fifty kilometres from the Great Northern Highway along the Ungani access road.
Ungani 3 was designed to test what was interpreted from the 3D seismic data as an eastern structural lobe of the field. It was a considerable stepout given the size and nature of the field, with a view to evaluating the upside of the Ungani Field. The well intersected the Ungani
Drilling
Rig SelectionNegotiations for a suitable drilling rig during the period concluded with Buru Energy entering into a contract with Advanced Energy Group (AEG) for the supply of a Huisman LOC 400 drilling rig (known as the Crusader 405). The rig is fully automated and modularised with a depth capability of in excess of 5,000 metres. It is specifically designed as a low operating cost rig with a small environmental footprint compared to rigs previously used in the Canning Basin. The rig is capable of quick and efficient moves with a rig up/rig down process taking less than 30% of the time of conventional rigs of equivalent depth capacity. The rig represents a significant advancement in the drilling technology that has previously been available in onshore Western Australia. It has the capability to drill quick and efficient
For
per
sona
l use
onl
y
Review of Operations
7
The Company has been actively undertaking field activities exploring and producing in the Canning Basin for five years on lands subject to native title claims and determinations. All of Buru Energy’s operations are conducted following extensive consultation and heritage surveys with Traditional Owners to ensure that sites or areas of significance are not disturbed. Active monitoring programs by the Traditional Owners’ representatives are an integral part of any field operation. Buru Energy is committed to working cooperatively with the Traditional Owners and takes particular care to ensure that its activities do not disturb registered sites or areas of cultural significance. Buru Energy has also implemented comprehensive cultural induction awareness training for all staff and contractors.
Prioritising High Value ExplorationBuru Energy’s growth strategy has been founded on securing, exploring and developing high-potential, high-value oil and gas assets. These assets include a significant exploration portfolio of oil and gas prospects in the Canning Basin. The exploration program over the last two years has identified a potentially world class gas accumulation in the Laurel Formation and a highly significant oil discovery at Ungani.
As the exploration drilling program over the last two years has been successful in defining the Laurel wet gas accumulation, the 2014 program will focus on the Ungani oil trend with up to four wells planned.
Traditional Owner Relations
The negotiations for the agreements the Joint Venture requires for long term operations in the Canning Basin are ongoing. Due to the importance of the results of the discussion on future developments and activity, Buru Energy is ensuring that any agreements reached provide the basis for long term alignment.
Ungani Heritage Incident Investigation ConcludedBuru Energy was advised by the Department of Aboriginal Affairs (DAA) that it has concluded its investigation into the alleged heritage disturbance in the area of the Ungani 3D seismic survey as reported by KRED Enterprises in October 2012.
The DAA determined that Buru Energy and its contractors did not breach the Aboriginal Heritage Act 1972 (WA) and that there was no evidence presented of any disturbance to Aboriginal heritage material.
Southern Canning Airborne Geophysical program The Southern Canning Airborne Geophysical program was completed during the period. This program acquired airborne gravity gradiometry (AGG) and magnetic data in a ~44,000 sq km area covering eight of Buru Energy’s permits in the Great Sandy Desert. It was designed to acquire high quality geophysical data in an area in which seismic acquisition is more difficult, and to identify high potential areas in the Acacia Province where the joint venture is planning to acquire seismic in 2014. The previous geophysical data in the area is of high quality and provides excellent geological and geophysical insights beyond the sparse seismic data coverage.
Laurel Gas Appraisal ProgramThe Laurel Formation contains a regional basin centred continuous accumulation of wet gas. The Buru Energy and MC JV has drilled six wells between 2011 and 2013 aimed at defining the accumulation and five of these are suitable for a fracture stimulation and test program.
Working with world-class tight gas experts Halliburton, who have seconded a highly experienced Project Lead into Buru Energy’s team, planning for the gas evaluation program is progressing well. The team are developing an appraisal program drawing on the latest advances from analogous programs in Australia, the US and Canada.
Buru Energy has completed an Environmental Plan (EP) for the program and this has been submitted to the DMP. Buru Energy also made the decision to self-refer the EP to the Environmental Protection Authority for their consideration for the need for their assessment under the Environmental Protection Act 1986 (WA).
All of Buru Energy’s operations are conducted following extensive consultation and heritage surveys with Traditional Owners
For
per
sona
l use
onl
y
Review of Operations
8
Environment
Over the last six months Buru Energy has continued to build on our strong environmental performance, ensuring that our work activities are carried out in an environmentally sustainable manner. Sound environmental management and stewardship is each and every employee and contractor’s responsibility.
Our environmental management team is responsible for ensuring that we have the systems and programs in place to achieve industry excellence, review and improve our Environmental Plans and
proactively manage our environmental performance.
We aim to ensure that we exceed our regulatory obligations, as mandated by a range of government agencies including the Department of Mines and Petroleum, the Department of Environmental Regulation and, where appropriate, the Environmental Protection Authority. To ensure that the environmental values of the activity areas and surrounds are protected during the activity, the Company sets key environmental performance objectives for each of the environmental
values. The environmental performance objectives are met through the implementation of environmental performance standards including regulatory requirements, which will be executed in accordance with the Company’s policies and procedures. There were no reportable environmental incidents in 2013.
Our priorities for the reporting period remained constant, directed towards water management, biodiversity and a range of research and monitoring programs.
For
per
sona
l use
onl
y

Review of Operations
9
Water Management Our water management strategy is focused on groundwater monitoring to ensure we can accurately determine our impact, if any, on this precious resource.
During the period we have continued our program of baseline studies and development of hydrogeological models. We will continue to pursue best practice in groundwater management across all our operations. Buru Energy has established a strategic partnership with internationally leading water consulting and engineering company
MWH Global. This partnership will aim to deliver world best practices are implemented in managing water resources.
BiodiversityThe Canning Basin is a unique natural environment with rich and diverse flora and fauna. Minimising our impact on this biodiversity requires a strong understanding of it and we continue to undertake a range of studies to minimise the impact of our operations. Prior to undertaking activities, the Company undertakes Level 1 flora
and fauna surveys in accordance with Environmental Protection Authority and Department of Parks and Wildlife guidance statements.
We work closely with the Traditional Owners, drawing on their knowledge and experience to understand the biodiversity of the region. This is complemented with the work we do with the Department of Mines and Petroleum, Department of Agriculture and Food, the Department of Environmental Regulation and the Kimberley Rangelands Biodiversity
Minimising our impact on this biodiversity requires a strong understanding of it and we continue to undertake a range of studies to minimise the impact of operations
For
per
sona
l use
onl
y

Review of Operations
10
Association.
Health and Safety
Safety is a core value and principal operational focus for our employees and contractors. Every activity we undertake is directed towards our goal of incident free operations. We have developed and implemented a Health, Safety, Security, Environment and Community (HSSEC) Plan which has 13 key objectives for the business to focus on.
During the reporting period this plan was implemented across all of Buru Energy’s operations, building on existing operating and field safety policies, standards and procedures.
PerformanceIn the six months to December 2013, there were two contractor Lost Time Injuries (LTIs). In the first incident, a contractor tripped down some steps resulting in two fractured ribs and 14 days off work. In the second incident, a contractor walked into an open door on a truck resulting in a head laceration and four days off work. With no employee LTIs the combined Lost Time Injury Frequency Rate (LTIs per million hours worked) for 2013 was 6.77. Contractor Management is a key focus area for 2014.
InitiativesA range of new initiatives were introduced during the period, complementing the strategies already in place, particularly as production ramps-up. These include:
• Enhancing our security management system;
• Incident response training and exercise completed;
• Review and updating of our Spill Management Plans;
• Operational readiness assessment conducted by an independent consultant; and
• Strengthening our journey management systems.
We will continue to focus on employee and contactor safety as we progress through to full production.
Safety is a core value and principal operational focus for our employees and contractors
For
per
sona
l use
onl
y
Review of Operations
11
• Apache will be granted an option to earn a 40% interest in exploration permits 472, 476 and 477, up to a 40% interest in exploration permit 478 and up to a 50% interest in exploration permit 474 (“Acacia Permits”).
• Apache will pay Buru Energy and MC a non-refundable option fee equal to the greater of (a) $7.2 million and (b) 80% of the costs of the 20,000 sqkm aerogravity survey conducted by Buru Energy and MC over the Acacia Permits (excluding exploration permit 474) and a 650km seismic survey planned to be conducted by Buru Energy and MC on the Acacia Permits (excluding exploration permit 474) in 2014.
• If Apache exercises the option at the conclusion of the 2014 seismic program to acquire interests in the Acacia Permits, it will fund 80% of the costs of the first two exploration wells to be drilled in the Acacia Permits and, in the event of success in either or both of those wells, 80% of the first two appraisal wells. Apache will also reimburse Buru Energy for the costs of the recently completed 5,000 sq km aerogravity survey and 400km seismic survey planned to be conducted by Buru Energy on exploration permit 474 in 2014.
Buru Energy will remain as the operator of the Coastal Permits and Acacia Permits but under the terms of the agreements, Apache will, subject to completion of the relevant work programs, have the right to assume operatorship following a transition period. In the event that Apache elects to assume operatorship, Buru Energy will continue to be heavily involved in the community affairs and engagement programs.
Exploration and Working Capital FundingDuring the period Buru Energy undertook a modest equity raising to contribute funding for exploration and general working capital. The equity raising was a combination of a fully underwritten $35 million Institutional Placement (IP), and a non-underwritten Share Purchase Plan (SPP) capped at $5 million.
The IP was priced at $1.65 per share, an 8.8% discount to the 5-day VWAP of $1.81. The bookbuild was supported by new and existing Buru Energy shareholders. Buru Energy issued approximately 21 million new shares under the Institutional Placement, representing approximately 7.8% of the Company’s existing issued capital.
The SPP was heavily oversubscribed, with subscription applications of some $22 million being received from 2,092 shareholders before being scaled back to $5 million.
Apache farm inDuring the period Buru Energy entered into agreements with Mitsubishi Corporation (“MC”) and Apache Energy Limited (“Apache”) pursuant to which an Apache subsidiary will farm-in to a number of the Buru-MC exploration permits in the Canning Basin. The permits principally cover the Goldwyer Shale areas of the Buru-MC portfolio, and are prospective for shale oil and gas as well as for conventional sandstone reservoirs, particularly in the southern areas. Under the agreements, subject to satisfaction of certain conditions:
• Apache will earn a 50% interest in exploration permits 390, 471 and 473 and up to a 50% interest in exploration permit 438 (“Coastal Permits”) by agreeing to fund a A$25 million exploration program to be conducted on the Coastal Permits during 2014.
Corporate
Ungani Development FundingDuring the period Mitsubishi Corporation agreed to provide Buru Energy with up to $27.5 million to contribute to Buru Energy’s share of costs for the development of the Ungani Field through the acceleration of the major project infrastructure support payments under the 2010 farmin agreement between Buru Energy and Mitsubishi.
NAB has been mandated as Sole Lead Financier to arrange and provide a USD denominated debt facility for the Ungani Field development. The NAB mandate provides a Reserve Base Loan Facility of up to US$40 million. Buru Energy will adopt a conservative position with respect to debt levels to ensure conservative balance sheet management. Buru Energy has received a Term Sheet from NAB on acceptable terms and expects that a binding commitment will be received in due course, once a FID decision on the development of the Ungani Field has been made by the Joint Venture partners, on the same basis.
Laurel Wet Gas Evaluation FundingDuring the period Alcoa agreed, subject to certain conditions, to release up to $20 million for the funding of Buru Energy’s share of the proposed 2014 Laurel Wet Gas accumulation appraisal program. These funds are currently held in escrow and form part of the $40 million gas prepayment monies advanced to Buru Energy under the Alcoa gas sales contract.
For
per
sona
l use
onl
y

Review of Operations
12
• achieve technical, operational, commercial, safety and environmental excellence in its activities;
• high-grade its exploration portfolio to ensure that exploration in the near term is focused on prospects that have the highest potential for early commercialisation and can therefore provide operational cash flow to “bootstrap” further exploration and development activity;
• fully develop its technical data-base and technical understanding of its exploration portfolio;
• drill prospects that are rigorously technically controlled and that have a high chance of commercial success;
• achieve cost-effective drilling operations by ensuring contractor alignment with Buru Energy’s corporate objectives, safety and environmental goals and cost targets; and
• pursuing rapid commercialisation of any discoveries.
The Company’s immediate strategy is to progress the development of the Ungani Field into full scale production, to complete an appraisal program of the Laurel Formation project, and to recommence an active seismic and drilling exploration program for conventional oil prospects, with an initial focus on the Ungani trend.
Strategy
Buru Energy’s goal is to build capability through core skills, strategic alliances and by applying innovative solutions to deliver material benefits to its shareholders, the Kimberley community and the Traditional Owners of the areas in which it operates. We will identify and address key risks and will target our highest value assets while derisking the balance of the portfolio. We will also undertake aggressive portfolio management and optimisation to ensure the Company’s capital is focussed on highest priorities.
To achieve its goals, Buru Energy has adopted the following commercial objectives / strategy:
• apply innovative solutions in its approach to developing long term relationships with Traditional Owners to ensure that any benefits that flow through to the Traditional Owners includes a balance of financial support and long term business creation opportunities;
• apply appropriate and innovative techniques and strategies to explore and develop the petroleum resources of its exploration portfolio so that shareholders’ funds are used only for those activities that provide the highest rewards at the lowest cost;
Additional interest acquired in EP438During the period Buru Energy entered into an agreement with Gulliver Productions Pty Ltd (Gulliver), a wholly owned subsidiary of Key Petroleum Limited and Indigo Oil Pty Ltd (Indigo). The agreement resulted in:
• Buru Energy acquiring an additional 25% interest in exploration permit EP 438, which will increase Buru Energy’s interest in the permit to 62.5%; and
• Buru Energy transferring its interests in L15 and R1 to Gulliver and Indigo.
This transaction was completed subsequent to the end of the period. Buru Energy and Mitsubishi Corporation intend to transfer a 50% interest in EP 438 to a wholly owned subsidiary of Apache Energy Limited as part of the transaction described above. The holdings in the permit at the completion of this transfer to Apache will be:
• Buru Energy: 25%• Mitsubishi Corporation: 25%• Apache Energy: 50%
Buru Energy previously held a 15.5% interest in L15 and a 43.28% interest in R1. The transfer of these permits forms part of Buru Energy’s ongoing acreage rationalisation program.
For
per
sona
l use
onl
y

Review of Operations
13
determined and undetermined). Before any exploration activities can be undertaken by Buru Energy, the Company is required to obtain heritage clearances from the relevant native title holders or claimants to ensure that no Aboriginal sites will be interfered with by the proposed activities. Although the Company has a strong relationship with the various Traditional Owner groups and their representative bodies, there can often be lengthy delays associated with this process, due to weather, availability of Traditional Owners and representative body staff, and the number of clearances requested by other operators.
• Regulatory Approvals – Operating onshore Western Australia requires a large range of approvals (depending on the particular activity) from a number of government agencies including the Department of Mines and Petroleum, Department of Environment Regulation, Department of Water, and the Environmental Protection Authority (depending on the impacts of the activity). It is possible that Buru may experience delays in the receipt of approvals from the relevant agencies which can have an adverse impact on the Company’s ability to plan and undertake activities in the Canning Basin.
• Weather – Heavy rainfall associated with the Kimberley’s monsoonal wet season (December to March) can isolate sections of the road network in the Canning Basin, restricting access and hampering preparations for the drilling season. Buru Energy is able to conduct operations during the wet season in certain areas where access is available year round.
• Hydraulic stimulation – Hydraulic stimulation may form a significant part of the appraisal and development of Buru Energy’s unconventional resources. There has been significant public debate over potential environmental risks associated with hydraulic stimulation. Many of the concerns that have been raised with respect to hydraulic stimulation relate to coal seam gas exploration and are not directly relevant to hydraulic stimulation of shale and tight gas resources in the Canning Basin. Buru Energy has undertaken careful review of the concerns raised in regard to these activities and is confident it can undertake them whilst minimising long term harm to the environment.
• Traditional Owners – The Company’s exploration permits are located in the Kimberley region of Western Australia and overlap lands that are subject to native title claims (both
Risks
The key risks to the Company’s strategies are set out below. The Company considers that it can appropriately manage these risks without any material adverse effect on the Company’s operating position and/or balance sheet.
• Frontier Exploration – Buru Energy is exploring in a frontier basin, meaning its exploration program is high-risk, high-reward. While this has been de-risked to some extent due to Buru Energy’s significant recent successes, an unsuccessful exploration program may potentially compromise Buru Energy’s ability to raise further capital for ongoing exploration activity, if required.
• Availability of services – Australia does not have a robust land rig market, which in many cases may lead to delays in the commencement of Buru Energy’s work programs. This risk has been reduced given Buru Energy’s arrangement with Advanced Energy Services Pty Ltd for the supply of a modern fit for purpose drilling rig. Operators in Western Australia also may face difficulties in mobilising hydraulic stimulation equipment when required. Buru Energy has negotiated alliances with service providers to reduce this risk to as low as practicable.
For
per
sona
l use
onl
y
Traditional Owners
14
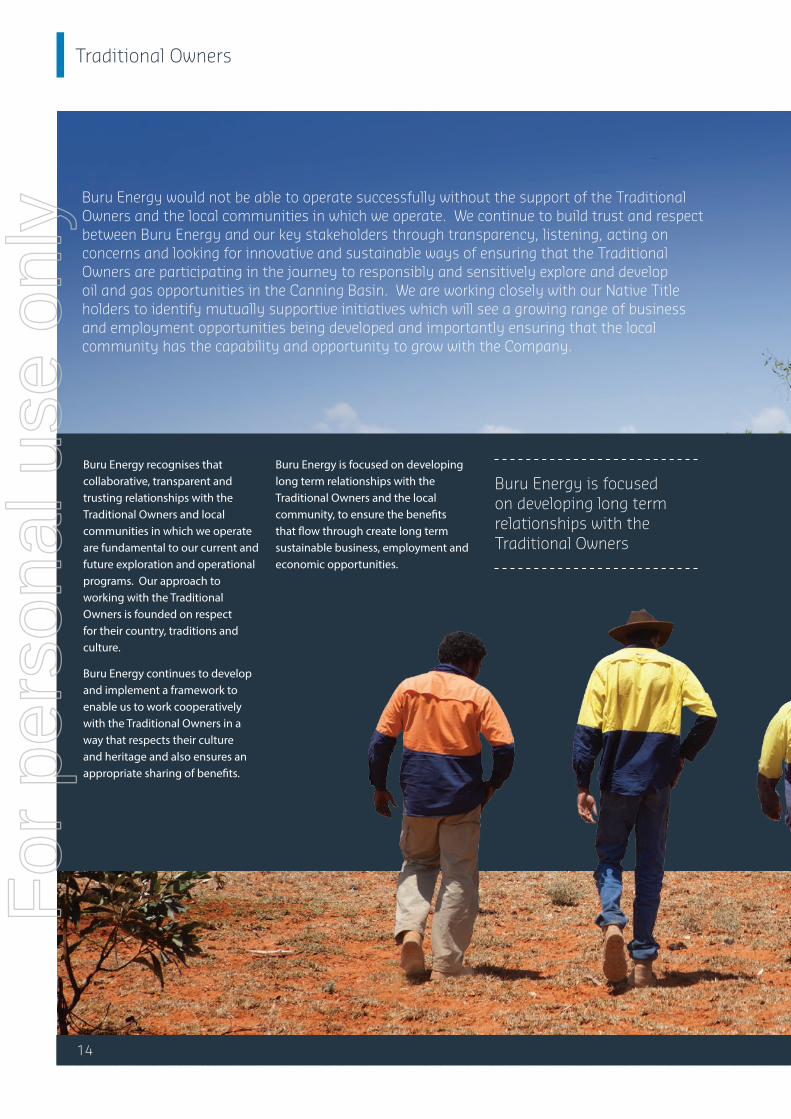
Buru Energy is focused on developing long term relationships with the Traditional Owners and the local community, to ensure the benefits that flow through create long term sustainable business, employment and economic opportunities.
Buru Energy is focused on developing long term relationships with the Traditional Owners
Buru Energy would not be able to operate successfully without the support of the Traditional Owners and the local communities in which we operate. We continue to build trust and respect between Buru Energy and our key stakeholders through transparency, listening, acting on concerns and looking for innovative and sustainable ways of ensuring that the Traditional Owners are participating in the journey to responsibly and sensitively explore and develop oil and gas opportunities in the Canning Basin. We are working closely with our Native Title holders to identify mutually supportive initiatives which will see a growing range of business and employment opportunities being developed and importantly ensuring that the local community has the capability and opportunity to grow with the Company.
Buru Energy recognises that collaborative, transparent and trusting relationships with the Traditional Owners and local communities in which we operate are fundamental to our current and future exploration and operational programs. Our approach to working with the Traditional Owners is founded on respect for their country, traditions and culture.
Buru Energy continues to develop and implement a framework to enable us to work cooperatively with the Traditional Owners in a way that respects their culture and heritage and also ensures an appropriate sharing of benefits.
For
per
sona
l use
onl
y

Traditional Owners
One of Buru Energy’s key employment activities with our Traditional Owners has been to establish an environmental cadet program. The program is aimed at providing training and employment opportunities in environmental management for local people. The program officially commenced in December with 11 cadets who will undertake training to achieve Certificate II and III in Conservation and Land Management. The program will progress throughout 2014 and
15
Discussions and negotiations with the Traditional Owners about our proposed work programs and operations have continued to progress. In addition to these negotiations, ongoing programs with the Traditional Owners included:
• engagement of Traditional Owners for heritage environmental monitoring;
• cultural awareness training and induction programs for new staff delivered by the Traditional Owners; and
• regular meetings to keep Traditional Owners informed of our approved operational activities, and to seek meaningful input and feedback, including participation in Traditional Owner community days to share information on Buru Energy’s activities, programs and answer questions.
is being run in conjunction with the Kimberley Training Institute and Kimberley Group Training. The cadets will provide water sampling, flora and fauna monitoring and general care for the environment to provide support across Buru Energy’s operations as part of the training program and future employment opportunities.
For
per
sona
l use
onl
y

16
Community
During the reporting period we supported a range of activities including the:
• Shinju Matsuri Festival of the Pearl;• Black Pearl Basketball Carnival with
the Hoops for Health Program;• Broome Rodeo;• Broome Rotary Club
– White Ribbon event;• 2013 Broome Sports Awards, with
the Outstanding Achievement Award and the Special Recognition Award;
• Looma Eagles participation in the Maali Football Carnival in Perth;
• Looma Men’s Integrity Conference; and
• Broome Chinatown Christmas Street Party.
Buru Energy formally launched its community engagement program for the broader Kimberley in October. The aim of this program is to give all segments of the community an opportunity to engage with Buru Energy to build an understanding of our operations and programs, through information sessions, briefings or “open day” style community events. This has included conducting presentations at Schools, to Community Groups and Sporting Clubs within Broome and in the broader Kimberley region.
The Company’s general community program contributes through economic activity and support of relevant local Kimberley programs and is focused on:
• providing direct benefits to the community and the people within it;
• minimising impact to the environment;
• supporting education and training and creating employment opportunities; and
• enhancing health, safety and emergency services.
Buru Energy is committed to supporting the communities in which we operate, and delivering community benefits to the Kimberley region.
For
per
sona
l use
onl
y

17
Community
We also have a strong focus on supporting local businesses in the Kimberley with contracts established with:
• Hampton Transport for the transport of produced oil to Wyndham;
• Indigenous Construction Resources Group Pty Ltd for site and civil works upgrades to existing facilities;
• Local catering and accommodation groups to support business activities; and
• Kimberley Training Institute and Kimberley Group Training for delivery of our environmental cadet program.
For
per
sona
l use
onl
y

Managing Director’s Report
18
For
per
sona
l use
onl
y
19
Corporate Governance Statement
This statement outlines the main corporate governance practices in place during the six month period. The Company’s corporate governance practices comply with the ASX Corporate Governance Principles and Recommendations (“ASX Recommendations”), unless otherwise stated.
Board of DirectorsThe respective roles and responsibilities of both the Board and management are set out in the Board Charter which can be viewed in the corporate governance section of the Company’s website www.buruenergy.com.
Roles and Responsibilities of the Board and Senior Executives (ASX’s Recommendation 1.1, 1.2 & 1.3)The Board is collectively responsible for the governance of the Company and for promoting its success. The Board’s primary purpose is to govern the Company on behalf of all shareholders. The Board’s specific job outputs are to maintain a link between the Company’s shareholders and its operations and to create and maintain governance policies that address the broadest levels of all decisions and situations. The Board retains the responsibility for setting the Company’s strategic direction and objectives and for setting limitations on the means by which management may achieve those objectives. Limitations on management are primarily imposed by approved corporate strategy and expenditure limits. The Board delegates to management the responsibility for developing the capability to achieve Buru’s aims and objectives and employing that capability within the limitations set by the Board. The Board monitors and maintains this delegation by requiring regular reporting by management to the Board.
The Board delegates a portion of its authority through management limitations, policies and holding the Chairman accountable. It also recognises in its policies, strategic direction and setting of objectives for management, its accountability to legal and ethical obligations and its broader responsibility to non-equity stakeholders and the community.
The mandate to lead Buru is placed by shareholders in the hands of the entire Board. The principles endorsed by the Board are as follows:
• No person within Buru, whether a Board member or a member of management, can have any authority unless the Board grants that authority.
• All Board members are accountable individually and as a whole for any lapses of performance or behaviour by Buru.• The Board possesses authority only as a group. The Chairman and individual Directors have no power unless specifically given
it by the Board collectively.
A Director or other officer of Buru who makes a business judgment will have met the requirements as a Director of Buru and their equivalent duties at common law and in equity, if they:
• make the judgment in good faith for a proper purpose;• do not have a material personal interest in the subject matter of the judgment;• inform themselves about the subject matter of the judgment to the extent they reasonably believe to be appropriate; and• rationally believe that the judgment is in the best interests of Buru.
The Director’s or officer’s belief that the judgment is in the best interests of Buru is a rational one unless the belief is one that no reasonable person in their position would hold.
The Board has developed a division of authority between the Chairman of the Board and the Managing Director which delineate the roles and responsibilities of each position. Senior executives are responsible for supporting the Managing Director and assisting him with the management of the Company in accordance with the delegated authority of the Board. Senior executives are responsible for reporting all matters which fall within the Company’s materiality thresholds at first instance to the Managing Director or, if the matter concerns the Managing Director, then directly to the Chairman.
For
per
sona
l use
onl
y
Corporate Governance Statement
20
Board Processes (ASX’s Recommendation 2.4, 4.1 & 8.1)Full Board meetings are conducted in accordance with the Company’s constitution at least nine times a year, but generally monthly, at venues, dates and times agreed, where practical, in advance. In accordance with the constitution, a Chairman has been appointed and the quorum for a meeting is two Directors. To assist in the execution of its responsibilities, the Board has established an Audit and Risk Committee and a Remuneration and Nomination Committee. Further details on both Committees are included later in this Corporate Governance Statement.
The agenda for each Board meeting is developed by the Company Secretary in consultation with the Managing Director and is approved by the Chairman. Board papers are distributed to Directors at least three business days before the meeting, unless the meeting has been called urgently. Board papers contain the information required for the Directors to make informed decisions in the efficient discharge of their responsibilities. The minutes of Board meetings are circulated, approved and signed by the Chairman within fourteen days of the date of the meeting.
Urgent matters that cannot wait until the next scheduled Board meeting and for which an impromptu Board meeting cannot be arranged are dealt with by a circular resolution in accordance with Buru’s Constitution (Article 11.22). Circular resolutions are normally preceded by telephone or email correspondence if practical, and are approved by the Managing Director before being circulated. The resolution is passed when it is signed by the last of the Directors. Signed circular resolutions are entered into the minute book.
Director EducationThe terms and conditions of the appointment and retirement of Non-executive Directors are set out in a letter of appointment, including expectations of attendance and preparation for all Board Meetings, minimum hourly commitment, appointments to other Boards, the procedures for dealing with conflicts of interest, and the availability of independent professional advice. Each new Director will undergo a formal induction at the earliest opportunity to enable them to gain an understanding of the Company’s financial, strategic, operational and risk management position and to participate fully and actively in Board decision-making. Directors also have the opportunity to visit Company facilities and meet with management to gain a better understanding of business operations. Directors are given access to continuing education opportunities to update and enhance their skills and knowledge.
Independent professional advice and access to company informationEach Director has the right to access all relevant Company information and to speak to and have access to management. Subject to prior consultation with and approval by the Chairman, each Director may seek independent professional advice in respect of the Company and the Board’s affairs from a suitably qualified adviser at the Group’s expense. A copy of the advice received by a Director in these circumstances will, subject to the Chairman’s discretion, be made available to all other members of the Board
Composition of the Board & Director Independence (ASX’s Recommendation 2.1, 2.2, 2.3 & 2.6)The names of the Directors of the Company in office at the date of this report, specifying which are independent, are set out in the Directors’ Report on pages 27 to 28.
The composition of the Board is determined using the following principles:
• a minimum of three and no more than eight Directors, with extensive knowledge relevant to the conduct of the Company’s business;
• a majority of independent Non-executive Directors;• a Non-executive independent Director as Chairman; and• all Directors are subject to re-election every three years (except for the Managing Director).
The Board should, collectively, have the appropriate level of personal qualities, skills, experience and time commitment to properly fulfil its responsibilities or have ready access to such skills where they are not available.
The Board considers the mix of skills and the diversity of Board members when assessing the composition of the Board. The Board assesses existing and potential Directors’ skills to ensure they have appropriate capabilities, experiences, skills and ability to add value to the Company’s business as a whole. The composition of the Board is also assessed having regard to the Company’s Diversity Policy, which is designed to promote and achieve diversity at all levels of Buru’s business, including the Board.
For
per
sona
l use
onl
y

Corporate Governance Statement
21
The Board assesses the independence of each Director annually in light of the interests declared by them. Directors will be considered independent if they meet the definition of an ‘Independent Director’ in accordance with the ASX Corporate Governance Council Corporate Governance Principles and Recommendations.
Board CommitteesRemuneration and Nomination Committee (ASX’s Recommendation 2.4, 2.5, 2.6, 8.1, 8,2, 8.3 & 8.4)The Remuneration and Nomination Committee oversees the appointment and induction process for Directors and Committee Members, and the selection, appointment and succession planning processes for the Company’s Managing Director, executives and senior management. The Committee makes recommendations to the Board on the appropriate skill mix, personal qualities, expertise and diversity of each position. When a Board vacancy exists or there is a need for particular skills, the Committee in consultation with the Board determines the selection criteria based on the skills deemed necessary. The Committee identifies potential Board candidates with advice from external consultants. The Board then appoints the most suitable candidate. Board candidates appointed through this process must stand for election at the next general meeting of shareholders following their appointment.
Approximately every three years, or more frequently if appropriate, the Remuneration and Nomination Committee (previously the Board) uses an external facilitator to undertake an evaluation of the performance of the Board, its Committees, individual Directors, and senior executives. The other Directors have an opportunity to contribute to the review process. The reviews generate recommendations to the Board, which votes on them. The Committee’s nomination of existing Directors for reappointment is not automatic and depends on, amongst other things, the outcome of the review process.
The Remuneration and Nomination Committee also conducts an annual review of the performance of the Managing Director and the senior executives reporting directly to him and the results are discussed at a Board Meeting. The Committee reviews and makes recommendations to the Board on remuneration packages and policies applicable to the executive officers and Directors of the Company and of other Group executives for the Group. It is also responsible for short and long term incentive performance packages, superannuation entitlements and retirement and termination entitlements.
The composition of the Remuneration and Nomination Committee is a minimum of three members and is comprised of only Non-executive Directors. The members of the Remuneration and Nomination Committee during the period were:
• The Hon. Peter Jones AM (Chairman) – Independent Non-Executive• Mr Graham Riley – Independent Non-Executive• Mr Eric Streitberg – Non-Executive (effective 5 February 2014)• Mr Austin Miller – Independent Non-Executive (resigned 5 February 2014)
The Managing Director, Company Secretary and General Manager Corporate Affairs are invited to Committee meetings, as required, to discuss senior executive and senior management performance and remuneration packages but they do not attend meetings involving matters pertaining to themselves.
The Remuneration and Nomination Committee will meet at least two times a year and as often as required as determined by the Chairman of the Committee. The Committee met five times during the six months ended 31 December 2013 and all members eligible to attend, attended all five meetings. Any Committee member may convene a meeting of the Committee and two members constitute a quorum. The Committee has the right to access management and may engage independent professional advisers as it requires, to assist it to discharge its purpose and responsibilities. The Company Secretary is the Secretary of the Remuneration and Nomination Committee. The minutes of Meetings are circulated, approved and signed by the Chairman within twenty one days of the date of the meeting.
Further details on the Remuneration and Nomination Committee, including its charter, the Board Renewal and Performance Evaluation Policy and the Diversity Policy can be viewed in the corporate governance section of the Company’s website www.buruenergy.com.
For
per
sona
l use
onl
y

22
Corporate Governance Statement
Audit and Risk Committee (ASX’s Recommendation 4,1, 4.2, 4.3, 4.4 ,7.1, 7.2, 7.3, & 7.4)The Audit and Risk Committee advises on the establishment and maintenance of a framework of internal control and appropriate ethical standards for the management of the Group.
The Audit and Risk Committee is responsible for oversight and review of:
• the annual and half yearly statutory financial statements;• procedures and issues that could have a significant impact on financial results (for example impairment testing);• Buru’s internal controls including accounting controls;• external auditor’s independence and monitoring the audit process in accordance with the international auditing standards
and any other applicable regulations; • the appropriateness of the external auditor’s provision of non-audit services;• the need for and, if required, the scope and conduct of internal audit;• the establishment and implementation of a risk management process to identify, assess, monitor and control risk;• management’s periodic risk assessments and recommendations;• the adequacy of Buru’s insurances;• compliance with appropriate regulations (including environmental and safety); and• reporting on reserves in accordance with the appropriate regulations and guidelines.
The Audit and Risk Committee reviews the performance of the external auditors on an annual basis and will meet with them during the year to:
• discuss the external audit plans, identifying any significant changes in structure, operations, internal controls or accounting policies likely to impact the financial statements and to review the fees proposed for the audit work to be performed;
• review the half-year and full year financial reports prior to lodgement with the ASX, and any significant adjustments required as a result of the auditor’s findings, and to recommend Board approval of these documents, prior to announcement; and
• review the results and findings of the auditor, the adequacy of accounting and financial controls, and to monitor the implementation of any recommendations made.
The Audit and Risk Committee oversees the establishment, implementation, and annual review of the Group’s Risk Management System. Management has established and implemented the Risk Management System for assessing, monitoring and managing all risks, including material business risks, for the Group (including sustainability risk). The Managing Director and the Chief Financial Officer have provided assurance, in writing to the Board, that the financial reporting risk management and associated compliance and controls have been assessed and found to be operating effectively. The operational and other risk management compliance and controls have also been assessed and found to be operating effectively.
Management provide the risk profile on a quarterly basis to the Audit and Risk Committee that outlines the material business risks to the Group. Risk reporting includes the status of risks through integrated risk management programs aimed at ensuring risks are identified, assessed and appropriately managed.
The Audit and Risk Committee reports the status of material business risks to the Board on a quarterly basis. Further details of the Group’s risk management policy and internal compliance and control system are available on the Company’s website.
The risks involved with oil and gas exploration generally and the specific risks associated with Buru’s activities in particular are regularly monitored and all exploration and investment proposals reviewed by the Committee include a conscious consideration of the issues and risks of each proposal. The Company’s executive and senior management have extensive experience in the industry and manage and monitor potential exposures facing Buru.
For
per
sona
l use
onl
y

23
Corporate Governance Statement
The Board is responsible for the overall internal control framework, but recognises that no cost-effective internal control system will preclude all errors and irregularities. Comprehensive practices have been established to ensure:
• capital expenditure and commitments above a certain size obtain prior board approval;• financial exposures are controlled, further details of the Group’s policies relating to interest rate management, forward
exchange rate management and credit risk management are included in Note 7 to the financial statements;• occupational health and safety standards and management systems are monitored and reviewed to achieve high standards
of performance and compliance with regulations;• business transactions are properly authorised and executed;• the quality and integrity of personnel;• financial reporting accuracy and compliance with the financial reporting regulatory framework; and• environmental regulation compliance.
Formal appraisals are conducted at least annually for all employees. Training and development and appropriate remuneration and incentives with regular performance reviews create an environment of cooperation and constructive dialogue with employees and senior management.
The Managing Director and the Chief Financial Officer have provided assurance in writing to the Board that the Group’s financial reports are founded on a sound system of risk management and internal compliance and control which implements the policies adopted by the board. Monthly actual results are reported against budgets approved by the Directors and revised forecasts for the year are prepared regularly.
The Group’s operations are subject to significant environmental regulation under both Commonwealth and State legislation in relation to its oil and gas exploration and production activities. The Group is committed to achieving a high standard of environmental performance and continuous improvement. It has established a Group-wide Environmental Policy together with operation and activity specific environmental management plans to manage this area of the Company’s activities.
Compliance with the requirements of environmental regulations and with specific requirements of site environmental licences was substantially achieved across all operations with no instances of material, non-compliance in relation to licence requirements noted.
Based on the results of enquiries made, the Board is not aware of any significant breaches during the period covered by this report.
Given the size and scale of Buru, it does not have an internal audit function.
The composition of the Audit and Risk Committee is a minimum of three members and is comprised of only Non-executive Directors. The members of the Audit and Risk Committee during the period were:
• The Hon. Peter Jones AM (Chairman) – Independent Non-Executive• Mr Graham Riley – Independent Non-Executive• Mr Eric Streitberg – Non-Executive (effective 5 February 2014)• Mr Austin Miller – Independent Non-Executive (resigned 5 February 2014)
The external auditors, the Managing Director and the Chief Financial Officer, are invited to Audit and Risk Committee meetings at the discretion of the Committee. The Managing Director and the Chief Financial Officer declared in writing to the Board:
• that the financial records of the Company for the financial year have been properly maintained; and • the Group’s financial reports for the six months ended 31 December 2013 comply with accounting standards and present a
true and fair view of the Group’s financial condition and operational results.
This statement is required annually.For
per
sona
l use
onl
y

24
Corporate Governance Statement
The Audit and Risk Committee will meet at least three times a year and as often as required as determined by the Chairman of the Committee. The Committee met three times during the period and all members eligible to attend participated in all three meetings. Any Committee member may convene a meeting of the Committee and two members constitute a quorum. The Committee has the right to access management and may engage independent professional advisers as it requires, assisting to discharge its purpose and responsibilities. The Company Secretary is the Secretary of the Audit and Risk Committee. The minutes of Meetings are circulated, approved and signed by the Chairman within twenty one days of the date of the meeting. The external auditor met with the Audit and Risk Committee twice during the year.
Further details on the Audit and Risk Committee including its charter can be viewed in the corporate governance section of the Company’s website www.buruenergy.com.
Ethical standardsCode of conduct (ASX’s Recommendations 3.1 & 3.5)Buru has established a Code of Conduct. The Code of Conduct applies to all Directors, senior executives, employees and contractors working on Buru sites. It sets out the practices necessary to maintain confidence in the Company’s honesty and integrity and the practices necessary to take into account the legal obligations and the expectations of the Company’s stakeholders and the responsibility and accountability of individuals for reporting and investigating reports of unethical practices.
The Code of Conduct sets out the procedure to be followed if there is, or may be, a conflict between the personal or other interests of a Director and the business of the Company including the notification of an interest to the Board and a withdrawal from a meeting in which the material matter is discussed. During the period, the Board approved the Whistle-blower Policy and this was fully implemented within the business in December 2013.
There have been no reports of a departure from the Code of Conduct.
Diversity (ASX’s Recommendations 3.2, 3.3 and 3.4)The Board is committed to having an appropriate level of diversity on the Board and in all areas of the Group’s business. The Board has established a policy regarding gender, age, ethnic and cultural diversity. Details of the policy are available on the Company’s website.
The key elements of the Group’s diversity policy are as follows:
• Disclose the Group’s commitment to attracting and retaining a diverse range of talented people to work in all levels of its business, from entry positions to Board members.
• Annual assessment of gender diversity on the Board and in all areas of the Group’s business and reporting against the gender diversity objectives approved by the Board.
The Group’s gender diversity as at the end of the reporting period was as follows:
Period 31 December 2013 30 June 2013
Gender Males Females Males Females
Level Number % Number % Number % Number %
Directors 5 100 0 0 5 100 0 0
Senior Executives 5 71 2 29 11 85 2 15
All Other Employees 44 60 29 40 29 54 25 46
TOTAL 54 64 31 36 45 62 27 38
For
per
sona
l use
onl
y

25
Corporate Governance Statement
During the six months ended 31 December 2013, the outcomes of the Company’s diversity objectives were as follows:
Diversity Objective Outcome
Establish an Aboriginal cadetship and traineeship program.
Environmental Cadet program established in conjunction with Kimberley Training Institute and the Kimberley Group Training. The program commenced in late 2013 and will run through 2014. There are 11 cadets from Buru’s Traditional Owner groups. In addition Buru has established an indigenous business administration traineeship in its Perth office.
Increase our Traditional Owner workforce by 10%.
Achieved, our current direct Traditional Owner workforce as a percentage of our direct employee numbers is now 21%.
Implement Cultural Awareness induction training for all new employees and contractors.
Achieved, an online induction has been developed, which has a significant section on Cultural Knowledge. In addition a face to face induction has been developed and implemented for all direct employees and long term contractors.
Develop and implement a mentoring program for women.
Partially achieved, a mentoring program for female employees has been scoped for implementation in 2014.
The Board has set the following new diversity objectives for the 2014 financial year:
• Continue to grow and develop our Aboriginal workforce
• Implement a mentoring program for women
• Develop and implement leadership training that includes a Diversity module
• Increase our partnering with local Kimberley Aboriginal businesses to provide services
Trading in Company securities by Directors and employees
The key elements of the Company’s share trading policy for Directors and employees are:
• identification of those restricted from trading – directors and senior executives may acquire shares in the Company, but are prohibited from dealing in Company shares or exercising options:
- in respect of a well drilling program in which Buru has an interest, from the date on which the casing string above the first objective is set (or such earlier time or event as may be notified to staff by the Managing Director) until the close of trading on the day that the drilling rig has been released from the relevant location;
- two weeks prior to the release of Buru’s half-year and annual reports;
- whilst in possession of price sensitive information not yet released to the market.
• to raise the awareness of legal prohibitions including transactions with colleagues and external advisers
• to raise awareness that the Group prohibits entering into transactions that limit economic risks related to unvested share-based payments and that the Group requires annual declarations of compliance with this particular policy
• to raise awareness that the Group prohibits those restricted from trading in Company shares as described above from entering into transactions such as margin loans that could trigger a trade during a prohibited period
• to require details to be provided of intended trading in the Company’s shares
• to require details to be provided of the subsequent confirmation of the trade
• the identification of processes for unusual circumstances where discretions may be exercised in cases such as financial hardship.
The policy also details the insider trading provisions of the Corporations Act 2001 and is reproduced in full on the Company’s website.
For
per
sona
l use
onl
y

26
Corporate Governance Statement
Communication with shareholders
Timely and Balanced Disclosure (ASX’s Recommendations 5.1, 5.2, 6.1 and 6.2)
The Board provides shareholders with information using a comprehensive Continuous Disclosure and Market Communications Policy which includes identifying matters that may have a material effect on the price of the Company’s securities, notifying them to the ASX, posting them on the Company’s website, and issuing media releases. More details of the policy are available on the Company’s website.
In summary, the Continuous Disclosure and Market Communications Policy operates as follows:
• the Managing Director and Company Secretary are responsible for interpreting the Group’s policy and where necessary informing and seeking approval from the Board. The Managing Director and Company Secretary are primarily responsible for all external communications including releases made on the ASX;
• the full annual report is made available to all shareholders via the Company’s website. A physical copy will be sent to any shareholder that specifically requests it. The full annual report includes relevant information about the operations of the Group during the year, changes in the state of affairs and details of future developments;
• the half-yearly report is made available to all shareholders via the Company’s website. A physical copy will be sent to any shareholder that requests it. The half-yearly report contains summarised financial information and a review of the operations of the Group during the period;
• proposed major changes in the Group which may impact on share ownership rights are submitted to a vote of shareholders;
• all announcements made to the ASX, and related information (including information provided to analysts or the media during briefings), are placed on the Company’s website after they are released to the ASX;
• the full texts of notices of meetings and associated explanatory material are placed on the Company’s website; and
• the external auditor attends the annual general meeting to answer questions concerning the conduct of the audit, the preparation and content of the auditor’s report, accounting policies adopted by the Group and the independence of the auditor in relation to the conduct of the audit.
All of the above information, dating back to the listing of the Company, is made available on the Company’s website within one day of public release, and is e-mailed to all shareholders who lodge their e-mail contact details with the Company. Information on lodging e-mail addresses with the Company is available on the Company’s website.
The Board encourages full participation of shareholders at the Annual General Meeting, to ensure a high level of accountability and identification with the Group’s strategy and goals. Important issues are presented to the shareholders as single resolutions.
The shareholders are requested to vote on the appointment and aggregate remuneration of Directors, the granting of options and shares to Directors, the Remuneration report and changes to the Constitution and all other matters requiring shareholder approval. A copy of the Constitution is available to any shareholder who requests it.
For
per
sona
l use
onl
y

27
Directors’ ReportFor the 6 months ended 31 December 2013
The Directors present their report together with the consolidated financial statements of the Group comprising Buru Energy Limited (“Buru” or “Group”) and its subsidiaries for the six month period ended 31 December 2013, and the auditor’s report thereon. The remuneration report for the six months ended 31 December 2013 on pages 33 to 39 forms part of the Directors’ report.
Directors
The Directors of the Company at any time during or since the end of the financial year are:
Name, qualifications and independence status
Experience, special responsibilities and other directorships
Mr Graham Riley, BJur LLB Chairman Independent Non-executive Director
Mr Riley is a qualified legal practitioner having gained his Bachelor of Law and Bachelor of Jurisprudence Degrees. After 10 years of legal practice as a partner of a commercial firm in Perth, he resigned to pursue private interests in the resources and exploration sector. Graham has been responsible for the foundation and growth of a number of petroleum and mining companies. He is currently the Chairman of Entek Energy Limited. Prior to their takeovers, he was the Chairman of Giralia Resources NL from 1998 until March 2011 and of Red Hill Iron Limited from 2005 to 2008. He is currently a Non-executive Director of Gascoyne Resources Limited. He was a Non-executive Director of Adelphi Energy Limited from 2005 until 2010, ARC Energy Limited from 1993 to 2005 and Target Energy Limited from 2011 to 2012.
Mr Riley is a Member of the Audit and Risk Committee and the Remuneration and Nomination Committee. He has been a Director since May 2008 and Chairman since March 2009.
Dr Keiran Wulff, PhD Managing Director
Dr Wulff has worked in the oil and gas industry for over 25 years. He spent 17 years with Oil Search Limited and was intimately involved in the development of that company from an exploration company to a major oil and gas production company. During that time Dr Wulff contributed to all aspects of Oil Search’s development, in roles including Exploration Manager, Group Chief Operating Officer and Head of the Middle East business unit. Dr Wulff has also established an unlisted company operating in developing countries which focuses on the development of power projects with strong ties to local social development and sustainability.
Dr Wulff has been a Director since October 2012 and Managing Director since January 2013.
Mr Eric Streitberg, BSc (App Geoph) Non-executive Director
Mr Streitberg has approximately 40 years’ experience in petroleum geology and geophysics, oil and gas exploration and oil and gas company management. He was a founding shareholder and held the position of Managing Director of ARC Energy Limited from 1997 until August 2008, during which time ARC Energy Limited was transformed from a junior oil and gas exploration company into a mid-size Australian oil and gas producer. He is a Fellow of the Australian Institute of Mining and Metallurgy and the Australian Institute of Company Directors, a member of the Society of Exploration Geophysicists, Petroleum Exploration Society of Australia and the American Association of Petroleum Geologists. He is on the Board, and immediate past chair of the Australian Petroleum Production and Exploration Association and is the immediate past Chair of the Marine Parks & Reserve Authority of Western Australia. He was also a Non-executive Director of Adelphi Energy Limited from 2005 until 2010.
Mr Streitberg has been a Director of Buru since October 2008 and was an Executive Director of Buru during the period October 2009 to 14 January 2014. Following Austin Miller’s resignation in February 2014, Mr Streitberg has been appointed as a Member of the Audit and Risk Committee and the Remuneration and Nomination Committee.
For
per
sona
l use
onl
y
28
Directors’ ReportFor the 6 months ended 31 December 2013
The Hon. Peter Jones AM Independent Non-executive Director
The Hon. Mr Jones was a member of the Western Australian Parliament from 1974 to 1986 during which time he served as the Minister for Resources Development, Mines, Fuel and Energy. He was the founding Chairman of ARC Energy Limited and Chairman of AMMTEC Limited. He previously served as the Chairman of Defence Housing Australia and the Water Corporation of Western Australia.
The Hon. Mr Jones is the Chairman the Remuneration and Nomination Committee and has been a Director since October 2009. He was also appointed Chairman of the Audit and Risk Committee following Austin Miller’s resignation in February 2014.
Mr Austin Miller Independent Non-executive Director (Resigned 5 February 2014)
Mr Miller holds degrees in Geology and Law, and has completed an MBA at the University of Melbourne. Mr Miller has worked for over 20 years in the energy sector. More recently his career has focused on the corporate side of the business including capital markets, M&A and strategy development and implementation. He has held senior investment banking positions specialising in the energy sector with Merrill Lynch and HSBC James Capel and most recently was Executive General Manager Investment and Strategy at Oil Search Limited, where he also took on broad responsibility for business and commercial development in addition to managing the execution of a number of significant capital raisings.
Mr Miller was the Chairman of the Audit and Risk Committee and was a Director from November 2012 to February 2014.
Company Secretary
Mr Chris Bath is a Chartered Accountant and a Member of the Australian Institute of Company Directors. Mr Bath has been the Company Secretary since November 2012. He is also the Company’s Chief Financial Officer.
Board and Committee Meetings
The number of Board and Committee meetings and the number of meetings attended by each of the Directors of the Company during the six month period year were:
Meeting Board MeetingsAudit & Risk
Committee MeetingsRemuneration & Nomination
Committee Meetings
Director Eligible to Attend Attended Eligible to Attend Attended Eligible to Attend Attended
Graham Riley 7 6 3 3 5 5
Peter Jones 7 5 3 3 5 5
Austin Miller 7 7 3 3 5 5
Eric Streitberg 7 6Not a member of the Committee during the period
Keiran Wulff 7 7
Chris Bath attended all Board and Committee Meetings as Company Secretary.
Principal Activities
The principal activity of the Group during the period was oil and gas exploration and production in the Canning Basin, in the northwest of Western Australia. There were no significant changes in the nature of the Group’s principal activities during the period.
Review of Operations
The review of operations during the period ended 31 December 2013 is set out on pages 4 to 13 and forms part of this Directors’ Report.
For
per
sona
l use
onl
y

29
Directors’ ReportFor the 6 months ended 31 December 2013
Operating Results
The consolidated loss of the Group after providing for income tax for the six months ended 31 December 2013 was $14,981,000 (year ended 30 June 2013: loss of $23,587,000).
Financial Position
The net assets of the Group totalled $131,392,000 as at 31 December 2013 (30 June 2013: $106,806,000).
Dividends
The Directors do not propose to recommend the payment of a dividend for the period. No dividends have been paid or declared by the Company during the current period.
Significant Changes in the State of Affairs
No significant change in the state of affairs of the Group occurred during the period other than already referred to elsewhere in this report.
After Balance Date Events
No significant events have occurred subsequent to balance date other than those already disclosed in the review of operations.
Likely Developments
The Group’s likely developments in its operations in future financial years and the expected results of those operations have been included generally in the Review of Operations. Other than as disclosed elsewhere, disclosure of information regarding likely developments in the operations of the consolidated entity in future financial years and the expected results of those operations is likely to result in unreasonable prejudice to the Group. Accordingly, this information has not been disclosed.
Environmental Regulations
The Group is subject to environmental regulation under relevant Australian and Western Australian legislation in relation to its oil and gas exploration and production activities, particularly with the DMP and the Western Australian Department of Environment Regulation (“DER”). The Directors actively monitor compliance with these regulations. As at the date of this report, the Directors are not aware of any material breaches in respect of the regulations.
Directors’ Interests
The relevant interest of each Director in the shares or options issued by the Company, as notified by the Directors to the ASX in accordance with s205G(1) of the Corporations Act 2001, at the date of this report are as follows:
Director Ordinary shares Unlisted options Share Appreciation Rights
Graham Riley 1,500,000 - -
Eric Streitberg 28,700,566 - -
Peter Jones 248,277 - -
Austin Miller * 1,625,132 - -
Keiran Wulff - - 2,500,000
Total 32,073,975 - 2,500,000
* Resigned 5 February 2014. The number of ordinary shares above represents the number of shares held on resignation.
For
per
sona
l use
onl
y

30
Directors’ ReportFor the 6 months ended 31 December 2013
Share OptionsNo share options were granted during the period. At the date of this report, the unissued shares of the Company under option are as follows:
Date of Expiry Exercise Price Number of shares under Option
31 December 2014 $4.04 1,339,800
Total 1,339,800
All unissued options are over ordinary shares in the Company. All options expire on the earlier of their expiry date or within 30 days from termination of the employee’s employment. These options do not entitle the holder to participate in any share issue of the Company or any other body corporate. There were no options granted to Directors or senior executives during or since the end of the financial year.
During or since the end of the reporting period, the following shares were issued on the exercise of options previously granted as compensation:
Number of options exercise Exercise Price ($/share) Number of shares issued Amount paid on each share
947,000 1.24 139,823 Nil*
* These options were exercised via the cashless exercise mechanism.
The cashless exercise mechanism was approved by shareholders at the Company’s Annual General Meeting held on 30 November 2012. This mechanism enables employees who hold options over shares in the Company to elect to exercise vested options by receiving shares equal to the value of the positive difference between the exercise price and the share price at exercise. The share price used for the calculation of the number of shares issued under the cashless exercise mechanism is the average market price of the shares (weighted by reference to volume) sold in the ordinary course of trading on ASX during the five trading days before the date on which the holder exercises its options. The cashless exercise of options mechanism results in less shares being issued upon exercise of existing options, to the benefit of shareholders, with less dilution of their own shareholdings.
There are no amounts unpaid on the shares issued as a result of the exercise of options during the period. Further details on the share options are included in the Remuneration Report on pages 33 to 39.
For
per
sona
l use
onl
y

31
Directors’ ReportFor the 6 months ended 31 December 2013
Share Appreciation Rights
Details of the Share Appreciation Rights (“SARs”) outstanding as at the date of this report are as follows:
Number of SARs granted Grant date Vesting date
Exercise price per SAR ($) Expiry date
% of SARs vested
% of SARs forfeited
Year in which grant vests
200,000
250,000
300,000
7 Dec 12
7 Dec 12
7 Dec 12
31 Dec 13
31 Dec 14
31 Dec 15
4.00
4.25
4.50
30 Jun 16
30 Jun 16
30 Jun 16
100%
0%
0%
0%
0%
0%
2013
2014
2015
200,000
250,000
300,000
3 Jan 13
3 Jan 13
3 Jan 13
31 Dec 13
31 Dec 14
31 Dec 15
4.00
4.25
4.50
30 Jun 16
30 Jun 16
30 Jun 16
100%
0%
0%
0%
0%
0%
2013
2014
2015
500,000
500,000
12 Dec 13
12 Dec 13
12 Dec 13
24 Jun 14
1.38
1.38
24 Jun 14
24 Jun 15
100%
0%
0%
0%
2013
2014
1,000,000**
1,500,000**
12 Nov 13
12 Nov 13
1 Feb 15
1 Feb 16
3.79
5.06
30 Jun 16
30 Jun 16
0%
0%
0%
0%
2015
2016
5,492,714 3 Jan 14 31 Oct 16* 1.63 31 Oct 19 0% 0% 2016
1,850,000 7 Feb 14 31 Oct 16* 1.63 31 Oct 19 0% 0% 2016
12,342,714
* This is the service period vesting date. Vesting is also subject to various performance hurdles relating to Relative Total Shareholder Return
** The SARs issued to Dr K Wulff were issued on 14 January 2013 on his commencement as Managing Director, however, they were subject to shareholder approval which was received at the Company’s Annual General Meeting in November 2013. The SARs had been provisionally valued using the Company’s share price on 30 June 2013 and have now been revalued at the grant date, being the AGM date, in accordance with AASB 2: Share based payments. Further details on the SARs are included in the Remuneration Report on pages 33 to 39.
Indemnification and Insurance of Officers
The Company has agreed to indemnify all current Directors and officers of the Company and its controlled entities against all liabilities to another person (other than the Company or a related body corporate) that may arise from their position as Directors and officers of the Company and its controlled entities, except where the liability arises out of conduct involving a lack of good faith. The agreement stipulates that the Company will meet the full amount of any such liabilities, including costs and expenses.
During the six month period, the Company has not paid any insurance premiums respect of Directors’ and officers’ liability as the insurance premiums paid in the prior period covered the current period as well. During the year ended 30 June 2013, $62,800 was paid. The premiums cover current and former Directors and officers, including senior executives of the Company and Directors and secretaries of its controlled entities. The insurance premiums relate to:
• costs and expenses incurred by the relevant officers in defending proceedings, whether civil or criminal and whatever their outcome; and
• other liabilities that may arise from their position, with the exception of conduct involving a wilful breach of duty or improper use of information or position to gain a personal advantage.F
or p
erso
nal u
se o
nly

32
Directors’ ReportFor the 6 months ended 31 December 2013
Proceedings on Behalf of Company
No person has applied for leave from any Court to bring proceedings on behalf of the Company or intervene in any proceedings to which the Company is a party for the purpose of taking responsibility on behalf of the Company for all or any part of those proceedings. The Company was not a party to any such proceedings during the period.
Non-audit Services
During the period, the Company’s auditor did not perform any other services in addition to their statutory audit, half year review and joint venture audits. During the six month period, the amount paid or payable to the Group’s auditor (KPMG Australia) for statutory and other audit and review services totalled to $70,250 (year ended 30 June 2013: $94,250).
Auditor’s Independence Declaration
The lead auditor’s independence declaration is set out on page 40 and forms part of the Directors’ Report for the six months ended 31 December 2013.
Rounding off
The Company is of a kind referred to in ASIC Class Order 98/100 dated 10 July 1998 and in accordance with that Class Order, amounts in the financial report and Directors’ report have been rounded off to the nearest thousand dollars, unless otherwise stated.
This report is made in accordance with a resolution of Directors.
___________________________ __________________________
Mr Keiran Wulff Mr Graham RileyManaging Director ChairmanPerth Perth21 March 2014 21 March 2014
For
per
sona
l use
onl
y

33
Remuneration ReportFor the 6 months ended 31 December 2013
Principles of compensation - AuditedThe Directors present their Remuneration Report for Buru for the six months ended 31 December 2013. This remuneration report outlines the remuneration arrangements of the Company’s Directors and other key management personnel (“KMP”) in accordance with the requirements of the Corporations Act 2001 and its Regulations. In accordance with section 308(3C) of the Corporations Act 2001, the remuneration report has been audited and forms part of the Directors’ Report. Remuneration is also referred to as compensation throughout this report.
KMP have authority and responsibility for planning, directing and controlling the activities of the Group and comprise the Directors, executives and senior management in accordance with s300A of the Corporations Act 2001.
Compensation levels for KMP are competitively set to attract and retain appropriately qualified and experienced Directors and executives. The compensation structures explained below are designed to reward the achievement of the Company’s strategic objectives and achieve the broader outcome of the creation of shareholder value. The Company’s compensation structures take into account:
• the capability and experience of KMPs; and
• the Group’s corporate, operational and financial performance.
Compensation packages include a mix of fixed and variable compensation, and short and long term performance based incentives.
Fixed compensation
Fixed compensation consists of base compensation (which is calculated on a total cost basis and includes any FBT charges related to employee benefits), as well as employer contributions to superannuation funds. Compensation levels are reviewed annually by the Remuneration and Nomination Committee through a process that considers individual, segment and overall performance of the Group. In addition, external consultants provide analysis and advice to ensure the Directors’, executive and senior management compensation is competitive in the market place. Compensation is also reviewed on promotion.
Performance linked compensation
Performance linked compensation includes both short-term and long-term incentives, and is designed to reward KMP for meeting or exceeding the Company’s expectations and agreed objectives. The short-term incentive (“STI”) is an ‘at risk’ bonus provided in the form of cash, while the long-term incentive (“LTI”) is provided as Share Appreciation Rights (“SARs”) to KMP. The LTIs are structured to ensure that incentives are appropriately aligned to sustainable shareholder value creation.
Short-term incentive bonuses
The Remuneration and Nomination Committee established a number of STI bonus schemes for some KMPs and other executives and senior management. The payment of bonuses under these schemes is linked to the fulfilment of key performance indicators (“KPIs”). The KPIs are designed to promote shareholder value creation and include financial and non-financial measures. The individual’s reward under the STI bonus scheme is directly aligned to the creation of shareholder value through the achievement of the Company’s strategic and performance goals. All STI bonuses are subject to Board approval.
The financial and non-financial measures vary with position and responsibility and include measures such as achieving operational outcomes and ensuring high levels of safety and environmental performance. The specific measures were chosen as they provide objective criteria against which the bonus will be paid.
For
per
sona
l use
onl
y

34
Remuneration ReportFor the 6 months ended 31 December 2013
Long-term incentive bonuses
The Remuneration and Nomination Committee considers that an LTI scheme structured around equity based compensation is necessary to attract and retain the highest calibre of professionals to the Group, whilst preserving the Group’s cash reserves. The purpose of these schemes is to align the interests of KMP with shareholders and to reward, over the medium term, KMP for delivering value to shareholders through share price appreciation.
During the financial period the Group issued SARs to certain KMP. Each SAR represents a right to an award equivalent to the positive difference between the notional share price set at the date of grant and the share price at the date of exercise, subject to satisfaction of any vesting conditions and exercise conditions. At the Board’s discretion, the award may be settled in ordinary shares of an equivalent value or as a cash payment.
Consequences of performance on shareholder wealth
The Board considers that the most effective way to increase shareholder wealth is through the successful exploration and development of the Group’s oil and gas exploration permits. The Board considers that the Group’s LTI schemes incentivise KMP to successfully explore the Group’s oil and gas permits by providing rewards, over the short and long term that are directly correlated to delivering value to shareholders through share price appreciation. The Board is of the opinion that this has been a successful method to increase shareholder wealth as shown in the chart below.
Service contracts
The employment contract with Mr Wulff is unlimited in term but capable of termination with four months’ notice by Mr Wulff, or twelve months’ notice by the Company, or by payment in lieu thereof at the discretion of the Company. Mr Ford’s employment contract is for a fixed 1 year term to July 2014. The contract can be extended by mutual agreement and is capable of termination on three months’ notice. Mr Williams is contracted for services to January 2015. The contract can be extended by mutual agreement and is capable of termination on three months’ notice.
Service contracts with other KMP are unlimited in term but capable of termination on three months’ notice by either party, or by payment in lieu thereof at the discretion of the Company.
The Remuneration & Nomination Committee determined the amount of compensation payable to KMP under each agreement. KMP are also entitled to receive their contractual and statutory entitlements including accrued annual and long service leave, together with any superannuation benefits, on termination of employment. Compensation levels are reviewed each year to take into account cost-of-living changes, any change in the scope of the role performed by KMP and any changes required to meet the principles of the Group’s compensation policy.
Dec-08
$3.50
$1.50
$2.50
$0.50
$3.00
$1.00
$2.00
$0.00
Jun-10 Dec-11Jun-09 Dec-10 Jun-12 Jun-13Dec-09 Jun-11 Dec-12 Dec-13
For
per
sona
l use
onl
y

35
Remuneration ReportFor the 6 months ended 31 December 2013
Services from remuneration consultants
During the period, the Board Remuneration and Nomination Committee engaged PricewaterhouseCoopers (“PwC”) to review the elements of, grant amounts and valuation of the Long Term Incentive Plan (“LTIP”) for Key Management Personnel (KMP) and Senior Executives. As part of this process, PwC assisted in drafting the terms of the SARs Plan. PwC were also asked to provide a briefing paper on General Employee Equity Plans and the various options operating in the industry for consideration by the Committee. PwC provided other minor taxation services during the period. PwC was paid $65,844 for the report regarding the LTIP and accounting and legal services associated with the General Employee Equity Plans. PwC was also paid $17,800 for other non-related services during the period.
The engagement of PwC was authorised by the Remuneration and Nomination Committee Chairman and an engagement letter was agreed between the Chairman and PwC to ensure that they were completely independent during the review. PwC declared to the Remuneration and Nomination Committee and the full Board their independence. All documentation related to the review of the LTIP was provided directly to the Chairman of the Committee. The Chairman provided approval for Buru Human Resources personnel to provide the necessary information related to the LTIP to PwC to complete their review. The Remuneration and Nomination Committee and the full Board are satisfied that the remuneration recommendations were made by PwC free from undue influence by members of the KMP about whom a number of the recommendations may relate.
Non-executive Directors
Total fixed compensation for all Non-executive Directors, last voted upon by shareholders at the 2012 Annual General Meeting, is not to exceed $600,000 per annum. The Non-executive Directors’ base fee is $92,000 plus statutory superannuation per annum and the Chairman’s base fee is $150,000 plus statutory superannuation per annum. An additional fee of $7,000 plus statutory superannuation per annum is payable for Non-executive Directors being a member of a Committee and the fee for chairing a Committee is $14,000 plus statutory superannuation.
For
per
sona
l use
onl
y

36
Remuneration ReportFor the 6 months ended 31 December 2013
Key
Man
agem
ent P
erso
nnel
Com
pens
atio
n - A
udite
d D
etai
ls o
f the
nat
ure
and
amou
nt o
f eac
h m
ajor
ele
men
t of c
ompe
nsat
ion
of e
ach
Dire
ctor
of t
he C
ompa
ny a
nd o
ther
KM
P fo
r the
six
mon
ths
ende
d 31
Dec
embe
r 201
3, a
nd th
e 12
m
onth
s en
ded
30 Ju
ne 2
013,
in A
UD
are
as
follo
ws:
Shor
t-te
rmPo
st-e
mpl
oym
ent
Oth
er
long
te
rm$
Term
inat
ion
bene
fits
(D) $
Shar
e-ba
sed
paym
ents
Tota
l $
s300
A(1
)(e)(i
) pr
opor
tion
of
rem
uner
atio
n pe
rfor
man
ce
rela
ted %
s300
A(1
)(e)
(vi)
valu
e of
sh
are
base
d pa
ymen
ts a
s a
prop
ortio
n of
re
mun
erat
ion %
Sala
ry &
Fe
es $
STI c
ash
bonu
s (C) $
Non
-m
onet
ary
bene
fits (
E)To
tal
Supe
rann
uatio
n be
nefit
s $
ESO
P (A
) /
SARs
(B) $
Non
-exe
cutiv
e D
irect
ors
Mr G
Rile
y, N
ED
Chai
rman
Dec
201
382
,000
--
82,0
007,
585
--
-89
,585
0.00
%0.
00%
Jun
2013
139,
111
- -
139,
111
12,5
35
- -
- 15
1,64
6 0.
00%
0.00
%
The
Hon
. P Jo
nes
AM
, N
EDD
ec 2
013
56,5
00-
-56
,500
5,22
6-
--
61,7
260.
00%
0.00
%
Jun
2013
106,
272
- -
106,
272
- -
- -
106
,272
0.
00%
0.00
%
Mr A
Mill
er, N
ED
(Res
igne
d Fe
b 20
14)
Dec
201
356
,500
--
56,5
005,
226
--
-61
,726
0.00
%0.
00%
Jun
2013
64,6
36
- -
64,6
36
5,8
30
- -
- 7
0,46
6 0.
00%
0.00
%
Tota
l Non
-exe
cutiv
e D
irect
ors’
Rem
uner
atio
nD
ec 2
013
195,
000
--
195,
000
18,0
37-
--
213,
037
0.00
%0.
00%
Jun
2013
310
,019
-
- 31
0,01
9 1
8,36
5 -
- -
328
,384
0.
00%
0.00
%
Exec
utiv
e D
irect
ors
Dr K
Wul
ff, M
anag
ing
Dire
ctor
(Exe
cutiv
e
from
Jan
2013
)
Dec
201
331
0,00
0-
4,95
731
4,95
728
,675
--
110,
584
454,
216
24.3
5%24
.27%
Jun
2013
310
,872
-
- 31
0,87
2 27
,991
-
- 88
,689
42
7,55
2 20
.74%
20.7
4%
Mr E
Str
eitb
erg,
Exe
c D
irect
or (N
on-e
xecu
tive
from
Jan
201
4)
Dec
201
324
8,16
2-
9,18
425
7,34
622
,955
--
- 28
0,30
10.
00%
0.00
%
Jun
2013
488
,020
3
84,0
00
- 8
72,0
20
78,
494
- -
- 9
50,5
14
40.4
0%0.
00%
Tota
l Dire
ctor
s’ Re
mun
erat
ion
Dec
201
375
3,16
2-
14,1
4176
7,30
369
,667
--
110,
584
947,
554
Jun
2013
1,10
8,91
1 3
84,0
00
- 1,
492,
911
124
,850
-
- 88
,689
1,7
06,4
50
For
per
sona
l use
onl
y

37
Remuneration ReportFor the 6 months ended 31 December 2013
Shor
t-te
rmPo
st-e
mpl
oym
ent
Oth
er
long
te
rm$
Term
inat
ion
bene
fits
(D) $
Shar
e-ba
sed
paym
ents
Tota
l $
s300
A(1
)(e)(i
) pr
opor
tion
of
rem
uner
atio
n pe
rfor
man
ce
rela
ted %
s300
A(1
)(e)
(vi)
valu
e of
sh
are
base
d pa
ymen
ts a
s a
prop
ortio
n of
re
mun
erat
ion %
Sala
ry &
Fe
es $
STI c
ash
bonu
s (C) $
Non
-m
onet
ary
bene
fits (
E)To
tal
Supe
rann
uatio
n be
nefit
s $
ESO
P (A
) /
SARs
(B)
$
Exec
utiv
es
Mr P
Milf
ord,
Ch
ief O
pera
ting
Offi
cer
(Com
men
ced
Nov
201
3)
Dec
201
372
,628
--
72,6
286,
718
--
-79
,346
0.00
%0.
00%
Jun
2013
- -
- -
- -
- -
-0.
00%
0.00
%
Mr C
Bat
h,
Chie
f Fin
anci
al O
ffice
r an
d Co
mpa
ny S
ecre
tary
Dec
201
318
4,39
545
,767
4,59
323
4,75
521
,300
--
-25
6,05
50.
00%
0.00
%
Jun
2013
258
,600
-
- 2
58,6
00
23,
274
- -
493
,568
7
75,4
42
63.6
5%63
.65%
Mr B
Will
iam
s G
M C
omm
erci
al
Dec
201
327
0,60
0-
3,54
027
4,14
0-
--
218,
162
492,
302
44.3
1%44
.64%
Jun
2013
477,
154
- -
477,
154
- -
- 2
43,0
61
720,
215
33.7
5%33
.75%
Ms
Lind
a D
awso
n G
M C
orpo
rate
Affa
irs
(Com
men
ced
Jul 2
013)
Dec
201
316
6,42
4-
-16
6,42
415
,394
--
-18
1,81
80.
00%
0.00
%
Jun
2013
- -
- -
- -
- -
-0.
00%
0.00
%
Mr J
on F
ord
GM
Com
mun
ity
Rela
tions
(C
omm
ence
d Ju
l 201
3)
Dec
201
315
6,25
0-
3,54
015
9,79
014
,453
--
-17
4,24
30.
00%
0.00
%
Jun
2013
- -
- -
- -
- -
-0.
00%
0.00
%
Ms
L W
est
Gen
eral
Cou
nsel
(R
esig
ned
Jan
2014
)
Dec
201
312
0,45
0-
1,40
512
1,85
511
,146
--
-13
3,00
10.
00%
0.00
%
Jun
2013
212
,243
3
2,11
0 -
244
,353
2
1,99
2 -
- 8
3,81
3 3
50,1
58
33.1
1%23
.94%
Mr T
Str
eitb
erg,
Fo
rmer
Hea
d of
Str
ateg
y
(Res
igne
d Ju
l 201
3)
Dec
201
338
,808
--
38,8
08-
-33
0,00
0-
368,
808
0.00
%0.
00%
Jun
2013
343
,200
3
16,8
00
47,5
14
707,
514
54,
054
- -
145
,281
90
6,84
950
.95%
16.0
2%
Ms
M M
alax
os
Form
er C
OO
(R
esig
ned
Jan
2013
)
Dec
201
3-
--
--
--
--
0.00
%0.
00%
Jun
2013
248,
590
- -
248,
590
22,
312
- 14
1,66
716
7,62
758
0,19
628
.89%
28.8
9%
Tota
l Dire
ctor
s an
d Ex
ecut
ive
Offi
cer
Rem
uner
atio
n
Dec
201
31,
762,
717
45,7
6727
,219
1,83
5,70
313
8,67
8-
330,
000
328,
746
2,63
3,12
7
Jun
2013
2,64
8,69
873
2,91
047
,514
3,42
9,12
224
6,48
2-
141,
667
1,22
2,03
95,
039,
310
For
per
sona
l use
onl
y

38
Remuneration ReportFor the 6 months ended 31 December 2013
Notes in relation to the table of KMP remuneration
A. The fair value of the options issued under the ESOP is calculated at the date of grant using the Black & Scholes option-pricing model and expensed at grant date. The value disclosed is the portion of the fair value of the options recognised in this reporting period.
B. The fair value of the SARs is calculated at the date of grant using the Black & Scholes option-pricing model and expensed over the vesting period. The value disclosed is the portion of the fair value of the SARs recognised in this reporting period.
C. Mr C Bath received a Short Term Incentive cash bonus during the financial year of $50,000 inclusive of superannuation in accordance with his employment contract on completion of 12 months’ service. All bonuses fully vested during the period. No bonuses were forfeited during the period.
D. Mr T Streitberg was provided with a termination benefit of 4 months’ salary based on an annual salary of $396,000, plus a cash payment of $198,000.
E. Mr T Streitberg resided in Sydney and was therefore provided with accommodation in Perth. The amount disclosed includes the cost of the accommodation and the FBT paid by the Company in relation to that accommodation. Non-monetary benefits to other KMP relate to the provision of car parking, life insurance and salary continuance insurance.
Analysis of share based payments - ESOP
There were no options issued under the ESOP to KMP during the reporting period and no options have been granted since the end of the period. Details of the vesting profiles of the options granted to KMP that were outstanding at the end of the reporting period are as follows:
Number of options
outstanding
Grant date
Vesting date
Fair value per option at
grant date ($)
Exercise price per
option ($)
Expiry date
% of options
vested
% of options
forfeited
Financial year in which grant
vested
Executives
Mr C Bath 530,000 1 Oct 12 1 Oct 12 0.93 4.04 31 Dec 14 100% 0% 2013
Ms L West 90,000 1 Oct 12 1 Oct 12 0.93 4.04 31 Dec 14 100% 0% 2013
During the reporting period, the following shares were issued on the exercise of options previously granted as compensation:
Number of options exercised Exercise Price ($/share) Number of shares issued Amount paid ($/share)
Executives
Ms L West 110,000 1.24* 15,824 Nil *
* These options were exercised via the cashless exercise mechanism.
The cashless exercise mechanism was approved by shareholders at the Company’s Annual General Meeting held on 30 November 2012. This mechanism enables employees who hold options over shares in the Company to elect to exercise vested options by receiving shares equal to the value of the positive difference between the exercise price and the share price at exercise. The share price used for the calculation of the number of shares issued under the cashless exercise mechanism is the average market price of the shares (weighted by reference to volume) sold in the ordinary course of trading on ASX during the five trading days before the date on which the holder exercises its options. The cashless exercise of options mechanism results in less shares being issued upon exercise of existing options, to the benefit of shareholders, with less dilution of their own shareholdings.
There are no amounts unpaid on the shares issued as a result of the exercise of options in the 2013 financial year.
For
per
sona
l use
onl
y

39
Remuneration ReportFor the 6 months ended 31 December 2013
The movement during the reporting period, by value, of options over ordinary shares in the Company held by each KMP is detailed below:
Granted in year $(A) Value of options exercised in year $(B) Lapsed during the financial year $(C)
Executives
Mr T Streitberg - - 145,281
Ms L West - 25,951 -
Notes in relation to the table of movements in the value of options:A. The value of options granted in the year is the fair value of the options calculated at grant date using the Black & Scholes
valuation model. The total value of the options granted is included in the table above. This amount is allocated to remuneration over the vesting period.
B. The value of options exercised during the year is calculated as the market price of shares of the Company as at close of trading on the date the options were exercised after deducting the price paid to exercise the option.
C. The value of the options that lapsed during the year represents the benefit forgone and is calculated at the date the option was granted using the Black & Scholes valuation model.
Analysis of share based payments - SARs
Details of the Share Appreciation Rights (“SARs”) granted to KMP during the reporting period and details of the vesting profiles of the SARs granted to KMP that were outstanding at the end of the reporting period are as follows:
Number of SARs
outstandingGrant
date Vesting
date
Fair value per SAR at grant date
($)
Exercise price per
SAR ($)Expiry
date
% of SARs
vested
% ofSARs
forfeited
Financial years in
which grant vests
Directors
Dr K Wulff 1,000,000
1,500,000
12 Nov 13
12 Nov 13
1 Feb 15
1 Feb 16
0.25
0.17
3.79
5.06
30 Jun 16
30 Jun 16
0%
0%
0%
0%
2015
2016
Executives
Mr B Williams 200,000
250,000
300,000
7 Dec 12
7 Dec 12
7 Dec 12
31 Dec 13
31 Dec 14
31 Dec 15
1.10
1.05
1.01
4.00
4.25
4.50
30 Jun 16
30 Jun 16
30 Jun 16
100%
0%
0%
0%
0%
0%
2013
2014
2015
The SARs issued to Dr K Wulff were initially granted on 14 January 2013 on his commencement as Managing Director, however, they were subject to shareholder approval which was received at the Company’s Annual General Meeting in November 2013. The SARs had been provisionally valued using the Company’s share price on 30 June 2013 and have now been revalued at the grant date, being the AGM date, in accordance with AASB 2.
For
per
sona
l use
onl
y

40
Auditor’s Independence DeclarationF
or p
erso
nal u
se o
nly

41
Financial Statements
For
per
sona
l use
onl
y

42
Consolidated Statement of Financial PositionAs at 31 December 2013
in thousands of AUD Note31 December
201330 June 2013
(Restated)*1 July 2012 (Restated)*
CURRENT ASSETS
Cash and cash equivalents 20a 60,252 45,437 62,360
Trade and other receivables 18 7,394 2,588 5,159
Inventories 19 5,724 5,340 4,646
Total Current Assets 73,370 53,365 72,165
NON-CURRENT ASSETS
Property, plant and equipment 13 7,974 8,021 6,310
Exploration and evaluation expenditure 14 64,618 63,828 30,375
Oil and gas assets 15 11,922 5,009 1,983
Investments 16 30,028 27,425 33,655
Total Non-Current Assets 114,542 104,283 72,323
TOTAL ASSETS 187,912 157,648 144,488
CURRENT LIABILITIES
Trade and other payables 23 8,681 3,061 5,108
Provisions 24 1,274 1,218 293
Total Current Liabilities 9,955 4,279 5,401
NON-CURRENT LIABILITIES
Trade and other payables 23 40,000 40,000 40,000
Provisions 24 6,565 6,563 5,141
Total Non-Current Liabilities 46,565 46,563 45,141
TOTAL LIABILITIES 56,520 50,842 50,542
NET ASSETS 131,392 106,806 93,946
EQUITY
Contributed equity 228,149 189,311 150,015
Reserves 3,761 3,471 10,188
Accumulated losses (100,518) (85,976) (66,257)
TOTAL EQUITY 131,392 106,806 93,946
The notes on pages 46 to 83 are an integral part of these consolidated financial statements* See Note 5
For
per
sona
l use
onl
y

43
Consolidated Statement of Profit or Loss and Other Comprehensive IncomeFor the Period Ended 31 December 2013
in thousands of AUD Note6 Months to 31 Dec 2013
Year ended 30 June 2013
(Restated)*
Revenue 8 - 5,420
Operating costs - (5,527)
Gross profit - (107)
Other income 9 119 2,145
Exploration and evaluation expenditure 5 (8,964) (10,789)
Impairment of oil and gas assets 15 - (914)
Impairment of property, plant and equipment 13 - (773)
Corporate and administrative expenditure 10 (7,034) (13,272)
Share based payment expenses 25 (729) (2,058)
JV Partner’s share of technical and administrative expenditure - 1,870
Results from operating activities (16,608) (23,898)
Financial income 11 1,627 2,587
Net finance income 1,627 2,587
Loss for the period before tax (14,981) (21,311)
Income tax (expense)/benefit 12 - (2,276)
Loss for the period (14,981) (23,587)
Other comprehensive income
Items that may be reclassified subsequently to profit or loss
Change in fair value of available-for-sale financial assets net of tax - (5,309)
Other comprehensive income for the period, net of income tax - (5,309)
Total comprehensive loss for the period (14,981) (28,896)
Loss per share (cents) 22 (5.09) (8.85)
Diluted Loss per share (cents) 22 (5.09) (8.85)
The notes on pages 46 to 83 are an integral part of these consolidated financial statements* See Note 5
For
per
sona
l use
onl
y

44
Consolidated Statement of Changes in Equity For the 6 months ended 31 December 2013
in th
ousa
nds o
f AU
D
Shar
e ca
pita
l $
Trea
sury
sh
are
rese
rve $
Opt
ion
prem
ium
re
serv
e $
Shar
e ba
sed
paym
ent
rese
rve $
Fina
ncia
l ass
et
reva
luat
ion
rese
rve $
Reta
ined
lo
sses $
Tota
l eq
uity $
Bala
nce
as a
t 1 Ju
ly 2
012
(as
prev
ious
ly re
port
ed)*
150,
015
(509
)10
73,
978
6,61
2(5
0,66
5)10
9,53
8
Impa
ct o
f cha
nges
in a
ccou
ntin
g po
licy
--
--
-(1
5,59
2)(1
5,59
2)
Bala
nce
as a
t 1 Ju
ly 2
012
(Res
tate
d)*
150,
015
(509
)10
73,
978
6,61
2(6
6,25
7)93
,946
Com
preh
ensi
ve in
com
e fo
r the
per
iod
Loss
for t
he p
erio
d-
--
--
(17,
417)
(17,
417)
Impa
ct o
f cha
nge
in a
ccou
ntin
g po
licy
--
--
-(6
,170
)(6
,170
)
Net
cha
nge
in fa
ir va
lue
of a
vaila
ble-
for-
sale
fina
ncia
l ass
ets
--
--
(5,3
09)
-(5
,309
)
Tota
l com
preh
ensi
ve in
com
e fo
r the
per
iod
(Res
tate
d*)
--
--
(5,3
09)
(23,
587)
(28,
896)
Tran
sact
ions
with
ow
ners
reco
rded
dire
ctly
in e
quit
y
Issu
e of
ord
inar
y sh
ares
, net
of t
rans
actio
n co
sts
38,6
12-
--
--
38,6
12
Shar
e ba
sed
paym
ent t
rans
actio
ns-
509
(107
)2,
058
--
2,46
0
Shar
e op
tions
exe
rcis
ed/f
orfe
ited
684
--
(3,8
68)
-3,
868
684
Tota
l tra
nsac
tion
with
ow
ners
reco
rded
dire
ctly
in e
quit
y39
,296
509
(107
)(1
,810
)-
3,86
841
,756
Bala
nce
as a
t 30
June
201
3 (R
esta
ted)
*18
9,31
1-
-2,
168
1,30
3(8
5,97
6)10
6,80
6
Shar
e ca
pita
l $
Trea
sury
sh
are
rese
rve $
Opt
ion
prem
ium
re
serv
e $
Shar
e ba
sed
paym
ent
rese
rve $
Fina
ncia
l ass
et
reva
luat
ion
rese
rve $
Reta
ined
lo
sses $
Tota
l eq
uity $
Bala
nce
as a
t 1 Ju
ly 2
013
(Res
tate
d)*
189,
311
--
2,16
81,
303
(85,
976)
106,
806
Com
preh
ensi
ve in
com
e fo
r the
per
iod
Loss
for t
he p
erio
d-
--
--
(14,
981)
(14,
981)
Net
cha
nge
in fa
ir va
lue
of a
vaila
ble-
for-
sale
fina
ncia
l ass
ets
--
--
--
-
Tota
l com
preh
ensi
ve in
com
e fo
r the
per
iod
--
--
-(1
4,98
1)(1
4,98
1)
Tran
sact
ions
with
ow
ners
reco
rded
dire
ctly
in e
quit
y
Issu
e of
ord
inar
y sh
ares
, net
of t
rans
actio
n co
sts
38,8
38-
--
--
38,8
38
Shar
e ba
sed
paym
ent t
rans
actio
ns-
--
729
--
729
Shar
e op
tions
exe
rcis
ed/f
orfe
ited
--
-(4
39)
-43
9-
Tota
l tra
nsac
tion
with
ow
ners
reco
rded
dire
ctly
in e
quit
y38
,838
--
290
-43
939
,567
Bala
nce
as a
t 31
Dec
embe
r 201
322
8,14
9-
-2,
458
1,30
3(1
00,5
18)
131,
392
The
note
s on
pag
es 4
6 to
83
are
an in
tegr
al p
art o
f the
se c
onso
lidat
ed fi
nanc
ial s
tate
men
ts*
See
Not
e 5
For
per
sona
l use
onl
y
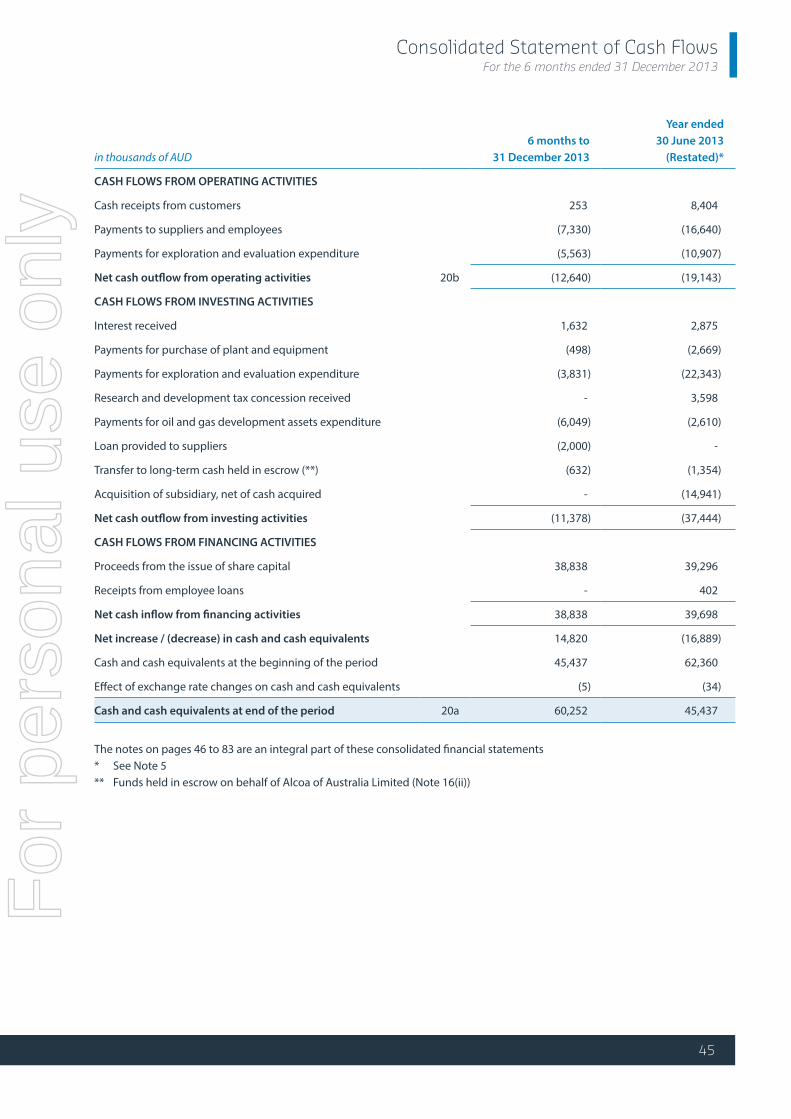
45
Consolidated Statement of Cash Flows For the 6 months ended 31 December 2013
in thousands of AUD6 months to
31 December 2013
Year ended30 June 2013
(Restated)*
CASH FLOWS FROM OPERATING ACTIVITIES
Cash receipts from customers 253 8,404
Payments to suppliers and employees (7,330) (16,640)
Payments for exploration and evaluation expenditure (5,563) (10,907)
Net cash outflow from operating activities 20b (12,640) (19,143)
CASH FLOWS FROM INVESTING ACTIVITIES
Interest received 1,632 2,875
Payments for purchase of plant and equipment (498) (2,669)
Payments for exploration and evaluation expenditure (3,831) (22,343)
Research and development tax concession received - 3,598
Payments for oil and gas development assets expenditure (6,049) (2,610)
Loan provided to suppliers (2,000) -
Transfer to long-term cash held in escrow (**) (632) (1,354)
Acquisition of subsidiary, net of cash acquired - (14,941)
Net cash outflow from investing activities (11,378) (37,444)
CASH FLOWS FROM FINANCING ACTIVITIES
Proceeds from the issue of share capital 38,838 39,296
Receipts from employee loans - 402
Net cash inflow from financing activities 38,838 39,698
Net increase / (decrease) in cash and cash equivalents 14,820 (16,889)
Cash and cash equivalents at the beginning of the period 45,437 62,360
Effect of exchange rate changes on cash and cash equivalents (5) (34)
Cash and cash equivalents at end of the period 20a 60,252 45,437
The notes on pages 46 to 83 are an integral part of these consolidated financial statements* See Note 5** Funds held in escrow on behalf of Alcoa of Australia Limited (Note 16(ii))
in th
ousa
nds o
f AU
D
Shar
e ca
pita
l $
Trea
sury
sh
are
rese
rve $
Opt
ion
prem
ium
re
serv
e $
Shar
e ba
sed
paym
ent
rese
rve $
Fina
ncia
l ass
et
reva
luat
ion
rese
rve $
Reta
ined
lo
sses $
Tota
l eq
uity $
Bala
nce
as a
t 1 Ju
ly 2
012
(as
prev
ious
ly re
port
ed)*
150,
015
(509
)10
73,
978
6,61
2(5
0,66
5)10
9,53
8
Impa
ct o
f cha
nges
in a
ccou
ntin
g po
licy
--
--
-(1
5,59
2)(1
5,59
2)
Bala
nce
as a
t 1 Ju
ly 2
012
(Res
tate
d)*
150,
015
(509
)10
73,
978
6,61
2(6
6,25
7)93
,946
Com
preh
ensi
ve in
com
e fo
r the
per
iod
Loss
for t
he p
erio
d-
--
--
(17,
417)
(17,
417)
Impa
ct o
f cha
nge
in a
ccou
ntin
g po
licy
--
--
-(6
,170
)(6
,170
)
Net
cha
nge
in fa
ir va
lue
of a
vaila
ble-
for-
sale
fina
ncia
l ass
ets
--
--
(5,3
09)
-(5
,309
)
Tota
l com
preh
ensi
ve in
com
e fo
r the
per
iod
(Res
tate
d*)
--
--
(5,3
09)
(23,
587)
(28,
896)
Tran
sact
ions
with
ow
ners
reco
rded
dire
ctly
in e
quit
y
Issu
e of
ord
inar
y sh
ares
, net
of t
rans
actio
n co
sts
38,6
12-
--
--
38,6
12
Shar
e ba
sed
paym
ent t
rans
actio
ns-
509
(107
)2,
058
--
2,46
0
Shar
e op
tions
exe
rcis
ed/f
orfe
ited
684
--
(3,8
68)
-3,
868
684
Tota
l tra
nsac
tion
with
ow
ners
reco
rded
dire
ctly
in e
quit
y39
,296
509
(107
)(1
,810
)-
3,86
841
,756
Bala
nce
as a
t 30
June
201
3 (R
esta
ted)
*18
9,31
1-
-2,
168
1,30
3(8
5,97
6)10
6,80
6
Shar
e ca
pita
l $
Trea
sury
sh
are
rese
rve $
Opt
ion
prem
ium
re
serv
e $
Shar
e ba
sed
paym
ent
rese
rve $
Fina
ncia
l ass
et
reva
luat
ion
rese
rve $
Reta
ined
lo
sses $
Tota
l eq
uity $
Bala
nce
as a
t 1 Ju
ly 2
013
(Res
tate
d)*
189,
311
--
2,16
81,
303
(85,
976)
106,
806
Com
preh
ensi
ve in
com
e fo
r the
per
iod
Loss
for t
he p
erio
d-
--
--
(14,
981)
(14,
981)
Net
cha
nge
in fa
ir va
lue
of a
vaila
ble-
for-
sale
fina
ncia
l ass
ets
--
--
--
-
Tota
l com
preh
ensi
ve in
com
e fo
r the
per
iod
--
--
-(1
4,98
1)(1
4,98
1)
Tran
sact
ions
with
ow
ners
reco
rded
dire
ctly
in e
quit
y
Issu
e of
ord
inar
y sh
ares
, net
of t
rans
actio
n co
sts
38,8
38-
--
--
38,8
38
Shar
e ba
sed
paym
ent t
rans
actio
ns-
--
729
--
729
Shar
e op
tions
exe
rcis
ed/f
orfe
ited
--
-(4
39)
-43
9-
Tota
l tra
nsac
tion
with
ow
ners
reco
rded
dire
ctly
in e
quit
y38
,838
--
290
-43
939
,567
Bala
nce
as a
t 31
Dec
embe
r 201
322
8,14
9-
-2,
458
1,30
3(1
00,5
18)
131,
392
The
note
s on
pag
es 4
6 to
83
are
an in
tegr
al p
art o
f the
se c
onso
lidat
ed fi
nanc
ial s
tate
men
ts*
See
Not
e 5
For
per
sona
l use
onl
y

Notes to the Financial StatementsFor the 6 months ended 31 December 2013
46
1. Reporting EntityBuru Energy Limited (“Buru” or the “Company”) is a company domiciled in Australia. The address of the Company’s registered office is Level 2, 88 William Street, Perth, Western Australia 6000. The consolidated financial statements of the Company as at and for the six months ended 31 December 2013 comprise the Company and its subsidiaries (together referred to as the “Group” and individually as “Group entities”) and the Group’s interest in jointly controlled entities. The Group is a for profit entity and is primarily involved in oil and gas exploration and production in the Canning Basin in the Kimberley region of Western Australia.
Comparative figures
The Company has adopted a voluntary change in accounting policy relating to exploration and evaluation expenditure. The comparative statement of profit or loss and other comprehensive income, comparative consolidated statement of cash flows and the comparative statement of financial position have been re-presented as if the change in accounting policy took place at the start of the comparative period (note 5).
Change of Financial Period
During the six months to 31 December 2013, the financial period of the Company was changed from 30 June to 31 December to align the Company’s financial year with that of the Joint Ventures it operates in the Canning Basin and the majority of its oil and gas peers. Accordingly comparative figures for the Financial Statements cover the twelve month period from 1 July 2012 to 30 June 2013. The results for the period are therefore not directly comparable with the results for the year ended 30 June 2013.
2. Basis of Preparation(a) Statement of Compliance
The consolidated financial statements are general purpose financial statements which have been prepared in accordance with Australian Accounting Standards (AASBs) (including Australian Interpretations) adopted by the Australian Accounting Standards Board (AASB) and the Corporations Act 2001. The consolidated financial statements of the Group comply with International Financial Reporting Standards (IFRSs) and interpretations adopted by the International Accounting Standards Board (IASB). The financial statements were approved by the Board of Directors on 21 March 2014.
(b) Basis of Measurement
The consolidated financial statements have been prepared on the historical cost basis, except for the following material items in the statement of financial position:
- Available-for-sale-financial assets are measured at fair value; and- Share based payments are measured at fair value.
The methods used to measure fair value are discussed further in note 4.
(c) Functional and Presentation Currency
These consolidated financial statements are presented in Australian dollars, which is each of the Group entities’ functional currency. The Company is of a kind referred to in ASIC Class Order 98/100 dated 10 July 1988 and in accordance with that Class Order, all financial information presented in Australian dollars has been rounded to the nearest thousand unless otherwise stated.
(d) Use of Estimates and Judgements
The preparation of financial statements in conformity with IFRS requires management to make estimates and assumptions that affect the application of accounting policies and the reported amounts of assets, liabilities, income and expenses. Actual results may differ from these estimates. Estimates and underlying assumptions are reviewed on an ongoing basis. Revisions to accounting estimates are recognised in the period in which the estimate is revised and in any future periodsaffected.
Information about assumptions and estimation uncertainties in applying accounting policies that have the most significant effect on the amount recognised in the financial statements are described in the following notes:
For
per
sona
l use
onl
y
Notes to the Financial StatementsFor the 6 months ended 31 December 2013
47
Note 14 – Exploration and evaluation expenditure
Determining the recoverability of exploration and evaluation expenditure capitalised requires estimates and judgements as to future events and circumstances, in particular, whether successful development and commercial exploitation or sale of the respective area of interest is likely. Critical to this assessment are estimates and assumptions as to the timing of expected cash flows, exchange rates, commodity prices and future capital requirements. If, after having capitalised the expenditure a judgement is made that recovery of the expenditure is unlikely, an impairment loss is recorded in the income statement.
Note 17 – Recognition of tax losses
In accordance with the group’s accounting policies for deferred taxes (refer note 3(o)), a deferred tax asset is recognised for unused tax losses only if it is probable that future taxable profits will be available to utilise those losses. Determination of future taxable profits requires estimates and assumptions as to future events and circumstances, in particular, whether successful development and commercial exploitation, or alternatively sale, of the respective areas of interest will be achieved. This includes estimates and judgements about oil and gas prices, reserves, exchange rates, future capital requirements, future operational performance and the timing of estimated cash flows. Changes in these estimates and assumptions could impact on the amount and probability of estimated taxable profits and accordingly the recoverability of deferred tax assets. The carrying amount of deferred tax assets are set out in note 17.
Note 24 – Provisions
The site restoration provision is in respect of the Group’s obligation to rectify environmental liabilities relating to exploration and production in the Canning Basin in accordance with the requirements of the Department of Environmental Regulation and the Department of Mines and Petroleum. Significant estimates and assumptions are made in determining the provision for site rehabilitation as there are numerous factors that will affect the ultimate liability payable. These factors include estimates of the timing, extent and costs of rehabilitation activities, regulatory changes and changes in discount rates. Those uncertainties may result in future actual expenditure differing from the amounts currently provided. The provision at balance date represents management’s best estimate of the present value of the future rehabilitation costs required. Changes to estimated future costs are recognised in the statement of financial position by adjusting the rehabilitation asset and liability.
Note 25 – Measurement of share-based payments
The fair value of share-based payment expenses is measured using the Black & Scholes valuation model that requires the use of estimates and assumptions for measurement inputs, including expected volatility of the underlying share and weighted average expected life of the instrument.
(e) Changes in Accounting Policies
Except for the changes listed below and in note 3(d), the Group has consistently applied the accounting policies set out in Note 3 to all periods presented in these consolidated financial statements.
The Group has adopted the following new standards and amendments to standards, including any consequential amendments to other standards, with a date of initial application of 1 July 2013.
a) AASB 10 Consolidated Financial Statements (2011)b) AASB 11 Joint Arrangementsc) AASB 12 Disclosure of Interests in Other Entitiesd) AASB 13 Fair Value Measuremente) AASB 119 Employee Benefits (2011)
The nature and effects of the changes are explained below.
For
per
sona
l use
onl
y
Notes to the Financial StatementsFor the 6 months ended 31 December 2013
48
(i) Subsidiaries
As a result of AASB 10 (2011), the Group has changed its accounting policy for determining whether it has control over and consequently whether it consolidates its investees. AASB 10 (2011) introduces a new control model that focuses on whether the Group has power over an investee, exposure or rights to variable returns from its involvement with the investee and ability to use its power to affect those returns.
In accordance with the transitional provisions of AASB 10 (2011), the Group reassessed the control conclusion for its investees (refer note 26) at 1 July 2013 and concluded that the application of AASB 10 (2011) does not have any impact on the amounts recognised in the financial statements.
(ii) Joint arrangements
As a result of AASB 11, the Group has changed its accounting policy for its interests in joint arrangements. Under AASB 11, the Group has classified its interests in joint arrangements as either joint operations (if the Group has rights to the assets, and obligations for the liabilities, relating to an arrangement) or joint ventures (if the Group has rights only to the net assets of an arrangement). When making this assessment, the Group considered the structure of the arrangements, the legal form of any separate vehicles, the contractual terms of the arrangements and other facts and circumstances. Previously, the structure of the arrangement was the sole focus of classification.
The Group has re-evaluated its involvement in its joint arrangements (note 28) and has reclassified the investments from jointly controlled assets to joint operations. Notwithstanding the reclassification, the Group continues to recognise its share of assets, liabilities and transactions, including its share of those incurred jointly, in its consolidated financial statements. The application of AASB 11 therefore does not have any impact on the recognised assets, liabilities and comprehensive income of the Group.
(iii) Disclosure of interests in other entities
As a result of AASB 12, the Group has expanded its disclosures about its interests in joint arrangements (see note 28).
(iv) Fair value measurement
AASB 13 establishes a single framework for measuring fair value and making disclosures about fair value measurements when such measurements are required or permitted by other AASBs. It unifies the definition of fair value as the price that would be received to sell an asset or paid to transfer a liability in an orderly transaction between market participants at the measurement date. It replaces and expands the disclosure requirements about fair value measurements in other AASBs, including AASB 7. As a result, the Group has included additional disclosures in this regard (see Note 16).
In accordance with the transitional provisions of AASB 13, the Group has applied the new fair value measurement guidance prospectively and has not provided any comparative information for new disclosures. Notwithstanding the above, the change had no significant impact on the measurements of the Group’s assets and liabilities.
(v) Employee benefits
In the current period, the Group adopted AASB 119 (2011) which revised the definition of short-term employee benefits to benefits that are expected to be settled wholly within 12 months after the end of the annual reporting period in which the employees render the related service. The application of AASB 119 (2011) does not have a significant impact on the amounts recognised in these financial statements.
For
per
sona
l use
onl
y

Notes to the Financial StatementsFor the 6 months ended 31 December 2013
49
3. Significant Accounting PoliciesThe accounting policies set out below have been applied consistently by Group entities to all periods presented in these consolidated financial statements. Certain comparative amounts have been reclassified to address changes in accounting policies (note 5).
(a) Basis of Consolidation(i) Subsidiaries
Subsidiaries are entities controlled by the Group. The Group controls an entity when it is exposed to, or has rights to, variable returns from its involvement with the entity and has the ability to affect those returns through its power over the entity. The financial statements of subsidiaries are included in the consolidated financial statements from the date that control commences until the date that control ceases.
(ii) Joint arrangements
A joint arrangement is an arrangement over which two or more parties have joint control. Joint control exists only when decisions about the relevant activities - i.e. those that significantly affect the returns of the arrangement - require the unanimous consent of the parties sharing control of the arrangement. Buru has numerous arrangements which meet this definition for its oil and gas activities in different exploration permits.
In accordance with AASB 11, the arrangements have been classified as joint operations (whereby the jointly controlling parties have rights to the assets and obligations for the liabilities relating to the arrangement) as opposed to a joint venture because separate vehicles have not been established through which activities are conducted. The Group therefore recognises its assets, liabilities and transactions, including its share of those incurred jointly, in its consolidated financial statements.
(iii) Transactions eliminated on consolidation
Intra-group balances and transactions, and any unrealised income and expenses arising from intra-group transactions, are eliminated in preparing the consolidated financial statements. Unrealised gains arising from transactions with equity accounted investees are eliminated against the investment to the extent of the Group’s interest in the investee. Unrealised losses are eliminated in the same way as unrealised gains, but only to the extent that there is no evidence of impairment.
(b) Foreign Currency
Transactions in foreign currencies are translated to Australian Dollars at the foreign exchange rate ruling at the date of the transaction. Monetary assets and liabilities denominated in foreign currencies at the balance sheet date are translated to Australian dollars at the foreign exchange rate ruling at that date. Foreign exchange differences arising on translation are recognised in the income statement.
(c) Property, Plant and Equipment(i) Recognition and measurement
Items of property, plant and equipment are measured at cost less accumulated depreciation and accumulated impairment losses.
Cost includes expenditure that is directly attributable to the acquisition of the asset. Purchased software that is integral to the functionality of the related equipment is capitalised as part of that equipment.
Gains and losses on disposal of an item of property, plant and equipment are determined by comparing the proceeds from disposal with the carrying amount of property, plant and equipment and are recognised net in profit or loss.
(ii) Subsequent costs
Subsequent expenditure is capitalised only when it is probable that the future economic benefits associated with the expenditure will flow to the Group, and its cost can be measured reliably. The costs of the day-to-day servicing of property, plant and equipment are recognised in profit or loss as incurred.
For
per
sona
l use
onl
y

Notes to the Financial StatementsFor the 6 months ended 31 December 2013
50
(iii) Depreciation
Depreciation is calculated over the depreciable amount, which is the cost of an asset, or other amount substituted for cost, less its residual value. Depreciation is recognised in profit or loss on a straight-line basis over the estimated useful lives of each component of property, plant and equipment, since this most closely reflects the expected pattern of consumption of the future economic benefits embodied in the asset.
The estimated useful lives for the current and comparative period are as follows:
• plant & equipment 10 – 30 years
• office equipment 3 – 20 years
• fixtures and fittings 6 – 20 years
• heritage and cultural assets not depreciated
The useful life, residual value and the depreciation method applied to an asset are reassessed at least annually. Heritage and cultural assets with the potential to be maintained for an indefinite period through conservation, restoration and preservation activities are considered to have an indefinite life and not depreciated.
(d) Exploration and Evaluation Expenditure
The Company has made a voluntary change to its accounting policy for exploration and evaluation expenditure. This change has been applied retrospectively. Exploration and evaluation expenditure in respect of each area of interest is accounted for using the successful efforts method of accounting. The successful efforts method requires all exploration and evaluation expenditure to be expensed in the period it is incurred, except the costs of successful wells and the costs of acquiring interests in new exploration assets, which are capitalised as intangible exploration and evaluation. The costs of wells are initially capitalised pending the results of the well.
An area of interest refers to an individual geological area where the presence of oil or a natural gas field is considered favourable or has been proved to exist, and in most cases will comprise an individual prospective oil or gas field.
Exploration and evaluation expenditure is recognised in relation to an area of interest when the rights to tenure of the area of interest are current and either:
a) such expenditure is expected to be recovered through successful development and commercial exploitation of the area of interest or, alternatively, by its sale; or
b) the exploration activities in the area of interest have not yet reached a stage which permits reasonable assessment of the existence of economically recoverable reserves and active and significant operations in, or in relation to, the area of interest are continuing.
Where an ownership interest in an exploration and evaluation asset is exchanged for another, the transaction is recognised by reference to the carrying value of the original interest. Any cash consideration paid, including transaction costs, is accounted for as an acquisition of exploration and evaluation assets.
Any cash consideration received, net of transaction costs, is treated as a recoupment of costs previously capitalised with any excess accounted for as a gain on disposal of non-current assets.
For
per
sona
l use
onl
y

Notes to the Financial StatementsFor the 6 months ended 31 December 2013
51
The carrying amounts of the Group’s exploration and evaluation assets are reviewed at each reporting date to determine whether any of the following indicators of impairment exists:
a) tenure over the licence area has expired during the period or will expire in the near future, and is not expected to be renewed; or
b) substantive expenditure on further exploration for and evaluation of mineral resources in the specific area is not budgeted or planned; or
c) exploration for and evaluation of resources in the specific area has not led to the discovery of commercially viable quantities of resources, and the Group has decided to discontinue activities in the specific area; or
d) sufficient data exist to indicate that although a development is likely to proceed, the carrying amount of the exploration and evaluation asset is unlikely to be recovered in full from successful development or from sale.
Where an indicator of impairment exists, a formal estimate of the recoverable amount is made and any resultant impairment loss is recognised in the income statement. (Refer note 3(i) - (ii))
When a discovered oil or gas field enters the development phase the accumulated exploration and evaluation expenditure is transferred to oil and gas assets – assets in development.
(e) Oil and Gas Assets Assets in development
The costs of oil and gas assets in development are separately accounted for and include past exploration and evaluation costs, development drilling and other subsurface expenditure, surface plant and equipment and any associated land and buildings.
When the committed development expenditure programs are completed and production commences, these costs are subject to amortisation. Once the required statutory documentation for a production licence is received the accumulated costs are transferred to oil and gas assets – producing assets.
(f ) Financial Instruments(i) Non-derivative financial assets
The Group initially recognises loans and receivables and deposits on the date that they are originated. All other financial assets (including assets designated at fair value through profit or loss) are recognised initially on the trade date at which the Group becomes a party to the contractual provisions of the instrument.
The Group derecognises a financial asset when the contractual rights to the cash flows from the asset expire, or it transfers the rights to receive the contractual cash flows on the financial asset in a transaction in which substantially all the risks and rewards of ownership of the financial asset are transferred. Any interest in transferred financial assets that is created or retained by the Group is recognised as a separate asset or liability.
Financial assets and liabilities are offset and the net amount presented in the statement of financial position when, and only when, the Group has a legal right to offset the amounts and intends either to settle on a net basis or to realise the asset and settle the liability simultaneously.
The Group has the following non-derivative financial assets: cash and cash equivalents, loans and receivables and available-for-sale financial assets.
Cash and cash equivalents
Cash and cash equivalents comprise cash balances and call deposits with original maturities of three months or less and are used by the Group in the management of its short-term commitments.F
or p
erso
nal u
se o
nly

Notes to the Financial StatementsFor the 6 months ended 31 December 2013
52
Loans and receivables
Loans and receivables are financial assets with fixed or determinable payments that are not quoted in an active market. Such assets are recognised initially at fair value plus any directly attributable transaction costs. Subsequent to initial recognition loans and receivables are measured at amortised cost using the effective interest method, less any impairment losses. Loans and receivables comprise trade and other receivables.
Available-for-sale financial assets
Available-for-sale financial assets are non-derivative financial assets that are designated as available-for-sale and that are not classified in any of the other categories of financial assets. Available-for-sale financial assets are recognised initially at fair value plus any attributable transaction costs. The Group’s investments in equity securities and certain debt securities are classified as available-for-sale financial assets. Subsequent to initial recognition, they are measured at fair value and changes therein, other than impairment losses (see note 3(i)(i)), and foreign currency differences on available-for-sale equity instruments, are recognised in other comprehensive income and presented within equity in the fair value reserve. When an investment is derecognised, the cumulative gain or loss in equity is transferred to profit or loss.
(ii) Non-derivative financial liabilities
Financial liabilities are recognised initially on the trade date at which the Group becomes a party to the contractual provisions of the instrument. The Group derecognises a financial liability when its contractual obligations are discharged or cancelled or expire. Financial assets and liabilities are offset and the net amount presented in the statement of financial position when, and only when, the Group has a legal right to offset the amounts and intends either to settle on a net basis or to realise the asset and settle the liability simultaneously.
The Group has the following non-derivative financial liabilities: trade and other payables.
Trade and Other Payables
Trade payables are non-interest bearing and are normally settled on 30 day terms.
Unearned income includes payments received relating to revenue in subsequent years. Revenue will only be recognised when Buru delivers the goods or services to the customer.
Such financial liabilities are recognised initially at fair value plus any directly attributable transaction costs. Subsequent to initial recognition these financial liabilities are measured at amortised cost using the effective interest rate method.
(iii) Share capital
Ordinary shares
Ordinary shares are classified as equity. Incremental costs directly attributable to the issue of ordinary shares and share options are recognised as a deduction from equity, net of any tax effects.
(g) Inventories
Inventories are valued at the lower of cost or net realisable value. Net realisable value is the estimated selling price in the ordinary course of business, less the estimated costs of completion and selling expenses. Cost is determined as follows:
a) Materials and consumables, which include drilling and maintenance stocks, are valued at the cost of acquisition which includes expenditure incurred in acquiring the inventories and bringing them to their existing location and condition; and
b) petroleum products, comprising extracted crude oil stored in tanks and pipeline systems, are valued using the full absorption cost method.
Inventories are accounted for on a FIFO basis.
(h) Leased Assets
Leases in terms of which the Group does not assume substantially all the risks and rewards of ownership are classified as operating leases. The leased assets are not recognised in the Group’s statement of financial position.
For
per
sona
l use
onl
y

Notes to the Financial StatementsFor the 6 months ended 31 December 2013
53
(i) Impairment(i) Non-derivative financial assets (including receivables)
A financial asset not carried at fair value through profit or loss is assessed at each reporting date to determine whether there is objective evidence that it is impaired. A financial asset is impaired if objective evidence indicates that a loss event has occurred after the initial recognition of the asset, and that the loss event had a negative effect on the estimated future cash flows of that asset that can be estimated reliably.
Objective evidence that financial assets (including equity securities) are impaired can include default or delinquency by a debtor, restructuring of an amount due to the Group on terms that the Group would not consider otherwise, indications that a debtor or issuer will enter bankruptcy, adverse changes in the payment status of borrowers or users in the Group, economic conditions that correlate with defaults or the disappearance of an active market for a security. In addition, for an investment in an equity security, a significant or prolonged decline in its fair value below its cost is objective evidence of impairment.
The Group considers evidence of impairment at both a specific asset and collective level. In assessing collective impairment the Group uses historical trends of the probability of default, timing of recoveries and the amount of loss incurred, adjusted for management’s judgement as to whether current economic and credit conditions are such that the actual losses are likely to be greater or less than suggested by historical trends.
An impairment loss in respect of a financial asset measured at amortised cost is calculated as the difference between its carrying amount and the present value of the estimated future cash flows discounted at the asset’s original effective interest rate. Losses are recognised in profit or loss and reflected in an allowance account against receivables. Interest on the impaired asset continues to be recognised through the unwinding of the discount. When a subsequent event causes the amount of impairment loss to decrease, the decrease in impairment loss is reversed through profit or loss.
Impairment losses on available-for-sale investment securities are recognised by transferring the cumulative loss that has been recognised in other comprehensive income, and presented in the fair value reserve in equity, to profit or loss. The cumulative loss that is reclassified from other comprehensive income and recognised in profit or loss is the difference between the acquisition cost, net of any principal repayment and amortisation, and the current fair value, less any impairment loss previously recognised in profit or loss. Changes in impairment provisions attributable to time value are reflected as a component of interest income.
If, in a subsequent period, the fair value of an impaired available-for-sale debt security increases and the increase can be related objectively to an event occurring after the impairment loss was recognised in profit or loss, then the impairment loss is reversed, with the amount of the reversal recognised in profit or loss. However, any subsequent recovery in the fair value of an impaired available-for-sale equity security is recognised in other comprehensive income.
(ii) Non-financial assets
The carrying amounts of the Group’s non-financial assets, other than deferred tax assets and inventories, are reviewed at each reporting date to determine whether there is any indication of impairment. If any such indication exists then the asset’s recoverable amount is estimated. An impairment loss is recognised if the carrying amount of an asset or its cash-generating unit exceeds its recoverable amount. For the purpose of impairment testing, assets that cannot be tested individually are grouped together into a cash-generating unit (“CGU”). A CGU is the smallest identifiable asset group that generates cash flows that largely are independent from other assets and groups. Impairment losses are recognised in profit or loss.
The recoverable amount of an asset or CGU is the greater of its value in use and its fair value less costs to sell. In assessing value in use, the estimated future cash flows are discounted to their present value using a pre-tax discount rate that reflects current market assessments of the time value of money and the risks specific to the asset or CGU.
Impairment losses recognised in prior periods are assessed at each reporting date for any indications that the loss has decreased or no longer exists. An impairment loss is reversed only to the extent that the asset’s carrying amount does not exceed the carrying amount that would have been determined, net of depreciation or amortisation, if no impairment loss had been recognised.
For
per
sona
l use
onl
y

Notes to the Financial StatementsFor the 6 months ended 31 December 2013
54
(j) Employee Benefits(i) Long-term employee benefits
The Group’s net obligation in respect of long-term employee benefits is the amount of future benefit that employees have earned in return for their service in the current and prior periods plus related on-costs; that benefit is discounted to determine its present value, and the fair value of any related assets is deducted. The discount rate is the yield at the reporting date on AA credit-rated or government bonds that have maturity dates approximating the terms of the Group’s obligations. The calculation is performed using the projected unit credit method. Any actuarial gains or losses are recognised in profit or loss in the period in which they arise.
(ii) Termination benefits
Termination benefits are recognised as an expense when the Group is demonstrably committed, without realistic possibility of withdrawal, to a formal detailed plan to either terminate employment before the normal retirement date, or to provide termination benefits as a result of an offer made to encourage voluntary redundancy. Termination benefits for voluntary redundancies are recognised as an expense if the Group has made an offer of voluntary redundancy, it is probable that the offer will be accepted, and the number of acceptances can be estimated reliably. If benefits are payable more than 12 months after the reporting period, then they are discounted to their present value.
(iii) Short-term benefits
Short-term employee benefit obligations are expensed as the related service is provided.
A liability is recognised for the amount expected to be paid if the Group has a present legal or constructive obligation to pay this amount as a result of past service provided by the employee and the obligation can be estimated reliably.
(iv) Share-based payment transactions
The grant date fair value of share-based payment awards granted to employees is recognised as an employee expense, with a corresponding increase in equity, over the period that the employees unconditionally become entitled to the awards. The amount recognised as an expense is adjusted to reflect the number of awards for which the related service and non-market vesting conditions are expected to be met, such that the amount ultimately recognised as an expense is based on the number of awards that meet the related service and non-market performance conditions at the vesting date. For share-based payment awards with non-vesting conditions, the grant date fair value of the share-based payment is measured to reflect such conditions and there is no true-up for differences between expected and actual outcomes.
The fair value of the amount payable to employees in respect of share appreciation rights, which are settled in cash, is recognised as an expense, with a corresponding increase in liabilities, over the period that the employees unconditionally become entitled to payment. The liability is remeasured at each reporting date and at settlement date. Any changes in the fair value of the liability are recognised as personnel expense in profit or loss.
Share-based payment arrangements in which the Group receives goods or services as consideration for its own equity instruments are accounted for as equity-settled share-based payment transactions, regardless of how the equity instruments are obtained by the Group. When the Company grants options over its shares to employees of subsidiaries, the fair value at grant date is recognised as an increase in the investments in subsidiaries, with a corresponding increase in equity over the vesting period of the grant.
(k) Provisions
A provision is recognised when the Group has a present legal or constructive obligation as a result of a past event, and it is probable that an outflow of economic benefits will be required to settle the obligation and that the obligation can be measured reliably. Provisions are determined by discounting the expected future cash flows at a pre-tax rate that reflects current market assessments of the time value of money and, where appropriate, the risks specific to the liability. The unwinding of the discount is recognised as a finance cost.F
or p
erso
nal u
se o
nly

Notes to the Financial StatementsFor the 6 months ended 31 December 2013
55
(i) Site restoration
Provisions are made for the estimated cost of an oil and gas field’s site rehabilitation, decommissioning and restoration. Provisions include reclamation, plant closure, waste site closure and monitoring activities. The amount recognised as a liability represents the estimated future costs discounted to present value at a pre-tax rate that reflects current market assessments of the time value of money and the risks specific to the liability.
Uncertainty exists as to the amount of restoration obligations which will be incurred due to the following factors:
• uncertainty as to the remaining life of existing operating sites; and
• the impact of changes in legislation.
At each reporting date the site restoration provision is re-measured to reflect any changes in discount rates and timing or amounts of the costs to be incurred. Such changes in estimates are dealt with on a prospective basis from the date of the changes and are added to, or deducted from, the related asset where it is probable that future economic benefits will flow to the entity.
(l) Revenue
Revenue from the sale of oil, gas and condensate in the course of ordinary activities is recognised in the income statement at the fair value of the consideration received or receivable. Revenue is recognised when the significant risks and rewards of ownership have been transferred to the buyer, recovery of the consideration is probable and the amount of revenue can be estimated reliably.
(m) Lease Payments
Payments made under operating leases are recognised in profit or loss on a straight-line basis over the term of the lease. Lease incentives received are recognised as an integral part of the total lease expense, over the term of the lease. Minimum lease payments made under finance leases are apportioned between the finance expense and the reduction of the outstanding liability. The finance expense is allocated to each period during the lease term so as to produce a constant periodic rate of interest on the remaining balance of the liability. Contingent lease payments are accounted for by revising the minimum lease payments over the remaining term of the lease when the lease adjustment is confirmed.
Determining whether an arrangement contains a lease
At inception of an arrangement, the Group determines whether such an arrangement is or contains a lease. A specific asset is the subject of a lease if fulfilment of the arrangement is dependent on the use of that specified asset and the arrangement conveys the right to use the asset. At inception or upon reassessment of the arrangement, the Group separates payments and other consideration required by such an arrangement into those for the lease and those for other elements on the basis of their relative fair values. If the Group concludes for a finance lease that it is impracticable to separate the payments reliably, an asset and a liability are recognised at an amount equal to the fair value of the underlying asset. Subsequently the liability is reduced as payments are made and an imputed finance charge on the liability is recognised using the Group’s incremental borrowing rate.
For
per
sona
l use
onl
y

Notes to the Financial StatementsFor the 6 months ended 31 December 2013
56
(n) Finance Income and Expenses
Finance income comprises interest income on funds invested (including available-for-sale financial assets), and gains on the disposal of available-for-sale financial assets. Interest income is recognised as it accrues in profit or loss, using the effective interest method.
Finance expenses comprise unwinding of the discount on provisions and impairment losses recognised on financial assets. All borrowing costs are recognised in profit or loss using the effective interest method.
Foreign currency gains and losses are reported on a net basis.
(o) Income Tax
Income tax expense comprises current and deferred tax. Income tax expense is recognised in the income statement except to the extent that it relates to items recognised directly in equity, in which case it is recognised in equity. Current tax is the expected tax payable or receivable on the taxable income or loss for the year, using tax rates enacted or substantively enacted at the reporting date, and any adjustment to tax payable in respect of previous years. Deferred tax is recognised in respect of temporary differences between the carrying amounts of assets and liabilities for financial reporting purposes and the amounts used for taxation purposes.
Deferred tax is not provided for: temporary differences on the initial recognition of assets or liabilities in a transaction that is not a business combination and that affects neither accounting nor taxable profit, nor differences relating to investments in subsidiaries to the extent that they will not reverse in the foreseeable future. The amount of deferred tax provided is based on the expected manner of realisation or settlement of the carrying amount of assets and liabilities, using tax rates enacted or substantively enacted at the balance sheet date. A deferred tax asset is recognised only to the extent that it is probable that future taxable profits will be available against which the asset can be utilised. Deferred tax assets are reviewed at each reporting date and are reduced to the extent that it is no longer probable that the related tax benefit will be realised.
PRRT
Petroleum Resource Rent Tax (PRRT) is considered for accounting purposes to be a tax on income. Accordingly, current and deferred PRRT expense is measured and disclosed on the same basis as income tax.
Tax consolidation
The Company and its wholly-owned Australian resident entities have formed a tax-consolidated group. As a consequence, all members of the tax-consolidated group are taxed as a single entity. The head entity within the tax-consolidated group is Buru Energy Limited.
(p) Goods and Services Tax
Revenue, expenses and assets are recognised net of the amount of goods and services tax (“GST”), except where the amount of GST incurred is not recoverable from the taxation authority. In these circumstances, the GST is recognised as part of the cost of acquisition of the asset or as part of the expense. Receivables and payables are stated with the amount of GST included. The net amount of GST recoverable from, or payable to, the ATO is included as a current asset or liability in the balance sheet. Cash flows are included in the statement of cash flows on a gross basis. The GST components of cash flows arising from investing and financing activities which are recoverable from, or payable to, the ATO are classified as operating cash flows.
(q) Segment Reporting
An operating segment is a component of Buru that engages in business activities from which it may earn revenues and incur expenses, including revenues and expenses that relate to transactions with any of Buru’s other components. All operating segments’ operating results are reviewed regularly by the Group’s Managing Director, Chief Operating Officer and the Chief Financial Officer to make decisions about resources to be allocated to the segment and to assess its performance, and for which discrete financial information is available. Buru’s revenue in the prior reporting period is significantly attributable to one customer. Segment results that are reported to the Managing Director, Chief Operating Officer and the Chief Financial Officer include items directly attributable to a segment as well as those that can be allocated on a reasonable basis. Unallocated items comprise mainly corporate assets and head office expenses. Segment capital expenditure is the total cost incurred during the year to acquire property, plant and equipment, and intangible assets other than goodwill.
For
per
sona
l use
onl
y

Notes to the Financial StatementsFor the 6 months ended 31 December 2013
57
(r) Earnings Per Share
The Group presents basic and diluted earnings per share (“EPS”) data for its ordinary shares. Basic EPS is calculated by dividing the profit or loss attributable to ordinary shareholders of the Group by the weighted average number of ordinary shares outstanding during the period, adjusted for shares held by the Group’s sponsored employee share plan trust. Diluted EPS is determined by adjusting the profit or loss attributable to ordinary shareholders and the weighted average number of ordinary shares outstanding, adjusted for shares held by the Group’s sponsored employee share plan trust, for the effects of all dilutive potential ordinary shares, which comprise share options granted to employees.
(s) Government Grants
Government grants related to assets are recognised initially as a deduction in the carrying amount of the asset when there is reasonable assurance that the grant will be received and the Group will comply with the conditions associated with the grant. The grants are then recognised in profit or loss on a systematic basis over the useful life of the asset. Grants that compensate the Group for expenses incurred are recognised in profit or loss as other income on a systematic basis in the same periods in which the expenses are recognised.
(t) New Standards and Interpretations Not Yet Adopted
A number of new standards, amendments to standards and interpretations are effective for annual periods beginning after 1 January 2013, and have not been applied in preparing these consolidated financial statements. Those which may be relevant to the Group are set out below. The Group does not plan to adopt these standards early.
AASB 9 Financial Instruments (2010), AASB 9 Financial Instruments (2009)
AASB 9 (2009) introduces new requirements for the classification and measurement of financial assets. Under AASB 9 (2009), financial assets are classified and measured based on the business model in which they are held and the characteristics of their contractual cash flows. AASB 9 (2010) introduces additional changes relating to financial liabilities. The IASB currently has an active project to make limited amendments to the classification and measurement requirements of AASB 9 and add new requirements to address the impairment of financial assets and hedge accounting. AASB 9 (2010) and (2009) are effective for annual periods beginning on or after 1 January 2015, with early adoption permitted. The impact of the adoption of these standards has not yet been assessed by the Group.
4. Determination of Fair ValuesA number of the Group’s accounting policies and disclosures require the determination of fair value, for both financial and non-financial assets and liabilities. When measuring the fair value of an asset or a liability, the Group uses market observable data as far as possible. Fair values are categorised into different levels in a fair value hierarchy based on the inputs used in the valuation techniques as follows.
- Level 1: quoted prices (unadjusted) in active markets for identical assets or liabilities.
- Level 2: inputs other than quoted prices included in Level 1 that are observable for the asset or liability, either directly (i.e. as prices) or indirectly (i.e. derived from prices).
- Level 3: inputs for the asset or liability that are not based on observable market data (unobservable inputs).
If the inputs used to measure the fair value of an asset or a liability might be categorised in different levels of the fair value hierarchy, then the fair value measurement is categorised in its entirety in the same level of the fair value hierarchy as the lowest level input that is significant to the entire measurement.
The Group recognises transfers between levels of the fair value hierarchy at the end of the reporting period during which the change has occurred.
Further information about the assumptions made in measuring fair values is included in the following notes:
- Note 25 – Share-based payment arrangements;
- Note 16 – Investments.
For
per
sona
l use
onl
y

Notes to the Financial StatementsFor the 6 months ended 31 December 2013
58
5. Voluntary Change in Accounting PolicyThe consolidated financial statements have been prepared on the basis of a retrospective application of a voluntary change in accounting policy relating to exploration and evaluation expenditure. Refer note 3(d) for details of the new exploration and evaluation expenditure accounting policy.
The previous exploration and evaluation expenditure accounting policy was to capitalise and carry forward exploration and evaluation expenditure as an asset when rights to tenure of the area of interest are current and costs are expected to be recouped through successful development and commercial exploitation or sale of the respective area of interest, or if activities have not, at reporting date, reached a stage which permits a reasonable assessment of the existence of economically recoverable reserves and active and significant operations in the area continuing.
The new accounting policy was adopted on 1 July 2013 and has been applied retrospectively. The Directors believe that the change in accounting policy will provide more relevant and no less reliable information to users of the consolidated financial statements.
The impact of the change in accounting policy on the Consolidated Statement of Financial Position, Consolidated Statement of Profit or Loss and Other Comprehensive Income and Consolidated Statement of Cash Flows is included in the following tables:
In thousands of AUD 31 December 2013 30 June 2013
Consolidated Statement of Financial Position
PreviousPolicy Adjustment
NewPolicy
PreviousPolicy Adjustment Restated
Exploration and evaluation expenditure capitalised
94,694 (30,076) 64,618 85,590 (21,762) 63,828
Net assets 161,468 (30,076) 131,392 128,568 (21,762) 106,806
Accumulated losses (70,442) (30,076) (100,518) (64,214) (21,762) (85,976)
Total equity 161,468 (30,076) 131,392 128,568 (21,762) 106,806
In thousands of AUD 1 July 2012
Consolidated Statement of Financial Position
PreviousPolicy Adjustment Restated
Exploration and evaluation expenditure
45,967 (15,592) 30,375
Net assets 109,538 (15,592) 93,946
Accumulated losses (50,665) (15,592) (66,257)
Total equity 109,538 (15,592) 93,946
The change in accounting policy did not have an impact on the net deferred tax asset recognised.
For
per
sona
l use
onl
y
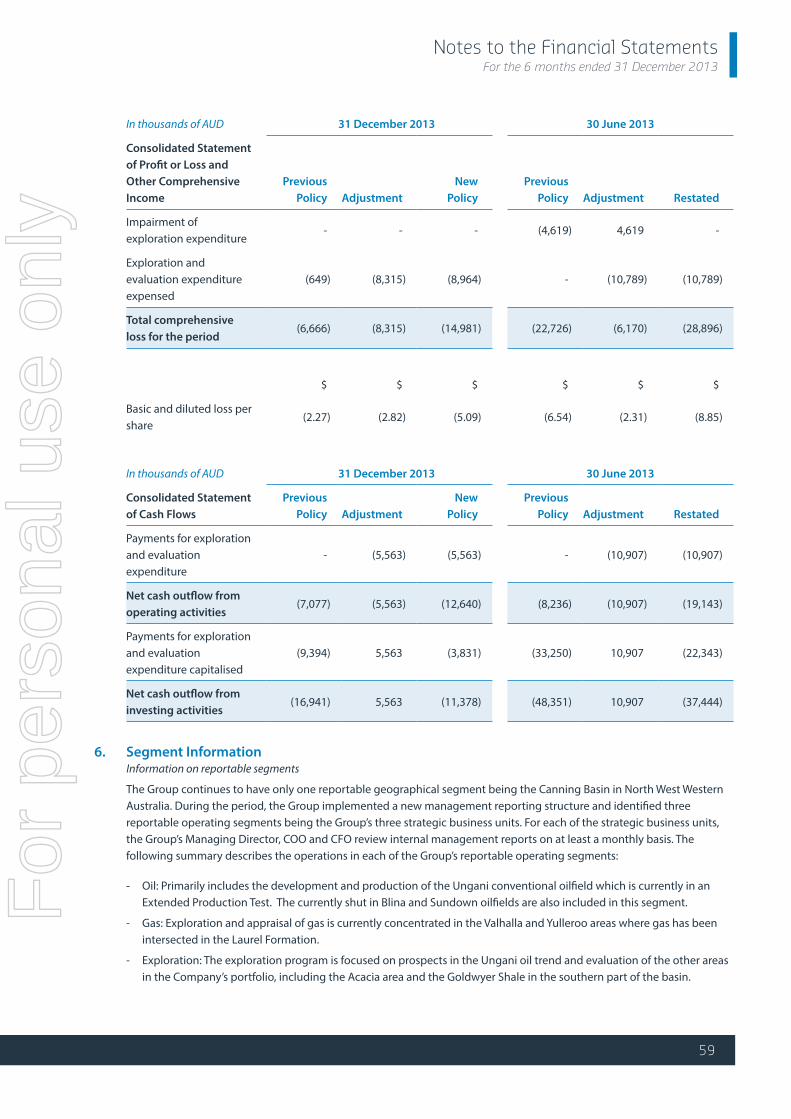
Notes to the Financial StatementsFor the 6 months ended 31 December 2013
59
In thousands of AUD 31 December 2013 30 June 2013
Consolidated Statement of Profit or Loss and Other Comprehensive Income
PreviousPolicy Adjustment
NewPolicy
PreviousPolicy Adjustment Restated
Impairment of exploration expenditure
- - - (4,619) 4,619 -
Exploration and evaluation expenditure expensed
(649) (8,315) (8,964) - (10,789) (10,789)
Total comprehensive loss for the period
(6,666) (8,315) (14,981) (22,726) (6,170) (28,896)
$ $ $ $ $ $
Basic and diluted loss per share
(2.27) (2.82) (5.09) (6.54) (2.31) (8.85)
In thousands of AUD 31 December 2013 30 June 2013
Consolidated Statement of Cash Flows
PreviousPolicy Adjustment
NewPolicy
PreviousPolicy Adjustment Restated
Payments for exploration and evaluation expenditure
- (5,563) (5,563) - (10,907) (10,907)
Net cash outflow from operating activities
(7,077) (5,563) (12,640) (8,236) (10,907) (19,143)
Payments for exploration and evaluation expenditure capitalised
(9,394) 5,563 (3,831) (33,250) 10,907 (22,343)
Net cash outflow from investing activities
(16,941) 5,563 (11,378) (48,351) 10,907 (37,444)
6. Segment Information Information on reportable segments
The Group continues to have only one reportable geographical segment being the Canning Basin in North West Western Australia. During the period, the Group implemented a new management reporting structure and identified three reportable operating segments being the Group’s three strategic business units. For each of the strategic business units, the Group’s Managing Director, COO and CFO review internal management reports on at least a monthly basis. The following summary describes the operations in each of the Group’s reportable operating segments:
- Oil: Primarily includes the development and production of the Ungani conventional oilfield which is currently in an Extended Production Test. The currently shut in Blina and Sundown oilfields are also included in this segment.
- Gas: Exploration and appraisal of gas is currently concentrated in the Valhalla and Yulleroo areas where gas has been intersected in the Laurel Formation.
- Exploration: The exploration program is focused on prospects in the Ungani oil trend and evaluation of the other areas in the Company’s portfolio, including the Acacia area and the Goldwyer Shale in the southern part of the basin.
For
per
sona
l use
onl
y

Notes to the Financial StatementsFor the 6 months ended 31 December 2013
60
Info
rmat
ion
rega
rdin
g th
e re
sults
of e
ach
repo
rtab
le s
egm
ent i
s in
clud
ed b
elow
. Per
form
ance
is m
easu
red
in re
gard
to th
e G
roup
and
its
segm
ents
prin
cipa
lly w
ith re
fere
nce
to e
arni
ngs
befo
re in
tere
st a
nd ta
x, a
nd c
apita
l exp
endi
ture
on
expl
orat
ion
and
eval
uatio
n as
sets
, oil
and
gas
asse
ts, a
nd p
rope
rty,
pla
nt a
nd e
quip
men
t. Co
rpor
ate
repr
esen
ts
a re
conc
iliat
ion
of re
port
able
seg
men
ts re
venu
es, p
rofit
or l
oss
and
asse
ts to
the
cons
olid
ated
figu
res.
This
is th
e fir
st re
port
ing
perio
d fo
r whi
ch B
uru
has
stru
ctur
ed it
s in
tern
al o
rgan
isat
ion
in a
man
ner t
hat c
ause
s th
e co
mpo
sitio
n of
its
repo
rtab
le s
egm
ents
and
the
Gro
up h
as
prov
ided
the
oper
atin
g se
gmen
t inf
orm
atio
n fo
r the
rest
ated
fina
ncia
l acc
ount
s fo
r the
yea
r end
ed 3
0 Ju
ne 2
013.
Profi
t and
loss
Oil
Gas
Expl
orat
ion
Corp
orat
eTo
tal
in th
ousa
nds o
f AU
DD
ec 1
3Ju
n 13
Dec
13
Jun
13D
ec 1
3Ju
n 13
Dec
13
Jun
13D
ec 1
3Ju
n 13
Exte
rnal
reve
nues
-5,
420
--
--
--
-5,
420
Ope
ratin
g co
sts
-(5
,527
)-
--
--
--
(5,5
27)
Gro
ss P
rofit
-(1
07)
--
--
--
-(1
07)
Oth
er in
com
e-
--
--
-11
92,
145
119
2,14
5
Expl
orat
ion
and
eval
uatio
n ex
pend
iture
--
(726
)(1
,646
)(8
,238
)(9
,143
)-
-(8
,964
)(1
0,78
9)
Impa
irmen
t of o
il an
d ga
s as
sets
-(9
14)
--
--
--
-(9
14)
Impa
irmen
t of p
rope
rty,
pla
nt
and
equi
pmen
t-
--
--
--
(773
)-
(773
)
Corp
orat
e an
d ad
min
istr
ativ
e ex
pend
iture
, inc
ludi
ng
depr
ecia
tion
--
--
--
(7,0
34)
(13,
272)
(7,0
34)
(13,
272)
Shar
e ba
sed
paym
ent e
xpen
ses
--
--
--
(729
)(2
,058
)(7
29)
(2,0
58)
JV P
artn
er’s
shar
e of
tech
nica
l and
ad
min
istr
ativ
e ex
pend
iture
--
--
--
-1,
870
-1,
870
EBIT
-(1
,021
)(7
26)
(1,6
46)
(8,2
38)
(9,1
43)
(7,6
44)
(12,
088)
(16,
608)
(23,
898)
Inte
rest
inco
me
--
--
--
1,62
72,
587
1,62
72,
587
Repo
rtab
le s
egm
ent p
rofit
/ (lo
ss) b
efor
e ta
x-
(1,0
21)
(726
)(1
,646
)(8
,238
)(9
,143
)(6
,017
)(9
,501
)(1
4,98
1)(2
1,31
1)
Inco
me
tax
expe
nse
/ (be
nefit
)-
--
--
--
(2,2
76)
-(2
,276
)
Net
pro
fit /
(loss
) aft
er ta
x-
(1,0
21)
(726
)(1
,646
)(8
,238
)(9
,143
)(6
,017
)(1
1,77
7)(1
4,98
1)(2
3,58
7)
Reve
nues
for t
he y
ear e
nded
30
June
201
3 fo
r the
Ung
ani O
il se
gmen
t wer
e ea
rned
from
one
cus
tom
er.
For
per
sona
l use
onl
y

Notes to the Financial StatementsFor the 6 months ended 31 December 2013
61
Inve
stm
ent E
xpen
ditu
reO
ilG
asEx
plor
atio
nCo
rpor
ate
Tota
l
in th
ousa
nds o
f AU
DD
ec 1
3Ju
n 13
Dec
13
Jun
13D
ec 1
3Ju
n 13
Dec
13
Jun
13D
ec 1
3Ju
n 13
Prop
erty
, pla
nt a
nd e
quip
men
t-
--
--
-50
13,
203
501
3,20
3
Expl
orat
ion
and
eval
uatio
n as
sets
--
757
7,30
03,
588
30,1
03-
-4,
345
37,4
03
Oil
and
gas
asse
ts –
dev
elop
men
t6,
913
3,94
0-
--
--
-6,
913
3,94
0
Tota
l cap
ital e
xpen
ditu
re6,
913
3,94
075
77,
300
3,58
830
,103
501
3,20
311
,759
44,5
46
Tota
l Ass
ets
Oil
Gas
Expl
orat
ion
Corp
orat
eTo
tal
in th
ousa
nds o
f AU
DD
ec 1
3Ju
n 13
Dec
13
Jun
13D
ec 1
3Ju
n 13
Dec
13
Jun
13D
ec 1
3Ju
n 13
Curr
ent a
sset
s-
--
--
-73
,370
53,3
6573
,370
53,3
65
Prop
erty
, pla
nt a
nd e
quip
men
t-
--
--
-7,
974
8,02
17,
974
8,02
1
Expl
orat
ion
and
eval
uatio
n as
sets
--
17,4
3516
,678
47,1
8347
,150
--
64,6
1863
,828
Oil
and
gas
asse
ts –
dev
elop
men
t11
,922
5,00
9-
--
--
-11
,922
5,00
9
Inve
stm
ents
--
--
--
30,0
2827
,425
30,0
2827
,425
Tota
l Ass
ets
11,9
225,
009
17,4
3516
,678
47,1
8347
,150
111,
372
88,8
1118
7,91
215
7,64
8
For
per
sona
l use
onl
y
Notes to the Financial StatementsFor the 6 months ended 31 December 2013
62
7. Financial Risk Management(a) Overview
The Group has exposure to the following risks from its use of financial instruments:
- credit risk;
- liquidity risk; and
- market risk.
This note presents information about the Group’s exposure to each of the above risks, its objectives, policies and processes for measuring and managing risk, and the management of capital. Further quantitative disclosures are included throughout these financial statements.
The Board has overall responsibility for the establishment and oversight of the risk management framework. The Board has established the Audit and Risk Committee which is responsible for developing and monitoring the Group risk management policies. The Committee reports regularly to the Board on its activities. Risk management policies are established to identify and analyse the risks faced by the Group, to set appropriate risk limits and controls, and to monitor risks and adherence to limits. Risk management policies and systems are reviewed regularly to reflect changes in market conditions and the Group’s activities. The Group, through its training and management standards and procedures, aim to develop a disciplined and constructive control environment in which all employees understand their roles and obligations.
The Audit and Risk Committee oversees how management monitors compliance with the Group’s risk management policies and procedures, and reviews the adequacy of the risk management framework in relation to the risks faced by the Group.
(b) Credit risk
Credit risk is the risk of financial loss to the Group if a customer or counterparty to a financial instrument fails to meet its contractual obligations, and arises principally from the Group’s receivables from customers and amounts due from Joint Venture Partners.
(i) Trade and other receivables
The Group’s exposure to credit risk is influenced mainly by the individual characteristics of each customer. The Group’s revenue from sales of crude oil in the prior reporting period was attributable to sales transactions with a single customer. The Board is confident that this particular customer is an organisation of sufficient size and has sufficient cash flows to limit the credit risk to acceptable levels. As at 31 December 2013, the Group had no exposure to this customer.
The Group does not require collateral in respect of trade and other receivables.
The Group does not have an allowance for impairment on trade and other receivables. To date the Group have always received full consideration for trade and other receivables in a timely manner and as such there is no reason to believe that this will not continue going forward.
For
per
sona
l use
onl
y

Notes to the Financial StatementsFor the 6 months ended 31 December 2013
63
Exposure to credit risk
The carrying amount of the Group’s financial assets represents the Group’s maximum credit exposure. The Group’s maximum exposure to credit risk at the reporting date was:
Note
Carrying amount
in thousands of AUD 31 December 2013 30 June 2013
Trade and other receivables (excluding prepayments) 18 6,921 2,069
Cash and cash equivalents 20a 60,252 45,437
Available-for-sale financial assets 16 2,167 2,167
Other loans, due after 1 year 16 2,000 -
Long-term cash held in escrow 16 25,861 25,229
97,201 74,902
Trade and other receivables included accrued interest receivable from Australian accredited banks of $187,000 (30 June 2013: $294,000), and tax amounts owed of $4,615,000 (30 June 2013: $187,000) from the Australian Taxation Office (refer note 18).
Impairment losses
None of the Group’s receivables are past due or impaired. None of the Group’s other financial instruments were impaired at yearend.
(ii) Cash and cash equivalents
The Group held cash and cash equivalents of $60,252,000 at 31 December 2013 (30 June 2013: $45,437,000) and long-term cash held in escrow of $25,861,000 (30 June 2013: $25,229,000) which represents its maximum credit exposure on these assets. The cash and cash equivalents are held with bank and financial institution counterparties, which are rated AA-, based on rating agency Fitch Ratings.
(c) Liquidity risk
Liquidity risk is the risk that the Group will not be able to meet its financial obligations as they fall due. The Group’s approach to managing liquidity is to ensure, as far as possible, that it will always have sufficient liquidity to meet its liabilities when due, under both normal and stressed conditions, without incurring unacceptable losses or risking damage to the Group’s reputation. This is monitored through rolling cash flow forecasts. The Group maintains sufficient cash to safeguard liquidity risk.
The following are contractual maturities of trade and other payables (excluding provisions):
Carrying amount
in thousands of AUD 31 December 2013 30 June 2013
Less than 1 year 8,681 3,061
1 – 5 years (i) 40,000 40,000
48,681 43,061
(i) This profile assumes that gas is not delivered to Alcoa of Australia Limited under the GSA (Note 23(i)).For
per
sona
l use
onl
y
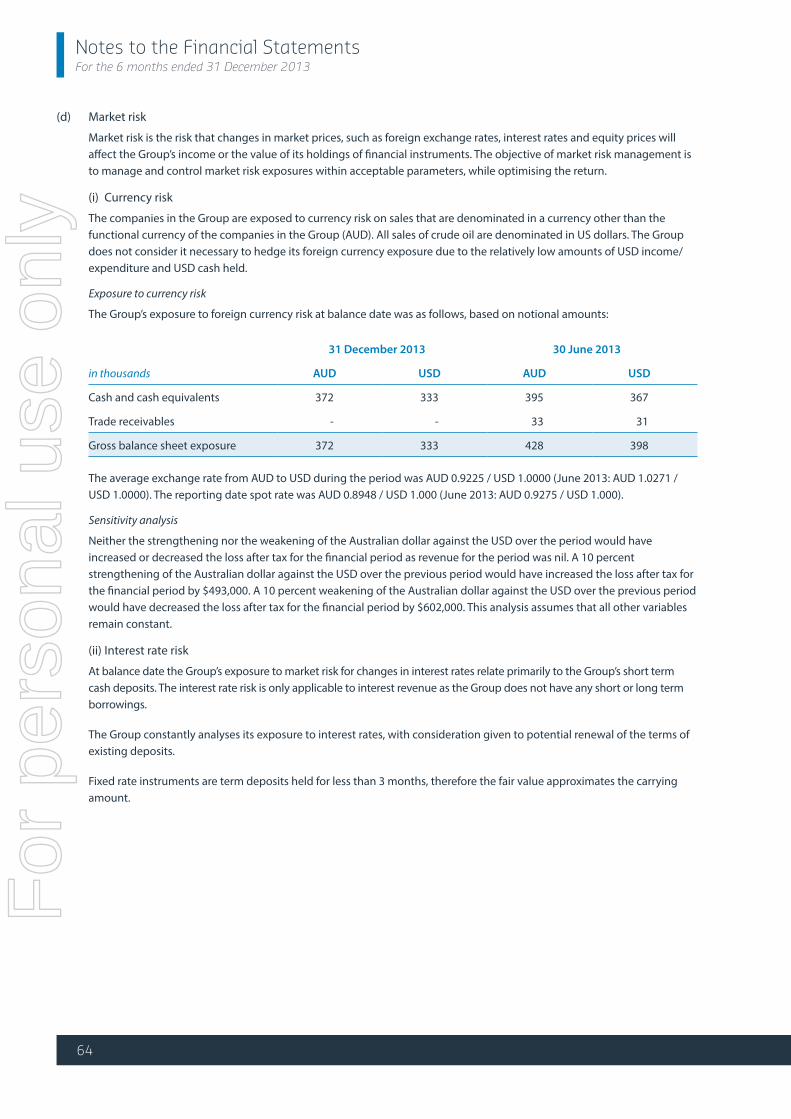
Notes to the Financial StatementsFor the 6 months ended 31 December 2013
64
(d) Market risk
Market risk is the risk that changes in market prices, such as foreign exchange rates, interest rates and equity prices will affect the Group’s income or the value of its holdings of financial instruments. The objective of market risk management is to manage and control market risk exposures within acceptable parameters, while optimising the return.
(i) Currency risk
The companies in the Group are exposed to currency risk on sales that are denominated in a currency other than the functional currency of the companies in the Group (AUD). All sales of crude oil are denominated in US dollars. The Group does not consider it necessary to hedge its foreign currency exposure due to the relatively low amounts of USD income/expenditure and USD cash held.
Exposure to currency risk
The Group’s exposure to foreign currency risk at balance date was as follows, based on notional amounts:
in thousands
31 December 2013 30 June 2013
AUD USD AUD USD
Cash and cash equivalents 372 333 395 367
Trade receivables - - 33 31
Gross balance sheet exposure 372 333 428 398
The average exchange rate from AUD to USD during the period was AUD 0.9225 / USD 1.0000 (June 2013: AUD 1.0271 / USD 1.0000). The reporting date spot rate was AUD 0.8948 / USD 1.000 (June 2013: AUD 0.9275 / USD 1.000).
Sensitivity analysis
Neither the strengthening nor the weakening of the Australian dollar against the USD over the period would have increased or decreased the loss after tax for the financial period as revenue for the period was nil. A 10 percent strengthening of the Australian dollar against the USD over the previous period would have increased the loss after tax for the financial period by $493,000. A 10 percent weakening of the Australian dollar against the USD over the previous period would have decreased the loss after tax for the financial period by $602,000. This analysis assumes that all other variables remain constant.
(ii) Interest rate risk
At balance date the Group’s exposure to market risk for changes in interest rates relate primarily to the Group’s short term cash deposits. The interest rate risk is only applicable to interest revenue as the Group does not have any short or long term borrowings.
The Group constantly analyses its exposure to interest rates, with consideration given to potential renewal of the terms of existing deposits.
Fixed rate instruments are term deposits held for less than 3 months, therefore the fair value approximates the carrying amount.
For
per
sona
l use
onl
y

Notes to the Financial StatementsFor the 6 months ended 31 December 2013
65
At the reporting date the Group’s interest-bearing financial instruments were as follows:
Carrying amount Carrying amount
in thousands of AUD 31 December 2013 30 June 2013
Fixed rate instruments
Cash and cash equivalents 49,840 16,176
Long-term cash held in escrow 25,861 25,229
Total variable interest bearing financial assets 75,701 41,405
Fair value sensitivity analysis for fixed rate instruments
The Group does not account for any fixed rate financial assets and liabilities at fair value through profit or loss. Therefore a change in interest rates at the reporting date would not affect profit or loss.
Carrying amount Carrying amount
in thousands of AUD 31 December 2013 30 June 2013
Variable rate instruments
Cash and cash equivalents 10,412 29,261
Total variable interests bearing financial assets 10,412 29,261
The cash held in the general operating account (note 20a) receives interest at the Reserve Bank Target Cash rate less 0.50%. A 100 basis point movement in variable interest rates across the period would have increased or decreased the loss after tax for the financial period by $50,000 (2013: $290,000). This analysis assumes that all other variables remain constant.
(iii) Other market price risk
Equity price risk arises from available-for-sale equity securities held in other listed exploration companies. The Group monitors its available for sale equity instruments on a regular basis including regular monitoring of ASX listed prices and ASX releases. The Group does not enter into commodity derivative contracts.
Sensitivity analysis – equity price risk
The Group’s equity investments are listed on the Australian Securities Exchange. For such investments classified as available for sale, a 10 percent increase in the value of the shares at the current and comparative reporting dates would have decreased the Group’s other comprehensive income of $216,700; an equal change in the opposite direction would have increased the Group’s other comprehensive income for the period by $216,700.
(e) Capital management
The Group’s objective when managing capital is to safeguard its ability to continue as a going concern, so as to maintain future exploration and development of its projects. Capital consists of share capital of the Group. In order to maintain or adjust its capital structure, Buru may in the future return capital to shareholders, issue new shares, borrow funds from financiers or sell assets. Buru’s focus has been to maintain sufficient funds to fund exploration and evaluation activities. There are no external borrowings as at 31 December 2013. There were no changes in the Group’s approach to capital management during the period. None of the Group’s entities are subject to externally imposed capital requirements.
(f ) Fair value vs carrying amounts
The carrying value of financial assets and liabilities in the statement of financial position are materially equal to their fair values.F
or p
erso
nal u
se o
nly

Notes to the Financial StatementsFor the 6 months ended 31 December 2013
66
8. Revenue
in thousands of AUD6 months ended
31 December 201312 months ended
30 June 2013
Sales of crude oil - 5,420
- 5,420
9. Other Income
in thousands of AUD6 months ended
31 December 201312 months ended
30 June 2013
Equipment rental 31 731
Fuel tax credits 45 624
Other revenue 43 790
119 2,145
10. Administrative Expenditure
in thousands of AUD6 months ended 31
December 201312 months ended 30
June 2013
Wages and salaries 3,816 5,760
Non-executive Directors’ fees 195 310
Superannuation 342 523
Contract employment services 524 559
Other associated personnel expenses 434 1,373
Office and other administration expenses 1,723 4,747
7,034 13,272
The above expense excludes share based payments disclosed at note 25.
11. Finance Income and Expenses
in thousands of AUD6 months ended 31
December 201312 months ended 30
June 2013
Interest income on bank deposits 1,632 2,628
Net foreign exchange gain / (loss) (5) (41)
Net finance income recognised in profit or loss 1,627 2,587
For
per
sona
l use
onl
y

Notes to the Financial StatementsFor the 6 months ended 31 December 2013
67
12. Income Tax Expense
in thousands of AUD
6 months ended 31
December 2013
12 months ended 30 June
2013 (Restated)
Current income tax
Current income tax charge - -
Adjustments in respect of previous current income tax 84 852
84 852
Deferred income tax
Deferred tax recognised on movement in financial asset revaluation reserve - 2,276
Benefit relating to origination and reversal of temporary differences (84) (852)
- (2,276)
Total income tax expense /(benefit) reported in the income statement - (2,276)
Numerical reconciliation between tax expense and pre-tax accounting profit
Accounting loss before tax (14,981) (21,311)
Income tax benefit using the domestic corporation tax rate of 30% 4,494 6,393
Increase in income tax due to:
- Non-deductible expenses (251) (630)
- Non-assessable income - -
- Deferred tax recognised on movement in financial asset revaluation reserve - (2,276)
- Temporary differences and tax losses not brought to account as a DTA (4,243) (5,763)
Income tax benefit / (expense) on pre-tax loss - (2,276)
Tax recognised directly in equity
6 months ended 31 December 2013 12 months ended 30 June 2013
in thousands of AUD Before TaxTax (Expense)
Benefit Net of tax Before TaxTax (Expense)
Benefit Net of tax
Financial Assets - - - 7,585 (2,276) 5,309
Tax consolidation
The company and its 100% owned entities have formed a tax consolidated group. Members of the consolidated entity have entered into a tax sharing arrangement in order to allocate income tax expense to the wholly owned controlled entities on a pro-rata basis. The agreement provides for the allocation of income tax liabilities between the entities should the head entity default on its tax payment obligations. At balance date, the possibility of default is remote.F
or p
erso
nal u
se o
nly

Notes to the Financial StatementsFor the 6 months ended 31 December 2013
68
Tax affect accounting by members of the Consolidated Group
Members of the tax consolidated group have entered into a tax funding agreement. The tax funding agreement provides for the allocation of current taxes to members of the tax consolidated group. Deferred taxes are allocated to members of the tax consolidated group in accordance with a group allocation approach which is consistent with the principles of AASB 112 Income Taxes. The allocation of taxes under the tax funding agreement are recognised as an increase/decrease in the controlled entities intercompany accounts with the tax consolidated group head entity, Buru. In this regard, Buru has assumed the benefit of tax losses from the member entities. The nature of the tax funding agreement is such that no tax consolidation contributions by or distributions to equity participants are required.
13. Property, Plant and Equipment
in thousands of AUDPlant and
equipmentOffice
equipmentFixtures
and fittings
Heritage and cultural
assetsIntangible
Assets Total
Cost or deemed cost
Carrying amount at 1 July 2012 4,969 722 254 868 - 6,813
Additions 585 413 1,347 - 858 3,203
Impairment (773) - - - - (773)
Transfers (31) (29) 60 - - -
Balance at 30 June 2013 4,750 1,106 1,661 868 858 9,243
Carrying amount at 1 July 2013 4,750 1,106 1,661 868 858 9,243
Additions 179 188 120 9 5 501
Disposals (4) - - - - (4)
Transfers - - - - - -
Balance at 31 December 2013 4,925 1,294 1,781 877 863 9,740
Depreciation
Carrying amount 1 July 2012 (118) (356) (29) - - (503)
Depreciation for the period (387) (154) (121) - (57) (719)
Transfers 3 12 (15) - - -
Balance at 30 June 2013 (502) (498) (165) - (57) (1,222)
Carrying amount 1 July 2013 (502) (498) (165) - (57) (1,222)
Depreciation for the period (192) (122) (146) - (87) (547)
Disposal 3 - - - - 3
Balance at 31 December 2013 (691) (620) (311) - (144) (1,766)
Carrying amounts
At 30 June 2012 4,851 366 225 868 - 6,310
At 30 June 2013 4,248 608 1,496 868 801 8,021
At 31 December 2013 4,234 674 1,470 877 719 7,974For
per
sona
l use
onl
y

Notes to the Financial StatementsFor the 6 months ended 31 December 2013
69
14. Exploration and Evaluation Expenditure
in thousands of AUD 31 December 201330 June 2013
(Restated)
Carrying amount at beginning of the period (Restated) 63,828 30,383
Exploration expenditure capitalised 4,345 22,102
Exploration assets acquired - 14,941
Research and development tax concession (3,555) (3,598)
Carrying amount at the end of the period 64,618 63,828
During the six months to 31 December 2013, the Company resolved to change the accounting policy relating to exploration and evaluation expenditure with retrospective application. Exploration and evaluation expenditure in respect of each area of interest is now accounted for using the Successful Efforts method. Refer to Notes 3(d) and 5 for more details.
15. Oil and Gas Assets
in thousands of AUD
Assets in Development 31 December 2013 30 June 2013
Carrying amount at beginning of the period 5,009 1,983
Expenditure incurred 6,913 3,940
Impairment of expenditure - (914)
Carrying amount at the end of the period 11,922 5,009
16. Investments
in thousands of AUD 31 December 2013 30 June 2013
Available-for-sale financial assets (i) 2,167 2,167
Other available-for-sale-financial assets - 29
Long-term cash held in escrow (ii) 25,861 25,229
Loan provided to suppliers 2,000 -
30,028 27,425
(i) Investments
The Group’s available-for-sale financial assets are categorised as Level 1 within the fair value hierarchy (refer note 4) and are measured at fair value based on quoted market prices at the reporting date, without any deduction for transaction costs. There were no transfers between levels during the period.
(ii) Buru and Alcoa of Australia Limited have agreed to escrow $20 million in cash and interest thereon in partial satisfaction of Buru’s potential obligations to repay $40 million to Alcoa of Australia Limited if Buru does not deliver gas (Note 23). The Group’s exposure to credit, currency and interest rate risks related to other investments is disclosed in note 7. During the period, Buru and Alcoa entered into an agreement for up to $20 million of the escrowed funds to be applied to fund the next phase of the appraisal program for the Laurel Wet Gas accumulation and will therefore be released from escrow when required for the appraisal program, subject to the terms of agreement. The remaining funds will be retained in the escrow account.
For
per
sona
l use
onl
y

Notes to the Financial StatementsFor the 6 months ended 31 December 2013
70
17. Tax Assets and LiabilitiesUnrecognised net deferred tax assets
Deferred tax assets have not been recognised in respect of the following items
in thousands of AUD 31 December 201330 June 2013
(Restated) Net Movement
Deferred tax assets
Accruals 106 8 98
Provisions 2,352 2,394 (42)
Business related costs 380 39 341
Unrealised foreign exchange loss - 3 (3)
Development expenditure 372 372 -
Tax losses 30,511 25,845 4,666
PRRT 36,197 25,513 10,684
69,918 54,174 15,744
Deferred tax liabilities
Exploration expenditure (14,903) (13,882) (1,021)
Property, plant and equipment (1,689) (801) (888)
Prepayments - (21) 21
Investments in listed entities (200) (199) (1)
(16,792) (14,903) (1,889)
Net deferred tax assets not brought to account 53,126 39,271 13,855
The deductible temporary differences and tax losses do not expire under current tax legislation. Deferred tax assets have not been recognised in respect of these items because it is not probable that future taxable profit will be available against which the Group can utilise the benefits.
18. Trade and Other Receivables
in thousands of AUD 31 December 2013 30 June 2013
Trade receivables 3 33
Interest receivable 187 294
Joint venture receivables 2,094 1,517
Prepayments 473 519
GST receivable 1,060 187
Research and development tax concession 3,555 -
Other receivables 22 38
7,394 2,588
The Group’s exposure to credit and currency risks and impairment losses related to trade and other receivables are disclosed in note 7.
For
per
sona
l use
onl
y
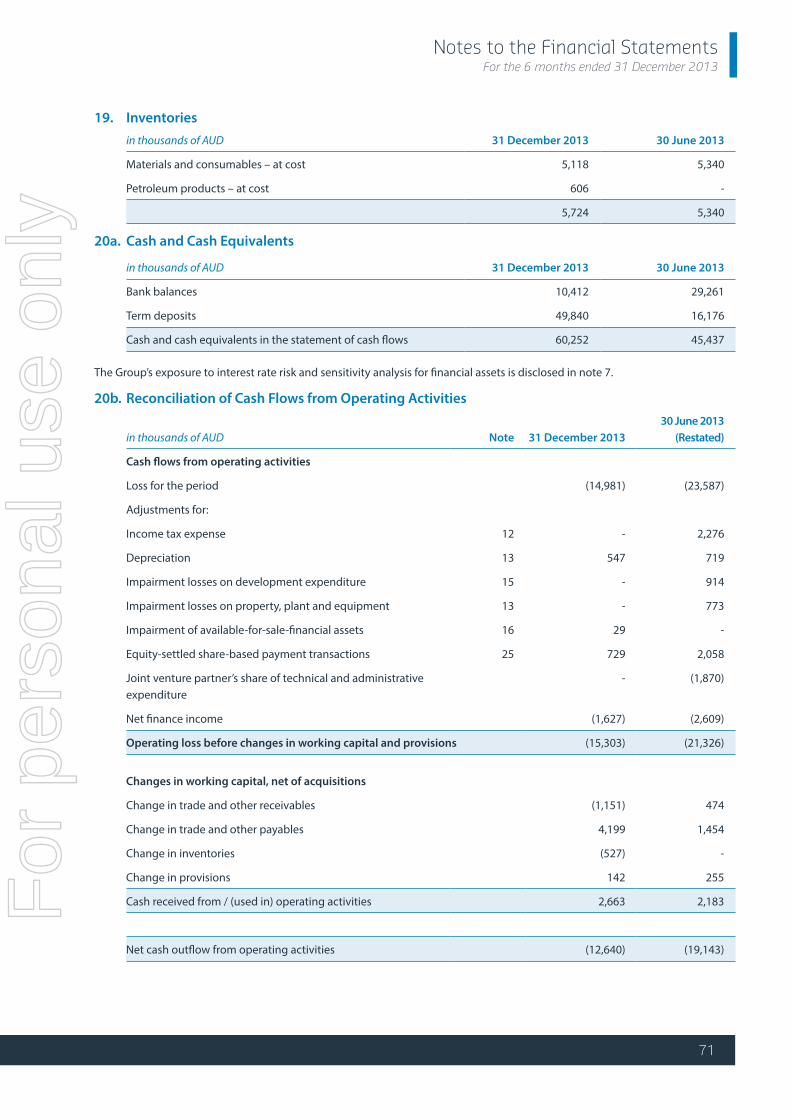
Notes to the Financial StatementsFor the 6 months ended 31 December 2013
71
19. Inventoriesin thousands of AUD 31 December 2013 30 June 2013
Materials and consumables – at cost 5,118 5,340
Petroleum products – at cost 606 -
5,724 5,340
20a. Cash and Cash Equivalents
in thousands of AUD 31 December 2013 30 June 2013
Bank balances 10,412 29,261
Term deposits 49,840 16,176
Cash and cash equivalents in the statement of cash flows 60,252 45,437
The Group’s exposure to interest rate risk and sensitivity analysis for financial assets is disclosed in note 7.
20b. Reconciliation of Cash Flows from Operating Activities
in thousands of AUD Note 31 December 201330 June 2013
(Restated)
Cash flows from operating activities
Loss for the period (14,981) (23,587)
Adjustments for:
Income tax expense 12 - 2,276
Depreciation 13 547 719
Impairment losses on development expenditure 15 - 914
Impairment losses on property, plant and equipment 13 - 773
Impairment of available-for-sale-financial assets 16 29 -
Equity-settled share-based payment transactions 25 729 2,058
Joint venture partner’s share of technical and administrative expenditure
- (1,870)
Net finance income (1,627) (2,609)
Operating loss before changes in working capital and provisions (15,303) (21,326)
Changes in working capital, net of acquisitions
Change in trade and other receivables (1,151) 474
Change in trade and other payables 4,199 1,454
Change in inventories (527) -
Change in provisions 142 255
Cash received from / (used in) operating activities 2,663 2,183
Net cash outflow from operating activities (12,640) (19,143)
For
per
sona
l use
onl
y
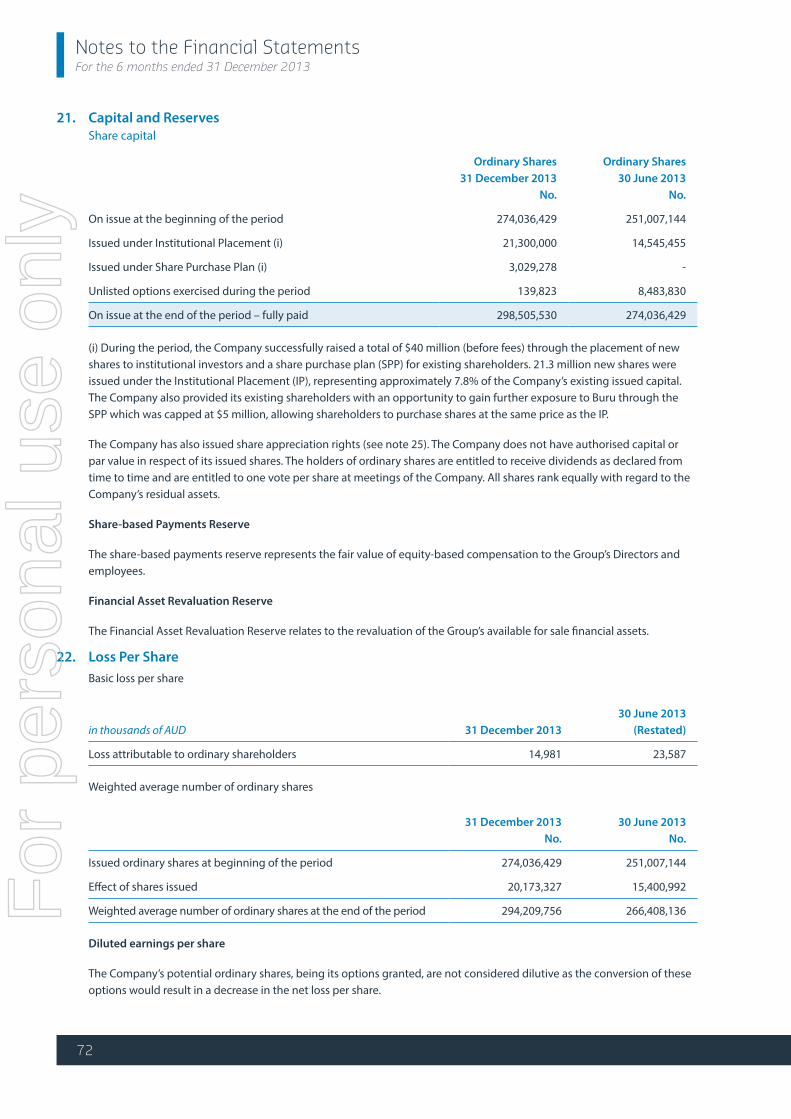
Notes to the Financial StatementsFor the 6 months ended 31 December 2013
72
21. Capital and Reserves Share capital
Ordinary Shares 31 December 2013
No.
Ordinary Shares 30 June 2013
No.
On issue at the beginning of the period 274,036,429 251,007,144
Issued under Institutional Placement (i) 21,300,000 14,545,455
Issued under Share Purchase Plan (i) 3,029,278 -
Unlisted options exercised during the period 139,823 8,483,830
On issue at the end of the period – fully paid 298,505,530 274,036,429
(i) During the period, the Company successfully raised a total of $40 million (before fees) through the placement of new shares to institutional investors and a share purchase plan (SPP) for existing shareholders. 21.3 million new shares were issued under the Institutional Placement (IP), representing approximately 7.8% of the Company’s existing issued capital. The Company also provided its existing shareholders with an opportunity to gain further exposure to Buru through the SPP which was capped at $5 million, allowing shareholders to purchase shares at the same price as the IP.
The Company has also issued share appreciation rights (see note 25). The Company does not have authorised capital or par value in respect of its issued shares. The holders of ordinary shares are entitled to receive dividends as declared from time to time and are entitled to one vote per share at meetings of the Company. All shares rank equally with regard to the Company’s residual assets.
Share-based Payments Reserve
The share-based payments reserve represents the fair value of equity-based compensation to the Group’s Directors and employees.
Financial Asset Revaluation Reserve
The Financial Asset Revaluation Reserve relates to the revaluation of the Group’s available for sale financial assets.
22. Loss Per ShareBasic loss per share
in thousands of AUD 31 December 201330 June 2013
(Restated)
Loss attributable to ordinary shareholders 14,981 23,587
Weighted average number of ordinary shares
31 December 2013 No.
30 June 2013 No.
Issued ordinary shares at beginning of the period 274,036,429 251,007,144
Effect of shares issued 20,173,327 15,400,992
Weighted average number of ordinary shares at the end of the period 294,209,756 266,408,136
Diluted earnings per share
The Company’s potential ordinary shares, being its options granted, are not considered dilutive as the conversion of these options would result in a decrease in the net loss per share.
For
per
sona
l use
onl
y
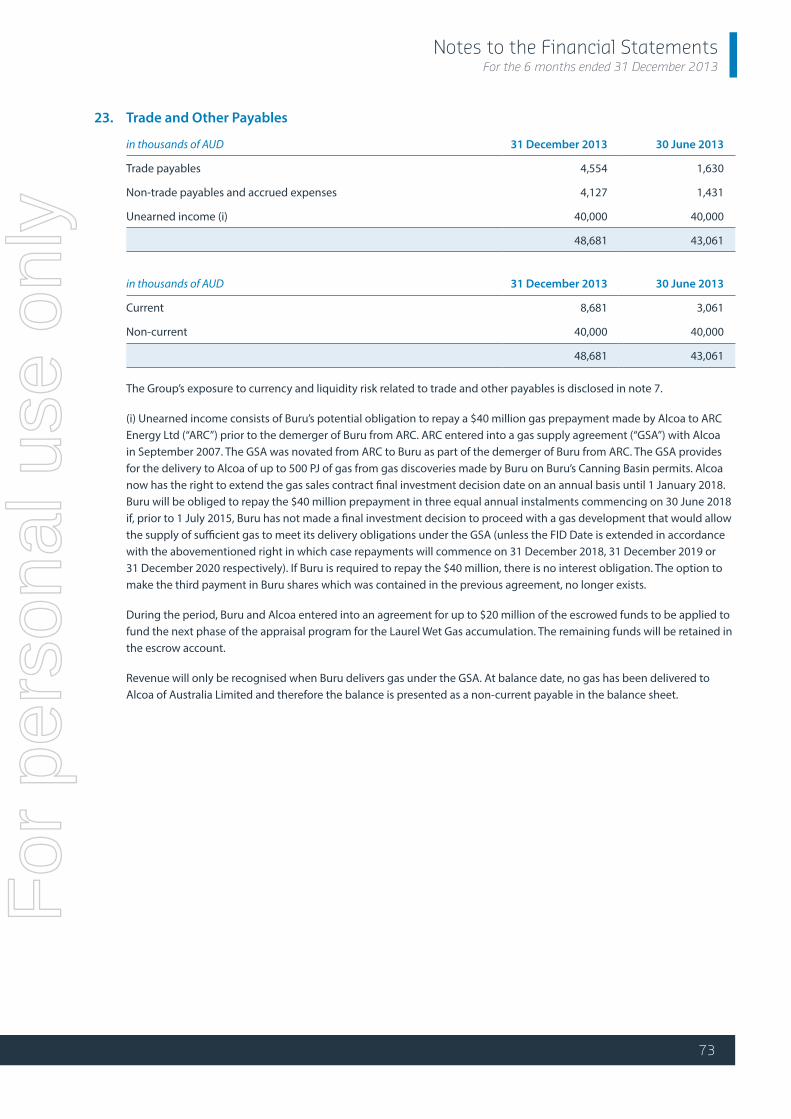
Notes to the Financial StatementsFor the 6 months ended 31 December 2013
73
23. Trade and Other Payables
in thousands of AUD 31 December 2013 30 June 2013
Trade payables 4,554 1,630
Non-trade payables and accrued expenses 4,127 1,431
Unearned income (i) 40,000 40,000
48,681 43,061
in thousands of AUD 31 December 2013 30 June 2013
Current 8,681 3,061
Non-current 40,000 40,000
48,681 43,061
The Group’s exposure to currency and liquidity risk related to trade and other payables is disclosed in note 7.
(i) Unearned income consists of Buru’s potential obligation to repay a $40 million gas prepayment made by Alcoa to ARC Energy Ltd (“ARC”) prior to the demerger of Buru from ARC. ARC entered into a gas supply agreement (“GSA”) with Alcoa in September 2007. The GSA was novated from ARC to Buru as part of the demerger of Buru from ARC. The GSA provides for the delivery to Alcoa of up to 500 PJ of gas from gas discoveries made by Buru on Buru’s Canning Basin permits. Alcoa now has the right to extend the gas sales contract final investment decision date on an annual basis until 1 January 2018. Buru will be obliged to repay the $40 million prepayment in three equal annual instalments commencing on 30 June 2018 if, prior to 1 July 2015, Buru has not made a final investment decision to proceed with a gas development that would allow the supply of sufficient gas to meet its delivery obligations under the GSA (unless the FID Date is extended in accordance with the abovementioned right in which case repayments will commence on 31 December 2018, 31 December 2019 or 31 December 2020 respectively). If Buru is required to repay the $40 million, there is no interest obligation. The option to make the third payment in Buru shares which was contained in the previous agreement, no longer exists.
During the period, Buru and Alcoa entered into an agreement for up to $20 million of the escrowed funds to be applied to fund the next phase of the appraisal program for the Laurel Wet Gas accumulation. The remaining funds will be retained in the escrow account.
Revenue will only be recognised when Buru delivers gas under the GSA. At balance date, no gas has been delivered to Alcoa of Australia Limited and therefore the balance is presented as a non-current payable in the balance sheet.
For
per
sona
l use
onl
y

Notes to the Financial StatementsFor the 6 months ended 31 December 2013
74
24. Provisions
in thousands of AUD 31 December 2013 30 June 2013
Current
Provision for annual leave 560 504
Provision for site restoration (i) 714 714
1,274 1,218
Non-Current
Provision for long-service leave 100 98
Provision for site restoration (i) 6,465 6,465
6,565 6,563
(i) Site restoration provision
in thousands of AUD 31 December 2013 30 June 2013
Opening balance 7,179 5,095
Provisions made during the period - 2,084
Balance at the end of the period 7,179 7,179
The site restoration provision is in respect of the Group’s obligation to rectify environmental liabilities relating to exploration and production in the Canning Basin in accordance with the requirements of the DER and the DMP. The provision is derived from an external independent review of the liabilities by Parsons Brinckerhoff which was undertaken in June 2013. Due to the long-term nature of the liability, there is significant uncertainty in estimating the costs that will be incurred at a future date. The rehabilitation is expected to occur progressively.
25. Share-based Payments
Fair value expensed in thousands of AUD6 months ended
31 December 201312 months ended
30 June 2013
Share Appreciation Rights 729 482
Employee Share Option Plan - 1,576
729 2,058
The fair value of share based payment arrangements are measured using the Black & Scholes valuation model. Measurement inputs include share price on a measurement date, exercise price of the instrument, expected volatility (based on weighted average historic volatility adjusted for changes expected due to publicly available information) weighted average expected life of the instruments (based on historical experience and general option holder behaviour), expected dividends, and the risk-free interest rate (based on government bonds). Service and non-market performance conditions attached to the transactions are not taken into account in determining fair value.
Share Appreciation Rights (SARs)
During the financial year the Group issued SARs to certain employees. Each SAR represents a right to an award equivalent to the positive difference between the notional share price set at the date of grant and the share price at the date of exercise, subject to satisfaction of any vesting conditions and exercise conditions. At the Board’s discretion, the award may be settled in ordinary shares of an equivalent value or as a cash payment. It is the Board’s intention to preserve cash and settle the award in ordinary shares. The SARs lapse at the earlier of the expiry date and the date of cessation of employment.
For
per
sona
l use
onl
y

Notes to the Financial StatementsFor the 6 months ended 31 December 2013
75
The fair value of all share appreciation rights granted during the year was measured using the Black & Scholes model. Expected volatility is estimated by considering historic average share price volatility. The inputs used in the measurement of the fair values at grant date of the equity settled share based payment plans were as follows:
Six months ended 31 December 2013
Number SARs
granted
Share Price at
Grant DateExercise
Price VolatilityExpected
Dividends
Risk free interest
rateVesting
DateExpiry
Date Fair Value
500,000 $1.48 $1.38 49% Nil 2.6% 13 Dec 13 24 Jun 14 $0.27
500,000 $1.48 $1.38 51% Nil 3.0% 24 Jun 14 24 Jun 15 $0.43
1,000,000 $1.57* $3.79 61% Nil 3.2% 1 Feb 15 30 Jun 16 $0.25*
1,500,000 $1.57* $5.06 61% Nil 3.2% 1 Feb 16 30 Jun 16 $0.17*
3,500,000
Year ended 30 June 2013
Number SARs
granted
Share Price at
Grant DateExercise
Price VolatilityExpected
Dividends
Risk free interest
rateVesting
DateExpiry
Date Fair Value
200,000 $2.83 $4.00 64% Nil 2.8% 31 Dec 13 30 Jun 16 $1.10
250,000 $2.83 $4.25 64% Nil 2.8% 31 Dec 14 30 Jun 16 $1.05
300,000 $2.83 $4.50 64% Nil 2.8% 31 Dec 15 30 Jun 16 $1.01
200,000 $2.31 $4.00 63% Nil 2.8% 31 Dec 13 30 Jun 16 $0.75
250,000 $2.31 $4.25 63% Nil 2.6% 31 Dec 14 30 Jun 16 $0.71
300,000 $2.31 $4.50 63% Nil 2.6% 31 Dec 15 30 Jun 16 $0.68
1,500,000
* The SARs issued to Dr K Wulff were initially issued on 14 January 2013 on his commencement as Managing Director, however, they were subject to shareholder approval which was received at the Company’s Annual General Meeting in November 2013. The SARs were therefore provisionally valued using the Company’s share price on 30 June 2013 and have now been revalued at the grant date, being the AGM date, in accordance with AASB 2. Further details on the unlisted options and SARs are included in the Remuneration Report on pages 33 to 39.
For
per
sona
l use
onl
y

Notes to the Financial StatementsFor the 6 months ended 31 December 2013
76
Employee Share Option Plan (ESOP)
At the 2012 Annual General Meeting, shareholders reapproved the Company’s ESOP for a further three years. Options issued in previous reporting periods were issued for no consideration and vested immediately. No options were issued during the current reporting period.
The following shares have been issued on the conversion of Director and Employee options during the financial year:
Number of options converted toordinary shares Average Exercise Price Date of conversion
Closing share price on date of conversion
26,937* $1.24 17 Dec 13 $1.41
82,714* $1.24 24 Dec 13 $1.64
30,172* $1.24 30 Dec 13 $1.75
139,823
* 139,823 shares were issued following the conversion of 947,000 unlisted options via the “cashless exercise” mechanism as approved at the Company’s 2012 AGM. On exercise of the options the Company issued the number of shares equal in value to the difference between the market value of the shares and the exercise price otherwise payable in relation to the options.
The number and weighted average exercise prices of share options are as follows:
Weighted averageexercise price ($)
Number ofoptions
Outstanding unlisted options as at 1 Jul 2012 0.97 13,730,000
Exercised 27 Jul 2012 1.24 (25,000)
Exercised 10 Oct 2012 0.75 (78,000)
Exercised 16 Oct 2012 0.56 (582,000)
Exercised 23 Oct 2012 0.48 (60,000)
Granted 1 Nov 2012 4.04 1,497,000
Exercised 26 Nov 2012 1.24 (15,000)
Granted 26 Nov 2012 4.04 38,800
Granted 4 Dec 2012 4.13 180,000
Exercised 14 Dec 2012 0.94 (11,398,000)
Exercised 22 Jan 2013 1.86 (320,000)
Exercised 20 Mar 2013 1.31 (250,000)
Forfeited during the period ended 30 Jun 2013 3.43 (251,000)
Outstanding as at 30 June 2013 2.97 2,466,800
Outstanding unlisted options as at 1 Jul 2013 2.97 2,466,800
Exercised 17 Dec 2013 1.24 (207,000)
Exercised 24 Dec 2013 1.24 (575,000)
Exercised 30 Dec 2013 1.24 (165,000)
Forfeited during the period ended 31 December 2013 4.13 (180,000)
Outstanding and exercisable as at 31 December 2013 4.04 1,339,800
The unlisted share options outstanding as at 31 December 2013 have an exercise price of $4.04 (June 2013: $1.24 to $4.13), and a weighted average contractual life of 1 year (June 2013: 2.2 years). All options outstanding fully vested in previous reporting periods.
For
per
sona
l use
onl
y

Notes to the Financial StatementsFor the 6 months ended 31 December 2013
77
26. Group Entities
Parent entityCountry of
incorporation 31 December 2013 30 June 2013
Buru Energy Limited (i) Australia
Subsidiaries Ownership Interest Ownership Interest
Terratek Drilling Tools Pty Limited Australia 100% 100%
Royalty Holding Company Pty Limited Australia 100% 100%
Buru Energy (Acacia) Pty Limited Australia 100% 100%
Buru Operations Pty Limited Australia 100% 100%
Yakka Munga Pastoral Company Pty Limited Australia 100% 100%
Buru Fitzroy Pty Limited Australia 100% 100%
(i) Buru Energy Limited is the head entity of the tax consolidated group. All subsidiaries are members of the tax consolidated group.
27. Parent Entity DisclosuresAs at, and throughout the 6 months ended 31 December 2013 the parent company of the Group was Buru Energy Limited.
in thousands of AUDCompany
31 December 2013
Company30 June 2013
(Restated)
Result of the parent entity
Loss for the period (12,648) (22,794)
Other comprehensive income / (expense) - (5,309)
Total comprehensive loss for the period (12,648) (28,103)
Financial position of the parent entity at year end
Current assets 77,806 57,349
Total assets 192,293 160,138
Current liabilities 9,952 3,565
Total liabilities 56,517 50,842
Total equity of the parent entity at year end
Share capital 228,149 189,311
Reserves 3,761 3,471
Retained earnings (96,134) (83,486)
Total equity 135,776 109,296
For
per
sona
l use
onl
y

Notes to the Financial StatementsFor the 6 months ended 31 December 2013
78
28. Joint OperationsThe consolidated entity has an interest in the following joint operations as at 31 December 2013 whose principal activities were oil and gas exploration and development.
Permit/Joint OperationDecember 2013
Beneficial InterestJune 2013
Beneficial Interest Operator Country
EP371 50.00% 50.00% Buru Energy Ltd Australia
EP390 ** 50.00% 50.00% Buru Energy Ltd Australia
EP391 50.00% 50.00% Buru Energy Ltd Australia
EP428 50.00% 50.00% Buru Energy Ltd Australia
EP431 50.00% 50.00% Buru Energy Ltd Australia
EP436 50.00% 50.00% Buru Energy Ltd Australia
EP438 ** *** 37.50% 37.50% Buru Energy Ltd Australia
EP457 37.50% 37.50% Buru Fitzroy Pty Ltd Australia
EP458 37.50% 37.50% Buru Fitzroy Pty Ltd Australia
EP471 ** 50.00% 50.00% Buru Energy Ltd Australia
EP472 ** 50.00% 50.00% Buru Energy (Acacia) Pty Ltd Australia
EP473 ** 50.00% 50.00% Buru Energy Ltd Australia
EP476 ** 50.00% 50.00% Buru Energy Ltd Australia
EP477 ** 50.00% 50.00% Buru Energy (Acacia) Pty Ltd Australia
EP478 * ** 50.00% 50.00% Buru Energy (Acacia) Pty Ltd Australia
* Subject to Trident Energy farm-in right to earn a 17.5% interest. Upon satisfaction or expiration of this right, Buru must transfer half of its remaining interest to Mitsubishi.
** Apache farm in
During the period Buru entered into agreements with Mitsubishi Corporation (“MC”) and Apache Energy Limited (“Apache”) pursuant to which an Apache subsidiary will farm-in to a number of the Buru-MC exploration permits in the Canning Basin. The permits principally cover the Goldwyer Shale areas of the Buru-MC portfolio, and are prospective for shale oil and gas as well as for conventional sandstone reservoirs, particularly in the southern areas. Under the agreements, subject to satisfaction of certain conditions:
Apache will earn a 50% interest in exploration permits 390, 471 and 473 and up to a 50% interest in exploration permit 438 (“Coastal Permits”) by agreeing to fund a A$25 million exploration program to be conducted on the Coastal Permits during 2014.
Apache will be granted an option to earn a 40% interest in exploration permits 472, 476 and 477, up to a 40% interest in exploration permit 478 and up to a 50% interest in exploration permit 474 (“Acacia Permits”).
Apache will pay Buru and MC a non-refundable option fee equal to the greater of (a) $7.2 million and (b) 80% of the costs of the 20,000 sq km aerogravity survey conducted by Buru and MC over the Acacia Permits (excluding exploration permit 474) and a 650km seismic survey planned to be conducted by Buru and MC on the Acacia Permits (excluding exploration permit 474) in 2014.
If Apache exercises the option at the conclusion of the 2014 seismic program to acquire interests in the Acacia Permits, it will fund 80% of the costs of the first two exploration wells to be drilled in the Acacia Permits and, in the event of success in either or both of those wells, 80% of the first two appraisal wells. Apache will also reimburse Buru for the costs of the recently completed 5,000 sq km aerogravity survey and 400km seismic survey planned to be conducted by Buru on exploration permit 474 in 2014.
For
per
sona
l use
onl
y

Notes to the Financial StatementsFor the 6 months ended 31 December 2013
79
Buru will remain as the operator of the Coastal Permits and Acacia Permits but under the terms of the agreements, Apache will, subject to completion of the relevant work programs, have the right to assume operatorship following a transition period. In the event that Apache elects to assume operatorship, Buru will continue to be heavily involved in the community affairs and engagement programs.
*** Additional interest acquired in EP438
During the period Buru entered into an agreement with Gulliver Productions Pty Ltd (Gulliver), a wholly owned subsidiary of Key Petroleum Limited and Indigo Oil Pty Ltd (Indigo). The agreement resulted in Buru acquiring an additional 25% interest in exploration permit EP 438, which will increase Buru’s interest in the permit to 62.5%; and Buru transferring its interests in L15 and R1 to Gulliver and Indigo.
This transaction was completed subsequent to the end of the period. Buru and Mitsubishi Corporation intend to transfer a 50% interest in EP 438 to a wholly owned subsidiary of Apache Energy Limited as part of the transaction described above. The holdings in the permit at the completion of this transfer to Apache will be:
• Buru Energy: 25%• Mitsubishi Corporation: 25%• Apache Energy: 50%
Buru previously held a 15.5% interest in L15 and a 43.28% interest in R1. The transfer of these permits forms part of Buru’s ongoing acreage
rationalisation program.
The Group’s interests in assets/liabilities and income/expenditure employed in the above joint operations are detailed below. The amounts are included in the financial statements under their respective asset categories.
in thousands of AUD 31 December 201330 June 2013
(Restated)
Income 1 165
Expenditure (4,690) (15,152)
(4,689) (14,987)
Current assets
Cash and cash equivalents 113 113
Trade and other receivables 867 120
Inventory 490 489
Total current assets 1,470 722
Non-current assets
Exploration expenditure 44,288 56,261
Development expenditure 11,708 4,963
Total non-current assets 55,996 61,224
Current Liabilities
Trade and other payables 6,742 1,237
Total current Liabilities 6,742 1,237
Share of net assets of joint venture operations 50,724 60,709
For
per
sona
l use
onl
y

Notes to the Financial StatementsFor the 6 months ended 31 December 2013
80
29. Operating LeasesLeases as lessee
Non-cancellable operating lease rentals are payable as follows:
in thousands of AUD 31 December 2013 30 June 2013
Less than one year 1,229 1,203
Between one and five years 3,382 3,803
More than five years - -
4,611 5,006
The Group leases a corporate office in Perth and an office/warehouse facility in Broome. The leases expire in October 2017 and November 2015 respectively. Both have options to renew the lease after the expiry dates.
The Group also maintains operating leases for production vehicles and accommodation for employees required to travel for work purposes.
The total operating lease amount recognised as an expense during the period was $691,000 (year ended 30 June 2013: $605,000).
30. Capital and Other Commitments
in thousands of AUD 31 December 2013 30 June 2013
Exploration expenditure commitments
Contracted but not yet provided for and payable:
Within one year 26,150 34,039
One year later and no later than five years 24,075 21,658
Later than five years - -
50,225 55,697
The commitments are required in order to maintain the petroleum exploration permits in which the Group has interests in good standing with the Department of Mines & Petroleum (“DMP”). These obligations may be varied from time to time, subject to approval by the DMP. Included in the above are the commitments during the term of the State Agreement, under which Buru and Mitsubishi have committed to the continued exploration, appraisal and, if technically viable, development of the gas resources of the permits with the objective of delivering gas into the Western Australian domestic gas market.
The above commitments also include the expenditure to purchase a 50% interest in the permit to be issued in respect of application area 5/07-8 (Derby Block), from Backreef Oil Limited, for a total cash consideration of $3.5 million, payable upon grant of the permit.
31. ContingenciesThere were no material contingent liabilities or contingent assets for the Group as at 31 December 2013.
For
per
sona
l use
onl
y

Notes to the Financial StatementsFor the 6 months ended 31 December 2013
81
32. Related Parties Key management personnel compensation
The key management personnel compensation comprised:
in AUD6 months ended
31 December 201312 months ended
30 June 2013
Short-term employee benefits 1,835,703 3,429,122
Post-employment benefits 138,678 246,482
Termination benefits 330,000 141,667
Share-based payments 328,746 1,222,039
2,633,127 5,039,310
Individual Directors and executives compensation disclosures
Information regarding individual Directors and executives compensation and some equity instruments disclosures as required by Corporations Regulations 2M.3.03 is provided in the remuneration report section of the Directors’ report on pages 33 to 39.
Apart from the details disclosed in this note, no Director has entered into a material contract with the Group since the end of the previous financial year and there were no material contracts involving directors’ interests existing at the end of the period.
Movements in shares
The movement during the reporting period in the number of ordinary shares in Buru held by each KMP is as follows:
KMP
Held at 1 July 2013 or on appointment as KMP
during the period
Received on exercise of
options Purchases Sales
Held at 31 December
2013
Mr G Riley 3,000,000 - - - 3,000,000
The Hon. P Jones AM 248,277 - - - 248,277
Mr A Miller (Resigned Feb 2014)
1,625,132 - - - 1,625,132
Mr E Streitberg 28,700,566 - - - 28,700,566
Mr T Streitberg (Resigned Jul 2013)
4,862,400 - - - 4,862,400*
Ms L West 50,000 15,824 - - 65,824
Total 38,486,375 15,824 - - 38,502,199
* Represents number of ordinary shares held on date of resignation.
KMP
Held at 1 July 2012 or on appointment as KMP
during the periodExercise of
options Purchases SalesHeld at 30 June 2013
Mr G Riley 3,000,000 - - - 3,000,000
The Hon. P Jones AM 248,277 - - - 248,277
Mr A Miller 1,625,132 - - - 1,625,132
Mr E Streitberg 23,401,066 5,299,500 - - 28,700,566
Mr T Streitberg 3,783,440 1,078,960 - - 4,862,400
Ms L West - 170,000 - (120,000) 50,000
Total 32,057,915 6,548,460 - (120,000) 38,486,375
For
per
sona
l use
onl
y

82
Notes to the Financial StatementsFor the 6 months ended 31 December 2013
Movements in options issued under the ESOP
The movement during the reporting period in the number of unlisted options over ordinary shares in Buru held by each KMP is as follows:
KMP
Held at 1 July 2013 or on appointment as KMP during
the period Exercised Granted Forfeited
Vested and Exercisable at 31 December
2013
Mr C Bath 530,000 - - - 530,000
Mr T Streitberg 180,000 - - (180,000) -
Ms L West 200,000 (110,000) - - 90,000
Total 910,000 (110,000) - (180,000) 620,000
KMP
Held at 1 July 2012 or on appointment as KMP during
the period Exercised Granted Forfeited
Vested and Exercisable at 30
June 2013
Mr E Streitberg 8,580,000 (8,580,000) - - -
Mr T Streitberg 1,446,000 (1,446,000) 180,000 - 180,000
Ms M Malaxos 320,000 (320,000) 180,000 (180,000) -
Mr C Bath - - 530,000 - 530,000
Ms L West 280,000 (170,000) 90,000 - 200,000
Total 10,626,000 (10,516,000) 980,000 (180,000) 910,000
Movements in share appreciation rights
The movement during the reporting period in the number of share appreciation rights in Buru held by each KMP is as follows:
KMP
Held at 1 July 2013 or on appointment as
KMP during the period Exercised Granted Forfeited
Held at 31 December
2013
Vested and Exercisable at 31 December
2013
Dr K Wulff 2,500,000 - - - 2,500,000 -
Mr B Williams 750,000 - - - 750,000 200,000
Total 3,250,000 - - - 3,250,000 200,000
KMP
Held at 1 July 2012 or on appointment as KMP
during the period Exercised Granted ForfeitedHeld at 30 June 2013
Vested and Exercisable at 30 June 2013
Dr K Wulff - - 2,500,000 - 2,500,000 -
Mr B Williams - - 750,000 - 750,000 -
Total - - 3,250,000 - 3,250,000 -
Other related party transactions
No other related party transaction has occurred during the reporting period.
For
per
sona
l use
onl
y
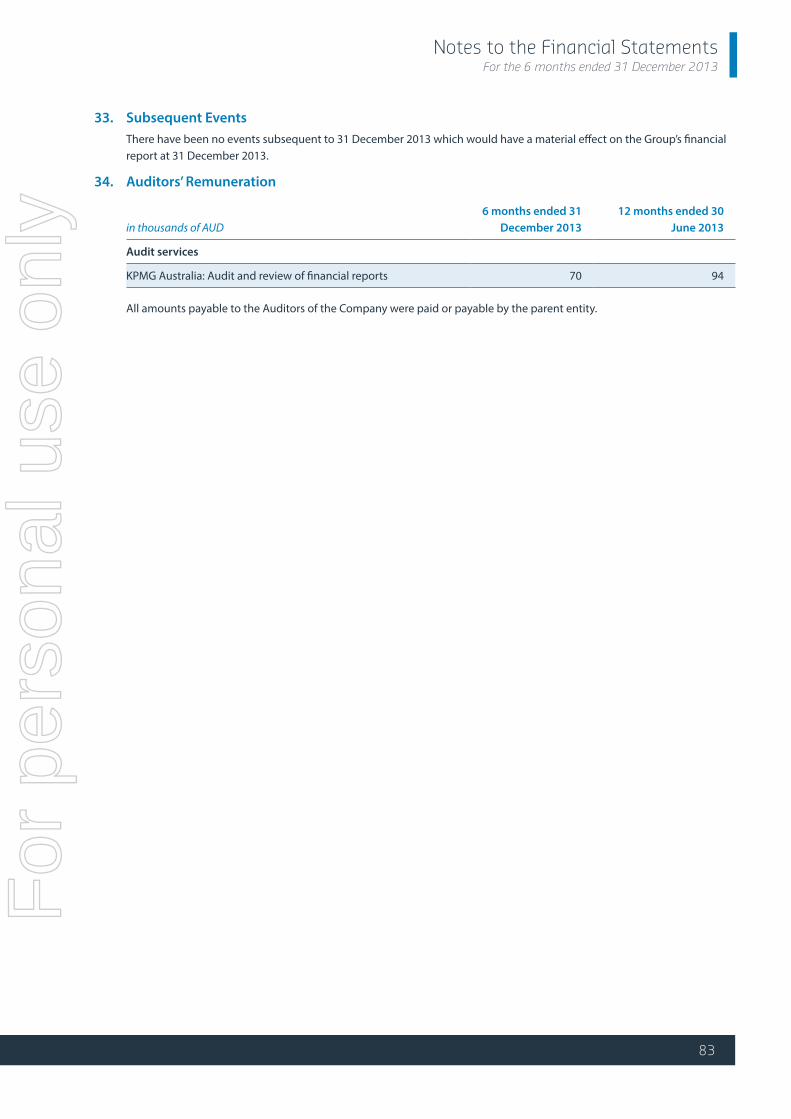
Notes to the Financial StatementsFor the 6 months ended 31 December 2013
83
33. Subsequent EventsThere have been no events subsequent to 31 December 2013 which would have a material effect on the Group’s financial report at 31 December 2013.
34. Auditors’ Remuneration
in thousands of AUD6 months ended 31
December 201312 months ended 30
June 2013
Audit services
KPMG Australia: Audit and review of financial reports 70 94
All amounts payable to the Auditors of the Company were paid or payable by the parent entity.
For
per
sona
l use
onl
y

84
Directors’ Declaration
1 In the opinion of the Directors of Buru Energy Limited (‘the Company’):
(a) the consolidated financial statements and notes that are contained on pages 46 to 83 and the Remuneration report in the Directors’ report, set out on pages 33 to 39, are in accordance with the Corporations Act 2001, including:
(i) Giving a true and fair view of the Group’s financial position as at 31 December 2013 and of its performance, for the financial period ended on that date; and
(ii) Complying with Australian Accounting Standards (including the Australian Accounting Interpretations) and the Corporations Regulations 2001.
(b) There are reasonable grounds to believe that the Group will be able to pay its debts as and when they become due and payable.
2 The Directors have been given the declarations required by Section 295A of the Corporations Act 2001 from the Managing Director and Chief Financial Officer, for the six months ended 31 December 2013.
3 The Directors draw attention to Note 2(a) to the consolidated financial statements, which includes a statement of compliance with International Financial Reporting Standards.
Signed in accordance with a resolution of the Directors:
___________________________ __________________________
Mr Keiran Wulff Mr Graham RileyManaging Director ChairmanPerth Perth21 March 2014 21 March 2014
For
per
sona
l use
onl
y

85
Independent Audit ReportF
or p
erso
nal u
se o
nly

Independent Audit Report
86
For
per
sona
l use
onl
y

Additional ASX Information
87
Additional information required by the ASX Limited Listing Rules and not disclosed elsewhere in this report is set out below.
The distribution of ordinary shares ranked according to size as at 14 March 2014 was as follows:
Category Ordinary shares % No. of holders %
100,001 and Over 217,656,431 72.92 295 3.43
10,001 to 100,000 58,940,233 19.75 2,071 24.06
5,001 to 10,000 11,592,948 3.88 1,521 17.67
1,001 to 5,000 9,527,003 3.19 3,232 37.56
1 to 1,000 788,915 0.26 1,487 17.28
Total 298,505,530 100.00 8,606 100.00
Unmarketable Parcels 88,650 0.03 538 6.25
The 20 largest ordinary shareholders of the ordinary shares as at 14 March 2014 were as follows:
Rank Name No. of ordinary shares %
1 BIRKDALE ENTERPRISES PTY LTD 23,320,657 7.81
2 UBS WEALTH MANAGEMENT AUSTRALIA NOMINEES PTY LTD 12,308,517 4.12
3 MR ERIC CHARLES STREITBERG 11,848,133 3.97
4 CITICORP NOMINEES PTY LIMITED 10,472,491 3.51
5 FLEXIPLAN MANAGEMENT PTY LTD 9,817,419 3.29
6 HSBC CUSTODY NOMINEES (AUSTRALIA) LIMITED 8,931,947 2.99
7 HSBC CUSTODY NOMINEES (AUSTRALIA) LIMITED – A/C 2 8,286,876 2.78
8 J P MORGAN NOMINEES AUSTRALIA LIMITED 6,512,931 2.18
9 NATIONAL NOMINEES LIMITED 6,335,686 2.12
10 JP MORGAN NOMINEES AUSTRALIA LIMITED 5,767,087 1.93
11 CVC LIMITED 5,619,806 1.88
12 MAXIGOLD HOLDINGS PTY LTD 4,752,043 1.59
13 MR THOMAS CHARLES STREITBERG 4,722,400 1.58
14 AUSTRALIAN FOUNDATION INVESTMENT COMPANY LIMITED 3,993,785 1.34
15 TROJAN OSF PTY LTD 3,706,000 1.24
16 WHITTINGHAM SECURITIES PTY LIMITED 2,000,000 0.67
17 NATIONAL NOMINEES LIMITED 1,976,074 0.66
18 CHARRINGTON PTY LTD 1,945,722 0.65
19 AMP LIFE LIMITED 1,800,185 0.60
20 BNP PARIBAS NOMS PTY LTD 1,769,132 0.59
Total twenty largest shareholders 135,886,891 45.52
Balance of register 162,618,639 54.48
Total register 298,505,530 100.00
For
per
sona
l use
onl
y

Additional ASX Information
88
The following interests were registered on the Company’s register of Substantial Shareholders as at 14 March 2014:
Shareholder Number
Eric Streitberg and his associates 28,700,566
Birkdale Enterprises Pty Ltd 23,320,657
Voting rightsOrdinary sharesAt a general meeting of shareholders:
(a) On a show of hands, each person who is a member or sole proxy has one vote.(b) On a poll, each shareholder is entitled to one vote for each fully paid share.
Unlisted OptionsThere are no voting rights attached to the unlisted options:
Other informationBuru Energy Limited, incorporated and domiciled in Australia, is a publicly listed company limited by shares.
The Company is listed on the Australian Securities Exchange. ASX Code: BRU
The Company and its controlled entities schedule of interests in permits as at 14 March 2014 was as follows:
Permit Type Ownership Operator
EP129 Exploration permit 100.00% Buru Energy Ltd
EP371 Exploration permit 50.00% Buru Energy Ltd
EP390 Exploration permit 50.00% Buru Energy Ltd
EP391 Exploration permit 50.00% Buru Energy Ltd
EP428 Exploration permit 50.00% Buru Energy Ltd
EP431 Exploration permit 50.00% Buru Energy Ltd
EP436 Exploration permit 50.00% Buru Energy Ltd
EP438 Exploration permit 62.50% Buru Energy Ltd
EP457 Exploration permit 37.50% Buru Fitzroy Pty Ltd
EP458 Exploration permit 37.50% Buru Fitzroy Pty Ltd
EP471 Exploration permit 50.00% Buru Energy Ltd
EP472 Exploration permit 50.00% Buru Energy (Acacia) Pty Ltd
EP473 Exploration permit 50.00% Buru Energy Ltd
EP474 Exploration permit 100.00% Buru Energy Ltd
EP476 Exploration permit 50.00% Buru Energy Ltd
EP477 Exploration permit 50.00% Buru Energy (Acacia) Pty Ltd
EP478 Exploration permit 100.00% Buru Energy (Acacia) Pty Ltd
L6 Production license 100.00% Buru Energy Ltd
L8 Production license 100.00% Buru Energy Ltd
L17 Production license 100.00% Buru Energy Ltd
PL7 Onshore pipeline license 100.00% Buru Energy Ltd
For
per
sona
l use
onl
y

Corporate DirectoryAs at 14 March 2014
89
Shares on issue: 298,505,530
Unlisted options: 1,339,800
Share Appreciation Rights:12,342,714
Debt: Nil
DirectorsMr Graham Riley – Chairman
Dr Keiran Wulff – Managing Director
Mr Eric Streitberg – Executive Director
The Hon Peter Jones – Non-Executive Director
Company SecretaryMr Chris Bath
Registered and Principal OfficeLevel 2
88 William Street
PERTH WA 6000
Telephone: +61 (08) 9215 1800
Facsimile: +61 (08) 9215 1899
Share RegistryLink Market Services Limited
Locked Bag A14
SYDNEY SOUTH NSW 1235
Telephone: 1800 810 859 (Within Australia)
+61 (02) 8280 7211 (Outside Australia)
Email:
Website:
www.linkmarketservices.com.au
AuditorsKPMG
235 St George’s Terrace
PERTH WA 6000
BankersCommonwealth Bank of Australia
1230 Hay Street
WEST PERTH WA 6005
Stock ExchangeAustralian Stock Exchange
Exchange Plaza
2 The Esplanade
PERTH WA 6000
ASX Code:BRU
For
per
sona
l use
onl
y