for more information contact - ocean conservancy...antarctic fur seal entangled in abandoned fi...
TRANSCRIPT

Please Note:Ocean Conservancy’s report, A Rising Tide of Ocean Debris and What We Can Do About It, is embargoed for release until Tuesday, March 10 at noon EDT (5pm GMT) for broadcast and publication.
For more INFormatIoN CoNtaCt:Tom McCann at 202-351-0465 ([email protected])Michele Capots at 202-351-0436 ([email protected])

2009 RepoRt
And WhAt We CAn do About It

OVERVIEWIntroduction from the President and CEO ................................................................................................... 2
A Message from Philippe Cousteau .............................................................................................................. 3
Executive Summary and Key Findings .......................................................................................................... 4
Results from the 2008 International Coastal Cleanup ................................................................................ 6
Participating Countries Map ......................................................................................................................... 7
Marine Debris Kills ...................................................................................................................................... 14
Climate Change and Marine Debris ............................................................................................................ 18
Take Action: Start a Sea Change ................................................................................................................. 22
International Coastal Cleanup Sponsoring Partners ................................................................................. 26
International Coastal Cleanup Volunteer Coordinators and Sponsors ..................................................... 28
THE MARINE DEBRIS INDEXMethodology and Research Notes ............................................................................................................. 34
Marine Debris Breakdown by Countries and Locations ............................................................................ 35
Participation by Countries and Locations ................................................................................................. 42
Marine Debris Breakdown by US States ..................................................................................................... 43
Participation by US States .......................................................................................................................... 46
Acknowledgments and Photo Credits ....................................................................................................... 48
Sources .............................................................................................................................. Inside Back Cover
© by Ocean Conservancy All rights reserved. ISBN: 978-0-615-27056-2
OCEAN CONSERVANCYOcean Conservancy promotes healthy and diverse ocean ecosystems and opposes practices that threaten ocean life and human life. Through research, education, and science-based advocacy, Ocean Conservancy informs, inspires, and empowers people to speak and act on behalf of the ocean. In all its work, Ocean Conservancy strives to be the world’s foremost advocate for the ocean.
THE INTERNATIONAL COASTAL CLEANUP In partnership with volunteer organizations and individuals across the globe, Ocean Conservancy’s International Coastal Cleanup engages people to remove trash and debris from the world’s beaches and waterways, to identify the sources of debris, and to change the behaviors that cause marine debris in the fi rst place.
COVER PHOTOGRAPHAntarctic fur seal entangled in abandoned fi shing net, South Georgia Island, southern Atlantic Ocean.
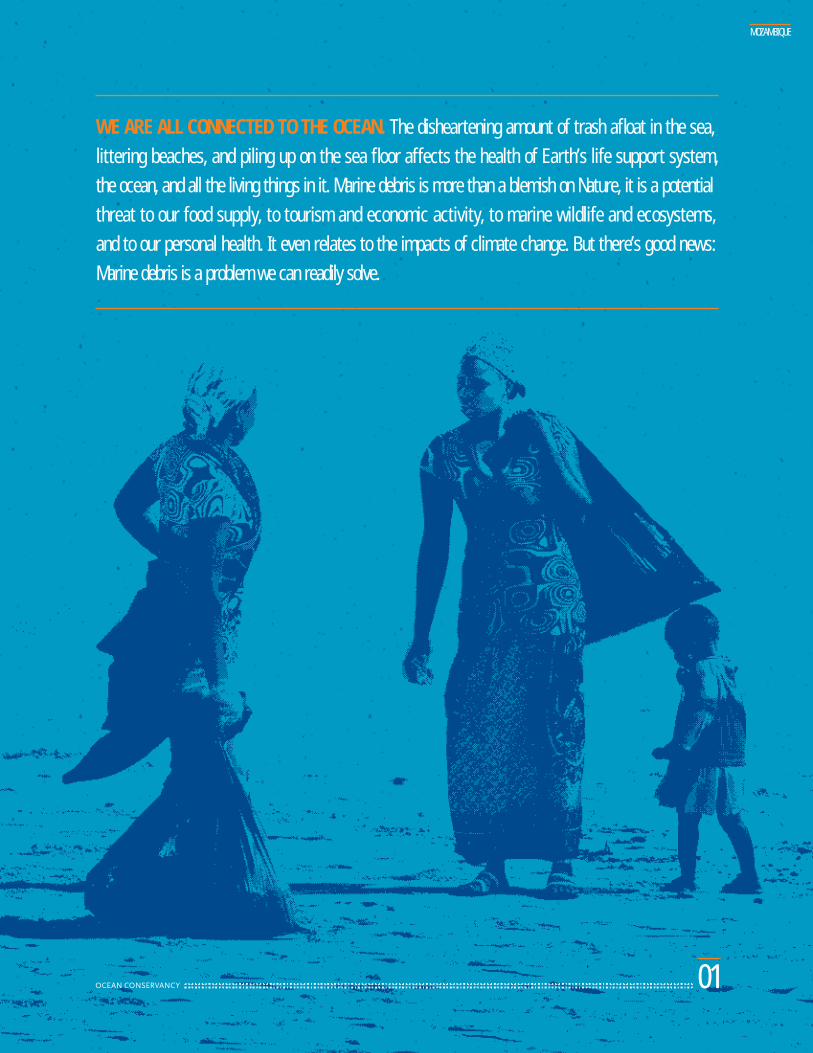
WE ARE ALL CONNECTED TO THE OCEAN. The disheartening amount of trash afl oat in the sea, littering beaches, and piling up on the sea fl oor affects the health of Earth’s life support system, the ocean, and all the living things in it. Marine debris is more than a blemish on Nature, it is a potential threat to our food supply, to tourism and economic activity, to marine wildlife and ecosystems, and to our personal health. It even relates to the impacts of climate change. But there’s good news: Marine debris is a problem we can readily solve.
MOZAMBIQUE
01
It’s time we realize that all of us —
whether we are among the large
portion of the world population
inhabiting the coast, or those living
thousands of miles inland — are intimately
connected to the ocean. The ocean
is Earth’s life support system. It drives
and moderates our climate. It creates
the weather (both good and bad). It is
the ultimate source of the water we drink
and much of the oxygen we breathe. It directly feeds millions
of people. It also absorbs much of the air and water pollution
generated by a world population approaching seven billion.
But our ocean is sick, and our actions have made it so.
We must recognize that the ocean is inextricably connected
to us; when we allow trash to get into the ocean, we directly
affect its health. And that, as you’ll learn in this report,
may affect our own health and well-being.
In spite of all of the wonderful life-giving benefi ts provided
by the ocean, most people don’t yet understand what’s really
at stake. All of these ocean benefi ts—indeed, the future
of life on Earth—are threatened by climate change and its
direct impact on the ocean, the land, and humanity. As we
work to reduce greenhouse gas emissions, we must also
fi nd ways to improve ocean health. We must make the ocean
more resilient to the negative impacts already set in motion
by excess carbon dioxide in the atmosphere and seawater.
Tackling the major pollution problem of marine debris is
a sure-fi re way to make an immediate change for the better.
I’m happy to report that awareness of ocean connections
is growing, as shown by exploding participation in Ocean
Conservancy’s International Coastal Cleanup. In September
2008, from the landlocked state of Nebraska in the United
States to countries with long ocean borders like Mozambique,
390,000 people in 104 countries and locations—each
concerned about the fate of our planet—walked riverbanks,
lake shores, and beaches picking up trash. Among them were
more than 10,600 divers and more than 1,200 boaters. These
volunteers not only cleaned up trash, but logged data about
what they found. This information, amassed over the 23-year
history of the Cleanup, has been integral both to raising
awareness about this global problem and implementing policy
changes to address it.
The ocean covers more than two-thirds of our planet.
It provides 99 percent of the living space on Earth. Since
the beginning of human history, we have believed it to be
infi nite, but it is not. We simply cannot continue to put our
trash in the ocean. The evidence turns up every day in dead
and injured marine life, littered beaches that discourage
tourists, and choked ocean ecosystems.
To keep the circle of life intact and healthy, we must act now.
This special report highlights the ways in which trash impacts
ocean health, and offers solutions based on that information
that every one of us can implement every day to ensure
a healthy ocean for the future. The report is a global snapshot
that shows how we are part of the marine debris picture—and
key to the solution.
Please read the Take Action section in this report, and visit
www.oceanconservancy.org on a regular basis, to fi nd out
what you can do to make a difference, including joining us
on September 19, 2009, at the 24th annual International
Coastal Cleanup.
For the ocean,
VIKKI SPRUILLPresident and CEO, Ocean Conservancy
INTRODUCTION
02
I grew up with the ocean. Sitting with
my grandfather and listening to his
life’s stories—hearing the urgency
in his voice—being inspired by the
passion that he had for taking action
for our water planet. The oceans are the
life support system of this planet. They
are in peril, and it is critical that we all
know we have a responsibility to protect
and restore the oceans because everything
we do makes a difference, all of our choices have consequences.
The preservationist John Muir said it best, I believe: “When
one tugs at a single thing in nature, he fi nds it attached to
the rest of the world.”
Building on my grandfather’s and father’s legacy, I dedicate
my work to the ocean as CEO of EarthEcho International
and as an Ocean Conservancy board member. Empowering
every individual to take action for a healthy and abundant
planet, especially the ocean, is at the heart of what I do.
Make no mistake; we live in a time of crisis for our oceans
and the challenges facing them are myriad and daunting.
Climate change, the greatest environmental challenge we
face, starts with the ocean. Melting sea ice, seawater that
is growing more acidic, rising sea levels, and extreme
weather events are affecting marine life and coastal
communities right now as you read this, not tomorrow
or next year or decades from now.
Removing marine debris is one way we can all take action
to help the ocean adapt and become stronger in the face
of climate change. But the problem of marine debris goes
deeper still. While climate change and other stressors
are taking a toll, trash layers the ocean fl oor, fl oats in our
waterways, and harms and kills ocean wildlife, further
weakening the system.
This report is a reminder that our own carelessness and
indifference is proving deadly for our ocean’s inhabitants.
Offered here on these pages are more than mere facts and
fi gures. The time for action is now, and true change will require
taking a bold and courageous stand. There are solutions that
everyone, everywhere in the world, can adopt and join in.
Most of them are quite simple: throw your trash in the proper
receptacles; opt for reusable bags at the grocery store; eat only
sustainably caught fi sh; recycle. Regardless, whatever you
choose to do to help the ocean, the most important thing is to
do something, to not only be ardent advocates of conservation
but also its most active participants.
The time for sea change has come. Each of us has a personal
responsibility when it comes to the health of the ocean. While
the challenges we face may seem overwhelming, I am a fi rm
believer that together we can build the sustainable future
of our dreams. Each of us alone. All of us together. Making
a positive difference.
PHILIPPE COUSTEAUPresident and CEO, EarthEcho InternationalBoard Member, Ocean Conservancy
A MESSAGE FROM
03

Litter can travel to the ocean from many miles inland,
blown on the wind or carried along by rivers and streams.
We are all responsible, from beachgoers to oil-rig workers
and fi shermen, for cigarette butts, food wrappers, bottles,
and bags in the water. Overfl owing sewage systems and
storm drains add to the burden by ferrying trash from rural
roads and city streets to the sea. And, despite national
and international regulations against dumping, some people
on boats still drop trash directly into the ocean. In recent
years, organic materials that were once the most prevalent
component of marine debris have been supplanted by
synthetics. Not only do items like packing straps, tarps, nets,
and containers last for years, but also they are often highly
buoyant, traveling thousands of miles on ocean currents.
Each year, Ocean Conservancy provides a compelling
global snapshot of marine debris collected at sites all over
the world at the International Coastal Cleanup held the
third Saturday of every September. This year’s report,
A Rising Tide of Ocean Debris, presents data recorded by
nearly 400,000 volunteers in 104 countries and locations
and 42 US states at the 23rd annual Cleanup.
This report reveals the types and sources of debris and
zeroes in on the startling impacts of ocean trash on wildlife
and its connection to the challenge of global climate change.
Its recommendations provide a roadmap for eliminating
marine debris altogether by reducing it at the source, chang-
ing the behaviors that cause it, and supporting better policy.
The comprehensive body of data compiled each year at the
Cleanup—the Marine Debris Index—has informed major
legislation like the Marine Debris Research, Prevention,
and Reduction Act of 2006, and inspired improvements
in packaging and other technologies as well as expanded
recycling efforts in communities large and small.
KEY FINDINGS
1 A tidal wave of ocean debris is a major pollution
problem of the 21st century. During the 2008
International Coastal Cleanup in September, nearly
400,000 volunteers picked up an astounding 6.8
million pounds of trash, trash that has a major impact
on ocean health. Toxic materials enter the food chain,
sharp items injure beachgoers, and accident-causing
debris snarls boat propellers. Trash weakens economies,
sapping precious dollars from tourism and our seafood
industries. And it harms individual species as well
as entire ecosystems, like coral reefs, that are essential
for the survival of marine life.
2 Certain categories of debris show up more often
in certain places. The Marine Debris Index is the
only state-by-state, country-by-country measure
of trash in our waterways and ocean. During
the 2008 Cleanup, volunteers collected 11,077 diapers
in the Philippines, 19,504 fi shing nets in the United
Kingdom, and 1,362,741 cigarette butts in the US. That’s
the kind of information that helps planners at the local,
regional, national, and international levels tackle marine
debris effectively.
3 Of the 43 items tracked during the Cleanup, the top
three items of trash found in 2008 were cigarette
butts, plastic bags, and food wrappers/containers.
All readily fall from human hands, and can be easily
contained if people dispose of them carefully.
ACCORDING TO THE UNITED NATIONS ENVIRONMENT PROGRAMME, “Marine litter is one of the most pervasive and solvable pollution problems plaguing the world’s ocean and waterways.”
04
INTERNATIONAL COASTAL CLEANUP

4 Marine debris kills. Every year, thousands of marine
mammals, sea turtles, seabirds, and other animals
are sickened, injured, or killed because of trash in
the ocean. Animals choke or become poisoned when
they eat trash, and drown when they become entangled in
bags, ropes, and old fi shing gear. The majority of entangled
animals found during the Cleanup were bound up by old
fi shing line. The loss of wildlife affects not only the beauty
and health of the planet, but also countless local economies
based on the bounty of the sea.
5 Marine debris degrades ocean health and
compromises its ability to adapt to climate
change. Marine debris is yet another stress on
an ocean already facing transformation due to
global climate change in the guise of rising sea levels,
warming water, and changing ocean chemistry. As marine
organisms and ecosystems struggle to adapt to climate
change, we can improve their resilience and help to give
them a fi ghting chance by eliminating the stresses caused
by human impacts like trash in the ocean.
RECOMMENDATIONSHumans have created the marine debris problem, and
humans must take responsibility for it. How big is the
challenge? In 2008, a major report from the National
Research Council titled Tackling Marine Debris in the 21st
Century recommended a goal of discharging zero waste
into marine environments.
The Cleanup data tells us that we are putting huge quantities
of dangerous items into the ocean. Based on the accumulated
evidence put forth in this report and over the past 23 years,
Ocean Conservancy recommends the following actions to
end marine debris:
1Expand public and private partnerships to monitor
and reduce marine debris. Ending marine debris
requires everyone’s participation. More corporations
and private citizens have joined government,
foundations, and non-governmental organizations in
the environmental arena and helped shape change as
never before. We must fi nd every opportunity to pull
all stakeholders into solution scenarios.
THE NATIONAL RESEARCH COUNCIL RECOMMENDED A GOAL OF DISCHARGING ZERO WASTE INTO MARINE ENVIRONMENTS.
2 Fund increased research on the sources and impacts
of marine debris. We need science-based solutions.
Armed with knowledge, we can focus our attention
on particular areas of greatest vulnerability and
target sources and types of marine debris that are proving the
most harmful. Bolstered by information about what these
things are, where they originate, and their quantities, we can
work more effi ciently and effectively to reduce litter at the
source in addition to cleaning up what’s already out there.
3 Reduce, reuse, recycle. Much of what winds up in
the ocean wasn’t truly necessary in the fi rst place.
We can produce less packaging up front and cut
back on debris through programs that encourage
positive changes in behavior such as recycling and the
routine use of cloth grocery bags.
4 Seek better technological solutions. Human
ingenuity has already closed in on some of the
breakthroughs we need to reduce marine litter,
such as bottle designs that use less plastic and
environmentally friendly materials.
5 Support the inclusion of comprehensive ocean
management in all climate change initiatives.
Citizens must vote for and actively support
climate change policies that protect the ocean.
Government, for its part, must lead with policy changes
that include strategies to minimize the negative impacts
climate change has on the ocean and policies that reduce
sources of marine debris.
6 Engage in community efforts like the International
Coastal Cleanup. Events like the Cleanup really do
make a difference, whether making the local beach
or shoreline free of debris or raising awareness
and empowering individuals to support a healthier, more
resilient ocean.
05

T he International Coastal Cleanup is the world’s largest volunteer
effort of its kind for the ocean. On one day in September 2008
during the 23rd annual Cleanup, 390,881 volunteers in 104
countries and locations around the world, as well as in 42 US states
and the District of Columbia, collected an astonishing 6.8 million
pounds of debris, the equivalent of 17 pounds for every participant.
THE MARINE DEBRIS INDEX
SOUTH AFRICA
INTERNATIONAL COASTAL CLEANUP
06

ArgentinaArubaAustraliaAustriaBahamasBahrainBangladeshBarbadosBelgiumBelizeBermudaBrazilBritish Virgin IslandsCanadaCayman IslandsChileChinaColombiaCook IslandsCosta RicaCroatia
CyprusDenmarkDominicaDominican RepublicEast TimorEcuadorEgyptEstoniaFijiFinlandFranceFrench PolynesiaGermanyGhanaGreeceGrenadaGuamGuatemalaGuyanaHondurasHong Kong
HungaryIndiaIndonesiaIranIrelandIsraelItalyJamaicaJapanJordanKenyaKuwaitMalaysiaMaldivesMaltaMarshall IslandsMauritiusMexicoMozambiqueNetherlands AntillesNetherlands
New ZealandNicaraguaNigeriaNorthern Mariana IslandsOmanPalauParaguayPhilippinesPolandPortugalPuerto RicoQatarRepublic of KoreaRussiaSaudi ArabiaSeychellesSingaporeSlovakiaSloveniaSolomon IslandsSouth Africa
SpainSri LankaSt. Kitts and NevisSt. Vincent and the
GrenadinesSwedenSwitzerlandTaiwanTanzaniaThailandTrinidad and TobagoTurkeyUkraineUnited Arab EmiratesUnited KingdomUnited StatesUS Virgin IslandsUruguayVanuatuVenezuelaVietnam
AND LOCATIONS
INTERNATIONAL COASTAL CLEANUP
07
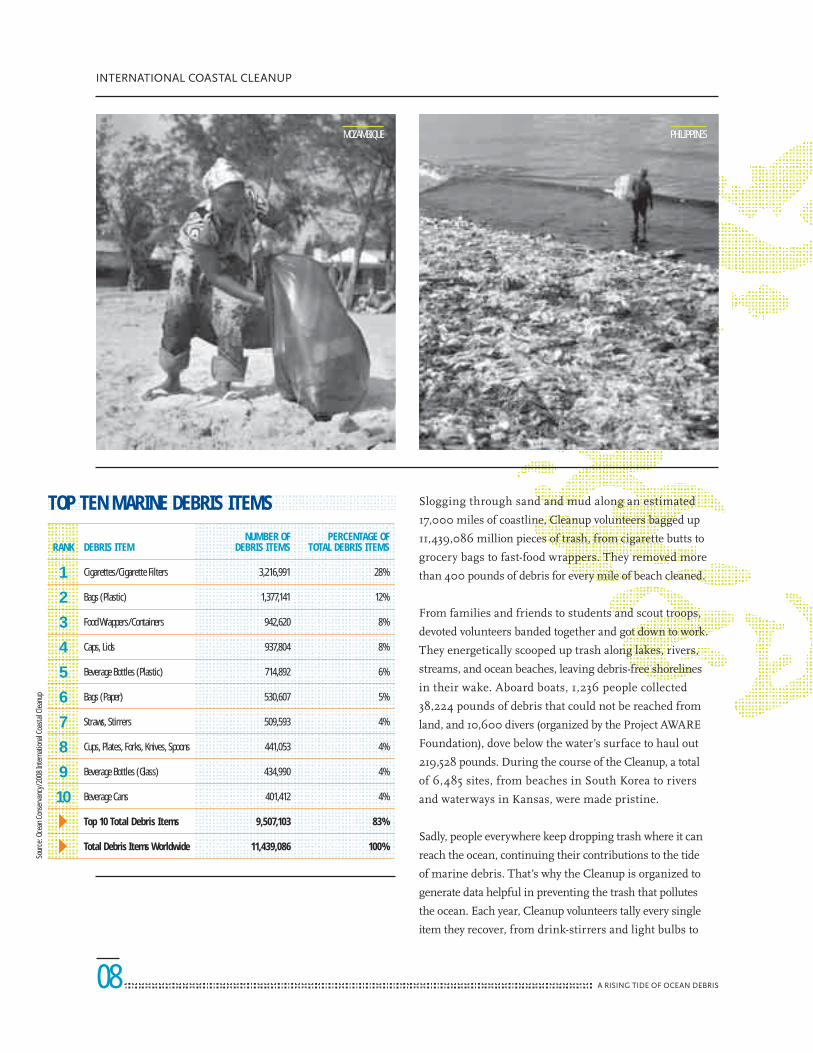
Slogging through sand and mud along an estimated
17,000 miles of coastline, Cleanup volunteers bagged up
11,439,086 million pieces of trash, from cigarette butts to
grocery bags to fast-food wrappers. They removed more
than 400 pounds of debris for every mile of beach cleaned.
From families and friends to students and scout troops,
devoted volunteers banded together and got down to work.
They energetically scooped up trash along lakes, rivers,
streams, and ocean beaches, leaving debris-free shorelines
in their wake. Aboard boats, 1,236 people collected
38,224 pounds of debris that could not be reached from
land, and 10,600 divers (organized by the Project AWARE
Foundation), dove below the water’s surface to haul out
219,528 pounds. During the course of the Cleanup, a total
of 6,485 sites, from beaches in South Korea to rivers
and waterways in Kansas, were made pristine.
Sadly, people everywhere keep dropping trash where it can
reach the ocean, continuing their contributions to the tide
of marine debris. That’s why the Cleanup is organized to
generate data helpful in preventing the trash that pollutes
the ocean. Each year, Cleanup volunteers tally every single
item they recover, from drink-stirrers and light bulbs to
Sour
ce: O
cean
Con
serv
ancy
/200
8 In
tern
ation
al Co
asta
l Cle
anup
RANK DEBRIS ITEMNUMBER OF
DEBRIS ITEMSPERCENTAGE OF
TOTAL DEBRIS ITEMS
1 Cigarettes/Cigarette Filters 3,216,991 28%
2 Bags (Plastic) 1,377,141 12%
3 Food Wrappers/Containers 942,620 8%
4 Caps, Lids 937,804 8%
5 Beverage Bottles (Plastic) 714,892 6%
6 Bags (Paper) 530,607 5%
7 Straws, Stirrers 509,593 4%
8 Cups, Plates, Forks, Knives, Spoons 441,053 4%
9 Beverage Bottles (Glass) 434,990 4%
10 Beverage Cans 401,412 4%
Top 10 Total Debris Items 9,507,103 83%
Total Debris Items Worldwide 11,439,086 100%
TOP TEN MARINE DEBRIS ITEMS
PHILIPPINESMOZAMBIQUE
INTERNATIONAL COASTAL CLEANUP
08
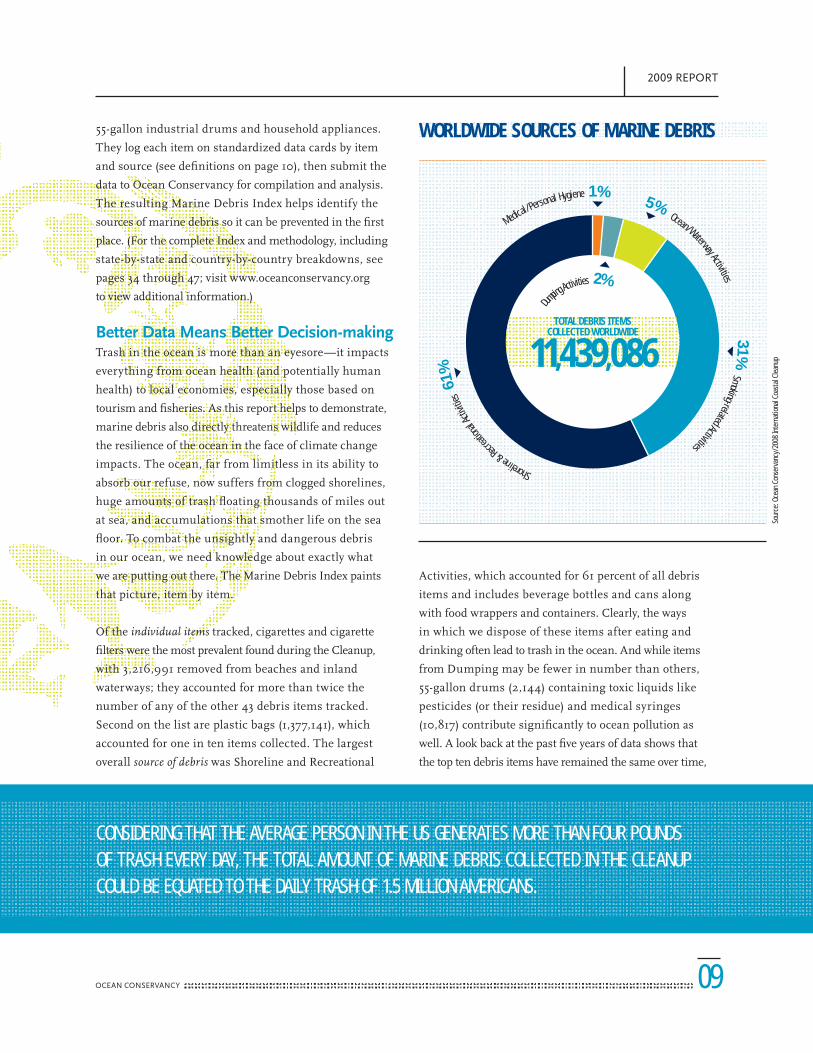
WORLDWIDE SOURCES OF MARINE DEBRIS
CONSIDERING THAT THE AVERAGE PERSON IN THE US GENERATES MORE THAN FOUR POUNDS OF TRASH EVERY DAY, THE TOTAL AMOUNT OF MARINE DEBRIS COLLECTED IN THE CLEANUP COULD BE EQUATED TO THE DAILY TRASH OF 1.5 MILLION AMERICANS.
55-gallon industrial drums and household appliances.
They log each item on standardized data cards by item
and source (see defi nitions on page 10), then submit the
data to Ocean Conservancy for compilation and analysis.
The resulting Marine Debris Index helps identify the
sources of marine debris so it can be prevented in the fi rst
place. (For the complete Index and methodology, including
state-by-state and country-by-country breakdowns, see
pages 34 through 47; visit www.oceanconservancy.org
to view additional information.)
Better Data Means Better Decision-makingTrash in the ocean is more than an eyesore—it impacts
everything from ocean health (and potentially human
health) to local economies, especially those based on
tourism and fi sheries. As this report helps to demonstrate,
marine debris also directly threatens wildlife and reduces
the resilience of the ocean in the face of climate change
impacts. The ocean, far from limitless in its ability to
absorb our refuse, now suffers from clogged shorelines,
huge amounts of trash fl oating thousands of miles out
at sea, and accumulations that smother life on the sea
fl oor. To combat the unsightly and dangerous debris
in our ocean, we need knowledge about exactly what
we are putting out there. The Marine Debris Index paints
that picture, item by item.
Of the individual items tracked, cigarettes and cigarette
fi lters were the most prevalent found during the Cleanup,
with 3,216,991 removed from beaches and inland
waterways; they accounted for more than twice the
number of any of the other 43 debris items tracked.
Second on the list are plastic bags (1,377,141), which
accounted for one in ten items collected. The largest
overall source of debris was Shoreline and Recreational
Activities, which accounted for 61 percent of all debris
items and includes beverage bottles and cans along
with food wrappers and containers. Clearly, the ways
in which we dispose of these items after eating and
drinking often lead to trash in the ocean. And while items
from Dumping may be fewer in number than others,
55-gallon drums (2,144) containing toxic liquids like
pesticides (or their residue) and medical syringes
(10,817) contribute signifi cantly to ocean pollution as
well. A look back at the past fi ve years of data shows that
the top ten debris items have remained the same over time, So
urce
: Oce
an C
onse
rvan
cy/2
008
Inte
rnat
ional
Coas
tal C
lean
up
61%
31%
5%1%
11,439,086TOTAL DEBRIS ITEMS
COLLECTED WORLDWIDE
2%
Shoreline
& Recre
ation
al Ac
tiviti
es
Smoking-related Activities
Ocean/Waterway Activities
Medical /Personal Hygiene
Dumping
Activities
2009 REPORT
09

SOURCE AFRICANORTH
AMERICACENTRAL AMERICA
SOUTH AMERICA CARIBBEAN
SOUTHEAST ASIA
WESTERN ASIA EUROPE OCEANIA
Shoreline & Recreational Activities 85.1% 53.1% 23.7% 71.2% 81.5% 79.6% 47.4% 57.3% 72.4%
Ocean/Waterway Activities 1.6% 4.9% 1.6% 5.9% 5.3% 7.3% 3.2% 29.0% 4.4%
Smoking-related Activities 9.0% 35.2% 74.0% 19.1% 9.8% 11.1% 47.0% 9.1% 19.7%
Dumping Activities 2.3% 2.1% 0.3% 2.4% 2.2% 1.1% 1.5% 2.7% 2.7%
Medical/Personal Hygiene 1.9% 4.7% 0.4% 1.4% 1.2% 0.9% 0.8% 2.0% 0.9%
trips, picnics, sports and recreation, and festivals.
Litter washes into the ocean from streets, parking lots,
and storm drains.
• Ocean/Waterway Activities. People engaged in recre-
ational fi shing and boating, commercial fi shing, cargo/
military/cruise ship operations, and offshore industries
such as oil drilling contribute to marine debris.
• Smoking-related Activities. Careless disposal of cigarette
fi lters, cigar tips, lighters, and tobacco product packaging
is common on both land and sea.
• Dumping. Legal and illegal dumping of domestic and
industrial garbage, construction materials, or large
household appliances puts big quantities of harmful
items into the ocean.
• Medical/Personal Hygiene. Items ranging from
tampons and disposable diapers to syringes enter
the water most often through sewer systems.
Regional trends are yet another useful tool for local
planners working to identify and manage sources of
specifi c debris items. As the chart on this page shows, in
Africa, Shoreline and Recreational Activities was the largest
category, whereas in Central America, Smoking-related
Activities dominated. Europe had a greater share of Ocean/
Waterway Activities than other regions. North America had
the largest portion of Medical/Personal Hygiene items,
like tampons and syringes, for a total of fi ve percent,
SOURCES OF MARINE DEBRIS BY REGION
THE TOTAL WEIGHT OF GARBAGE COLLECTED (3,402 TONS) MATCHES THE WEIGHT OF 18 BLUE WHALES, THE LARGEST WHALE IN THE WORLD.
and Shoreline and Recreational Activities held their position
as the top source of marine debris.
The marine debris problem is solvable, and often through
relatively simple or existing measures. Armed with
knowledge about the most prevalent components of marine
debris, elected offi cials can make informed policy decisions,
community leaders can tailor and expand recycling and
other trash-reduction programs, corporate decision makers
can improve technology and reduce packaging, and
individuals can recycle, reuse, or properly dispose of trash
to keep these items out of the ocean in the fi rst place.
Sources of Marine DebrisWhere does all the trash in the ocean originate? Knowing the
answer to that question leads to better management plans
and policies to stop it. To gain a more complete and useful
picture of marine debris, this report defi nes several sources
to help identify how specifi c items enter the ocean:
• Shoreline and Recreational Activities. The majority
of marine debris comes from land-based activities like
eating fast food and discarding the wrappers, beach
Sour
ce: O
cean
Con
serv
ancy
/200
8 In
tern
ation
al Co
asta
l Cle
anup
INTERNATIONAL COASTAL CLEANUP
10

compared to less than two percent for other parts of the
world. Differences in individual items could help target
specifi c actions. For instance, in the Philippines volunteers
found 11,077 disposable diapers.
ParticipationIn a remarkable act of solidarity and community, individuals
working at the same time and with a shared sense of urgency
bagged and recorded debris. The number of participating
countries and locations jumped by more than 30 percent
in 2008 over 2007, to 104—a powerful demonstration
that awareness of the marine debris problem is surging
around the globe. About half of the volunteers were outside
of the US, where the Philippines, Canada, and Japan had
the greatest volunteer turnout. Volunteers came from
countries as large as India and Brazil as well as one of the
world’s smallest nations, the island of Palau.
The greatest turnout came from the US, where 183,194
volunteers collected 3,661,455 pounds of trash along an
estimated 9,000 miles of shoreline. They worked in 42 states
and the District of Columbia. California had the largest
cleanup in the US, with one out of fi ve volunteers nationally.
TOP TEN PARICIPATING COUNTRIES AND LOCATIONS
RANKCOUNTRY AND LOCATION
NUMBER OF VOLUNTEERS
1 United States 183,194
2 Philippines 37,728
3 Canada 34,320
4 Japan 13,887
5 Brazil 11,731
6 Mexico 9,543
7 Puerto Rico 8,637
8 Ecuador 8,379
9 South Africa 7,003
10 India 6,147
104 Countries and Locations 390,881
TOP TEN PARICIPATING US STATES
RANK US STATENUMBER OF
VOLUNTEERS
1 California 73,691
2 Florida 32,696
3 North Carolina 18,330
4 New York 6,494
5 New Jersey 5,872
6 Virginia 5,710
7 Alabama 3,925
8 Texas 3,573
9 Illinois 3,227
10 Massachusetts 3,077
42 US States and District of Columbia 183,194
MARK YOU CALENDAR FOR THE NEXT INTERNATIONAL COASTAL CLEANUP ON SEPTEMBER 19, 2009. VISIT WWW.COASTALCLEANUP.ORG TO SIGN UP.
Sour
ce: O
cean
Con
serv
ancy
/200
8 In
tern
ation
al Co
asta
l Cle
anup
Sour
ce: O
cean
Con
serv
ancy
/200
8 In
tern
ation
al Co
asta
l Cle
anup
COSTA RICA
11
2009 REPORT

TRASH MOVES FROM LAND TO SEA
T rash travels. A plastic bag carried from a store in Memphis,
Tennessee, blows from a picnic table, washes down
a storm drain to the river, and winds up being eaten by a sea
turtle in the Gulf of Mexico (see photos at right). That’s why
the International Coastal Cleanup takes place on lakes and
inland waterways as well as the ocean’s shores.
Data from the Cleanup confi rms that the same items that
litter the landscape show up on the ocean’s shores. Cigarettes/
cigarette fi lters were the number-one debris item removed
from both coastal (2,447,482 butts) and inland (769,509 butts)
cleanups. With 73 percent of volunteers in coastal areas,
compared to just 27 percent inland, the International Coastal
Cleanup hopes to enlist more volunteers to help clean up lakes
and inland waterways.
The Environmental Protection Agency, a key Cleanup partner
since the start, understands the land-to-sea connection. The
EPA-funded report National Marine Debris Monitoring Program:
Final Program Report, Data Analysis and Summary estimates
that in the US more than half of all marine debris originates
from land-based activities.
1
3
5
2
4
6
SOURCE NUMBER OF COASTAL DEBRIS ITEMS NUMBER OF INLAND DEBRIS ITEMS TOTAL NUMBER OF DEBRIS ITEMS
Shoreline & Recreational Activities 4,974,667 2,014,605 6,989,272
Smoking-related Activities 2,653,844 882,057 3,535,901
Ocean/Waterway Activities 506,276 92,440 598,716
Dumping Activities 133,183 73,975 207,158
Medical/Personal Hygiene 68,476 39,563 108,039
Totals 8,336,446 3,102,640 11,439,086
COASTAL VS. INLAND SOURCES OF MARINE DEBRIS
Sour
ce: O
cean
Con
serv
ancy
/200
8 In
tern
ation
al Co
asta
l Cle
anup
SIX DEGREES OF IMPACT
12
INTERNATIONAL COASTAL CLEANUP

SOUR
CE
BALLO
ONS
BEVE
RAGE
BOTTL
ES
BEVE
RAGE
CANS
BUILD
ING M
ATER
IALS
CRAB
, LOB
STER
, FISH
TRAP
S
FISHIN
G HOO
KS
FISHIN
G LINE
FISHIN
G NET
S
PLAS
TIC BA
GS
RIBBO
N/STR
INGS
ROPE
SIX-PA
CK RI
NGS
TIRES
WIRES
TOTA
L WILD
LIFE
Amphibians 0 1 0 0 0 0 0 2 1 0 1 1 1 0 7
Birds 1 4 1 0 0 3 57 4 9 5 13 1 0 1 99
Fish 0 16 10 0 21 4 70 33 24 2 9 4 1 3 197
Invertebrates 0 12 4 1 35 1 12 24 11 4 9 3 4 2 122
Mammals 0 2 0 0 0 0 2 2 0 1 1 0 0 0 8
Reptiles 0 0 0 0 0 0 2 2 2 0 3 1 0 0 10
Total Debris Items 1 35 15 1 56 8 143 67 47 12 36 10 6 6 443
MARINE WILDLIFE FOUND ENTANGLED IN MARINE DEBRIS
Dangers to WildlifeThe trash collected during the 2008 Cleanup illustrates
the scope of the hazards faced every single day by wildlife
in the ocean. Marine debris not only entangles marine life,
but injures and kills animals that eat it.
Volunteers discovered 443 animals and birds entangled
or trapped by marine debris, of which 268 were found
alive and released. Fish, including sharks, stingrays,
and seahorses, were the most prevalent (44 percent);
volunteers found abandoned traps stuffed to the gills
with doomed fi sh, and sharks tangled in rope or old nets.
Invertebrates like octopuses, crabs, lobsters, and jellyfi sh
were the second largest category, and birds came in third.
Fishing-related items, including line, nets, rope, hooks, and
crab/lobster/fi sh traps, accounted for the most entanglements:
69 percent, or three of every fi ve animals found.
FOR THE COMPLETE MARINE DEBRIS INDEX GO TO PAGE 34.
Sour
ce: O
cean
Con
serv
ancy
/200
8 In
tern
ation
al Co
asta
l Cle
anup
NORTHWESTERN HAWAIIAN ISLANDS
2009 REPORT
13
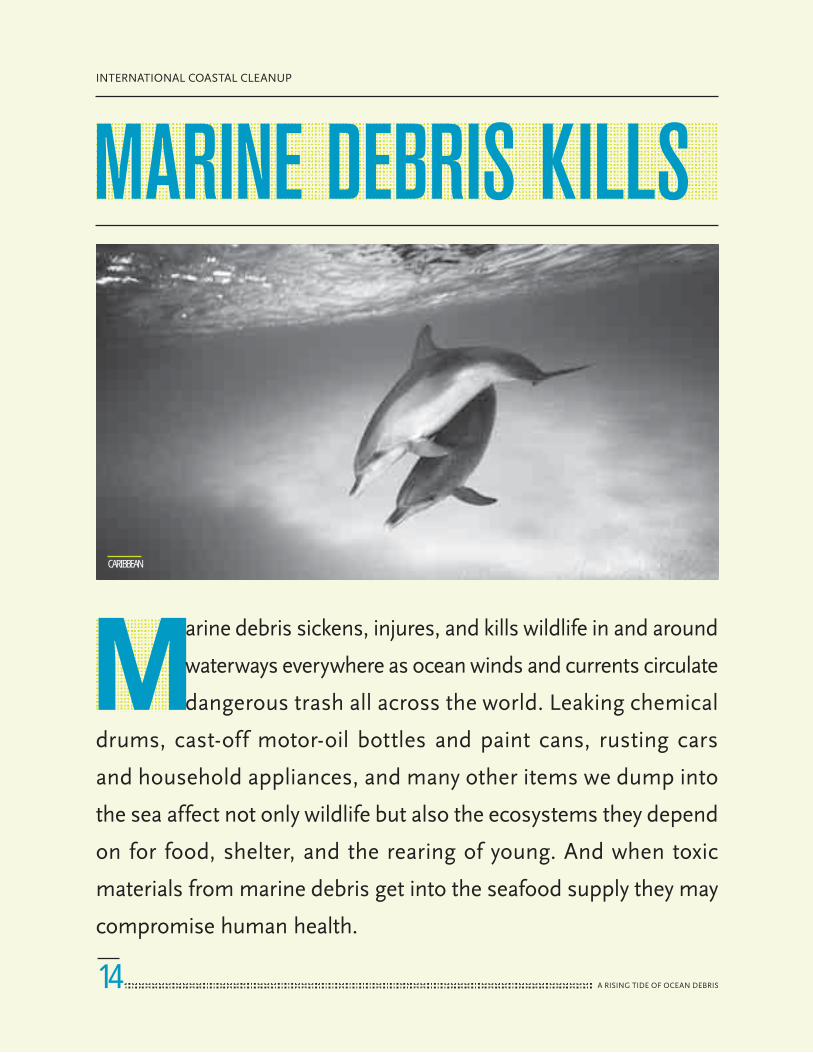
M arine debris sickens, injures, and kills wildlife in and around
waterways everywhere as ocean winds and currents circulate
dangerous trash all across the world. Leaking chemical
drums, cast-off motor-oil bottles and paint cans, rusting cars
and household appliances, and many other items we dump into
the sea affect not only wildlife but also the ecosystems they depend
on for food, shelter, and the rearing of young. And when toxic
materials from marine debris get into the seafood supply they may
compromise human health.
CARIBBEAN
INTERNATIONAL COASTAL CLEANUP
14

• Scientists recently found a dead sperm whale with
440 pounds of fi shing gear in its stomach.
• A study of northern fulmar seabirds found dead
on Dutch beaches revealed that 98 percent had plastic
in their stomachs.
• In Florida, 12 stranded dolphins had fi shing gear
in their stomachs, mouths, or throats, and some had
line tangled from their stomachs to their mouths.
Plastic, the most prevalent component of marine debris,
poses hazards because it persists so long in the ocean,
degrading into tinier and tinier bits that can be consumed
by the smallest marine life at the base of the food web.
The National Research Council’s 2008 report Tackling
Marine Debris in the 21st Century states that plastics
collect toxic compounds that then get into the bodies
of organisms that eat the plastic. These compounds may
travel through the food web, though the evidence on
human health effects thus far is inconclusive. Research
is needed to determine just how this process might
impact not only wildlife but also our food supply.
THOUSANDS OF MARINE MAMMALS, SEA TURTLES, AND SEABIRDS ARE INJURED OR KILLED BECAUSE OF ENCOUNTERS WITH DANGEROUS ITEMS.
Trash travels thousands of miles in the ocean, touching
the most remote places. To protect wildlife and ourselves,
we have to stop marine debris at its source.
Every year, thousands of marine mammals, sea turtles,
seabirds, and other animals are injured or killed by
encounters with dangerous items we’ve carelessly allowed
to reach the ocean. A fatal attraction to items like plastic
bags, cigarette butts, and discarded fi shing line and gear
poses great hazards to the health of marine life throughout
the ocean. Many species, like Hawaiian monk seals (see
photo on page 16) that number just 1,200 today, are already
critically endangered, raising the stakes when it comes to
the impacts of marine debris.
Ingesting Marine Debris: The Unhealthiest Diet Many birds, dolphins, seals, turtles, and fi sh eat things
they shouldn’t—like bottle caps and toothbrushes. Few
can regurgitate unhealthy items, resulting in a false sense
of fullness that causes them to stop eating and slowly
starve to death. Ingested trash can also cause choking,
blockage of the digestive system, or toxic poisoning.
Mounting Evidence: Every day, animals in the ocean suffer
because of marine debris. A growing body of research has
raised the alarm, from studies of the tiniest phytoplankton
that have absorbed toxic materials from plastic to surveys
of porpoises and whales drowned when discarded or
abandoned ropes or fi shing nets entangle them underwater.
Sea turtles, of which six out of seven species are threatened
or endangered, may mistake waterborne plastic bags and
balloons for jellyfi sh (a favorite food) and die when the plastic
chokes them or clogs their digestive systems. Seabirds,
attracted to any small bits of trash, commonly consume
plastic pellets, bottle caps, string, and cigarette butts.
RUSSIA
2009 REPORT
15

Plastic in the ocean includes not only whole or fragmented
consumer items, but also the pellets that are used to
manufacture them. Plastic fragments and pellets can
be found on beaches worldwide. Measureable amounts
of small plastic debris have been found on each of the
remote Northwestern Hawaiian Islands, home to the
critically endangered Hawaiian monk seal and more
than a million seabirds. In one study, 87 percent of the
plastic collected was plastic fragments and 11 percent
consisted of pre-production plastic pellets. The pellets
spill and travel to the ocean through sewer systems, rivers
and streams, and even on the wind.
Entanglement: A Treacherous Web We WeaveEvery item we allow into the ocean adds to the dangerous
marine debris obstacle course confronting wildlife. Curious
seals poke their noses into food containers, yogurt cups,
or bottles, and then get stuck, which prevents them from
eating or even breathing. Playful dolphins swirl around
discarded fi shing nets and rope, becoming entangled.
Even mighty whales are no match for marine debris;
they, too, get wrapped up in abandoned fi shing lines,
nets, and ropes fl oating in the water. Victims of lost
fi shing gear may drown immediately, or drag the debris
around until they weaken and die.
Debris doesn’t just affect animals on the move; those
living anchored to the sea fl oor are also vulnerable. Tarps,
nets, tires, and other dangerous items, moved around
by ocean currents, scrape, smother, and break delicate
sea fans, sponges, coral, and other life on the ocean
fl oor or reefs. In one study of recovered derelict nets
and the sea life they had collected, a fi fth of the total
weight of debris found in nets was attributed to pieces
of coral the nets had broken off and scooped up.
Fishing nets abandoned in the water can travel the
sea over many years, trapping signifi cant numbers
of fi sh through a phenomenon known as “ghost fi shing.”
NORTHWESTERN HAWAIIAN ISLANDS
INTERNATIONAL COASTAL CLEANUP
16

Researchers off the coast of Newfoundland, for instance,
retrieved ten lost nets that in six months had accumulated
20,000 cod, a species already on the brink of collapse
because of overfi shing. Lost fi shing traps used to catch
crabs, lobsters, and octopuses become fatal prisons.
Traps in one Japanese bay caught and killed twice as many
octopuses as commercial fi shermen caught. In the
Chesapeake Bay and its tributaries, where the blue
crab population has crashed, every crab lost means
one step further away from recovery for a species that
provides economic support for entire communities.
Lost or cast-off fi shing gear also has indirect impacts on
wildlife when it transports species to ecosystems where they
don’t belong. In 2004, scientists reported the fi rst known
case of the Asian sea anemone colonizing the Hawaiian
Islands; abandoned fi shing gear likely gave the anemone
a ride. The impacts of these particular hitch-hikers are yet
to be discovered, but unwelcome transplants like them can
destroy habitat and introduce diseases. The arrival of a new
species in an ecosystem can critically affect the food supply
and interactions between predators and prey.
While these impacts may seem daunting, the fact remains
that marine debris is a problem we can manage if we all
take part in the solutions. Eliminating marine debris would
save the lives of countless ocean animals and countless
dollars lost in our tourism and fi shing industries.
CHANGING BEHAVIORS THAT CAUSE MARINE DEBRIS
S topping the fl ow of trash in the ocean
is diffi cult in part because changing
human behavior is so diffi cult. But the right
approach can make
a difference: On a
Florida fi shing pier,
a program launched
by Ocean Conservancy
and its partners is
successfully changing
actions that cause
great harm to wildlife:
Fishers are now
recycling used fi shing
line instead of discarding it where it can
get into the water and kill marine animals.
Volunteers talk directly with them to explain
the dangers and the option of recycling;
collection bins on the pier make recycling
easy. No single silver bullet can end the
marine debris problem, but programs like
this one offer hope. They can be replicated
in many locations, rippling out across the
globe to change the behaviors that put trash
in the water.
URUGUAY
2009 REPORT
17
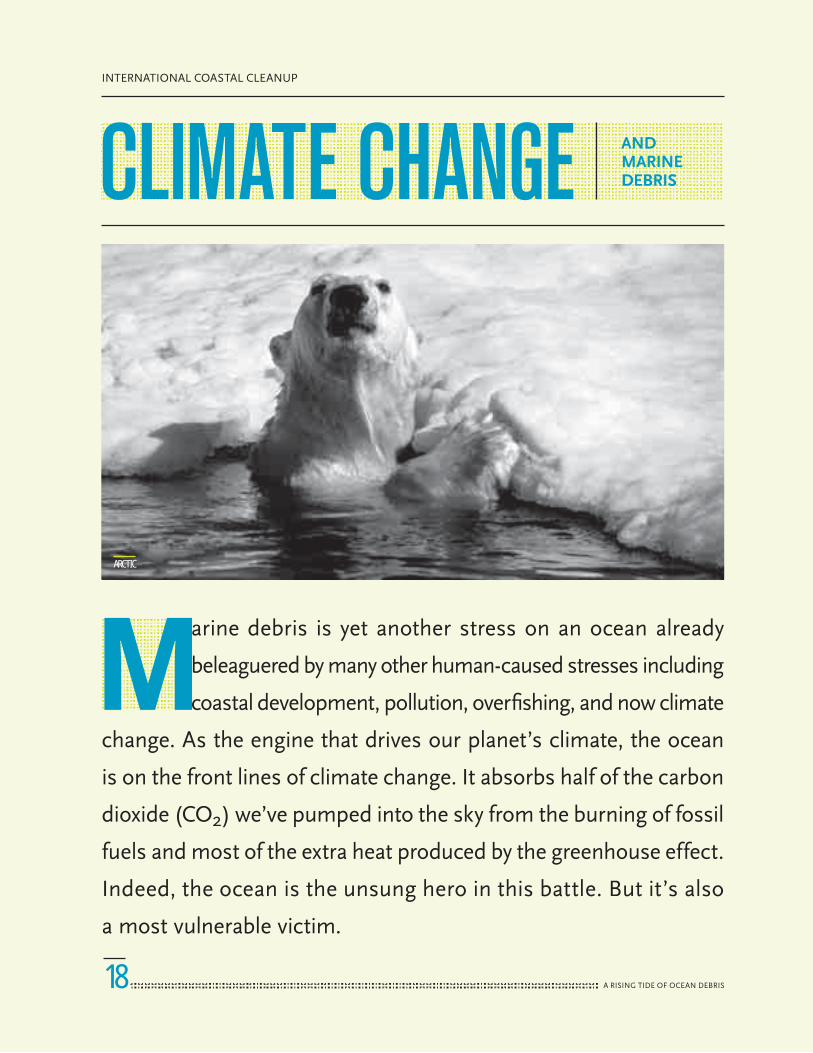
M arine debris is yet another stress on an ocean already
beleaguered by many other human-caused stresses including
coastal development, pollution, overfi shing, and now climate
change. As the engine that drives our planet’s climate, the ocean
is on the front lines of climate change. It absorbs half of the carbon
dioxide (CO2) we’ve pumped into the sky from the burning of fossil
fuels and most of the extra heat produced by the greenhouse effect.
Indeed, the ocean is the unsung hero in this battle. But it’s also
a most vulnerable victim.
AND MARINE DEBRIS
ARCTIC
INTERNATIONAL COASTAL CLEANUP
18

We are already seeing the effects of climate change: Melting
ice, the acidifi cation of ocean water, rising sea levels,
and extreme weather events are affecting marine life and
coastal communities right now. Even if we were to stop
all CO2 emissions today, we would not escape climate
change impacts set in motion from excess CO2 already
in the atmosphere—and in the ocean. The reality is that
the concentration of CO2 in the atmosphere has risen by 35
percent in the last 175 years, and the increase is accelerating.
The added burden of climate change on top of other
escalating stressors is creating a perfect storm of impacts
that threatens the future of ocean ecosystems and life.
Marine debris is one of the straws that together could
break the camel’s back—in this case, the ocean’s health.
A Sick, Stressed-out Ocean Needs to be Fully Resilient to Better Adapt to Climate Change By eliminating stresses including marine debris that
degrade the integrity and health of ocean ecosystems,
we can help give the ocean a fi ghting chance to adapt
to the impacts of ocean climate change. A healthier
ocean will be a more resilient ocean.
Think of the human body. When attacked by disease, its
resistance and ability to recover from other stresses and
diseases is diminished. Just as a person with emphysema
or pneumonia would be less likely than a healthy person
to survive working in a coal mine, an ocean compromised
by many ills is less likely to survive the challenges of
climate change.
In some places, reducing marine debris could be part
of the cure, increasing the odds that some ocean animals
and ecosystems can adapt. Human activities such as the
dumping of trash and debris, the discharge of pollutants
or excess fertilizers, overfi shing, and destruction of habitats
by coastal development all reduce the ocean’s resilience—its
ability to resist and recover from stresses. From wildlife like
endangered sea turtles and the Hawaiian monk seal to
biologically-rich ecosystems like coral reefs, life in the ocean
will be healthier, more resilient, and better able to adapt to
climate change in the absence of debris-related impacts.
CLIMATE CHANGE POLICY: ADVANCING ADAPTATION
S cientists tell us that to avoid severe impacts from
climate change, we need to keep the concentration
of CO2 in the atmosphere below 350 parts per million
(ppm)—but the level is already more than 385 ppm and
rising rapidly. Therefore, energy policy reform that leads
to the immediate and substantial reduction of greenhouse
gas emissions must be the cornerstone of legislative efforts
by the Congress and the Obama administration.
But reducing emissions is only
part of the solution for an ocean
that must adapt to changes
already set in motion. As Ocean
Conservancy President and
CEO Vikki Spruill testifi ed at the
fi rst-ever hearing on Capitol Hill
about the ocean’s role in climate
change, many species will be
unable to adapt fully because of the unprecedented
magnitude and speed of change. But we can make
a difference. We need strong, solid laws in place to support
ocean management that builds the resilience of ocean
systems and increases adaptation success. And that
includes laws to eliminate marine debris, which so
severely taxes the ocean and all the life in it. Adaptation
requires funding; that cost could be met through the sale
of carbon credits within the cap-and-trade system.
Climate change, the greatest environmental challenge
of our time, requires an enormous—and immediate—
response. Fortunately, the new administration and Congress
count climate change among their top priorities, and
awareness of the critical ocean-climate change connection
is growing in the halls of government. Climate change
knows no boundaries, and the United States has an
unequaled opportunity to lead global climate change
policy, including at the United Nations Climate Change
Conference in Copenhagen in December 2009, where
we can boost the odds that we will all be able to adapt
to a world made vastly different from the one we have
known. For more information, including the Congressional
testimony noted above, visit www.oceanconservancy.org.

Hawaiian monk seals—one of the most critically endan-
gered marine animals in the world—inhabit the remote
Northwestern Hawaiian Islands. These animals already face
what could be life-and-death threats from climate change:
Warming water may affect the fi sh, eels, and other life the
seals rely on for food, and rising sea levels will ultimately
inundate the beaches where they rest, give birth, and raise
young. With only about 1,200 Hawaiian monk seals alive
today and global climate change already closing in on their
environment, it is critical that we address threats from
marine debris to help protect this fragile population.
Major ocean currents deposit more than 52 metric tons
of debris in the Northwestern Hawaiian Islands every
year, most of it lost or abandoned fi shing gear. These
playful monk seals encounter discarded cups or other
containers in the water, or on the beach, and wind up
with trash stuck on their snouts, trash that keeps them
from feeding or even breathing. They explore old nets or
cast-off fi shing line, become entangled, and drown. Since
1998, the National Oceanic and Atmospheric Administration
(NOAA) and partners have worked together to remove more
than 100 metric tons of fi shing gear and other marine debris
from the Northwestern Hawaiian Islands. Getting rid
of dangerous debris helps keep this endangered species
healthier in the face of climate impacts.
Ecosystems need help, too. Coral reefs have been called the
rainforests of the sea. These extraordinary living systems
cover just two-tenths of one percent of the ocean fl oor, yet
are home to a quarter of all the ocean’s fi sh species. Coral
reefs offer recreation to humans as well as food and shelter
to fi sh. They also provide a buffer that protects many tropical
coastlines during severe storms. But climate change has
already exacted a toll: In the Caribbean, 80 percent of coral
reefs have died because of changes brought about by
warming water, excess nutrients washed into the ocean from
land, and overfi shing. Scientists predict that if carbon
emissions continue unabated, temperature rise and ocean
acidifi cation may lead to the death of most coral reefs
worldwide during this century. If any reefs do survive, they
will be the most resilient ones. It is our responsibility to
ensure they are as healthy as possible to face the future.
Marine debris compromises coral reef resilience by infl icting
physical injury. Nets, plastic sheets, and other large forms of
debris snag on coral reefs, breaking off living coral branches.
Studies have revealed signifi cant damage to delicate reefs
by old fi shing nets in the Northwestern Hawaiian Islands
and Australia. Piles of trash block sunlight essential to the
health of living coral. And toxic materials leaching from trash
in the water poison these ecosystems. By removing and
preventing marine debris, we are giving reefs a fi ghting
chance at survival and they, in return, will continue to
provide us with physical and spiritual nourishment that
are critical to our health and well-being.
GLOBAL CLIMATE CHANGEThe increase in carbon dioxide (CO2) and other greenhouse gases collecting in the atmosphere like a thickening blanket traps the sun’s heat and causes the planet to warm. Most of us have a pretty good understanding of CO2’s impact on the atmosphere and land, but many don’t yet realize that there are serious connections to the ocean, too, from warming water to changing ocean chemistry.
MITIGATIONAny human intervention that attempts to reduce the amount of greenhouse gases in the atmosphere or ocean.
ACIDIFICATIONAn increase in the acidity of the ocean caused by the increased absorption of carbon dioxide (CO2) from the atmosphere. Atmospheric CO2 comes from
the fossil fuels we burn and changes in land management.
ADAPTATION (NATURAL)The response of a biological or ecological system to environmental changes brought about by climate change.
ADAPTATION (SOCIAL)Any response by humans to climate change in order to reduce the negative impacts on communities, society, and economies.
ECOLOGICAL RESILIENCEA measure of how much stress an ecosystem can stand from pressures natural or manmade without undergoing fundamental changes that may be permanent and, from a human perspective, highly undesirable.
TERMS TO KNOW
INTERNATIONAL COASTAL CLEANUP
20

THE GREAT PACIFIC GARBAGE PATCH Will Climate Change Create More Trash Dumps at Sea?
I magine the open ocean, emblematic of Nature’s
wild and spectacular beauty, dominated by trash.
Unbelievable, right? Guess again. That ugly picture is
actually the reality in a signifi cant portion of the North
Pacifi c Ocean, where four major currents defi ne a large
area known as the North Pacifi c Subtropical Gyre,
a giant eddy of sorts. In one particular hot spot north
of the Hawaiian Islands, fl oating debris concentrates
where ocean currents and wind meet (see convergence
zone on map). This dynamic area of fl oating trash—
everything from toys, boots, and balloons to tiny plastic
particles—shifts location seasonally.
Though many people call this area the “Great
Pacifi c Garbage Patch,” that’s something of a misnomer;
while not a solid patch of trash, it does encompass
a huge amount of debris over a wide swath of ocean.
Birds and animals across the region become entangled
in this debris; their digestive tracts can become fatally
clogged when they eat it. One researcher found that
every one of 10,000 Laysan albatross chicks hatched
in a year on nearby Kure Atoll had ingested plastic
and other marine debris.
The more trash we allow into the ocean, the more the
concentration here grows year after year. The “Garbage
Patch” is just one of several big accumulations of trash
in the ocean. We don’t know how global climate change
may affect them, but one possibility is that this one may
shift closer to the Northwestern Hawaiian Islands,
carrying more debris towards their beaches. And that
could mean more entanglements of marine life like the
endangered Hawaiian monk seal.
Courtesy of NOAA Marine Debris Program
21
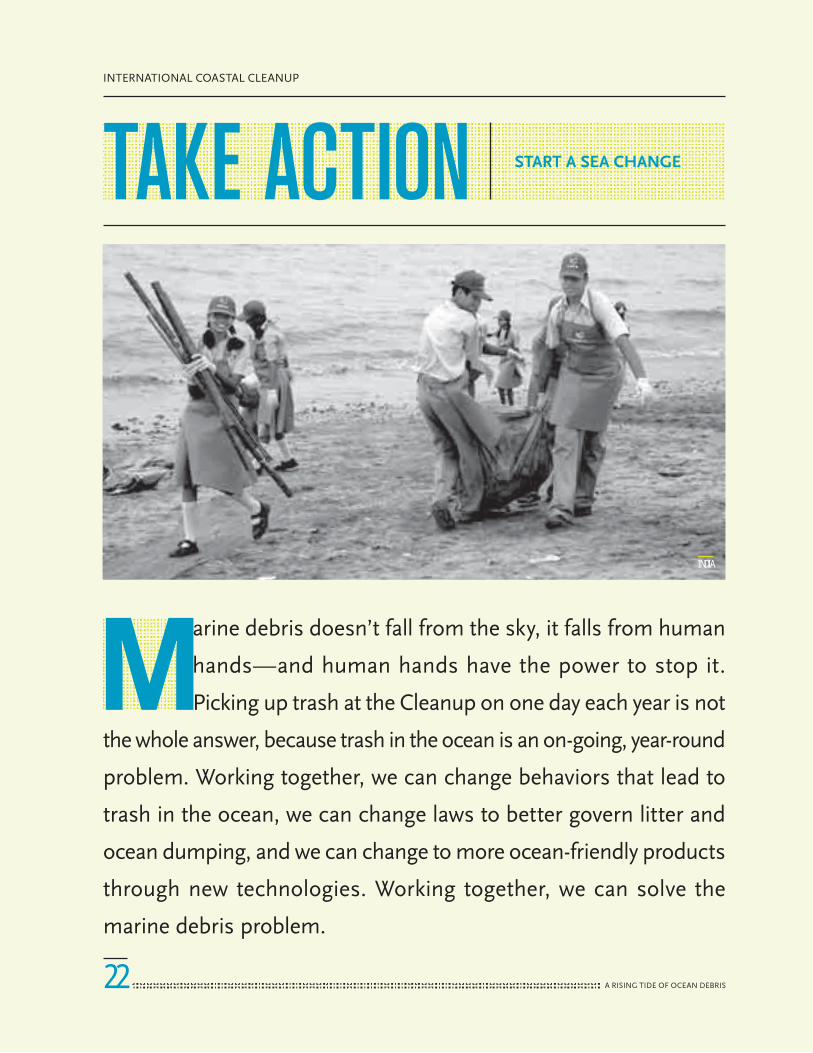
M arine debris doesn’t fall from the sky, it falls from human
hands—and human hands have the power to stop it.
Picking up trash at the Cleanup on one day each year is not
the whole answer, because trash in the ocean is an on-going, year-round
problem. Working together, we can change behaviors that lead to
trash in the ocean, we can change laws to better govern litter and
ocean dumping, and we can change to more ocean-friendly products
through new technologies. Working together, we can solve the
marine debris problem.
START A SEA CHANGE
INDIA
22
INTERNATIONAL COASTAL CLEANUP

CITIZENS AND CORPORATIONS ARE DEMANDING CHANGE AS NEVER BEFORE.
2Fund increased research on the sources and
impacts of marine debris. Understanding
the sources and impacts of marine debris
is integral to fi nding solutions that work
on a permanent basis. While data from volunteer
events like the Cleanup are helpful, they represent
only a snapshot of the debris problem. We need
science-based solutions, and therefore more
funding for scientifi c research that can help us
focus our attention on areas of greatest vulnerability
and target types of marine debris that are proving
most harmful. Research can also help us identify
debris-reduction techniques that provide solutions
for the long term.
RECOMMENDATIONS
1Expand public and private partnerships to
monitor and reduce marine debris. No longer
are conservation coalitions drawn just from
the rolls of government, foundations, and
nongovernmental organizations. Citizens and
especially corporations are demanding change
as never before. The mandate for corporate
sustainability is being driven directly from the
boardroom, and progressive corporations are key
to success. We must look for new and broader
opportunities to pull them into solution scenarios.
For instance, the National Oceanic and Atmospheric
Administration, Schnitzer Steel Hawaii Corporation,
Covanta Energy, and other public and private
organizations all support the “Nets-to-Energy”
program in Hawaii, which collects and burns lost
fi shing gear to get it out of the ocean and turn it into
electricity. The program has been replicated in New
England, where every ton of gear collected provides
enough electricity to heat a home for 25 days.
The Keep America Beautiful Cigarette Litter
Prevention Program, supported by funding from
Philip Morris USA, an Altria Company, encourages
smokers to change their behaviors and properly
dispose of cigarette butts, cigar tips, and packaging
—items that commonly wind up in the ocean now.
And the Disney Vero Beach Resort in Florida
stopped using plastic drinking straws (a top item
found during the state’s Cleanups) to make beaches
safer for nesting sea turtles and other wildlife.
CALIFORNIA
23
2009 REPORT

instituted pay-as-you-throw programs; a number
of these communities have a recycling rate of 60
percent, as compared to just over 30 percent from
non-pay-as-you-throw communities. The system
has economic rewards as well: In Fort Worth, Texas,
92 percent of residents pay less for garbage disposal
than they did under the old system. The city also
cut its waste management costs by 25 percent.
Then there is the old-fashioned solution—use
less stuff. People must be made aware of just
how much waste material—all of it potential
marine debris—we create in the wake of our
daily existence. Simply learning to cut back
on the amount of synthetic packaging we use
by refusing that plastic bag at the grocery store
or the foam sandwich carton at the take-out
counter can greatly reduce the sheer amount
of stuff in our world.
4Seek better technological solutions to
debris management and reduction. Human
ingenuity is an incredible thing. It has
already led to some of the breakthroughs
we need to reduce dangerous marine litter. The
ITW Hi-Cone company has not only reduced the
amount of plastic used in their six-pack holders
by 30 percent, but in the 1970s developed a
photodegradable version; the rings fl oat on the
water, and within days sunlight reduces their
strength by up to 75 percent so that if an animal
gets entangled, it can break away. Depending
on the season and intensity of the UV sunlight,
within weeks these rings will become completely
brittle and crumble in a strong wind or upon
contact. It took time, but by 1988 they were used
throughout the United States, and worldwide by
1990. More recently, innovations like new bottle
designs that use less material than traditional
shapes have entered the scene.
Biodegradable plastics under development include
those made from soy and corn. Polylactic acid (PLA)
can be processed on existing plastics equipment,
REDUCE, REUSE, RECYCLE: THE CONCEPT OF GOING GREEN STARTS WITH LIVING BLUE.
3Reduce, reuse, recycle. The concept of going
green starts with living blue—making daily
decisions with the ocean’s health in mind.
Behavioral changes like choosing products
that use less packaging or taking reusable bags to
the grocery store are critical to keeping trash out of
the ocean. Just one small step repeated by everyone
can make a world of difference for ocean habitats
and wildlife ranging from the largest whales to the
smallest sea snails.
Consider recycling. As much as we hear about
it, not nearly enough people have dedicated
themselves to sorting their recyclables. A signifi cant
portion of trash picked up on beaches during the
Cleanup could have been kept out of waterways
and the ocean through recycling. The EPA says
the United States generates the equivalent of 4.5
pounds of solid waste per person per day, yet we
recycle just 33.4 percent of it.
The EPA also estimates that Americans use
more than 90 billion plastic bags a year, with just
a fraction reaching recycling facilities. Many bags
end up in the ocean as marine debris. When Ireland
levied a fee on each plastic bag used by consumers,
single-use disposal bag consumption dropped by
more than 90 percent.
Especially effective in encouraging recycling
and waste reduction are “pay-as-you-throw” trash
pick-up programs that charge based on the amount
of trash thrown away. People are motivated to reduce
what they put out for collection at the curb when
their wallets are directly impacted. As of 2006,
more than 7,000 communities in 47 states have
24
INTERNATIONAL COASTAL CLEANUP

include strategies to minimize the negative
impacts climate change has on the ocean.
See www.oceanconservancy.org/climatechange
for more information.
6Engage in community efforts like the
International Coastal Cleanup. Events like
the Cleanup really do make a difference,
whether making the local beach or coastline
free of debris or raising awareness and empowering
employees or individuals to take action and support
a healthier, more resilient ocean. For more informa-
tion and to sign up as a volunteer for the next
International Coastal Cleanup on September 19,
2009, visit www.coastalcleanup.org.SEEK BETTER TECHNOLOGICAL SOLUTIONS TO DEBRIS MANAGEMENT AND REDUCTION.
which is certainly attractive to industries with
billions invested in infrastructure. These plastics
biodegrade in water and soil, and compost readily.
Currently, bioplastics cost more and may have
physical characteristics that don’t quite match those
of synthetics, but better versions that are stronger,
more durable, and more versatile are under
development. Where new technologies seem
too expensive on fi rst glance, we must weigh
aspects like price against hidden costs like waste
management, dead and injured animals, and
greenhouse gas emissions.
5Support the inclusion of comprehensive
ocean management in all climate change
initiatives. The ocean is the engine that
drives climate, and must be included
in all work to lessen climate change impacts.
The reduction of greenhouse gas emissions
is not enough to protect the ocean; we need
to reduce other human-caused stressors like
marine debris, so ocean life has a better chance
of adapting to climate change. People want
to do the right thing, and policy, a powerful
embodiment of public will, is an important
tool for success. Let your elected offi cials know
you want them to support legislation that will
protect our ocean for the long term. Encourage
legislators to put in place efforts to reduce marine
debris. From hometown regulations on waste
management to international laws on ocean
dumping, the ocean needs protection.
Citizens can actively support climate change
policies that protect the ocean. Government,
for its part, must lead with policy changes that
RUSSIA
25
2009 REPORT

The Coca-Cola Company has a vision: a world
where their packaging is no longer seen as
waste, but as a valuable resource for future
use. The international giant is hard at work
fi nding ways to improve the sustainability of its
packaging across the entire lifecycle. Partnering
with the Cleanup fi ts within their plan to encourage
collection efforts that bring used packaging back into
the recycling loop. This forward-thinking company
recognizes that cleanups are only part of the solution;
like Ocean Conservancy, Coca-Cola is dedicated to
keeping litter out of the world’s waterways all year long.
A Cleanup sponsor since 1995 and the lead sponsor
since 2005, Coca-Cola has not only stepped up its
direct support, but also provides a number of in-kind
contributions, including arranging for its strategic
thinkers to consult with Ocean Conservancy, helping
The Coca-Cola Company
WALKING THE TALK
SPONSORING PARTNERS
THE COCA-COLA COMPANY IS A DRIVING FORCE AND A STRONG PARTNER IN STARTING A SEA CHANGE.
us strengthen our online campaigns, expand our media
reach, and increase awareness about the Cleanup
and the problem of marine debris. Coca-Cola also
has developed a campaign within the company to
encourage participation in the Cleanup. In 2008,
Coca-Cola engaged over 50,000 people in 35 countries
across their worldwide system—company associates,
bottling partners, customers, and consumers—to help
clear beaches and waterways of debris.
The Coca-Cola Company sets an excellent example
for the kinds of holistic solutions we need to battle
marine debris. The company invests millions of
dollars annually to support the collection and recovery
of beverage packaging materials around the world,
and they use the recycled packaging materials to
produce more sustainable bottles and cans. In 1991,
Coca-Cola was the fi rst beverage company to use
recycled plastic in their packaging. Since that time,
they’ve led the industry in the global use of recycled
PET content. The company will soon open the world’s
largest bottle-to-bottle recycling plant in South
Carolina to recycle even more bottles. They also have
launched a line of clothing crafted from recycled
bottles; fi ve recycled bottles go into each t-shirt, and
the shirts help get out the recycling word by sporting
clever slogans like “I’m wearing post-consumer
waste.” All of this work sets a great example for the
kinds of solutions we need to fi ght marine debris.
COSTA RICA
26
INTERNATIONAL COASTAL CLEANUP
Bank of America, which has supported the
International Coastal Cleanup since 1991,
fully understands the ocean-climate change
connection. A leader in sustainable business
practices, Bank of America’s $20 billion, ten-year climate
change initiative champions green economic growth
through lending, investment, products and services,
and operations. In addition to contributing funds to the
Cleanup, the bank has embraced the chance to educate
its associates about climate change and its impacts on
the ocean; the volunteers of “Team Bank of America”
pitch in at Cleanup events across the United States
and draw in members of the larger local community.
Bank of America also supports Ocean Conservancy’s
Ocean Industries Initiative, which will help businesses
whose operations impact the ocean reduce their
greenhouse gas emissions; the bank provided seed
money for a pilot program aimed at improving the
carbon footprint of the Gulf of Mexico shrimp fi shery.
The success of the Cleanup is magnifi ed by the
signifi cant contributions of business partners like
Bank of America who provide not only critical funding
but also the leadership and know-how to help get the
job done. And that’s an investment in ocean health
that will pay dividends for years to come.
Bank of America
INVESTING IN CLIMATE CHANGE SOLUTIONS
THE COCA-COLA COMPANY“The Coca-Cola Company seeks out partners that not only address critical environmental issues but also look to develop solutions. This year, we mobilized over 50,000 volunteers from within our network to provide hands-on support in 35 countries as an active sponsor of the International Costal Cleanup.”
BANK OF AMERICA“Bank of America is proud to partner with Ocean Conservancy to restore the vitality of our ocean and waterways. This year’s International Coastal Cleanup provided a tangible way to fi ght for a thriving ocean and address climate change for our associates, who volunteer in Cleanups around the country.”
PHILIP MORRIS USA, AN ALTRIA COMPANY
“Philip Morris USA, an Altria Company, is committed to reducing the environmental impact of its business. We are proud to support Ocean Conservancy’s Cleanup through grants and volunteer activities that help reduce the amount of cigarette-butt litter in waterways.”
BRUNSWICK PUBLIC FOUNDATION
“Boaters long have been at the forefront of keeping our ocean and waterways healthy, valuing such a precious resource. It is the Brunswick Foundation’s honor to support Ocean Conservancy’s efforts to encourage environmentally responsible behavior on the water.”
DOW “Dow is proud to have sponsored the Cleanup efforts for more than 20 years. We value our partnership with an organization like Ocean Conservancy that is dedicated to developing the global solutions and public education needed to change the behaviors that cause marine debris.”
GLAD “The Glad Products Company, a subsidiary of the Clorox Company, is proud to supply Cleanup volunteers with its trash bags to remove marine debris from their local communities and support the important work being done by Ocean Conservancy.”
NATIONAL OCEANIC AND ATMOSPHERIC ADMINISTRATION (NOAA)
“The National Oceanic and Atmospheric Administration Marine Debris Program is proud to partner with Ocean Conservancy on the Cleanup. Our partnership goes beyond the Cleanup with our shared goal of eliminating marine debris that continues to have devastating impacts on marine life and habitat in the global environment.”
ORACLE“Oracle is proud to support the Cleanup to help preserve our beaches across the globe. Our partnership connects hundreds of Oracle employees with Cleanup projects that truly make a difference in the local community and reinforce our commitment to protecting the environment.”
The statements above recognize sponsoring partners who donate $50,000 or more to Ocean Conservancy to support the International Coastal Cleanup. For the complete list of sponsors, please see page 48.
HERE’S WHAT OUR SPONSORS SAY ABOUT THE CLEANUP
2009 REPORT

VOLUNTEER COORDINATORSCOORDINATORS ARE THE TRUE “SEA STARS” OF THE CLEANUP. They give their time and energy all year long, scouting out Cleanup sites, rallying volunteers, lining up sponsors, and organizing data collection. Their work is at the heart of this international movement.
2008 CLEANUP COUNTRY COORDINATORS
AMERICAN SAMOAPelema KoliseAmerican Samoa Environmental Protection Agency
ARGENTINADaniel RolleriAsociación ReCrear
BAHAMASAnita Knowles (Abaco)Friends of the Environment
Renamae Symonette, Erika Gates (Grand Bahama Island)Bahamas Ministry of Tourism
Tanya Moss (Nassau)Dolphin Encounters
BANGLADESHS. M. Muntasir MamunKewkradong
BARBADOSMichael ThompsonNational Conservation Commission
Osmond HarewoodCaribbean Youth Environmental Network
BELIZEHilberto RiverolThe Scout Association of Belize
BERMUDARobyn LarkinDolphin Quest
BRAZILLeonardo VianaLaboratório de Mastozoologia e Manejo de Fauna
BRITISH VIRGIN ISLANDSJasmine BannisConservation & Fisheries Department
CAMBODIAKoch SavathMinistry of Environment
CANADACarla Schuk (British Columbia)Vancouver Aquarium Marine Science Centre
Gay Wittrien (New Brunswick)The Green Network – ACAP Saint John
David Boyce (Prince Edward Island)Southeast Environmental Association
CAYMAN ISLANDSKim PisanoCayman Islands Tourism Association
CHILEChristian Cid, Héctor HuertaDIRECTEMAR
COLOMBIA Enriqueta HawkinsCORALINA
COSTA RICAGiovanna Longhi
CYPRUSAndreas DemetropoulosCyprus Wildlife Society
DOMINICATerry RaymondDominica Youth Environment Organisation
DOMINICAN REPUBLICHector Mota, Carolina GuisandeFundación Vida Azul
ECUADORJaime ParedesPrograma de Manejo de Recursos Costeros
Capt. Miguel Mosquera B., Sergio Bazan (Galapagos)Fundacion Ecologica Albatros
EGYPTMaha Youssry, Emad AdlyGhazala Hotels
GREECEConstantinos Triantafi llouHELMEPA
GRENADADr. Clare MorrallSt. George’s University
GUAMTom QuinataGuam Coastal Management Program
GUATEMALAMilthon Cárdenas, Marlon LopezEco Prodiver
GUYANATrevor BennGuyberNet
HONG KONGLisa ChristensenEcovision Asia
Thierry ChanGreen Council
INDIACaptain Rajan VirIndian Maritime Foundation
INDONESIAHani Taufi kYayasan JARI
AND
SPONSORS
INTERNATIONAL COASTAL CLEANUP
28

ISRAELRonen AlkalayMarine and Coastal Division – Ministry of the Environment
JAMAICACarlette FalloonJamaica Environmental Trust
JAPAN Yoshiko Ohkura, Azusa Kojima Japan Environmental Action Network
Edo Heinrich-Sanchez, Naoko Kiyan (Ryukyu Islands, Okinawa)Okinawa O.C.E.A.N.
KENYAFred SeweNairobi Keen Kleeners,Ltd.
MALAYSIAJesse Siew, Maizura MazlanThe Body Shop West Malaysia
MALTAVince AttardNature Trust (Malta)
MEXICO Alejandra López de Román (Tamaulipas)Club Regatas Corona, A.C.
Brady Wheatley (Baja)School for Field Studies
Kenia Castaneda Nevarez (Sonora)Intercultural Center for the Study of Deserts and Oceans
Lidia Silva Iniguez (Colima)Universidad de Colima
NETHERLANDS ANTILLES Mabel Nava (Bonaire)Sea Turtle Conservation Bonaire
Susan Hurrell (Saba)Saba Marine Park/Saba Hyperbaric Facility
Jadira Veen (St. Maarten)Sint Maarten Pride Foundation
NICARAGUASarah OtterstromPaso Pacifi co
NIGERIAPrince Ene Baba-OwohClean-Up Nigeria
NORWAYAlec RiedelInternational School of Stavanger
PANAMAJenny Echeverria, Angel CardenasAsociación Nacional para la Conservacion de la Naturaleza
PERUErika V. Pariamachi Medina, Arturo E. Alfaro MedinaVIDA – Instituto para la Proteccion del Medio Ambiente
PHILIPPINESGeronimo P. Reyes, Romeo B. TronoInternational Marinelife Alliance/Conservation International
PROJECT AWARE FOUNDATIONLauren Wiskerson, Jenny Miller Garmendia (Americas)
Joanne Marston (Asia Pacifi c)
Dominic Ziegler (Europe)
Cher Platt, Suzanne Pleydell (International)
Shuichi Kobayashi (Japan)
PUERTO RICOAlberto MartíScuba Dogs Society
REPUBLIC OF KOREASun Wook HongKorea Marine Rescue Center
SINGAPOREN. Sivasothi, Angeline TayRaffl es Museum of Biodiversity Research, NUS
SOUTH AFRICAJohn Kieser (Cape Town)Coastal Cleanup – South Africa
Wayne Munger (KwaZulu-Natal)KwaZulu-Natal Wildlife
ST. KITTS AND NEVIS Miriam Knorr (Nevis)Nevis Historical & Conservation Society
Randolph Edmead, Andy Blanchette (St. Kitts)Department of Physical Planning and Environment
ST. LUCIAMarcia DolorCaribbean Youth Environment Network
ST. VINCENT AND THE GRENADINESAndrew SimmonsJEMS Environmental Management Services
TAIWANTed ChangKuroshio Ocean Education Foundation
THAILANDVorasuntharosot VorapongPacifi c Plastics/Dow Chemicals
TRINIDAD AND TOBAGOZakiya Uzoma-WadadaCaribbean Network for Integrated Rural Development
TURKEYFiliz UykusuzTurkish Marine Environment Protection Association
TURKS AND CAICOS ISLANDSMichelle GardinerCleanup TCI
UNITED ARAB EMIRATESAhmed Bin Byat, Ibrahim Al-ZubiEmirates Diving Association
UNITED KINGDOMEmma SnowdenMarine Conservation Society
US VIRGIN ISLANDS Marcia Taylor (St. Croix)University of the Virgin Islands – VIMAS
Kristen Maize (St. John)Friends of Virgin Islands National Park
Lihla Noori (St. Thomas)University of the Virgin Islands – VIMAS
VENEZUELAErnesto Estevez, Janethe GonzalezFUDENA
VIETNAMThu Hue NguyenInternational Marine Alliance
2008 CLEANUP COUNTRY AND LOCATION SPONSORS
ARGENTINAYPFAsociacion Ribera NorteDaniel Eduardo ValdovinosReserva del PilarPrefectura La PlataClub Universotario Sede Punta LaraFernando Aguiar
BAHAMAS (Nassau)Aquapure WaterBahamas Experience Tours and TravelBahamas Waste Ltd.Caribbean Bottling Company – Coca-ColaCelebrations Party SuppliesDolphin Encounters Ltd.Island Wholesale Ltd.Ports InternationalNautilus WaterT&K Trash Removal
BELIZEBowen & Bowen Ltd.Protected Areas Conservation Trust (PACT)Augusto Quan Ltd.James Brodie & Co. Ltd.Jofi us Ltd.Belize Audubon SocietyBelize Waste Control Ltd.
29
2009 REPORT
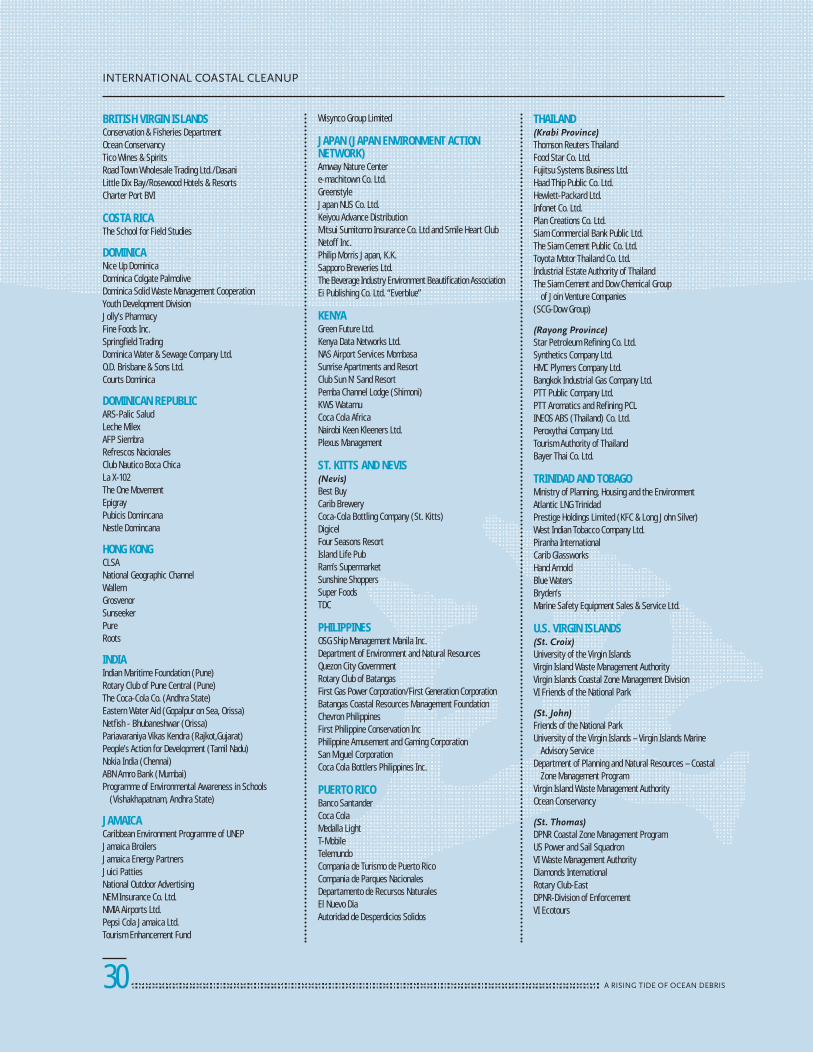
BRITISH VIRGIN ISLANDSConservation & Fisheries DepartmentOcean ConservancyTico Wines & SpiritsRoad Town Wholesale Trading Ltd./DasaniLittle Dix Bay/Rosewood Hotels & ResortsCharter Port BVI
COSTA RICAThe School for Field Studies
DOMINICANice Up DominicaDominica Colgate PalmoliveDominica Solid Waste Management CooperationYouth Development DivisionJolly’s PharmacyFine Foods Inc.Springfi eld TradingDominica Water & Sewage Company Ltd.O.D. Brisbane & Sons Ltd.Courts Dominica
DOMINICAN REPUBLICARS-Palic SaludLeche MilexAFP SiembraRefrescos NacionalesClub Nautico Boca ChicaLa X-102The One MovementEpigrayPubicis DomincanaNestle Domincana
HONG KONGCLSANational Geographic ChannelWallemGrosvenorSunseekerPureRoots
INDIAIndian Maritime Foundation (Pune)Rotary Club of Pune Central (Pune)The Coca-Cola Co. (Andhra State)Eastern Water Aid (Gopalpur on Sea, Orissa)Netfi sh - Bhubaneshwar (Orissa)Pariavaraniya Vikas Kendra (Rajkot,Gujarat)People’s Action for Development (Tamil Nadu)Nokia India (Chennai)ABN Amro Bank (Mumbai)Programme of Environmental Awareness in Schools
(Vishakhapatnam, Andhra State)
JAMAICACaribbean Environment Programme of UNEPJamaica BroilersJamaica Energy PartnersJuici PattiesNational Outdoor AdvertisingNEM Insurance Co. Ltd.NMIA Airports Ltd.Pepsi Cola Jamaica Ltd.Tourism Enhancement Fund
Wisynco Group Limited
JAPAN (JAPAN ENVIRONMENT ACTION NETWORK)Amway Nature Centere-machitown Co. Ltd.GreenstyleJapan NUS Co. Ltd.Keiyou Advance DistributionMitsui Sumitomo Insurance Co. Ltd and Smile Heart ClubNetoff Inc.Philip Morris Japan, K.K.Sapporo Breweries Ltd.The Beverage Industry Environment Beautifi cation AssociationEi Publishing Co. Ltd. “Everblue”
KENYAGreen Future Ltd.Kenya Data Networks Ltd.NAS Airport Services MombasaSunrise Apartments and ResortClub Sun N’ Sand ResortPemba Channel Lodge (Shimoni)KWS WatamuCoca Cola AfricaNairobi Keen Kleeners Ltd.Plexus Management
ST. KITTS AND NEVIS (Nevis)Best BuyCarib BreweryCoca-Cola Bottling Company (St. Kitts)DigicelFour Seasons Resort Island Life PubRam’s SupermarketSunshine ShoppersSuper FoodsTDC
PHILIPPINESOSG Ship Management Manila Inc.Department of Environment and Natural ResourcesQuezon City GovernmentRotary Club of BatangasFirst Gas Power Corporation/First Generation CorporationBatangas Coastal Resources Management FoundationChevron PhilippinesFirst Philippine Conservation IncPhilippine Amusement and Gaming CorporationSan Miguel CorporationCoca Cola Bottlers Philippines Inc.
PUERTO RICOBanco SantanderCoca ColaMedalla LightT-MobileTelemundoCompania de Turismo de Puerto RicoCompania de Parques NacionalesDepartamento de Recursos NaturalesEl Nuevo DiaAutoridad de Desperdicios Solidos
THAILAND(Krabi Province)Thomson Reuters ThailandFood Star Co. Ltd.Fujitsu Systems Business Ltd.Haad Thip Public Co. Ltd.Hewlett-Packard Ltd.Infonet Co. Ltd.Plan Creations Co. Ltd.Siam Commercial Bank Public Ltd.The Siam Cement Public Co. Ltd.Toyota Motor Thailand Co. Ltd.Industrial Estate Authority of Thailand The Siam Cement and Dow Chemical Group
of Join Venture Companies(SCG-Dow Group)
(Rayong Province)Star Petroleum Refi ning Co. Ltd.Synthetics Company Ltd. HMC Plymers Company Ltd.Bangkok Industrial Gas Company Ltd.PTT Public Company Ltd. PTT Aromatics and Refi ning PCLINEOS ABS (Thailand) Co. Ltd.Peroxythai Company Ltd.Tourism Authority of Thailand Bayer Thai Co. Ltd.
TRINIDAD AND TOBAGOMinistry of Planning, Housing and the EnvironmentAtlantic LNG TrinidadPrestige Holdings Limited (KFC & Long John Silver)West Indian Tobacco Company Ltd.Piranha InternationalCarib GlassworksHand ArnoldBlue WatersBryden’sMarine Safety Equipment Sales & Service Ltd.
U.S. VIRGIN ISLANDS (St. Croix)University of the Virgin IslandsVirgin Island Waste Management AuthorityVirgin Islands Coastal Zone Management DivisionVI Friends of the National Park
(St. John)Friends of the National ParkUniversity of the Virgin Islands – Virgin Islands Marine
Advisory ServiceDepartment of Planning and Natural Resources – Coastal
Zone Management ProgramVirgin Island Waste Management AuthorityOcean Conservancy
(St. Thomas)DPNR Coastal Zone Management ProgramUS Power and Sail SquadronVI Waste Management Authority Diamonds InternationalRotary Club-EastDPNR-Division of EnforcementVI Ecotours
INTERNATIONAL COASTAL CLEANUP
30

2008 CLEANUP US COORDINATORS
ALABAMAAmy King (ADCNR), Spencer Ryan (PALS)ADCNR State Lands Division Coastal Section
ALASKACachet Garret
ARIZONAMary Lynn Kelly, Kellie GutridgeArizona Clean & Beautiful
CALIFORNIAEben Schwartz, Chris (Christiane) ParryCalifornia Coastal Commission
CONNECTICUTKierran BroatchSave the Sound, a program of Connecticut Fund
for the Environment
DELAWAREJennifer HallDelaware Department of Natural Resources
& Environmental Control
DISTRICT OF COLUMBIADawn Terrell
FLORIDASeth GodfreyOcean Conservancy
GEORGIAHarold HarbertDepartment of Natural Resources
HAWAIIChristine WoolawayFriends of Honolulu Parks & Recreation
ILLINOISFrances Canonizado, Stephanie SmithAlliance for the Great Lakes
INDIANAFrances CanonizadoAlliance for the Great Lakes
KANSASJennifer Clay
LOUISIANABenjamin F. Goliwas Sr.HomePortNewOrleans.Org
MAINETheresa Torrent-EllisMaine Coastal Program – Maine State Planning Offi ce
MARYLANDNadine Miller (Assateague)Assateague Coastal Trust
Geri Schlenoff (Baltimore)
MASSACHUSETTSKristin Uiterwyk, Dennis LeighUrban Harbors Institute – Umass Boston
MICHIGANJamie CrossAlliance for the Great Lakes
MINNESOTASarah EricksonGreat Lakes Aquarium
MISSISSIPPILauren ThompsonMississippi Department of Marine Resources
MONTANAKaren McKinnonHelena Scuba
NEBRASKAJane PolsonKeep Nebraska Beautiful
NEVADAMadonna DunbarIncline Village General Improvement District
Waste Not Programs
NEW HAMPSHIREJen KennedyBlue Ocean Society for Marine Conservation
NEW JERSEYMaureen SalvestriniAlliance for a Living Ocean
Carl GuastaferroClean Ocean Action
Mary SmithNew Jersey Department of Environmental Protection
NEW YORKBarbara Cohen, Don ReipeAmerican Littoral Society
Volunteer Spotlight
JANE POLSON, NEBRASKA
J ane Polson, executive director of Keep Nebraska Beautiful, has served
as her state’s Cleanup coordinator for nine years. Like many coordinators,
she came to the Cleanup by way of her full-time job, which includes working
to eliminate marine debris. She admits that she has to educate people
constantly about how the Cleanup isn’t just for coastlines, but for all
waterways, and has a ready answer when asked why a landlocked state
would participate: “You have recreational waters in every state, whether
you’re in California or Nebraska. We have a lot of rivers and lakes we want to
protect, and since we know that more than 50 percent of debris in ocean
waters comes from inland states, we’re just as protective as coastal states.”
Polson’s organization is a state affi liate of Keep America Beautiful; local
affi liates across Nebraska serve as site coordinators and help recruit
volunteers and run individual events. Polson downplays her role, and says
the site coordinators and volunteers make the Cleanup happen: “I’m amazed
that people continue year after year; it is such hard work. And people lead
such busy lives that they are truly giving precious time. It says a lot about how
much they care for the environment.” Polson says the international aspect
has a powerful draw. “They know that people all around the world are doing
the very same thing, and that’s a neat feeling, to know people everywhere are
working for the same cause: the ocean.”
31
2009 REPORT

NORTH CAROLINAJudy BolinNorth Carolina Big Sweep Statewide Headquarters
NORTH DAKOTARandy KraftSCUBA One
OHIOJill Woodyard, Linda ZmudzinskiOhio Lake Erie Commission
OKLAHOMATom RhodesGrand Divers Supply
OREGONPamela SerySOLV
PENNSYLVANIALeni HerrVerizon TelecomPioneers
PROJECT AWARE FOUNDATIONLauren Wiskerson, Jenny Miller Garmendia (Americas)
RHODE ISLANDEugenia Marks, July LewisAudubon Society of Rhode Island
SOUTH CAROLINASusan Ferris Hill (coastal)South Carolina Sea Grant Consortium
Bill Marshall (inland)Land, Water and Conservation Division
SOUTH DAKOTADennis LivelyHigh Plains Diving & Mick’s Scuba Center
TENNESSEEMichael Hughes
TEXASReneé TuggleTexas General Land Offi ce Texas Adopt-A-Beach Program
UTAHKristen BonnerThe Living Planet Aquarium
VERMONTJames Ferro
VIRGINIAKatie RegisterClean Virginia Waterways – Longwood University
WASHINGTONJoan Hauser-Crowe
WISCONSINKae DonLevy
2008 CLEANUP US AND DISTRICT OF COLUMBIA SPONSORS
ALABAMAADCNR State Lands, Coastal SectionAlabama PALSBaldwin County CommissionBebo’s Car WashExxonMobilHonda Manufacturing of Alabama LLCAlabama Department of TransportationAlabama Gulf Coast CVBALFABaldwin EMC
ARIZONAArizona Clean and Beautiful
CALIFORNIAPresenting Sponsor: Whole Foods MarketWhale Sponsor: Crystal GeyserPelican Sponsor: OracleSee’s CandiesKPMGNature’s PathOrganic ValleyNatracareAubrey OrganicsPeet’s Coffee & Tea
Volunteer Spotlight
JOHN KIESER, SOUTH AFRICA
J ohn Kieser logged more than 18,000 miles driving across South Africa
last year for Cleanup-related meetings, from the Orange River to the
province of Kwazulu-Natal. His dedication to the job of Cleanup Coordinator
began while he was working for the South African government. When John left
the Department of Environmental Affairs and Tourism three years ago, the
plastics and waste industries along with retail grocery chain Pick n Pay asked
if he would make sure the Cleanup continued, both on the coast and
inland—and so he has, with boundless enthusiasm needed for such a big
job. Cape Town alone produces more that 3.5 million tons of waste annually,
he says, and recycling is not yet widespread. “The beaches are in terrible
shape from litter,” he observes.
John enjoys the fact that the Cleanup revolves around a very positive
atmosphere of community involvement. Restaurant owners who observed
hard-working volunteers invited them in at day’s end for refreshments.
When the ferry to Robben Island broke down, a local charter company
stepped up to offer a large boat to transport volunteers, and they’re already
onboard for next year. School children—for whom water pollution is part of
the curriculum—fl ock to Cleanup sites every year. Companies sign up their
entire staffs. And John points out that the Cleanup has infl uenced other
exciting programs. Thirty-eight schools on the western Cape are involved in
beach monitoring through an Adopt-a-Beach program, and John helps raise
litter awareness at major sporting events like the annual Argus-Cape Town
cycle tour. A government anti-poverty program pays poor people to clean
up litter. But none of this progress could happen without the energy and
ideas of coordinators like John.
32
INTERNATIONAL COASTAL CLEANUP

CALIFORNIA (PROJECT AWARE FOUNDATION)Ritz-Carlton Laguna NiguelSt. Regis Monarch BeachCity of Dana Point Water QualityCostcoJack’s SurfboardsJack’s RestaurantWyland FoundationMcBeth Foundation
CONNECTICUTPatagonia of WestportKayak for a Cause
DELAWAREDelmarva PowerEnergizer Personal CareAccomack County, VirginiaAssateague Coastal TrustAssateague Island National Seashore – National Park ServiceChincoteague Chamber of CommerceChincoteague National Wildlife Refuge – US Fish
& Wildlife ServiceChincoteague Volunteer Fire CompanyCity of Salisbury, MarylandClean Ocean Action Beach Sweeps
DISTRICT OF COLUMBIAThe Coca-Cola CompanyWhole FoodsGingko GardensFrager’s HardwareCaribou Coffee (Logan Circle)
FLORIDAWalt Disney WorldPublix Super Markets Charities97X WSUN Tampa Bay
GEORGIAGeorgia PowerThe Coca-Cola CompanyOglethorpe Power CorporationBalch & Bingham LLPEnvironmental Planning Specialists Inc.Jones DayKodakMead WestvacoSutherland
ILLINOISBrunswick Public FoundationITW Hi-ConeThe Field Foundation of Illinois Inc.Grand Victoria FoundationThe Searle Funds at the Chicago Community TrustIllinois Environmental Protection AgencyHome DepotNorthwestern CutleryWhole FoodsChicago Department of Environment-Chicago Conservation
CorpsPeggy Notebaert Nature MuseumArgo TeaGoogleIndiana
INDIANALake Michigan Coastal ProgramNiSourceHome DepotNorthwestern CutleryWhole FoodsPeggy Notebaert Nature MuseumArgo TeaGoogleShaw’s CrabhouseStarbucks
KANSASBlack & VeatchCorporate Woods, Overland Park, KSCrittenton CenterOverland Park Department of Parks and Recreation
MAINEPenmor LithographersRonn OrensteinOcean Conservancy
MARYLANDThe Coca-Cola Company (Hanover)Home Depot (Golden Ring Road, Rosedale)Wal-Mart (Golden Ring Road, Rodedale)Food Lion Supermarket (Hyde Park Rd., Essex)Sam’s Club of TimoniumWhole Foods Market (Mt. Washington)State Farms Insurance CompanyBeacon Hill Sports (Cockeysville)Sue Holmes, 2nd to None, BaltimoreB&T Hardware, Essex
MASSACHUSETTSBank of AmericaHMH Trade and Reference PublishersWeston SolutionsTronex BrandCape Cod Potato ChipsGarden Club of HinghamQuest Diagnostics
MICHIGANMichigan Department of Environmental Quality
Coastal Management ProgramNational Oceanic and Atmospheric AdministrationFrederick S. Upton FoundationJohnson Controls Care & Share ProgramShaw and Betty Walker FoundationConsumers Energy FoundationJoe’s Sporting Goods of St. Paul, MNMN-DNR Adopt-a-River ProgramGarmin
NEBRASKANebraska Department of Environmental QualityNew JerseyNYMEX FoundationAvedaUnited Teletech FinancialVerizonShop RiteAtlantic City Electric
NEW YORK
New York City Environmental Fund/Hudson River FoundationDreyfus FoundationNational Grid FoundationJosh & Judy WestonNFW Foundation/Long Island Sound Futures FundCon EdisonFlorida Power & Light EnergyAltriaNew York City Department of Environmental ProtectionRichmond County Savings FoundationPatagoniaLittauer FoundationMannington MillsQuebec Labrador Foundation
NORTH CAROLINAN.C. Department of TransportationPhilip Morris USAReynolds AmericanDuke PowerFirst Citizens BankWRAL-TV 5WGHP Fox 8WLOS-TV 13WNCT-TV 9WWAY-TV 3
PENNSYLVANIAVerizon TelecomPioneers LH Kinnard Chapter #7Country FairErie Times – News in EducationLord CorporationWaste Management Inc.Gannon UniversityTyler Mountain WaterShaver’s Creek Environmental CenterClearWater ConservancyBlue Mountain Outfi tters
RHODE ISLANDABC 6Audubon Society of Rhode IslandBJ’s Wholesale Club, Inc.Dunkin’ DonutsFidelity InvestmentsGEM Plumbing & HeatingNational GridRhode Island Bridge & Turnpike AuthorityRhode Island Mobile Sportfi shermenWashington Trust
TEXASShell Oil CompanyRowan Companies, Inc.LyondellBasellExxonMobilHalliburton
2009 REPORT
33

THE MARINE DEBRIS INDEXTHE MARINE DEBRIS INDEX presents state-by-state and country-by-country data about marine debris collected and tallied by volunteers around the world on one day each September at the International Coastal Cleanup.
Methodology and Research NotesOcean Conservancy, in conjunction with its US and international volunteer coordinators, has collected data during the International Coastal Cleanup since 1986 within the US, and since 1989 internationally. From 1986 through 2000, Cleanup volunteers tallied debris items on standardized data cards developed and provided by Ocean Conservancy. During this time, debris was categorized by the type of material. In 2001, Ocean Conservancy revised and simplifi ed the data card to include 42 specifi c debris items and groupings related to fi ve debris-producing activities and sources. The new groupings identify the behavior associated with the debris’ presence. In 2008, Ocean Conservancy decided to tally paper and plastic bags separately for a total of 43 items listed. Totals for each site are mailed, emailed, and faxed to Ocean Conservancy, or are entered into Ocean Conservancy’s secure Online Data Collection and Reporting Tool by the Cleanup coordinator for the country, location, or US state. All data sent to Ocean Conservancy and not entered online by the coordinator are entered into the online tool by Ocean Conservancy staff. The result is a unique global, online database of debris information collected from Cleanup sites around the world.
DATA ANALYSISOcean Conservancy staff analyzes data in-house. Data are broken down by country, location (including islands), and US states using reports generated by the Online Data Collection and Reporting Tool. Country, location, and US state geographic designations are made using the CIA World Factbook, https://www.cia.gov/library/publications/the-world-factbook/geos/uk.html. Data are also analyzed by regions, which are determined according to the United Nations Statistical Division, http://unstats.un.org/unsd/methods/m49/m49regin.htm. A location identifi ed in the Marine Debris Index is a geographic area that is governed by a country
but is located in a different geographic area than the governing country (for example, the Netherlands Antilles are governed by the Netherlands, but are located in a different geographic area than the governing country). These geographic designations do not imply Ocean Conservancy’s opinion of the legal status of any country, territory, or location (including islands), or concern the delimitation of its boundaries.
LIMITATIONS OF THE DATAData are collected on a single day by volunteers—not by paid staff or researchers—in more than 6,485 sites and locations around the world. Ocean Conservancy produces data cards in six languages; there could be a language barrier for some volunteers. Data for pounds and miles are sometimes estimated by volunteers (see terminology). The data represented in this report are only what was shared with Ocean Conservancy, and totals could be higher if all locations reported in. Weather events can impact planned events and may decrease data return for a certain country, location, or US state.
INTERPRETATION OF THE DATAThe collected data is a snapshot of what was removed from a certain location, on a certain day, by volunteers. The data provide the most comprehensive and measurable global snapshot of the world’s marine debris, as well as a breakdown of sources and debris items found in US states, countries, locations, and regions of the world. Due to the large sample and nature of the collection, the data provide a base for other studies. This valuable information is an effective tool for educating the public, business, industry, and government offi cials about the presence of marine debris and how and where to take specifi c actions.
FOR TERMINOLOGY SEE PAGE 47
INTERNATIONAL COASTAL CLEANUP
34

COUNTRY AND LOCATION ARGENTINA ARUBA AUSTRALIA AUSTRIA BAHAMAS BAHRAIN BANGLADESH
ISLAND (IF AVAILABLE) NASSAU
SHORELINE & RECREATIONAL ACTIVITIES
Bags (Paper) 50 88 396 9 1,245 77 604
Bags (Plastic) 180 79 1,158 31 2,630 126 407
Balloons 5 5 82 0 281 11 44
Beverage Bottles (Plastic) 30 234 766 32 2,433 79 397
Beverage Bottles (Glass) 57 140 1,268 34 3,802 53 221
Beverage Cans 15 264 801 35 5,054 87 543
Caps, Lids 5 199 1,334 20 2,438 64 841
Clothing, Shoes 10 42 231 11 1,259 4 159
Cups, Plates, Forks, Knives, Spoons 27 379 417 9 3,621 52 2,513
Food Wrappers/Containers 24 212 1,172 11 3,297 55 9,643
Pull Tabs 0 5 113 2 222 14 298
6-Pack Holders 4 10 45 3 161 0 0
Shotgun Shells/Wadding 0 0 22 0 116 0 0
Straws, Stirrers 71 91 847 1 1,768 85 1,587
Toys 0 10 48 11 864 0 53
Total 478 1,758 8,700 209 29,191 707 17,310
OCEAN/WATERWAY ACTIVITIES
Bait Containers/Packaging 0 0 295 1 160 34 23
Bleach/Cleaner Bottles 0 14 11 2 303 29 9
Buoys/Floats 0 5 31 1 55 0 42
Crab/Lobster/Fish Traps 0 0 10 0 150 1 68
Crates 0 2 3 0 80 0 0
Fishing Line 0 22 917 3 167 6 53
Fishing Lures/Light Sticks 0 5 234 0 76 0 4
Fishing Nets 0 1 30 1 121 8 107
Light Bulbs/Tubes 0 0 7 0 63 0 12
Oil/Lube Bottles 0 6 3 0 329 16 17
Pallets 0 2 0 1 99 0 0
Plastic Sheeting/Tarps 0 0 18 0 673 3 172
Rope 0 15 177 3 424 17 118
Strapping Bands 0 6 22 10 140 3 16
Total 0 78 1,758 22 2,840 117 641
SMOKING-RELATED ACTIVITIES
Cigarettes/Cigarette Filters 734 231 2,314 3 1,273 90 10,338
Cigarette Lighters 2 3 70 0 333 7 62
Cigar Tips 0 16 59 11 404 0 4
Tobacco Packaging/Wrappers 51 10 302 0 447 0 487
Total 787 260 2,745 14 2,457 97 10,891
DUMPING ACTIVITIES
Appliances (Refrigerators, Washers, etc.) 1 0 15 0 219 0 0
Batteries 0 8 22 0 267 14 102
Building Materials 39 19 160 43 3,611 76 23
Cars/Car Parts 2 0 38 1 213 0 0
55-Gallon Drums 0 0 0 0 36 0 0
Tires 1 3 9 1 250 0 11
Total 43 30 244 45 4,596 90 136
MEDICAL/PERSONAL HYGIENE
Condoms 3 24 38 0 388 0 38
Diapers 15 24 11 0 316 0 6
Syringes 0 2 10 0 51 0 31
Tampons/Tampon Applicators 4 2 27 0 137 0 0
Total 22 52 86 0 892 0 75
MARINE DEBRIS ITEM TOTALS 1,330 2,178 13,533 290 39,976 1,011 29,053

BARBADOS BELGIUM BELIZE BERMUDA BRAZIL BRITISH VIRGIN ISLANDS
BRITISH VIRGIN ISLANDS
BRITISH VIRGIN ISLANDS
BRITISH VIRGIN ISLANDS
COOPER ISLAND TORTOLA VIRGIN GORDA TOTAL
102 0 2,411 257 11,444 0 160 0 160
434 67 7,118 397 24,373 10 871 0 881
12 25 456 17 786 0 6 0 6
414 248 6,364 339 11,486 10 3,384 24 3,418
189 120 2,278 829 6,429 30 1,628 24 1,682
78 116 1,167 283 10,243 20 1,109 0 1,129
1,234 25 4,612 854 16,391 10 995 2,000 3,005
139 69 1,628 121 2,296 10 249 40 299
244 54 3,156 392 9,911 0 1,233 202 1,435
300 122 1,838 554 10,023 0 1,048 60 1,108
8 67 369 27 1,747 0 98 0 98
77 204 147 50 2,940 10 50 60 120
0 0 19 3 60 0 0 0 0
219 107 1,233 441 9,347 0 396 30 426
60 28 841 45 1,223 0 40 0 40
3,510 1,252 33,637 4,609 118,699 100 11,267 2,440 13,807
31 6 47 13 138 0 28 24 52
109 29 140 20 1,316 0 29 0 29
119 2 298 28 526 5 56 20 81
2 1 29 0 104 0 0 4 4
56 8 35 12 105 0 16 0 16
49 25 48 76 402 0 12 202 214
7 3 157 5 276 0 10 42 52
149 2 17 5 151 0 6 60 66
13 8 69 5 207 0 11 0 11
50 15 343 25 634 0 115 18 133
112 11 19 3 2,071 0 6 50 56
13 10 73 41 412 0 4 80 84
520 31 110 163 800 0 263 40 303
66 11 110 36 245 0 66 120 186
1,296 162 1,495 432 7,387 5 622 660 1,287
30 219 669 6,109 17,565 0 994 0 994
16 46 113 63 379 0 13 50 63
81 98 170 51 645 0 0 0 0
11 224 195 190 1,348 0 19 0 19
138 587 1,147 6,413 19,937 0 1,026 50 1,076
10 1 39 5 282 0 19 10 29
18 51 77 16 446 0 8 2 10
168 105 142 101 1,997 0 380 0 380
38 22 85 19 311 0 54 0 54
5 0 1 0 42 0 2 0 2
35 48 118 4 255 0 12 2 14
274 227 462 145 3,333 0 475 14 489
36 3 86 12 597 0 21 0 21
14 6 215 24 539 0 11 8 19
17 0 117 2 153 0 2 12 14
3 24 25 8 182 0 2 8 10
70 33 443 46 1,471 0 36 28 64
5,288 2,261 37,184 11,645 150,827 105 13,426 3,192 16,723
MARINE DEBRIS BREAKDOW
N BY COUNTRIES AND LOCATIONS (AND ISLANDS IF AVAILABLE)
35

COUNTRY AND LOCATION CANADA CAYMAN ISLANDS CHILE CHINA COLOMBIA COOK ISLANDS COSTA RICA
ISLAND (IF AVAILABLE)
SHORELINE & RECREATIONAL ACTIVITIES
Bags (Paper) 24,439 0 3,612 714 104 48 495
Bags (Plastic) 1,764 24 12,499 897 141 468 1,595
Balloons 5,758 0 231 24 2 0 39
Beverage Bottles (Plastic) 37,503 30 6,522 834 147 654 2,679
Beverage Bottles (Glass) 32,061 15 3,966 311 124 256 355
Beverage Cans 44,092 37 3,702 19 134 688 605
Caps, Lids 65,749 29 7,675 431 200 208 1,589
Clothing, Shoes 11,124 6 904 256 296 126 835
Cups, Plates, Forks, Knives, Spoons 42,219 41 1,835 145 48 612 1,657
Food Wrappers/Containers 106,911 17 7,243 1,412 614 1,312 1,552
Pull Tabs 10,800 0 399 189 1 0 120
6-Pack Holders 3,609 0 374 14 4 18 231
Shotgun Shells/Wadding 4,660 0 119 0 2 0 43
Straws, Stirrers 27,100 16 1,658 212 136 214 543
Toys 7,029 0 644 38 32 2 606
Total 424,818 215 51,383 5,496 1,985 4,606 12,944
OCEAN/WATERWAY ACTIVITIES
Bait Containers/Packaging 3,562 2 70 253 122 0 25
Bleach/Cleaner Bottles 1,118 0 300 19 11 2 42
Buoys/Floats 3,276 0 416 104 2 0 26
Crab/Lobster/Fish Traps 1,597 0 61 10 0 2 3
Crates 303 0 121 15 0 0 1
Fishing Line 3,267 14 248 26 102 2 25
Fishing Lures/Light Sticks 1,065 5 129 0 56 0 3
Fishing Nets 1,112 0 194 229 21 2 20
Light Bulbs/Tubes 576 0 122 31 0 0 7
Oil/Lube Bottles 1,432 0 458 36 5 2 59
Pallets 342 0 187 64 0 0 8
Plastic Sheeting/Tarps 4,376 0 624 64 8 0 14
Rope 21,742 2 2,279 137 102 20 58
Strapping Bands 4,546 0 290 26 0 6 6
Total 48,314 23 5,499 1,014 429 36 297
SMOKING-RELATED ACTIVITIES
Cigarettes/Cigarette Filters 323,706 0 18,048 10,872 5 226 1,001,337
Cigarette Lighters 3,863 0 804 118 0 26 1,057
Cigar Tips 15,405 0 5,415 12 0 0 23
Tobacco Packaging/Wrappers 16,568 0 3,249 112 15 64 1,336
Total 359,542 0 27,516 11,114 20 316 1,003,753
DUMPING ACTIVITIES
Appliances (Refrigerators, Washers, etc.) 494 0 51 2 2 16 41
Batteries 1,431 0 1,069 31 7 4 262
Building Materials 16,595 0 1,177 44 13 20 31
Cars/Car Parts 4,054 0 70 1 2 2 50
55-Gallon Drums 136 0 14 0 0 0 4
Tires 1,272 0 172 6 91 10 14
Total 23,982 0 2,553 84 115 52 402
MEDICAL/PERSONAL HYGIENE
Condoms 2,939 0 660 9 4 2 85
Diapers 1,026 0 1,027 10 4 12 62
Syringes 898 0 35 28 0 0 13
Tampons/Tampon Applicators 3,765 0 180 27 5 16 65
Total 8,628 0 1,902 74 13 30 225
MARINE DEBRIS ITEM TOTALS 865,284 238 88,853 17,782 2,562 5,040 1,017,621
MAR
INE
DEBR
IS B
REAK
DOW
N BY
COU
NTRI
ES A
ND L
OCAT
IONS
(AND
ISLA
NDS
IF A
VAIL
ABLE
)
36

CROATIA CYPRUS DENMARK DOMINICA DOMINICAN REPUBLIC EAST TIMOR ECUADOR EGYPT ESTONIA
40 124 0 755 5,327 14 414 142 0
70 1,175 1 2,198 10,754 38 1,354 1,409 10
3 6 0 67 1,096 0 53 12 0
156 520 1 9,461 31,473 62 850 1,389 30
87 280 7 1,116 6,631 18 358 661 10
19 468 4 2,017 4,056 18 194 786 20
3 1,034 0 560 36,931 68 455 681 0
2 62 1 2,688 7,650 37 125 153 2
0 84 6 2,585 27,632 80 225 264 0
17 558 0 1,582 6,674 168 315 314 10
0 17 0 50 631 6 68 189 0
31 67 0 175 1,320 2 131 0 2
0 31 6 27 395 2 0 0 0
7 970 0 856 7,547 4 82 203 2
8 56 0 490 2,089 2 6 15 4
443 5,452 26 24,627 150,206 519 4,630 6,218 90
0 20 0 162 755 12 4 41 0
0 82 0 4,278 2,510 2 64 251 0
5 15 0 196 452 2 32 51 0
0 1 0 60 371 0 1 5 0
1 26 0 6 400 0 7 7 0
59 50 0 406 344 2 112 914 2
6 264 0 129 486 0 20 4 0
3 32 0 189 385 8 157 208 0
1 2 0 33 799 0 3 30 0
2 25 0 531 1,888 4 130 33 0
1 1 0 29 166 2 95 0 0
11 7 2 348 1,113 4 24 52 0
13 83 4 261 652 12 478 95 0
5 24 0 71 520 8 55 26 0
107 632 6 6,699 10,841 56 1,182 1,717 2
400 1,777 0 149 4,927 152 95 1,274 10
9 89 0 33 681 14 21 57 0
50 4 0 48 1,063 20 1,035 134 0
87 357 0 79 695 2 318 176 4
546 2,227 0 309 7,366 188 1,469 1,641 14
1 2 0 158 320 0 7 2 0
7 56 2 116 468 2 6 33 0
3 159 0 1,377 808 6 40 249 20
0 0 2 428 478 2 4 22 0
0 1 0 24 191 2 7 2 0
5 17 0 165 330 2 39 25 2
16 235 4 2,268 2,595 14 103 333 22
4 33 0 297 844 0 61 3 0
21 72 0 214 1,000 0 48 12 0
1 111 0 52 571 0 10 4 0
5 32 0 194 343 0 19 8 0
31 248 0 757 2,758 0 138 27 0
1,143 8,794 36 34,660 173,766 777 7,522 9,936 128

COUNTRY AND LOCATION FIJI FINLAND FRANCE FRENCH POLYNESIA GERMANY GHANA GREECE
ISLAND (IF AVAILABLE)
SHORELINE & RECREATIONAL ACTIVITIES
Bags (Paper) 102 45 0 18 0 2,290 2,859
Bags (Plastic) 890 67 43 13 245 3,047 2,430
Balloons 5 43 0 0 78 15 419
Beverage Bottles (Plastic) 2,166 232 124 37 982 360 4,661
Beverage Bottles (Glass) 344 540 233 4 1,089 257 2,035
Beverage Cans 596 310 91 15 505 296 5,189
Caps, Lids 216 198 14 0 1,467 146 10,185
Clothing, Shoes 202 7 15 3 259 294 825
Cups, Plates, Forks, Knives, Spoons 217 13 17 13 494 102 1,413
Food Wrappers/Containers 112 18 22 28 874 580 1,998
Pull Tabs 5 0 22 0 164 7 2,518
6-Pack Holders 0 0 0 0 91 1 401
Shotgun Shells/Wadding 5 0 10 0 105 0 357
Straws, Stirrers 91 0 14 0 264 510 5,896
Toys 2 1 5 7 131 31 491
Total 4,953 1,474 610 138 6,748 7,936 41,677
OCEAN/WATERWAY ACTIVITIES
Bait Containers/Packaging 12 0 10 7 188 0 289
Bleach/Cleaner Bottles 23 84 0 0 81 0 308
Buoys/Floats 14 182 2 3 71 33 171
Crab/Lobster/Fish Traps 9 3 9 0 16 0 62
Crates 2 0 2 0 36 0 326
Fishing Line 76 0 34 15 337 8 1,061
Fishing Lures/Light Sticks 4 0 3 0 204 49 240
Fishing Nets 13 0 10 2 8 32 599
Light Bulbs/Tubes 11 0 0 0 36 15 190
Oil/Lube Bottles 5 30 2 11 31 17 250
Pallets 2 0 1 2 16 0 219
Plastic Sheeting/Tarps 5 0 51 0 206 0 3,858
Rope 29 46 28 21 105 65 2,277
Strapping Bands 27 30 0 0 26 18 199
Total 232 375 152 61 1,361 237 10,049
SMOKING-RELATED ACTIVITIES
Cigarettes/Cigarette Filters 64 465 83 0 4,100 1 35,180
Cigarette Lighters 29 7 12 2 179 0 865
Cigar Tips 4 0 0 9 113 0 28
Tobacco Packaging/Wrappers 22 30 17 0 1,164 0 1,026
Total 119 502 112 11 5,556 1 37,099
DUMPING ACTIVITIES
Appliances (Refrigerators, Washers, etc.) 20 4 2 0 8 5 79
Batteries 59 25 0 2 127 24 704
Building Materials 369 478 5 9 151 0 1,385
Cars/Car Parts 25 2 3 0 26 0 111
55-Gallon Drums 0 0 2 0 3 0 103
Tires 30 2 7 16 70 6 383
Total 503 511 19 27 385 35 2,765
MEDICAL/PERSONAL HYGIENE
Condoms 2 81 4 2 86 30 15
Diapers 8 0 1 0 63 10 197
Syringes 5 79 0 0 15 19 117
Tampons/Tampon Applicators 0 0 8 4 78 0 1
Total 15 160 13 6 242 59 330
MARINE DEBRIS ITEM TOTALS 5,822 3,022 906 243 14,292 8,268 91,920

GRENADA GUAM GUATEMALA GUYANA HONDURAS HONG KONG HUNGARY INDIA INDONESIA
92 3,811 382 641 45 688 0 18,780 799
604 3,843 383 641 547 7,907 100 15,016 1,994
6 426 0 99 0 1,129 0 4,131 6
420 7,655 742 1,298 1,664 4,050 500 4,731 681
290 9,712 878 33 142 1,232 350 3,454 110
263 17,920 345 351 86 622 50 1,290 209
236 6,655 0 1,461 1,145 3,745 0 5,591 326
112 2,377 46 266 58 1,307 31 7,560 289
184 6,450 128 967 97 2,980 4 5,363 182
549 6,260 0 719 480 4,872 0 10,638 367
13 1,744 0 42 0 514 0 379 0
3 984 0 49 0 303 0 183 0
0 152 0 14 0 49 0 1,255 0
86 1,788 0 1,471 286 3,041 0 4,405 164
7 690 0 139 19 640 3 1,792 5
2,865 70,467 2,904 8,191 4,569 33,079 1,038 84,568 5,132
25 135 0 27 5 2,452 3 552 20
37 377 0 92 0 355 30 604 10
8 174 5 10 0 268 0 1,382 0
7 87 0 10 0 163 0 254 1
2 54 0 21 2 189 0 197 2
23 356 0 38 0 692 0 310 74
1 106 0 33 0 652 0 313 4
5 139 3 37 1 521 0 686 7
4 135 0 21 0 324 0 581 0
34 200 0 78 17 188 0 582 16
1 63 0 9 0 128 0 218 0
54 623 0 131 0 1,034 0 1,916 79
53 530 0 119 3 1,213 0 3,998 21
27 225 0 105 0 792 0 530 0
281 3,204 8 731 28 8,971 33 12,123 234
157 17,574 15 231 1,000 4,689 1,000 9,193 370
7 366 0 123 0 878 20 2,750 14
19 1,542 0 101 0 274 0 1,214 0
46 1,247 0 113 227 895 800 9,742 134
229 20,729 15 568 1,227 6,736 1,820 22,899 518
1 211 2 9 1 57 0 121 0
3 978 2 38 0 168 0 651 106
51 766 0 68 3 1,774 150 1,747 1
9 447 26 15 4 128 80 166 0
0 26 0 3 0 58 0 11 2
0 257 0 11 2 71 0 402 2
64 2,685 30 144 10 2,256 230 3,098 111
6 130 7 152 14 105 5 626 0
3 815 0 18 18 32 2 492 22
0 25 0 22 6 167 10 1,227 0
3 89 0 28 0 107 30 65 30
12 1,059 7 220 38 411 47 2,410 52
3,451 98,144 2,964 9,854 5,872 51,453 3,168 125,098 6,047
MARINE DEBRIS BREAKDOW
N BY COUNTRIES AND LOCATIONS (AND ISLANDS IF AVAILABLE)
37

COUNTRY AND LOCATION IRELAND ISRAEL ITALY JAMAICA JAPAN JORDAN KENYA
ISLAND (IF AVAILABLE)
SHORELINE & RECREATIONAL ACTIVITIES
Bags (Paper) 118 0 50 4,544 4,764 17 17,066
Bags (Plastic) 67 10 797 15,153 5,424 287 6,867
Balloons 25 0 30 227 661 2 1,956
Beverage Bottles (Plastic) 1,059 12 886 56,370 8,835 217 3,995
Beverage Bottles (Glass) 505 3 663 7,801 6,803 76 1,980
Beverage Cans 749 0 610 5,731 7,934 435 1,065
Caps, Lids 2,078 0 783 18,534 12,739 39 7,112
Clothing, Shoes 67 3 105 5,468 1,857 6 5,215
Cups, Plates, Forks, Knives, Spoons 624 15 568 10,335 2,746 54 8,294
Food Wrappers/Containers 3,114 6 430 8,862 18,834 28 5,041
Pull Tabs 49 0 172 162 850 0 2,409
6-Pack Holders 66 0 60 60 78 2 605
Shotgun Shells/Wadding 11 0 69 17 137 0 1,004
Straws, Stirrers 323 30 238 3,492 3,256 16 1,095
Toys 36 8 171 651 1,152 4 1,613
Total 8,891 87 5,632 137,407 76,070 1,183 65,317
OCEAN/WATERWAY ACTIVITIES
Bait Containers/Packaging 8 0 31 231 448 3 1,075
Bleach/Cleaner Bottles 118 0 149 1,501 992 5 891
Buoys/Floats 9 0 19 72 10,632 1 1,037
Crab/Lobster/Fish Traps 0 0 24 95 456 5 576
Crates 1 0 70 93 340 2 313
Fishing Line 15 1 117 190 1,999 156 767
Fishing Lures/Light Sticks 3 0 5 36 626 130 689
Fishing Nets 39 1 36 150 337 2 858
Light Bulbs/Tubes 5 0 12 165 165 0 823
Oil/Lube Bottles 11 0 40 1,003 60 15 740
Pallets 7 0 3 15 78 1 364
Plastic Sheeting/Tarps 46 10 491 523 592 3 723
Rope 318 1 78 236 11,510 4 2,487
Strapping Bands 39 0 102 61 1,856 5 377
Total 619 13 1,177 4,371 30,091 332 11,720
SMOKING-RELATED ACTIVITIES
Cigarettes/Cigarette Filters 257 20 7,884 979 49,913 0 3,679
Cigarette Lighters 44 3 107 1,076 2,671 10 890
Cigar Tips 1 12 186 289 6,159 0 938
Tobacco Packaging/Wrappers 113 0 242 170 1,915 47 1,541
Total 415 35 8,419 2,514 60,658 57 7,048
DUMPING ACTIVITIES
Appliances (Refrigerators, Washers, etc.) 6 0 173 102 315 0 370
Batteries 5 1 96 133 237 12 576
Building Materials 148 0 153 265 1,422 1 875
Cars/Car Parts 2 0 55 348 68 0 484
55-Gallon Drums 2 0 11 15 66 2 182
Tires 8 6 108 315 292 13 594
Total 171 7 596 1,178 2,400 28 3,081
MEDICAL/PERSONAL HYGIENE
Condoms 10 0 49 723 76 0 2,176
Diapers 7 0 47 681 69 34 618
Syringes 14 0 10 101 137 0 426
Tampons/Tampon Applicators 15 0 44 56 104 27 707
Total 46 0 150 1,561 386 61 3,927
MARINE DEBRIS ITEM TOTALS 10,142 142 15,974 147,031 169,605 1,661 91,093
MAR
INE
DEBR
IS B
REAK
DOW
N BY
COU
NTRI
ES A
ND L
OCAT
IONS
(AND
ISLA
NDS
IF A
VAIL
ABLE
)
38

KUWAIT MALAYSIA MALDIVES MALTA MARSHALL ISLANDS MAURITIUS MEXICO MOZAMBIQUE NETHERLANDS
ANTILLES
BONAIRE
120 856 0 75 10 5 4,929 274 121
40 3,727 163 77 31 20 44,438 207 391
0 844 11 6 0 0 1,470 0 16
32 2,046 245 275 290 0 54,011 262 223
16 880 159 306 92 50 22,614 193 363
7 504 207 427 311 90 7,664 241 92
11 794 243 84 88 0 48,785 287 263
2 579 85 30 240 0 7,606 113 52
1 688 131 182 31 10 25,265 44 433
7 1,343 169 84 21 10 18,381 82 272
0 68 0 17 1 0 4,088 36 29
0 21 2 6 1 0 4,209 47 10
0 15 0 0 0 0 135 0 2
0 704 97 61 1 0 10,952 2 235
3 121 10 45 15 5 2,256 20 31
239 13,190 1,522 1,675 1,132 190 256,803 1,808 2,533
0 71 37 25 1 0 413 7 6
0 149 49 10 12 0 3,831 28 32
0 561 13 2 11 0 615 1 9
2 40 0 6 0 0 186 0 2
0 18 0 18 4 0 342 12 7
1 132 237 60 7 20 1,351 17 34
0 27 24 45 3 2 243 0 12
0 95 16 0 0 3 736 18 6
2 141 19 36 0 1 326 1 21
0 158 50 49 0 0 2,420 40 29
0 15 4 4 0 0 494 0 21
0 342 140 16 0 0 1,282 1 45
1 761 144 20 30 0 4,186 145 42
0 89 169 12 5 0 697 0 7
6 2,599 902 303 73 26 17,122 270 273
11 3,333 125 1,100 1,004 5,000 30,747 321 57
5 319 7 0 0 1 1,163 16 88
0 675 19 3 44 0 5,369 10 204
0 390 34 15 57 0 2,322 50 5
16 4,717 185 1,118 1,105 5,001 39,601 397 354
0 36 53 3 0 0 191 3 0
1 53 76 16 0 0 492 8 1
0 308 586 97 4 0 1,865 9 30
0 36 0 11 0 0 524 3 9
0 2 4 1 0 0 80 0 2
0 21 19 38 1 5 413 0 19
1 456 738 166 5 5 3,565 23 61
0 25 0 0 0 15 867 13 2
1 89 20 3 0 0 2,468 18 18
0 20 6 0 0 5 586 0 12
0 11 3 0 0 0 421 11 4
1 145 29 3 0 20 4,342 42 36
263 21,107 3,376 3,265 2,315 5,242 321,433 2,540 3,257

COUNTRY AND LOCATION NETHERLANDS ANTILLES
NETHERLANDS ANTILLES
NETHERLANDS ANTILLES
NETHERLANDS ANTILLES NETHERLANDS NEW ZEALAND NICARAGUA
ISLAND (IF AVAILABLE) CURACAO ST. EUSTATIUS ST. MAARTEN TOTAL
SHORELINE & RECREATIONAL ACTIVITIES
Bags (Paper) 19 27 1,345 1,512 79 103 5,218
Bags (Plastic) 25 28 2,703 3,147 217 365 8,764
Balloons 2 4 115 137 4 19 420
Beverage Bottles (Plastic) 47 76 3,111 3,457 429 243 11,971
Beverage Bottles (Glass) 211 11 4,840 5,425 244 501 4,532
Beverage Cans 80 2 2,447 2,621 465 282 1,072
Caps, Lids 40 443 3,744 4,490 150 824 10,136
Clothing, Shoes 40 18 755 865 28 89 2,248
Cups, Plates, Forks, Knives, Spoons 97 135 3,676 4,341 180 164 3,835
Food Wrappers/Containers 15 104 1,998 2,389 779 769 3,455
Pull Tabs 26 4 190 249 90 126 145
6-Pack Holders 15 0 190 215 36 2 289
Shotgun Shells/Wadding 0 8 3 13 0 18 47
Straws, Stirrers 13 113 1,536 1,897 55 163 5,910
Toys 3 11 156 201 86 28 1,023
Total 633 984 26,809 30,959 2,842 3,696 59,065
OCEAN/WATERWAY ACTIVITIES
Bait Containers/Packaging 5 0 42 53 4 9 177
Bleach/Cleaner Bottles 0 1 190 223 14 2 2,910
Buoys/Floats 0 11 37 57 3 1 518
Crab/Lobster/Fish Traps 0 0 11 13 4 4 4
Crates 0 0 15 22 1 1 14
Fishing Line 357 16 15 422 23 119 224
Fishing Lures/Light Sticks 14 2 17 45 3 38 0
Fishing Nets 4 9 36 55 2 3 100
Light Bulbs/Tubes 1 0 29 51 2 0 66
Oil/Lube Bottles 2 10 101 142 3 2 685
Pallets 0 0 64 85 4 0 0
Plastic Sheeting/Tarps 2 80 244 371 1 24 126
Rope 9 257 283 591 23 16 926
Strapping Bands 12 8 44 71 32 13 141
Total 406 394 1,128 2,201 119 232 5,891
SMOKING-RELATED ACTIVITIES
Cigarettes/Cigarette Filters 123 5 2,183 2,368 418 1,194 2,098
Cigarette Lighters 0 9 118 215 34 14 779
Cigar Tips 0 1 581 786 4 94 1,632
Tobacco Packaging/Wrappers 10 0 111 126 115 36 290
Total 133 15 2,993 3,495 571 1,338 4,799
DUMPING ACTIVITIES
Appliances (Refrigerators, Washers, etc.) 0 0 14 14 3 2 43
Batteries 1 2 39 43 13 15 18
Building Materials 5 8 275 318 139 57 229
Cars/Car Parts 1 2 49 61 14 4 101
55-Gallon Drums 0 0 3 5 4 0 1
Tires 8 3 10 40 12 5 73
Total 15 15 390 481 185 83 465
MEDICAL/PERSONAL HYGIENE
Condoms 2 1 240 245 11 12 176
Diapers 0 1 139 158 1 0 97
Syringes 0 1 3 16 3 2 183
Tampons/Tampon Applicators 0 1 94 99 1 1 131
Total 2 4 476 518 16 15 587
MARINE DEBRIS ITEM TOTALS 1,189 1,412 31,796 37,654 3,733 5,364 70,807

NIGERIA NORTHERN MARIANA ISLANDS OMAN PALAU PARAGUAY PHILIPPINES POLAND PORTUGAL PUERTO RICO
44,141 193 30 850 111 253,013 242 0 10,968
155,274 280 619 80 1,255 679,957 254 198 24,641
3,810 10 0 80 10 8,756 38 0 1,756
85,262 339 292 100 72 20,238 347 249 33,744
33,188 438 94 500 46 12,553 279 424 41,452
53,854 792 333 500 16 8,619 213 198 14,332
137,489 175 192 1,000 360 12,930 106 99 33,126
11,394 32 8 50 144 38,394 45 63 8,019
8,237 329 74 300 78 18,614 79 82 37,411
84,006 115 38 1,000 45 103,226 146 112 16,043
192,244 78 0 40 0 1,027 53 16 3,368
579 58 0 200 0 998 5 2 2,446
0 0 0 0 0 843 2 0 400
130,814 54 0 0 117 68,421 4 0 15,281
5,142 13 4 10 9 7,574 14 5 2,677
945,434 2,906 1,684 4,710 2,263 1,235,163 1,827 1,448 245,664
0 3 83 0 18 1,915 7 10 410
0 6 3 10 1 3,515 2 17 1,656
0 2 3 5 0 2,563 1 3 699
0 3 20 0 0 1,837 0 154 134
0 0 9 1 9 570 1 10 553
0 15 60 1 0 3,142 8 254 795
0 2 19 0 0 1,701 7 17 204
0 0 11 0 0 2,660 4 226 504
0 13 2 0 5 1,413 2 0 387
0 6 4 5 2 1,874 8 26 1,588
0 1 0 1 1 384 2 10 282
0 7 3 5 139 13,883 4 85 2,682
0 36 16 1 21 6,854 6 128 2,028
0 9 23 0 107 1,499 33 26 360
0 103 256 29 303 43,810 85 966 12,282
65,467 698 15 500 110 34,154 97 333 56,888
4,098 19 28 20 3 5,025 12 30 1,284
7,593 9 0 0 64 8,011 19 100 4,791
14,902 76 40 150 29 8,624 68 140 1,913
92,060 802 83 670 206 55,814 196 603 64,876
9 5 0 1 0 231 1 0 496
7,479 22 1 2 2 1,906 13 46 616
1,704 76 88 0 256 2,055 33 1 3,302
6,774 17 0 4 13 561 7 18 1,183
0 0 1 0 0 221 0 1 94
8,287 6 3 20 2 1,054 22 58 1,045
24,253 126 93 27 273 6,028 76 124 6,736
5,575 9 0 0 58 650 27 2 671
13,498 6 0 20 8 11,077 2 0 1,457
748 0 0 0 11 835 0 3 850
23 1 0 0 2 1,859 0 1 497
19,844 16 0 20 79 14,421 29 6 3,475
1,081,591 3,953 2,116 5,456 3,124 1,355,236 2,213 3,147 333,033
MARINE DEBRIS BREAKDOW
N BY COUNTRIES AND LOCATIONS (AND ISLANDS IF AVAILABLE)
39
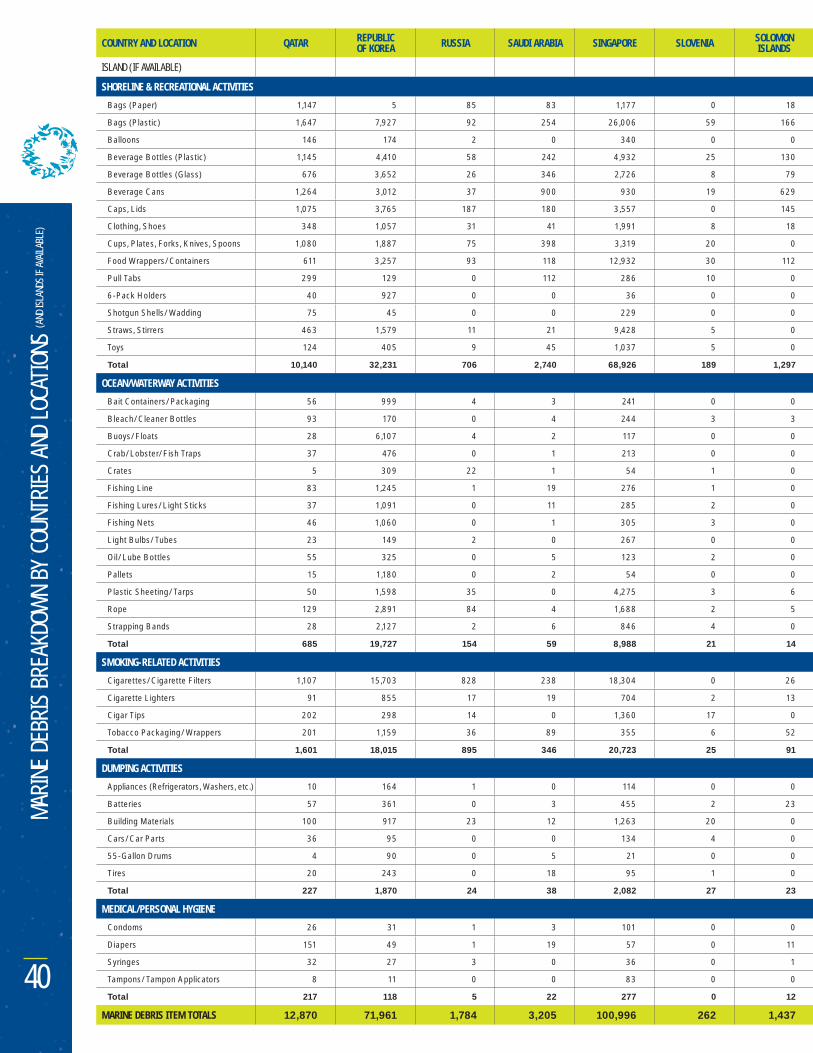
COUNTRY AND LOCATION QATAR REPUBLIC OF KOREA RUSSIA SAUDI ARABIA SINGAPORE SLOVENIA SOLOMON
ISLANDS
ISLAND (IF AVAILABLE)
SHORELINE & RECREATIONAL ACTIVITIES
Bags (Paper) 1,147 5 85 83 1,177 0 18
Bags (Plastic) 1,647 7,927 92 254 26,006 59 166
Balloons 146 174 2 0 340 0 0
Beverage Bottles (Plastic) 1,145 4,410 58 242 4,932 25 130
Beverage Bottles (Glass) 676 3,652 26 346 2,726 8 79
Beverage Cans 1,264 3,012 37 900 930 19 629
Caps, Lids 1,075 3,765 187 180 3,557 0 145
Clothing, Shoes 348 1,057 31 41 1,991 8 18
Cups, Plates, Forks, Knives, Spoons 1,080 1,887 75 398 3,319 20 0
Food Wrappers/Containers 611 3,257 93 118 12,932 30 112
Pull Tabs 299 129 0 112 286 10 0
6-Pack Holders 40 927 0 0 36 0 0
Shotgun Shells/Wadding 75 45 0 0 229 0 0
Straws, Stirrers 463 1,579 11 21 9,428 5 0
Toys 124 405 9 45 1,037 5 0
Total 10,140 32,231 706 2,740 68,926 189 1,297
OCEAN/WATERWAY ACTIVITIES
Bait Containers/Packaging 56 999 4 3 241 0 0
Bleach/Cleaner Bottles 93 170 0 4 244 3 3
Buoys/Floats 28 6,107 4 2 117 0 0
Crab/Lobster/Fish Traps 37 476 0 1 213 0 0
Crates 5 309 22 1 54 1 0
Fishing Line 83 1,245 1 19 276 1 0
Fishing Lures/Light Sticks 37 1,091 0 11 285 2 0
Fishing Nets 46 1,060 0 1 305 3 0
Light Bulbs/Tubes 23 149 2 0 267 0 0
Oil/Lube Bottles 55 325 0 5 123 2 0
Pallets 15 1,180 0 2 54 0 0
Plastic Sheeting/Tarps 50 1,598 35 0 4,275 3 6
Rope 129 2,891 84 4 1,688 2 5
Strapping Bands 28 2,127 2 6 846 4 0
Total 685 19,727 154 59 8,988 21 14
SMOKING-RELATED ACTIVITIES
Cigarettes/Cigarette Filters 1,107 15,703 828 238 18,304 0 26
Cigarette Lighters 91 855 17 19 704 2 13
Cigar Tips 202 298 14 0 1,360 17 0
Tobacco Packaging/Wrappers 201 1,159 36 89 355 6 52
Total 1,601 18,015 895 346 20,723 25 91
DUMPING ACTIVITIES
Appliances (Refrigerators, Washers, etc.) 10 164 1 0 114 0 0
Batteries 57 361 0 3 455 2 23
Building Materials 100 917 23 12 1,263 20 0
Cars/Car Parts 36 95 0 0 134 4 0
55-Gallon Drums 4 90 0 5 21 0 0
Tires 20 243 0 18 95 1 0
Total 227 1,870 24 38 2,082 27 23
MEDICAL/PERSONAL HYGIENE
Condoms 26 31 1 3 101 0 0
Diapers 151 49 1 19 57 0 11
Syringes 32 27 3 0 36 0 1
Tampons/Tampon Applicators 8 11 0 0 83 0 0
Total 217 118 5 22 277 0 12
MARINE DEBRIS ITEM TOTALS 12,870 71,961 1,784 3,205 100,996 262 1,437
MAR
INE
DEBR
IS B
REAK
DOW
N BY
COU
NTRI
ES A
ND L
OCAT
IONS
(AND
ISLA
NDS
IF A
VAIL
ABLE
)
40

SOUTH AFRICA SPAIN SRI LANKA ST. VINCENT AND THE GRENADINES SWEDEN SWITZERLAND TANZANIA THAILAND TRINIDAD
AND TOBAGO
GRENADINES
488 0 4,115 575 5 0 0 1,914 2,431
2,859 2,722 10,270 2,605 39 134 2,300 3,198 6,549
60 94 352 44 1 15 0 379 74
6,035 1,221 5,649 2,185 18 775 575 3,216 15,129
2,948 463 2,091 2,483 23 663 78 3,310 7,604
1,464 824 520 2,143 44 246 245 2,555 2,504
10,564 898 3,103 889 25 218 880 5,074 12,822
638 171 3,346 465 11 50 56 9,054 2,075
1,058 188 491 910 82 186 0 2,018 10,448
2,651 1,108 4,830 990 36 312 1,250 16,763 7,573
96 579 116 55 2 13 20 270 333
61 216 183 34 0 3 0 9 119
83 5 153 7 1 6 0 8 13
2,224 233 4,211 177 0 40 1,727 2,484 1,921
330 58 685 58 15 35 0 235 402
31,559 8,780 40,115 13,620 302 2,696 7,131 50,487 69,997
240 135 318 32 0 30 0 509 287
170 163 453 62 0 11 0 849 327
68 69 1,602 113 4 6 20 814 164
68 14 114 29 1 1 0 622 53
149 134 72 5 0 7 0 15 46
1,822 215 249 21 22 63 0 622 140
160 91 89 14 0 22 0 22 41
97 282 300 21 4 5 0 700 156
116 17 306 137 0 7 0 145 105
122 91 327 338 1 10 0 279 529
25 36 103 23 0 2 0 22 34
164 135 341 22 11 63 0 426 140
2,356 268 408 247 36 40 15 11,411 707
477 112 184 13 7 24 0 701 64
6,034 1,762 4,866 1,077 86 291 35 17,137 2,793
2,450 1,919 14,609 271 70 1,830 3,450 2,128 1,117
220 92 879 27 0 69 26 1,228 424
13 446 485 14 0 37 0 359 496
370 237 999 86 0 99 44 209 671
3,053 2,694 16,972 398 70 2,035 3,520 3,924 2,708
28 12 90 19 1 22 0 907 42
18 29 324 21 1 123 0 421 51
797 342 297 74 27 224 35 813 263
130 21 194 22 17 8 10 316 106
30 8 38 4 0 1 0 0 11
125 41 130 15 31 63 0 157 84
1,128 453 1,073 155 77 441 45 2,614 557
308 82 265 46 0 38 30 22 159
29 50 194 33 3 11 0 48 289
6 2 167 6 0 6 0 16 70
82 181 231 5 17 20 0 10 77
425 315 857 90 20 75 30 96 595
42,199 14,004 63,883 15,340 555 5,538 10,761 74,258 76,650

COUNTRY AND LOCATION TURKEY UKRAINE UNITED KINGDOM UNITED STATES US VIRGIN ISLANDS
US VIRGIN ISLANDS
US VIRGIN ISLANDS
ISLAND (IF AVAILABLE) ST. CROIX ST. JOHN ST. THOMAS
SHORELINE & RECREATIONAL ACTIVITIES
Bags (Paper) 1,384 6 699 78,417 778 32 1,822
Bags (Plastic) 2,430 31 8,440 229,758 1,902 274 3,965
Balloons 68 0 1,744 38,181 308 4 67
Beverage Bottles (Plastic) 1,540 22 12,819 210,568 2,228 547 3,571
Beverage Bottles (Glass) 464 14 2,092 168,849 2,629 287 3,111
Beverage Cans 749 0 670 163,441 1,903 271 2,212
Caps, Lids 1,732 0 26,751 379,589 3,850 787 4,293
Clothing, Shoes 152 2 3,723 46,634 788 124 876
Cups, Plates, Forks, Knives, Spoons 103 24 4,267 167,108 2,267 201 2,671
Food Wrappers/Containers 516 0 32,170 397,231 1,961 443 2,902
Pull Tabs 757 0 103 36,538 364 46 241
6-Pack Holders 323 0 478 10,995 84 7 90
Shotgun Shells/Wadding 6 0 1,692 19,060 381 5 30
Straws, Stirrers 320 0 6,963 155,659 848 267 2,968
Toys 78 2 1,656 41,278 306 26 254
Total 10,622 101 104,267 2,143,306 20,597 3,321 29,073
OCEAN/WATERWAY ACTIVITIES
Bait Containers/Packaging 14 0 689 19,880 93 10 33
Bleach/Cleaner Bottles 132 0 1,180 7,152 162 67 190
Buoys/Floats 16 0 621 12,844 77 79 109
Crab/Lobster/Fish Traps 11 0 44 5,285 45 3 31
Crates 13 0 616 2,347 37 8 46
Fishing Line 13 4 9,902 36,910 206 53 186
Fishing Lures/Light Sticks 6 0 326 11,059 54 2 18
Fishing Nets 16 0 19,504 5,539 238 43 114
Light Bulbs/Tubes 23 0 162 4,589 80 3 22
Oil/Lube Bottles 49 0 456 7,478 194 42 121
Pallets 1 0 108 1,637 56 5 83
Plastic Sheeting/Tarps 38 0 8 25,889 261 72 248
Rope 27 0 22,507 44,409 863 382 365
Strapping Bands 11 0 2,691 15,737 88 56 42
Total 370 4 58,814 200,755 2,454 825 1,608
SMOKING-RELATED ACTIVITIES
Cigarettes/Cigarette Filters 26,455 700 11,485 1,362,741 627 1,575 2,196
Cigarette Lighters 172 5 1,444 18,555 210 41 227
Cigar Tips 8 0 9 74,399 281 59 433
Tobacco Packaging/Wrappers 357 6 1,282 36,397 125 22 371
Total 26,992 711 14,220 1,492,092 1,243 1,697 3,227
DUMPING ACTIVITIES
Appliances (Refrigerators, Washers, etc.) 14 0 1,088 1,523 37 0 59
Batteries 98 0 8 5,715 45 1 33
Building Materials 112 0 2,713 58,448 306 28 339
Cars/Car Parts 54 0 280 8,258 196 6 246
55-Gallon Drums 2 0 52 499 9 0 2
Tires 48 0 322 8,243 216 45 62
Total 328 0 4,463 82,686 809 80 741
MEDICAL/PERSONAL HYGIENE
Condoms 10 0 240 7,136 174 18 328
Diapers 20 0 184 4,965 145 1 127
Syringes 12 0 241 2,387 14 0 8
Tampons/Tampon Applicators 11 0 3,079 12,528 8 3 42
Total 53 0 3,744 27,016 341 22 505
MARINE DEBRIS ITEM TOTALS 38,365 816 185,508 3,945,855 25,444 5,945 35,154

US VIRGIN ISLANDS VANUATU VENEZUELA VIETNAM COUNTRY AND
LOCATION TOTALS
TOTAL
2,632 15 2,500 0 530,607
6,141 5 702 400 1,377,141
379 0 18 0 77,721
6,346 0 3,715 5 714,892
6,027 15 4,475 0 434,990
4,386 5 731 10 401,412
8,930 0 6,746 0 937,804
1,788 0 187 20 198,807
5,139 0 1,273 0 441,053
5,306 0 1,121 500 942,620
651 0 481 0 266,986
181 0 115 0 35,461
416 0 12 0 31,974
4,083 0 1,237 35 509,593
586 0 65 0 88,211
52,991 40 23,378 970 6,989,272
136 0 414 0 38,579
419 400 64 0 40,684
265 0 28 0 47,808
79 0 0 0 13,712
91 0 23 0 8,351
445 100 46 30 72,941
74 0 3 0 21,797
395 0 5 0 39,576
105 0 4 15 13,125
357 0 99 0 27,214
144 0 27 0 9,096
581 0 19 0 71,406
1,610 0 28 500 157,066
186 0 2 0 37,361
4,887 500 762 545 598,716
4,398 0 780 0 3,216,991
478 0 107 10 56,491
773 0 0 0 143,790
518 0 222 20 118,629
6,167 0 1,109 30 3,535,901
96 0 3 0 8,408
79 0 16 0 27,099
673 0 42 0 115,549
448 0 12 0 27,373
11 0 1 0 2,144
323 0 8 0 26,585
1,630 0 82 0 207,158
520 0 2 0 27,862
273 25 220 0 43,389
22 0 15 0 10,817
53 0 37 0 25,971
868 25 274 0 108,039
66,543 565 25,605 1,545 11,439,086
MARINE DEBRIS BREAKDOW
N BY COUNTRIES AND LOCATIONS (AND ISLANDS IF AVAILABLE)
41

LAND UNDERWATER TOTAL
COUNTRY AND LOCATION ISLAND PEOPLE POUNDS MILES PEOPLE POUNDS MILES PEOPLE POUNDS MILES
Argentina 1,243 11,968.9 7.0 - - - 1,243 11,968.9 7.0
Aruba 112 1,432.3 1.6 32 224.5 0.3 144 1,656.8 1.9
Australia 426 6,920.3 23.8 310 4,762.0 8.4 736 11,682.3 32.2
Austria 3 2.2 2.4 40 1,060.4 4.1 43 1,062.6 6.5
Bahamas Abaco 519 6,450.0 28.5 3 20.0 0.3 522 6,470.0 28.8
Nassau 859 38,900.0 6.3 150 9,000.0 2.0 1,009 47,900.0 8.3
Total 1,378 45,350.0 34.8 153 9,020.0 2.3 1,531 54,370.0 37.1
Bahrain 11 13.2 0.9 21 94.8 0.4 32 108.0 1.3
Bangladesh 391 1,049.8 72.6 - - - 391 1,049.8 72.6
Barbados 60 3,991.5 1.8 16 230.0 0.1 76 4,221.5 1.9
Belgium 33 152.1 11.6 139 4,105.0 6.7 172 4,257.1 18.3
Belize 992 28,699.0 26.6 - - - 992 28,699.0 26.6
Bermuda 194 1,998.0 4.0 6 200.0 0.1 200 2,198.0 4.1
Brazil 11,534 122,601.3 2,937.6 197 1,175.1 1.2 11,731 123,776.4 2,938.8
British Virgin Islands Cooper Island 7 20.0 - 16 30.0 - 23 50.0 -
Tortola 223 5,706.0 5.6 - - - 223 5,706.0 5.6
Virgin Gorda 22 1,000.0 1.0 - - - 22 1,000.0 1.0
Total 252 6,726.0 6.6 16 30.0 - 268 6,756.0 6.6
Canada 33,919 306,648.9 1,734.5 401 8,776.7 6.0 34,320 315,425.6 1,740.5
Cayman Islands Grand Cayman 6 500.0 0.1 22 200.0 0.1 28 700.0 0.2
Chile 3,279 138,655.7 68.3 17 628.3 0.6 3,296 139,284.0 68.9
China 1,134 2,775.8 1.7 29 50.7 0.1 1,163 2,826.5 1.8
Colombia 362 2,848.4 1.9 62 1,378.1 37.9 424 4,226.5 39.8
Cook Islands 60 1,102.3 0.9 21 440.9 0.3 81 1,543.2 1.2
Costa Rica 426 5,608.4 6.6 4 44.1 0.3 430 5,652.5 6.9
Croatia 56 2,050.3 2.8 - - - 56 2,050.3 2.8
Cyprus 380 4,362.8 4.7 130 1,744.3 5.8 510 6,107.1 10.5
Denmark - - 0 19 152.1 1.8 19 152.1 1.8
Dominica 561 18,933.0 23.8 - - - 561 18,933.0 23.8
Dominican Republic 2,220 56,845.7 16.6 54 3,527.4 0.5 2,274 60,373.1 17.1
East Timor 38 440.9 0.2 15 55.1 0.2 53 496.0 0.4
Ecuador 8,313 52,806.2 83.3 66 3,222.3 0.8 8,379 56,028.5 84.1
Egypt 433 4,280.7 12.8 388 3,319.5 7.8 821 7,600.2 20.6
Estonia 55 3,720.5 2.6 50 3,704.6 0.6 105 7,425.1 3.2
Fiji 145 5,426.2 4.3 17 176.4 2.6 162 5,602.6 6.9
Finland 104 1,609.4 0.9 50 1,388.9 0.8 154 2,998.3 1.7
France 49 557.8 4.0 61 1,907.0 1.6 110 2,464.8 5.6
French Polynesia 20 440.9 2.5 12 661.4 0.6 32 1,102.3 3.1
Germany 291 4,290.2 51.7 377 18,466.3 39.7 668 22,756.5 91.4
Ghana 200 200.0 0.5 - - - 200 200.0 0.5
Greece 2,155 28,761.9 33.7 165 6,541.9 4.1 2,320 35,303.8 37.8
Grenada 45 790.0 15.9 14 179.4 1.0 59 969.4 16.9
Guam 3,366 32,171.0 2.1 85 340.0 0.3 3,451 32,511.0 2.4
Guatemala 146 1,716.0 0.4 40 1,716.0 0.4 186 3,432.0 0.8
Guyana 104 1,485.0 2.0 - - - 104 1,485.0 2.0
Honduras 41 1,525.0 0.7 10 200.0 0.2 51 1,725.0 0.9
Hong Kong 2,892 28,735.3 34.5 7 44.1 1.9 2,899 28,779.4 36.4
Hungary 45 1,763.7 0.2 20 220.5 0.1 65 1,984.2 0.3
India 6,132 21,953.4 247.6 15 41.9 0.6 6,147 21,995.3 248.2
Indonesia 287 2,410.5 4.3 78 200.6 2.4 365 2,611.1 6.7
Iran 115 1,132.6 4.4 45 1,224.8 3.4 160 2,357.4 7.8
Ireland 96 639.3 0.6 - - - 96 639.3 0.6
Israel 1,627 47,178.9 15.1 54 1,278.7 2.4 1,681 48,457.6 17.5
Italy 543 8,115.2 18.3 365 5,584.3 11.1 908 13,699.5 29.4
Jamaica 1,787 23,207.1 23.3 25 1,379.2 0.7 1,812 24,586.3 24.0
Japan 13,516 68,387.5 44.5 371 17,727.5 5.8 13,887 86,115.0 50.3
Jordan 6 44.1 0.1 25 465.0 0.1 31 509.1 0.2
Kenya 5,959 30,911.0 219.3 - - - 5,959 30,911.0 219.3
Kuwait 22 39.7 0.1 12 15.4 - 34 55.1 0.1
Malaysia 1,278 23,922.5 10.0 261 895.1 3.7 1,539 24,817.6 13.7
PART
ICIP
ATIO
N BY
COU
NTRI
ES A
ND L
OCAT
IONS
42

LAND UNDERWATER TOTAL
COUNTRY AND LOCATION ISLAND PEOPLE POUNDS MILES PEOPLE POUNDS MILES PEOPLE POUNDS MILES
Maldives 142 1,388.9 10.8 247 4,455.5 10.7 389 5,844.4 21.5
Malta 57 630.1 1.8 96 3,046.3 1.9 153 3,676.4 3.7
Marshall Islands 21 80.0 - 18 20.0 - 39 100.0 -
Mauritius 12 308.7 0.6 12 308.7 0.6 24 617.4 1.2
Mexico 9,235 138,765.7 87.4 308 3,648.1 12.1 9,543 142,413.8 99.5
Mozambique 95 1,027.4 4.4 7 11.0 0.3 102 1,038.4 4.7
Netherlands Antilles Bonaire 62 1,680.0 1.1 39 150.0 0.2 101 1,830.0 1.3
Curacao 21 68.3 0.4 101 2,700.7 0.8 122 2,769.0 1.2
St. Eustatius 20 455.5 0.9 - - - 20 455.5 0.9
St. Maarten 826 3,351.1 0.3 - - - 826 3,351.1 0.3
Total 929 5,555.0 2.7 140 2,850.7 1.0 1,069 8,405.7 3.7
Netherlands 43 1,479.3 11.6 170 2,918.9 11.0 213 4,398.2 22.6
New Zealand 138 888.5 5.5 109 1,728.4 2.2 247 2,616.9 7.7
Nicaragua 1,287 16,961.0 25.3 - - - 1,287 16,961.0 25.3
Nigeria 429 64,416.9 51.6 - - - 429 64,416.9 51.6
Northern Mariana Islands 312 559.0 0.5 - - - 312 559.0 0.5
Oman 86 1,455.1 7.9 47 1,422.0 5.4 133 2,877.1 13.3
Palau 85 2,000.0 3.0 - - - 85 2,000.0 3.0
Paraguay 60 4,257.1 0.1 - - - 60 4,257.1 0.1
Philippines 37,238 616,050.8 311.3 490 5,891.6 6.6 37,728 621,942.4 317.9
Poland 336 11,367.0 9.0 141 4,541.5 622.6 477 15,908.5 631.6
Portugal 45 2,491.2 4.0 108 3,507.6 3.4 153 5,998.8 7.4
Puerto Rico 8,521 197,330.5 170.7 116 3,405.0 4.9 8,637 200,735.5 175.6
Qatar 560 3,086.5 0.6 80 176.4 0.1 640 3,262.9 0.7
Republic of Korea 5,954 527,200.2 27.3 135 6,721.9 0.2 6,089 533,922.1 27.5
Russia 192 96.9 0.2 - - - 192 96.9 0.2
Saudi Arabia 40 1,212.5 1.1 50 1,000.0 0.5 90 2,212.5 1.6
Seychelles 40 297.6 0.1 - - - 40 297.6 0.1
Singapore 2,448 21,119.0 10.4 - - - 2,448 21,119.0 10.4
Slovakia 5 66.1 0.1 12 44.1 0.1 17 110.2 0.2
Slovenia 14 110.2 0.2 44 1,190.5 0.3 58 1,300.7 0.5
Solomon Islands 23 275.6 1.7 - - - 23 275.6 1.7
South Africa 6,772 20,771.5 55.4 231 1,550.7 1.3 7,003 22,322.2 56.7
Spain 341 4,014.6 32.3 276 4,929.0 16.3 617 8,943.6 48.6
Sri Lanka 632 6,787.4 - - - - 632 6,787.4 -
St. Kitts and Nevis Nevis 135 2,809.3 9.2 17 52.1 0.8 152 2,861.4 10.0
St. Vincent and the Grenadines Grenadines 289 4,636.5 9.6 - - - 289 4,636.5 9.6
Sweden 29 125.7 2.5 30 782.6 0.4 59 908.3 2.9
Switzerland 76 1,142.0 11.1 227 8,430.5 10.3 303 9,572.5 21.4
Taiwan 60 66.1 0.3 60 485.0 0.3 120 551.1 0.6
Tanzania 99 1,446.2 0.9 - - - 99 1,446.2 0.9
Thailand 2,406 21,845.6 18.6 716 9,122.7 6.6 3,122 30,968.3 25.2
Trinidad and Tobago Trinidad 1,186 12,850.5 9.7 - - - 1,186 12,850.5 9.7
Tobago 282 3,994.4 7.6 38 92.7 2.6 320 4,087.1 10.2
Total 1,468 16,844.9 17.3 38 92.7 2.6 1,506 16,937.6 19.9
Turkey 1,710 8,096.1 20.6 42 3,886.1 1.0 1,752 11,982.2 21.6
Ukraine 7 123.5 0.1 10 94.8 0.1 17 218.3 0.2
United Arab Emirates 87 - 1.8 60 - 8.0 147 - 9.8
United Kingdom 5,684 44,413.7 114.3 146 765.9 1.2 5,830 45,179.6 115.5
United States 181,240 3,628,924.6 9,044.3 1,954 32,530.8 70.5 183,194 3,661,455.4 9,114.8
United States Virgin Islands St. Croix 526 1,803.7 11.2 19 230.0 1.7 545 2,033.7 12.9
St. John 143 4,292.0 10.1 - - - 143 4,292.0 10.1
St. Thomas 706 12,272.0 19.9 - - - 706 12,272.0 19.9
Total 1,375 18,367.7 41.2 19 230.0 1.7 1,394 18,597.7 42.9
Uruguay - - - 31 13.2 - 31 13.2 -
Vanuatu 300 1,763.7 - 26 440.9 0.2 326 2,204.6 0.2
Venezuela 355 11,561.0 5.6 76 432.1 0.5 431 11,993.1 6.1
Vietnam 21 250.0 - - - - 21 250.0 -
COUNTRY AND LOCATION TOTALS 380,275 6,584,365.3 15,968.1 10,606 219,527.6 975.6 390,881 6,803,892.9 16,943.7
TOTAL NUMBER OF COUNTRIES AND LOCATIONS: 104

COUNTRY AND LOCATION ALABAMA ALASKA ARIZONA ARKANSAS CALIFORNIA COLORADO CONNECTICUT
SHORELINE & RECREATIONAL ACTIVITIES
Bags (Paper) 2,968 0 338 3 24,194 7 1,124
Bags (Plastic) 5,987 7 717 46 52,544 69 5,187
Balloons 654 0 22 2 8,987 8 902
Beverage Bottles (Plastic) 9,343 0 1,272 15 24,282 34 5,598
Beverage Bottles (Glass) 6,990 32 1,088 23 31,774 39 3,161
Beverage Cans 8,359 32 1,509 148 23,090 18 3,413
Caps, Lids 8,000 0 1,116 20 83,069 53 7,869
Clothing, Shoes 1,413 9 187 13 12,185 22 1,082
Cups, Plates, Forks, Knives, Spoons 4,745 0 468 153 34,354 55 4,451
Food Wrappers/Containers 6,420 15 749 24 114,758 89 16,488
Pull Tabs 1,037 0 943 2 10,448 4 899
6-Pack Holders 750 0 31 2 1,780 2 123
Shotgun Shells/Wadding 437 0 23 0 5,590 17 287
Straws, Stirrers 2,162 0 330 2 33,170 17 3,316
Toys 1,384 14 50 14 10,558 4 1,091
Total 60,649 109 8,843 467 470,783 438 54,991
OCEAN/WATERWAY ACTIVITIES
Bait Containers/Packaging 519 0 45 1 2,961 6 560
Bleach/Cleaner Bottles 422 0 31 0 811 2 69
Buoys/Floats 543 2 9 0 1,583 4 574
Crab/Lobster/Fish Traps 128 2 0 0 358 0 38
Crates 113 1 9 0 532 3 42
Fishing Line 947 0 167 85 6,466 9 893
Fishing Lures/Light Sticks 433 3 117 13 1,385 0 180
Fishing Nets 188 3 14 0 739 0 71
Light Bulbs/Tubes 282 0 8 0 1,037 0 72
Oil/Lube Bottles 511 6 21 0 866 0 65
Pallets 51 0 1 0 428 0 12
Plastic Sheeting/Tarps 894 0 15 1 5,715 5 395
Rope 1,484 8 38 3 5,968 7 450
Strapping Bands 506 0 22 2 3,838 2 189
Total 7,021 25 497 105 32,687 38 3,610
SMOKING-RELATED ACTIVITIES
Cigarettes/Cigarette Filters 17,938 20 2,179 117 340,221 43 26,948
Cigarette Lighters 597 3 23 0 4,709 5 473
Cigar Tips 838 0 74 0 16,574 24 1,287
Tobacco Packaging/Wrappers 1,205 5 147 9 9,025 21 792
Total 20,578 28 2,423 126 370,529 93 29,500
DUMPING ACTIVITIES
Appliances (Refrigerators, Washers, etc.) 68 0 0 0 313 0 12
Batteries 269 6 38 1 1,517 2 66
Building Materials 4,106 3 40 1 20,513 3 996
Cars/Car Parts 333 1 158 0 1,824 0 145
55-Gallon Drums 23 0 0 0 44 1 2
Tires 292 3 10 8 1,402 2 59
Total 5,091 13 246 10 25,613 8 1,280
MEDICAL/PERSONAL HYGIENE
Condoms 213 0 3 1 2,032 1 332
Diapers 171 0 155 1 893 0 95
Syringes 49 0 4 0 706 0 70
Tampons/Tampon Applicators 114 0 21 3 1,132 2 226
Total 547 0 183 5 4,763 3 723
MARINE DEBRIS ITEM TOTALS 93,886 175 12,192 713 904,375 580 90,104

DELAWARE DISTRICT OF COLUMBIA FLORIDA GEORGIA HAWAII IDAHO ILLINOIS INDIANA KANSAS
982 344 11,336 2 2,474 36 3,237 821 448
4,131 2,228 42,376 52 7,782 104 4,884 540 738
1,059 66 4,404 1 864 1 1,801 1,132 26
4,435 2,957 46,263 380 1,832 155 3,393 1,028 356
2,627 1,292 37,360 196 4,203 101 5,735 1,193 51
2,588 896 33,212 418 2,165 183 4,421 875 235
10,220 2,042 82,314 73 15,919 135 14,086 4,042 117
567 173 8,110 8 1,584 56 1,146 335 37
2,705 1,594 31,033 52 3,820 21 4,945 1,278 130
5,434 3,459 49,403 149 11,376 223 13,160 2,196 403
583 227 7,340 1 1,847 7 1,089 227 25
148 63 2,752 2 214 1 232 55 7
713 2 1,181 2 194 5 137 118 0
2,608 745 35,207 0 2,337 37 5,550 2,416 84
1,297 226 6,078 442 827 53 1,285 322 30
40,097 16,314 398,369 1,778 57,438 1,118 65,101 16,578 2,687
1,260 276 3,534 41 422 30 124 202 0
102 60 1,310 3 211 0 48 27 2
295 38 2,457 1 450 4 34 21 1
41 3 577 0 1,636 0 23 3 0
66 4 397 0 106 1 31 3 0
710 316 6,745 0 3,167 32 139 23 0
603 100 2,513 0 322 4 137 40 0
76 15 1,145 0 615 1 63 7 1
50 9 1,382 0 167 6 42 7 0
150 92 1,480 0 93 2 63 39 8
26 2 251 0 27 0 22 0 0
273 157 6,405 0 416 14 1,131 33 26
639 30 8,661 0 4,278 9 311 151 6
262 19 3,213 0 524 3 291 63 17
4,553 1,121 40,070 45 12,434 106 2,459 619 61
23,178 175,499 197,389 15 68,115 678 49,987 13,191 206
406 108 3,675 8 736 3 402 163 5
1,219 597 16,561 0 1,105 0 3,738 1,600 10
511 256 6,152 57 1,292 30 768 215 33
25,314 176,460 223,777 80 71,248 711 54,895 15,169 254
7 2 251 0 21 0 20 6 0
24 20 972 0 512 2 178 77 0
962 75 7,688 10 775 35 711 106 163
143 31 1,187 0 282 13 173 22 12
9 0 54 1 6 0 5 1 4
145 8 887 0 126 2 73 27 0
1,290 136 11,039 11 1,722 52 1,160 239 179
116 63 1,348 0 211 1 208 60 4
60 36 780 0 192 17 95 34 4
56 23 499 0 37 0 20 13 0
299 83 934 1 86 1 240 292 1
531 205 3,561 1 526 19 563 399 9
71,785 194,236 676,816 1,915 143,368 2,006 124,178 33,004 3,190
MARINE DEBRIS BREAKDOW
N BY US STATES AND DISTRICT OF COLUMBIA
43

COUNTRY AND LOCATION LOUISIANA MAINE MARYLAND MASSACHUSETTS MICHIGAN MINNESOTA MISSISSIPPI
SHORELINE & RECREATIONAL ACTIVITIES
Bags (Paper) 1,577 800 903 1,425 1,995 702 2,175
Bags (Plastic) 2,308 2,023 1,568 9,391 5,601 1,373 6,174
Balloons 171 313 833 1,990 3,010 180 464
Beverage Bottles (Plastic) 4,100 1,350 4,538 5,588 1,985 596 5,605
Beverage Bottles (Glass) 2,214 1,047 1,181 2,946 1,434 567 5,164
Beverage Cans 2,121 702 1,939 3,969 1,298 841 4,752
Caps, Lids 4,279 1,602 3,344 11,194 10,389 838 4,717
Clothing, Shoes 758 318 388 1,186 868 334 1,288
Cups, Plates, Forks, Knives, Spoons 2,501 1,128 1,504 4,594 3,754 638 2,815
Food Wrappers/Containers 3,396 3,482 2,659 13,292 14,087 3,698 5,412
Pull Tabs 673 208 255 599 769 94 495
6-Pack Holders 239 40 54 133 155 23 338
Shotgun Shells/Wadding 127 326 427 619 762 72 144
Straws, Stirrers 2,022 525 1,016 4,720 5,162 487 1,452
Toys 443 318 352 1,605 1,140 157 547
Total 26,929 14,182 20,961 63,251 52,409 10,600 41,542
OCEAN/WATERWAY ACTIVITIES
Bait Containers/Packaging 286 229 211 492 487 40 324
Bleach/Cleaner Bottles 179 161 101 376 70 14 344
Buoys/Floats 263 1,021 131 976 134 16 316
Crab/Lobster/Fish Traps 48 492 44 351 3 0 115
Crates 36 54 14 77 14 0 109
Fishing Line 261 157 467 1,285 641 45 534
Fishing Lures/Light Sticks 131 66 169 397 216 22 165
Fishing Nets 74 136 14 802 39 10 168
Light Bulbs/Tubes 154 20 41 53 52 6 202
Oil/Lube Bottles 180 159 220 149 58 20 374
Pallets 132 12 6 34 16 2 112
Plastic Sheeting/Tarps 302 505 110 606 812 480 657
Rope 466 2,966 302 4,388 565 41 826
Strapping Bands 191 712 137 942 360 51 287
Total 2,703 6,690 1,967 10,928 3,467 747 4,533
SMOKING-RELATED ACTIVITIES
Cigarettes/Cigarette Filters 3,953 10,466 3,264 37,683 60,624 11,479 13,432
Cigarette Lighters 226 102 249 545 334 138 269
Cigar Tips 727 199 547 1,231 5,436 767 1,052
Tobacco Packaging/Wrappers 363 272 246 802 857 422 1,071
Total 5,269 11,039 4,306 40,261 67,251 12,806 15,824
DUMPING ACTIVITIES
Appliances (Refrigerators, Washers, etc.) 27 5 5 6 9 5 73
Batteries 131 45 41 83 45 23 105
Building Materials 2,638 1,471 203 907 870 493 3,454
Cars/Car Parts 194 124 25 172 103 84 358
55-Gallon Drums 18 8 7 3 8 1 38
Tires 49 72 62 65 32 25 235
Total 3,057 1,725 343 1,236 1,067 631 4,263
MEDICAL/PERSONAL HYGIENE
Condoms 76 32 12 160 125 54 117
Diapers 27 33 48 107 137 27 89
Syringes 43 8 43 75 40 19 15
Tampons/Tampon Applicators 79 60 114 1,063 480 54 66
Total 225 133 217 1,405 782 154 287
MARINE DEBRIS ITEM TOTALS 38,183 33,769 27,794 117,081 124,976 24,938 66,449
MAR
INE
DEBR
IS B
REAK
DOW
N BY
US
STAT
ES A
ND D
ISTR
ICT
OF C
OLUM
BIA
44

MISSOURI MONTANA NEBRASKA NEVADA NEW HAMPSHIRE NEW JERSEY NEW YORK NORTH CAROLINA OHIO
50 0 254 7 713 1,402 6,584 1,912 714
70 26 1,154 33 2,427 7,101 22,424 5,574 2,580
0 1 22 16 376 1,918 4,062 932 116
158 21 1,267 28 1,163 7,315 21,419 13,909 3,011
246 82 1,391 31 1,709 3,150 15,402 10,385 1,947
346 310 2,122 34 1,836 3,233 13,944 11,408 3,073
11 40 1,166 121 2,901 25,486 33,551 9,439 1,908
16 20 166 27 496 1,156 4,681 1,579 386
12 28 727 44 1,773 8,676 18,074 7,711 2,083
8 85 1,667 240 4,907 14,170 30,957 17,451 4,814
1 10 155 54 377 628 2,596 1,242 224
0 0 35 1 38 310 1,270 617 42
0 0 568 0 191 418 2,189 566 325
11 6 179 41 1,524 10,263 18,740 3,126 900
9 12 68 13 450 2,044 3,631 1,669 270
938 641 10,941 690 20,881 87,270 199,524 87,520 22,393
9 2 627 2 122 360 1,515 2,286 39
1 0 3 1 36 189 518 189 38
0 2 49 6 267 334 1,096 306 55
0 0 0 0 434 38 383 70 1
0 0 1 0 42 215 174 27 8
6 505 824 0 363 1,829 2,870 1,993 28
3 32 103 0 54 746 940 444 38
0 0 7 0 133 111 293 154 17
0 0 7 1 27 95 253 103 25
2 2 26 3 33 274 627 277 79
0 0 0 0 19 52 82 60 28
0 2 52 1 579 95 2,488 888 116
3 4 26 12 2,629 755 2,554 848 60
3 2 13 15 539 474 838 251 57
27 551 1,738 41 5,277 5,567 14,631 7,896 589
45 15 2,192 637 58,664 34,871 60,033 23,256 2,807
0 0 51 4 95 679 1,778 602 207
0 0 222 53 576 4,350 4,738 1,196 1,074
8 0 379 15 446 1,021 2,843 1,615 546
53 15 2,844 709 59,781 40,921 69,392 26,669 4,634
1 0 0 3 12 9 110 253 26
3 0 59 0 66 97 475 195 58
3 2 100 2 320 672 3,441 2,504 377
3 0 17 0 99 79 804 376 283
0 10 5 0 0 11 43 41 4
9 2 5 1 35 92 342 1,574 147
19 14 186 6 532 960 5,215 4,943 895
0 0 9 0 45 240 683 133 133
0 2 35 4 43 62 526 593 20
1 0 0 0 10 124 268 19 12
0 0 31 6 62 1,966 2,805 94 357
1 2 75 10 160 2,392 4,282 839 522
1,038 1,223 15,784 1,456 86,631 137,110 293,044 127,867 29,033

COUNTRY AND LOCATION OKLAHOMA OREGON PENNSYLVANIA RHODE ISLAND SOUTH CAROLINA TENNESSEE TEXAS
SHORELINE & RECREATIONAL ACTIVITIES
Bags (Paper) 0 11 1,890 1,704 316 12 2,092
Bags (Plastic) 0 172 6,242 8,354 878 9 6,668
Balloons 1 22 691 1,629 44 0 620
Beverage Bottles (Plastic) 27 183 6,836 7,206 1,291 8 7,030
Beverage Bottles (Glass) 120 53 4,521 4,650 978 20 2,320
Beverage Cans 263 226 5,268 5,542 1,747 15 4,029
Caps, Lids 3 150 6,829 13,138 1,312 39 9,845
Clothing, Shoes 18 36 1,072 1,663 190 1 1,326
Cups, Plates, Forks, Knives, Spoons 6 67 3,400 5,428 1,578 8 3,993
Food Wrappers/Containers 0 109 15,207 14,490 1,244 28 3,790
Pull Tabs 1 26 574 787 176 17 1,106
6-Pack Holders 2 4 146 219 27 2 662
Shotgun Shells/Wadding 0 12 624 1,344 55 0 699
Straws, Stirrers 1 59 3,678 7,103 340 17 2,254
Toys 3 151 821 1,427 225 0 915
Total 445 1,281 57,799 74,684 10,401 176 47,349
OCEAN/WATERWAY ACTIVITIES
Bait Containers/Packaging 0 28 740 741 73 8 478
Bleach/Cleaner Bottles 0 4 143 416 23 0 1,086
Buoys/Floats 1 12 101 699 178 0 532
Crab/Lobster/Fish Traps 0 1 8 341 2 0 85
Crates 0 1 38 51 14 0 129
Fishing Line 2 51 524 2,718 104 6 1,122
Fishing Lures/Light Sticks 7 2 216 594 93 0 546
Fishing Nets 0 1 67 198 10 0 285
Light Bulbs/Tubes 0 1 59 57 52 0 228
Oil/Lube Bottles 0 2 130 169 58 2 696
Pallets 0 1 28 59 10 0 140
Plastic Sheeting/Tarps 0 3 944 561 148 0 605
Rope 0 81 331 2,489 74 0 2,478
Strapping Bands 0 13 199 875 233 0 313
Total 10 201 3,528 9,968 1,072 16 8,723
SMOKING-RELATED ACTIVITIES
Cigarettes/Cigarette Filters 0 869 31,784 47,905 6,320 47 3,316
Cigarette Lighters 0 9 307 605 49 2 552
Cigar Tips 0 9 3,632 2,142 107 0 370
Tobacco Packaging/Wrappers 0 42 1,107 1,214 67 18 399
Total 0 929 36,830 51,866 6,543 67 4,637
DUMPING ACTIVITIES
Appliances (Refrigerators, Washers, etc.) 0 0 46 24 3 0 63
Batteries 0 10 184 77 27 0 98
Building Materials 0 34 839 1,186 195 0 1,345
Cars/Car Parts 0 0 421 180 31 0 184
55-Gallon Drums 0 0 31 8 5 0 42
Tires 0 6 946 90 94 0 129
Total 0 50 2,467 1,565 355 0 1,861
MEDICAL/PERSONAL HYGIENE
Condoms 0 0 137 175 7 0 222
Diapers 0 2 103 144 6 2 124
Syringes 0 0 29 79 4 0 73
Tampons/Tampon Applicators 0 6 384 848 20 0 336
Total 0 8 653 1,246 37 2 755
MARINE DEBRIS ITEM TOTALS 455 2,469 101,277 139,329 18,408 261 63,325

UTAH VIRGINIA WASHINGTON WISCONSIN TOTALS
0 2,332 106 427 78,417
6 9,273 239 698 229,758
0 590 2 249 38,181
32 13,499 240 820 210,568
35 10,571 276 544 168,849
60 11,838 204 759 163,441
20 5,695 135 2,362 379,589
20 1,476 33 205 46,634
3 5,966 91 702 167,108
20 15,231 99 2,342 397,231
1 675 6 110 36,538
1 434 0 41 10,995
0 279 10 597 19,060
2 2,603 19 1,428 155,659
0 975 110 248 41,278
200 81,437 1,570 11,532 2,143,306
2 742 6 50 19,880
0 156 0 6 7,152
0 239 7 87 12,844
0 48 8 4 5,285
0 28 2 5 2,347
11 811 1 53 36,910
1 187 3 34 11,059
0 68 2 12 5,539
0 86 3 2 4,589
0 531 4 7 7,478
0 18 5 1 1,637
0 360 22 73 25,889
0 359 58 51 44,409
0 237 5 39 15,737
14 3,870 126 424 200,755
19 17,607 271 15,458 1,362,741
0 336 12 88 18,555
0 1,117 4 1,223 74,399
0 1,728 47 351 36,397
19 20,788 334 17,120 1,492,092
0 140 1 2 1,523
0 166 21 22 5,715
0 1,036 107 62 58,448
0 365 9 23 8,258
0 65 0 1 499
0 1,156 3 28 8,243
0 2,928 141 138 82,686
0 118 2 63 7,136
0 271 0 27 4,965
0 39 0 9 2,387
0 163 8 91 12,528
0 591 10 190 27,016
233 109,614 2,181 29,404 3,945,855
MARINE DEBRIS BREAKDOW
N BY US STATES AND DISTRICT OF COLUMBIA
45

LAND UNDERWATER TOTAL
US STATES PEOPLE POUNDS MILES PEOPLE POUNDS MILES PEOPLE POUNDS MILES
Alabama 3,925 80,374.7 287.8 - - - 3,925 80,374.7 287.8
Alaska 2 40.0 1.0 6 60.0 - 8 100.0 1.0
Arizona 231 5,025.0 28.2 321 1,585.0 3.4 552 6,610.0 31.6
Arkansas 8 30.0 1.4 35 170.0 1.5 43 200.0 2.9
California 73,553 1,664,501.2 2,860.0 138 1,605.0 4.3 73,691 1,666,106.2 2,864.3
Colorado 94 1,144.0 - 2 10.0 - 96 1,154.0 -
Connecticut 1,654 13,143.0 58.7 54 544.0 2.2 1,708 13,687.0 60.9
Delaware 1,357 21,736.5 64.0 - - - 1,357 21,736.5 64.0
District of Columbia 308 6,678.0 8.5 - - - 308 6,678.0 8.5
Florida 32,437 409,116.2 1,928.9 259 7,163.0 37.4 32,696 416,279.2 1,966.3
Georgia 28 56.0 3.3 - - - 28 56.0 3.3
Hawaii 2,392 22,481.1 79.1 109 3,655.0 2.3 2,501 26,136.1 81.4
Idaho 705 1,630.0 40.3 58 650.0 0.8 763 2,280.0 41.1
Illinois 3,094 10,403.0 38.2 133 1,032.0 1.1 3,227 11,435.0 39.3
Indiana 611 6,927.0 15.2 24 20.0 0.2 635 6,947.0 15.4
Kansas 42 1,310.0 1.0 - - - 42 1,310.0 1.0
Louisiana 1,637 22,900.0 71.1 - - - 1,637 22,900.0 71.1
Maine 1,638 13,559.5 105.2 - - - 1,638 13,559.5 105.2
Maryland 535 7,454.0 20.4 - - - 535 7,454.0 20.4
Massachusetts 3,066 22,299.5 139.2 11 60.0 0.5 3,077 22,359.5 139.7
Michigan 2,445 7,878.9 116.4 27 415.8 0.7 2,472 8,294.7 117.1
Minnesota 510 3,784.1 24.1 30 306.0 0.7 540 4,090.1 24.8
PART
ICIP
ATIO
N BY
US
STAT
ES A
ND D
ISTR
ICT
OF C
OLUM
BIA
46

LAND UNDERWATER TOTAL
US STATES PEOPLE POUNDS MILES PEOPLE POUNDS MILES PEOPLE POUNDS MILES
Mississippi 2,328 45,855.0 169.0 - - - 2,328 45,855.0 169.0
Missouri 24 501.0 0.2 36 360.0 - 60 861.0 0.2
Montana 10 70.0 0.0 30 410.0 0.1 40 480.0 0.1
Nebraska 526 7,156.0 89.8 10 500.0 0.2 536 7,656.0 90.0
Nevada 29 540.0 7.6 15 150.0 0.1 44 690.0 7.7
New Hampshire 1,547 6,635.3 23.9 10 1,000.0 0.5 1,557 7,635.3 24.4
New Jersey 5,821 39,988.5 147.2 51 801.0 0.6 5,872 40,789.5 147.8
New York 6,428 81,876.9 302.4 66 1,090.0 2.1 6,494 82,966.9 304.5
North Carolina 18,256 527,278.0 1,560.0 74 748.0 1.1 18,330 528,026.0 1,561.1
Ohio 908 11,576.0 54.0 136 1,872.0 1.0 1,044 13,448.0 55.0
Oklahoma 5 200.0 2.0 5 800.0 1.0 10 1,000.0 3.0
Oregon 94 1,402.0 107.1 23 114.0 0.1 117 1,516.0 107.2
Pennsylvania 2,562 91,388.0 107.3 100 4,940.0 3.8 2,662 96,328.0 111.1
Rhode Island 1,799 12,796.0 83.5 70 825.0 0.5 1,869 13,621.0 84.0
South Carolina 598 8,453.0 34.7 7 8.0 - 605 8,461.0 34.7
Tennessee 111 5,038.0 0.3 4 50.0 0.1 115 5,088.0 0.4
Texas 3,558 208,795.0 77.2 15 230.0 0.8 3,573 209,025.0 78.0
Utah 9 175.2 1.2 15 235.0 1.0 24 410.2 2.2
Virginia 5,710 254,046.0 364.9 - - - 5,710 254,046.0 364.9
Washington 81 810.0 11.2 27 675.0 0.8 108 1,485.0 12.0
Wisconsin 564 1,873.0 8.8 53 447.0 1.6 617 2,320.0 10.4
US STATE AND DISTRICT OF COLUMBIA TOTALS
181,240 3,628,924.6 9,044.3 1,954 32,530.8 70.5 183,194 3,661,455.4 9,114.8
TOTAL NUMBER OF US STATES AND DISTRICT OF COLUMBIA: 43

TERMINOLOGYBelow are the defi nition of terms used throughout the report:
THE SYMBOL (-) IN A CHARTThis data was not collected.
THE NUMBER 0 IN A CHARTThe quantity of the data collected was equal to zero.
COASTAL CLEANUPThis type of Cleanup site borders the ocean.
INLAND CLEANUPThis type of Cleanup site borders waterways that are located inland such as rivers, lakes, streams, and ponds. It is not located on the ocean.
LAND CLEANUPA Cleanup that was conducted on a beach or waterway.
UNDERWATER CLEANUPA Cleanup that was conducted underwater by certifi ed divers.
WATERCRAFT CLEANUPA Cleanup that was conducted offshore by watercraft which includes kayaks, canoes, sail boats, and motor boats.
PEOPLE OR VOLUNTEERSThe number of people or volunteers at a Cleanup site are counted by the coordinator, totaled for each country, location, or US state, and sent to Ocean Conservancy.
POUNDSVolunteers weigh trash collected when possible. On average, a bag of trash weighs 15 pounds, an estimate which is used by coordinators and Ocean Conservancy staff to estimate weight if scales are not available.
MILESThe number of miles cleaned is estimated from the starting point to the end point at each Cleanup site. The distance for a Cleanup site is not the sum of all distances covered by each individual volunteer.
TEN THINGS YOU CAN DO TO STOP MARINE DEBRIS
1 Volunteer for Ocean Conservancy’s International
Coastal Cleanup held every September. Go to
www.coastalcleanup.org.
2 Put trash in a secure, lidded receptacle—most
marine debris starts out on land.
3 Properly recycle everything you can: batteries,
cans, bottles and food containers, newspapers,
cell phones, computers, bags, packaging materials,
fi shing line. Contact your local waste hauler or county
solid waste offi ce to discover your recycling options.
4 When boating, bring your oil cans, food wrappers,
and cigarette butts back to shore, and be sure to
ask your marina to handle waste properly (check out
Ocean Conservancy’s Good Mate manual for helpful
tips at www.coastalcleanup.org).
5 Less is more: Don’t buy stuff you don’t need
that will just end up as trash. When you do make
purchases, choose items that use less packaging.
6 Start conversations that inform and inspire your
friends and co-workers to help stop marine debris
at the source.
7 Bring along your own permanent food containers for
picnics instead of using disposables. Remember to
take your own reusable bags whenever you go shopping.
8 Write to companies or visit local shops and restau-
rants and encourage them to reuse, recycle, and
generate less packaging.
9 Put cigarette butts in ashtrays, not
on streets, sidewalks, or beaches.
10 Write to your elected offi cials and encourage
them to support policies that protect our ocean.
47
2009 REPORT

ACKNOWLEDGMENTSPHOTO CREDITSCOVER Seal © Yva Momatiuk & John Eastcott/Minden Pictures
PAGE 2Vikki Spruill © Rachel’s Network
PAGE 3Philippe Cousteau © Animal Planet
PAGE 12Bag © VeerPicnic © PurestockGutter © VeerSign © VeerTugboat © Don Spiro/Getty ImagesTurtle © Norbert Wu
PAGE 13Birds © NOAA
PAGE 14Dolphins © Digital Vision
PAGE 16Monk Seal © NOAA Fisheries, Hawaiian Monk Seal Research Program
PAGE 17Turtle © Alejandro Fallabrino
PAGE 18Polar Bear © Photo Disc
PAGE 21Map © NOAA
DIRECTOR, INTERNATIONAL COASTAL CLEANUPDianne Sherman, Executive Editor
ASSOCIATE DIRECTOR, INTERNATIONAL COASTAL CLEANUPSonya Besteiro
MANAGING EDITOR/WRITERCatherine C. Fox
RESEARCH COORDINATORKate Sherman
SPECIAL THANKS
PRINCIPAL ADVISORS Laura Burton CappsVicki CornishDennis HeinemannDennis Takahashi-Kelso
CONTRIBUTORSMichele CapotsDove CoggeshallRaychelle DanielIsabel DunkinDeAndra HicksBethany Latham
Kelly LuckJames MathiesonTom McCannAdam MistlerAmelia MontjoyAndrew MyersSeba SheavlyMatt Tinning
PHOTO EDITORLori Murphy
DESIGNfuszion
LEAD SPONSORING PARTNERThe Coca-Cola Company
BLUE PLANET PARTNERBank of America
LIVING WATERS PARTNERSBrunswick Public FoundationDavid and Lucile Packard FoundationThe Dow Chemical CompanyNational Oceanic and Atmospheric
AdministrationGladPhilip Morris USA, an Altria Company
HEALTHY BAYS SPONSOROracle
RIVER AND STREAMS SPONSORSRecycleBankUS Environmental Protection AgencyUnited Nations Environment Programme
LAKES & MARSHES SPONSORSEndangered Species ChocolateFlorida Power & Light CompanyGooglePublix Super Markets CharitiesThe S. D. Bechtel, Jr. FoundationSea World Busch Gardens Conservation FundWalt Disney WorldWolverine World Wide
NONGOVERNMENTAL ORGANIZATION PARTNERProject AWARE
FOR MORE INFORMATION OR TO SIGN UP AS A VOLUNTEER FOR THE NEXT INTERNATIONAL COASTAL CLEANUP VISIT WWW.COASTALCLEANUP.ORG.
48
INTERNATIONAL COASTAL CLEANUP

“Big City, Big State, Big Results: Fort Worth, Texas, Adopts PAYT.” US Environmental Protection Agency PAYT Bulletin, Spring 2004.
Brown, J., G. Macfadyen, T. Huntington, J. Magnus, and J. Tumilty. 2005. “Ghost fishing by lost fishing gear.” Final Report to DG Fisheries and Maritime Affairs of the European Commission. Fish/2004/20. Institutue for European Environmental Policy/Poseidon Aquatic Resource Management Ltd. joint report.
Bullimore, B.A., P.B. Newman, M.J. Kaiser, S.E. Gilbert, and K.M. Lock. “A study of catches in a fleet of ‘ghost fishing’ pots.” Fishery Bulletin 99: 247-253 (2001)
“Coral Reefs Under Rapid Climate Change and Ocean Acidification.” O. Hoegh-Guldberg, et al. Science 318, 1737 (2007).
Damerona, O.J., M. Parke, M. Albins, and R. Brainard. 2007. “Marine debris accumulation in the Northwestern Hawaiian Islands: An examination of rates and processes.” Marine Pollution Bulletin 54: 423-433.
Derraik, Jose. “The Pollution of the Marine Environment by Plastic Debris”: A Review.” Marine Pollution Bulletin 54 (2007): 423-433.
M.J. Donohue, R.C. Boland, C.M. Sramek and G.A. Antonelis (2001). Derelict Fishing gear in the Northwestern Hawaiian Islands: diving surveys and debris removal in 1999 confi rm threat to coral reef ecosystems. Marine Pollution Bulletin 42 (12): 1301-1312.
Intergovernmental Panel on Climate Change. 2007. Fourth Assessment Report: Climate Change 2007. Contributions from Working Groups I (The Physical Science Basis), II (Impacts, Adaptation and Vulnerability), and III (Mitigation of Climate Change) and the Synthesis Report to the Fourth Assessment Report of the Intergovernmental Panel on Climate Change (IPCC). Cambridge University Press, Cambridge, United Kingdom, and New York, NY, USA (http://www.ipcc.ch, accessed November 19, 2007).
“Long-Term Region-Wide Declines in Caribbean Corals.” Toby A. Gardner, et al. Science 301, 958 (2003).
McDermid, K.J. and T.L. McMullen. 2004. Quantitative analysis of small-plastic debris on beaches in the Hawaiian archipelago. Marine Pollution Bulletin, 48(7-8):790-794.
“Municipal Solid Waste in the United States: 2007 Facts and Figures.” US Environmental Protection Agency Offi ce of Solid Waste, November 2008.
Myers, Andy. “What Comes Around: Breaking the Cycle of Plastics in the Ocean.” Ocean Conservancy, Autumn 2007.
National Research Council (2008) “Tackling Marine Debris in the 21st Century.” Committee on the Effectiveness of National and International Measures to Prevent and Reduce Marine Debris and Its Impacts.
Nellemann, C., Hain, S., and Alder, J. (Eds). February 2008. “In Dead Water – Merging of climate change with pollution, over-harvest, and infestations in the world’s fi shing grounds.” United Nations Environment Programme, GRID-Arendal, Norway, www.grida.no
O’Hara, K.J., S. Ludicello, and R. Bierce. A Citizen’s Guide to Plastics in the Ocean: More than a Litter Problem. Washington, DC: Center for Marine Conservation, 1988.
Ryan, P.G. 2008. Seabirds indicate changes in the composition of plastic litter in the Atlantic and south-western Indian Oceans. Marine Pollution Bulletin, 56(8): 1406-1409.
Schreiber, Allan. “Dead Sperm Whale Washes Ashore.” Upwelling. Farallones Marine Sanctuary Association, April 2008.
Skumatz, L. et al. “Pay as You Throw in the US: 2006 Update and Analysis: Final Report.” Prepared for US Environmental Protection Agency and SERA by Skumatz Economic Research Associates, Superior, Colorado, December 2006.
Sheavly, S.B. 2007. “National Marine Debris Monitoring Program: Final Program Report, Data Analysis and Summary.” Prepared for US Environmental Protection Agency by Ocean Conservancy, Grant Number X83053401-02. 76 pp.
Stamper, Andrew. “Case study: Morbidity in Pygmy Sperm Whale Kogia breviceps due to Ocean-Bourne Plastic.” Marine Mammal Science 22(3) (July 2006):719-722.
van Franeket, J.A., A. Meijboom, M.L. de Jong. “Marine litter monitoring by Northern Fulmars in the Netherlands 1982-2003” Alterra, 1093, Wageningen.
Waddell, J.E. and A.M. Clarke (eds.), 2008. The State of Coral Reef Ecosystems of the United States and Pacifi c Freely Associated States: 2008. NOAA Technical Memorandum NOS NCCOS 73. NOAA/NCCOS Center for Coastal Monitoring and Assessment’s Biogeography Team. Silver Spring, MD. 569 pp.
UNEP-CAR/RCU, 2008. Marine Litter in the Wider Caribbean Region: A Regional Overview. United Nations Environment Programme. 81 pp.
Wells. R.S., J.B. Allen, S. Hofman, K. Bassos-Hull, D.A. Fauquier, N.B. Barros, R.E. DeLynn, G. Sutton, V. Socha, and M.D. Scott. 2008. “Consequences of Injuries on Survival and Reproduction of Common Bottlenose Dolphins (Torsiops truncates) along the West Coast of Florida.” Marine Mammal Science 24(4): 774-494.
Wilkinson, C., Souter, D. (2008). “Status of Caribbean coral reefs after bleaching and hurricanes in 2005.” Global Coral Reef Monitoring Network, and Reef and Rainforest Research Centre, Townsville, 152 p.
Zabin, C.J., J.T. Carlton, and L.S. Goodwin. 2004. “First report of the Asian sea anemone Diadumene lineata from the Hawaiian Islands.” Bishop Museum Occasional Papers, 79:54-58.
SOURCES

FOR MORE INFORMATION on Ocean Conservancy’s International Coastal Cleanup please contact:
OCEAN CONSERVANCY 1300 19th Street, NW | 8th Floor | Washington, DC 20036 | USA | 202.429.5609
Each year, Ocean Conservancy—in partnership with a network of volunteer organizations and individuals—
provides a compelling global snapshot of marine debris collected in and around the ocean and inland
waterways all over the world on the third Saturday in September. This year’s report, A Rising Tide of Ocean
Debris, presents data recorded by nearly 400,000 volunteers in 104 countries and locations and 42 states
and the District of Columbia in the US who rolled up their sleeves and got to work during Ocean
Conservancy’s 23rd annual International Coastal Cleanup.
In addition to providing the Marine Debris Index—state-by-state and country-by-country data about
the 6.8 million pounds of trash picked up—this report reveals the sources of debris, from cigarette butts
and fast-food wrappers to syringes and old fi shing line, and zeroes in on the deadly effects of marine
debris on marine wildlife. It also identifi es the connection between the stress caused by marine debris
and the ability of the ocean and its critical-life support systems to adapt to the onset of global climate
change. Recommendations provide a roadmap for eliminating marine debris altogether by reducing
it at the source, changing the behaviors that cause it, and supporting better policy.
Humans have created the marine debris problem, and humans must take responsibility for it.
The comprehensive body of data compiled during the Cleanup in the course of its 23-year history
continues to inform and inspire action. Working together, citizens and environmentalists, our top
corporations, and government leaders can take effective action to eliminate the scourge of trash in the
ocean. The future of the planet and the well-being of present and future generations are counting on it.
WWW.OCEANCONSERVANCY.ORG