for mauritius, forever - sans concessions web viewhe was minister of finance of mauritius between...
TRANSCRIPT

Initiative Citoyenne
pour une réforme électorale
réalisable à Maurice
Roadmap for a better balance between stability and fairness in the voting formula
DR RAMA SITHANEN
JANUARY 2012 QUATRE BORNES

‘Most conflicts are two–sided. The first alternative is my way,
the second alternative is your way. By synergising , we can go
to a third alternative – our way, a higher and better way to
resolve the conflict’.
Stephen R . Covey
ii

Contents
Page
Preface and acknowledgements vi
Report Methodology vii
List of Tables viii
List of Appendices x
List of Boxes xi
About the Author xii
Executive Summary xiii
1. Introduction : who we are, where we are and where we want to go 1
2. Spain in the Indian Ocean : has it worked there and will it deliver
here? 3
3. Earthquake in paradise : from tranquil efficacy to vengeful
revolution 6
4. Avoiding some pitfalls : what’s mine is mine, what’s yours
is negotiable 22
5. Curing the defects of FPTP : beware of unintended consequences 25
6. Gender fairness : the discreet charm of a much simpler solution 28
iii
7. Subsuming the Best Loser System: promote inclusion, foster nationhood 34
8. Party list : better, safer and more transparent than the BLS 49
9. How should PR seats be allocated? Pandemonium in heaven 54
10. The ‘unreturned votes elect’ (UVE) formula: a new kid in town 58
11. How much stability, how much fairness: the great dilemma 60
12. The way forward : keep FPTP baby, throw away bath
water of its huge unfairness 70
13. Defining some concepts in the new electoral landscape:
welcome to the party 75
14. Remember some of Sachs : forward with the past or back to
the future 78
15. Unreturned Votes Elect : can the odd couple of stability andfairness be reconciled? 82
16. Between FPTP and Sachs : the middle is better than the
extremes 92
17. Conclusion : Have we reached the goal post? 95
Appendices 98
Selected Bibliography 109
List of persons and organisations met 115
iv

For Mauritius, forever
v
Preface and Acknowledgements
The genesis of this report lay in the realisation that in spite of many attempts to reform the
electoral system of Mauritius, not much progress has been made. The rationale for reforming the
FPTP voting system is compelling in view of the distortion that exists between votes polled and
seats won at many elections and its amplification when a party or an alliance captures all seats on
slightly more than 50 % of votes, thus leaving no Parliamentary representation to a huge share of
the electorate. The political actors seem to have the will to implement such reforms and yet the
topic continues to shift between the backburner and the centre of the agenda.
This report provides a framework for reaching an acceptable compromise among the various
stakeholders on electoral reform. My only aim is to make a modest and an informed contribution
by enabling my fellow countrymen to understand and evaluate the complex subject of electoral
reform in a multi ethnic society and the likely impact of changes in the voting formula. There has
been very wide consultations and dialogue in order to understand the ideas and the proposals of
various stakeholders. These have allowed me to acknowledge and appreciate the complexities of
finding solutions to problems in a multi faith country. I have benefitted immensely from these
interactions. My objective in some of these meetings was to test the findings, conclusions and
recommendations of the report. The document has been reviewed by five persons ( four in
Mauritius and one overseas) who collectively have a wealth of knowledge, experience and
expertise on constitutional matters, on electoral issues, on the realities, history, context and
circumstances of our country and on the mathematics of simulating likely election results based
on different voting formulae. I owe them a huge debt of gratitude for their critical insight and
suggestions. I am particularly grateful to Mr Irfan Rahman, Electoral Commissioner, for his
guidance and support in providing the much needed election statistics to carry out the various
simulations. As is customary, the responsibility for errors and omissions remains mine.
vi

Report Methodology
The following methodology has been used to produce this report:
(i) Review all the major reports written on the Constitutional and Electoral arrangements
for Mauritius. These include the Trustram-Eve, Banwell, De Smith, Sachs,
Collendavelloo and Carcassonne reports;
(ii) Consult the archives of discussion among political actors in the run up to the choice of
the electoral system in 1959 and 1967 and exchanges between various protagonists;
(iii) Survey the comparative literature to understand how other multi faith and multi ethnic
societies address the complex problem of choosing an electoral system;
(iv) Refine the findings and recommendations of the PhD thesis that I wrote on this
subject;
(v) Discuss with around 50 persons and organisations in order to have a good background
of their views and aspirations. This ranges from political parties to women’s
organisations, from constitutional experts to those who have written reports on
electoral system in Mauritius, from civil society to members of the Judiciary;
(vi) Simulate election results based on different voting formula to check the integrity and
the robustness of the electoral system being proposed;
(vii) Test the findings, conclusions and recommendations with an informal focus group,
that represents the diversity of Mauritius, through informed discussions;
(viii) Request 5 well respected Mauritians to review the document and to incorporate their
suggestions, where possible, before its release.
vii
List of Tables
1. Outcome of elections in Spain 1979-2011
2. Hypothetical results of elections held under Spain-like electoral system
3. Gender unfairness in Mauritius: number of candidates and Members of
Parliament
4. Type of quota in countries with high percentage of women Members of
Parliament
5. Ratio of Non Best Loser Members of Parliament to Best Loser
Members of Parliament
6. Difference between Parallel and Compensatory method of allocating PR
seats
7. Stability versus fairness at a glance
8. When Model C of Sachs poses no threat to stability
9. Model C of Sachs is too proportional at the expense of stability
10. The special case of the 1976 Elections
11. The insignificance of Sachs’ Model A on fairness
12. Votes of unreturned candidates as a percentage of total votes
13. Results of 1987 general elections
14. Seat allocation using votes of unreturned candidates (1987 with 20 Seats)
15. Simulation of 1987 Elections with UVE formula
viii

16. Simulation of 1982, 1995, 1991 and 2000 Elections with UVE formula
17. Simulation of 1967, 1976, 1983, 2005, 2010 Elections with UVE formula
18. FPTP, Sachs C and UVE : which stability and which fairness?
ix

List of Appendices
Appendix 1: Allocation of PR seats in a compensatory mode using
D’Hondt’s Highest Average Method
Appendix 2: Apportionment of 20 additional UVE seats in 1967
Appendix 3 Apportionment of 20 additional UVE seats in 1976
Appendix 4: Apportionment of 20 additional UVE seats in 1982
Appendix 5: Apportionment of 20 additional UVE seats in 1983
Appendix 6: Apportionment of 20 additional UVE seats in 1991
Appendix 7: Apportionment of 20 additional UVE seats in 1995
Appendix 8: Apportionment of 20 additional UVE seats in 2000
Appendix 9: Apportionment of 20 additional UVE seats in 2005
Appendix 10: Apportionment of 20 additional UVE seats in 2010
Note : Apportionment for 1987 elections is in the text at Table 14
x
List of Boxes
Box 1: A short history of electoral systems in Mauritius
Box 2: How the BLS will be subsumed into the new mixed electoral system
Box 3: Measuring unfairness in electoral systems
Box 4: Some countries using closed Party List to return Mps
Box 5: Some countries where double candidacy is very common
xi
About the Author
Rama Sithanen has developed an interest for electoral systems in plural societies by accident
rather than by design. Surprised by the huge disproportionality between votes polled and
seats obtained in many elections held in Mauritius since Independence in 1967 under the
FPTP system, he started to research constitutional arrangements and institutional designs,
with an emphasis on the electoral system and the voting formula, of plural societies,
especially those that are cleaved along ethnic, racial, linguistic, cultural and religious lines, to
accommodate diversity and ensure inclusion and fairness in political and parliamentary
representation.
As part of that research endeavour, he read political science at Brunel University in the UK
and obtained a PhD in Politics. His thesis was entitled ‘Evaluating and Proposing Electoral
Systems for Plural Societies: the case of Mauritius’. He has appraised the electoral systems of
many deeply divided societies such as South Africa, Northern Ireland, Belgium, Sri Lanka,
Lebanon, Fiji and Iraq, amongst others.
He has also studied Economics at the London School of Economics and Political Science and
holds a BSc (Economics) with First Class Honours and an MSc (Economics) with a Mark of
Distinction.
He was Minister of Finance of Mauritius between 1991 and 1995 and Deputy Prime Minister
and Minister of Finance and Economic Development between 2005 and 2010.
He is currently Chairman and Director of International Financial Services Ltd.
xii

Executive Summary
1. Electoral reform is back on the political agenda after the publication of the
Carcassonne report which proposes a radical departure from most features of our
voting system. The recommended model is a pure PR formula with variable multi-
member constituencies and a closed Party List to return Mps. It is very similar to
what exists in Spain.
2. Electoral systems that are successful in almost homogeneous countries might not
necessarily work in plural societies. The history, political environment, context and
specific circumstances of the country have a determining role in the choice of the
voting formula. It also depends on what the country wants to achieve and what
weights it assigns to each of the conditions for a good voting formula. Electoral rules
should not only be fashionable; they should also fit the circumstances and match the
realities of the country. They cannot be bought off the peg; they must be made to
measure.
3. In spite of some novel ideas, the Carcassonne report contains many weaknesses :
radical changes to the current FPTP formula; absence of well defined boundaries for
the multi-member constituencies; risk that no clear majority will emerge; danger of
not meeting the criteria of diversity and inclusiveness; complete disenfranchisement
of the electorate; weakening of the link between elected representatives and their
constituents. In attempting to cure one defect, the Carcassonne report has created too
many practical problems and there are also unintended consequences.
xiii
4. In a plural society like Mauritius, the six core values of an electoral system should be
stability, fairness, inclusion, gender representation, accountability of Mps to their
constituency and the shunning of essentially communal parties. Our unique FPTP
electoral rules have delivered on most of the core values of a good electoral system.
However its main drawback is the inequitable distribution of seats to votes. The two
principal tasks to be accomplished in a reform of the FPTP formula should be to
remedy the high distortion between seats and votes and, in so doing, not to unduly
undermine the stability of the system.
5. The political representation of women is very low in Mauritius. The principal reason
for such a paltry presence of women in Parliament has more to do with the policies
and practices of political parties than the electoral system itself. There are simply too
few women being selected as candidates. To redress this deficiency, it is proposed to
have no more than two candidates of the same sex in each of the twenty FPTP
constituencies in Mauritius. And if there is a Party list in addition to FPTP, it should
be constituted such that there is at least one person of a different gender out of every
three sequential candidates . In the medium term, we should aim for gender parity in
Parliamentary representation as women have all the characteristics to be chosen as
candidates and have demonstrated that they are at par with their male peers. As is the
practice in many mature democracies, the onus for ensuring such representation
should rest with political parties, beefed up by strong guidelines from the Electoral
Commission.
xiv

6. The Mauritius electoral system contains four special features to guarantee the political
representation of all the main segments of the population. These are specially drawn
constituencies, unequal distribution of population across electoral districts, three-
member constituencies and the Best Loser System (BLS). While there is a historical
and an emotional character to the BLS, a compelling analysis shows that its impact is
not substantive compared to the other three features that are used to secure adequate
Parliamentary presence. 82 % of Mps of one particular ethnic group has entered
Parliament over the last 10 elections since 1967 through the normal, non-BLS
pathway. The corresponding figure for another ethnic group is 78 %. For a third
community, the number is a remarkable 100 %. In view of its low impact on
representation, an alternative, credible and modern technique can easily be found to
maintain the objective of the BLS while replacing its operating mechanism.
7. The objective of the BLS can be subsumed into a new mixed FPTP and Party List
electoral system through two sets of measures. First is the retention of three-member
electoral constituencies, coupled with the maintenance of electoral boundaries and the
acceptance of unequal distribution of votersn across constituencies. Second is an
additional tier of 20 Mps combined with a closed, ranked-based Party list to return
these Mps and the provision for double candidacies. Together, these six measures
will inherently provide for socio-demographic inclusion while removing the
communal masonry from our Constitution. It is a win- win situation.
8. The remaining challenge is how to strike the right balance between government
stability and party fairness, especially as these two criteria very often move in
opposite direction. The maximization of proportionality is not always a desirable end.
xv
If we want to preserve stability which is a fundamental feature of an electoral system,
we should avoid pure PR and choose broad proportionality instead. There will still be
some divergence between seats and votes but it will tend to be small and tolerable
compared to the unfairness of the current voting mode.
9. A uniquely designed electoral system based on our context, history and realities is
recommended for a better balance between stability and fairness. It is a mixed system
with a two tier electoral formula. The first tier of 62 Mps will allocate seats
nominally through a FPTP mode while the second tier will distribute seats by party
lists. It will use, in respect of each party, the aggregated votes of all unreturned
candidates from all constituencies to apportion the newly created 20 Party List seats,
subject to a threshold for eligibility. As a result, there will be a Parliament of 82 Mps.
10. This mixed system of 62 FPTP Mps and 20 Party list Mps has the great merit of
bringing down significantly the level of disproportionality between seats and votes
while affording a working majority to the winner. It will also compensate the second
party in case of an alliance taking all 60 seats in Mauritius.
11. Often a country cannot choose a perfect system but has to settle for one that is
significantly less imperfect than other formulae. The best voting system for a country
is not one that satisfies only one criterion completely, but one that provides a fair
balance among the different attributes. A prudent approach is to design an electoral
system that avoids serious shortcomings.
xvi

12. The proposed electoral system is not a perfect one but it has the features to provide
the most satisfactory overall balance between them in a multi-ethnic society,
especially between stability and fairness. It meets all the requirements of a good
electoral system in a plural society. Not all of them perfectly but very satisfactorily.
It produces stability and effectiveness as it gives a working majority to the winning
party even in hotly contested elections. It is fair and equitable as it narrows
considerably the unacceptable distortion between seats and votes, especially for the
second party. It achieves diversity and inclusion in political representation by using
an intelligent combination of the specific features of the FPTP and some well-crafted
characteristics of an additional tier electoral mode. It is significantly inclusive of
women and it ensures accountability by keeping the essential link between
constituents and their elected representatives. It will also shun single issue parties,
promote harmony and foster nationhood.
13. Never has the country been so close to reaching an agreement on reforming the
electoral system. The necessary consensus is there and we need to build on that
momentum to accelerate the process. Reformers have engaged in a very long and
patient exercise and the status quo does not appear to be a durable option anymore.
Today, the balance of probabilities appears to be on the side of reformers. It is only a
question of timing when reform will actually happen. However, it crucially hinges on
the willingness and the desire of political actors and the population at large to make
some historic compromises in order to reach an acceptable and a sustainable
consensus.
xvii
Initiative citoyenne pour une réforme électorale réalisable à Maurice
Roadmap for a better balance between stability and fairness in the voting formula
1. Introduction : who we are, where we are and where we want to go
Electoral reform has raised its head again and has moved from the backburner to a high place
on the political agenda after the publication of the Carcassonne report which proposes a
radical change to most features of our electoral system. That Report alters the voting formula
from a First Past The Post mode ( FPTP ) to a variable multi-member pure Proportional
Representation one; it reduces the number of votes in each constituency from three
candidates to one for a party. All Mps will be chosen by political parties in a closed, rank-
based Party list as opposed to being elected through open choice by voters; the number of
constituencies will be both reduced and redrawn. As to add spice to the debate, there are
proposals to appoint up to 33 % of Ministers from outside Parliament and to have more Mps
in case of defection by members.
Often attitudes on electoral systems in plural societies depend on who you are, where you are
and where you want to go. We are a multi-ethnic, multi-faith and multi-cultural country that
values fairness of representation and inclusion. However we acknowledge that modern
society requires decisive and effective government to achieve social and economic progress.
We also cherish the vital links and accountability between elected representatives and their
1

constituents. We know where we are in terms of how the current electoral system has served
the country since Independence, what are its strengths and its weaknesses. Above all we are
at a crossroad where we want to consolidate the democratic foundations of our country and
move resolutely towards enhanced nationhood. In carrying out reforms to our voting formula,
there is a wish to avoid the dangers of unintended consequences while purporting to cure
existing ones. While a broad measure of agreement exists to remedy the anomalies of the
FPTP electoral system, there is divergence on what should constitute the ideal formula to
replace the existing one. Both the Sachs and the Carcassonne reports must be assessed within
the framework of a search for an electoral system best suited to the realities of a plural
society.
2

2. Spain in the Indian Ocean : Has it worked there and will it deliver here?
The Carcassonne report comes almost ten years after the submission of the Sachs proposals.
While there was near consensus on the adoption of a mixed system – a combination of FPTP
and a dose of PR to correct the inequity of the FPTP voting formula- we now face the
prospects of a complete change of almost every characteristic of our electoral system. It is
my considered view that the deficiency to be remedied in our voting system - essentially the
inordinate disparity between seats and votes - does not warrant such a comprehensive
rejection of the current system and the adoption of a totally different formula. There is
absolutely no need to throw away the baby with the bath water. FPTP has significant intrinsic
qualities that we should retain. What is required is a mechanism to mitigate its key drawback
in certain circumstances in addition to finding an acceptable alternative for broad
representation and inclusiveness.
The model proposed by Carcassonne is very similar to what exists in Spain. It is essentially a
PR formula with variable multi-member constituencies and a closed Party list to return Mps.
The objective, like in Spain, is to have a PR formula with some plurality features that would
facilitate the creation of a majority to govern the country. It is important to acknowledge that
a given voting formula will not necessarily work in the same way in different countries.
Electoral systems that are successful in almost homogeneous societies like Spain might not
necessarily work in plural countries like Mauritius. The history, political environment,
context and specific circumstances of the country should have a determining role in the
choice of the voting formula. An electoral system should not only be fashionable; it should
3
also adequately respond to the circumstances and match the realities of any particular
country. Such a system cannot be bought off the peg; it must be made to measure.
Undoubtedly there are some interesting proposals in the report, even if many have already
been suggested by others before, such as the absolute necessity to forge nationhood, the
enhanced representation of women, the subsuming of the Best Loser System into a new
electoral dispensation and the proof of identity to cast one’s vote so as to avoid
impersonation. Carcassonne and his two distinguished co-authors add their considerable
weight and voice to an illustrious list of forward looking people who militate for fairness of
representation, gender inclusion, diversity of Mps, a constitution and an electoral process that
are devoid of communal stain and a curious mix of ethnic and religious foundations.
However, the report contains many deficiencies, some due to an acute lack of understanding
of Mauritian realities and others attributable to the unintended consequences of some basic
recommendations. Unlike Trustram-Eve, de Smith, Banwell, Sachs and Collendavelloo who
held a series of public meetings, received many written submissions and engaged in
protracted debate and discussion with many political and civil society actors, there was
hardly any consultation and dialogue this time. Not even a focus group research which is
very common in such a sensitive exercise and which could have thrown light on many issues.
It must be pointed out that it is not the first time that a PR voting formula based on multi-
member constituencies and a party list system is proposed. It was suggested as far back as
1957 during the discussion that led to the London agreement. The objective then was to
achieve a compromise between governability and representation via a balanced ticket in
multi-member constituencies. Some 55 years on, we still have to find an acceptable solution
to reconcile stability with fairness of representation. Interestingly, we have also held
4

elections in Mauritius in variable multi-member constituencies between 1948 and 1958.
There were 19 elected legislators in 5 multi-member electoral districts with three returning 3
members each, one choosing 4 representatives and one electing 6 Mps. It was however a
restricted franchise as we did not have universal suffrage of one person one vote until the
general elections of 1959. Furthermore, S A de Smith who was appointed as Constitutional
Commissioner in 1961 made an appraisal of some forms of PR; however after intense debate
and negotiations among the different political stakeholders, he made two proposals with
respect to the voting formula. Both were mixed systems. The first was a combination of
FPTP and Limited Vote while the second was a mix of FPTP and a form of Proportional
Representation in multi-member constituencies. In 1967, Banwell considered, amongst other
electoral systems, some form of PR with 20 three-member constituencies using the D’Hondt
highest average method to allot seats before the country finally adopted the current FPTP
voting formula. No stone was left unturned in the search for the best electoral system for
Mauritius. Even as far back as 1956, many of our compatriots were extremely unhappy
about the prospects of party elites alone deciding on who would be on the list and in which
rank. And half a century on, we face the same challenges.
5

3. Earthquake in paradise : from tranquil efficacy to vengeful revolution
The greatest drawback of the Carcassonne report lies in the fact that in trying to cure one
anomaly of the FPTP system, it creates many other problems. It is crucially important, while
considering reforms, to acknowledge the disadvantages of alternative systems in addition to
their presumed virtues. Equally we must assess whether it is possible to avoid the drawbacks
of the current system without introducing undesirable features and consequences in the new
formula
First is the complete overhaul of an electoral system that has become familiar in Mauritius
over decades and that has served the country reasonably well even if it has some defects.
The Carcassonne formula constitutes too radical a departure from what the Mauritian
electorate and political actors know and what they are all used to. There is hardly any
country that has thrown away an existing system altogether and started with a new one,
except probably in post conflict societies or else after a revolution. Most electoral system
changes that have occurred in the last two decades have built on what existed rather than
jettison everything and take a leap in the dark. In 1993, New Zealand moved from FPTP to a
mixed electoral system with both FPTP and PR. Lesotho shifted, in 2001, from FPTP to a
combination of FPTP and PR. In 1994 Japan changed from a semi proportional system to a
mixed model with both FPTP and PR. In 1998, the Jenkins Commission recommended a
mixed member system with AV (which is a majoritarian mode of election) in replacement of
FPTP in the UK and a dose of PR.
6
Box 1: A short history of electoral systems in Mauritius
7
Mauritius has always held elections under FPTP system which it inherited from Britain, even if
different versions have been adopted since the first elections of 1885 to the last one of 2010. One can
distinguish four electoral formulae that have been used , all based on the FPTP plurality system
From 1885 to 1947,the Council comprised 10 elected representatives out of a total of 28 (the
remaining members were either nominated or ex officio and the Governor). There were nine
constituencies, coinciding with the nine districts, with eight electing one member and one
(Port Louis) returning two representatives. It was however a very limited suffrage. The
overwhelming majority of the people of Mauritius did not have the right to vote.
From 1948 to 1958, we had a variable multi-member constituency mode with 19 elected
representatives out of a total of 35 members. The 19 legislators came from 5 multi-member
electoral districts with three returning 3 members each, one choosing 4 representatives
(Port Louis) and one selecting 6 members (Plaines Wilhems and Black River). The suffrage
was extended but it was still not universal as embodied by the concept of ‘ one man one vote’;
From 1959 to 1966, the country was divided into 40 one member constituencies and election
was again FPTP- based. Besides the 40 elected representatives, there were three ex officio
members, the Speaker and a maximum of 12 nominated members appointed by the Governor.
Universal suffrage was introduced at the General Elections of 1959;
As from 1967 Mauritius has a Legislative Assembly of 70 members made up of 62 directly
elected MPs and 8 Best Losers. The Best Losers are intended to mitigate for relative ethnic
underrepresentation. The elections are held under the FPTP system with the 62 directly
elected representatives coming from 20 three member constituencies in Mauritius and one 2
member district in Rodrigues.
In 1986, France switched from its traditional Two Round System to PR only to revert to the
old system in the following election. Mauritius has always used FPTP to return Mps, albeit in
different forms. It would be difficult to win the hearts and minds of the people and
politicians alike with a radical change. Box 1 gives a short history of the electoral rules from
1888 to today.
Second is the absence of constituency boundaries. In elections that are based on geographical
districts, the boundary delimitations are probably more important than the voting formula
itself. It explains why in 1958, the Trustram-Eve commission proposed both a new voting
formula in 40 single members constituencies characterized by a detailed boundary of each of
these forty constituencies. The two must go hand in hand. Equally in 1966, when the
Banwell Commission recommended a new voting formula based on 20 three-member and
one two member constituencies, it also came up with the existing boundaries of the previous
40 constituencies now combined in the proposed 20 constituencies. The Sachs Commission
did not advocate any change in the number of constituencies even if it called for an
adjustment in the low number of electors in some electoral districts. There was therefore no
need for new boundaries across the country. Carcassonne is proposing between 10 to 12
constituencies compared to the existing 21 (including Rodrigues). Yet we are left guessing
on the boundaries of these new constituencies in mainland Mauritius. He assigns this
extremely daunting and controversial exercise to an Electoral Commission which should be
‘independent, neutral and objective’ in undertaking this mission. This would be a thankless
task as there would be deep division and bitter disagreement. On several occasions, the
country has been unable to agree on small adjustments to be made to the existing 20
constituencies as per the provisions of the Constitution. Equally there was an uproar recently
when boundaries for Municipal elections were redrawn. One then wonders how consensus
8

could possibly be reached on four extremely sensitive and complex subjects: the reduction in
the number of constituencies from 20 to between 10 and 12, the new boundaries of each of
these newly created constituencies, the size and make up of each of them and the number of
Mps. Will the Electoral Commission follow the principles and practices adopted by
Trustram-Eve, thus keeping a fine balance between urban and rural areas and the
composition of these constituencies? Will it also pursue the objectives of the Banwell
Commission when it brought down 40 single member constituencies to 20 three member
constituencies while maintaining a particular balance? Or will it start on a new base
altogether?
Third, there is the risk that no clear majority will emerge from the proposed formula. While
the choice of an odd number of Mps in most, if not all, variable member constituencies and
the adoption of relatively small electoral districts (between 4 and 7 Mps) should help the two
largest parties, it is not at all clear that a majority will be readily forthcoming. Both the theory
and the evidence of elections demonstrate very clearly that the dynamics of elections, the
behavior of parties and the expectations of voters vary considerably as the voting formula
changes. One of the most fundamental ideas in the study of electoral systems is that plurality
modes favour the emergence of a two party (or two coalition) system while PR formulae
encourage the formation of several political parties that generally reflect policy, ideology, or
leadership differences within society.
There is usually a higher number of parties that compete in elections under pure PR than
under FPTP. The campaign itself is different as some small parties would concentrate their
effort and resources in few constituencies where they have a stronghold. For instance in
Belgium where elections are held in multi-member constituencies with PR, there are at least
9

10 parties represented in Parliament. When New Zealand switched from a FPTP to a mixed
system with a strong dose of PR in 1996, there were more parties that entered Parliament. In
France and in the UK, it is easier for smaller parties to win seats for the European Parliament
that use PR than for National elections that return Mps with a majoritarian voting formula.
Paradoxically in France, the National Front usually wins seat for the European Parliament but
not for the National Assembly. A similar situation applies for the Nationalist UK
Independence Party. France adopted a PR formula in one general election in 1986 before
reverting to the Two Round System and it was the only time when the National Front secured
Parliamentary representation.
An analysis of the political consequences of the electoral system of Spain shows that, while it
was designed to constrain the number of parties (identical to what Carcassone is proposing),
it has not altogether prevented the fragmentation of votes. There are of course two major
national parties (PSOE and PP), similar to Mauritius. However there are few small
formations such as the United Left that have some support across the country. And more
importantly, there are some strong regional parties that compete in specific constituencies
and are rewarded by the electoral formula as their votes are concentrated in some few
electoral districts (the Catalan and Basque nationalists amongst others). In some elections
they wield considerable influence as they hold the balance of power. For instance in the
2004 general elections, the third national party, United Left, obtained just two seats with over
800,000 votes which were dispersed across the country while the Catalan nationalist won ten
seats with about the same number of votes which were concentrated in few districts. The Socialists
took 46.8 % of the seats with 43.2 % of the votes. However as they had no majority of seats, they
needed the support of the small regional parties to govern.
10

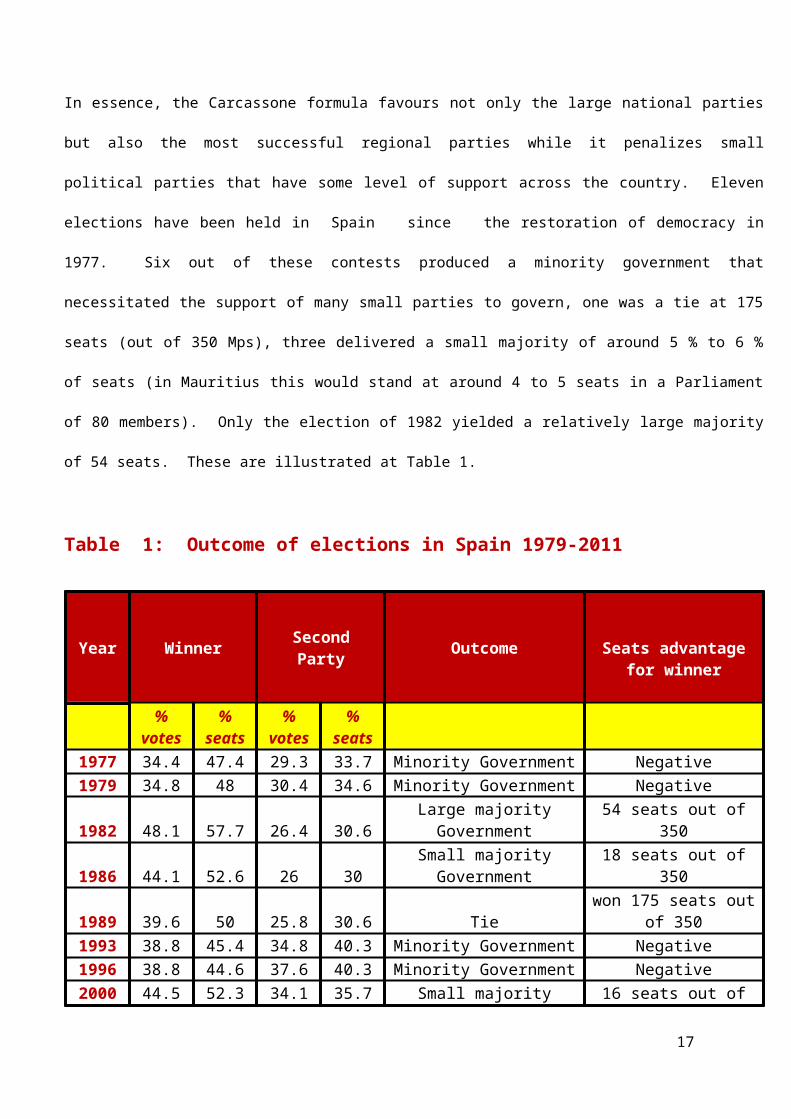
In essence, the Carcassone formula favours not only the large national parties but also the most successful regional
parties while it penalizes small political parties that have some level of support across the country. Eleven elections
have been held in Spain since the restoration of democracy in 1977. Six out of these contests produced a minority
government that necessitated the support of many small parties to govern, one was a tie at 175 seats (out of 350 Mps),
three delivered a small majority of around 5 % to 6 % of seats (in Mauritius this would stand at around 4 to 5 seats in a
Parliament of 80 members). Only the election of 1982 yielded a relatively large majority of 54 seats. These are
illustrated at Table 1.
Table 1: Outcome of elections in Spain 1979-2011
Year Winner Second Party Outcome Seats advantage for winner
% votes
% seats
% votes
% seats
1977 34.4 47.4 29.3 33.7 Minority Government Negative1979 34.8 48 30.4 34.6 Minority Government Negative1982 48.1 57.7 26.4 30.6 Large majority Government 54 seats out of 3501986 44.1 52.6 26 30 Small majority Government 18 seats out of 3501989 39.6 50 25.8 30.6 Tie won 175 seats out of 3501993 38.8 45.4 34.8 40.3 Minority Government Negative1996 38.8 44.6 37.6 40.3 Minority Government Negative2000 44.5 52.3 34.1 35.7 Small majority Government 16 seats out of 3502004 42.6 46.9 37.7 42.3 Minority Government Negative2008 43.8 48.3 39.9 44 Minority Government Negative2011 44.6 53.1 28.7 31.4 Small majority Government 22 seats out of 350
The figures show that the winning party requires around 44 % of votes to be almost certain of having a small majority
to govern. This depends crucially on the distribution of votes across all constituencies. It is quite likely that this
level of vote would not produce a majority in Mauritius because of the concentration of votes of the two major
parties in specific electoral districts and the performance of some small parties with relatively moderate regional
electoral enclaves.
11
The same phenomenon could very well happen in Mauritius. It may or may not occur immediately
but it will almost certainly take shape in the medium to the long term after the new voting formula
would have stabilized. The ingredients for such eventuality already exist in our electoral system. A
detailed study of the 10 elections since 1967 shows that attempt at fragmenting the system has been,
to a large extent, thwarted by the FPTP formula. However with PR in multi- member constituency,
there will be more parties in the starting block. Of course, the two large parties will have an
advantage. However small regional parties could fragment the system and prevent the creation of a
stable majority. Such examples abound in our electoral landscape.
In the North, Dulloo of the MMSM attracted 29 % of votes in Grand Baie/Poudre D’ Or in 1995
while Busgeeth took 11.2 % of votes in Piton/Rivière Du Rempart in 2010. In the East, Dayal of
MDN captured 38 % of the votes in Montagne-Blanche/Grand River South East in 2000, while
Hawaldar of PSP earned 14.8 % of votes in Flacq/Bon Accueil in 1976. In the South, Bissondoyal of
the IFB won 22 % of votes in Vieux Grand Port/Rose Belle while Molaye had 12 % of votes in
Rivière des Anguilles/Souillac in 1976, AhYan of FCL polled 10 % of votes in Mahebourg/Plaine
Magnien in 2005 and 2010, Ramsahok of PAL took 12.7 % of votes in that same constituency in
1995 while Lutchmeenariadoo of MDL garnered 16 % of votes in Rivière des Anguilles/Souillac in
that same elections. Gaetan Duval formed a party on the eve of the 1995 elections and obtained a
relatively good share of votes in 5 urban constituencies, including 4 in Plaines Wilhems.
Gaetan Duval of PGD obtained 38 % of the votes in Curepipe/Midlands in 1995. The PMSD
usually does well in many urban ridings where historically it has a stronghold. And the most
recent phenomenon is the rise of the FSM of Meeah in Port-Louis Maritime/Port-Louis East
and Port Louis South/Port Louis Central. All these small parties could win one seat in
relatively large multi-member constituencies. This would deprive the winning party of the
odd seat required to have an edge in the constituency. For instance, if constituencies 2 and 3
were merged and there were 5 Mps, it is clear that FSM would take at least one seat with a
12

vote tally of around 15 % under a PR format. And neither the Labour Party nor the MMM
would have a majority in that constituency, even with an odd number of seats.
The same pattern could happen in other constituencies. Better these small parties could enter
into a tactical alliance asking their supporters to vote for some specific parties in
constituencies where they do not field candidates. Of course there could be other
possibilities. Two small parties that complement each other (say the MSM in rural areas and
the PMSD in urban districts) could join forces and create a third formation that would
deprive either the LP or the MMM of a majority in most, if not all, the newly created
constituencies. This would be very similar to what happened in the 1976 general elections. In
addition to these regional parties, there is also the MSM which has some support across most,
if not all, constituencies. The party landscape is almost a carbon copy of what exists in Spain.
The MSM, on its own, could potentially win few seats in some specific constituencies with
around 11 % of the votes, even if its national average is much lower. It attracted 19 % of
votes in 1995. It depends on the distribution of votes across the country. If it is low and
evenly spread across the constituencies, its chances are low. However if it is concentrated in
few electoral districts (as appear to be the case), then it could win few seats. The same logic
would apply to the PMSD with relatively moderate support in some urban districts. It did
win some moderate support in the 1976 and 1982 elections.
The fragmentation of votes among many political parties will make it difficult for the
electorate to have a clear choice for a team to govern the country. Carcassonne implicitly
recognizes this problem and attempts to mitigate it by recommending a raft of measures to
insulate the system against such weaknesses. Mps could vote even when they are not
physically present in the Assembly, new members would be appointed when an MP defects
from his/her party, the procedure to dislodge a sitting Prime Minister becomes more difficult
13

with a ‘constructive vote of no confidence’ and the PM keeps the threat of early dissolution
as a strong deterrent. However all these may be redundant if, after the elections, there is no
clear majority that emerges because of vote fragmentation. This may destabilise the political
system, resulting in weak, ineffective and unstable government.
An extremely bold attempt is made to test the Carcassone model using some realistic
assumptions about constituency boundaries, geographical support of the two main parties and
the likelihood of a third political formation fragmenting votes in few constituencies.
Following the rationale adopted by the Trustram-Eve and Banwell reports, eleven
constituencies are constituted from the existing twenty (plus one for Rodrigues).
The main highly realistic assumptions underpinning the hypothetical outcome are as follows:
(i) There are 11 variable member constituencies. Six have seven Mps, four choose five
members and one elects six Mps and there are two elected representatives in
Rodrigues, making a total of 70 seats. The size of the constituency varies according
to the population ratio;
(ii) The existing 20 constituencies are collapsed into 11 new ones, following a particular
pattern. Some combinations are very obvious (Grand River North West/Port Louis
West and Beau Basin/Petite Rivière, Port Louis South/Port Louis Central and Port
Louis Maritime and Port Louis East, Grand Bay/Poudre D’Or and Piton/Rivière du
Rempart, Vieux Grand Port/Rose Belle and Mahebourg/Plaine Magnien,
Vacoas/Floreal and Curepipe/Midlands and Belle Rose/Quatre Bornes and
La Caverne/Phoenix) while others will require some subtle geographical and
demographic engineering;
14
(iii) Party A has a majority of votes in five constituencies while Party B has an edge in
three electoral districts. The contest in the remaining three constituencies is close.
(iv) Party C is an aggregation of residual parties and encompasses many possibilities.
From a combination of many regionally-based parties to one national party with some
support across constituencies. For instance, it could represent FSM in Port Louis,
MMSM of Dulloo in the North, MDN of Dayal or IFB in the East, Ah Yan type civil
society movement or IFB in the South and PMSD/PGD in Plaines Wilhems. All have
some regional strongholds. Or alternatively, it could stand for a party like the MSM.
Or both at the same time. The determining factor is the high probability of some
degree of fragmentation away from the hold of the two major parties on the system.
Not necessarily immediately but certainly over time. In Spain, a party that polls
around 44 % of the votes is likely to have a small working majority. This is quite
unlikely in Mauritius because of the dynamics of the elections in the 11
constituencies. At 44 %, the leading party will probably have a plurality of seats
(around 32 to 34 out of 70) but will not have an absolute majority, especially with the
two seats from Rodrigues not contested by the two largest national parties. Under
these circumstances, the combined forces of the Opposition (including the two Mps
from Rodrigues) may be higher than that of the party coming first in the electoral
contest.
Table 2 illustrates the difficulties of having a stable and a strong government with the Spanish-like
model proposed by Carcassonne, adapted to the local context.
Table 2: Hypothetical results of elections held under Spain-like electoral system
15

Constituency Seats A B C
% votes Seats
% votes seats
% votes Seats
1 7 41 3 56 4 2 02 5 40 2 39 2 18 13 7 54 4 39 3 4 04 7 53 4 33 2 12 15 7 55 4 32 2 12 16 5 53 3 43 2 3 07 6 54 4 40 2 5 08 5 49 3 47 2 2 09 5 42 2 53 3 3 0
10 7 47 3 51 4 1 011 7 45 3 42 3 12 1
Rodrigues 2 2
Total seats 70% vote 49 43 7Seats 35 29 6
% seats 50 41.5 8.5
Party A attracts above 50 % of votes in five constituencies and between 40 % and 49 % in the
other electoral districts. Party B captures over 50 % of votes in three ridings, between 40 %
and 47 % in four districts and between 32 % and 39 % in another four constituencies. Party
C which combines many parties has some relatively moderate support in 4 constituencies
only. Using the D’Hondt formula to apportion seats at constituency level, the overall results
show Party A with 35 seats, Party B with 29 Mps and Party C with 4 elected representatives.
If the two Mps from Rodrigues (likely to be from two different parties because of the
proportional system) are not counted as being on the side of Party A, there is no majority,
even with 49 % of national votes. Of course small variation in terms of votes could change
the results slightly. But the impact would be marginal in terms of the overall outcome. And
the above simulation is most probably a best case scenario. With less than 45 % of votes, the
16
system becomes more fragmented. While it is highly proportional (Party A has 50 % of seats
with 49 % of votes while Party B captures 41.5 % of seats with 43 % of votes), it would not
produce a working majority to govern the country. Post-election negotiation will be
required to form a coalition government.
Representative government must not only represent, it must also govern. Simulations show
that the number of seats is probably too low to have a clear winner from the 11 new
constituencies on mainland Mauritius. In a constituency where there are 6 elected MPs, a
party with 57 % of votes and another one with 43 % may each win 3 seats. While the
proposal to have an odd number of seats may help, overall it could be nullified by the
existence of party strongholds. For instance, the one seat advantage of the Labour Party in
the North could be wiped out by one additional seat for the MMM in Lower or Upper Plaines
Wilhems. Even at 45 % or more of the votes, the majority is extremely thin while in some
cases, government formation will depend on the two Mps from Rodrigues. The proposal to
have a PR mode of election with two seats only for Rodrigues is difficult to understand. A
party with 66 % of the vote will win one seat and so will another with only 34 % of votes.
On the other hand, the larger the constituency, the higher the likelihood of party
fragmentation! It is a difficult balance to maintain.
Fourth, there is the danger of not meeting the diversity/plurality criteria at the constituency
level. Under PR it is easier for some small groups to obtain political representation. However
the low level of seats in many constituencies, the tendency of the two largest parties to field
candidates with more or less the same profile in many districts and the likelihood that the
rank of a candidate will vary directly with the share of voters with similar characteristics to
him/her will combine to deny representation to some components of the population. There is
17

a positive correlation between large-district PR electoral systems and the success of small
groups in securing Parliamentary representation. In large multi-member PR districts, it is
possible for small sections of society to form part of a balanced ticket. This is similar to the
rationale behind three member constituencies as they are more likely to return members of
small groups than single member districts. At times, the constituencies also are
‘gerrymandered’ to produce a Parliament that is a microcosm of society. Simulations show
that with a low number of seats, it would be extremely difficult to have a diverse and
balanced slate from each of the newly proposed constituencies. While the system could attain
the objective of equity in terms of party representation at the national level, it may not be
inclusive of the rainbowness of the nation.
Fifth, the electorate is disenfranchised as it is party elites that decide who goes on the list, in
what order, who is elected, and who forms the Government. While it is possible to agree to a
percentage of Mps being returned through a closed Party List (this will be important to
subsume the BLS into the new system), it is highly questionable when 100 % of Mps are
chosen in that manner. It means that however people vote, it is the party’s choice that is
likely to prevail. Political power is thus removed from voters and entrusted to the party
apparatus. As such it is very ineffective in disciplining politicians as voters do not have a say
in the composition of Parliament. Leaders become even more powerful as they have
enormous influence in choosing candidates for the PR list. Internal party debate and
discussion become much more difficult. MPs lose their independence as their fortunes lie in
the hands of party elites. Their role is thus restricted to the whims of party leadership and
party machinery, with little freedom of action for legislative work and constituency services.
Sixth is a weakening of the important link between elected representatives and their
constituents as it exists in a FPTP system. As Mps will depend on the party and not on the
18
electorate to be elected, they may lose interest in constituency work and not respond to the
specific needs and wishes of voters. This may pose a major problem of political
responsiveness and accountability. In a closed Party List system, the voter cannot express
his/her dissatisfaction through any means but to refuse to vote for the party. Important local
and community issues cannot be well articulated as in a plurality mode of election. Elected
representatives know very well that electors can punish non-performers by voting them out of
office at the next electoral contest. In marginal seats, sitting MPs tend to perform more
constituency services as these could improve their prospects for re-election. This link will
weaken in the new PR mode and this is not good for the consolidation of democracy. While
a degree of choice by Party elites may be necessary to reassure some components of our
society about inclusiveness of representation, it is a major concern when all Mps are returned
on that basis.
Seventh, is the relatively high probability of small parties wielding power that is
disproportionate to their electoral strength. A fragmentation of the political system requires
many parties to form a government. For example, if one large party captures 42 % of the
seats and a second one takes another 40 %, a small party with 11 % of the seats could hold
the balance of power, thus becoming the kingmaker. Under these circumstances, it is the
third party and not the voters which decides who will govern the country. It may even exert
undue power and influence in the governing coalition by seeking major concessions from
their senior partner on many policies. And ‘this tail wagging the dog’ situation may not be
supported by a large majority of voters. The small parties can even bring down Governments
by shifting political allegiance between elections, as the FDP did in 1982 in Germany. PR
and coalition government could allow small parties much greater representation and input in
the political process than the electorate has expressed. In some instances, the second and
19

third parties could come together in a coalition and deprive the most popular party of a place
in Government. It could also encourage corrupt practices to form Government and to stay in
office.
Eighth is the temptation to balkanize the political system with the proliferation of parties.
When there are multiple social cleavages, and social groups are structured into distinct
organisations, the use of a pure PR in multi member constituencies may aggravate the
fragmentation and political differences will be magnified. It will thus further entrench
divisions and encourage the emergence and legitimizing of single issue parties. Each party
believes it can win some representation by appealing to its group only. This could lead to
polarized pluralism where parties stick to their social groups and compromise becomes very
difficult. If voting continues to be on ethnic considerations, PR can entrench political
commitment along communal lines. To some extent, this is what happened after the general
elections in Belgium in 2010 when the country became bitterly divided along linguistic and
cultural cleavages.
Ninth, is the high probability of a gap between the election result and the composition of the
government?. Government formation often takes a long time after the results of elections
under PR. In FPTP, on the very night of the results, the population usually knows who will
be in power and who will lead the Opposition. Under PR, Government formation depends
very much on post-election discussions and negotiations in secret meetings between party
leaders. It may not be the direct outcome of a popular mandate. Belgium was without a Government
for almost 16 months after the 2010 elections. It uses a pure PR voting formula and returns Mps in
variable multi-member constituencies.
Tenth, is the bias of the formula against small and even medium parties that have broad but shallow
national support compared to those with strong regional support. A small party with 10 % of national
20
vote may not win a single seat if its support is evenly spread across the country. However one party
that has a stronghold in one or two constituencies (of around 15 % in one district) but no overall
following across the country could gain Parliamentary representation. The fortunes of small and
midsized political parties will hinge on the performance of the big parties. In a constituency with 4
seats, the threshold for eligibility to one seat could be as high as 18 %. It may come down to around
14 to 15 % for five seats and 10 to 11 % for seven seats. In a hotly contested election with no party
winning more than 35 % of the votes, it could be possible for a small party to squeak through with
one seat with 10 % of the votes.
Eleventh, the proposal to handle defection of PR Mps is pregnant with difficulties. In FPTP system,
voters elect individuals while in closed PR mode, it is the party that is chosen. The right of the
individual Mp returned on a Party List to stay in Parliament after leaving his/her party is extremely
tenuous as the vote is specifically for the party and not for the individual. This is why the law, in
many countries where there is a closed Party list, requires the member to vacate his/her position and
to be replaced by someone else on the list. However the rules and procedure for such replacement
must be very clear to avoid any abuse by Party elites, especially with respect to independent minded
Mps. The suggestion to replace the defector by someone else could potentially lead to a huge
increase in the number of MPs between elections. Also this provision could encourage abuse and
corrupt practices. Thirty five years on, one still does not know why a duly elected Mp in 1976
resigned a couple of days after election to be replaced by someone who had lost his seat. In the new
system, the temptation is higher as the defector does not even sacrifice his seat!
21

4. Avoiding some pitfalls: what’s mine is mine, what’s yours is negotiable
Right from the outset, it should be clear that electoral rules are not neutral in their translation
of votes into seats. There is nothing automatic about the way in which votes are converted
into seats and different electoral systems will perform this function in different ways. Often
the electoral formula will influence the political colour of a country’s Government, the
relative strength of the various parties in Parliament and very likely the identity of the Prime
Minister. The electoral system may even influence the way people vote.
Proposals for reforms often suffer from three main drawbacks. First, parties often favor the
status quo from which they have benefitted and/or are likely to benefit .They could also
introduce changes either to increase their chances of success or to prevent their opponents
from winning. Second, political actors, however well intentioned, may not always have all the
knowledge and the information to fully grasp all the consequences and ramifications of
different electoral systems. Unfortunately, some may even have the tendency to believe what
they know best is what is best for the country or what is best for their party is also best for the
country. Third, electoral reforms are rarely made in a political vacuum. It depends on
contextual and temporal factors.
Political parties often embrace strategies that would maximize their chances of converting
votes into seats in Parliament, especially in the immediate term. Some often change their
position on electoral reforms depending on how the system has treated their electoral fortunes.
This is true in many countries and the most glaring example is probably from the UK. When
the Liberal Party was in power at the turn of the 20th century, it was opposed to PR as it
benefitted from the FPTP process; today as it is severely penalised by the current FPTP
22

electoral system, it is the most articulate proponent of PR. When the Conservative Party lost
the General Elections of 1974, it proposed a review of the system. However it quickly
changed its position as the FPTP kept it continuously in power for 18 years from 1979 to
1997. During that period it was the Labour Party that fought for electoral reform as it was
disadvantaged by the formula, while between 1945 and 1979 they were quite hostile to
reforms when they were often in office. As a consequence, the Jenkins report, which was
commissioned by the Labour Government that came to power in 1997 to make
recommendations on electoral reform in the UK, stated that this attitude has prompted
‘the cynical thought that there has been an element of the devil was sick, the devil a monk
would be, the devil was well, the devil a devil he’d be…. about the attitude of all parties to
electoral reform’.
It is all too often about realpolitik and party partisanship. A good reform should avoid these
pitfalls. Some politicians are often tempted to use their knowledge to design electoral systems
to promote formulae which they think will give them a partisan advantage. This could lead to
choices that are not the best ones for the long-term political development of the country with
potentially far reaching consequences for the democratic process. As the choice of electoral
systems is one of the most important institutional decisions for any democracy, it is important
to understand the need for reforms, grasp the consequences of each proposal from a normative
standpoint, draw on the experience of other countries and build the necessary consensus for
implementation. The worst that could happen is an attempt to satisfy the short term objectives
of some political parties. This occured in France when the Socialists changed the electoral
system for the 1986 Legislative Elections from a Two Round System to a PR mode, some
months before the election in order to gain an unfair advantage. In the process they let in the
right wing extremist National Front with 35 Mps, as the purpose of the new electoral formula
23

was to divide the votes of the Right to ensure victory for the Left. Not only did the Socialists
lose, but the “partisan” formula was changed very quickly and the following election in 1988
was held under the old Two Round Formula. Worse, that political shenanigan of the Left
started the rise of the Extreme Right, which culminated in the defeat of the Socialist
candidate, Lionel Jospin, in the first round of the 2002 Presidential election. What an irony!.
This is a classical example of perceived short term gain for long term atrocious pain. In fact it
was not even an immediate gain as the Left lost the 1986 Elections. Hoist with its own petard!
.A partisan approach would lead to frequent changes in the electoral system as new
governments attempt to concoct recipes to their advantages. This occurred in Mexico where
the five elections between 1985 and 1997 were held under five different electoral systems!
The one-sided approach led to constant changes in the electoral formula until the adoption of
a consensual mixed member model in 1997. It should be abundantly plain that nobody could
contemplate
"tribal politics being allowed to choose a new voting system"
as eloquently stated by a Labour MP in the UK. As the choice of a particular electoral system
has far reaching consequences on the future political life of the country and as, once chosen, it
often stays in force for a very long period, we cannot afford a half-baked or a partisan
solution. We need to be alert to the unintended consequences of reforms as, if conducted for
short term partisan benefit, a country may fare worse than what it bargained for. It is of
utmost importance for the stability and the progress of the country that we build consensus,
seek legitimacy and secure wide acceptance for a change in the electoral formula. The new
system should also be robust and sustainable.
24
5. Curing the defects of FPTP: beware of unintended consequences
Which electoral system is best depends on just what we want it to do. In many countries the
electoral system itself is a major political issue. Some would like it changed while others
vigorously defend the status quo. It all depends on the criteria employed to evaluate an
electoral system.
It is my considered view that in a plural society like Mauritius we need to focus on six core
values as follows:
(i) government stability: the electoral system must provide for stable and strong
government that is capable of taking decisive action;
(ii) party fairness: there must be a fair distribution of seats to votes to political parties
even if it does not have to be a scrupulous mirror image;
(iii) broad based socio demographic inclusion: various segments of the population must
secure adequate political representation;
(iv) gender representation: the system should encourage the involvement of women in
the political process and their presence in Parliament;
(v) accountability: the electoral system should maintain and indeed strengthen the
linkages between MPs and their constituents and encourage political responsiveness;
25
(vi) avoid communal parties: the voting formula should not exacerbate divisions in a
multi-ethnic society.
It is almost impossible for one electoral formula to satisfy all these attributes. In fact some of
them are mutually exclusive and often it is possible to achieve one particular objective only
at the expense of another. As a result an electoral system must balance various objectives
and values. Specialists differ on which criteria matters most when choosing an appropriate
electoral system as the exercise involves many trade-offs and a careful balancing act. That is
why there are so many electoral systems around the world. Each country has its own sets of
values and applies them in designing its electoral formula.
Our unique FPTP electoral rules (three member constituency with BLS) have delivered on
most of the core values of a good electoral system. They have performed well or very
satisfactorily on stability, inclusion and accountability. We have also largely avoided
communal parties. As shall be shown later, the low level of female representation is not an
inbuilt characteristic of the voting formula. It is due to other factors. The main drawback of
FPTP is the inequitable distribution of seats to votes in certain elections.
It seems to me that the two principal tasks to be accomplished in a reform of the FPTP
system ought to be as follows:
(i) to cure the very high disproportionality between seats won and votes polled which
leads to significant underrepresentation of some parties. And to remedy the
amplification of ‘winner takes all’, where one alliance could obtain 100 % of seats
with around 51 % of votes, thus leaving no elected representation at all to other
26

parties with a relatively high share of votes. This can be done by introducing a
greater degree of fairness, measured by a better distribution between seats and votes,
in our electoral system;
(ii) to ensure, in so doing, that the stability of the system is not undermined. It is assessed
by the need to secure effective and stable government. This is important as very often
the objective of greater fairness can only be achieved at the expense of stability.
However in the process, two other issues have emerged and require solutions.
(i) First is gender representation: while it is an extremely important issue, one must
acknowledge that it is has nothing to do with the reform process itself as the lack of
women representation is not necessarily an intrinsic weakness of our three member
FPTP voting formula;
(ii) Second is the future of the Best Loser System: The aim of reforming the BLS is
certainly not its pure and simple abolition but rather to find a viable alternative that
keeps its objective of ensuring that all sections of the population are adequately
represented in Parliament. However this will be achieved by using a different and a
modern mechanism that will reassure the communities concerned about broad-based
representation while removing its unacceptable features.
I shall deal with each of these two issues before turning to the crucial debate between
fairness and stability.
27
6. Gender fairness : The discreet charm of a much simpler solution
The FPTP electoral system of Mauritius cannot, on its own, explain the low representation of
women. While it is true that a single member constituency (as in the UK, Canada and India)
makes it very difficult for women to be chosen as candidates, this need not be the case in our
specifically-designed three member constituencies that encourage a balanced slate of
candidates. The principal reason for the low representation of women has more to do with
the policies and practices of political parties rather than the voting formula. For the 10
elections in Mauritius between 1967 and 2010, the number of women fielded as candidates
by the two main parties (three in 1976,1982 and 1995) stood at 88 out of 1380 candidates,
representing only 6.4 % of total candidates. It started extremely low in the early elections
and has grown over the years, even if it stays very low compared to the size of our women
population. If women are not selected as candidates, they simply cannot be elected to
Parliament. Unsurprisingly, the average Parliamentary representation of women was very
low at 7.4 % for these ten elections. As shown at Table 3 below, it ranged from 0 % in 1967
to 9 % in 1995, 17 % in 2005 and 19 % in 2010. The same underrepresentation exists at
cabinet level with usually only 4 % of Ministers being women (at best 12 % before the break-
up of the LP/MSM/PMSD alliance in 2011 with 3 women Ministers out of a cabinet of 25).
In Rwanda women represent around 56 % of all Mps. In Sweden it is at 45 % while in
Seychelles it stands at 44 %. Female representation is at 39 % in Mozambique and 36 % in
Spain while Tunisia’s first democratic elections returned 26 % of women Mps.
28
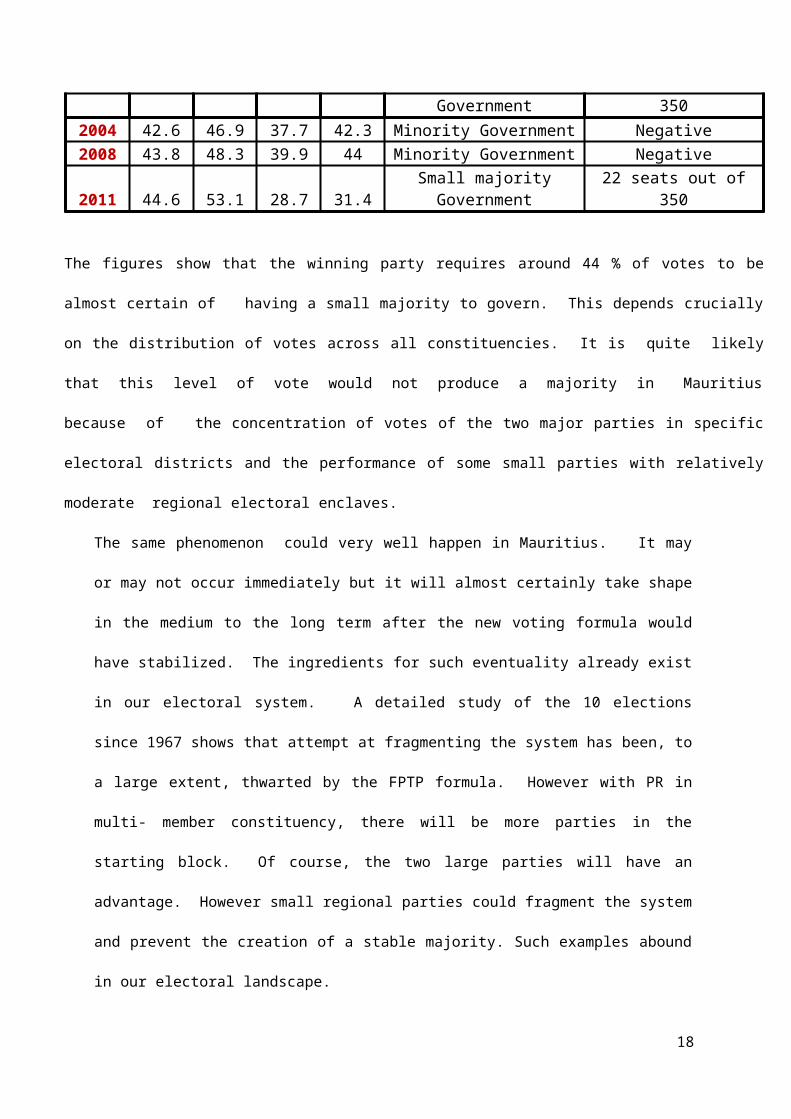
Table 3: Gender Unfairness in Mauritius: Number of candidates and Mps
YearWomen
Candidates
Total Candidate
s
% of women
Women Mps
Number of Mps
% of Women
Mps
1967 1 120 0.83 0 70 0.00
1976 5 180 2.78 3 70 4.29
1982 4 180 2.22 2 66 3.03
1983 6 120 5.00 4 70 5.71
1987 6 120 5.00 5 70 7.14
1991 3 120 2.50 2 66 3.03
1995 14 180 7.78 6 66 9.09
2000 12 120 10.00 4 70 5.71
2005 16 120 13.33 12 70 17.14
2010 21 120 17.50 13 69 18.84
1967-2010 88 1380 6.38 51 687 7.42
The political system has been traditionally dominated by men , and women have considerable
difficulties in being selected as Parliamentary candidates. However when women candidates
are fielded by political parties, they have absolutely no problem to be elected. 16 women
were chosen as candidates in 2005 and 12 of them were returned as Mps. Equally in 2010,
21 women were selected as candidates and 13 were elected. There is no evidence of
reluctance by the electorate to vote for female candidates on a gender balanced slate in three
member constituencies. The obvious reason accounting for the 19 % presence of women in
the current Parliament is the fact that more women were selected by their parties in 2010 than
in previous elections. As simple as that!
29

Women have been elected to office across the country and at times in top position as
evidenced by the 2010 results in Grand River North West/Port Louis West, in Port-Louis
Nord-Montagne Longue and in Piton- Rivière du Rempart (it has happened in other
constituencies in previous elections). They are elected in the east, west, south and north of
the country, in Port Louis and in both lower and upper Plaines Wilhems. There are currently
two constituencies (Port-Louis North-Montagne Longue and Vacoas-Floreal) with three
women Mps each and one (Savanne/Black River) with two female representatives. The
argument of reluctance and resistance from the voting public is both a nonsense and an insult
to the intelligence and maturity of our population. Equally the argument of culture, history,
sociology and societal values does not stand the test of empirical evidence, especially today.
Can we consider a political system where more than 50 % of the population is excluded from
the political decision making process as a fair and an equitable one? Would the situation have
been different if parties were not male dominated and women were more assertive
politically ? Especially when the same system guarantees seats to other cohorts in the
population that account for far less than 50 % (in some cases as low as 5 % based on ethnic
representation) and when candidates are chosen on the basis of belonging to a smaller pool
(various communal and sub communal groups). As women, like men, share all the
characteristics of the nation, political parties should have absolutely no problem to factor in
appropriate balancing of elements other than gender when choosing women candidates. Even
in countries with a history and culture of discrimination against women (like South Africa),
significant progress has been made in gender fairness through the use of many techniques,
including quotas over a relatively short period. Reserved seats (only for women) as they
exist in Rwanda, Uganda, Tanzania and Burundi are certainly not the way to proceed. It is
also not recommended to embed quotas in our constitution or to entrench it in an electoral
30
law as these might arguably be challenged in court. The trend worldwide is to encourage
parties to change their constitution and internal rules to adopt voluntary quotas for greater
gender participation at elections. The Party quota could be beefed up by strongly worded
guidelines from the Electoral Commission and a policy of ‘name and shame’ and moral
suasion, especially by the voters. And it is working in more than 30 countries, including
South Africa where women represent around 44 % of Mps and 30 % of Ministers. In its very
short history of Parliamentary democracy, women have been elected as both Speaker and
Deputy Speaker of the House. These are due to the policies and affirmative action
mechanism embraced by the ANC since the first post–Apartheid elections in 1994. The quota
is not in the Constitution, in spite of the fact that women have suffered the indignity of
several inequalities during the cruel apartheid era.
Plural societies need policies and institutions that foster accommodation and encourage
cooperation among different groups. They also require an electoral system that is inclusive
from both a socio-demographic and a gender perspective. The key challenge is whether this
should form part of a social compact, a consociational convention or it should be embedded
in the constitution or another legislation. Mauritius has a very long history of tolerance,
peaceful coexistence and mutual understanding. We are often cited as an example where
different ethnic, religious, linguistic and cultural groups live well together. Why do we need
legislative and constitutional constraints to compel us to do the things that a nation should do
towards all its citizens ? Why do we require a legal force to accept the simple and natural fact
that women have a fundamental and a democratic right to fairness in political and
parliamentary representation ? Why should we have legislation to compel us to ensure
adequate political representation to all the colours of our rainbow nation? In all walks of life
in contemporary Mauritius, we give and share and accept it as a vital condition for successful
31

nation building in a multi-faith society. Why can’t political parties assume their
responsibilities towards the nation and behave as mature parties do in well established
democracies?
Table 4 depicts how quotas are implemented in countries where women account for more
than 30 % of Mps. Countries with reserved seats are excluded from the analysis. It is
interesting to note that women representation is generally higher at 58 % in the voluntary
rather than in the legislated systems. It is important to highlight which countries use one
method as opposed to the other one and which ones Mauritius should follow. Most mature
democracies like Mauritius use voluntary quotas by parties that often include them in their
constitution and internal rules.
While the recommendation of Carcassonne on women is commendable (the first two
candidates on the Party List to be of different gender), similar, if not better, proposals have
been made before. There is a very simple solution that should be adopted. We should provide
for the list of candidates in each constituency to comprise no more than 2 persons of the same
sex. And on the Party list, we should ensure that neither gender represents less than 33 % of
candidates and there is at least one person of a different gender out of every 3 sequential
candidates. This has the merit of assuring both sexes in terms of both numbers and rank on
the Party list.
Unfortunately it has not been implemented. It should be pointed out that this
recommendation is not related at all to electoral reform. Even in the current FPTP system, it
can easily be introduced if there is political will by parties. I must also emphasise that in the
medium to long term, we should aim for equality between men and women in Parliamentary
32
representation. Women have all the characteristics to be chosen as candidates. No more but
certainly no less than men. We have hesitated for too long on this issue and we have not even
fulfilled the commitment of all member states ( including Mauritius) taken at the SADC
summit of 1997 in Malawi to achieve at least 30 % women’s representation in Parliament by
2005. It is high time that we implement this decision, regardless of reforms to the voting
formula.
Table 4: Type of quota in countries with high percentage of women Mps
Country % of Womenin Parliament
Type of quota
Sweden 45 Voluntary
South Africa 44.5 Voluntary
Seychelles 43.8 Voluntary
Iceland 42.9 Voluntary
Finland 42.5 Voluntary
Norway 39.6 Voluntary
Belgium 39.3 Legislated
Netherlands 39.3 Voluntary
Mozambique 39.2 Voluntary
Denmark 39.1 Voluntary
Angola 38.6 Legislated
Costa Rica 38.6 Legislated
Argentina 37.4 Legislated
Spain 36 Legislated
Nepal 33.2 Legislated
Germany 32.8 Voluntary
Ecuador 32.3 Legislated
New Zealand 32.2 Voluntary
Macedonia 30.9 Legislated
7. Subsuming the Best Loser System : promote inclusion, foster nationhood
33

One of the important issues facing democratic plural societies is the inclusion of diverse
racial, ethnic, religious, linguistic and cultural groups in the political process, especially in a
FPTP system where often it is ‘winner takes all’. The problem is further compounded when
some groups are small and dispersed geographically. Countries have tailored different
mechanisms to address the issue of inclusiveness and broad based socio-demographic
representation. Often there are difficult trade-offs involved in these choices. With some
electoral systems, even free and fair elections cannot always assure the representation of all
groups and interests. The legitimacy and stability of a democratic system is challenged when
it fails to include all groups in the decision making process. It is essential, especially in
plural societies, to provide representation and to avoid marginalization and exclusion. The
presence of all segments of society in Parliament strengthens representational links,
encourages more positive attitude towards institutions and fosters legitimacy and
acceptability.
The two broad electoral systems that exist- PR and FPTP- address the problem of diversity
and inclusion very differently. The focus of FPTP is effective, strong and responsive
government and not the representation of all shades of opinion in society. In such system
there is no universal answer to the question of how groups that are relatively small in size
and geographically spread should be represented in Parliament. Some countries ensure such
political representation by providing special electoral law requirements for them. These are
‘institutional workarounds’ to give comfort to all segments of society. Mauritius has used
various mechanisms to ensure that all sections of the population are adequately represented
in Parliament while keeping the FPTP for its intrinsic qualities.
The Mauritius electoral system is very unique in four of its features. These attributes are
particularly designed to enable political inclusiveness in FPTP. Had Mauritius chosen a PR
34
system in 1967, there would have been no need for the BLS as the primary purpose of PR is
to provide representation to all groups in society. As PR was not accepted as a voting
formula and FPTP was instead retained, there was a necessity to include some special
features in the system to guarantee the political representation of all the main segments of the
population.
There are four such features in our voting formula. They are as follows:
(i) specially drawn electoral districts: this is a case of ‘benign gerrymandering’ as the
boundaries of some constituencies are drawn in such a way as to ensure to each main
component of the population the maximum chance of electing representatives to
Parliament in the areas where it is numerically strong. The 40 single member
constituencies were brought down to 20 three-member constituencies in such a way
that the dilution of some specific groups was minimized. Many ‘specially drawn’
constituencies were thus created to ensure broad representation. The risks of
affecting the electoral system were considerably diminished by an intelligent pairing
of constituencies. More importantly it was done to allay the apprehensions of some
segments of the population who were concerned about political exclusion. This was
an example of electoral engineering to fit the context and the circumstances of the
day. The boundaries were drawn by Banwell, following the principles initiated by
Trustram-Eve in 1957 in the setting up of forty one-member constituencies. We still
have this legacy of boundaries drawn to reflect some socio-demographic realities!
(ii) malapportionment of constituencies: it refers to inequality in the population size of
electoral districts. Here the ethnic balance of the constituencies is not unduly
35

disturbed by either demographic changes or population movements across the
country. The consequence of maintaining such a balance is a significant disparity in
the size of the 20 constituencies. To encourage diversity and plurality, especially for
groups which are dispersed across the country, our FPTP system accepts huge
variation in the population/voter density of the 20 districts.
Such disparity in the size of constituencies explains the coexistence of two very small
constituencies with 23 000 and 25 000 electors, on the one hand (Rodrigues is
another exception with still lower number of voters, albeit returning two elected
representatives), and two extremely large ones with 58 000 and 60 000 electors, on
the other. And each of these constituencies nevertheless returns 3 Mps. There are 20
000 electors per MP in Savanne/Riviere Noire and only around 7700 voters per
elected representative in Port Louis Maritime/Port Louis East. This is the price in a
FPTP electoral system to achieve broad-based representation. Other communities also
benefit from gerrymandered electoral districts. In a PR system, there is no
requirement for such malapportionment as the formula works very differently.
(iii) three member constituencies with a mandatory three votes per elector: the FPTP
system with three members in each constituency and three compulsory votes allow a
very delicate balance to be struck so that everybody is perceived to have a fair chance
to gain political representation. It would have been very difficult to present a balanced
slate of candidates with single member ridings. This is well articulated by Sachs in
the 2001 report:
‘the bloc-of-three vote appears to have achieved substantial success in encouraging
parties to straddle community divides when nominating candidates. This is not
36
simply because of any subjective desire to appear politically correct but because of
the advantages which the bloc-of-three system gives to broadly based tickets. The
result is that no community is left out’.
(iv) And finally, the Best Loser System with the appointment of a maximum of eight best
loser Mps. The objective is to mitigate the relative underrepresentation of some
communities in Parliament after the elections of 62 Mps by FPTP mode.
While there is a historical and an emotional dimension to the BLS, a compelling assessment
of the 10 elections since 1967 unambiguously shows that the first three features (specially
drawn constituencies, unequal voters per constituency and three-member electoral districts)
have had a much greater impact on the parliamentary representation of some components of
the population than the BLS. For instance, the impact of ‘specially drawn constituencies’ and
unequal number of voters has, in 2010, has ensured the election of 6 Muslim candidates in Port
Louis South/Port Louis Central and Port Louis Maritime/Port Louis East. The votes polled by
Soodhun alone in La Caverne/Phoenix in the 2010 elections is more than the sum of the votes
obtained by the three elected Mps in Port-Louis Maritme/Port-Louis East. Equally Ganoo in
Savanne/Black River attracted almost the same number of votes as the three elected members in
Port-Louis South/Port-Louis Central. This is the impact of ‘specially drawn constituencies,
‘malapportionment’ and three- member constituencies. Equally the balanced ticket offered by three
member constituencies can deliver additional Mps to our Muslim compatriots (and to other
communities as well) across the country. For the ten elections between 1967 and 2010, the
combined effects of ‘specially drawn constituencies, unequal distribution of voters and three
member districts account for 82 % of all seats won by the Muslim community while the BLS
represents only 18 % of such seats (around 1.9 Mps per election, on average). The corresponding
figures for the General Population are 78 % (non BLS Mps) and 22 % (BLS Mps) respectively.
37

These are illustrated at Table 5. It should be pointed out that there has never been a Sino-Mauritian
best loser.
Table 5: Ratio of Non Best Loser MPs to Best Loser Mps
Muslims MPs General Population MPs
YearNon BLS
MpsBLS Mps
Total Mps
Non BLS Mps
BLS Mps
Total Mps
1967 10 1 11 16 6 22
1976 7 3 10 15 5 20
1982 9 0 9 14 4 18
1983 9 2 11 15 6 21
1987 6 4 10 15 4 19
1991 8 2 10 18 2 20
1995 9 1 10 17 3 20
2000 9 2 11 17 4 21
2005 8 2 10 13 6 19
2010 9 2 11 16 5 21
Total 84 19 103 156 45 201
Average 8.4 1.9 10.3 15.6 4.5 20.1
% 82 18 100 78 22 100
While the symbolical dimension of the BLS is intense, its impact is not substantive compared
to the other three features that are used to secure adequate political representation. It is
precisely because of its low incidence on representation that an alternative, credible and
modern mechanism can easily be found to adequately replace the BLS instrument and give
reassurance to the community or communities most supportive of the Best Loser system.
As it is a sensitive issue, one rider is in order at this stage. Even though another community
has gained more from the BLS and other groups also have benefitted from specially drawn
constituencies, the analysis focuses more on our Muslim compatriots as their size and their
38

geographical distribution, compared to the other two main groups, could make it difficult for
them to secure adequate political representation in a FPTP voting system. This issue was
comprehensively addressed by Trustram-Eve in 1958, De Smith in 1964 and Banwell in 1966
and various options were considered to ensure their fair Parliamentary representation.
Equally, the same consideration of adequate presence in Parliament prevailed when it was
proposed to do away with the nominations of some Mps, who represented ‘special interests’,
by the Governor during the colonial era. The same principles that will operate to subsume the
BLS for one community will apply for other communities while acknowledging their
respective size in terms of the number of candidates fielded in constituencies and those
appearing on the Party List.
Conversely to FPTP, an electoral system based on Proportional Representation (PR) aims at
including all components of society in Parliament. PR, with low threshold and large
constituencies, maximizes the chances of small groups in electoral contests. However it is
weak on stability as there is rarely a clear majority that emerges from the elections. Countries
that have diverse populations like Belgium (Flemish and Wallons) and Northern Ireland
(Catholics and Protestants) invariably use the PR system to ensure diversity and inclusion.
However most of them need to have a coalition government as there is no single party with a
clear majority. Many countries use special techniques to blunt the high proportionality of PR
so as to produce some degree of stability. Here the ‘workarounds’ have a completely
different purpose. While in FPTP the techniques purport to have fairness of representation, in
PR it is exactly the opposite. The mechanisms are intended to manufacture a majority to
enable stability and ensure the effectiveness of government. The ‘workarounds’ used are as
follows:
39

(i) Introduce a threshold to make it difficult for small parties to obtain seat, thus
minimizing the fragmentation of the system (10 % at the national level in Turkey);
(ii) Adopt multi member constituencies instead of a country–wide PR. Again the
objective is to raise the bar to gain seats to enter Parliament. It gives a fillip to large
parties (like in Spain and what is being proposed by Carcassonne for Mauritius);
(iii) Give a percentage of seats as premium to the party that comes first in a PR election.
For instance, in Italy, the first party is guaranteed around 54 % of the seats even if it
polls only 44 % of votes and the other seats are then allocated proportionately to the
remaining parties;
(iv) Allocate a surplus of seats in absolute term to the party ranked first in a PR election.
For example, in Greece, the winning party has a premium of 40 seats even with less
than 45 % of the votes and the remaining 260 out of 300 total seats are allotted on a
PR basis among all parties.
FPTP and PR are completely different voting systems when it comes to the two key values of
stability and fairness. One prioritises stability and has to find techniques to provide adequate
representation to minorities while the other privileges fairness and has to introduce
mechanisms to ensure stability. This is why the BLS is not seen as compatible with PR as
the very essence of PR is to have broad-based socio-demographic representation. Similarly it
would be inconceivable to give a premium to the winner in a FPTP election when it already
has a majority of seats! It is a matter of record that those who proposed a PR voting formula
in the run up to the 1967 elections did not also ask for the Best Loser System since the PR
40

itself would ensure broad-based representation. Such guarantee of political representation
was demanded when PR was rejected and the FPTP adopted.
It is possible to provide the assurance embedded in the BLS by using a modern technique to
operate its implementation while simultaneously removing its unacceptable features. Such
technique is widely used in other countries to ensure socio-demographic inclusiveness. And it
has been proposed by both Sachs and Carcassonne . It is wrong to state that Carcassonne has
recommended the abolition of the BLS. He has kept its objective while changing the
mechanism through which it is implemented. In an interview given to L’Express Dimanche
of 18th September, Carcassonne categorically stated that:
‘Attention, il ne s’agit pas de supprimer le Best Loser sans trouver un substitut qui garantisse à
chaque communauté qu’elle sera normalement représentée. Des substituts, on peut en imaginer. Le
droit constitutionnel et la science politique ont fait, depuis 50 ans, des progrès phénoménaux. Nous
avons dans la boite à outils un nombre d’instruments incomparables avec ceux de nos
prédécesseurs.’
Equally, Sachs argued that:
‘the best approach would be to devise alternative and credible means of providing
reassurance to the community or communities most supportive of the Best Loser system … it
should be possible to achieve the original objectives of the BLS in a manner that is consistent
with contemporary political reality’ .
And he emphasized that:
41

‘there was widespread support for the idea of using the list system to provide for establishing
mechanisms that will subsume the BLS and further its underlying affirmative objectives
without perpetuating its anachronistic and divisive aspects’
For instance, Carcassonne has subtly subsumed the BLS into the new electoral system with
three specific proposals: the PR mode of election, a closed, rank-based party list to return
Mps and the possibility of allowing a 15 % margin in the number of voters per constituency.
And of course, there could be a fourth one with the boundaries of the newly defined
constituencies which he has recommended to refer to an Electoral Commission.
I am proposing a different set of alternative measures to subsume the BLS. It hinges on a
mix of retaining some of the existing features of our FPTP and of introducing some new
elements that will give reassurance. The current features that should be kept are as follows:
(i) maintain the three member constituencies that clearly offer a balanced slate of
candidates;
(ii) retain the 20 specially drawn constituencies ;
(iii) keep the size and composition of constituencies as they are, until reform has settled
in; this would avoid an untimely dispute on electoral boundaries. It should not be too
difficult to accommodate the periodic review that is required by the Constitution;
In addition to the above, there is need for some additional arrangements to subsume the BLS
into the new voting formula. I submit that the most satisfactory solution for Mauritius would
42
be a mixed electoral system. We should keep the main features of the current FPTP system
that have worked well and introduce an additional list tier of 20 Mps elected with a new
formula that will considerably lower the disproportionality between seats and votes while
preserving the stability of the system. In the proposed formula, there will be two tiers of seat
distribution.
It is a mixed system that combines the features of FPTP and a party list tier of 20 seats. The
recommendation is to subsume the BLS as follows:
(i) to introduce an additional list tier of 20 seats that will be allotted on a national basis;
(ii) to have a closed, rank-based Party list to choose these 20 list tier Mps. This is similar
to what is proposed by Carcassonne and Sachs; However instead of 100 % of Mps
being chosen on that basis, I recommend that FPTP Mps continue to be elected in
open competition as is the case today and only the 20 additional Mps be returned by
the closed Party List. While the list would be an inclusive one, it is one way of
providing some additional reassurance to those who feel concerned by the
replacement of the BLS. The order of candidates on the closed Party list cannot be
changed by voters. The system is unlikely to work in an open list as voters can alter
the rank of candidates;
(iii) to provide for double candidacies. Essentially some candidates will be fielded in
FPTP constituencies and will also be included on the party list. In addition to other
benefits (such as political leaders assured of presence in Parliament), it will also give
a second chance if a candidate is not elected while his/her running mates are returned.
43

It has happened in very few cases. Candidates elected on FPTP voting mode will have
their name struck from the party list as is the case in many countries with mixed
system. And other candidates will be chosen as list Mps based on their rank order. It
is a self-regulating mechanism. And it works well in many countries with mixed
system.
The above provisions constitute a sound trade-off between removing the unacceptable
features of the Best Loser System while providing the reassurance of political representation
to all segments of our population. It is consistent with the recommendation of both Sachs and
Carcassonne. In this way, it will be possible to achieve the original objectives of BLS, in a
new form adapted in a principled way to present-day conditions and dilemmas. It is far from
complicated. Electors will continue to cast three votes in their constituencies. Political parties
will present a rank-ordered Party list of 20 candidates (some will be constituency candidates)
and the 20 list tier Mps will be chosen by a specific formula. It will be more transparent than
the computation of the current BLS formula.
Box 2 summarises how the BLS will be subsumed into the mixed electoral system. The
maintenance of the current three-member constituency combined with the existing specially
drawn constituencies and the unequal distribution of voters among constituencies will result
in the election of around 8.4 Muslim Mps on average. Three new features of the proposed voting
formula ( 20 Party list Mps, a closed, ranked-based Party list to return these Mps and the acceptance
of double candidacies) will return more than 2 additional Muslim Mps. The actual number will
depend on the outcome of constituency contests, on how the party list is constituted and how
candidates are ranked. The same principles will apply for the General Population, except that their
number will be higher to reflect their larger population size. This is facilitated by the simple fact that
there will be Muslim and General Population candidates ( and Hindus and Chinese also) on all Party
44
Lists and the election of one member from a community is not mutually exclusive with another one
of the same community as they appear on different and distinct lists.
While the Sino-Mauritian community has never relied on the BLS to secure adequate representation,
the case of Hindus is slightly different. Under most, if not all, circumstances they do not depend on
the BLS to have adequate Parliamentary representation. This is obtained through the 62 FPTP Mps.
However there was one Hindu who was returned as Best Loser in the 1967 elections; and
exceptionally two Hindus were chosen as Best Losers in 2000 and they owed their election to the
Constitutional amendment introduced in 1992 to ensure that a party restores the balance in respect of
the second set of four seats, irrespective of community, should candidates from the appropriate
underrepresented community be unavailable. They were chosen as there was no candidate from either
the Muslim or the General Population or the Chinese community from the appropriate party to
appoint with a view to restoring the balance. In the new formula, Hindus will continue to be fielded in
the constituencies as is the case currently, in addition to obtaining their adequate share from the Party
list that will reflect the diversity and rainbowness of Mauritius.
With 20 seats, it should be possible to reflect the socio-demographic diversity of our country. There is
only one difference. Instead of these seats being constitutionally entrenched, it will now form part of
a social compact, a consociational arrangement where the responsibility rests with political
parties ,especially their leaders. And it has to work because of the self-interest of political parties. All
the major parties have a very long tradition and practice of presenting a balanced slate to appeal to all
segments of voters. And as shown in Table 4, the overwhelming majority of Muslim and General
Population Mps are not returned by the BLS but by some social compact that compels political parties
to field a balanced slate of candidates.
This recommendation represents a win win situation. On the one hand, it is a great relief for
those who feel that the BLS is the unacceptable face of our electoral system, that it
45

undermines nation building, is discriminatory, archaic and anachronistic, very complex,
arbitrary, erratic, irrational and paradoxical. The reference to ethnic belonging will be
removed from our Constitution, there will be no need to declare the community of a
candidate contesting an election and we avoid the cumbersome post-election mathematical
BLS computation based on ethnicity to return some 8 MPs. And last but not least we will
cease being open, as a nation, to stern criticism by the Supreme Court, the Human Rights
Commission and even the Law Lords on the current electoral arrangement based on ethnic
classification.
46
Box 2: How the BLS will be subsumed into the new mixed electoral system
18
C.C
On the other hand, it is a tremendous comfort and a reassurance for our compatriots who are
concerned psychologically about adequate political representation. It keeps the objective of
the BLS while it replaces its operational mechanism. In societies that are divided on the
basis of race, religion, ethnicity, languages, it is very crucial to design electoral systems that
are all inclusive. It induces shared goals and common values, encourages nation building and
promotes social cohesiveness. It creates space for groups to find some form of expression On
47
A. What exists today
82 % of Muslims Mps ( an average of 8.4 Mps) are elected through a combination of:
i) three member constituency with balanced slate
ii) specially drawn constituencies
iii) unequal distribution of voters across constituencies
18 % of Muslim Mps ( an average of 1.9 Mps) gain Parliamentary representation through the Best Loser system
B. What will be kept
i) retain three member constituency and the current 62 FPTP Mps
ii) maintain specially drawn constituencies
iii) allow unequal distribution of voters across constituencies
FPTP Impact: an average of 8.4 Muslim Mps will continue to be elected through a combination of these three features.
C. What will change
The BLS is subsumed into the new electoral dispensation. It will not exist in its current form, but its principles are kept and absorbed as follows:
i) have a tier of 20 Mps in addition to 62 FPTP Mps;
ii) return the 20 Mps through a closed,rank-ordered Party List that cannot be changed by voters;
iii) allow double candidacies so that some candidates will contest elections at constituency level and will also be on the Party List;
Party List Impact: more than 2 Muslim Mps and more than 4 General Population Mps will be returned from the Party List of the main parties, depending on what happens at constituency levels. It is a self regulating mechanism due to the existence of double candidacies. There will be Muslim and General Population ( and other communities) candidates on the Party lists of all major parties and their elections are not mutually exclusive.

On the other hand, it is a tremendous comfort and a reassurance for our compatriots who are
psychologically concerned about adequate political representation. It keeps the objective of
the BLS while it replaces its operational mechanism. In societies that are divided on the
basis of race, religion, ethnicity, languages, it is very crucial to design electoral systems that
are all inclusive. It induces shared goals and common values, encourages nation building and
promotes social cohesiveness. It creates space for groups to find some form of expression
through the political system. However it should be done in a manner that does not create
unnecessary stigmas. Constitutional engineers and electoral specialists have provided a
variety of institutional arrangement to precisely achieve that objective. We know that
political parties pay careful attention in choosing a balanced slate of candidates so as to
appeal to voters from all communities. They will adopt the same principles for the
composition and rank of the party list. As cogently argued by de Smith, Sachs and
Carcassonne parties will be guided by self-interest and those that do not play by the expected
rules will pay a heavy price at the poll.
48

8. Party list :better, safer, and more transparent than the BLS
A closed, ranked-based Party list is significantly superior than the current BLS in more ways
than one. In addition to the usual criticisms that BLS institutionalizes communalism, uses
archaic figures from 1972 to allot seats and is unfair against some segments of the Mauritian
society, there are many practical problems with its operating mechanism. All the various
loopholes, discrepancies, paradoxes and inconsistencies of the BLS can be comprehensively
addressed by adopting the safer,fairer and more transparent and predictable closed Party List.
First, the BLS, in its current form, is anachronistic. Subsequent to a Constitutional
amendment in 1982, there is no need for Mauritians to reveal their ethnic identities for the
purpose of population censuses. Since 1972, there is no official publication of the ethnic
make up of the population. And yet Best Loser seats continue to be allocated according to the
1972 communal breakdown. For instance, the Best Loser seats in 2010 were distributed
using the population size and the communal breakdown of the 1972 census, almost 38 years
ago. The population has since increased by almost 50 per cent and it is highly likely that the
ethnic composition is not the same as in 1972. Yet the system continues to use outdated
statistics to allot Best Loser seats. The reliability of these figures and the fairness of the
method can easily be contested. It could also lead to anomalies. For instance, if the 1962
census (which was used to allocate the Best Loser seats in the 1967 elections) were used
instead of the one of 1972, the allotment of Best Loser seats would be different in terms of
communities and individuals for most elections. Second if we use religion ( based on
subsidies granted by the State ) as a proxy for community in subsequent censuses and make
some simple assumptions, this would give a third set of Best Losers. Finally, if there were
more eligible communities than four, the allocation of Best Losers would again be different.
49

Second, Best Loser seats are allocated by the use of a very complicated formula using a two
tiered system. Very few people understand how it operates as it has to take many factors into
consideration. First the appropriate community, then the appropriate party with the
appropriate community, then the sequence of appointments and finally it has to maintain a
given political balance. The process can be quite arbitrary in its apportionment. In 1995 a
party that polled 20 per cent of the votes did not secure a single best loser seats. Four Best
Loser seats were instead allotted to parties with a very small percentage of votes while the
MSM/RMM had members of the appropriate community among its defeated candidates. In
2000 and 2005 also, two best loser seats were distributed to a very small regional party at the
expense of a large national party that had many candidates of underrepresented communities
in its ranks.
Third, the system is very erratic in its distribution. In the 1983 General Elections, Nawoor
with only 16 % ( yes 16 %) of the vote was chosen as a Best Loser for the Muslim
community while Kasenally with 47 % and belonging to the same community was not
returned. Similarly in 1987, Finette was appointed with 47 % of the votes while Bérenger did
not go to Parliament with 49 % of the votes even if both are from the General Population.
The case of Bérenger in 1987 shows the paradox and the cruelty of the BLS. When one seat
was awarded to a member of the General Population, Bérenger was in the ‘appropriate
community’ but not in the ‘appropriate party’ and the seat went to Finette of the PMSD.
When another seat was distributed to the MMM, then Bérenger was in the ‘appropriate party’
but not in the ‘appropriate community’ and Peerun of the MMM was chosen. This is because
of the specific complexities, randomness and the two tiered basis of the allocation method.
Had there been a Party list, Bérenger would have been returned to Parliament without any
complication as the MMM would have been eligible for 14 Party List seats in 1987.
50
Fourth, there is no by election to replace a vacancy for a Best Loser seat. In case of a
vacancy, the seat is allotted to the most successful unreturned candidate available, belonging
to the same community and party as the outgoing member. This could lead to a situation
where the candidate may have given up politics or have left the country. Worse, he could
have changed sides in the meantime.
Fifth, the system is also very unpredictable in its outcome. In 1982, 1991 and 1995 only four
Best Loser Seats were distributed as the winning party did not have any unreturned eligible
candidate. During those years, there was a Parliament of only 66 members instead of 70 MPs
as provided for in the Constitution. And in 2010, only 7 seats were allotted for reasons that
are not so easy to understand. As a matter of fact, the Electoral Supervisory Commission did
not know whether to appoint any Best Loser in 1982 as it could upset the balance of political
forces. The matter was referred to the Supreme Court that ruled that only the first four Best
Losers be distributed.
Sixth, the process can be mind-boggling in some cases. In 1983 there was an alliance among
three parties (MSM, LP and PMSD). However to avoid three symbols on the ballot paper, it
was agreed that in most constituencies all candidates of that alliance would stand under the
joint symbol of the sun and the key (MSM/LP) while in some districts the symbol would be a
cockerel only (PMSD). Notwithstanding the fact that the three formations were in a total
alliance yet they were registered as two parties for the purpose of the elections (as MSM/LP
and as PMSD). For tactical reasons, Malherbe, who was a very long serving member of the
LP, had to stand on the PMSD platform in Grande Rivière North West /Port Louis West. He
polled 44.91 % of the votes and yet was not returned as a Best loser while Candahoo, from
the same alliance and belonging to the same community, got in with 43.78 % of the votes, as
he contested under the MSM/LP banner! Had Malherbe stood under the symbol of his party,
he would have been chosen as a Best Loser. In the same elections, Clifford, a PMSD
51
candidate for the MSM/LP/PMSD alliance in Rose-Hill/Stanley, polled 46.27 % of the votes;
yet he was not awarded a Best Loser seat while Michel, from the same community and the
same alliance, got one such seat with 44.32 % of the votes as he fought the elections as a
MSM/LP candidate. This is how unpredictable and random the system can be.
Seventh, the number of electors in a constituency affects the allocation of Best Loser seats.
As a result, a candidate can secure a Best Loser seat with far fewer votes than another one
belonging to the same community and the same party. The most known example is the case
of Rima and Koenig in 1967. Rima was allotted a Best Loser seat with 6,596 votes while
Koenig, the leader of the PMSD, did not have one with 6,851 votes. Both were from the
PMSD and both belonged to the same community. It was the smaller size of the constituency
that favoured Rima as his percentage of votes at 45.72 % was slightly higher than that of
Koenig at 44.37 %. The case of Balancy and Chaperon in the same elections confirms how
constituency size can influence the allocation of Best Loser seats. Both were from the
Independence party and both were members of the General Population. Balancy became a
Best Loser MP with 4,884 votes while Chaperon was not with 5,998 votes. The constituency
of Chaperon was 34 % bigger than that of Balancy. In 1995 and 2000, it led to a double
anomaly. In 1995, Beeharry, a Muslim, was awarded a Best Loser seat even if his party had a
very insignificant percentage of the national vote compared to the 20 % of the MSM/RMM.
Worse he won only 4,405 votes while Soodhun, also a Muslim, polled 7,416 votes without a
Best Loser seat. In 2000, Leopold with only 7,732 votes (his party took 1 % of national vote)
won a Best Loser seat while Petit, of the same community, with 14,626 (and his party had 37
% of votes overall ) did not.
Eighth, it is possible to abuse the system. After an examination of the provisions of the
Constitution, Judge Seetulsing reached the conclusion that it is perfectly constitutional for
Seegobin, Lallah and Renghen (all Hindus) to be classified as General Population, which is a
52
‘residual’ community in the Constitution. Consequently, he questioned the enforceability of
the BLS and stated that this problem should be addressed within the context of electoral and
constitutional reform. In essence, there is nothing that prevents a candidate of a particular
community choosing, for the purpose of elections, to become a member of another
community so as to enhance his chances of obtaining a best loser seat. There are candidates
that select their community for election purposes by drawing lots as they castigate the
communalistic aspects of the Best Loser system. Moreover candidates of the Chinese
community, who are also Christians, could improve their chances of being a Best Loser MP if
they chose to be classified as General Population. Such abuse could pervert the basis for
which these seats are allotted. And it has happened. This is because the BLS is a curious mix
of ethnicity and religion
Ninth, it leads to rivalry among candidates who belong to the same community as it is a ‘zero
sum game’. If one member of a particular community is elected, it considerably diminishes
the chances of another member of the same community from being appointed as they are
mutually exclusive. As Party lists are distinct and separate, this problem is largely mitigated.
There will be candidates from all communities on all Party list.
All these above-mentioned problems and their consequences will be addressed with the
certainty and transparency of a Party List. The system is safe, reliable and predictable. As the
Party list will reflect the diversity of the country, all political leaders will find their place in
Parliament without playing a game of high risks and high uncertainty with the BLS. Razack
Mohamed, a leading member of the Muslim community, would have entered Parliament with
a Party List in 1976. The same applies for Koenig in 1967, Duval in 1976, Ramgoolam in
1982, Berenger in 1983 and 1987, A..Jugnauth in 1995 and P. Jugnauth in 2005. Yet none of
these political leaders won a seat in Parliament with the Best Loser system.
53
9. How should PR seats be allocated? Pandemonium in heaven
While many people grasp the difference between FPTP and PR systems, they do not always make the
fundamental distinction between a parallel PR ( as proposed in Model A of Sachs) and a
compensatory PR ( as recommended in Model C of Sachs), when used in tandem with FPTP. This is
currently a major source of confusion in the mind of many well-intentioned persons. Parallel PR
allocates the PR seats to parties in relative proportion to their votes. It does not take into account the (
possibly disproportionate number of ) constituency seats they have won. It could thus be unfair and
unrepresentative as it may lead to huge disparities between overall votes and total seats. By contrast,
constituency seats won are taken into account in Compensatory PR. The method aims to align the
total seats ( constituency plus PR) of each party to its votes. A party which has obtained more ( less)
constituency seats than deemed by its share of votes will receive less ( more) or no PR seats. Because
of its proportional features, the compensatory formula is adopted by some democracies that have a
mixed model. This is the case in New Zealand, Germany, Scotland and Wales. It has also been
adopted by Lesotho which moved from a FPTP to a mixed FPTP/PR system. However it makes
government formation difficult as it could be too proportional. On the other hand countries which
have recently embraced democracy have adopted a parallel system. Russia (until recently), Ukraine,
Georgia and Armenia are such examples. Japan also has a mixed parallel PR/FPTP voting formula.
While both Russia and Germany have mixed electoral system with 50 % of seats returned with FPTP
and 50 % with PR, Russia uses a parallel PR while Germany applies a compensatory one. The
consequences are very different, even if both are mixed systems. While both provide for
representation, the degree of fairness is very different. In the Russian case, a party that receives 40 %
of the votes may end up with only 20 % of the seats even if it has lost all constituency contests. In
54

the German system it could receive, in similar circumstances, between 35 % and 38 % of the seats as
the compensatory PR allotment corrects for the unfairness of the FPTP results.
Table 6 illustrates the major difference between the parallel and the compensatory method of allocating PR
seats in a mixed FPTP/PR electoral model. The two elections of 1982 and 1987 in Mauritius are used as
worked examples.
Table 6: Difference between Parallel and Compensatory method of allocating PR seats
FPTP/Parallel PR FPTP/Compensatory PR
1982%
votesFPTP PR Total
% seats
FPTP PR Total%
seats
seats seats seats seats Seats seats
MMM/PSM 64.16 60 14 74 90.2 60 0 60 73.2
PAN 25.78 0 6 6 7.3 0 20 20 24.4
Other 10.06 2 0 2 2.4 2 0 2 2.4
Total 100 62 20 82 100 62 20 82 100
1987%
votesFPTP PR Total
% seats
FPTP PR Total%
seats
MSM/LP/PMSD 49.86 39 10 49 59.8 39 2 41 50
MMM & Allies 48.12 21 10 31 37.8 21 18 39 47.6
Other 2.02 2 0 2 2.4 2 0 2 2.4
Total 100 62 20 82 100 62 20 82 100
In 1982, the parallel mode, which disregards the fact that PAN did not receive a single seat for 25.78
% of the votes in FPTP elections, allocates 6 seats to the second party and 14 to the MMM/PSM
alliance , based simply on their respective share of votes, after eliminating parties that do not meet the
threshold to be eligible for these PR seats. The final outcome is 74 seats for the MMM/PSM and 6
seats for PAN. It is highly disproportional with PAN attracting only 7 % of seats for 25.78 % of votes.
The compensatory method recognises the unfairness of the FPTP elections and compensates PAN for
55

its share of votes using the D’Hondt formula. PAN receives all 20 seats as it was severely
penalised in the constituencies. The final result is 60 seats for MMM/PSM and 20 seats for
PAN. The second party obtains 24.4 % of seats for 25.78 % of votes. It is almost a
proportional outcome. The small difference between the two figures is the impact of
thresholds. In 1982 the compensatory mode is fair and it also leaves a huge working majority
for the winning team. The parallel formula is very insignificant in correcting the unfairness
of the system.
The situation is completely different in closely held elections. In 1987, the parallel formula
allocates 10 PR seats to each of the two main parties as their share of votes was very close.
However as it does not take into consideration what happens in FPTP contest, the final tally
gives 49 seats to the MSM/LP/PMSD alliance and 31 seats to the MMM & allies. The
compensation mode ,on the other hand, allots 18 of the 20 PR seats to the MMM & allies in
recognition of the fact that it was penalised in FPTP elections with only 21 seats on 48.12 %
of the votes. The final outcome is 41 Mps for the MSM/LP/PMSD alliance, 39 Mps for the
MMM & allies and 2 Mps for Rodrigues. We are thus in a situation where a relatively large
majority of 18 (maintained after the BLS) seats is transformed into a hung Parliament with
no majority as the combined forces of the Opposition is equal to the numerical strength of the
winning party. It is too proportional.
The parallel mode of apportioning PR seats leaves huge distortion between seats and votes.
This is the main reason why it was rejected by Sachs and not considered by Carcassonne.
However the compensatory mode of allocating PR seats converts the electoral system into a
proportional one in many cases. And we are in fact in a Carcassone-like system of very close
proportionality between seats and votes. This is why the compensatory formula is also called
56
mixed-member proportional by electoral specialists. As a matter of fact this is precisely what
happens very often in New Zealand and in Germany. While on paper, it is a mixed system, in
actual fact it becomes a very proportional voting formula.
During my consultations, I have also found that many people do not necessarily have a very
good understanding of how PR seats are apportioned in a mixed FPTP/PR system using the
D’Hondt formula. Consequently I am giving a worked example of the operational aspects of
the formula using the 1987 election as a case study at Appendix 1.
10 . The ‘unreturned votes elect’ formula (UVE) : a new kid in town
57
As the parallel mode is very disproportional and the compensatory formula highly
proportional, I am recommending a third possibility of allotment of PR seats on the basis of
the votes of ‘unreturned candidates’ . There is in fact a fourth one which is the surplus vote.
However it is complicated and less fair than an allocation by the votes of unreturned
candidates. The term used in political and electoral science for such votes is ‘wasted votes’.
However, I shall refer to it as the ‘unreturned votes elect’ formula ( UVE) as wasted vote
may send the wrong signal as a basis to elect Mps !. These are the votes of candidates who
have polled a fairly significant percentage of votes and who have not been elected (hence the
appellation of ‘wasted’ in the literature as this is exactly what it is). These unreturned votes
shall be used to elect the 20 list tier Mps. This is why it is called the UVE formula.
An electoral system which reduces the number of lost or wasted votes can be considered
desirable on grounds of fairness. For example, in the UK General Elections of 2005 which
use a FPTP voting system , 52 % of votes were cast for unsuccessful candidates. This is
perhaps the most fundamental criticism of FPTP, that a large majority of votes plays no part
in determining the outcome. The proposal is to use the votes of unreturned candidates to have
an additional tier distribution of 20 seats. It is not perfect. However it has the merit of
keeping a very satisfactory balance between stability and fairness. Significantly UVE
produces a working majority while lowering the huge distortion between seats and votes of
the unsuccessful party.
The idea behind compensating political parties on the basis of the votes of unreturned
candidates is conceptually sound, especially in our system. It aims at minimising or
eliminating the number of wasted votes that often accounts for the huge disproportionality
between votes and seats in FPTP voting formula. Many candidates with a substantial
58
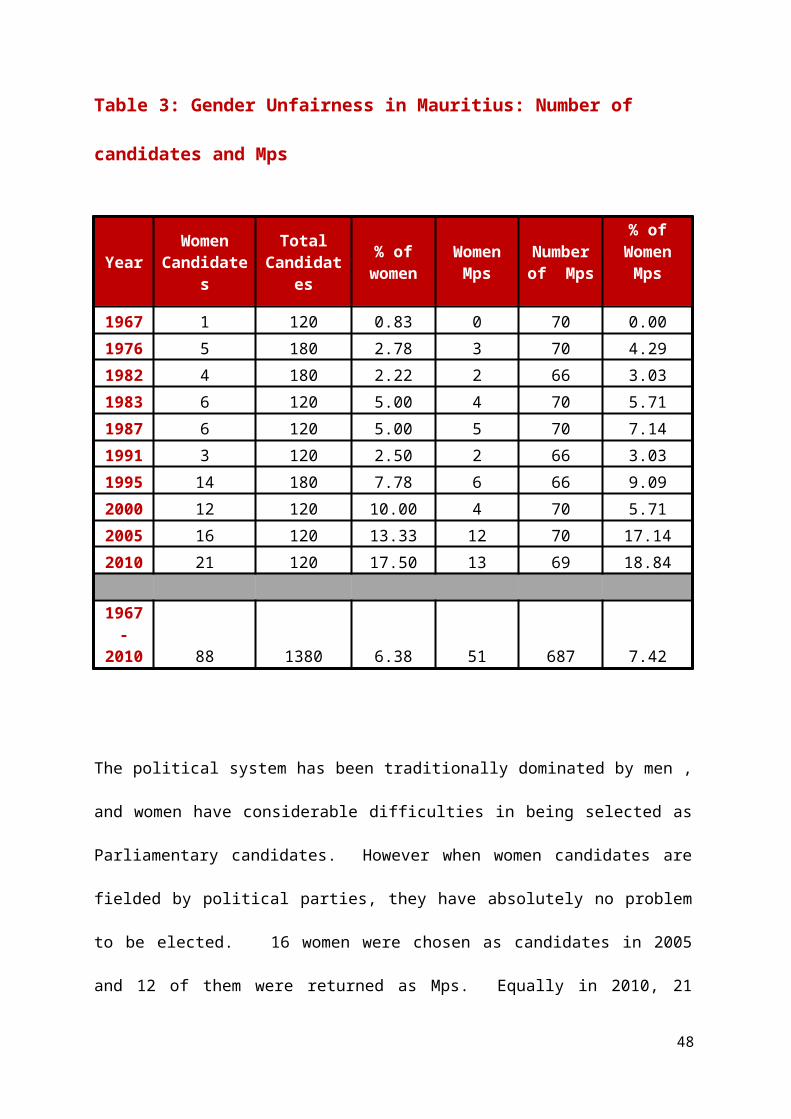
percentage of votes do not get any representation. For instance, 46 % of those who cast a
ballot did not contribute to electing anybody with their votes in the general elections of 2010,
as they went to unsuccessful candidates. In the 1967 elections, the Independence Party took
all three seats in Vacoas/Floreal with 51 % of the votes while the PMSD got nothing with
48.6 % of the votes. The MMM captured all three seats in Rose Hill/Stanley with 53 % of the
votes in the 1983 elections, while the MSM/LP/PMSD alliance did not receive anything with
46 % of the votes. The unfairness of the current formula is due to the fact a party often ‘takes
all’ in one constituency (this has happened in 160 out of 200 constituencies in the last 10
elections!) and the party whose candidates come immediately after the elected
representatives does not obtain anything, even if it has attracted a significant share of the
votes. The more such losers there are and if they hail from the same party, the higher will be
the disproportionality between seats and votes. The UVE formula has the advantage of
rewarding the overall winner also in constituencies where it has failed to win seats. This,
indeed, happens when elections are very close. In this system, the party that does not win
the election will be better compensated by the formula; however it will not work to the
extreme of making it purely proportional as is the case with Model C of Sachs. It counts only
the votes of unreturned candidates for the simple reason that the votes of returned candidates
have already been used to elect the three Mps. To some extent, it avoids using the same votes
twice , which is the case in the other formulae.
11. How much stability, how much fairness?: the great dilemma
59

Of the various criteria listed by Carcassonne, the current FPTP electoral system functions very well
on stability. It is effective, transparent, responsive and decisive. There is no better system than FPTP
to produce a clear and distinct majority which is absolutely essential to govern the country. PR is
weak on this count and in some cases extremely so. Gender fairness and socio-demographic
inclusion have already been dealt with. We are therefore left with the principal deficiency of FPTP
which is its inability to translate votes into seats in an equitable manner. It delivers disproportional
outcomes in certain elections, magnifies majorities and could even lead to the complete elimination of
opposition parties in Parliament, thus vitiating the very foundation of representative democracy. This
is the principal defect to be cured; however in so doing, one must be careful not to create problems
with the criterion of stability. Put simply, the challenge is how to strike the right balance between
stable, decisive, effective, responsive and accountable government that are considered the strengths of
plurality/majoritarian systems and fairness and representation which are the main attributes of
proportional representation formulae. Often, these two sets of criteria move in opposite directions
and this has led many to believe that the perceived conflict between effectiveness and representation,
between stable government and fairness is a very difficult one to resolve. Many countries have
attempted to reconcile this contradiction by embracing a mixed system that combines the best features
of FPTP and PR electoral systems.
It is a fact that no electoral system could possibly fully meet all the criteria for a good voting system.
It is my considered view that a mixed electoral system that combines our current FPTP formula
with an additional list tier allocation of 20 seats is best suited to address the issues of stability and
fairness in our electoral landscape. However, to avoid the high proportionality of the system in some
specific cases and its lack of a working majority, I suggest that we adopt a new approach based on an
apportionment formula that is different from the one used in Model C of Sachs. Box 3 explains how
unfairness is measured in electoral systems. Most experts do not expect a fair voting formula to be
completely proportional.
Box 3: Measuring unfairness in electoral systems
60There are many ways of determining whether an electoral system is fair or not. Most measures of
fairness concern the relationship between the share of votes captured by parties and their share of seats
in Parliament. Although the concepts of proportionality appears simple, it is not that straightforward to
find the best method to measure the fairness of election results. There are many indices of

Many were justifiably concerned that Model C of Sachs, while being very attractive in many ways,
becomes too proportional in very close elections. The maximisation of proportionality is not
always a desirable end in itself. It might produce a Parliament that is too fragmented, thus making
many werit difficult to have strong and effective government. The UVE formula is a significant
Many were justifiably concerned that Model C of Sachs, while being very attractive in many ways,
becomes too proportional in close elections. The maximization of proportionality is not always a
61
There are many ways of determining whether an electoral system is fair or not. Most measures of
fairness concern the relationship between the share of votes captured by parties and their share of seats
in Parliament. Although the concepts of proportionality appears simple, it is not that straightforward to
find the best method to measure the fairness of election results. There are many indices of
desirable end in itself . It might produce a Parliament that is too fragmented, thus making it difficult
to have strong and effective government improvement. The UVE formula is a significant
improvement on the current system and it is also better in terms of ‘overall balance’ to what has
been proposed up to now. If we want to preserve stability which is a fundamental feature of an
electoral system, we should avoid pure PR and choose broad proportionality instead. There will
still be some divergence between seats and votes but it will be small and tolerable compared to the
current voting mode. We should retain the best values of the FPTP electoral formula and design a
mechanism to remedy its major drawback. Table 7 gives the results of the 10 elections held since
1967.
Table 7: Stability versus fairness at a glance
Winning Party Second Party Others Majority
Year%
votes seats%
seats%
votes seats%
seats%
votesseat
s%
seats In Seats1967 54.13 43 61.4 43.99 27 38.6 1.88 0 0 16
1976 38.64 34 48.6 37.9 28 40.0 23.5 8 11.4 Hung
1982 64.16 60 90.9 25.78 2 3.0 10.1 4 6.1 54
1983 52.22 46 65.7 46.4 22 31.4 1.38 2 2.9 22
1987 49.86 44 62.9 48.12 24 34.3 2.02 2 2.9 18
1991 56.3 57 86.4 40 7 10.6 3.7 2 3.0 48
1995 65.2 60 90.9 19.7 0 0.0 15.1 6 9.1 54
2000 51.5 58 82.9 36.7 8 11.4 11.8 4 5.7 46
2005 49.4 42 60.0 43.3 24 34.3 7.31 4 5.7 14
2010 50.7 45 65.2 42.9 20 29.0 6.4 4 5.8 21
62

It shows that FPTP has delivered on stability but has been weak on fair representation on several
occasions. It is good at producing a majority to ensure effective government even when the
elections are close in terms of votes between the two major contenders. In 1987, a difference
of only 1.74 % in national votes (49.86 % against 48.12 %) between the LP/MSM/PMSD and
the MMM produced a huge disproportionality in seats of 28.6 % (62.9 % against 34.3 %), thus
giving an absolute majority of 18 seats to the governing party. In 1991, a divergence of 16.3 %
in votes (56.3 % against 40 %) produced a difference of 75.8 % in seats for the MSM/MMM
alliance over the LP/PMSD coalition (86.4 % against 10.6 %), thus yielding a majority of 48
seats for the winner. The same degree of unfairness occurred in 2000 when a difference of 14.8
% in votes manufactured a seat disproportionality of 71.1 %. And we have the two cases of 60-0
(1982 and 1995) with one party taking all 60 seats and the second party that attracted 25.78 %
and 19.7 % of votes failing to win a single seat in the FPTP contest.
The objective of a Party list tier seats is to narrow the difference between seats and votes.
However in so doing it could make the system weak on stability as the majority becomes
extremely thin. This is the problem with Model C of Sachs in some elections. Table 8 depicts
the results of four elections out of ten since 1967 using the Sachs compensatory method of
allocating 20 PR seats. The formula would have lowered the seat/vote disproportionality without
affecting the stability of the system. For ease of comparison, the change in majority is shown in
the last column of Table 8. The system works well when there is a huge unfairness against one
party. It happened in 1982 and 1995 (60-0) and in 1991 and 2000 (57 seats for winner and only
three seats for the second party and 54 seats to 6 seats respectively). In 1982 all the 20 PR
seats would have been distributed to the party that polled 25.78 % of the votes and did not
secure a single seat. After the allotment of the 20 PR seats, the PAN alliance would have had
24.4 % of total seats. In fact had there been additional PR seats (say 25 instead of 20); PAN
would have collected another 4 seats.
63
Table 8 : When Model C of Sachs poses no threat to stability
62 FPTP and 20 PR Model C Sachs,10 % threshold
% votesFPTP MPs PR seats
Total seats
% of seats
Majority in seats
1982 MMM/PSM 64.16 60 0 60 73.2PAN 25.78 0 20 20 24.4
PMSD 7.79 0 0 0 0.0Other 2.27 2 0 2 2.4Total 100 62 20 82 100.0 from 54 to 38
1991 MSM/MMM 56.3 57 0 57 69.5LP/PMSD 40 3 20 23 28.0
Other 3.7 2 0 2 2.4Total 100 62 20 82 100.00 from 48 to 32
1995 LP/MMM 65.2 60 2 62 75.6MSM/RMM 19.7 0 18 18 22.0
Other 15.1 2 0 2 2.4Total 100 62 20 82 100.00 from 54 to 42
2000 MSM/MMM 51.5 54 0 54 65.9LP/PMXD 36.7 6 20 26 31.7
Other 11.8 2 0 2 2.4Total 88.2 62 20 82 100.0 from 46 to 26
In 1995, the second party would have taken 18 of the 20 PR seats. It did not capture all, as in 1982,
because its tally of votes was only 19.7 %. As it is an almost PR system, parties are compensated up
to their share of vote. In 1991 and 2000, the LP/PMSD alliance would have received all 20 PR seats
as they were very disadvantaged by the FPTP outcome (only 3 seats for 40 % of votes and 6 seats for
36.7 % of votes respectively). In the four cases of 1982, 1991, 1995 and 2000, the winning party
would still command a relatively large majority of seats while the disproportionality between seats
and votes is lowered for the second party.
64

However the situation with respect to stability becomes tenuous when a major party does
well in terms of votes, wins some seats but is heavily penalized in terms of constituency
seats. Under these circumstances, most, if not all of the seats, would accrue to that party as it
has suffered badly from the unfairness of the FPTP. This happened in 1987 when the MMM
received only 34.3 % of the seats with 48.12 % of the votes (a massive negative distortion of
13.8 % between seats and votes) while at the same time the MSM/LP/PMSD gained 62.9 %
of the seats with only 49.86 % of the votes (a huge positive difference of 13.04 % between
seats and votes). In view of the huge disproportionality of the FPTP outcome, the PR seats
would have been awarded mostly to the MMM (18 seats against 2 for the winning party).
And the consequence is the disappearance of the majority of 18 that the MSM/LP/PMSD had
after the FPTP results. And if the two Mps from Rodrigues are not counted as forming part
of the winning alliance, there is a deadlock with 41 seats for the Government and a combined
41 Mps against it. These results are illustrated at Table 9.
1983 also poses a challenge for almost the same reason as in 1987. The vote/seat difference
is quite high for both parties (positive 13.5 % for the MSM/LP/PMSD and negative 15 % for
the MMM). The compensatory allocation of the 20 PR seats has the mechanical effect of
lowering the majority from 22 to 2 seats as 19 out of the 20 PR seats are allotted to the
MMM as it suffered heavily from the constituency outcome. In fact the majority of 2 could
easily have vanished as there were some hotly contested seats. Three candidates of the
MMM were defeated by very few votes. Bérenger lost by 33 votes in Belle-Rose/Quatre
Bornes, Jawaheer by 112 votes in La Caverne/Phoenix and Minerve by 237 votes in Beau
Bassin /Petite Rivière. The 2005 and 2010 elections would also have posed some problem
for stability after the apportionment of the compensatory seats. The seat majority comes
down from 15 to 4 in 2005 and from 21 to 4 in 2010.
65
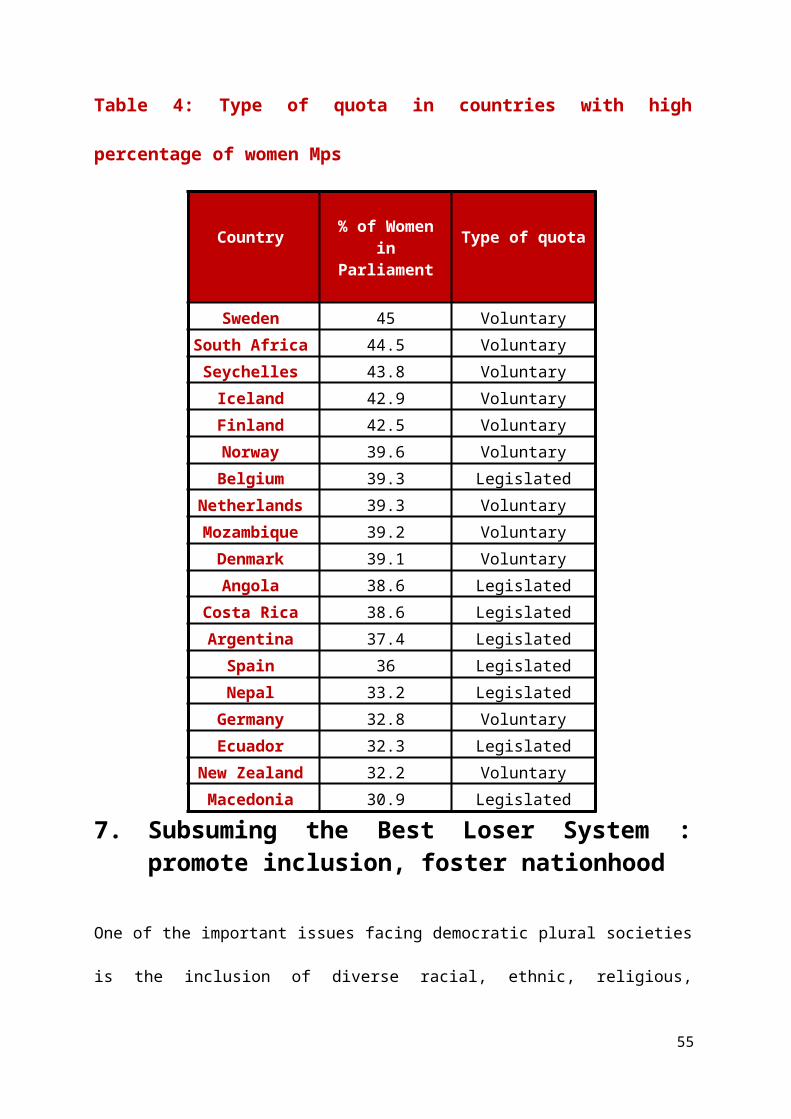
The case of 1967 is quite interesting and is different from the elections of 1983, 1987, 2005
and 2010. The PMSD did relatively well in the FPTP contest by winning 38.66 % of the
seats with 43.99 % of votes (a difference of only 5.33 % between seats and votes). As a
result the mechanics of Model C of Sachs distributed some seats to the winner also. This has
the effect of reducing the majority from 16 in the FPTP mode to 8 in the mixed FPTP/PR
formula. However it still leaves a working majority for the winning party. While the formula
is extremely fair, it however moves away from being stable and effective. This is the major
drawback of too proportional an electoral formula.
66

Table 9: Model C of Sachs is too proportional at the expense of stability
62 FPTP and 20 PR Model C Sachs,10 % threshold
% votes
FPTP MPs PR seats Total
seats% of seats
Majority in seats
1967 IP 54.13 39 6 45 54.9PMSD 43.99 23 14 37 45.1Other 1.88 0 0 0 0.0Total 100 62 20 82 100.0 From 16 to 8
1983MSM/LP/
PMSD 52.22 41 1 42 51.2MMM 46.4 19 19 38 46.3Other 1.38 2 0 2 2.4Total 100 62 20 82 100.0 From 22 to 2
1987MSM/LP/
PMSD 49.86 39 2 41 50.0Union 48.12 21 18 39 47.6Other 2.02 2 0 2 2.4Total 100 62 20 82 100.0 From 18 to 0
2005 LP/PMSD 49.39 38 5 43 52.4MSM/MMM 43.3 22 15 37 45.1
Other 7.31 2 0 2 2.4Total 100 62 20 82 100.0 From 14 to 4
2010LP/MSM/
PMSD 50.72 41 2 43 52.4MMM 42.88 18 18 36 43.9Other 6.4 3 0 3 3.7Total 100 62 20 82 100.0 From 21 to 4
67

The three-cornered electoral contest of 1976 was quite unique. The FPTP mode produced a difference
of 5 seats in favour of the MMM against the Independence Party (30 seats to 25 seats). However it
was a very close election with the MMM on 38.64% of the votes and the Independence Party on
37.9% of votes . As Party list seats are allocated on percentage of votes polled after taking into
account what happens at the level of constituencies, the Independence Party would have obtained 9
seats and the MMM 4 seats. Both parties would therefore end up with 34 seats and the 5 seat margin
of the MMM would disappear. The PMSD would have taken 7 Party List seats in these elections.
Consequently the combined seats of IP and PMSD (after entering into a coalition after the elections)
would have been significantly higher than the MMM (48 against 34). This is shown at Table 10.
Table 10: The special case of the 1976 Elections
62 FPTP and 20 PR Model C Sachs,10 % threshold
% votesFPTP MPs PR seats
Total seats
% of seats
Difference in seats
1976 MMM 38.64 30 4 34 41.5
IP 37.9 25 9 34 41.5
PMSD 16.2 7 7 14 17.1
Other 7.26 0 0 0 0.0
Total 100 62 20 82 100.0 From 5 to 0
For the sake of setting it aside, it should be noted that Model A of Sachs (which allocates the PR seats
regardless of constituency results) does not cure the unfairness of the system. A combination of a
relatively high number of FPTP seats in a mixed system coupled with a parallel formula to allot the
low number of PR seats would not significantly reduce the seat/vote distortion produced by the
excesses of the FPTP system. Its impact is small as it would fail to correct the underrepresentation of
unsuccessful parties. In fact, the majoritarian effect of the formula remains largely dominant,
although tempered by a very small degree of proportionality. Worse, in many cases it actually widens
the majority of the winning party in terms of seats. This is illustrated in Table 11 below.
Table 11: The insignificance of Sachs’ Model A on fairness (20 PR seats)
68
In the majority of cases, the winning party which has already secured an advantage from the FPTP
formula reaps the benefits of the parallel system of the 20 PR seats. For instance in 1982, the
MMM/PSM won all 60 seats while four BLS were awarded to two opposition parties. The winning
coalition had a majority of 54 seats if we include the two Rodrigues Mps as not forming part of the
Government. The MMM/PSM alliance would have taken 14 out of the 20 seats as it polled 64.16 %
of the votes as the parallel mode of attributing seats does not take into consideration the outcome at
constituency level. The second party which was already very disadvantaged by not winning a single
constituency seat with 25.78% of the vote is punished a second time as the lion’s share of PR seats
still goes to the winner of FPTP elections. This explains why the majority in fact widens (from 54 to
66 seats) after the allocation of PR seats, even if as a percentage there is a very slight improvement in
the fortunes of the second party. The same pattern is observed in 1991, 1995 and 2000. These were
the years when the second party was hugely underrepresented and yet the absolute difference in the
number of seats increases after the distribution of the 20 PR seats. It is hardly a solution to correct the
deficiency of the FPTP formula except if we are looking at token representation.
69
Year Majority (seats) Majority (seats)
FPTP/BLS FPTP/Sachs A
1967 16 181976 2 61982 54 661983 22 221987 18 161991 48 561995 54 682000 46 502005 14 162010 21 22
12. The way forward : keep FPTP baby, throw away bath water of its huge unfairness
Some countries have electoral systems characterized by conscious design after extensive and
wide ranging debate on the attractiveness of particular electoral formulae. In other cases, the
electoral formula has been the result of compromise by the various political actors based on
its culture, heritage and tradition rather than on an objective evaluation of the relative merits
of different rules. Our electoral system is clearly the outcome of a mix of conscious design
after extensive discussion and the result of a compromise by the various political actors.
Banwell had produced his report after protracted debate; yet it was not accepted as such.
Subsequent negotiations led to the adoption of the 20 three-member constituencies as
recommended by Banwell, the rejection of the variable correctives, the revision of the fixed
correctives from 5 to 8 Mps and the addition of new conditions to ensure that the
apportionment of the BLS does not change the results of the elections. The requirement to
poll at least 10 % of national votes to be eligible for BLS was also dropped.
It is against this background of compromise by political actors that I am suggesting a
uniquely designed electoral system based on our context, our history and our realities to
resolve the conflict between stability and fairness.
The main features of the proposal are as follows:
(i) to retain the 20 three-member constituencies and one two-member constituency
(Rodrigues) using FPTP mode. Voters will continue to elect three candidates ( two in
Rodrigues) of their choice as is currently the case. This is the nominal tier;
70
(ii) to keep the boundaries of the 20 existing constituencies unchanged for some time.
This may be necessary to reassure some segments of society, to allow the new
electoral system to settle down and to prevent the reform from being hijacked by
other considerations;
(iii) to subsume the BLS into the new FPTP/additional list tier voting formula. The
objective of diverse representation remains while the mechanism to ensure its
attainment is replaced by the set of measures spelt out earlier in this report;
(iv) to allocate an additional 20 seats on a party list tier. It would be a very difficult
practical task to cure the defect of unfairness in the system without increasing the
number of seats. The alternative is to lower the number of FPTP constituencies so as
to keep the overall number of MPs constant or to change the formula radically as
proposed by Carcassonne. But then we have to redefine constituency boundaries and
this would become a source of bitter controversy and deep division;
(v) to have a National Assembly of 82 seats, 62 elected through FPTP system and 20 by
party list. This would imply an additional 12 seats compared to what obtains
currently. It is probably the price to remedy the deficiency of the FPTP system
without causing collateral damage in terms of redrawing constituencies and reducing
their number. And it will also facilitate the subsumption of the BLS;
(vi) to allot the 20 party list tier seats on a national basis;
71

(vii) to return these 20 list tier Mps through a closed, rank-based party list. Parties should
constitute their list both in terms of numbers and rank to broadly reflect the diversity
and plurality of the country. In that mixed system, 62 Mps or 76 % of all Mps will be
elected directly by the voters that send them to Parliament through the FPTP system
while 20 Mps or 24 % of all Mps will be chosen on closed, rank-based party list.
This is necessary both for fairness and inclusiveness. There are countries with diverse
population that use this technique to ensure broad based political representation;
(viii) to allow double candidacies where some candidates will both appear on the Party list
and will compete in FPTP constituency elections. The actual number of double
candidacies should be left to parties as part of their electoral strategy of aligning
candidates to maximize their chances of success. Again this exists in many mixed
systems. If a candidate is not elected in the constituency, he/she has the chance of
being returned from the list. The basis for this flexibility is so obvious in our
electoral system;
(ix) to have no more than two candidates of the same sex in each of the 20 constituencies.
We should equally provide for party lists to ensure that neither gender represents less
than 33 % of candidates. And we should have a narrow ‘zipper’ so that there is at
least one person of a different gender out of every three sequential candidates on
party lists ;
(x) to introduce a minimum threshold of at least 10 % of national vote for parties to be
eligible for the 20 list tier seats; if it appears too unfair to some genuine, non-
72
communal parties, we could provide that the 10 % of national vote shall be lowered to
5 % if a party also wins three constituency seats ;
(xi) to use the d’Hondt highest average formula to allocate the 20 additional list tier seats
among eligible parties;
(xii) to have one set of vote (three votes per constituency on the mainland and two in
Rodrigues). The three votes (two in Rodrigues) will return the 62 FPTP Mps. These
three same votes will also be considered as votes for the respective parties. Their
unreturned votes will be aggregated at the national level to apportion the 20 list tier
seats, subject to meeting the minimum threshold;
(xiii) to provide for the party lists to be submitted to the Electoral Commissioner and
published before elections as nominations for the allocation of the 20 seats (say, on
Nomination Day itself). It will inform electors on the composition and rank of the
list. This is how it is done in mature democracies as the population has a right to
know for whom it is voting;
(xiv) to appoint the next person on the party list to Parliament in case of a vacancy for list
tier Mps. As these Mps are returned on the basis of votes polled by candidates
belonging to their respective parties, there will be no by-elections, as is the case in
countries with such voting formula. Provided that the newly chosen candidate is still a
member of the eligible party. For instance in Germany, a list member is replaced by
the next non-elected candidate on that party’s list, with the proviso that he or she must
still be a member of the party. By-elections would continue to be organised to
replace constituency MPs as they are elected ‘nominally’ and not by Party list;
73
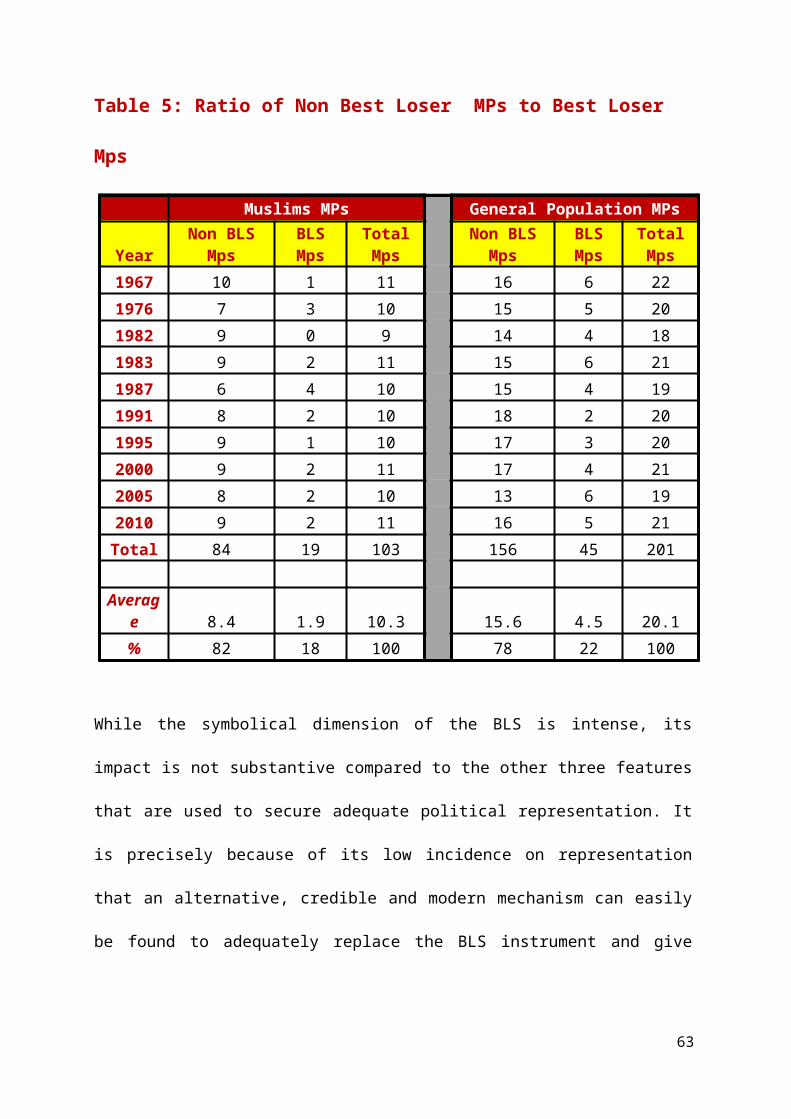
(xv) to replace the party list Mps in case of crossing of the floor. This is straightforward
as it is the party that has appointed him or her. Therefore he/she should be
automatically replaced by another candidate from the Party if he/she defects. Of
course, in case of constituency Mps, the problem is trickier as he/she has been elected
‘nominally’. Therefore the same procedure cannot apply. He/she retains the seat until
the next election.
We are still left with the stability/fairness issue. On the one hand, if the method of allocating
the 20 list tier seats is too proportional, it will sacrifice stability and effectiveness. On the
other, if the formula is too timid on reasonably attenuating the unfairness of FPTP, we are
still left with its defect.
74
13. Defining some concepts in the new electoral landscape : welcome to the party
The 20 list tier Mps will be returned from a closed Party List. Most countries with
some form of Party list system resort to closed list to choose Mps , even if others use
an open or a flexible list. MPs. In this system, parties make a list of candidates to be
elected and seats are awarded to each party in proportion to the number of votes it
receives. Candidates are elected in the order they appear on the Party list until all seats
are filled. The list is pre-determined by the party and cannot be changed by the voter.
Box 4 gives a list of some countries that use a closed Party list to return Mps. In many
of them, this is the only way in which Mps are elected to Parliament.
Box 4: Some countries using closed Party List to return Mps
There are many states with a mixed electoral system that allow double candidacies. Evidence
suggests that in these countries, the overwhelming majority of candidates contest elections
both in constituencies and on Party list. And there are many Mps who alternate between the
two modes during their Parliamentary career. In the event of the candidate being returned in
the constituency race, his name is automatically struck from the list and the seat goes to the
75
Norway South Africa Argentina Japan
Spain Israel Peru Uruguay
Portugal Mozambique Iraq Angola
Italy Serbia Cambodia Guyana
Mps for European Parliament in UK and France
next unelected candidate on the list. In practice high positions on the list are taken by party
members who also stand as candidates in specific districts. This strategy protects the party in
case it loses power; most of its senior members will be elected from the Party List. Double
candidacies also solve the problems of two categories of Mps in mixed system (one
contesting in constituency and the other standing on the list) as many candidates on the list
are competing in FPTP race. It gives a safety net to some candidates, especially the leaders
of the parties. In Mauritius it will have the added advantage of affording some reassurance to
those who may have been penalised at the level of constituencies for some unfortunate
reasons. In this case it would operate in a similar manner to the Best Loser System. One does
not necessarily have to be highly placed to become a party list Mp. It depends how many
successful constituency candidates are ranked higher. In 2005, for example, one candidate
of the CDU in North-Rhine Westphalia in Germany was placed only 33rd on the party’s state
list, but was nevertheless elected because 11 other CDU candidates ranked above him won
their constituencies. These winners are thus no longer considered for the seat distribution by
list, and other list candidates ranked lower move up.
45 % of candidates in the German 2005 election ran both in a constituency and on a party list, 37 %
was on the party list alone while only 18 % contested just in a constituency. This practice has spread
to countries that have adopted such a mixed system. The percentage of candidates on the list who did
not run in constituencies was only 8.5 % and 3.3 % respectively in the 2003 Scottish and Welsh
elections, and only 5.8 % in the 2002 New Zealand election. The strategy seems to have emerged
from lessons learned over many elections. With experience, parties fully understand the great
advantages of double candidacies. It is worth noting that double candidacy has allowed Chancellor
Helmut Kohl of Germany to enter the Bundestag despite being defeated in his constituency in some
76
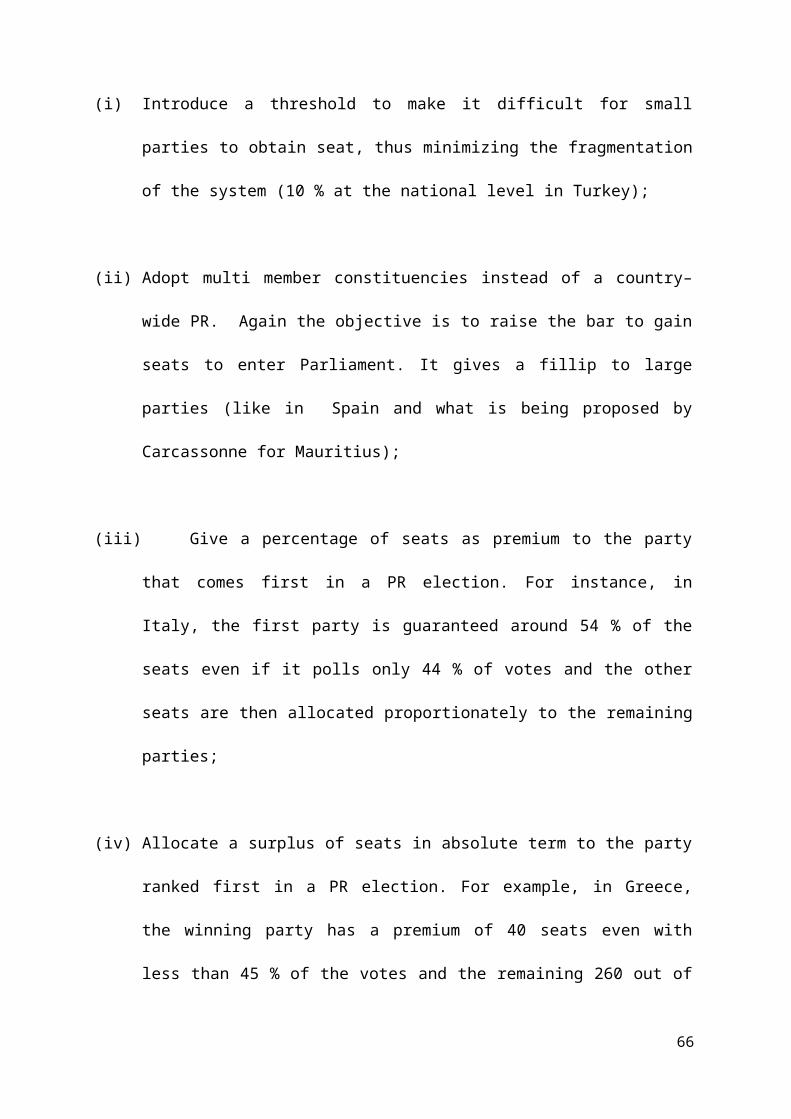
elections. And it did not undermine his authority as Chancellor in Germany. Box 4 illustrates some
countries with mixed system where double candidacy is very common
Box 5 : Some countries where double candidacy is very common
A minimum threshold is usually necessary to be eligible for list tier seats. The threshold can
be implicit or explicit. Implicit thresholds are the outcome of quotas from votes cast (as
proposed by Carcassonne) while explicit thresholds are predetermined percentages of votes
necessary for a party to secure representation ( as recommended by Sachs). Countries that
favour broad representation tend to have a low threshold (South Africa is at an extremely low
0.25 % ) while those that seek to exclude extremist or single issue parties fix a high threshold
(Turkey at 10 %). In Germany it is either a minimum threshold of 5 % or a requirement to
have won 3 constituency seats. It is plain that the higher the threshold, the more difficult it is
for small parties to gain Parliamentary representation while the lower it is, the higher the
risks of fragmentation of the party system and the polarisation on communal lines that could
pose a threat to national unity. It is a very difficult choice to make especially in a multi ethnic
society. On balance, I prefer to err on the side of caution and am recommending a 10 %
threshold even if it appears high and could be unfair to many genuine, non-communal small
parties. The risks of ethnic fragmentation and polarisation is simply too elevated. However I
am also recommending the possibility of allowing parties that obtain 5 % of national votes
and three FPTP Mps to become eligible for the 20 List tier Mps.
77
Germany Japan
New Zealand Lesotho
Wales Scotland
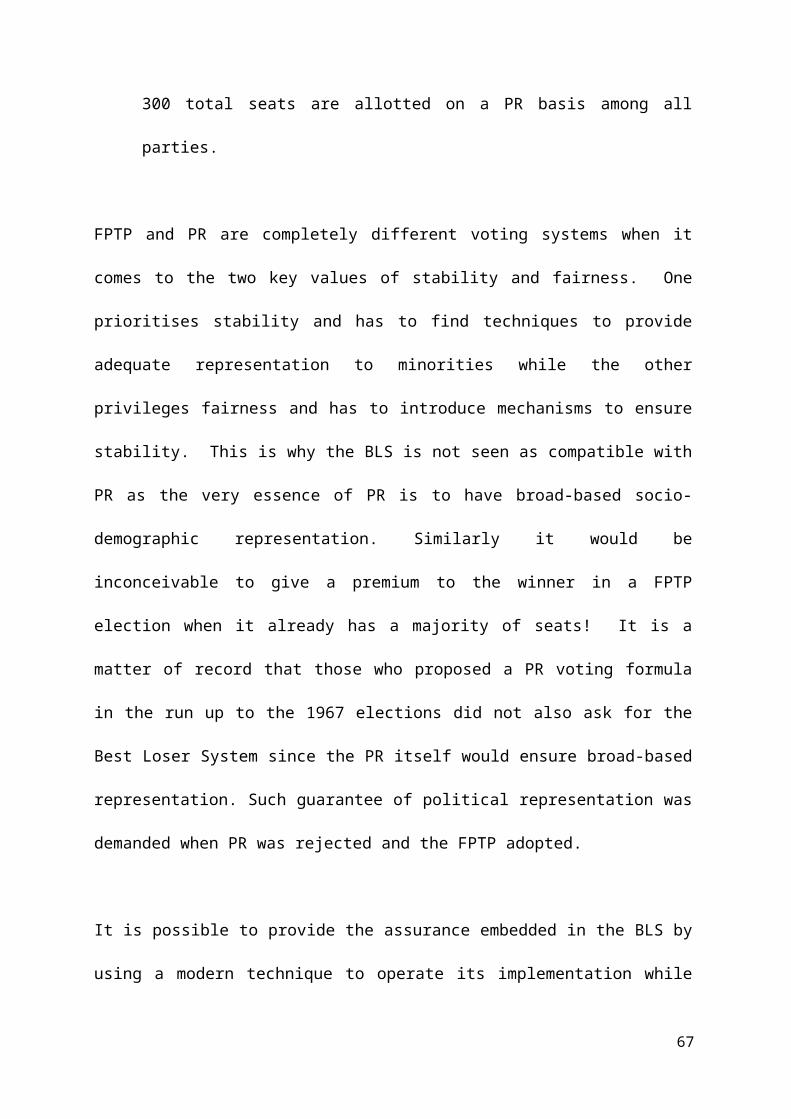
14. Remember some of Sachs : forward with the past or back to the future
After thoroughly evaluating the various options and following wide consultations and
dialogue with many stakeholders and taking into account both contextual factors and the
historical, social and political specificities of the country, the Sachs Commission proposed a
mixed model that combines features of a plurality system with some proportional elements as
contained in Model C. It advocated the retention of the 62 FPTP Mps and recommended the
election of 30 PR Mps along a compensatory PR mode that takes into account the results at
constituency levels. Parties should poll at least 10 % of the national vote to be eligible for
the 30 PR seats. It has a very marked preference for subsuming the BLS into the 30 PR seats,
thus giving a Parliament of 92 seats. Otherwise there would be 100 Mps.
Model C of Sachs is attractive for many reasons and was supported by the major political
parties. It attempts to reach a balance between the two key attributes of stability and fairness.
It is familiar to voters as FPTP continues to be the most important component of the mixed
system. The 62 representatives elected via FPTP would ensure stability while fairness would
be guaranteed by returning the 30 PR seats through a compensatory formula that would
correct the underrepresentation of Opposition parties. It would also satisfy the other criteria
of a good electoral system such as accountability and constituency links. They would also
produce a balanced list that reflects the diversity and plurality of Mauritius. The combination
of three-member constituencies, the 10 % threshold and the Party list would not exacerbate
fragmentation on communal and ethnic lines. Thus Model C scores well on the issue of
national harmony and social progress as most parties would present Party lists that cut across
ethnic lines and promote gender fairness.
78

However it suffers from three drawbacks. First, there are probably too many seats especially
when compared to the number of persons per Mp and this may not be in line with the
expectations of the population. Second, there is also no need for 30 seats to cure the defect of
the FPTP voting mode; it can be done with fewer additional seats. I recommend that the
number of Mps be lowered from 92 to 82. The third drawback was amplified by the context
and the circumstances. The elections to the newly set up Regional Assembly in Rodrigues
took place after the submission of the Sachs report. The elections were held under a similar
voting formula to Model C of Sachs. It is a mixed system of 12 FPTP seats elected from 6
two-member local region and 6 PR seats allocated on an island-wide basis on a compensatory
basis. Many believe that the new electoral system produced too proportional a result and
could affect the stability of the Regional Government as the leading party’s majority was
sharply narrowed after the allotment of the PR seats. However, one should admit that the
final results probably reflected the balance of power in the island and the limited number of
seats at stake.
Nevertheless it is a fact that Model C of Sachs becomes very proportional when elections are
close in terms of votes. Under these circumstances, it might be difficult to have stability.
However, this is simply a question of values and they vary considerably across the
international spectrum. Should two parties that receive almost the same share of votes obtain
very different level of seats ?. The question is simple while the answer is highly complex.
Countries that value fairness and have been used to elections that reflect these values
(Netherlands, Denmark, South Africa, Germany, New Zealand and Sweden) would strongly
argue that seats allocation should be proportional to the votes of parties, even if governability
would be very difficult under these circumstances. For them the essence of democracy is
fairness and equitable representation. On the other hand, states that cherish effectiveness and
79

stability and have known this electoral system for a long time have no qualm about
disproportionality between seats and votes as long it delivers effective government (United
Kingdom, France, USA, Australia, India and Mauritius). For them the most important
attribute of democracy is effective and decisive government. Even in a mixed system such as
Model C of Sachs, this conflict is not resolved in all circumstances. While we value fairness,
our proclivity for the strengths of FPTP and our culture of confrontation, conflict and
adversary politics as opposed to accommodation, collaboration and consensus are such that
many would like elections to be decisive in outcome so as to encourage the quick formation
of Government after even a close election.
There are various practical ways of addressing the problem of too much proportionality in
Model C of Sachs. I shall mention three possibilities as follows:
(i) first, it could be tweaked to suit our specific circumstances. Essentially its
application could be limited when it becomes too proportional so as to leave an
acceptable margin to the party that has come first in the elections. We need to decide
on the margin (say a maximum of 10 % of seats in a Parliament of 80 members)
subject to polling a threshold level of votes. It has existed in some countries and
there are similar mechanisms at work elsewhere. It has fundamental drawbacks,
especially as it artificially creates a majority through some constitutional engineering;
(ii) second, we could allow Model C of Sachs to be fully operational and adjust
afterwards by giving some additional seats to the winner of FPTP to produce a
majority. Here we have to decide on the premium. It is essentially what has been
provided for Rodrigues after the close elections to the Regional Assembly in 2002. It
80

has many deficiencies especially as it artificially changes the will of the people after
the application of a voting formula;
(iii) third, is a formula that constitutes a departure from the apportionment mechanism
used by Model C of Sachs. It also attempts to narrow the disproportionality between
seats and votes significantly, but not fully as Model C of Sachs; however it leaves a
working majority for the winner of the elections even in closely contested ones. It is
designed to achieve a middle ground between the criteria of stability and the value of
fairness. Basically it sits between the current FPTP and Model C of Sachs, while
being closer to the latter. It is the UVE formula.
81
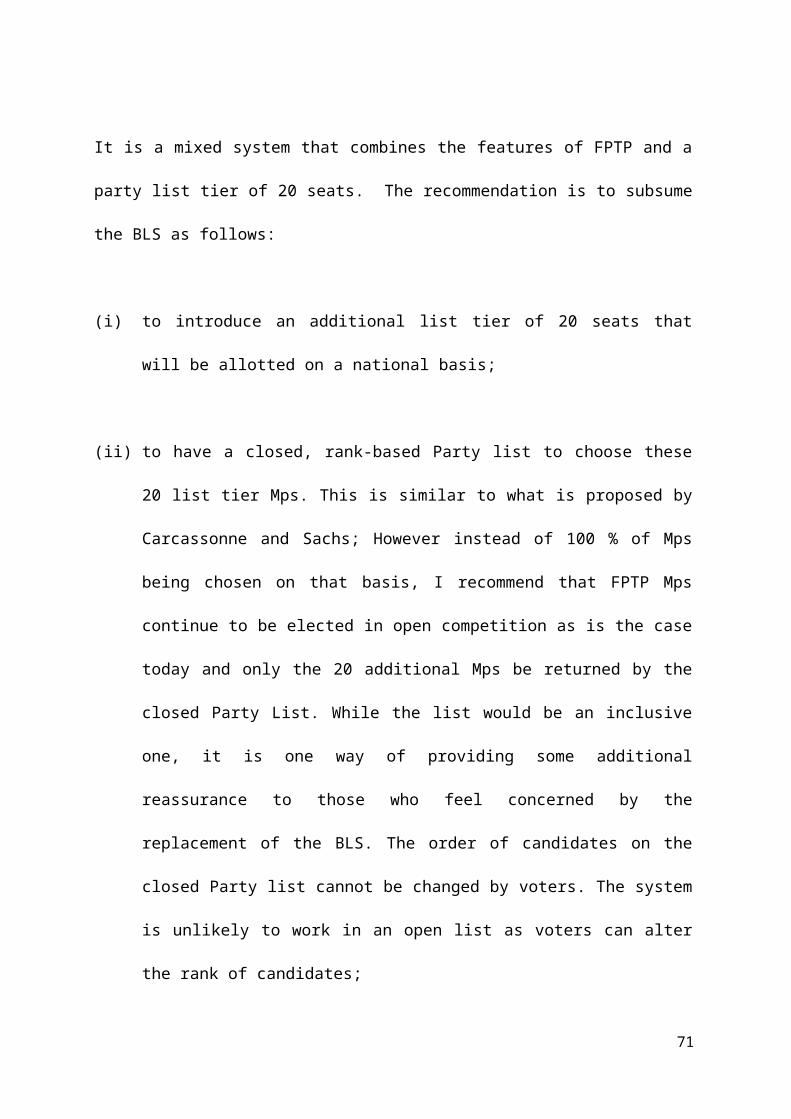
15. Unreturned Votes Elect : can the odd couple of stability and fairness be reconciled?
The concept of unreturned votes and its rationale have already been explained . Now it needs to
be operationalised to produce results that would address the stability/fairness dilemma. Table 12
gives the extent of the votes of unsuccessful candidates for the ten elections since 1967. They
are extremely high and are at the heart of the unfairness of the FPTP electoral system. 55 % of
votes were used in 1987 to elect Mps while 45 % of votes had no representation at all. The
percentages of votes of unreturned candidates were very high at 48 % and 46 % in 2005 and 2010
respectively. The share of these votes went up significantly to 57 % in 1976 because of the three
way electoral contest. Many Mps were elected on 40 % of the votes which implies that 60 % of
votes had no representation in these constituencies.
Table 12: Votes of unreturned candidates as a percentage of total votes
The results of the general elections of 1987 are used to illustrate the workings of the UVE
mechanism. The outcome of that election is given at Table 13.
82
YearVotes of
unreturned candidates
% of total votes
1967 40
1976 57
1982 36
1983 44
1987 451991 44
1995 342000 482005 482010 46

Table 13 : Results of 1987 general elections
% votes
Elected MPs
% of seats
Best Losers
Total seats
% of seats
without BLS with BLS
MSM/LP/PMSD 49.86 39 62.9 5 44 62.9
MMM & Allies 48.12 21 33.9 3 24 34.3
Other 2.02 2 3.2 0 2 2.9
Total 100 62 100 8 70 100
Majority 18
The MSM/LP/PMSD alliance captured 49.86 % of the votes and won 44 seats (39 directly
elected Mps and 5 Best Losers) while the MMM and its allies polled 48.12 % of votes and
obtained 24 seats (21 directly elected and 3 Best Losers). There is thus a huge degree of
disproportionality between seats and votes. The winner took 62.9 % of the seats with only
49.86 % of the votes while the second party received only 34.3 % of the seats for 48.12 % of
the votes. The Government had a majority of 18 seats. What is required is a formula that will
reward the second party for having been penalized by the FPTP formula, without making it
extremely difficult for the winner to govern.
We proceed by computing the votes of all candidates that have not been returned in each
constituency, provided their parties have polled at least 10 % of national votes ( or the 5 %
plus 3 FPTP Mps formula) . In constituencies where three members of the same party have
been elected, the formula will calculate the votes of the three candidates of the other parties.
In constituencies where candidates of both parties are returned (or for that matter of three
parties like in Port Louis Maritime/Port Louis East in 2010), the votes of unelected
candidates of all the parties are taken into account. This is carried out for all 21
83

constituencies and the sum of such votes from unreturned candidates is aggregated to reach a
national figure for both parties (or more if necessary). And the parties are allocated seats
proportional to their share of votes of unreturned candidates nationally. In cases of one party
winning all FPTP seats, as in 1982 and 1995, all the 20 additional tier seats will go to other
parties as there will not be any unreturned candidates of the winning party.
For instance, in Grand Riviere North West/Port Louis West, the MMM won all three seats in
1987 and the three candidates of the second party obtained a total of 26979 votes. These
votes are credited to the account of the MSM/LP/PMSD alliance. In Grand Baie/Poudre
D’Or, the MSM/LP/PMSD captured all three seats. The three unreturned MMM candidates
polled 34824 votes and these are given to that party. In Rivière Des Anguilles/Souillac, the
MSM/LP/PMSD won 2 seats while the MMM returned one MP. In that case, the votes of the
two unsuccessful candidates of the MMM and the one of the MSM/LP/PMSD alliance are
reckoned as unreturned votes. The principle is simple. There is compensation for parties
whose candidates have polled a high percentage of votes but which have been totally ignored
by the FPTP formula. However this is done on a constituency by constituency basis and then
aggregated nationally so as to reward parties. The benefit accruing to each party will
depend on the extent that it has been penalized at constituency level.
The simulated computation of unreturned votes for the elections of 1987 are produced at
Table 14 below. In constituencies where one party has won all three seats, it will not receive
any ‘unreturned votes’ as it has already taken the three seats. The second party will earn
some credit for the purpose of the allotment of the 20 additional seats. In cases where there
are split votes in a constituency, both parties will have votes from unreturned candidates;
however the party that has returned two Mps will have a lower number of such votes than the
84

one with only one elected representative. As the MMM was disadvantaged by the FPTP
contest, it would have more votes from unreturned candidates. However it is not a one way
traffic as is the case in Model C of Sachs formula. The party that came first but lost in some
constituencies is also rewarded. As the MMM received 492468 votes from its unreturned
candidates and the MSM/LP/PMSD 224764 , the share of the additional tier seats is divided
in relative proportion between the different parties, using the D’Hondt formula. Parties that
receive less than 10 % of national votes ( or 5 % plus 3 FPTP Mps) are not eligible for these
seats. Thus the MMM would have received 14 additional seats while the MSM/LP/PMSD
would be entitled to 6 more Mps. The candidates are chosen from the rank-based closed
Party List. 14 candidates on the MMM list are returned as list tier Mps (some will be
candidates who have lost in constituencies and whose name also appear on the Party List).
Similarly, 6 candidates would be elected on the MSM/LP/PMSD party list . If some who
appear on the Party list are elected in constituency contests, their names are removed and
those further down are chosen.
85

Table 14 : Seat allocation using votes of unreturned candidates (1987) (20 seats)
1987 Votes of unreturned candidates
Constituency MSM/LP/PMSD MMM Total
1 26979 26979
2 24553 24553
3 10998 10998
4 28181 14342 42523
5 40895 40895
6 34824 34824
7 30748 30748
8 33014 33014
9 40330 40330
10 40473 40473
11 28185 28185
12 31591 31591
13 11638 23385 35023
14 17074 32853 49927
15 33088 17166 50254
16 14817 29196 44013
17 38161 38161
18 43600 43600
19 30985 30985
20 26451 13705 40156
Total 224764 492468 717232
% of wasted votes 31.3 68.7 100.0
Additional Tier Seats 6 14 20
The final outcome of the 1987 elections with this new formula would be as given at Table 15.
86
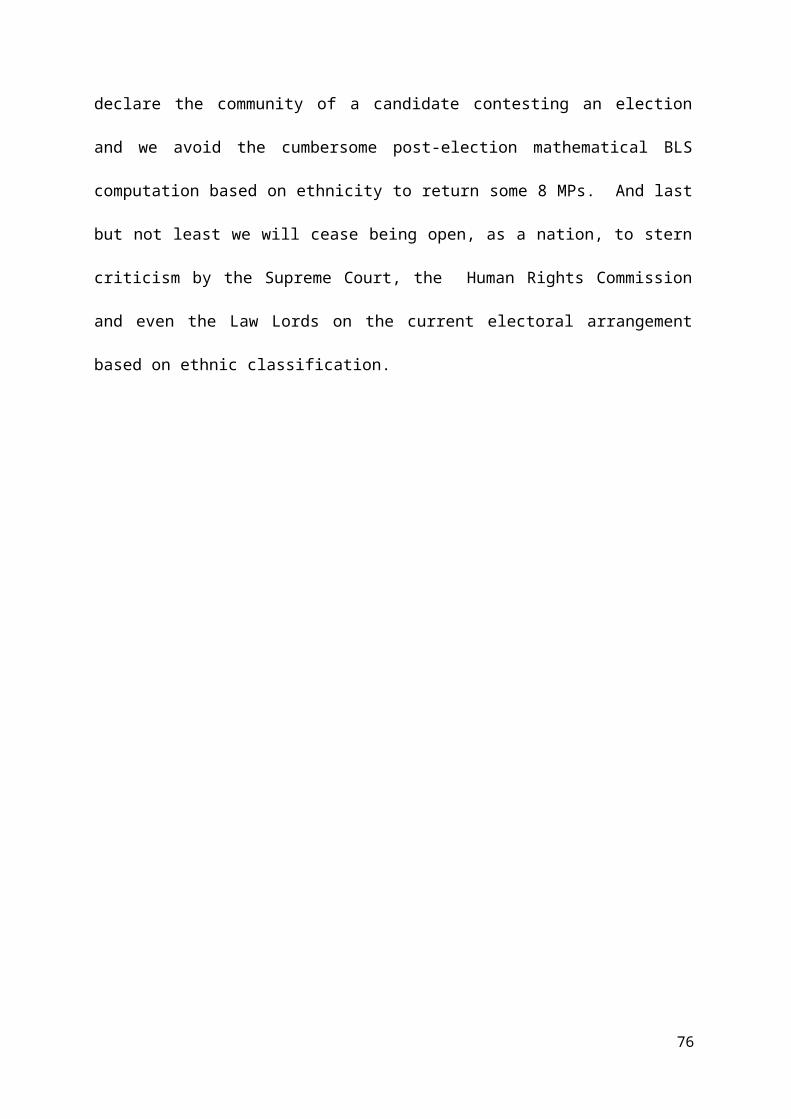
Table 15 : Simulation of 1987 elections with UVE formula
% votes
FPTP Mps
% FPTP Mps
Additional Tier Mps
Total seats
% Total seats
Distribution
MSM/LP/PMSD 49.86 39 62.9 6 45 54.9
MMM & Allies 48.12 21 33.9 14 35 42.7
Other 2.02 2 3.2 0 2 2.4
Total 100 62 100 20 82 100
Majority 8
This is a significantly better outcome in terms of fairness than the FPTP formula. It is at the
same time superior in terms of stability than Model C of Sachs. The party with 48.12 % of the
votes now has 42.7 % of the seats compared to 34.3 % in the current FPTP formula (see Table
13). There is now a difference of only 5.4 % between seats and votes of the second party
(42.7 % of seats to 48.12 % of votes). This is very acceptable by international standards. The
winning party still has a working majority of 8 seats (equivalent to around 10 % of the number
of MPs) compared with 18 under FPTP. The majority is much higher than in Model C of
Sachs (which was zero).
Table 16 shows the simulation for the four very disproportionate elections of 1982 and 1995
(in both cases one alliance won all 60 seats) and of 1991 and 2000 (in both elections, one party
with around 50 % of votes obtained almost 90 % of seats). The proposed model based on
compensating parties on the basis of the votes of unreturned candidates performs as expected.
In the two cases of 60-0, all the 20 PR seats would accrue to the second party. In 1982, the
PAN alliance would receive around 25 % of seats, very close to its vote tally of 25.78 %.
87
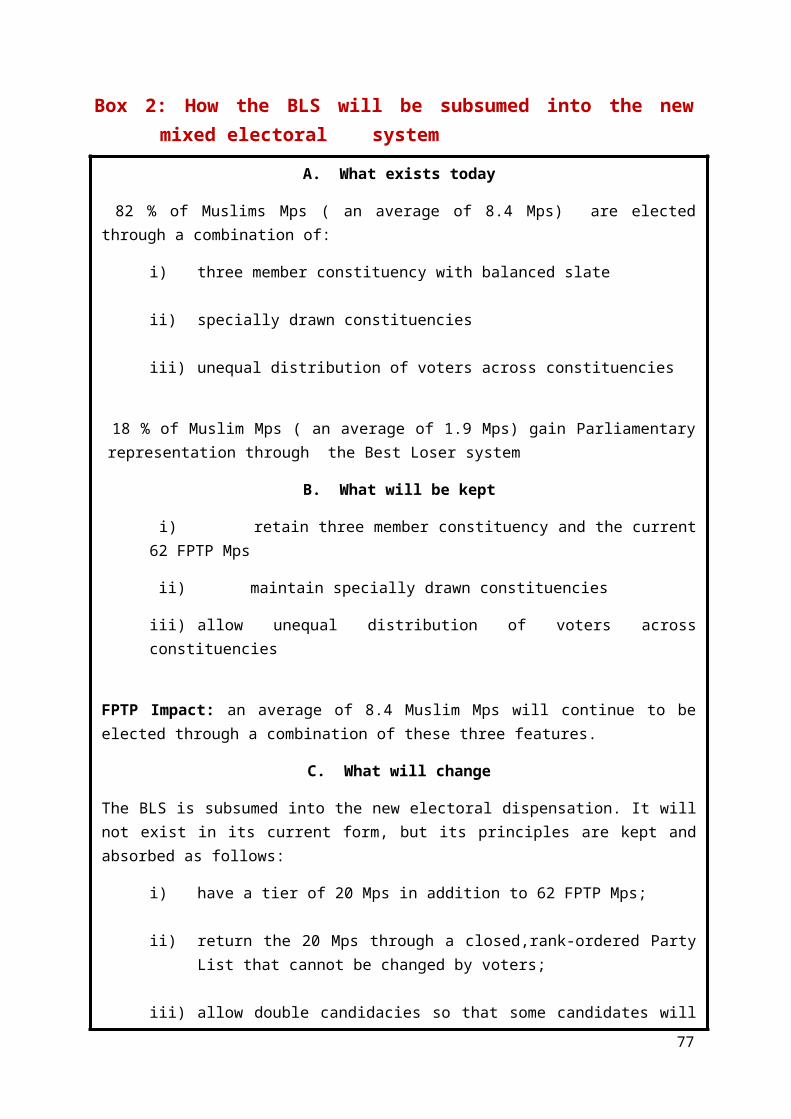
Table 16: Simulation of 1982, 1995, 1991 and 2000 elections with UVE formula
1982 % votesFPTP Mps
% FPTP Mps
Additional Tier Mps
Total seats
% Total seats
MMM/PSM 64.16 60 96.8 0 60 73.2
PAN 25.78 0 0.0 20 20 24.4
Other 10.06 2 3.2 0 2 2.4
Total 100 62 100.0 20 82 100
1995
LP/MMM 65.2 60 96.8 0 60 73.2
MSM 19.7 0 0.0 20 20 24.4
Other 15.1 2 3.2 0 2 2.4
Total 100 62 100.0 20 82 100
1991MSM/MMM 56.3 57 91.9 1 58 70.7
LP/PMSD 40 3 4.8 19 22 26.8
Other 3.7 2 3.2 0 2 2.4
Total 100 62 100.0 20 82 100
2000MSM/MMM 51.5 54 87.1 2 56 68.3
LP/PMSD 36.7 6 9.7 18 24 29.3
Other 11.8 2 3.2 0 2 2.4
Total 100 62 100.0 20 82 100
Similarly in 1995 the MSM would have kept all 20 PR seats, representing around 24.5 % of
seats for a vote tally of 19.7%. However in both cases, the winning party retains a
considerable majority (38 in both cases). The country would have had a strong contingent of
opposition members in Parliament. This result is not different from what would happen
88

under Model C of Sachs. In 1991 and 2000, the second party which was penalized in FPTP
contest would have received 19 and 18 PR seats respectively. It obtained only 3 and 6 FPTP
seats and the compensation is very similar to what Sachs would have provided. It is far better
in terms of fairness than the FPTP outcome and the winner still has a majority to govern.
Overall, the LP/PMSD alliance would have more than 20 Mps compared to the 7 and 8 that it
actually obtained. This makes a major difference for Parliamentary democracy and for
fairness. However there is still some disproportionality between votes and seats.
Table 17 gives the simulations for the five remaining general elections held since 1967
(1967, 1976, 1983, 2005 and 2010). Again they produce a good balance between the two
competing attributes of stability and fairness. In 1967, it produced a highly proportional
result but it also generated a good working majority of 10 seats. The elections of 1976 would
have necessitated a post-election coalition in all cases. The results of the 1983 elections are
very fair with the MMM receiving 40 % of seats for 46 % of votes and the majority for the
winning team is reasonable at 12 seats (compared to 22 under FPTP and to 2 under Model C
of Sachs). The same trend is observed for the general elections of 2005 and 2010 with a
degree of deviation between seats and votes for the MMM at 2 % and 4 % respectively. This
is a highly equitable result indeed as it is extremely difficult to expect a pure proportional
outcome. And in both cases, the working majority of 10 Mps and 12 Mps respectively are
much lower than those produced by FPTP formula (14 and 21 respectively) but higher than
those created by Model C of Sachs (at 4 in both cases).
89
Table 17: Simulation of 1967, 1976, 1983, 2005, 2010 elections with UVE formula
1967%
votesFPTP MPs
% FPTP MPS
Additional Tier Mps
Total seats
% Total seats
IP 54.13 39 62.9 7 46 56.1PMSD 43.99 23 37.1 13 36 43.9Other 1.88 0 0.0 0 0 0.0Total 100 62 100.0 20 82 100
Majority 10
1976MMM 38.64 30 48.4 7 37 45.1
IP 37.9 25 40.3 8 33 40.2PMSD 16.2 7 11.3 5 12 14.6Other 7.26 0 0.0 0 0 0.0Total 100 62 100.0 20 82 100
Majority Hung
1983MSM/LP/
PMSD 52.22 41 66.1 6 47 57.3MMM 46.4 19 30.6 14 33 40.2Other 1.38 2 3.2 0 2 2.4Total 100 62 100.0 20 82 100
Majority 12
2005LP/PMSD 49.39 38 61.3 8 46 56.1
MSM/MMM 43.3 22 35.5 12 34 41.5Other 7.31 2 3.2 0 2 2.4Total 100 62 100.0 20 82 100
Majority 10
2010LP/MSM/
PMSD 50.72 41 66.1 6 47 57.3MMM 42.88 18 29.0 14 32 39.0Other 6.4 3 4.8 0 3 3.7Total 100 62 100.0 20 82 100
Majority 12
90
Could there be any unintended consequence in the application of the UVE formula?. Ten
elections are quite a reasonable sample to test the robustness of an electoral formula. It
behaves well in all 10 simulations with respect to the balance between fairness and stability.
Of course Sachs Model C would produce slightly more proportional results in some elections
but at the expense of stability and effectiveness. The Carcassonne model could produce
equitable result at the national level with fairly disproportional outcome at the level of each
constituency. However both Sachs Model C and Carcassonne could be extremely weak on
stability when results are close in terms of percentage of votes.
91
16. Between FPTP and Sachs : the middle is better than the extremes
Table 18 makes the comparison between three different electoral systems on the two
dimensional plane of stability and fairness. The three voting formulae are FPTP, Model C of
Sachs and UVE . Stability is measured as the margin of seats that the winning party has in
Parliament. The lower the margin, the less stable the system is deemed to be. The difference
between the percentage of seats obtained by the second party and its share of votes is used as
a proxy for fairness. The higher the negative divergence between the two, the more unfair
the formula is. As expected, the FPTP produces the largest majority in all elections. It ranges
from 14 seats in 2005 to 54 seats in 1982 and 1995. Sachs Model C lowers considerably the
majority in 5 elections; it varies from no majority in 1987, to a majority of 2 seats, 4 seats, 4
seats and 8 seats in 1987, 1983, 2005, 2010 and 1967 respectively. The UVE formula sits
between FPTP and Sachs Model C (closer to the latter ) in the five hotly contested elections
of 1967, 1983, 1987, 2005 and 2010 with a majority varying from 10 seats in 1967 and 2005,
12 seats in 1983 and 2010 and 8 seats in 1987. Essentially it gives a working margin to the
winner. In 1995, it delivers all 20 seats to the MSM while Sachs operates slightly differently.
The 1976 elections delivered a hung Parliament in all three modes. It should be pointed out
that in 1982, Sachs Model C and UVE produce the same majority of 38 seats while in 1991
and 2000, the UVE formula gives a few more seats to the winning party compared to the
Sachs formula.
92
Table 18: FPTP, Sachs C and UVE : which stability and which fairness?
Stability ( Y-X ) Fairness ( % of votes and seats of second party)
Year FPTP Sachs C UVE FPTP Sachs C UVE
Margin of
seats
Margin of
seats
Margin of
seats
% of votes of second
party
% of seats of second
party
% of seats of second
party
% of seats of second
party
1967 16 8 10 43.99 38.57 45.12 43.90
1976 Hung Hung Hung 37.90 40.00 41.46 40.24
1982 54 38 38 25.78 3.03 24.39 24.39
1983 22 2 12 46.40 31.43 46.34 40.24
1987 18 0 8 48.12 34.29 47.56 42.68
1991 48 32 34 40.00 10.61 28.05 26.83
1995 54 42 38 19.70 0.00 21.95 24.39
2000 46 26 30 36.70 11.43 31.71 29.27
2005 14 4 10 43.30 34.29 45.12 41.46
2010 21 4 12 42.88 28.99 43.90 39.02 Y-X is the difference between seats of winning party and those of other parties combined
The FPTP is the most unfair formula as shown by the very high difference between seats and votes
in many elections. In 1995, the second party polled 19.7 % of votes without a single seat while in
1982 , it attracted 3 % of seats on 25.78 % of votes. There are also large differences between votes
and seats in 1991 and 2000 and some distortion in 1983, 1987, 2005 and 2010. Model C of Sachs,
which is a mixed member proportional system, produces the fairest results in most elections. In fact
in some cases, the percentage of seats is higher than the share of votes (1967, 1976, 1995, 2005 and
2010). This is attributable to the threshold of 10 % ( or its alternative of 5 % and 3 FPTP Mps)
which excludes parties below that level from participating in the allotment of the 20 list tier seats. If
we adjust for the threshold, Model C of Sachs becomes a full PR system in 8 out of the ten
elections, even if it a mixed FPTP/PR system. The only reason why it is not proportional in 1991
93

and in 2000 is the number of PR seats which is fixed at 20. If there were 30 seats, all 10 elections
would become very proportional. The UVE formula lowers the disproportionality between seats and
votes considerably ; however it does not transform the electoral system into a pure proportional
model. It is very fair to the second party in all the 10 elections. In 1987 the MMM and allies would
have captured 42.68 % of seats with 48.12 % of votes while in 1983 it would have received 40.24
% of seats with 46.4 % of the votes. The same pattern emerges in 2005 and 2010. There are
elections where there is either no difference between the two (1982) or a very marginal one (1991).
The high difference between seats and votes in 1991 is attributable to the fact that there are not
enough seats to compensate the LP/PMSD alliance for its relatively high share of votes at 40 %.
The greatest merit of the UVE formula is to bring down the level of the FPTP unfairness
significantly while affording a working majority to the winner.
94
17. Conclusion: Have we reached the goal post?
Choosing the right electoral system in a plural society is a very difficult process as it is never
neutral. It has very clear implications on the political development of the country.
Historical, political, social, cultural, contextual and temporal factors have to be taken into
account as the system and any reform do not take place in a vacuum. A lot of emphasis is
placed on characteristics such as stable, effective, responsive and accountable government,
fairness, social and political representation and inclusiveness while features like voter’s
choice, links between elected representatives and their constituents are also important. It is
almost impossible for one electoral formula to satisfy all these attributes. In fact some of
them are mutually exclusive as often it is possible to achieve one particular objective only at
the expense of another. The exercise is complicated by the fact that electoral systems are not
disinterested in their translation of votes into seats. It depends on many circumstances, on
what the country wants to achieve and what weights it assigns to each of the conditions of a
good system. Finally it depends on the willingness and the desire of political actors to
compromise in order to reach an acceptable and a sustainable consensus.
Often a country cannot choose a perfect system but has to settle for one that is significantly
less imperfect than other formulae. The best voting system for a country is not one that
satisfies only one criterion completely, but one that provides a fair balance among the
different attributes. As no electoral system could possibly meet all these criteria, the
objective should be a solution that is satisfactory rather than optimal. A prudent approach is
to design an electoral system that avoids serious shortcomings.
I have attempted, through research work, wide-ranging consultations,comparative analyses of
voting formulae in plural societies, best international practices, an understanding of the
95
historical perspectives of electoral systems of our country and an appreciation of its specific
realities, to make an independent and an objective contribution in respect of some
fundamental issues raised by the Trustram-Eve (1958), de Smith (1964), Banwell (1966),
Sachs (2002), Collendavelloo (2004) and Carcassonne (2011) reports. After appraising their
various proposals, I am recommending a mixed electoral system with 62 FPTP Mps in three
member constituencies (2 for Rodrigues) and 20 additional tier Mps elected from a closed
rank- ordered party list. The seats are allocated on a uniquely designed formula based on the
votes on unreturned candidates at general elections.
Even if all systems have both defects and virtues, some are however better than others. The
proposed electoral system is not a perfect one but it has the features to provide the most
satisfactory overall balance between them in a multi-ethnic society, especially between
stability and fairness. The ‘specially designed’ mixed electoral system of 62 FPTP in three
member constituencies and 20 additional tier Mps meets all the requirements of a good
electoral system in a plural society. Not all of them perfectly but very satisfactorily. It
produces stability and effectiveness as it gives a working majority to the winning party even
in hotly contested elections. It is fair and equitable as it narrows considerably the
unacceptable distortion between seats and votes, especially for the second party. It achieves
diversity and inclusion in political representation by using an intelligent combination of the
specific features of the FPTP and some well-crafted characteristics of an additional tier
electoral mode. It is very inclusive of women with the proposal to have no more than two
candidates of the same sex in each of the 20 constituencies and at least one person of a
different gender out of every three sequential candidates on the Party List. It ensures
accountability by keeping the essential link between constituents and their elected
representatives as 75 % of Mps will depend on the choice of electors and only 25 % will be
96
chosen by the Party. With a threshold of 10 % ( or 5 % plus 3 FPTP Mps) to be eligible for
national seats, it will also shun single issue parties, promote harmony and foster nationhood.
Never has the country been so close to reaching an agreement among the main political
parties on reforming the electoral rules. All agree on the need for reform. Then there is a
cooling ardour and it starts all over again. Electoral reform has featured prominently in the
electoral manifestoes of all major political parties for a long time. Our political leaders
continue to curse the deficiencies of the FPTP voting formula and extol the virtues of greater
women participation and more fairness. Many of our compatriots look forward to finding an
acceptable solution to the BLS while ensuring inclusion and broad-based socio-demographic
representation. And they all insist on the need to have stability and decisive government. All
these four crucial questions have been comprehensively addressed in this document. The
necessary consensus is there and we need to build on that momentum to accelerate the
process. The ball is now in the court of political actors. Reformers have played a very long
and patient game and the status quo does not appear to be a sustainable option anymore. It is
only a question of timing when reform will actually happen. The balance of probabilities
appears to be on the side of reformers and the deepening and the widening of democracy in
our Motherland.
RAMA SITHANEN
97
Appendices
Appendix 1: Allocation of PR seats in a compensatory mode using D’Hondt’s Highest Average Method
The worked example below shows how the D’Hondt formula allocates PR seats in a compensatory mode. It is
illustrated with the results of the 2007 elections.
1987%
votesFPT
P
seatsSequence of
seats 40 41 42 43 44 45
Highest Average 1.2471.21
6 1.187 1.16 1.133 1.108
MSM/LP/PMSD 49.86 39
Sequence of seats 22 23 24 25 26 27 28 29 30
Highest Average 2.1872.09
2 2.005 1.925 1.851 1.7821.71
9 1.6591.60
4
MMM & Allies 48.12 21Sequence of
seats 31 32 33 34 35 36 37 38 39
Highest Average 1.5521.50
4 1.458 1.415 1.375 1.3371.30
1 1.2661.23
4
Other 2.02 2
100 62
Seat allocation
MSM/LP/PMSD 2 18 20
MMM & Allies 18 1 2 3 4 5 6 7 8 9
10 11 12 13 14 15 16 17 19
Final OutcomeFPT
P PR Total
MSM/LP/PMSD 39 2 41
MMM & Allies 21 18 39
Other 2 0 2
98
Total 62 20 82
The MSM/LP/PMSD alliance won 39 seats ( or 65 % of seats) with 49.86 % of the votes
while the MMM and allies took 21 seats ( or 35 % of seats) with 48.12 % of votes.
Successive quotients are calculated for each party. The formula for the quotient is the
percentage of votes divided into the number of seats already won by each party plus one.
Whichever list has the highest average gets the next seat and its quotient is recalculated given
its new seat total. The process is repeated until the 20 seats are allocated. It simply attempts
to keep the ratio of votes polled to seats allotted as close as possible. The MSM/LP/PMSD
alliance first quotient is obtained by dividing 49.86 % into 40 ( 39 seats plus one), which
gives a figure of 1.247. That of the MMM and allies is reached by dividing 48.12 % into 22
(21 seats plus one) and it yields 2.187. This is due to the fact that the MMM and allies have
been penalised in FPTP contest. The MMM is entitled to the first seat as it has a higher
quotient. The next quotient of the MMM is now obtained by dividing 48.12 into 23 ( as it has
won one additional seat). This now stands at 2.092 which is still higher than 1.247. The
process continues until all 20 seats are allotted. The first 17 seats accrue to the MMM and
allies as its quotient remains higher than 1.247 which is the quotient at which the
MSM/LP/PMSD alliance would be entitled to its first seat. The MSM/LP/PMSD receives the
18 th and 20 th seats. Of the 20 PR seats, the MMM and allies captures 18 seats while the
MSM/LP/PMSD takes 2 seats. Overall, the MSM/LP/PMSD ends up with 41 seats, the
MMM and allies with 39 seats and Rodrigues with 2 Mps.
99
Appendix 2: Apportionment of 20 additional UVE seats in 1967
100
1967 Votes of unreturned candidates
Constituency IP PMSD Total
1 17379 17379
2 14371 14371
3 12908 12908
4 19607 19607
5 12320 12320
6 13476 13476
7 5333 5333
8 10758 10758
9 11846 11846
10 15457 15457
11 10972 10972
12 14899 14899
13 15444 15444
14 19678 19678
15 20306 20306
16 21458 21458
17 13965 13965
18 18438 18438
19 17846 17846
20 18024 18024
Total 112931 191554 304485
% of votes 37.1 62.9 100.0
Additional Tier Seats 7 13 20
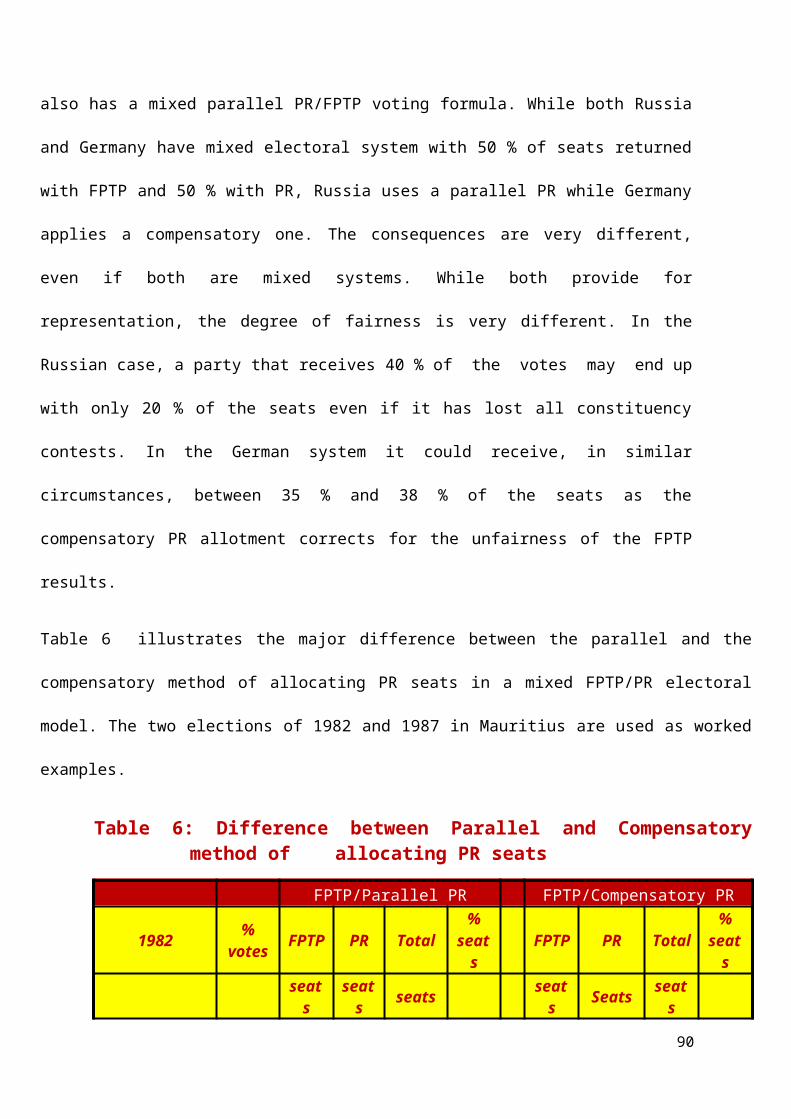
Appendix 3: Apportionment of 20 additional UVE seats in 1976
101
1976 Votes of unreturned candidates
Constituency IP MMM PMSD Total
1 14809 17502 32311
2 15605 9048 24653
3 9260 5899 15159
4 22682 13643 36325
5 21367 4715 26082
6 17103 8833 7655 33591
7 7538 12272 2597 22407
8 8883 16186 2413 27482
9 15913 8413 548 24874
10 16833 8858 25691
11 17345 17345
12 14497 7541 3699 25737
13 13270 7772 3418 24460
14 9761 19427 6124 35312
15 28419 11275 39694
16 20908 17918 38826
17 11800 16108 27908
18 6572 13140 16884 36596
19 17529 19430 36959
20 21309 15911 8185 45405
Total 223364 222500 150953 596817
% of votes 38.3 37.1 24.6 100.0
Additional Tier Seats 8 7 5 20
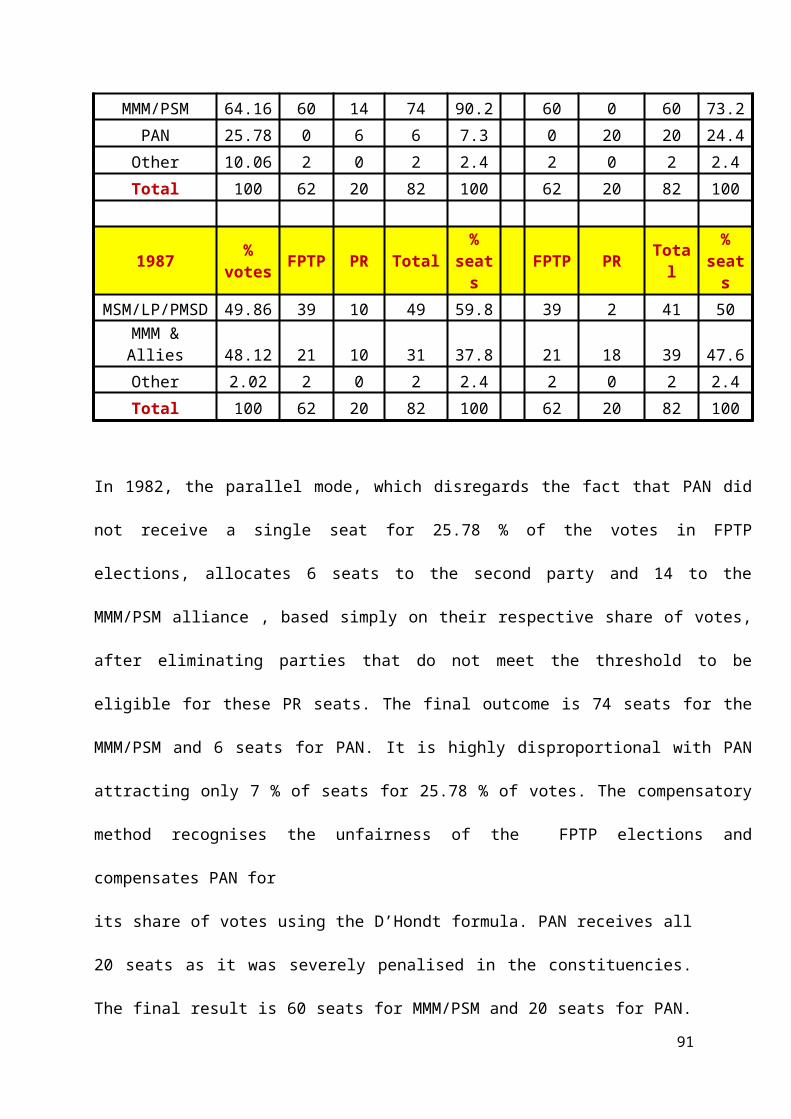
Appendix 4: Apportionment of 20 additional UVE seats in 1982
102
1982 Votes of unreturned candidates
Constituency PAN MMM/PSM Total
1 10453 10453
2 12806 12806
3 2069 2069
4 19820 19820
5 26420 26420
6 22107 22107
7 13046 13046
8 15778 15778
9 26128 26128
10 22184 22184
11 16782 16782
12 15667 15667
13 14875 14875
14 27252 27252
15 27251 27251
16 21541 21541
17 16082 16082
18 17780 17780
19 16118 16118
20 19360 19360
Total 363519 0 363519
% of votes 100.0 0.0 100.0
Additional Tier Seats 20 0 20
Appendix 5 : Apportionment of 20 additional UVE seats in 1983
1983 Votes of unreturned candidates
Constituency MSM/LP/PMSD MMM Total
1 25253 25253
2 18578 18578
3 4929 4929
4 32861 32861
5 31859 31859
6 28461 28461
7 17828 17828
8 28133 28133
9 31897 31897
10 31821 31821
11 21679 21679
12 25550 25550
13 27969 27969
14 38662 38662
15 28263 14207 42470
16 35145 35145
17 29206 29206
18 31910 31910
19 31341 31341
20 27422 14247 41669
Total 168647 408574 577221
% of votes 29.2 70.8 100.0
Additional Tier Seats 6 14 20
Appendix 6 : Apportionment of 20 additional UVE seats in 1991
103

1991 Votes of unreturned candidates
Constituency LP/PMSD MSM/MMM Total
1 20909 20909
2 18527 18527
3 8565 8565
4 30272 30272
5 29608 15012 44620
6 41904 41904
7 37102 37102
8 32651 32651
9 36536 36536
10 36659 36659
11 23793 11961 35754
12 21945 11220 33165
13 29864 29864
14 40512 40512
15 41750 41750
16 41040 41040
17 37840 37840
18 40864 40864
19 24403 24403
20 32947 32947
Total 627691 38193 665884
% of votes 94.4 5.6 100
Additional Tier Seats 19 1 20
Appendix 7: Apportionment of 20 additional UVE seats in 1995
104

105
1995 Votes of unreturned candidates
Constituency LP/MMM MSM/RMM Total
1 7354 7354
2 8246 8263
3 2710 2710
4 16209 16209
5 17859 17859
6 13853 13853
7 29251 29251
8 24375 24375
9 29168 29168
10 16867 16867
11 20852 20852
12 13677 13677
13 14968 14968
14 22294 22294
15 23580 23580
16 18355 18355
17 11896 11896
18 19020 19020
19 7145 7145
20 14013 14013
Total 0 331709 331709
% of votes 0 100 100
Additional Tier Seats 0 20 20
Appendix 8: Apportionment of 20 additional UVE seats in 2000
2000 Votes of unreturned candidates
Constituency LP/PMSD MMM/MSM Total
1 30371 30371
2 12590 6936 19526
3 10417 5182 15599
4 33566 33566
5 30876 16001 46877
6 25654 13922 39576
7 22177 14444 36621
8 33382 33382
9 39117 39117
10 29255 29255
11 23140 13783 36923
12 30846 30846
13 27223 27223
14 47766 47766
15 36945 36945
16 33441 33441
17 34825 34825
18 36794 36794
19 21737 21737
20 31230 31230
Total 591352 70268 661620
% of votes 89.4 10.6 100
Additional Tier Seats 18 2 20
Appendix 9: Apportionment of 20 additional UVE seats in 2005
106
107
2005 Votes of unreturned candidates
Constituency LP/PMSD MMM/MSM Total
1 34876 34876
2 21467 21467
3 6155 12400 18555
4 28319 14258 42577
5 45049 45049
6 41959 41959
7 30098 30098
8 14623 29070 43693
9 42520 42520
10 16321 29199 45520
11 39996 39996
12 27575 27575
13 32208 32208
14 39254 20049 59303
15 18450 35194 53644
16 30240 14858 45098
17 37598 37598
18 41949 41949
19 31801 31801
20 33660 33660
Total 291297 477849 769146
% of votes 37.9 62.1 100
Additional Tier Seats 8 12 20
Appendix 10: Apportionment of 20 additional UVE seats in 2010
2010 Votes of unreturned candidates
Constituency LP/MSM/PMSD MMM Total
1 34464 34464
2 7709 14057 21766
3 11119 11804 22923
4 14544 29383 43927
5 48225 48225
6 38145 38145
7 32998 32998
8 42782 42782
9 37383 37383
10 44978 44978
11 31818 31818
12 31867 31867
13 35110 35110
14 21630 40802 62432
15 53090 53090
16 16278 31422 47700
17 42592 42592
18 14662 28644 43306
19 32639 32639
20 36979 36979
Total 232616 552508 785124
% of votes 29.6 70.4 100.0
Additional Tier Seats 6 14 20
Selected Bibliography
108
Ahnee R (2001) : Report on proposed decentralised system of Government for Rodrigues
Anckar C : Effects of Electoral Systems: A study of 80 countries.
Banwell (1966) : Report of the Commission on the Electoral system for Mauritius.
Benoit K &
Shepsle K.A : Electoral systems and minority representation.
Bird K : The Political Representation of Women and Ethnic Minorities in established democracies
Blais A : Criteria for assessing electoral systems
Bogdanor V &
Butler D : Democracy and Elections: Electoral Systems and their political
Consequences
Bowler S &
Farrell D : ‘So Which Electoral System Is Best? Let's Ask the Anoraks’.
Cannon D : Race, redistricting and representation: the unintended consequences of black majority districts
Carcassonne
& al : Report to the PM on Electoral Reform (Dec 2011)
Carroll S : The impact of women in public office
Collendavelloo I
(2004) : Report of Select Committee on introduction of a measure of PR in our electoral system
Dahlerup D : From a small to a large minority: Women in Scandinavian Politics.
David M & Dinan P (1999) : Réforme Electorale a Maurice
De Smith S.A (1964) : Report of the Constitutional Commissioner
De Ville J &Steytler N : Choosing an electoral system
De Ville J : Proportional Representation in multi-member constituencies
Dunleavy P &
109
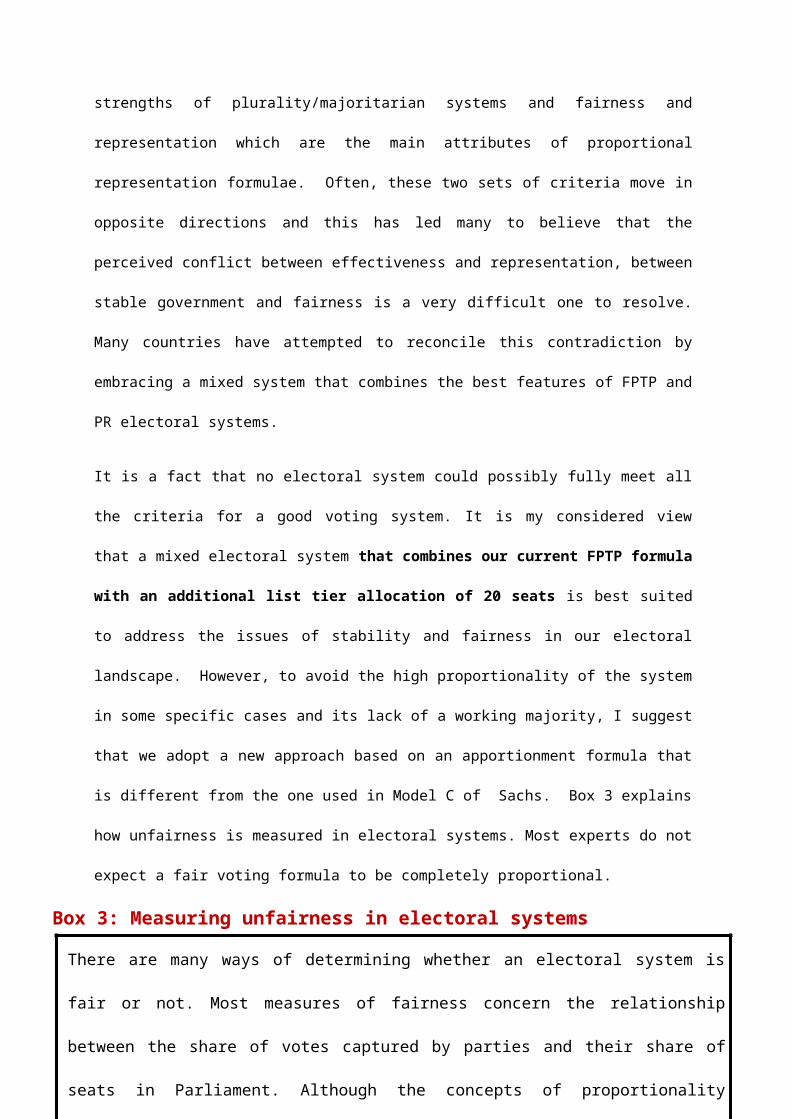
Margetts H : Understanding the Dynamics of Electoral Reform.
Electoral Task Team Round table : Electoral Models for South Africa
Elklit J : What could a new South African electoral system look like?
Elklit J : Lesotho 2002: Africa's first MMP elections.
Farrell D : Comparing electoral systems
Farrell D &Gallagher M : Submission to the Independent Commission on the Voting System.
Faure M & Venter A : Electoral systems and accountability
Fick G : The Constitution and the electoral system in South Africa
Fraenkel J : Disunity through Diversity? The contours of Fiji's post-putsch elections
Fraenkel J &B Grofman : Evaluating the impact of electoral reform on inter-ethnic
accommodation
Gallagher M : Proportionality, disproportionality and electoral systems
Gallagher M : Comparing Proportional Representation electoral systems: quotas, threshold, paradoxes and majorities
Gallagher M : The political impact of electoral system change in Japan and New Zealand
Gallagher M &Mitchell P : The Politics of Electoral Systems.
Guinier Lani : The tyranny of the majority: fundamental fairness in representative democracy
Hartmann C : The Strengths and Weaknesses of existing electoral models as instruments for mitigating ethnic conflicts.
Horowitz D : Democracy in Divided Societies
Horowitz D : Encouraging electoral accommodation in divided societies
IDEA : Electoral System Design. The International IDEA Handbook
110

IDEA : Women in Politics: Beyond the Numbers.
IPU : Women in Politics
Ishiyama John : Electoral rules and party nomination strategies in ethnically leaved societies
Jenkins Lord : The Report of the Independent Commission on the UK voting system
Johnson N : Electoral Reform: The Risks of Unintended Consequences
Lal Brij.V : Electoral Systems in Divided Societies
LeDuc L, Niemi R.G, Norris P : Voting in democracies: a study of majority and PR systems.
Lennox Boyd A (1958) : Despatch of Secretary of State to Sir Malcolm Trustram Eve.
Lennox Boyd A (1958) : Despatch of Secretary of State to the Governor of Mauritius.
Lijphart A : Democracy in Plural Societies: A Comparative Exploration.
Lijphart A : Degrees of Proportionality of Proportional Representation Formula
Lijphart A : Electoral systems, Party systems and conflict management in segmented societies.
Lijphart A : Constitutional choices for new democracies
Lijphart A & Grofman Bernard (1986) : Electoral Laws and Their Political consequences
Lijphart A & Grofman Bernard : Choosing an Electoral System: Issues and Alternatives
Lodge T : Which Criteria Are More Important in Choosing an Electoral System in the Post-1999 South Africa
London Agreement (1956) : Text of the London Agreement. Conference of the Constitution of
Mauritius.
111
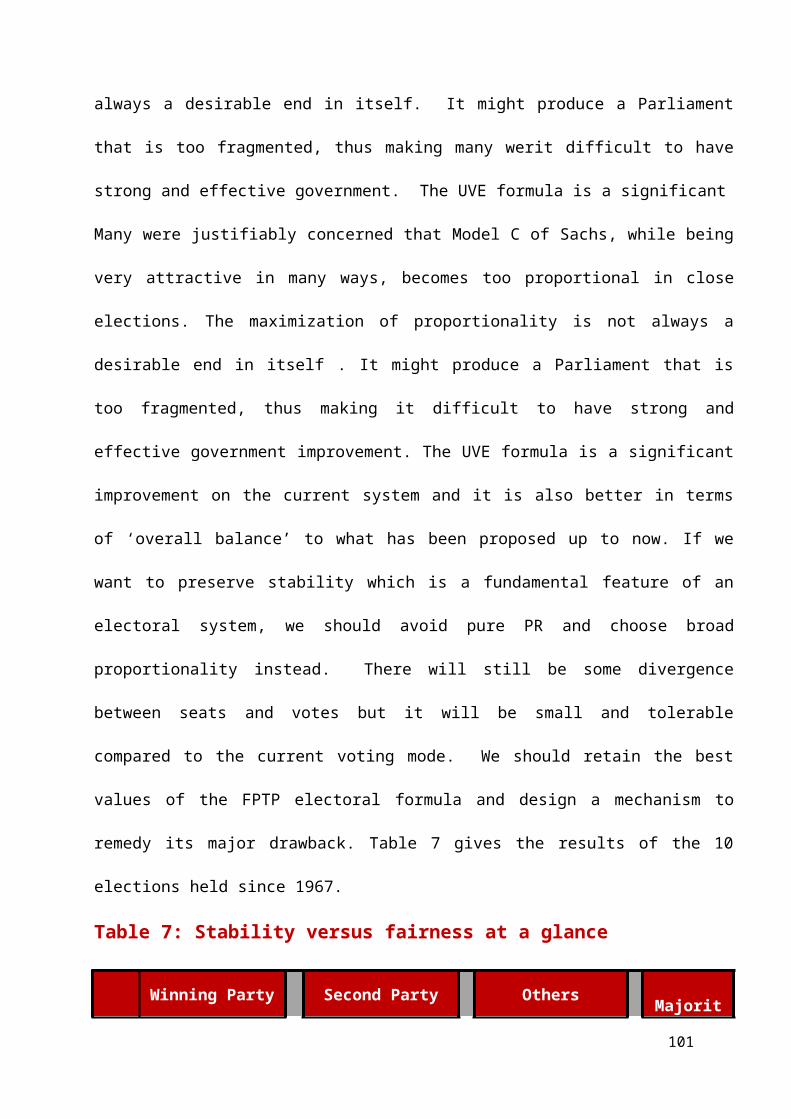
Lovenuski J : Women and Politics: minority representation or critical mass?
Lovenduski J & Norris P : Gender and Party Politics.
Lublin D : The Paradox of Representation: Racial Gerrymandering and Minority interests
Mansbridge J : ‘Should Blacks represent blacks and Women represent Women?
Matland R.E : Enhancing Women's political participation: legislative recruitment and electoral systems.
Matlosa K : Ballots or Bullets: Elections and conflict management in Southern Africa
Mathur H : Parliament in Mauritius
Meade J.E & al (1961) : The economics and social structure of Mauritius
Nohlen D : Changes and Choices in Electoral Systems
Nohlen D : Elections and Electoral Systems
Northern Ireland Forum : Committee on Electoral Reform in Northern Ireland.
Norris P : The politics of electoral reform
Norris P : Choosing electoral systems: proportional, majoritarian and mixed systems
Norris P : ‘Ballots Not Bullets: Testing Consociational Theories of Ethnic Conflict,
Norris &Lovenduski : Political Recruitment: ‘Gender, Race and class in the British
Parliament.
Norton P : The Case for First-Past-The-Post
Phillips A : The Politics of Presence
Pinto-Duschinsky M : ‘Send the Rascals Packing: Defects of Proportional Representation and the Virtues of the Westminister Model’
Pitkin Hanna : The Concept of Representation
112
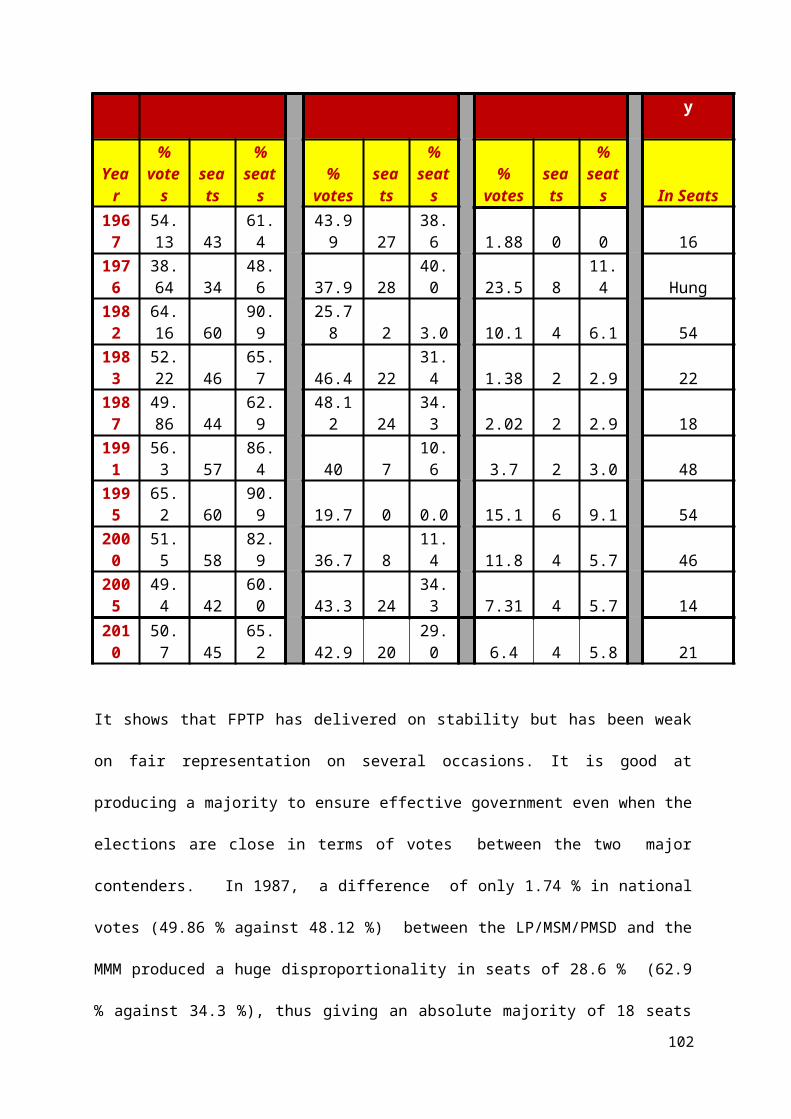
Plant R : Criteria for electoral systems: The Labour Party and Electoral Reform'.
Rae Douglas : The Political Consequences of Electoral Laws
Reilly B : Electoral systems choice in Post 1999 South Africa: an alternative model.
Reilly B : Democracy in Divided Societies: Electoral Engineering for Conflict Management
Reilly B &Reynolds A : Electoral Systems and Conflict Management in Divided societies
Reynolds A &Grofman B : Choosing an electoral system for the new South Africa: the main
proposals'.
Reynolds A & Sisk T : Electoral systems and Conflict Management in Africa
Rule Wilma : Why women don't run. The critical contextual factors in Women's legislative recruitment
Rule W &Zimmerman J : Electoral systems in comparative perspective: their impact on
women and minorities
Sachs Commission (2002) : Report on Constitutional and Electoral Reform.
Saggar S : Race and Political Representation Reconsidered
Shugart MS : Electoral Efficiency' and the Move to Mixed -Member Systems
Shugart MS &Wattenberg MP : Mixed Member Electoral Systems: The Best of Both Worlds?
Sithanen R : Evaluating and proposing electoral systems for plural societies: the case of Mauritius. PhD thesis
Sithanen R : Submission to the Commission on Constitutional and Electoral Reform ( 2001)
Sithanen R : A proposal for electoral reform (2001)
Sithanen R : Submission to the Select Committee on Electoral Reforms (2002)
Sithanen R : Which form of mixed system is best for Mauritius (2002)
113

Sithanen R : A pathway for stable government, fairness and rainbow representation (2002)
Sithanen R : A critical appraisal of the Select Committee report on Electoral Reforms in Mauritius (2004)
Sithanen R : Why simplicity breeds perversion and imperils social harmony (2004)
Sithanen R : Coalition politics under the tropics: A case study of Mauritius
Sithanen R : Avoiding instability and communal risks in a mixed electoral system (2004)
Sisk T : Choosing an Electoral System: South Africa seeks new ground rules
Stonehouse J (1966) : Report in Sessional Paper, No. 3.
Subramanian A & Roy D : Who can explain the Mauritian miracle: Meade, Romer, Sachs or
Rodrick?
Swain C : Black Faces, Black Interests: The Representation of African Americans in Congress
Taagepera R : Designing electoral rules and waiting for an electoral system to evolve.
Taagepera R : How Electoral Systems Matter for Democratisation
Taagepera R : The Tailor of Marraketh: Western Electoral Systems Advice to Emerging Democracies
Taagepera R &Shugart M S : Seats and Votes: The Effects and Determinants of electoral systemsTate K : The political representation of blacks in Congress: Does Race Matter?
Tate K : Black Faces in the Mirror: African Americans and their representation in the US congress.
Trustram Eve M (1958) : Report of the Mauritius Electoral Boundary Commission.
Whitby K : The Colour of Representation: Congressional Behaviour and Black Constituents
List of persons and organizations met
114

Dr Navin Ramgoolam, Prime Minister and Leader of the Labour Party
Paul Berenger, Leader of the Opposition and Leader of the MMM
Dr Rashid Beebeejaun, Deputy Prime Minister and Deputy Leader of the Labour Party
Xavier Luc Duval, Vice Prime Minister and Leader of the PMSD
Kailash Purryag, Speaker of the National Assembly
Pravind Jugnauth, MP and Leader of the MSM. Former Deputy Prime Minister
Cassam Uteem, Former President of the Republic
Alan Ganoo, MP and Deputy Leader of the MMM
Abu Kasenally, MP and Minster of Land and Housing
Cader Sayed- Hossen, MP and Minister of Commerce and Industry
Bernard Sik Yuen, Chief Justice
Rajsoomer Lallah, Former Chief Justice
Sir Victor Glover, Former Chief Justice
Robert Ahnee, Former Judge. Member of Sachs Commission on Electoral Reform
Sir Hamid Moollan, QC, Lawyer
Eddy Balancy, Judge of the Supreme Court
Irfan Rahman, Electoral Commissioner
Nando Bodha, MP and member of the MSM. Former Minister of Tourism
Shakeel Mohamed, MP and Minister of Labour and Industrial Relations
Leela Devi Dookhun-Luchoomun, MP and member of the MSM. Former Minister
Showkatally Soodhun, MP and member of the MSM. Former Minister
Steeve Obeegadoo, MP and Secretary General of MMM ( discussions over phone )
Cabinet of Ministers: meeting with Cabinet Ministers
Geoffrey Cox, MP of the Conservative Party, United Kingdom. Lawyer
Lindsey Collen, member of Lalit
Rajni Lallah, member of Lalit
Dr Jocelyn Chan Low, Associate Professor of History, University of Mauritius
115
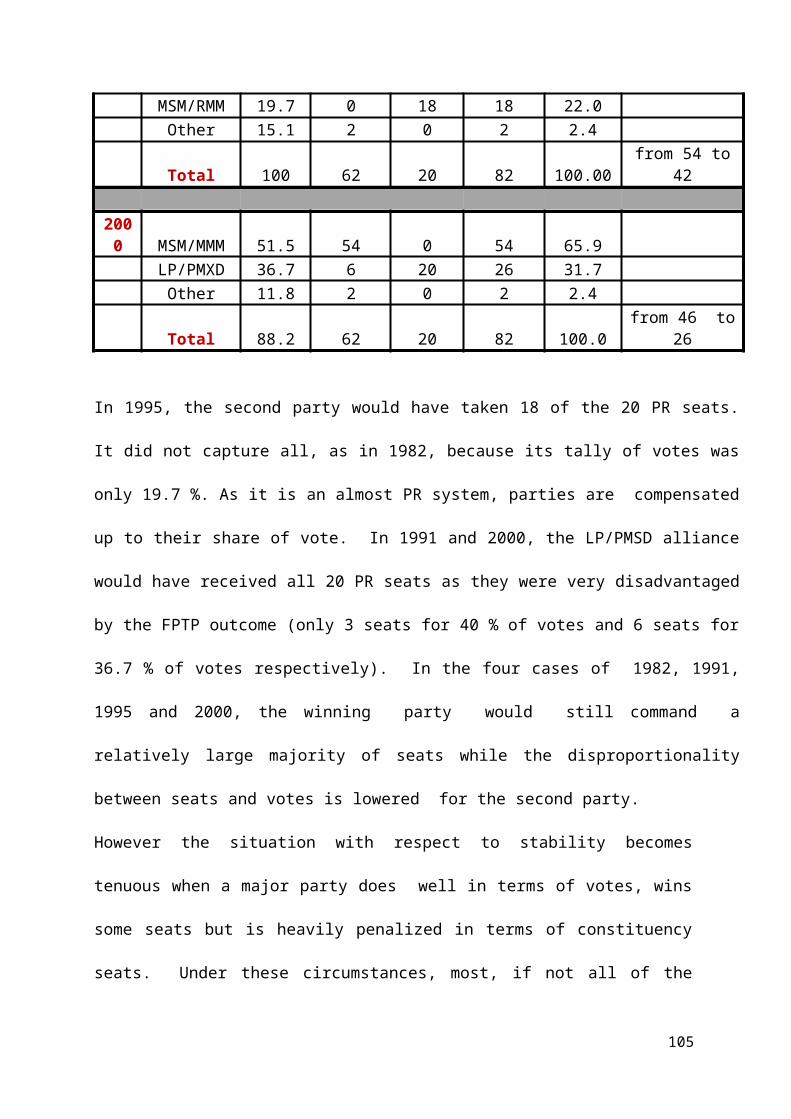
Dr Mamade Khodabaccus, Mayor of Port Louis. Member of the PMSD
Nanda Kisnen, Lawyer. Member of the PMSD
Ashok Subron, Member of Reziztans and Alternative (discussion over the phone)
Dr Singfat Chu, Associate Professor of Business Analytis,National University of Singapore (discussion over the phone and by mail)
Jean Claude de L’Estrac, Journalist, writer and historian. Former Minister
Yousouf Mohamed, Lawyer and Former Minster
Lindsay Riviere, Chairman, Le Sentinelle
Raouf Bundhun, Former Minister and Former Vice-President of the Republic
Serge Clair, Leader, OPR ( discussion over phone)
Nicholas Von Mally, Leader MR and Minister of Rodrigues (discussion over phone)
Pierre Dinan, Economist and author of a report on Electoral system in Mauritius
Women’s wing of the Labour Party
Women’s wing of the MSM
Women’s wing of the PMSD
Loga Virahsawmy, Director Gender Links
Jane Valls, Women in Politics and Women in Networking
Dr Ameenah Sorefan, Vice President,Media Watch
Bruno Woomed, Women in Politics and Women in Networking
Celh Meeah, MP and leader of FSM
Many individuals have phoned me to express their views on electoral reforms.
Some people have also sent proposals (by post and by e-mail) on electoral reforms and these have been considered.
116