for 2007-08 to 2015-16 - karnatakafinance.kar.nic.in/stats/2007 to 2015-10 years doc final to...
TRANSCRIPT

GOVERNMENT OF KARNATAKA
ACCOUNTS RECKONER
FOR
2007-08 to 2015-16
FINANCE DEPARTMENT Computer Cell January 2016

Statement No. Details Page No.
I Budget at a Glance 01-02II Summarised Financial Position of Government of Karnataka as on 31st March 03-05III Sources & Applications of Funds 06IV Summary of State Transactions 07-10V Tax Revenue, Non-Tax Revenue, Public Debt & Consolidated Fund for the State 11-13VI Revenue Receipts, Revenue Expenditure & Revenue Surplus/Deficit 14-15VII Arrears of Revenue 16VIII Analysis of Consolidated Fund 17-26IX Object Head-wise Revenue Expenditure 27-37X Major Head-wise Plan/Non-Plan Expenditure 38-55XI Summary of Appropriation Accounts & Control over Expenditure 56-57XII Progressive Capital Expenditure in the form of Equity & Capital Assistance at the end of 31st March 58-68XIII State Resources for Plan Expenditure 69XIV Sectoral Outlays on State Plan Schemes 70-75XV Outlay on Centrally Sponsored Schemes 76-80XVI Outlay on Central Plan Schemes 81-84XVII Major Head-wise Expenditure under State Plan Schemes 85-91XVIII Major Head-wise Expenditure under Centrally Sponsored Schemes 92-94XIX Major Head-wise Expenditure under Central Plan Schemes 95-96XX Public Debt & Liabilities as on 31st March 97XXI Contingent Liabilities for Guarantees given by the Government 98XXII Loans & Advances by the State Government 99XXIII Group-wise details of Sanctioned Strength 100-101XXIV Expenditure on Salaries 102-103XXV No. of Pensioners & Expenditure thereon 104XXVI Ways & Means Advances and Overdraft 105XXVII Misappropriations, Defalcations etc. 106XXVIII Developmental and Non-Developmental Expenditure 107-109
CONTENTS

N O T E
“Accounts Reckoner” provides a broad overview of the Governmental Activities, as reflected in the Finance & Appropriation Accounts and Audit Reports for the period 2007-08 to 2015-16.
The Reckoner contains 28 Statements of vital importance in accounts and has information under broad
categories of financial position of the State, Receipts, Revenue Expenditure, Sectoral Expenditure, Capital Expenditure, Investments, Debt, Staff Strength and Salaries, etc. The Reckoner will be useful for Officers of Finance Department in various meetings, preparing replies to questions raised by the Members of Legislative Assembly and Legislative Council and also for preparation of Budget Estimates.
Besides, the Reckoner has information on investments made on Progressive Capital Expenditure in the
form of Equity / Capital Assistance as the end of 31st March. The Computer Cell of Finance Department has compiled the Reckoner. It is earnestly hoped that the
Reckoner will serve as a good source of information for Finance and other user Departments. Suggestions for improvement are most welcome.
January 2016 Bangalore
SINDHU B
Special Officer Budget Finance Department

STATEMENT - IBudget At A Glance (Rs. in Crores)
2007-08 2008-09 2009-10 2010-11 2011-12 2012-13 2013-14 2014-15 2014-15 2015-16ItemSl.No RE BEBE
A
B
Opening BalanceREVENUE ACCOUNTI. RECEIPTS State Taxes Share of Central Taxes Grants from Central Govt. Non Tax RevenueTOTAL (A-I)II. EXPENDITURE Social Services Economice Services. General Services. GIA & Contribution.TOTAL (A-II)Revenue Account Surplus/Deficit.CAPITAL ACCOUNTI. RECEIPTS Loans from Govt. of India Open Market Loans (net) Loans from LIC, RBI, GIC, NABARD &NCI Loans from NSSF Recoveries of Loans & Advances Public Account (net) etc., Contingency Fund (net)TOTAL (B-I)I. DISBURSEMENTS: Capital Outlay (net) Repayment of Central Loans Repayment of Loans to LIC, RBI, GIC & NCDC etc.,
231.88
25986.65 6779.34 5027.49 3357.66
41151.14
13123.67 11453.31 10871.78
1926.00 37374.77
3776.37
806.00 287.48 334.29
388.27 52.07
4148.30 13.28
6029.69
8403.16 448.56 339.57
89.90
27645.55 7153.88 5332.26 3158.99
43290.68
15872.99 11136.64 12275.57
2374.09 41659.29
1631.38
596.16 6583.41
465.39
113.73 56.65
1471.94-2.10
9285.18
9689.15 461.43 483.00
-358.45
30578.60 7359.98 7883.32 3333.80
49155.70
19118.86 13181.71 12762.34
2474.01 47536.92
1618.78
680.85 4953.83
648.59
661.47 555.36
5440.48 2.10
12942.67
12066.89 470.46 791.75
-107.68
38473.12 9506.31 6868.51 3358.28
58206.23
22107.82 14892.44 14055.10
2978.49 54033.84
4172.39
1503.52 1037.25
744.45
2465.77 161.38
6244.00-12.53
12143.83
13283.36 890.96 953.41
-657.13
46475.96 11075.04
8168.41 4086.86
69806.27
25171.74 19153.90 16445.48
4343.96 65115.07
4691.20
1267.06 6207.50
590.89
0.00 240.40
6910.48 12.02
15228.34
15416.47 800.20
1227.18
3.01
53753.56 12647.14
7809.42 3966.11
78176.22
30419.80 21674.19 20180.84
4018.42 76293.26
1882.97
1348.98 9148.69
899.33
456.29 157.61
4834.06 0.51
16845.47
15445.43 696.53
1419.16
67.95
62603.53 13808.28
9098.82 4031.89
89542.53
32621.89 26592.83 24954.41
5020.44 89189.57
352.96
1154.56 13406.30
485.88
649.07 109.28
3640.41 0.00
19445.50
16858.92 694.27
1531.57
77.77
69869.75 16560.01 20135.43
4473.43 111038.62
42116.77 32398.78 29570.19
6671.60 110757.34
281.28
1729.93 16733.71
1170.33
1000.00 92.73
1733.02 0.00
22459.72
19938.79 774.43
1577.72
86.22
68554.09 15410.00 20478.32
4465.33 108907.74
42997.10 31192.49 27690.36
6867.68 108747.63
160.11
1337.53 16733.71
750.00
1000.00 60.45
1733.02 0.00
21614.71
18805.06 723.34
1625.96
256.51
76445.40 24789.78
9918.97 5206.17
116360.32
45728.41 32175.31 30997.04
6548.92 115449.68
910.64
1724.93 17101.54
850.00
0.00 91.21
2667.20 0.00
22434.88
20488.62 776.12
1738.32
FDCC Page 1 of 109 Accounts Reckoner 2007-08 to 2015-16 BE
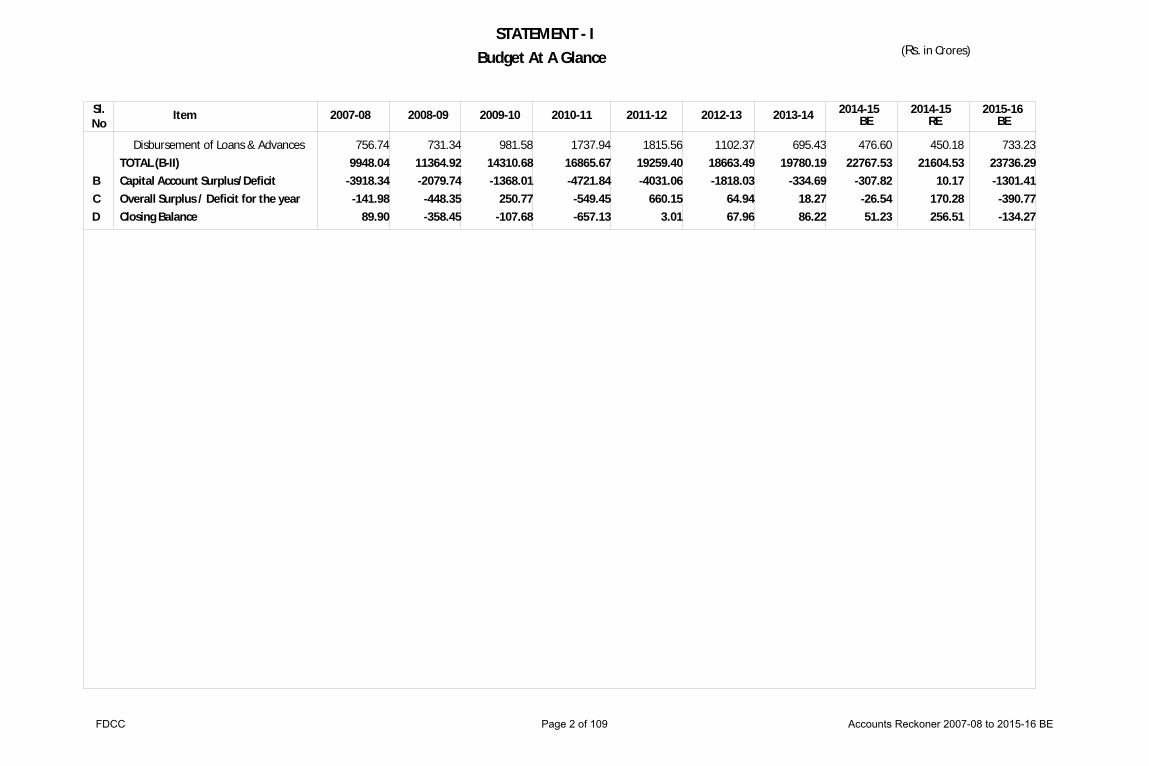
STATEMENT - IBudget At A Glance (Rs. in Crores)
2007-08 2008-09 2009-10 2010-11 2011-12 2012-13 2013-14 2014-15 2014-15 2015-16ItemSl.No RE BEBE
BCD
Disbursement of Loans & AdvancesTOTAL (B-II)Capital Account Surplus/Deficit Overall Surplus / Deficit for the yearClosing Balance
756.74 9948.04-3918.34
-141.98 89.90
731.34 11364.92-2079.74
-448.35-358.45
981.58 14310.68-1368.01
250.77-107.68
1737.94 16865.67-4721.84
-549.45-657.13
1815.56 19259.40-4031.06
660.15 3.01
1102.37 18663.49-1818.03
64.94 67.96
695.43 19780.19
-334.69 18.27 86.22
476.60 22767.53
-307.82-26.54 51.23
450.18 21604.53
10.17 170.28 256.51
733.23 23736.29-1301.41
-390.77-134.27
FDCC Page 2 of 109 Accounts Reckoner 2007-08 to 2015-16 BE

STATEMENT - II
(Rs.in Crores)
Summarised Financial Postion of Government of Karnataka as on 31st March
2005 2006 2007 2008 2010 2011 2012 2013 20142009
LIABILITIES
A. Internal Debt
a) Market Loans bearing interest
b) Market loans not bearing interest
c) Loans from other institutions
TOTAL (A)
B. LOANS & ADVANCES FROM CENTRALGOVT. a) Pre 1984-85 Loans
b) Non-Plan Loans
c) Loans for State Plan Schemes
d) Loans for Central Plan Schemes
e) Loans for Centrally Sponsored Schemes
f) Ways & Means Advances
TOTAL (B)
LIABILITIES
C. CONTINGENCY FUND
D. SMALL SAVINS, PROVIDENT FUND ETC.,
E. DEPOSITS.
F. RESERVE FUNDS
G. SUSPENSE & MISC. BALANCES.
H. SURPLUS ON GOVT. ACCOUNTS
a) Surplus at the end of the year ended 31stMarch (*)
I. (a) Shortfall with RB Deposits.
(b) Remittances in Transit.
11762.00
7.49
14395.69
26165.18
50.19
482.62
8290.62
43.94
163.69
0.00
9031.06
41.09
6469.68
2826.94
2468.54
1020.11
0.00
0.00
0.69
11933.46
1.54
18831.71
30766.71
0.07
118.41
8960.12
40.23
163.39
0.00
9282.22
80.00
7125.55
2941.83
2464.73
1468.46
0.00
4.15
0.00
11700.41
2.05
20943.40
32645.86
0.07
112.36
8886.85
36.53
163.83
0.00
9199.64
66.72
7784.93
4264.87
4130.07
1658.30
0.00
0.00
517.65
11988.42
1.52
21326.39
33316.33
0.07
105.63
9250.82
32.84
167.72
0.00
9557.08
80.00
8533.31
4199.29
4879.61
3056.25
0.00
0.00
0.00
18571.99
1.36
21422.51
39995.86
0.07
98.92
9407.29
29.16
156.37
0.00
9691.81
77.90
9709.55
5752.41
7053.46
3957.65
0.00
0.00
0.00
23525.76
1.42
21940.82
45468.00
0.07
92.62
9639.38
25.48
144.65
0.00
9902.20
80.00
11177.06
7660.97
10254.03
4495.66
0.00
0.00
0.00
24562.97
1.45
24197.63
48762.05
0.07
86.37
10274.20
21.82
132.30
0.00
10514.76
67.47
12784.10
11628.06
9698.19
4144.34
0.00
0.00
0.00
30770.35
1.57
23561.33
54333.25
0.07
80.16
10933.57
-7.31
-24.87
0.00
10981.62
79.49
14181.71
11106.37
14389.21
6723.64
0.00
0.00
0.00
39919.86
0.75
23497.79
63418.40
0.07
74.00
11586.14
-1.26
-24.87
0.00
11634.08
80.00
15913.80
15750.87
13616.75
6821.67
0.00
0.00
0.00
53326.21
0.70
23101.17
76428.08
0.07
67.94
12050.01
-5.40
-18.25
0.00
12094.37
80.00
18020.87
15885.30
16456.87
9492.78
0.00
0.00
0.00
FDCC Page 3 of 109 Accounts Reckoner 2007-08 to 2015-16 BE
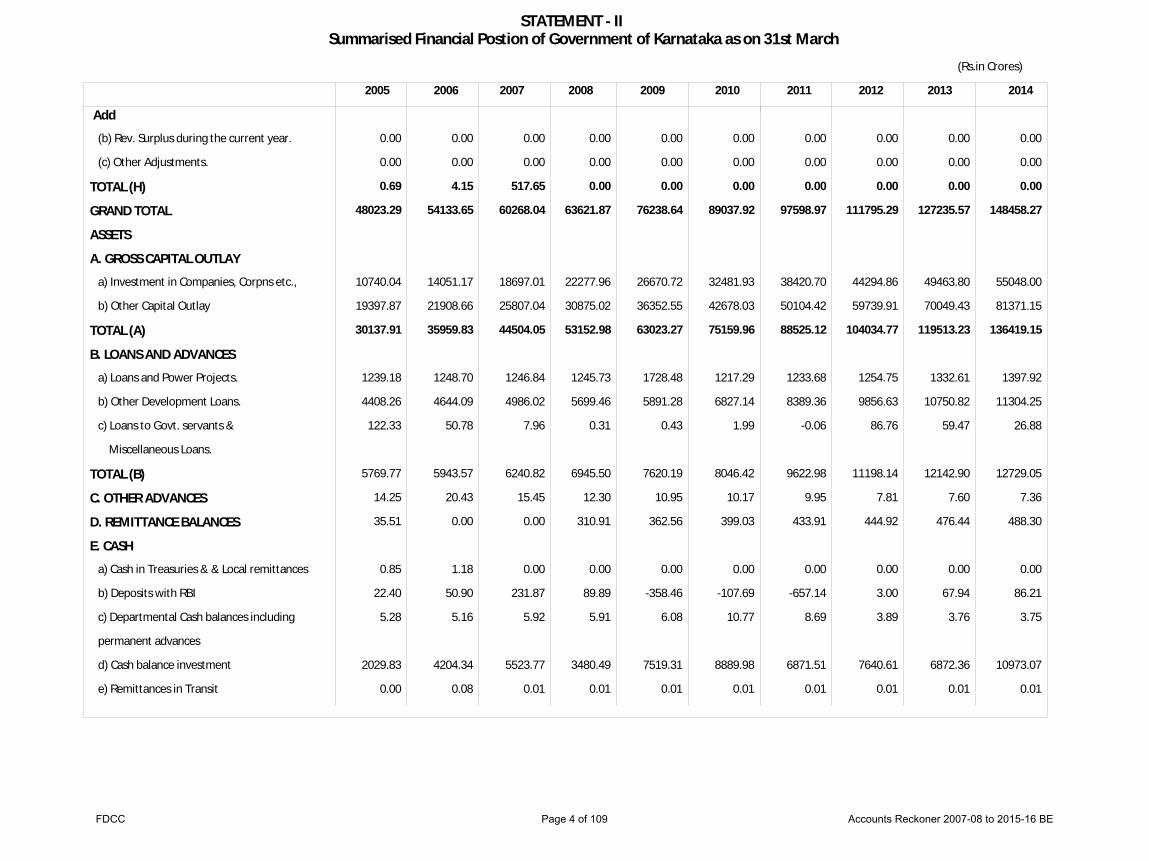
STATEMENT - II
(Rs.in Crores)
Summarised Financial Postion of Government of Karnataka as on 31st March
2005 2006 2007 2008 2010 2011 2012 2013 20142009
Add
(b) Rev. Surplus during the current year.
(c) Other Adjustments.
TOTAL (H)
GRAND TOTAL
ASSETS
A. GROSS CAPITAL OUTLAY
a) Investment in Companies, Corpns etc.,
b) Other Capital Outlay
TOTAL (A)
B. LOANS AND ADVANCES
a) Loans and Power Projects.
b) Other Development Loans.
c) Loans to Govt. servants &
Miscellaneous Loans.
TOTAL (B)
C. OTHER ADVANCES
D. REMITTANCE BALANCES
E. CASH
a) Cash in Treasuries & & Local remittances
b) Deposits with RBI
c) Departmental Cash balances including
permanent advances
d) Cash balance investment
e) Remittances in Transit
0.00
0.00
0.69
48023.29
10740.04
19397.87
30137.91
1239.18
4408.26
122.33
5769.77
14.25
35.51
0.85
22.40
5.28
2029.83
0.00
0.00
0.00
4.15
54133.65
14051.17
21908.66
35959.83
1248.70
4644.09
50.78
5943.57
20.43
0.00
1.18
50.90
5.16
4204.34
0.08
0.00
0.00
517.65
60268.04
18697.01
25807.04
44504.05
1246.84
4986.02
7.96
6240.82
15.45
0.00
0.00
231.87
5.92
5523.77
0.01
0.00
0.00
0.00
63621.87
22277.96
30875.02
53152.98
1245.73
5699.46
0.31
6945.50
12.30
310.91
0.00
89.89
5.91
3480.49
0.01
0.00
0.00
0.00
76238.64
26670.72
36352.55
63023.27
1728.48
5891.28
0.43
7620.19
10.95
362.56
0.00
-358.46
6.08
7519.31
0.01
0.00
0.00
0.00
89037.92
32481.93
42678.03
75159.96
1217.29
6827.14
1.99
8046.42
10.17
399.03
0.00
-107.69
10.77
8889.98
0.01
0.00
0.00
0.00
97598.97
38420.70
50104.42
88525.12
1233.68
8389.36
-0.06
9622.98
9.95
433.91
0.00
-657.14
8.69
6871.51
0.01
0.00
0.00
0.00
111795.29
44294.86
59739.91
104034.77
1254.75
9856.63
86.76
11198.14
7.81
444.92
0.00
3.00
3.89
7640.61
0.01
0.00
0.00
0.00
127235.57
49463.80
70049.43
119513.23
1332.61
10750.82
59.47
12142.90
7.60
476.44
0.00
67.94
3.76
6872.36
0.01
0.00
0.00
0.00
148458.27
55048.00
81371.15
136419.15
1397.92
11304.25
26.88
12729.05
7.36
488.30
0.00
86.21
3.75
10973.07
0.01
FDCC Page 4 of 109 Accounts Reckoner 2007-08 to 2015-16 BE
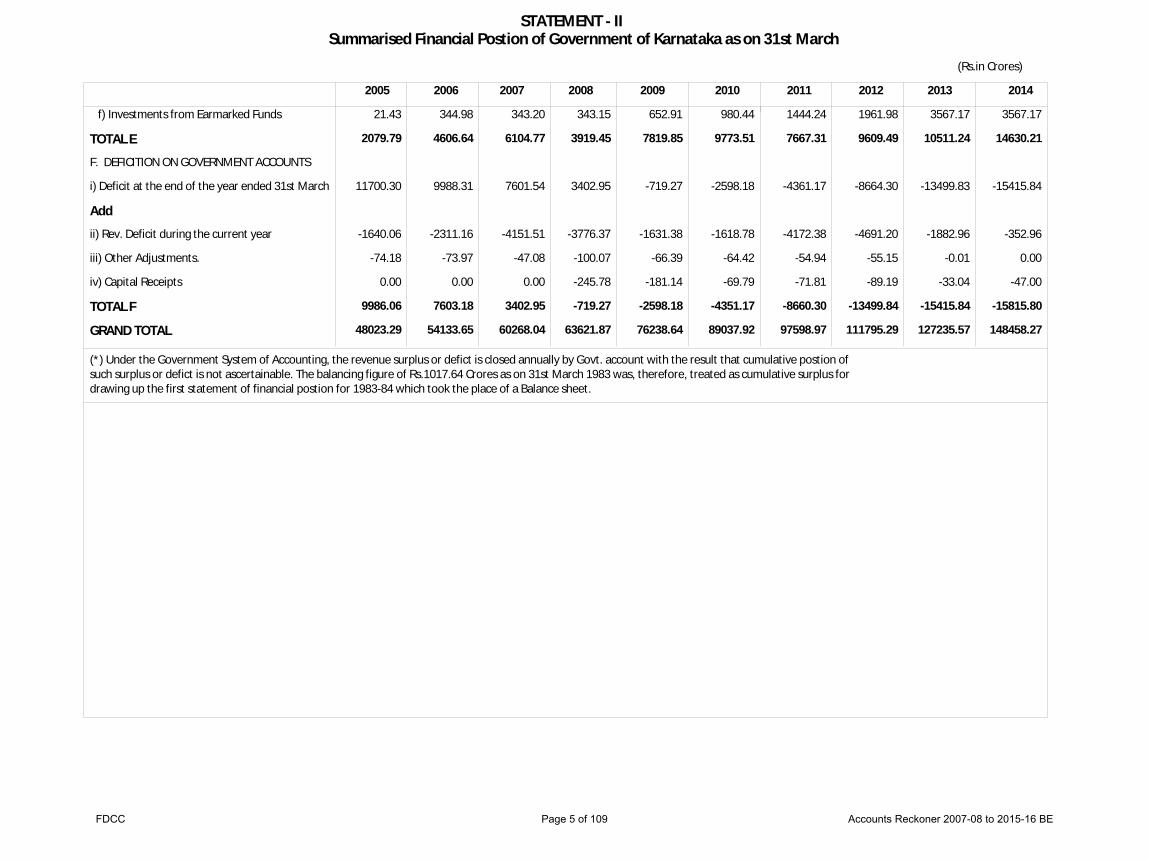
STATEMENT - II
(Rs.in Crores)
Summarised Financial Postion of Government of Karnataka as on 31st March
2005 2006 2007 2008 2010 2011 2012 2013 20142009
f) Investments from Earmarked Funds
TOTAL E
F. DEFICITION ON GOVERNMENT ACCOUNTS
i) Deficit at the end of the year ended 31st March
Add
ii) Rev. Deficit during the current year
iii) Other Adjustments.
iv) Capital Receipts
TOTAL F
GRAND TOTAL
21.43
2079.79
11700.30
-1640.06
-74.18
0.00
9986.06
48023.29
344.98
4606.64
9988.31
-2311.16
-73.97
0.00
7603.18
54133.65
343.20
6104.77
7601.54
-4151.51
-47.08
0.00
3402.95
60268.04
343.15
3919.45
3402.95
-3776.37
-100.07
-245.78
-719.27
63621.87
652.91
7819.85
-719.27
-1631.38
-66.39
-181.14
-2598.18
76238.64
980.44
9773.51
-2598.18
-1618.78
-64.42
-69.79
-4351.17
89037.92
1444.24
7667.31
-4361.17
-4172.38
-54.94
-71.81
-8660.30
97598.97
1961.98
9609.49
-8664.30
-4691.20
-55.15
-89.19
-13499.84
111795.29
3567.17
10511.24
-13499.83
-1882.96
-0.01
-33.04
-15415.84
127235.57
3567.17
14630.21
-15415.84
-352.96
0.00
-47.00
-15815.80
148458.27
(*) Under the Government System of Accounting, the revenue surplus or defict is closed annually by Govt. account with the result that cumulative postion ofsuch surplus or defict is not ascertainable. The balancing figure of Rs.1017.64 Crores as on 31st March 1983 was, therefore, treated as cumulative surplus fordrawing up the first statement of financial postion for 1983-84 which took the place of a Balance sheet.
FDCC Page 5 of 109 Accounts Reckoner 2007-08 to 2015-16 BE

STATEMENT-III
2007-08 2008-09 2009-10 2010-11 2011-12 2012-13 2013-14 2014-15 2014-15 2015-16 BERE
(Rs in Crores)Sources & Application of Funds for the years 2007-08 to 2015-16
BE
SOURCES
1. Revenue Receipts
2. Recoveries from Loans & Advances
3. Increase in Public Debt.
4. Contingency Fund.
5. Net Receipt from PublicAccount (i) Increase in Small Savings, PF etc.,
(ii) Increase in Res. Funds.
(iii) Increase/Decrease in SuspenseMisc. (iv) Effect on Remittance Balances
(v) Decrease/Increase in Deposits &Advn.Net Receipts from PublicAccount6. Misc. Capital Receipts
Total
APPLICATION
1. Revenue Expenditure
2. Lending for Development & OtherPurposes3. Capital Expenditure
4. Contingency Fund.
5. Decrease/Increase in Cash Balance(CB-OB)Total
41151.14
52.07
1027.91
13.28
748.38
749.58
3541.31
-828.56
-62.42
4148.30
245.78
46638.47
37374.77
756.74
8648.94
0.00
-141.98
46638.47
43290.68
56.65
6814.26
0.00
1176.24
1864.08
-3071.20
-51.65
1554.46
1471.94
181.14
51814.67
41659.29
731.34
9870.29
2.10
-448.35
51814.67
49155.70
555.36
5682.53
2.10
1467.51
2873.05
-772.94
-36.48
1909.34
5440.48
69.79
60905.96
47536.92
981.58
12136.68
0.00
250.77
60905.96
58206.23
161.38
3906.61
0.00
1607.05
910.23
1724.15
-34.88
2037.44
6244.00
71.81
68590.02
54033.84
1737.94
13355.17
12.53
-549.45
68590.02
69806.27
240.40
6038.07
12.53
1397.61
2243.40
1870.17
-11.01
1410.32
6910.48
89.18
83096.93
65115.07
1815.56
15505.65
0.51
660.15
83096.93
78176.22
157.61
9737.60
0.51
1732.09
-243.51
866.41
-31.53
2510.59
4834.06
33.04
92939.04
76293.26
1102.37
15478.47
0.00
64.94
92939.04
89542.53
109.28
13469.97
0.00
2107.07
134.43
-1429.58
-11.86
2840.36
3640.41
87.94
106850.13
89189.57
695.43
16946.86
0.00
18.27
106850.13
111038.62
92.73
18281.82
5.00
1925.00
-49.98
0.00
0.00
-142.00
1733.02
75.00
131226.18
110757.34
476.60
20013.79
5.00
-26.54
131226.18
108907.74
60.45
17471.94
5.00
1925.00
-49.98
0.00
0.00
-142.00
1733.02
75.00
128253.15
108747.63
450.18
18880.06
5.00
170.28
128253.15
116360.32
91.21
17162.03
5.00
2167.20
0.00
500.00
0.00
0.00
2667.20
75.00
136360.76
115449.68
733.23
20563.62
5.00
-390.77
136360.76
FDCC Page 6 of 109 Accounts Reckoner 2007-08 to 2015-16 BE
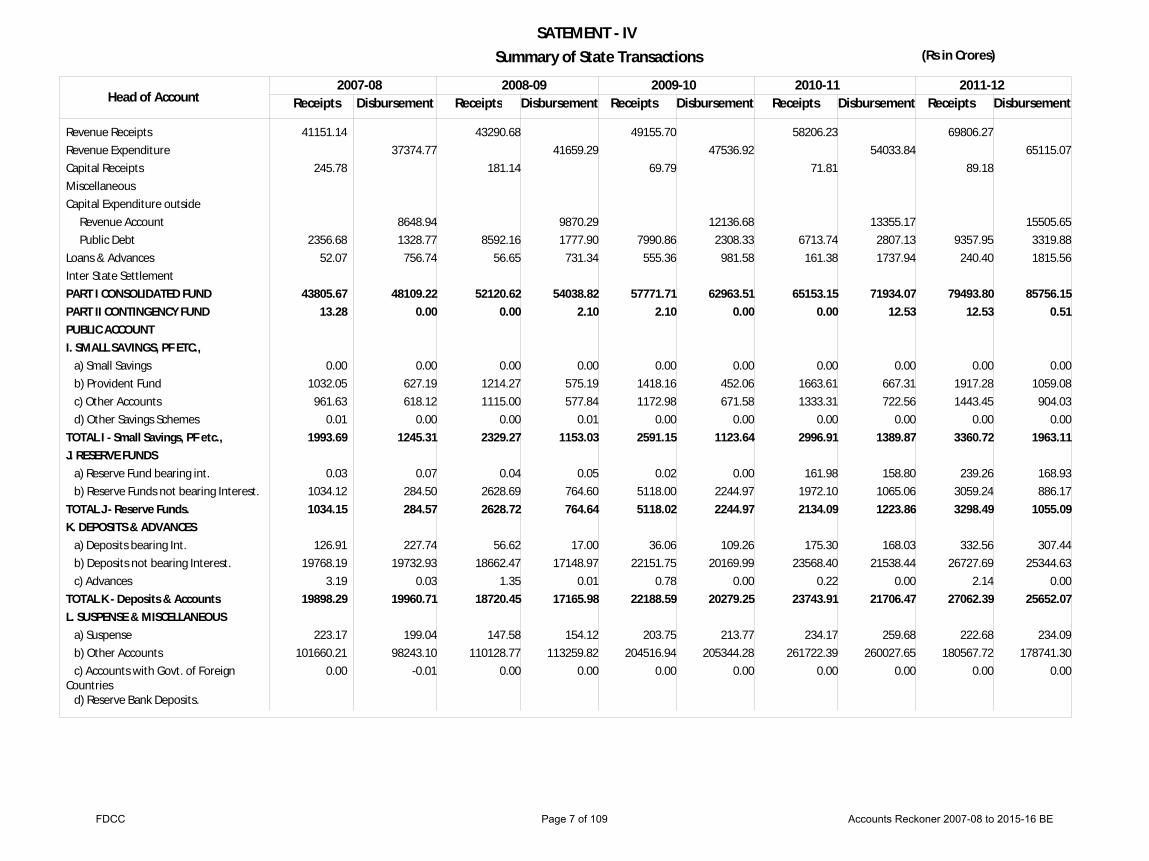
SATEMENT - IVSummary of State Transactions (Rs in Crores)
Head of Account Receipts Disbursement Receipts Disbursement Receipts Disbursement Receipts Disbursement Receipts Disbursement2007-08 2008-09 2009-10 2010-11 2011-12
Revenue ReceiptsRevenue ExpenditureCapital ReceiptsMiscellaneousCapital Expenditure outside Revenue Account Public DebtLoans & AdvancesInter State SettlementPART I CONSOLIDATED FUNDPART II CONTINGENCY FUNDPUBLIC ACCOUNTI. SMALL SAVINGS, PF ETC., a) Small Savings b) Provident Fund c) Other Accounts d) Other Savings SchemesTOTAL I - Small Savings, PF etc., J. RESERVE FUNDS a) Reserve Fund bearing int. b) Reserve Funds not bearing Interest.TOTAL J - Reserve Funds.K. DEPOSITS & ADVANCES a) Deposits bearing Int. b) Deposits not bearing Interest. c) AdvancesTOTAL K - Deposits & AccountsL. SUSPENSE & MISCELLANEOUS a) Suspense b) Other Accounts c) Accounts with Govt. of ForeignCountries d) Reserve Bank Deposits.
41151.14
245.78
2356.68 52.07
43805.67 13.28
0.00 1032.05
961.63 0.01
1993.69
0.03 1034.12 1034.15
126.91 19768.19
3.19 19898.29
223.17 101660.21
0.00
37374.77
8648.94 1328.77
756.74
48109.22 0.00
0.00 627.19 618.12
0.00 1245.31
0.07 284.50 284.57
227.74 19732.93
0.03 19960.71
199.04 98243.10
-0.01
43290.68
181.14
8592.16 56.65
52120.62 0.00
0.00 1214.27 1115.00
0.00 2329.27
0.04 2628.69 2628.72
56.62 18662.47
1.35 18720.45
147.58 110128.77
0.00
41659.29
9870.29 1777.90
731.34
54038.82 2.10
0.00 575.19 577.84
0.01 1153.03
0.05 764.60 764.64
17.00 17148.97
0.01 17165.98
154.12 113259.82
0.00
49155.70
69.79
7990.86 555.36
57771.71 2.10
0.00 1418.16 1172.98
0.00 2591.15
0.02 5118.00 5118.02
36.06 22151.75
0.78 22188.59
203.75 204516.94
0.00
47536.92
12136.68 2308.33
981.58
62963.51 0.00
0.00 452.06 671.58
0.00 1123.64
0.00 2244.97 2244.97
109.26 20169.99
0.00 20279.25
213.77 205344.28
0.00
58206.23
71.81
6713.74 161.38
65153.15 0.00
0.00 1663.61 1333.31
0.00 2996.91
161.98 1972.10 2134.09
175.30 23568.40
0.22 23743.91
234.17 261722.39
0.00
54033.84
13355.17 2807.13 1737.94
71934.07 12.53
0.00 667.31 722.56
0.00 1389.87
158.80 1065.06 1223.86
168.03 21538.44
0.00 21706.47
259.68 260027.65
0.00
69806.27
89.18
9357.95 240.40
79493.80 12.53
0.00 1917.28 1443.45
0.00 3360.72
239.26 3059.24 3298.49
332.56 26727.69
2.14 27062.39
222.68 180567.72
0.00
65115.07
15505.65 3319.88 1815.56
85756.15 0.51
0.00 1059.08
904.03 0.00
1963.11
168.93 886.17
1055.09
307.44 25344.63
0.00 25652.07
234.09 178741.30
0.00
FDCC Page 7 of 109 Accounts Reckoner 2007-08 to 2015-16 BE

SATEMENT - IVSummary of State Transactions (Rs in Crores)
Head of Account Receipts Disbursement Receipts Disbursement Receipts Disbursement Receipts Disbursement Receipts Disbursement2007-08 2008-09 2009-10 2010-11 2011-12
e) Ledger Balance Adjustment A/c. f) MiscellaneousTOTAL L - Suspense & Misc.M. REMITTANCES a) Money Orders & Other Remittances b) Inter Government Adjustments.TOTAL M - RemittancesPART III- PUBLIC ACCOUNTTotal Receipts / DisbursementsCash Balance (AFS Closing Balance)GRAND Total Receipts/Disbursements.
100.08 0.00
101983.46
2519.90-0.44
2519.47 127429.06 171248.01
231.88 171479.89
0.00 0.01
98442.15
3333.41 14.61
3348.02 123280.76 171389.99
89.90 171479.89
66.39 0.00
110342.75
1179.79 0.02
1179.81 135201.00 187321.62
89.90 187411.52
0.00 0.00
113413.94
1237.98-6.52
1231.46 133729.06 187769.97
-358.45 187411.52
64.41 0.00
204785.10
1250.57 0.48
1251.04 235933.90 293707.71
-358.45 293349.25
0.00 0.00
205558.04
1284.10 3.42
1287.52 230493.42 293456.93
-107.68 293349.25
54.97 0.00
262011.53
1474.21-0.14
1474.07 292360.52 357513.67
-107.68 357405.99
0.00 0.04
260287.38
1491.88 17.06
1508.95 286116.52 358063.12
-657.13 357405.99
55.21 0.00
180845.62
412.17-0.09
412.07 214979.29 294485.62
-657.13 293828.49
0.00 0.06
178975.45
443.25-20.17
423.08 208068.81 293825.48
3.01 293828.49
FDCC Page 8 of 109 Accounts Reckoner 2007-08 to 2015-16 BE

SATEMENT - IVSummary of State Transactions
(Rs. in Crores)
Head of Account Receipts Disbursement Receipts Disbursement Receipts Disbursement Receipts Disbursement Receipts Disbursement2012-13 2013-14 2014-15 2014-15 2015-16 BEREBE
Revenue ReceiptsRevenue ExpenditureCapital ReceiptsMiscellaneousCapital Expenditure outside Revenue Account Public DebtLoans & AdvancesInter State SettlementPART I CONSOLIDATED FUNDPART II CONTINGENCY FUNDPUBLIC ACCOUNTI. SMALL SAVINGS, PF ETC., a) Small Savings b) Provident Fund c) Other Accounts d) Other Savings SchemesTOTAL I - Small Savings, PF etc., J. RESERVE FUNDS a) Reserve Fund bearing int. b) Reserve Funds not bearing Interest.TOTAL J - Reserve Funds.K. DEPOSITS & ADVANCES a) Deposits bearing Int. b) Deposits not bearing Interest. c) AdvancesTOTAL K - Deposits & AccountsL. SUSPENSE & MISCELLANEOUS a) Suspense b) Other Accounts c) Accounts with Govt. of ForeignCountries d) Reserve Bank Deposits.
78176.22
33.04
13464.66 157.61
91831.53 0.51
2248.33 1646.16
0.00 3894.49
857.02 2802.14 3659.16
444.75 30695.90
0.21 31140.85
516.78 200053.00
0.00
76293.26
15478.47 3727.06 1102.37
96601.16 0.00
1290.12 872.28
0.00 2162.40
927.23 2975.44 3902.67
441.94 28188.33
0.00 28630.27
453.09 199250.28
0.00
89542.53
87.94
17286.81 109.28
107026.56 0.00
2557.64 1950.48
0.00 4508.12
432.03 1600.36 2032.39
621.43 33681.30
0.24 34302.98
472.94 216722.07
0.00
89189.57
16946.86 3816.84
695.43
110648.70 0.00
1370.52 1030.53
0.00 2401.06
340.58 1557.38 1897.96
611.77 30850.85
0.00 31462.62
494.96 218129.64
0.00
111038.62
75.00
25042.26 92.73
136248.61 5.00
2484.90 1815.46
0.00 4300.37
295.63 1493.52 1789.15
402.39 32992.82
2.59 33397.81
269.44 219417.56
0.00
110757.34
20013.79 6760.44
476.60
138008.16 5.00
1281.49 1093.88
0.00 2375.37
295.61 1543.52 1839.13
402.39 33134.82
2.59 33539.81
269.44 219417.56
0.00
108907.74
75.00
22229.53 60.45
131272.71 5.00
2484.90 1815.46
0.00 4300.37
295.63 1493.52 1789.15
402.39 32992.82
2.59 33397.81
269.44 219417.56
0.00
108747.63
18880.06 4757.59
450.18
132835.45 5.00
1281.49 1093.88
0.00 2375.37
295.61 1543.52 1839.13
402.39 33134.82
2.59 33539.81
269.44 219417.56
0.00
116360.32
75.00
22949.93 91.21
139476.46 5.00
2783.09 1997.01
0.00 4780.10
325.17 1642.87 1968.04
442.63 36292.11
2.85 36737.59
296.39 241859.32
0.00
115449.68
20563.62 5787.90
733.23
142534.43 5.00
1409.64 1203.26
0.00 2612.90
325.17 1642.87 1968.04
442.63 36292.11
2.85 36737.59
296.39 241359.32
0.00
FDCC Page 9 of 109 Accounts Reckoner 2007-08 to 2015-16 BE
SATEMENT - IVSummary of State Transactions
(Rs. in Crores)
Head of Account Receipts Disbursement Receipts Disbursement Receipts Disbursement Receipts Disbursement Receipts Disbursement2012-13 2013-14 2014-15 2014-15 2015-16 BEREBE
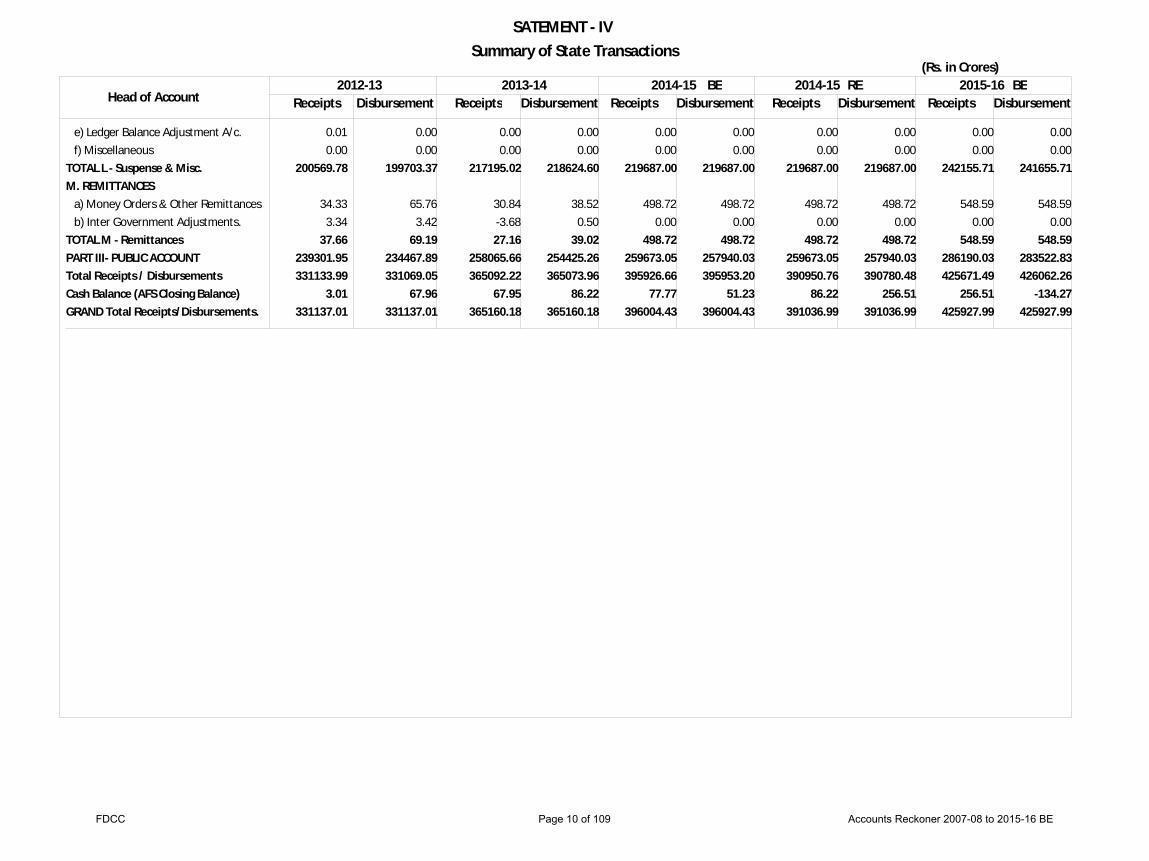
e) Ledger Balance Adjustment A/c. f) MiscellaneousTOTAL L - Suspense & Misc.M. REMITTANCES a) Money Orders & Other Remittances b) Inter Government Adjustments.TOTAL M - RemittancesPART III- PUBLIC ACCOUNTTotal Receipts / DisbursementsCash Balance (AFS Closing Balance)GRAND Total Receipts/Disbursements.
0.01 0.00
200569.78
34.33 3.34
37.66 239301.95 331133.99
3.01 331137.01
0.00 0.00
199703.37
65.76 3.42
69.19 234467.89 331069.05
67.96 331137.01
0.00 0.00
217195.02
30.84-3.68
27.16 258065.66 365092.22
67.95 365160.18
0.00 0.00
218624.60
38.52 0.50
39.02 254425.26 365073.96
86.22 365160.18
0.00 0.00
219687.00
498.72 0.00
498.72 259673.05 395926.66
77.77 396004.43
0.00 0.00
219687.00
498.72 0.00
498.72 257940.03 395953.20
51.23 396004.43
0.00 0.00
219687.00
498.72 0.00
498.72 259673.05 390950.76
86.22 391036.99
0.00 0.00
219687.00
498.72 0.00
498.72 257940.03 390780.48
256.51 391036.99
0.00 0.00
242155.71
548.59 0.00
548.59 286190.03 425671.49
256.51 425927.99
0.00 0.00
241655.71
548.59 0.00
548.59 283522.83 426062.26
-134.27 425927.99
FDCC Page 10 of 109 Accounts Reckoner 2007-08 to 2015-16 BE

STATEMENT - VTax Revenue, Non-Tax Revenue, Public Debt & Consolidated Fund of the State (Rs. in Crores)
2007-08 2008-09 2009-10 2010-11 2011-12 2012-13 2013-14 2014-15 2014-15 2015-16Head of AccountBEREBE
A. Tax RevenueState's Own Tax Revenue1. Commercial Taxes0022 Taxes on Agricultural Income0028 Other Taxes on Income andExpenditure0040 Taxes on Sales, Trade etc.,.0042 Taxes on Goods & Passengers0045 Other Taxes and Duties onCommodities & Services 101 Entertainment Tax 102 Betting Tax 105 Luxury TaxTotal - Commercial Tax2. 0039 State Excise3. 0041 Taxes on Vehicles4. 0030 Stamps and Registrations5. 0029 Land Revenue6. 0043 Taxes and Duties on Electricity7. 0045 Other Taxes and DutiesStates Own Tax Revenue2. Tax Devolution From Centre0020 Corporation Tax0021 Taxes on Income Other thanCorprn. Tax.0028-901 Other Taxes on Income &Expenditure0032 Taxes on Wealth0037 Customs0044 Service Tax0045 Other Taxes & Duties onCommodities and Services0045-901 Share of net proceeds assignedto StatesTotal Tax Devolution From Centre
3.04 451.37
13893.99 837.34
352.90 1.38
11.61 15551.63
4766.57 1650.13 3408.83
145.31 449.50
14.79 25986.76
2151.52 1444.07
-0.11
2.39 1281.39 1223.25
676.98
-0.26
6779.23
9.28 538.79
14622.73 1085.02
157.75 41.40
190.31 16645.29
5749.57 1681.16 2926.72
255.65 370.59
16.68 27645.66
2345.84 1472.96
-0.11
2.25 1367.55 1192.65
772.85
-0.22
7153.77
8.70 527.21
15832.67 1291.13
116.14 51.19
133.30 17960.33
6946.32 1961.60 2627.57
127.88 678.69 276.21
30578.60
3028.92 1687.23
0.00
6.85 1030.07
829.73 777.19
-0.01
7359.98
9.33 549.74
20234.69 1525.55
97.70 67.09
216.68 22700.78
8284.74 2550.02 3531.08
177.53 663.49 565.49
38473.12
3715.63 1963.50
0.00
7.62 1662.27 1209.25
948.05
-0.01
9506.31
15.04 600.20
25020.02 1690.17
480.15 54.53
139.99 28000.10
9775.44 2956.72 4623.20
214.93 654.24 251.34
46475.96
4359.17 2214.26
0.00
16.83 1920.18 1242.54 1322.06
0.00
11075.04
22.26 692.89
28414.44 2180.71
136.03 154.15 264.77
31865.26 11069.73
3829.52 5225.02
204.92 928.80 630.31
53753.56
4542.84 2719.73
0.00
7.66 2101.59 1428.25 1847.07
0.00
12647.14
21.32 792.98
33719.35 2625.66
146.22 176.19 299.06
37780.77 12828.36
3911.50 6188.76
199.49 896.58 798.06
62603.53
4643.76 3057.77
0.00
12.75 2252.90 1591.16 2249.93
0.01
13808.28
28.00 945.00
37250.00 2890.00
229.00 228.00 430.00
42000.00 14430.00
4350.00 7450.00
232.75 935.00 472.00
69869.75
5731.88 3547.99
0.00
14.32 2675.85 1884.09 2705.88
0.00
16560.01
20.21 864.67
36924.80 3028.87
192.74 173.02 345.69
41550.00 13750.79
4350.00 7100.00
199.82 981.48 622.00
68554.09
5333.83 3301.60
0.00
13.33 2490.03 1753.25 2517.97
0.00
15410.00
23.00 986.00
41329.00 3101.00
220.00 197.00 394.00
46250.00 15200.00
4800.00 8200.00
220.66 1150.74
624.00 76445.40
8209.89 6061.27
-0.24 3810.69 2478.34 4229.84
-0.01
24789.78
FDCC Page 11 of 109 Accounts Reckoner 2007-08 to 2015-16 BE
STATEMENT - VTax Revenue, Non-Tax Revenue, Public Debt & Consolidated Fund of the State (Rs. in Crores)
2007-08 2008-09 2009-10 2010-11 2011-12 2012-13 2013-14 2014-15 2014-15 2015-16Head of AccountBEREBE
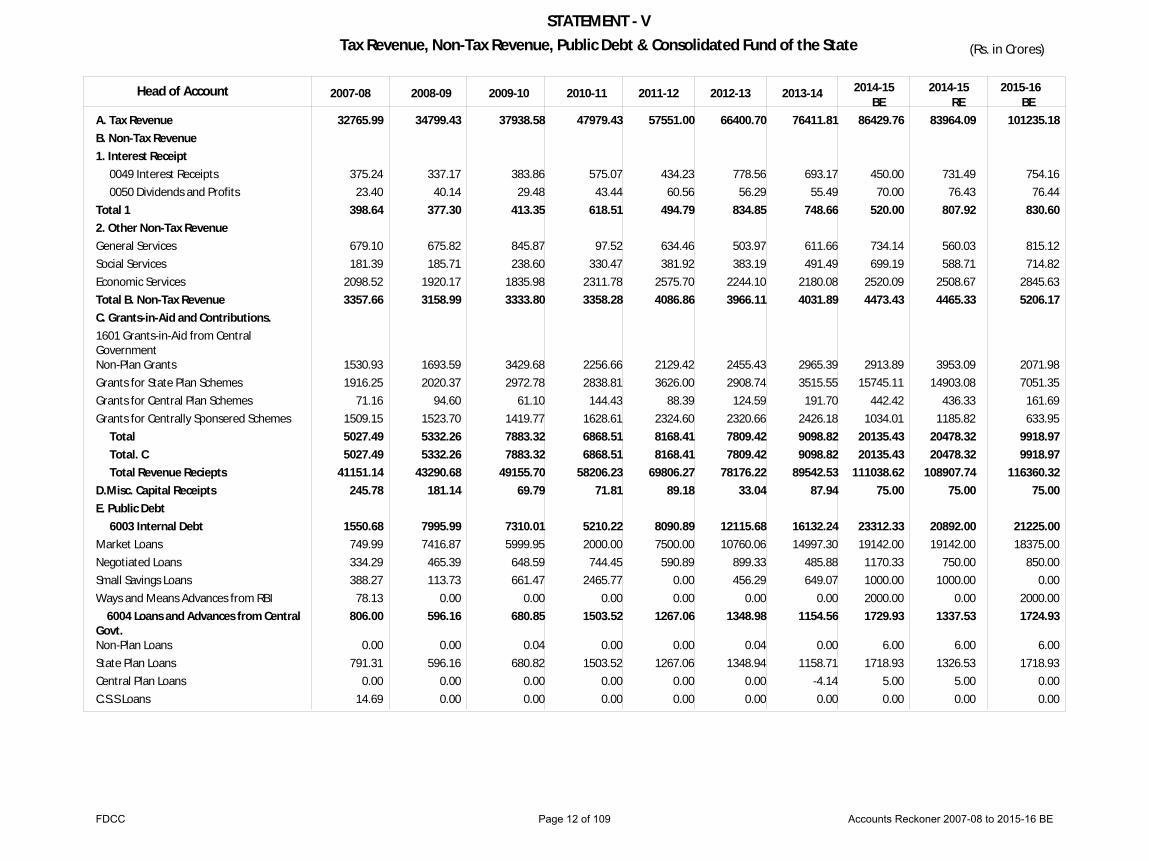
A. Tax RevenueB. Non-Tax Revenue1. Interest Receipt 0049 Interest Receipts 0050 Dividends and ProfitsTotal 12. Other Non-Tax RevenueGeneral ServicesSocial ServicesEconomic ServicesTotal B. Non-Tax RevenueC. Grants-in-Aid and Contributions.1601 Grants-in-Aid from CentralGovernmentNon-Plan GrantsGrants for State Plan SchemesGrants for Central Plan SchemesGrants for Centrally Sponsered Schemes Total Total. C Total Revenue RecieptsD.Misc. Capital ReceiptsE. Public Debt 6003 Internal DebtMarket LoansNegotiated LoansSmall Savings LoansWays and Means Advances from RBI 6004 Loans and Advances from CentralGovt.Non-Plan LoansState Plan LoansCentral Plan LoansC.S.S Loans
32765.99
375.24 23.40
398.64
679.10 181.39
2098.52 3357.66
1530.93 1916.25
71.16 1509.15 5027.49 5027.49
41151.14 245.78
1550.68 749.99 334.29 388.27
78.13 806.00
0.00 791.31
0.00 14.69
34799.43
337.17 40.14
377.30
675.82 185.71
1920.17 3158.99
1693.59 2020.37
94.60 1523.70 5332.26 5332.26
43290.68 181.14
7995.99 7416.87
465.39 113.73
0.00 596.16
0.00 596.16
0.00 0.00
37938.58
383.86 29.48
413.35
845.87 238.60
1835.98 3333.80
3429.68 2972.78
61.10 1419.77 7883.32 7883.32
49155.70 69.79
7310.01 5999.95
648.59 661.47
0.00 680.85
0.04 680.82
0.00 0.00
47979.43
575.07 43.44
618.51
97.52 330.47
2311.78 3358.28
2256.66 2838.81
144.43 1628.61 6868.51 6868.51
58206.23 71.81
5210.22 2000.00
744.45 2465.77
0.00 1503.52
0.00 1503.52
0.00 0.00
57551.00
434.23 60.56
494.79
634.46 381.92
2575.70 4086.86
2129.42 3626.00
88.39 2324.60 8168.41 8168.41
69806.27 89.18
8090.89 7500.00
590.89 0.00 0.00
1267.06
0.00 1267.06
0.00 0.00
66400.70
778.56 56.29
834.85
503.97 383.19
2244.10 3966.11
2455.43 2908.74
124.59 2320.66 7809.42 7809.42
78176.22 33.04
12115.68 10760.06
899.33 456.29
0.00 1348.98
0.04 1348.94
0.00 0.00
76411.81
693.17 55.49
748.66
611.66 491.49
2180.08 4031.89
2965.39 3515.55
191.70 2426.18 9098.82 9098.82
89542.53 87.94
16132.24 14997.30
485.88 649.07
0.00 1154.56
0.00 1158.71
-4.14 0.00
86429.76
450.00 70.00
520.00
734.14 699.19
2520.09 4473.43
2913.89 15745.11
442.42 1034.01
20135.43 20135.43
111038.62 75.00
23312.33 19142.00
1170.33 1000.00 2000.00 1729.93
6.00 1718.93
5.00 0.00
83964.09
731.49 76.43
807.92
560.03 588.71
2508.67 4465.33
3953.09 14903.08
436.33 1185.82
20478.32 20478.32
108907.74 75.00
20892.00 19142.00
750.00 1000.00
0.00 1337.53
6.00 1326.53
5.00 0.00
101235.18
754.16 76.44
830.60
815.12 714.82
2845.63 5206.17
2071.98 7051.35
161.69 633.95
9918.97 9918.97
116360.32 75.00
21225.00 18375.00
850.00 0.00
2000.00 1724.93
6.00 1718.93
0.00 0.00
FDCC Page 12 of 109 Accounts Reckoner 2007-08 to 2015-16 BE
STATEMENT - VTax Revenue, Non-Tax Revenue, Public Debt & Consolidated Fund of the State (Rs. in Crores)
2007-08 2008-09 2009-10 2010-11 2011-12 2012-13 2013-14 2014-15 2014-15 2015-16Head of AccountBEREBE
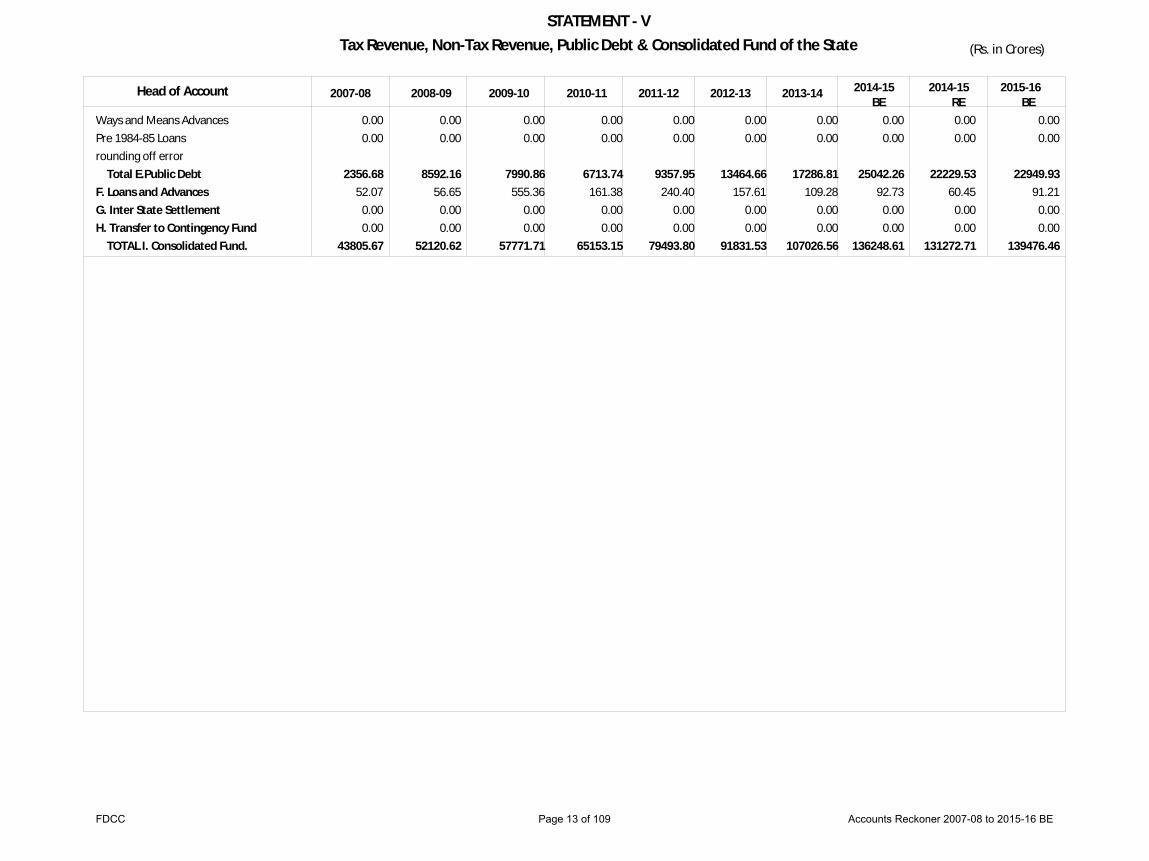
Ways and Means Advances Pre 1984-85 Loansrounding off error Total E.Public DebtF. Loans and AdvancesG. Inter State SettlementH. Transfer to Contingency Fund TOTAL I. Consolidated Fund.
0.00 0.00
2356.68 52.07
0.00 0.00
43805.67
0.00 0.00
8592.16 56.65
0.00 0.00
52120.62
0.00 0.00
7990.86 555.36
0.00 0.00
57771.71
0.00 0.00
6713.74 161.38
0.00 0.00
65153.15
0.00 0.00
9357.95 240.40
0.00 0.00
79493.80
0.00 0.00
13464.66 157.61
0.00 0.00
91831.53
0.00 0.00
17286.81 109.28
0.00 0.00
107026.56
0.00 0.00
25042.26 92.73
0.00 0.00
136248.61
0.00 0.00
22229.53 60.45
0.00 0.00
131272.71
0.00 0.00
22949.93 91.21
0.00 0.00
139476.46
FDCC Page 13 of 109 Accounts Reckoner 2007-08 to 2015-16 BE

STATEMENT - VIRevenue Receipts, Revenue Expenditure Revenue, Surplus / Defict
( Rs in Crores)
2007-08 2008-09 2009-10 2010-11 2011-12 2012-13 2013-14 2014-15 2014-15 2015-16BEREBE
I.
12345678
II.
IIIIVV
VIVIIVIII
Revenue raised by the GovernmentA. TAX REVENUE (OWN TAX REVENUE) Taxes on Sales, Trades, etc. State Excise Taxes on Vechicles Stamps & Registration Fees Land Revenue Taxes & Duties on Electricty Taxes on Goods & Passengers Other TaxesA. TAX REVENUEB.NON- TAX REVENUE TotalReceipts from Govt.of India by of Tax Devolution (a) Devolution from CentreTotal II C. GRANTS-IN-AID(I) Non- Plan Grants(ii) Grants for State plan Schemes(iii) Grants for Central and Centrally SponoredSchemes Total Grants-in -Aid Total Receipts from Government of IndiaTotal Receipts of the State. Govt.(Rev. Acc)Percentage of revenue raised to Total ReceiptsRevenue Expenditure. a) Plan b) Non-PlanTotal Revenue Expenditure.Revenue Deficit (-) Surplus(+)% of dificit/ surplus to Non-plan Expenditure% increase in Rev Rec over the previous year.
13893.99 4766.57 1650.13 3408.83
145.31 449.50 837.34 835.09
25986.76 3357.66
29344.42
6779.23 6779.23
1530.93 1916.25 1580.31
5027.49 11806.72 41151.14
71.31
8312.82 29061.95 37374.77
3776.37 12.99
9.48
14622.73 5749.57 1681.16 2926.72
255.65 370.59
1085.02 954.22
27645.66 3158.99
30804.65
7153.77 7153.77
1693.59 2020.37 1618.29
5332.25 12486.02 43290.67
71.16
10530.31 31128.99 41659.30
1631.37 5.24 5.20
15832.67 6946.32 1961.60 2627.57
127.88 678.69
1291.13 1112.73
30578.59 3333.80
33912.39
7359.98 7359.98
3429.68 2972.78 1480.86
7883.32 15243.30 49155.69
68.99
12302.68 35234.24 47536.92
1618.77 4.59
13.55
20234.69 8284.74 2550.02 3531.08
177.53 663.49
1525.55 1506.03
38473.13 3358.28
41831.41
9506.31 9506.31
2256.66 2838.81 1773.03
6868.50 16374.81 58206.22
71.87
15187.43 38846.41 54033.84
4172.38 10.74 18.41
25020.02 9775.44 2956.72 4623.20
214.93 654.24
1690.17 1541.25
46475.97 4086.86
50562.83
11075.04 11075.04
2129.42 3626.00 2412.99
8168.41 19243.45 69806.28
72.43
18566.74 46548.33 65115.07
4691.21 10.08 19.93
28414.44 11069.73
3829.52 5225.02
204.92 928.80
2180.71 1900.42
53753.56 3966.11
57719.67
12647.14 12647.14
2455.43 2908.74 2445.25
7809.42 20456.56 78176.23
73.83
21211.68 55081.58 76293.26
1882.97 3.42
11.99
33719.35 12828.36
3911.50 6188.76
199.49 896.58
2625.66 2233.82
62603.52 4031.89
66635.41
13808.28 13808.28
2965.39 3515.55 2617.88
9098.82 22907.10 89542.51
74.42
26969.84 62219.73 89189.57
352.94 0.57
12.69
37250.00 14430.00
4350.00 7450.00
232.75 935.00
2890.00 2332.00
69869.75 4473.43
74343.18
16560.01 16560.01
2913.89 15745.11
1476.43
20135.43 36695.44
111038.62 66.95
37432.97 73324.37
110757.34 281.28
0.38 24.01
36924.80 13750.79
4350.00 7100.00
199.82 981.48
3028.87 2218.33
68554.09 4465.33
73019.42
15410.00 15410.00
3953.09 14903.08
1622.15
20478.32 35888.32
108907.74 67.05
37781.89 70965.73
108747.62 160.12
0.23-1.92
41329.00 15200.00
4800.00 8200.00
220.66 1150.74 3101.00 2444.00
76445.40 5206.17
81651.57
24789.78 24789.78
2071.98 7051.35
795.64
9918.97 34708.75
116360.32 70.17
40223.31 75226.37
115449.68 910.64
1.21 6.84
FDCC Page 14 of 109 Accounts Reckoner 2007-08 to 2015-16 BE

STATEMENT - VIRevenue Receipts, Revenue Expenditure Revenue, Surplus / Defict
( Rs in Crores)
2007-08 2008-09 2009-10 2010-11 2011-12 2012-13 2013-14 2014-15 2014-15 2015-16BEREBE
IXXXI
XIIXIIIXIV
Revenue deficit/surplus as a % of Rev Receipts% of growth on Non- Tax Rev over the previous year% of Receipts from Government Of India to RevReceipts% of growth of Tax Rev over previous year% increase in Revenue Expr over previous year% of Receipts from GoI to Rev Expr.
9.18-18.07 28.69
11.53 11.78 31.59
3.77-5.92
28.84
6.38 11.46 29.97
3.29 5.53
31.01
10.61 14.11 32.07
7.17 0.73
28.13
25.82 13.67 30.30
6.72 21.70 27.57
20.80 20.51 29.55
2.41-2.95
26.17
15.66 17.17 26.81
0.39 1.66
25.58
16.46 16.90 25.68
0.25 10.95 33.05
11.61 24.18 33.13
0.15-0.18
32.95
-1.88-1.81
33.00
0.78 16.59 29.83
11.51 6.16
30.06
FDCC Page 15 of 109 Accounts Reckoner 2007-08 to 2015-16 BE

STATEMENT - VIIArrears of Revenue
YearPercentage of arrears to revenue
raised
Arrears of revenue (Rs. in Crores)
Revenue raised(Rs. in Crores)
2004-052005-062006-072007-082008-092009-102010-112011-122012-132013-14
20137.91 22506.26 27399.44 29344.42 30804.65 33912.40 41831.40 50562.82 57720.00 66635.00
3844.85 3683.01 5025.99 6163.08 5937.79 4585.58 3013.86 3115.11 4134.41 4946.00
191618211914
7678
FDCC Page 16 of 109 Accounts Reckoner 2007-08 to 2015-16 BE

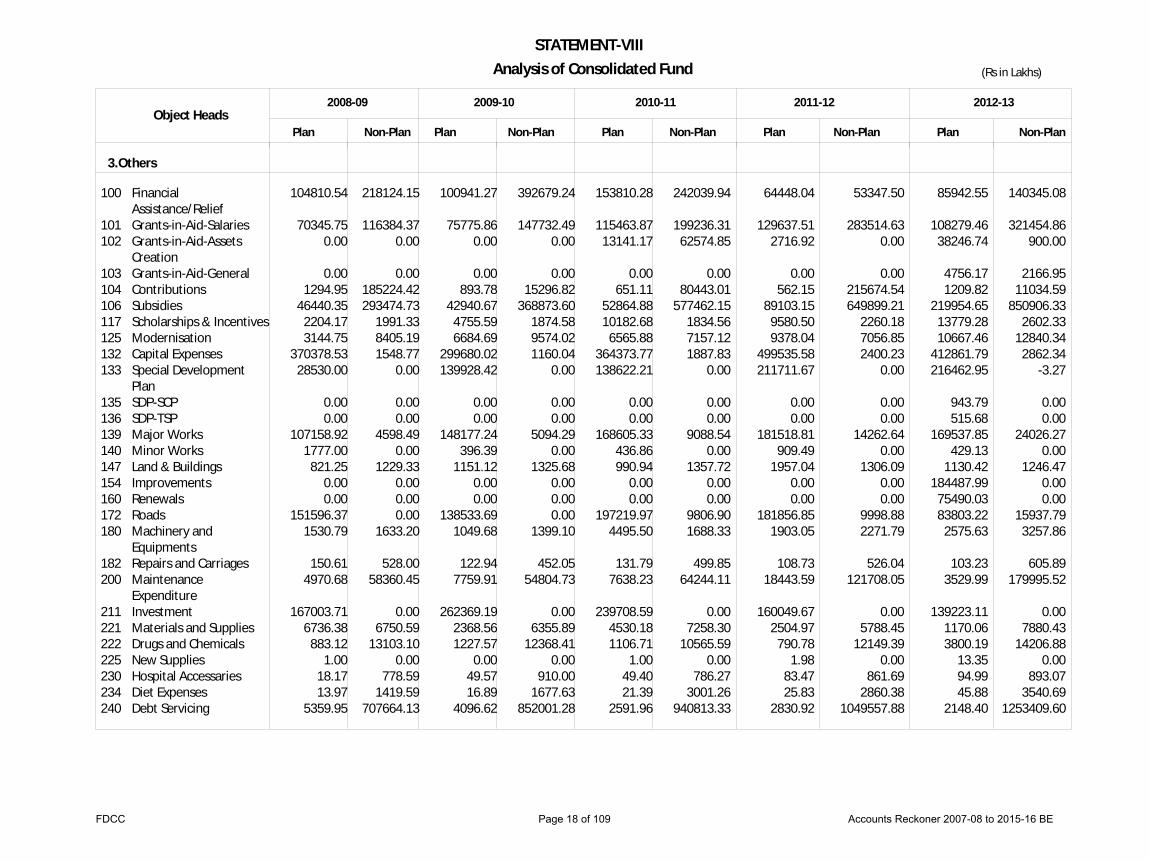
STATEMENT-VIIIAnalysis of Consolidated Fund
Object HeadsPlan Non-Plan Plan Non-Plan Plan Non-Plan Plan Non-Plan
(Rs in Lakhs)
Plan Non-Plan
2008-09 2009-10 2010-11 2011-12 2012-13
1664358.20 2659305.82 2083139.57 3075775.31 2542250.63 3404010.28 3027684.47 4010423.79 3123542.01 4683430.46
1. Salary
2.Administrative Expenditure
3.Others
26632.20
18784.71
382491.85
63631.59
33770.63
16388.91
407246.50
82446.69
52554.89
20421.59
469250.35
83607.40
67325.93
25263.20
532555.02
88024.24
84241.30
26194.31
626944.40
120296.69
002003004011014020
015021
029
041051052053
060071195
001032
059
Pay-OfficersPay-StaffInterim ReliefDearness AllowanceOther AllowanceMedical Allowance
Subsidiary ExpensesReimbursement ofMedical ExpensesEstablishment ChargesTransferred From 2701Major & MeadiumIrrigationTravel ExpensesGeneral ExpensesTelephone ChargesPurchase of Furnitureand Fixture for OfficeCompensatory CostBuilding ExpensesTransport Expenses
Consolidated SalariesGrants for Creation ofCapital AssetsOther Expenses
4838.94 14438.02
0.00 5271.91 2083.33
0.00
7928.46 0.00
1275.34
415.97 7366.45
64.72 22.24
0.00 1067.17
644.36
0.00 0.00
314482.92
32075.25 240909.42
0.00 70582.32 38924.86
0.00
11489.71 0.00
0.00
8948.07 19176.07
883.02 215.47
0.00 8784.69
14134.56
805.63 0.00
24842.57
6109.25 15775.29
0.00 9409.18 2413.21
63.70
4721.08 152.74
0.00
435.64 9741.69
92.96 28.07
0.00 579.25 637.48
0.00 0.00
401636.69
34900.14 234893.59
0.00 102468.12
33825.39 1159.26
23142.31 5966.28
1447.70
10796.85 17809.72
904.96 294.07
0.00 8985.10
13099.70
1721.00 0.00
30111.47
11941.70 19977.50
0.00 16412.52
4096.77 126.40
4668.38 308.16
0.00
375.68 13401.60
84.92 69.23
0.00 927.16 586.46
7.92 0.00
368915.70
49632.62 231498.60
0.00 146336.14
40086.14 1696.85
17088.41 7731.47
0.00
11832.55 21258.14
986.38 303.50
0.00 9514.35
14892.60
1538.43 0.00
61047.77
18371.55 18323.14
1173.83 23726.83
5621.25 109.33
2958.83 351.02
0.00
432.27 19243.79
93.07 42.33
0.00 1451.75
690.14
300.50 144715.37
469882.65
61557.01 225917.28
11325.10 187987.42
44395.01 1373.20
16958.51 8353.66
0.00
12966.70 21178.27
1039.73 295.64
0.00 10439.44 16792.29
64374.71 105070.43
84256.82
24875.26 34860.83
843.74 14749.36
8728.39 183.72
3435.44 526.17
0.00
466.15 19082.33
106.25 75.85
0.00 1419.47 1082.65
3.26 100492.17
460965.31
77857.71 400264.30
7099.69 70428.98 69199.13
2094.59
20799.30 8500.49
0.00
16597.92 40121.29
1116.28 313.20
23.84 13135.85 19688.52
90698.79 77427.49
96644.58
Total:
Total:
A.State Sector of which
1. Salary
2.Administrative Expenditure
FDCC Page 17 of 109 Accounts Reckoner 2007-08 to 2015-16 BE
STATEMENT-VIIIAnalysis of Consolidated Fund
Object HeadsPlan Non-Plan Plan Non-Plan Plan Non-Plan Plan Non-Plan
(Rs in Lakhs)
Plan Non-Plan
2008-09 2009-10 2010-11 2011-12 2012-13
3.Others
100
101102
103104106117125132133
135136139140147154160172180
182200
211221222225230234240
FinancialAssistance/ReliefGrants-in-Aid-SalariesGrants-in-Aid-AssetsCreationGrants-in-Aid-GeneralContributionsSubsidiesScholarships & IncentivesModernisationCapital ExpensesSpecial DevelopmentPlanSDP-SCPSDP-TSPMajor WorksMinor WorksLand & BuildingsImprovementsRenewalsRoadsMachinery andEquipmentsRepairs and CarriagesMaintenanceExpenditureInvestmentMaterials and SuppliesDrugs and ChemicalsNew SuppliesHospital AccessariesDiet ExpensesDebt Servicing
104810.54
70345.75 0.00
0.00 1294.95
46440.35 2204.17 3144.75
370378.53 28530.00
0.00 0.00
107158.92 1777.00
821.25 0.00 0.00
151596.37 1530.79
150.61 4970.68
167003.71 6736.38
883.12 1.00
18.17 13.97
5359.95
218124.15
116384.37 0.00
0.00 185224.42 293474.73
1991.33 8405.19 1548.77
0.00
0.00 0.00
4598.49 0.00
1229.33 0.00 0.00 0.00
1633.20
528.00 58360.45
0.00 6750.59
13103.10 0.00
778.59 1419.59
707664.13
100941.27
75775.86 0.00
0.00 893.78
42940.67 4755.59 6684.69
299680.02 139928.42
0.00 0.00
148177.24 396.39
1151.12 0.00 0.00
138533.69 1049.68
122.94 7759.91
262369.19 2368.56 1227.57
0.00 49.57 16.89
4096.62
392679.24
147732.49 0.00
0.00 15296.82
368873.60 1874.58 9574.02 1160.04
0.00
0.00 0.00
5094.29 0.00
1325.68 0.00 0.00 0.00
1399.10
452.05 54804.73
0.00 6355.89
12368.41 0.00
910.00 1677.63
852001.28
153810.28
115463.87 13141.17
0.00 651.11
52864.88 10182.68
6565.88 364373.77 138622.21
0.00 0.00
168605.33 436.86 990.94
0.00 0.00
197219.97 4495.50
131.79 7638.23
239708.59 4530.18 1106.71
1.00 49.40 21.39
2591.96
242039.94
199236.31 62574.85
0.00 80443.01
577462.15 1834.56 7157.12 1887.83
0.00
0.00 0.00
9088.54 0.00
1357.72 0.00 0.00
9806.90 1688.33
499.85 64244.11
0.00 7258.30
10565.59 0.00
786.27 3001.26
940813.33
64448.04
129637.51 2716.92
0.00 562.15
89103.15 9580.50 9378.04
499535.58 211711.67
0.00 0.00
181518.81 909.49
1957.04 0.00 0.00
181856.85 1903.05
108.73 18443.59
160049.67 2504.97
790.78 1.98
83.47 25.83
2830.92
53347.50
283514.63 0.00
0.00 215674.54 649899.21
2260.18 7056.85 2400.23
0.00
0.00 0.00
14262.64 0.00
1306.09 0.00 0.00
9998.88 2271.79
526.04 121708.05
0.00 5788.45
12149.39 0.00
861.69 2860.38
1049557.88
85942.55
108279.46 38246.74
4756.17 1209.82
219954.65 13779.28 10667.46
412861.79 216462.95
943.79 515.68
169537.85 429.13
1130.42 184487.99
75490.03 83803.22
2575.63
103.23 3529.99
139223.11 1170.06 3800.19
13.35 94.99 45.88
2148.40
140345.08
321454.86 900.00
2166.95 11034.59
850906.33 2602.33
12840.34 2862.34
-3.27
0.00 0.00
24026.27 0.00
1246.47 0.00 0.00
15937.79 3257.86
605.89 179995.52
0.00 7880.43
14206.88 0.00
893.07 3540.69
1253409.60
FDCC Page 18 of 109 Accounts Reckoner 2007-08 to 2015-16 BE
STATEMENT-VIIIAnalysis of Consolidated Fund
Object HeadsPlan Non-Plan Plan Non-Plan Plan Non-Plan Plan Non-Plan
(Rs in Lakhs)
Plan Non-Plan
2008-09 2009-10 2010-11 2011-12 2012-13
3.Others
241243250251
261271292293294295296297
364386393394395
396422423433436437438442
443
495
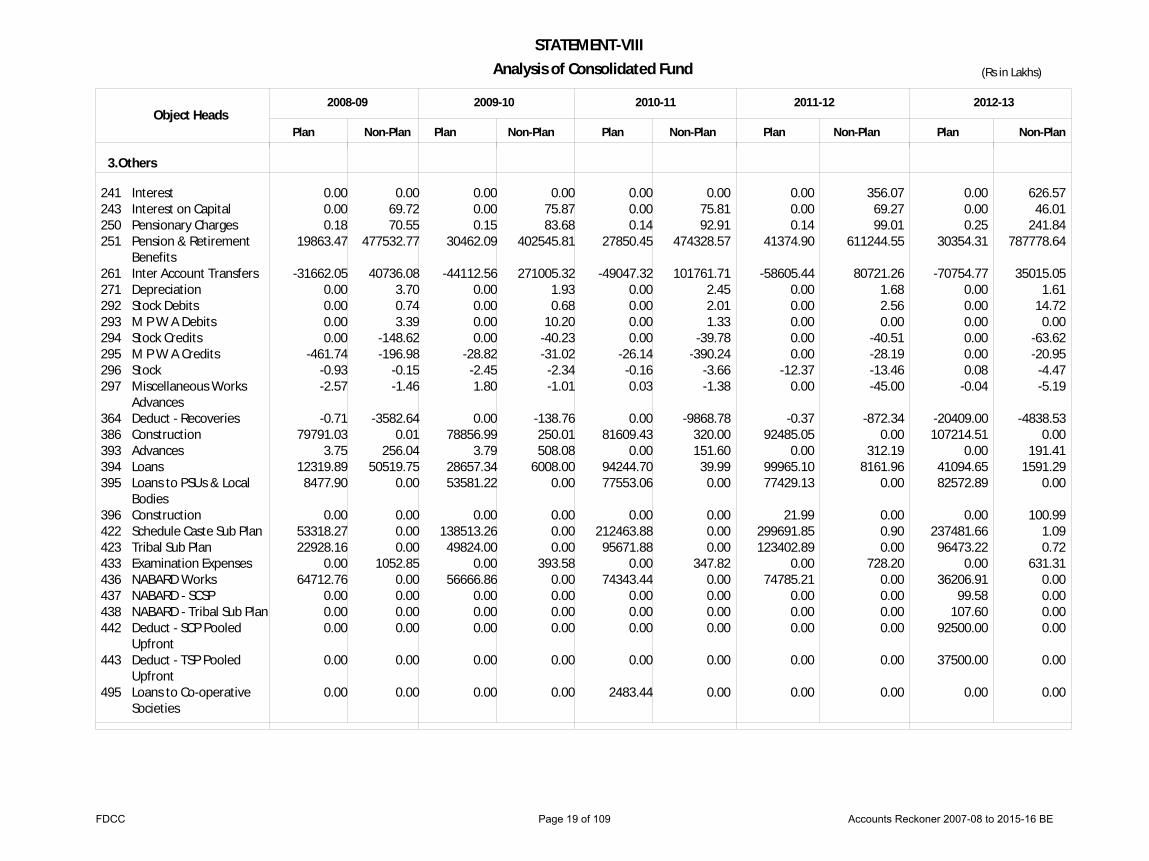
InterestInterest on CapitalPensionary ChargesPension & RetirementBenefitsInter Account TransfersDepreciationStock DebitsM P W A DebitsStock CreditsM P W A CreditsStockMiscellaneous WorksAdvancesDeduct - RecoveriesConstructionAdvancesLoansLoans to PSUs & LocalBodiesConstructionSchedule Caste Sub PlanTribal Sub PlanExamination ExpensesNABARD WorksNABARD - SCSPNABARD - Tribal Sub PlanDeduct - SCP PooledUpfrontDeduct - TSP PooledUpfrontLoans to Co-operativeSocieties
0.00 0.00 0.18
19863.47
-31662.05 0.00 0.00 0.00 0.00
-461.74-0.93-2.57
-0.71 79791.03
3.75 12319.89
8477.90
0.00 53318.27 22928.16
0.00 64712.76
0.00 0.00 0.00
0.00
0.00
0.00 69.72 70.55
477532.77
40736.08 3.70 0.74 3.39
-148.62-196.98
-0.15-1.46
-3582.64 0.01
256.04 50519.75
0.00
0.00 0.00 0.00
1052.85 0.00 0.00 0.00 0.00
0.00
0.00
0.00 0.00 0.15
30462.09
-44112.56 0.00 0.00 0.00 0.00
-28.82-2.45 1.80
0.00 78856.99
3.79 28657.34 53581.22
0.00 138513.26
49824.00 0.00
56666.86 0.00 0.00 0.00
0.00
0.00
0.00 75.87 83.68
402545.81
271005.32 1.93 0.68
10.20-40.23-31.02
-2.34-1.01
-138.76 250.01 508.08
6008.00 0.00
0.00 0.00 0.00
393.58 0.00 0.00 0.00 0.00
0.00
0.00
0.00 0.00 0.14
27850.45
-49047.32 0.00 0.00 0.00 0.00
-26.14-0.16 0.03
0.00 81609.43
0.00 94244.70 77553.06
0.00 212463.88
95671.88 0.00
74343.44 0.00 0.00 0.00
0.00
2483.44
0.00 75.81 92.91
474328.57
101761.71 2.45 2.01 1.33
-39.78-390.24
-3.66-1.38
-9868.78 320.00 151.60
39.99 0.00
0.00 0.00 0.00
347.82 0.00 0.00 0.00 0.00
0.00
0.00
0.00 0.00 0.14
41374.90
-58605.44 0.00 0.00 0.00 0.00 0.00
-12.37 0.00
-0.37 92485.05
0.00 99965.10 77429.13
21.99 299691.85 123402.89
0.00 74785.21
0.00 0.00 0.00
0.00
0.00
356.07 69.27 99.01
611244.55
80721.26 1.68 2.56 0.00
-40.51-28.19-13.46-45.00
-872.34 0.00
312.19 8161.96
0.00
0.00 0.90 0.00
728.20 0.00 0.00 0.00 0.00
0.00
0.00
0.00 0.00 0.25
30354.31
-70754.77 0.00 0.00 0.00 0.00 0.00 0.08-0.04
-20409.00 107214.51
0.00 41094.65 82572.89
0.00 237481.66
96473.22 0.00
36206.91 99.58
107.60 92500.00
37500.00
0.00
626.57 46.01
241.84 787778.64
35015.05 1.61
14.72 0.00
-63.62-20.95
-4.47-5.19
-4838.53 0.00
191.41 1591.29
0.00
100.99 1.09 0.72
631.31 0.00 0.00 0.00 0.00
0.00
0.00
FDCC Page 19 of 109 Accounts Reckoner 2007-08 to 2015-16 BE

STATEMENT-VIIIAnalysis of Consolidated Fund
Object HeadsPlan Non-Plan Plan Non-Plan Plan Non-Plan Plan Non-Plan
(Rs in Lakhs)
Plan Non-Plan
2008-09 2009-10 2010-11 2011-12 2012-13
3.Others
1618941.29 2213182.38 2032980.03 2586082.12 2469274.15 2851152.53 2935095.34 3389844.53 3013106.40 3936189.37Total: 3.Others
B.District Sector of which
Pay-OfficersPay-StaffInterim ReliefDearness AllowanceOther AllowanceMedical Allowance
2187.14 34730.04
13.83 6821.42 5407.70
0.00
1.Salary
201
300
401
402
403
404
405
406
407
408
409
410
411
412
GIA for ZP
Lumpsum - ZP
Bengaluru (Urban
Bengaluru (Rural)
Chitradurga
Kolar
Shivamogga
Tumakuru
Mysuru
Chikkamagaluru
Dakshina Kannad
Hassan
Kodagu
Mandya
208.50
37790.94
9747.55
5924.21
10505.36
7640.15
11045.65
17703.72
11842.65
8843.05
8998.57
10470.64
4603.85
10406.46
0.00
17524.38
39374.32
14638.14
27327.10
23196.31
25228.90
40521.84
31592.13
20502.85
21235.66
31629.44
7882.31
25558.36
0.00
31649.64
10263.98
6242.53
11079.81
8460.48
13727.20
18265.17
13606.40
9268.66
9797.34
12197.03
4719.24
11212.48
0.00
22695.18
38020.18
14672.83
26439.45
21298.13
26165.59
42099.99
32040.92
21132.27
21546.36
32982.81
8306.41
26556.53
0.00
24272.15
13759.97
6893.85
13513.45
10181.05
16010.02
22468.32
16117.51
10760.41
11234.32
13982.87
4869.98
13545.39
0.00
13590.95
41341.32
14881.60
28566.71
23903.57
27986.47
46427.81
34317.02
22438.24
23340.64
35570.14
9152.71
29084.63
0.00
93163.75
22633.88
6690.08
13409.12
9654.12
14398.59
22258.82
16554.84
11042.75
10724.52
13951.27
5429.50
13310.45
0.00
116132.66
46781.60
16966.16
32253.67
27642.47
31459.99
50730.52
40438.40
25999.23
26304.60
38270.29
10679.66
31738.85
0.00
121802.87
17138.45
8508.43
16385.95
12126.88
19098.35
26115.19
22162.33
14236.98
14864.50
17257.64
6376.45
16115.31
0.00
190175.88
53188.10
19487.47
38512.02
32773.45
37471.09
59061.97
44880.37
28348.76
31296.77
38940.49
11921.49
35083.83
324558.11 755659.85 350568.02 786868.29 408266.57 838879.54 494247.22 1043259.77 621762.50 1231381.20
Total -1
13533.90 330215.20
83.55 81642.15 31862.09
0.00
2548.41 37859.79
6.70 11121.69
5881.33 106.16
13939.08 301641.67
60.24 115390.99
29561.33 1155.75
3062.33 39510.16
0.24 17186.20
6313.60 157.00
16269.77 318005.77
7.31 178235.57
34575.89 1619.04
3263.20 44832.40
1496.43 22983.21 10221.01
153.91
16596.38 311004.89
14305.13 218882.48
37753.01 1524.36
7142.22 120425.07
1039.69 9529.70
16979.60 480.35
30174.89 575405.25
7955.71 63897.60 61775.93
2416.10
49160.13 457336.89 57524.08 461749.06 548713.35 82950.16 600066.25 741625.48 66229.53 155596.63
FDCC Page 20 of 109 Accounts Reckoner 2007-08 to 2015-16 BE
STATEMENT-VIIIAnalysis of Consolidated Fund
Object HeadsPlan Non-Plan Plan Non-Plan Plan Non-Plan Plan Non-Plan
(Rs in Lakhs)
Plan Non-Plan
2008-09 2009-10 2010-11 2011-12 2012-13
413
414
415
416
417
418
419
420
421
451
452
453
456
457
461
462
463
466
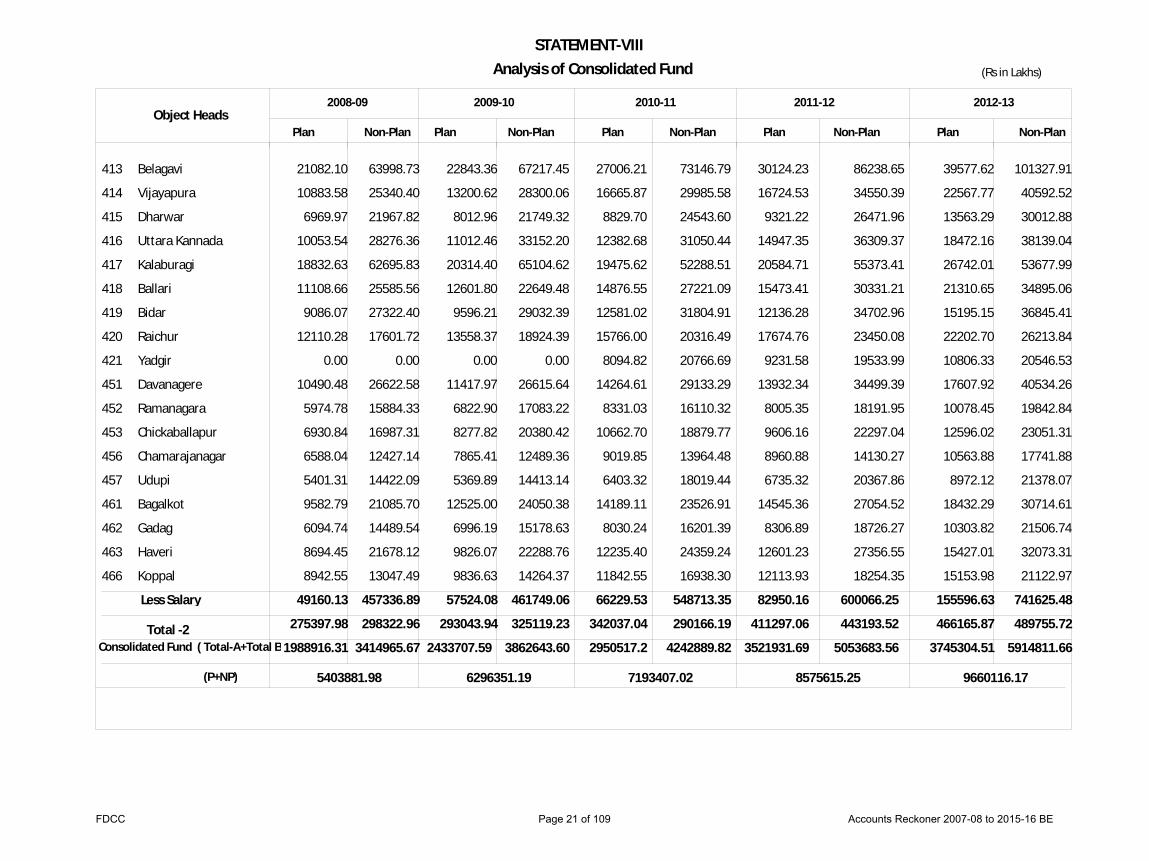
Belagavi
Vijayapura
Dharwar
Uttara Kannada
Kalaburagi
Ballari
Bidar
Raichur
Yadgir
Davanagere
Ramanagara
Chickaballapur
Chamarajanagar
Udupi
Bagalkot
Gadag
Haveri
Koppal
21082.10
10883.58
6969.97
10053.54
18832.63
11108.66
9086.07
12110.28
0.00
10490.48
5974.78
6930.84
6588.04
5401.31
9582.79
6094.74
8694.45
8942.55
63998.73
25340.40
21967.82
28276.36
62695.83
25585.56
27322.40
17601.72
0.00
26622.58
15884.33
16987.31
12427.14
14422.09
21085.70
14489.54
21678.12
13047.49
22843.36
13200.62
8012.96
11012.46
20314.40
12601.80
9596.21
13558.37
0.00
11417.97
6822.90
8277.82
7865.41
5369.89
12525.00
6996.19
9826.07
9836.63
67217.45
28300.06
21749.32
33152.20
65104.62
22649.48
29032.39
18924.39
0.00
26615.64
17083.22
20380.42
12489.36
14413.14
24050.38
15178.63
22288.76
14264.37
27006.21
16665.87
8829.70
12382.68
19475.62
14876.55
12581.02
15766.00
8094.82
14264.61
8331.03
10662.70
9019.85
6403.32
14189.11
8030.24
12235.40
11842.55
73146.79
29985.58
24543.60
31050.44
52288.51
27221.09
31804.91
20316.49
20766.69
29133.29
16110.32
18879.77
13964.48
18019.44
23526.91
16201.39
24359.24
16938.30
30124.23
16724.53
9321.22
14947.35
20584.71
15473.41
12136.28
17674.76
9231.58
13932.34
8005.35
9606.16
8960.88
6735.32
14545.36
8306.89
12601.23
12113.93
86238.65
34550.39
26471.96
36309.37
55373.41
30331.21
34702.96
23450.08
19533.99
34499.39
18191.95
22297.04
14130.27
20367.86
27054.52
18726.27
27356.55
18254.35
39577.62
22567.77
13563.29
18472.16
26742.01
21310.65
15195.15
22202.70
10806.33
17607.92
10078.45
12596.02
10563.88
8972.12
18432.29
10303.82
15427.01
15153.98
101327.91
40592.52
30012.88
38139.04
53677.99
34895.06
36845.41
26213.84
20546.53
40534.26
19842.84
23051.31
17741.88
21378.07
30714.61
21506.74
32073.31
21122.97
Less Salary 49160.13 57524.08 66229.53 82950.16 155596.63 457336.89 461749.06 548713.35 600066.25 741625.48
Total -2 275397.98 293043.94 342037.04 411297.06 466165.87 298322.96 325119.23 290166.19 443193.52 489755.72
Consolidated Fund ( Total-A+Total B 1988916.31 3414965.67 2433707.59 3862643.60 2950517.2 4242889.82 3521931.69 5053683.56 3745304.51 5914811.66
(P+NP) 5403881.98 6296351.19 7193407.02 8575615.25 9660116.17
FDCC Page 21 of 109 Accounts Reckoner 2007-08 to 2015-16 BE

STATEMENT-VIIIAnalysis of Consolidated Fund
Object HeadsPlan Non-Plan Plan Non-Plan Plan Non-Plan
(Rs in Lakhs)
Plan Non-Plan
2013-14 2014-15 BE 2014-15 RE 2015-16 BE
3709014.35 5304807.47 4705240.66 6452738.53 4626167.79 5943857.59 4957852.00 6637980.00
1. Salary
2.Administrative Expenditure
3.Others
96499.24
35152.74
701042.76
133239.51
123552.68
44156.83
959027.64
186709.48
126902.59
58704.30
825595.49
185641.25
122928.00
57605.00
903474.00
176147.00
002003004011014020
015021
041050051052053
060071195
001032
059100
101
Pay-OfficersPay-StaffInterim ReliefDearness AllowanceOther AllowanceMedical Allowance
Subsidiary ExpensesReimbursement ofMedical ExpensesTravel ExpensesOffice ExpensesGeneral ExpensesTelephone ChargesPurchase of Furnitureand Fixture for OfficeCompensatory CostBuilding ExpensesTransport Expenses
Consolidated SalariesGrants for Creation ofCapital AssetsOther ExpensesFinancialAssistance/ReliefGrants-in-Aid-Salaries
36677.89 29860.29
0.00 19212.18 10598.21
150.67
3591.82 592.03
484.28 0.00
27924.99 137.94
93.93
0.00 1474.83
852.92
4.84 169769.90
646817.53 51607.46
113570.70
105338.23 420746.84
0.00 89648.48 83069.27
2239.94
24219.03 10375.69
17812.93 0.00
41680.31 1292.03
909.19
45.01 14210.02 22695.30
62940.82 100122.89
116071.55 87592.78
344499.82
52246.92 27766.67
0.00 31821.47 11583.70
133.92
5715.11 1614.01
1339.99 0.00
31451.08 251.69
96.10
0.00 2357.71 1331.14
420.00 168048.40
1210772.77 35196.60
161430.77
120274.62 426758.12
0.00 161475.77 248231.89
2287.24
31121.69 12594.00
19050.31 0.00
70394.72 2340.50 1230.01
955.00 20109.22 28914.03
85610.04 132998.00
197306.08 54392.58
432261.00
53374.58 28844.51
0.00 32399.66 12148.93
134.91
5907.87 1614.11
1445.02 0.00
45501.55 251.69 133.10
0.00 2371.31 1479.65
420.00 165048.40
1236706.51 52634.60
173619.69
120771.36 427775.00
0.00 161756.88 112997.75
2294.50
33719.71 12900.01
18728.04 0.00
64529.91 2330.50 1452.01
955.00 19847.34 31178.73
85610.04 132998.00
232333.99 54447.08
431659.13
43828.00 23585.00
14.00 34890.00 20400.00
211.00
5988.00 1783.00
1224.00 50.00
43541.00 240.00 151.00
0.00 3073.00 1555.00
0.00 197509.57
1070856.88 46486.00
139725.00
114768.00 373213.00
84.00 190234.00 222832.00
2343.00
41973.00 13673.00
15832.00 0.00
57461.00 1884.00
905.00
952.00 19358.00 24109.00
86471.00 137395.00
198498.00 95081.00
370383.00
Total:
Total:
A.State Sector of which
1. Salary
2.Administrative Expenditure
FDCC Page 22 of 109 Accounts Reckoner 2007-08 to 2015-16 BE

STATEMENT-VIIIAnalysis of Consolidated Fund
Object HeadsPlan Non-Plan Plan Non-Plan Plan Non-Plan
(Rs in Lakhs)
Plan Non-Plan
2013-14 2014-15 BE 2014-15 RE 2015-16 BE
3.Others
102
103104106117125132133
134
135136139140147154160172180
182186187188200
202
211221222
Grants-in-Aid-AssetsCreationGrants-in-Aid-GeneralContributionsSubsidiesScholarships & IncentivesModernisationCapital ExpensesSpecial DevelopmentPlanSpecial DevelopmentPlan - NABARDSDP-SCPSDP-TSPMajor WorksMinor WorksLand & BuildingsImprovementsRenewalsRoadsMachinery andEquipmentsRepairs and CarriagesHKRDPHKRDP - SCSPHKRDP - TSPMaintenanceExpenditureSalary/Wages forMaintenanceInvestmentMaterials and SuppliesDrugs and Chemicals
38180.99
15156.17 760.97
432544.91 18853.99 10443.67
489500.57 240485.51
262.91
924.00 0.00
168216.38 1174.04 1661.21
234984.18 40020.94 87044.90
1958.28
111.19 0.00 0.00 0.00
7892.51
62.81
120900.28 3487.54 3625.39
2454.50
105881.33 532.90
977476.38 2703.55
13547.47 1666.65
0.00
0.00
0.00 0.00
30842.93 0.00
869.53 0.00 0.00
12264.46 3782.78
667.16 0.00 0.00 0.00
211972.44
0.00
7.90 8760.58
14954.96
27438.78
15375.02 1058.20
145336.78 23848.01 17967.44
518004.47 100962.92
420.00
15100.14 6364.94
290984.24 450.00
2115.80 52524.14 19000.00
154313.00 5232.10
243.00 148306.85
10958.73 4475.29 7242.22
50.00
123870.65 6968.00 3822.38
1741.00
1400.01 670.25
1184879.00 4135.52
31106.06 2307.48
0.00
0.00
0.00 0.00
36323.80 0.00
1575.78 0.00 0.00
15000.00 5404.17
864.86 0.00 0.00 0.00
248030.62
0.00
0.00 11267.21 19331.36
19691.78
15502.58 1308.20
146408.89 28575.51 18268.22
466891.97 96627.93
420.00
15100.14 6364.94
203175.85 450.00
2115.80 191917.14
22724.00 117127.00
5132.10
243.00 142206.85
10958.73 4475.29 9876.96
50.00
129870.83 8711.00 3817.38
1741.00
1102.15 1160.25
1031272.00 4110.52
17726.06 2307.48
0.00
0.00
0.00 0.00
36029.16 0.00
1520.78 0.00 0.00
15000.00 5297.52
864.86 0.00 0.00 0.00
242955.63
0.00
0.00 10131.71 19331.36
50345.00
26443.00 1251.00
222982.55 31900.00 20144.00
736121.00 228392.00
0.00
1150.00 460.00
245520.00 500.00
2246.00 162280.00
25738.00 147519.00
8833.00
195.00 74932.00 16230.00
8590.00 7209.00
50.00
196110.00 13969.00
8627.00
256.00
61497.00 775.00
1097111.00 4301.00
22575.00 3229.00
0.00
0.00
0.00 0.00
37811.00 0.00
1146.00 0.00 0.00
14449.00 4590.00
871.00 0.00 0.00 0.00
263004.00
0.00
0.00 10845.00 31965.00
FDCC Page 23 of 109 Accounts Reckoner 2007-08 to 2015-16 BE
STATEMENT-VIIIAnalysis of Consolidated Fund
Object HeadsPlan Non-Plan Plan Non-Plan Plan Non-Plan
(Rs in Lakhs)
Plan Non-Plan
2013-14 2014-15 BE 2014-15 RE 2015-16 BE
3.Others
225230234240241243250251
261271292293294295296297
302364386393394395
396422423433436437438442
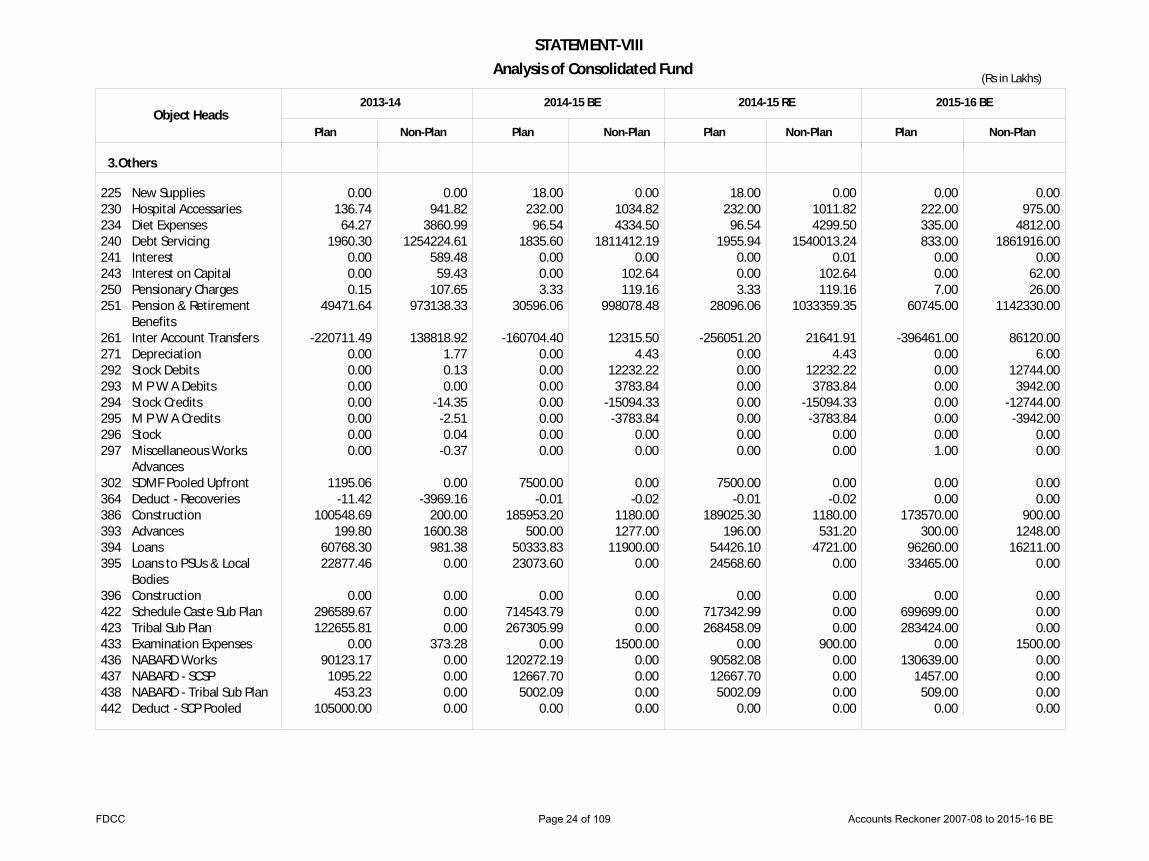
New SuppliesHospital AccessariesDiet ExpensesDebt ServicingInterestInterest on CapitalPensionary ChargesPension & RetirementBenefitsInter Account TransfersDepreciationStock DebitsM P W A DebitsStock CreditsM P W A CreditsStockMiscellaneous WorksAdvancesSDMF Pooled UpfrontDeduct - RecoveriesConstructionAdvancesLoansLoans to PSUs & LocalBodiesConstructionSchedule Caste Sub PlanTribal Sub PlanExamination ExpensesNABARD WorksNABARD - SCSPNABARD - Tribal Sub PlanDeduct - SCP Pooled
0.00 136.74
64.27 1960.30
0.00 0.00 0.15
49471.64
-220711.49 0.00 0.00 0.00 0.00 0.00 0.00 0.00
1195.06-11.42
100548.69 199.80
60768.30 22877.46
0.00 296589.67 122655.81
0.00 90123.17
1095.22 453.23
105000.00
0.00 941.82
3860.99 1254224.61
589.48 59.43
107.65 973138.33
138818.92 1.77 0.13 0.00
-14.35-2.51 0.04-0.37
0.00-3969.16
200.00 1600.38
981.38 0.00
0.00 0.00 0.00
373.28 0.00 0.00 0.00 0.00
18.00 232.00
96.54 1835.60
0.00 0.00 3.33
30596.06
-160704.40 0.00 0.00 0.00 0.00 0.00 0.00 0.00
7500.00-0.01
185953.20 500.00
50333.83 23073.60
0.00 714543.79 267305.99
0.00 120272.19
12667.70 5002.09
0.00
0.00 1034.82 4334.50
1811412.19 0.00
102.64 119.16
998078.48
12315.50 4.43
12232.22 3783.84
-15094.33-3783.84
0.00 0.00
0.00-0.02
1180.00 1277.00
11900.00 0.00
0.00 0.00 0.00
1500.00 0.00 0.00 0.00 0.00
18.00 232.00
96.54 1955.94
0.00 0.00 3.33
28096.06
-256051.20 0.00 0.00 0.00 0.00 0.00 0.00 0.00
7500.00-0.01
189025.30 196.00
54426.10 24568.60
0.00 717342.99 268458.09
0.00 90582.08 12667.70
5002.09 0.00
0.00 1011.82 4299.50
1540013.24 0.01
102.64 119.16
1033359.35
21641.91 4.43
12232.22 3783.84
-15094.33-3783.84
0.00 0.00
0.00-0.02
1180.00 531.20
4721.00 0.00
0.00 0.00 0.00
900.00 0.00 0.00 0.00 0.00
0.00 222.00 335.00 833.00
0.00 0.00 7.00
60745.00
-396461.00 0.00 0.00 0.00 0.00 0.00 0.00 1.00
0.00 0.00
173570.00 300.00
96260.00 33465.00
0.00 699699.00 283424.00
0.00 130639.00
1457.00 509.00
0.00
0.00 975.00
4812.00 1861916.00
0.00 62.00 26.00
1142330.00
86120.00 6.00
12744.00 3942.00
-12744.00-3942.00
0.00 0.00
0.00 0.00
900.00 1248.00
16211.00 0.00
0.00 0.00 0.00
1500.00 0.00 0.00 0.00 0.00
FDCC Page 24 of 109 Accounts Reckoner 2007-08 to 2015-16 BE

STATEMENT-VIIIAnalysis of Consolidated Fund
Object HeadsPlan Non-Plan Plan Non-Plan Plan Non-Plan
(Rs in Lakhs)
Plan Non-Plan
2013-14 2014-15 BE 2014-15 RE 2015-16 BE
3.Others
3577362.37 4470525.20 4537531.15 5307001.41 4440560.90 4932620.85 4777319.00 5558359.00
443UpfrontDeduct - TSP PooledUpfront
44922.00 0.00 0.00 0.00 0.00 0.00 0.00 0.00
Total: 3.Others
B.District Sector of which
Pay-OfficersPay-StaffInterim ReliefDearness AllowanceOther AllowanceMedical Allowance
1.Salary 9382.72
132381.94 13.67
17315.05 19692.58
593.11
37269.92 603193.12
69.30 87207.37 73524.58
2734.68
13180.10 136289.52
0.00 40356.60 21721.60
687.88
46297.99 674438.03
0.00 194598.73 118308.08
3025.67
13180.10 136289.52
0.00 40356.60 21721.60
687.88
46297.99 674438.03
0.00 194598.73 118308.08
3025.67
12457.10 122608.66
0.00 45928.29 32608.19
618.54
46833.81 589610.60
0.00 216492.24 161296.74
2770.80
179379.07 212235.70 212235.70 214220.78 803998.97 1036668.50 1036668.50 1017004.19
300
401
402
403
404
405
406
407
408
409
410
411
Lumpsum - ZP
Bengaluru (Urban
Bengaluru (Rural)
Chitradurga
Kolar
Shivamogga
Tumakuru
Mysuru
Chikkamagaluru
Dakshina Kannad
Hassan
Kodagu
121802.87
17138.45
8508.43
16385.95
12126.88
19098.35
26115.19
22162.33
14236.98
14864.50
17257.64
6376.45
190175.88
53188.10
19487.47
38512.02
32773.45
37471.09
59061.97
44880.37
28348.76
31296.77
38940.49
11921.49
340120.30
29877.50
12894.30
24013.29
18722.98
25185.80
35200.82
30197.58
19003.02
20425.16
23806.24
8347.10
211329.31
73951.20
25209.08
61246.49
41040.73
48579.87
79195.48
61857.62
39268.40
38349.45
53079.62
15910.09
345634.18
29887.48
12909.30
24015.49
18722.98
25192.12
35211.30
30197.58
19007.50
20425.16
23807.84
8347.10
261027.98
74021.67
25251.60
61268.49
41040.73
48582.27
79255.41
61871.68
39274.90
38349.45
53108.42
15910.09
355703.11
32333.18
13546.05
26205.00
18583.49
27330.50
37095.00
34887.00
20078.85
22524.38
26146.00
8834.49
172751.53
74037.71
25480.09
51980.21
41292.88
48440.89
79348.42
62109.80
39866.07
39667.31
55729.25
15626.42
716941.49 1334106.52 1056589.09 1586248.19 1062464.75 1651054.80 1132771.00 1524840.00
Total -1
FDCC Page 25 of 109 Accounts Reckoner 2007-08 to 2015-16 BE

STATEMENT-VIIIAnalysis of Consolidated Fund
Object HeadsPlan Non-Plan Plan Non-Plan Plan Non-Plan
(Rs in Lakhs)
Plan Non-Plan
2013-14 2014-15 BE 2014-15 RE 2015-16 BE
412
413
414
415
416
417
418
419
420
421
451
452
453
456
457
461
462
463
466
Mandya
Belagavi
Vijayapura
Dharwar
Uttara Kannada
Kalaburagi
Ballari
Bidar
Raichur
Yadgir
Davanagere
Ramanagara
Chickaballapur
Chamarajanagar
Udupi
Bagalkot
Gadag
Haveri
Koppal
16115.31
39577.62
22567.77
13563.29
18472.16
26742.01
21310.65
15195.15
22202.70
10806.33
17607.92
10078.45
12596.02
10563.88
8972.12
18432.29
10303.82
15427.01
15153.98
35083.83
101327.91
40592.52
30012.88
38139.04
53677.99
34895.06
36845.41
26213.84
20546.53
40534.26
19842.84
23051.31
17741.88
21378.07
30714.61
21506.74
32073.31
21122.97
23093.43
60923.00
33212.79
20793.33
26942.49
38863.14
29597.75
22101.97
30831.18
15730.54
23833.69
14536.17
16967.60
14381.74
11846.86
27711.13
14374.70
22125.83
20927.66
45478.01
138711.79
54511.37
40685.34
50031.04
60495.77
44910.02
53046.11
35498.95
18940.48
51075.81
25851.20
32165.91
23840.71
24730.15
42530.73
27638.83
38830.07
28234.37
23093.43
60923.00
33318.16
20793.33
26964.49
38869.74
29630.74
22137.18
30831.18
15730.54
23874.48
14580.79
16967.60
14381.74
11848.06
27732.79
14374.70
22127.11
20927.66
45478.01
138760.45
56477.68
40685.34
50056.04
60495.77
44910.02
53074.75
35498.95
25778.25
54741.81
25933.15
32165.91
23840.71
26894.10
42568.23
27638.83
38832.67
28237.25
24411.69
69787.40
34909.75
22527.27
25650.00
41693.00
34475.00
25450.00
33351.63
16872.00
26227.45
15193.49
17615.00
15428.60
12365.00
31427.20
15810.70
23181.50
23127.27
45972.53
104946.60
55808.53
38268.30
46941.28
64063.38
46763.59
50414.55
36688.66
24438.09
53165.47
26372.02
31845.51
23059.90
26853.59
44315.76
28846.76
40440.75
29274.15
Less Salary 179379.07 212235.70 212235.70 214220.78 803998.97 1036668.50 1036668.50 1017004.19
Total -2 537562.42 844353.39 850229.05 918550.22 530107.55 549579.69 614386.30 507835.81
Consolidated Fund ( Total-A+Total B) 4425955.84 6638913.99 5761829.75 8038986.72 5688632.54 7594912.39 6090623 8162820
(P+NP) 11064869.83 13800816.47 13283544.93 14253443.00
FDCC Page 26 of 109 Accounts Reckoner 2007-08 to 2015-16 BE

STATEMENT-IXAnalysis of Revenue Expenditure
Object HeadsPlan Non-Plan Plan Non-Plan Plan Non-Plan Plan Non-Plan
(Rs in Lakhs)
Plan Non-Plan
2008-09 2009-10 2010-11 2011-12 2012-13
728472.70 2357238.68 879700.05 2736555.22 1110476.33 3045761.49 1362426.64 3611573.12 1499405.47 4276776.48
1. Salary
2.Administrative Expenditure
3.Others
25047.88
16827.36
382283.21
63625.25
32449.39
16182.42
407023.61
80993.18
51076.48
20260.96
469013.25
83599.96
65776.06
25100.64
532299.54
88017.54
82622.48
26130.24
626647.23
120290.29
002003004011014020
015021
041051052053
060071195
001032
059100
101
Pay-OfficersPay-StaffInterim ReliefDearness AllowanceOther AllowanceMedical Allowance
Subsidiary ExpensesReimbursement ofMedical ExpensesTravel ExpensesGeneral ExpensesTelephone ChargesPurchase of Furnitureand Fixture for OfficeCompensatory CostBuilding ExpensesTransport Expenses
Consolidated SalariesGrants for Creation ofCapital AssetsOther ExpensesFinancialAssistance/ReliefGrants-in-Aid-Salaries
4733.65 13338.10
0.00 4988.51 1987.62
0.00
7928.46 0.00
394.03 7248.74
64.72 22.24
0.00 524.81 644.36
0.00 0.00
292393.05 102491.94
70345.75
32042.27 240786.99
0.00 70544.97 38908.98
0.00
11489.71 0.00
8944.40 19174.55
883.02 215.47
0.00 8783.54
14134.56
805.63 0.00
24842.57 218096.15
116384.37
6028.75 14944.38
0.00 9075.22 2340.06
60.98
4721.08 140.69
414.98 9569.49
92.96 28.07
0.00 577.67 637.48
0.00 0.00
341963.35 100941.27
75775.86
34857.07 234783.95
0.00 102412.00
33811.80 1158.79
23142.31 5965.23
10795.20 17807.90
904.96 294.07
0.00 8983.81
13099.70
1721.00 0.00
30111.47 392585.49
147732.49
11840.41 19165.26
0.00 15932.39
4017.28 121.14
4668.38 302.43
352.22 13271.69
84.92 69.23
0.00 925.63 586.46
7.92 0.00
322854.19 153810.28
115463.87
49591.73 231396.08
0.00 146258.70
40070.66 1696.08
17088.41 7729.06
11830.80 21256.22
986.38 303.50
0.00 9512.99
14892.60
1538.43 0.00
61047.77 241962.24
199236.31
18291.15 17549.50
1136.61 23151.45
5541.26 106.09
2958.83 341.56
419.36 19105.04
93.07 42.33
0.00 1450.31
690.14
300.50 144715.37
401975.61 64448.04
129637.51
61517.92 225817.38
11319.14 187893.97
44378.43 1372.70
16958.51 8351.86
12964.83 21176.26
1039.73 295.64
0.00 10438.42 16792.29
64374.71 105070.43
84256.82 53287.64
283514.63
24743.82 33688.64
820.54 14579.34
8611.47 178.67
3435.44 515.21
455.75 19040.97
106.25 75.85
0.00 1418.12 1082.65
3.26 100492.17
375527.28 85902.55
108279.46
77786.05 400098.57
7095.92 70401.32 69171.65
2093.72
20799.30 8498.50
16596.00 40119.48
1116.28 313.20
23.84 13135.17 19688.52
90698.79 77427.49
96644.58 140277.57
321454.86
Total:
Total:
A.State Sector of which
1. Salary
2.Administrative Expenditure
FDCC Page 27 of 109 Accounts Reckoner 2007-08 to 2015-16 BE

STATEMENT-IXAnalysis of Revenue Expenditure
Object HeadsPlan Non-Plan Plan Non-Plan Plan Non-Plan Plan Non-Plan
(Rs in Lakhs)
Plan Non-Plan
2008-09 2009-10 2010-11 2011-12 2012-13
3.Others
102
103104106117125132133
135136139147172180
182200
221222225230234240241243250251
261
Grants-in-Aid-AssetsCreationGrants-in-Aid-GeneralContributionsSubsidiesScholarships & IncentivesModernisationCapital ExpensesSpecial DevelopmentPlanSDP-SCPSDP-TSPMajor WorksLand & BuildingsRoadsMachinery andEquipmentsRepairs and CarriagesMaintenanceExpenditureMaterials and SuppliesDrugs and ChemicalsNew SuppliesHospital AccessariesDiet ExpensesDebt ServicingInterestInterest on CapitalPensionary ChargesPension & RetirementBenefitsInter Account Transfers
0.00
0.00 1294.95
46440.35 2204.17 3144.75
482.76 0.00
0.00 0.00
25373.91 603.32
40312.75 1177.54
0.00 4281.82
6728.54 883.12
1.00 18.17 13.97
0.00 0.00 0.00 0.00
19863.47
13610.65
0.00
0.00 185224.42 293474.73
1991.33 8405.19 1548.77
0.00
0.00 0.00
4598.49 1229.33
0.00 1633.20
323.73 58360.45
6747.13 13103.10
0.00 778.59
1419.59 453248.59
0.00 69.72 62.74
477532.77
40736.08
0.00
0.00 893.78
42940.67 4755.59 6684.69
450.30 23824.82
0.00 0.00
23099.74 850.25
23010.26 717.81
0.01 7125.92
2365.78 1227.57
0.00 49.57 16.89
0.00 0.00 0.00 0.00
30462.09
9700.89
0.00
0.00 15296.82
368873.60 1874.58 9574.02 1160.04
0.00
0.00 0.00
5094.29 1325.68
0.00 1399.10
287.95 54804.73
6336.20 12368.41
0.00 910.00
1677.63 521369.47
0.00 75.87 74.11
402545.81
271005.32
13141.17
0.00 651.11
52864.88 10182.68
6069.36 1777.77
34298.42
0.00 0.00
17939.92 777.97
34934.79 2499.51
0.00 7055.07
4527.09 1106.71
1.00 49.40 21.39
0.00 0.00 0.00 0.00
27850.45
5337.98
62574.85
0.00 80443.01
577462.15 1834.56 7157.12 1387.83
0.00
0.00 0.00
9088.54 1357.72 9806.90 1688.33
343.46 64244.11
7257.69 10565.59
0.00 786.27
3001.26 575082.80
0.00 75.81 83.64
474328.57
100870.10
2716.92
0.00 562.15
89103.15 9580.50 8584.25 1148.45
52668.63
0.00 0.00
20276.84 1706.65 6691.11 1019.78
0.00 18041.81
2503.72 790.78
1.98 83.47 25.83
355.00 0.00 0.00 0.00
41374.90
8296.00
0.00
0.00 215674.54 649899.21
2260.18 7056.85 2400.23
0.00
0.00 0.00
14262.64 1306.09 9998.88 2271.79
334.44 121708.05
5786.38 12149.39
0.00 861.69
2860.38 659756.93
356.07 69.27 89.92
611244.55
79784.79
38246.74
4756.17 1209.82
219954.65 13779.28
9668.38 889.40
55461.80
607.79 368.68
21339.84 1065.41
17278.23 1181.72
0.00 3149.92
1165.42 3800.19
13.35 94.99 45.88
193.12 0.00 0.00 0.00
30354.31
6480.22
900.00
2166.95 11034.59
850906.33 2602.33
12840.34 2633.46
0.02
0.00 0.00
24026.27 1246.47
15937.79 3257.86
400.43 179995.52
7875.18 14206.88
0.00 893.07
3540.69 844616.68
626.57 46.01
224.55 787778.64
35015.27
FDCC Page 28 of 109 Accounts Reckoner 2007-08 to 2015-16 BE

STATEMENT-IXAnalysis of Revenue Expenditure
Object HeadsPlan Non-Plan Plan Non-Plan Plan Non-Plan Plan Non-Plan
(Rs in Lakhs)
Plan Non-Plan
2008-09 2009-10 2010-11 2011-12 2012-13
3.Others
686597.46 1911330.22 831068.24 2248538.43 1039138.89 2493148.28 1271549.94 2991256.04 1390652.75 3529838.96
271292293294295296297
386422423433436442
443
DepreciationStock DebitsM P W A DebitsStock CreditsM P W A CreditsStockMiscellaneous WorksAdvancesConstructionSchedule Caste Sub PlanTribal Sub PlanExamination ExpensesNABARD WorksDeduct - SCP PooledUpfrontDeduct - TSP PooledUpfront
0.00 0.00 0.00 0.00 0.00 0.00 0.00
534.65 37788.14 16608.69
0.00 0.00 0.00
0.00
3.70 0.74 3.39
-148.62-196.98
-0.04-1.50
0.01 0.00 0.00
1052.85 0.00 0.00
0.00
0.00 0.00 0.00 0.00 0.00 0.00 0.00
199.53 98652.52 35359.08
0.00 0.00 0.00
0.00
1.93 0.68
10.20-40.23-31.02
0.00-0.79
0.00 0.00 0.00
393.58 0.00 0.00
0.00
0.00 0.00 0.00 0.00 0.00 0.00 0.00
474.91 153262.32
69826.51 0.00
2352.22 0.00
0.00
2.45 2.01 1.33
-39.78-390.24
-0.37 0.00
0.00 0.00 0.00
347.82 0.00 0.00
0.00
0.00 0.00 0.00 0.00 0.00 0.00 0.00
340.99 184471.84
75408.03 0.00
4720.13 0.00
0.00
1.68 2.56 0.00
-40.51-28.19
-0.10-45.00
0.00 0.90 0.00
728.20 0.00 0.00
0.00
0.00 0.00 0.00 0.00 0.00 0.00 0.00
322.02 108209.37
47072.53 0.00
3738.80 92500.00
37500.00
1.61 14.72
0.00-63.62-20.95
0.00-1.11
0.00 1.09 0.72
631.31 0.00 0.00
0.00
Total: 3.Others
B.District Sector of which
Pay-OfficersPay-StaffInterim ReliefDearness AllowanceOther AllowanceMedical Allowance
2187.14 34730.04
13.83 6821.42 5407.70
0.00
13533.90 330215.20
83.55 81642.15 31862.09
0.00
1.Salary 2548.41
37859.79 6.70
11121.69 5881.33
106.16
13939.08 301641.67
60.24 115390.99
29561.33 1155.75
3062.33 39510.16
0.24 17186.20
6313.60 157.00
16269.77 318005.77
7.31 178235.57
34575.89 1619.04
3263.20 44832.40
1496.43 22983.21 10221.01
153.91
16596.38 311004.89
14305.13 218882.48
37753.01 1524.36
7142.22 120425.07
1039.69 9529.70
16979.60 480.35
30174.89 575405.25
7955.71 63897.60 61775.93
2416.10
49160.13 57524.08 66229.53 82950.16 155596.63 457336.89 461749.06 548713.35 600066.25 741625.48
201 GIA for ZP 208.50 0.00 0.00 0.00 0.00 0.00 0.00 0.00 0.00 0.00
324558.11 755659.85 350568.02 786868.29 408266.57 838879.54 494247.22 1043259.77 621762.50 1231381.20
Total -1
FDCC Page 29 of 109 Accounts Reckoner 2007-08 to 2015-16 BE

STATEMENT-IXAnalysis of Revenue Expenditure
Object HeadsPlan Non-Plan Plan Non-Plan Plan Non-Plan Plan Non-Plan
(Rs in Lakhs)
Plan Non-Plan
2008-09 2009-10 2010-11 2011-12 2012-13
300
401
402
403
404
405
406
407
408
409
410
411
412
413
414
415
416
417
418
419
420
421
451
Lumpsum - ZP
Bengaluru (Urban
Bengaluru (Rural)
Chitradurga
Kolar
Shivamogga
Tumakuru
Mysuru
Chikkamagaluru
Dakshina Kannad
Hassan
Kodagu
Mandya
Belagavi
Vijayapura
Dharwar
Uttara Kannada
Kalaburagi
Ballari
Bidar
Raichur
Yadgir
Davanagere
37790.94
9747.55
5924.21
10505.36
7640.15
11045.65
17703.72
11842.65
8843.05
8998.57
10470.64
4603.85
10406.46
21082.10
10883.58
6969.97
10053.54
18832.63
11108.66
9086.07
12110.28
0.00
10490.48
17524.38
39374.32
14638.14
27327.10
23196.31
25228.90
40521.84
31592.13
20502.85
21235.66
31629.44
7882.31
25558.36
63998.73
25340.40
21967.82
28276.36
62695.83
25585.56
27322.40
17601.72
0.00
26622.58
31649.64
10263.98
6242.53
11079.81
8460.48
13727.20
18265.17
13606.40
9268.66
9797.34
12197.03
4719.24
11212.48
22843.36
13200.62
8012.96
11012.46
20314.40
12601.80
9596.21
13558.37
0.00
11417.97
22695.18
38020.18
14672.83
26439.45
21298.13
26165.59
42099.99
32040.92
21132.27
21546.36
32982.81
8306.41
26556.53
67217.45
28300.06
21749.32
33152.20
65104.62
22649.48
29032.39
18924.39
0.00
26615.64
24272.15
13759.97
6893.85
13513.45
10181.05
16010.02
22468.32
16117.51
10760.41
11234.32
13982.87
4869.98
13545.39
27006.21
16665.87
8829.70
12382.68
19475.62
14876.55
12581.02
15766.00
8094.82
14264.61
13590.95
41341.32
14881.60
28566.71
23903.57
27986.47
46427.81
34317.02
22438.24
23340.64
35570.14
9152.71
29084.63
73146.79
29985.58
24543.60
31050.44
52288.51
27221.09
31804.91
20316.49
20766.69
29133.29
93163.75
22633.88
6690.08
13409.12
9654.12
14398.59
22258.82
16554.84
11042.75
10724.52
13951.27
5429.50
13310.45
30124.23
16724.53
9321.22
14947.35
20584.71
15473.41
12136.28
17674.76
9231.58
13932.34
116132.66
46781.60
16966.16
32253.67
27642.47
31459.99
50730.52
40438.40
25999.23
26304.60
38270.29
10679.66
31738.85
86238.65
34550.39
26471.96
36309.37
55373.41
30331.21
34702.96
23450.08
19533.99
34499.39
121802.87
17138.45
8508.43
16385.95
12126.88
19098.35
26115.19
22162.33
14236.98
14864.50
17257.64
6376.45
16115.31
39577.62
22567.77
13563.29
18472.16
26742.01
21310.65
15195.15
22202.70
10806.33
17607.92
190175.88
53188.10
19487.47
38512.02
32773.45
37471.09
59061.97
44880.37
28348.76
31296.77
38940.49
11921.49
35083.83
101327.91
40592.52
30012.88
38139.04
53677.99
34895.06
36845.41
26213.84
20546.53
40534.26
FDCC Page 30 of 109 Accounts Reckoner 2007-08 to 2015-16 BE
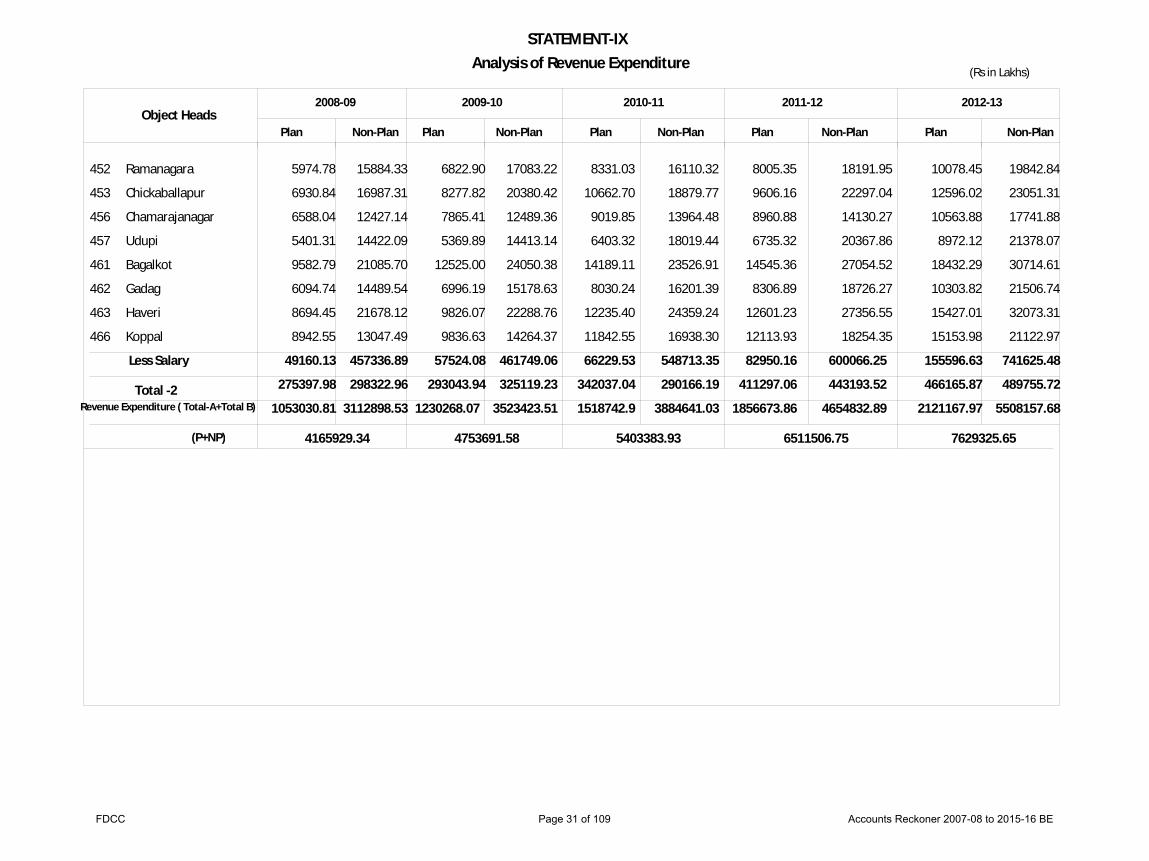
STATEMENT-IXAnalysis of Revenue Expenditure
Object HeadsPlan Non-Plan Plan Non-Plan Plan Non-Plan Plan Non-Plan
(Rs in Lakhs)
Plan Non-Plan
2008-09 2009-10 2010-11 2011-12 2012-13
452
453
456
457
461
462
463
466
Ramanagara
Chickaballapur
Chamarajanagar
Udupi
Bagalkot
Gadag
Haveri
Koppal
5974.78
6930.84
6588.04
5401.31
9582.79
6094.74
8694.45
8942.55
15884.33
16987.31
12427.14
14422.09
21085.70
14489.54
21678.12
13047.49
6822.90
8277.82
7865.41
5369.89
12525.00
6996.19
9826.07
9836.63
17083.22
20380.42
12489.36
14413.14
24050.38
15178.63
22288.76
14264.37
8331.03
10662.70
9019.85
6403.32
14189.11
8030.24
12235.40
11842.55
16110.32
18879.77
13964.48
18019.44
23526.91
16201.39
24359.24
16938.30
8005.35
9606.16
8960.88
6735.32
14545.36
8306.89
12601.23
12113.93
18191.95
22297.04
14130.27
20367.86
27054.52
18726.27
27356.55
18254.35
10078.45
12596.02
10563.88
8972.12
18432.29
10303.82
15427.01
15153.98
19842.84
23051.31
17741.88
21378.07
30714.61
21506.74
32073.31
21122.97
Less Salary 49160.13 57524.08 66229.53 82950.16 155596.63 457336.89 461749.06 548713.35 600066.25 741625.48
Total -2 275397.98 293043.94 342037.04 411297.06 466165.87 298322.96 325119.23 290166.19 443193.52 489755.72 Revenue Expenditure ( Total-A+Total B) 1053030.81 3112898.53 1230268.07 3523423.51 1518742.9 3884641.03 1856673.86 4654832.89 2121167.97 5508157.68
(P+NP) 4165929.34 4753691.58 5403383.93 6511506.75 7629325.65
FDCC Page 31 of 109 Accounts Reckoner 2007-08 to 2015-16 BE

STATEMENT-IXAnalysis of Revenue Expenditure
Object HeadsPlan Non-Plan Plan Non-Plan Plan Non-Plan
(Rs in Lakhs)
Plan Non-Plan
2013-14 2014-15 BE 2014-15 RE 2015-16 BE
1980042.09 4887866.69 2686707.89 5746188.69 2715724.67 5445518.32 2889560.00 5997797.00
1. Salary
2.Administrative Expenditure
3.Others
94784.11
35059.67
700733.44
133231.35
121693.84
43834.24
958701.98
186697.32
125043.75
58381.71
825269.83
185629.09
122483.00
56976.00
903161.00
176130.00
002003004011014020
015021
041050051052053
060071195
001032
059
Pay-OfficersPay-StaffInterim ReliefDearness AllowanceOther AllowanceMedical Allowance
Subsidiary ExpensesReimbursement ofMedical ExpensesTravel ExpensesOffice ExpensesGeneral ExpensesTelephone ChargesPurchase of Furnitureand Fixture for OfficeCompensatory CostBuilding ExpensesTransport Expenses
Consolidated SalariesGrants for Creation ofCapital AssetsOther Expenses
36541.39 28618.57
0.00 19013.52 10464.78
145.85
3591.82 579.75
469.70 0.00
27860.08 137.94
93.93
0.00 1473.53
852.92
4.84 169769.90
543589.46
105245.25 420597.66
0.00 89614.97 83036.42
2239.14
24219.03 10372.58
17810.93 0.00
41677.97 1292.03
909.19
45.01 14209.31 22695.30
62940.82 100122.89
116071.55
51895.77 26773.56
0.00 31458.53 11437.01
128.97
5715.11 1574.43
1316.44 0.00
31201.98 251.69
96.10
0.00 2352.35 1326.14
420.00 168048.40
1058552.71
120182.86 426622.28
0.00 161414.32 248195.99
2286.53
31121.69 12588.46
19048.19 0.00
70392.08 2340.50 1230.01
955.00 20107.36 28914.03
85610.04 132998.00
197306.08
53023.43 27851.40
0.00 32036.72 12002.24
129.96
5907.87 1574.53
1421.47 0.00
45252.45 251.69 133.10
0.00 2365.95 1474.65
420.00 165048.40
1080316.45
120679.60 427639.16
0.00 161695.43 112961.85
2293.79
33719.71 12894.47
18725.92 0.00
64527.27 2330.50 1452.01
955.00 19845.48 31178.73
85610.04 132998.00
232333.99
43700.00 23424.00
14.00 34792.00 20348.00
205.00
5988.00 1765.00
1209.00 50.00
42951.00 240.00 151.00
0.00 3067.00 1555.00
0.00 197509.57
973769.88
114681.00 373092.00
84.00 190163.00 222800.00
2341.00
41973.00 13666.00
15829.00 0.00
57457.00 1884.00
905.00
952.00 19355.00 24109.00
86471.00 137395.00
198498.00
Total:
Total:
A.State Sector of which
1. Salary
2.Administrative Expenditure
FDCC Page 32 of 109 Accounts Reckoner 2007-08 to 2015-16 BE

STATEMENT-IXAnalysis of Revenue Expenditure
Object HeadsPlan Non-Plan Plan Non-Plan Plan Non-Plan
(Rs in Lakhs)
Plan Non-Plan
2013-14 2014-15 BE 2014-15 RE 2015-16 BE
3.Others
100
101102
103104106117125132133
135136139147172180
182186187188200
202
221222
FinancialAssistance/ReliefGrants-in-Aid-SalariesGrants-in-Aid-AssetsCreationGrants-in-Aid-GeneralContributionsSubsidiesScholarships & IncentivesModernisationCapital ExpensesSpecial DevelopmentPlanSDP-SCPSDP-TSPMajor WorksLand & BuildingsRoadsMachinery andEquipmentsRepairs and CarriagesHKRDPHKRDP - SCSPHKRDP - TSPMaintenanceExpenditureSalary/Wages forMaintenanceMaterials and SuppliesDrugs and Chemicals
51567.46
113570.70 38180.99
15156.17 760.97
432544.91 18853.99
9451.80 4232.00
96716.50
0.00 0.00
20802.35 1546.19 9206.69 1524.60
0.00 0.00 0.00 0.00
7179.21
62.81
3486.36 3625.39
87592.78
344499.82 2454.50
105881.33 532.90
977476.38 2703.55
13547.47 1576.51
0.00
0.00 0.00
30842.93 869.53
12264.46 3782.78
423.14 0.00 0.00 0.00
211972.44
0.00
8754.63 14954.96
35111.04
161430.77 27438.78
15375.02 1058.20
145336.78 23848.01 16417.44 57172.44 46467.37
2934.59 1278.04
74854.26 1739.80
14600.00 3277.10
0.00 47165.05
1074.93 370.89
6991.72
50.00
6951.00 3822.38
54250.58
432261.00 1741.00
1400.01 670.25
1184879.00 4135.52
31106.06 2007.48
0.00
0.00 0.00
36323.80 1575.78
15000.00 5404.17
513.90 0.00 0.00 0.00
248030.62
0.00
11260.21 19331.36
52549.04
173619.69 19691.78
15502.58 1308.20
146408.89 28575.51 16718.22 55772.44 43607.37
2934.59 1278.04
40904.37 1739.80
13600.00 3277.10
0.00 41065.05
1074.93 370.89
9326.46
50.00
8694.00 3817.38
54305.08
431659.13 1741.00
1102.15 1160.25
1031272.00 4110.52
17726.06 2007.48
0.00
0.00 0.00
36029.16 1520.78
15000.00 5297.52
513.90 0.00 0.00 0.00
242955.63
0.00
10124.71 19331.36
46346.00
139725.00 50345.00
26443.00 1251.00
222982.55 31900.00 18844.00
101825.00 105159.00
245.00 98.00
43285.00 1475.00
16500.00 4640.00
0.00 44932.00
9830.00 4990.00 6388.00
50.00
13964.00 8627.00
95061.00
370383.00 256.00
61497.00 775.00
1097111.00 4301.00
22575.00 1929.00
0.00
0.00 0.00
37811.00 1146.00
14449.00 4590.00
506.00 0.00 0.00 0.00
263004.00
0.00
10837.00 31965.00
FDCC Page 33 of 109 Accounts Reckoner 2007-08 to 2015-16 BE

STATEMENT-IXAnalysis of Revenue Expenditure
Object HeadsPlan Non-Plan Plan Non-Plan Plan Non-Plan
(Rs in Lakhs)
Plan Non-Plan
2013-14 2014-15 BE 2014-15 RE 2015-16 BE
3.Others
225230234240241243250251
261271292293294295297
302364386422423433436437438442
443
New SuppliesHospital AccessariesDiet ExpensesDebt ServicingInterestInterest on CapitalPensionary ChargesPension & RetirementBenefitsInter Account TransfersDepreciationStock DebitsM P W A DebitsStock CreditsM P W A CreditsMiscellaneous WorksAdvancesSDMF Pooled UpfrontDeduct - RecoveriesConstructionSchedule Caste Sub PlanTribal Sub PlanExamination ExpensesNABARD WorksNABARD - SCSPNABARD - Tribal Sub PlanDeduct - SCP PooledUpfrontDeduct - TSP PooledUpfront
0.00 136.74
64.27 138.78
0.00 0.00 0.00
49471.64
-83445.44 0.00 0.00 0.00 0.00 0.00 0.00
1195.06 0.00
410.66 169315.88
73359.52 0.00
6455.91 0.00 0.00
57515.00
33747.00
0.00 941.82
3860.99 839150.17
589.48 59.43 98.30
973138.33
138818.92 1.77 0.13 0.00
-14.35-2.51 0.00
0.00-2379.23
0.00 0.00 0.00
373.28 0.00 0.00 0.00 0.00
0.00
18.00 232.00
96.54 47.26
0.00 0.00 3.13
30596.06
-13661.40 0.00 0.00 0.00 0.00 0.00 0.00
7500.00 0.00
600.00 406519.33 149087.17
0.00 15277.00
2190.00 888.00
0.00
0.00
0.00 1034.82 4334.50
1120367.81 0.00
102.64 108.46
998078.48
12315.50 4.43
12232.22 3783.84
-15094.33-3783.84
0.00
0.00 0.00 0.00 0.00 0.00
1500.00 0.00 0.00 0.00 0.00
0.00
18.00 232.00
96.54 167.60
0.00 0.00 3.13
28096.06
-2994.20 0.00 0.00 0.00 0.00 0.00 0.00
7500.00 0.00
835.00 408737.68 149941.22
0.00 8917.00 2190.00
888.00 0.00
0.00
0.00 1011.82 4299.50
1049254.63 0.01
102.64 108.46
1033359.35
21641.91 4.43
12232.22 3783.84
-15094.33-3783.84
0.00
0.00 0.00 0.00 0.00 0.00
900.00 0.00 0.00 0.00 0.00
0.00
0.00 222.00 335.00
31.00 0.00 0.00 4.00
60745.00
-16418.00 0.00 0.00 0.00 0.00 0.00 0.00
0.00 0.00
635.00 407842.00 176581.00
0.00 9000.00
0.00 0.00 0.00
0.00
0.00 975.00
4812.00 1242127.00
0.00 62.00 14.00
1142330.00
86120.00 6.00
12744.00 3942.00
-12744.00-3942.00
0.00
0.00 0.00 0.00 0.00 0.00
1500.00 0.00 0.00 0.00 0.00
0.00
FDCC Page 34 of 109 Accounts Reckoner 2007-08 to 2015-16 BE
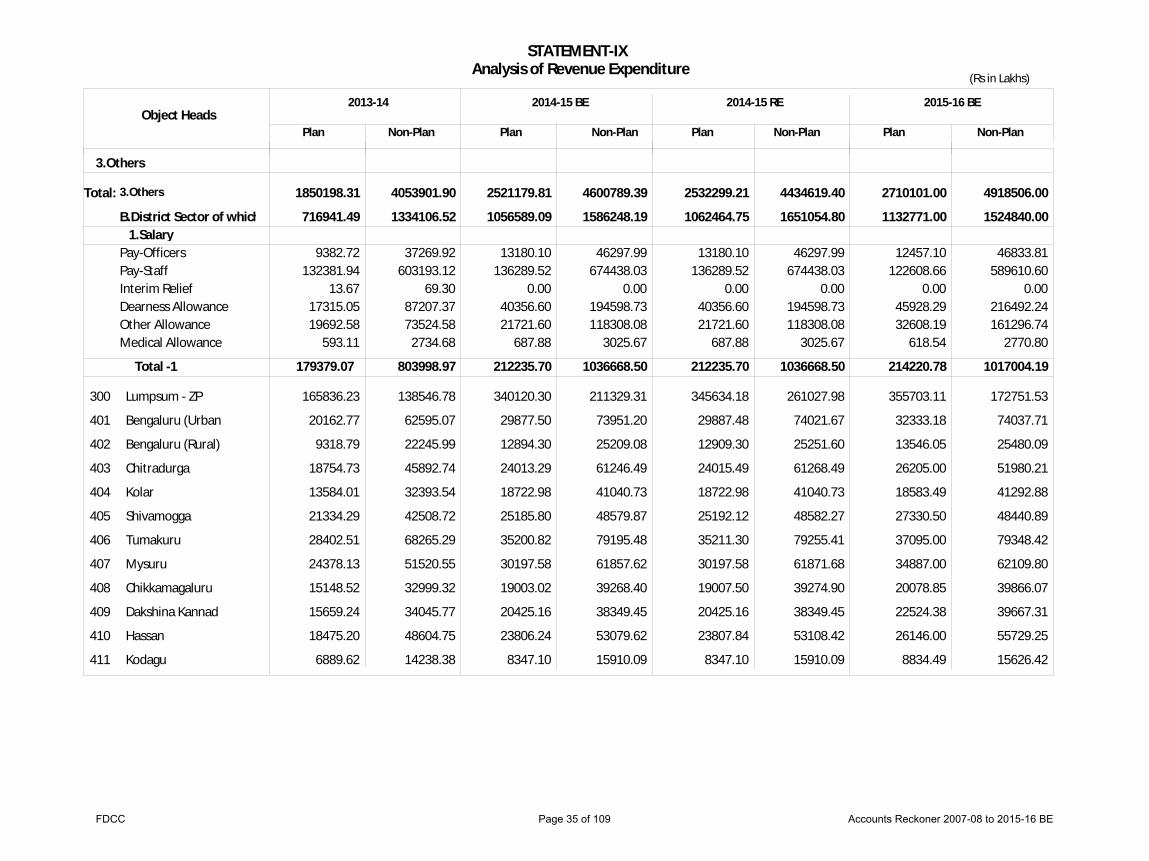
STATEMENT-IXAnalysis of Revenue Expenditure
Object HeadsPlan Non-Plan Plan Non-Plan Plan Non-Plan
(Rs in Lakhs)
Plan Non-Plan
2013-14 2014-15 BE 2014-15 RE 2015-16 BE
3.Others
1850198.31 4053901.90 2521179.81 4600789.39 2532299.21 4434619.40 2710101.00 4918506.00Total: 3.Others
B.District Sector of which
Pay-OfficersPay-StaffInterim ReliefDearness AllowanceOther AllowanceMedical Allowance
1.Salary 9382.72
132381.94 13.67
17315.05 19692.58
593.11
37269.92 603193.12
69.30 87207.37 73524.58
2734.68
13180.10 136289.52
0.00 40356.60 21721.60
687.88
46297.99 674438.03
0.00 194598.73 118308.08
3025.67
13180.10 136289.52
0.00 40356.60 21721.60
687.88
46297.99 674438.03
0.00 194598.73 118308.08
3025.67
12457.10 122608.66
0.00 45928.29 32608.19
618.54
46833.81 589610.60
0.00 216492.24 161296.74
2770.80
179379.07 212235.70 212235.70 214220.78 803998.97 1036668.50 1036668.50 1017004.19
300
401
402
403
404
405
406
407
408
409
410
411
Lumpsum - ZP
Bengaluru (Urban
Bengaluru (Rural)
Chitradurga
Kolar
Shivamogga
Tumakuru
Mysuru
Chikkamagaluru
Dakshina Kannad
Hassan
Kodagu
165836.23
20162.77
9318.79
18754.73
13584.01
21334.29
28402.51
24378.13
15148.52
15659.24
18475.20
6889.62
138546.78
62595.07
22245.99
45892.74
32393.54
42508.72
68265.29
51520.55
32999.32
34045.77
48604.75
14238.38
340120.30
29877.50
12894.30
24013.29
18722.98
25185.80
35200.82
30197.58
19003.02
20425.16
23806.24
8347.10
211329.31
73951.20
25209.08
61246.49
41040.73
48579.87
79195.48
61857.62
39268.40
38349.45
53079.62
15910.09
345634.18
29887.48
12909.30
24015.49
18722.98
25192.12
35211.30
30197.58
19007.50
20425.16
23807.84
8347.10
261027.98
74021.67
25251.60
61268.49
41040.73
48582.27
79255.41
61871.68
39274.90
38349.45
53108.42
15910.09
355703.11
32333.18
13546.05
26205.00
18583.49
27330.50
37095.00
34887.00
20078.85
22524.38
26146.00
8834.49
172751.53
74037.71
25480.09
51980.21
41292.88
48440.89
79348.42
62109.80
39866.07
39667.31
55729.25
15626.42
716941.49 1334106.52 1056589.09 1586248.19 1062464.75 1651054.80 1132771.00 1524840.00
Total -1
FDCC Page 35 of 109 Accounts Reckoner 2007-08 to 2015-16 BE

STATEMENT-IXAnalysis of Revenue Expenditure
Object HeadsPlan Non-Plan Plan Non-Plan Plan Non-Plan
(Rs in Lakhs)
Plan Non-Plan
2013-14 2014-15 BE 2014-15 RE 2015-16 BE
412
413
414
415
416
417
418
419
420
421
451
452
453
456
457
461
462
463
466
Mandya
Belagavi
Vijayapura
Dharwar
Uttara Kannada
Kalaburagi
Ballari
Bidar
Raichur
Yadgir
Davanagere
Ramanagara
Chickaballapur
Chamarajanagar
Udupi
Bagalkot
Gadag
Haveri
Koppal
18343.06
46109.95
23750.92
14804.53
20759.36
29727.34
23513.13
15417.61
24734.64
11323.56
18913.23
11051.71
12841.09
11361.95
9830.07
21994.44
11658.64
17595.86
15266.36
40081.07
117585.48
48756.37
32492.97
46319.68
51083.59
42014.53
43594.62
30277.53
23158.93
48460.28
23337.05
28514.83
21050.95
25975.47
36027.36
24211.96
34501.67
22775.59
23093.43
60923.00
33212.79
20793.33
26942.49
38863.14
29597.75
22101.97
30831.18
15730.54
23833.69
14536.17
16967.60
14381.74
11846.86
27711.13
14374.70
22125.83
20927.66
45478.01
138711.79
54511.37
40685.34
50031.04
60495.77
44910.02
53046.11
35498.95
18940.48
51075.81
25851.20
32165.91
23840.71
24730.15
42530.73
27638.83
38830.07
28234.37
23093.43
60923.00
33318.16
20793.33
26964.49
38869.74
29630.74
22137.18
30831.18
15730.54
23874.48
14580.79
16967.60
14381.74
11848.06
27732.79
14374.70
22127.11
20927.66
45478.01
138760.45
56477.68
40685.34
50056.04
60495.77
44910.02
53074.75
35498.95
25778.25
54741.81
25933.15
32165.91
23840.71
26894.10
42568.23
27638.83
38832.67
28237.25
24411.69
69787.40
34909.75
22527.27
25650.00
41693.00
34475.00
25450.00
33351.63
16872.00
26227.45
15193.49
17615.00
15428.60
12365.00
31427.20
15810.70
23181.50
23127.27
45972.53
104946.60
55808.53
38268.30
46941.28
64063.38
46763.59
50414.55
36688.66
24438.09
53165.47
26372.02
31845.51
23059.90
26853.59
44315.76
28846.76
40440.75
29274.15
Less Salary 179379.07 212235.70 212235.70 214220.78 803998.97 1036668.50 1036668.50 1017004.19
Total -2 537562.42 844353.39 850229.05 918550.22 530107.55 549579.69 614386.30 507835.81
FDCC Page 36 of 109 Accounts Reckoner 2007-08 to 2015-16 BE
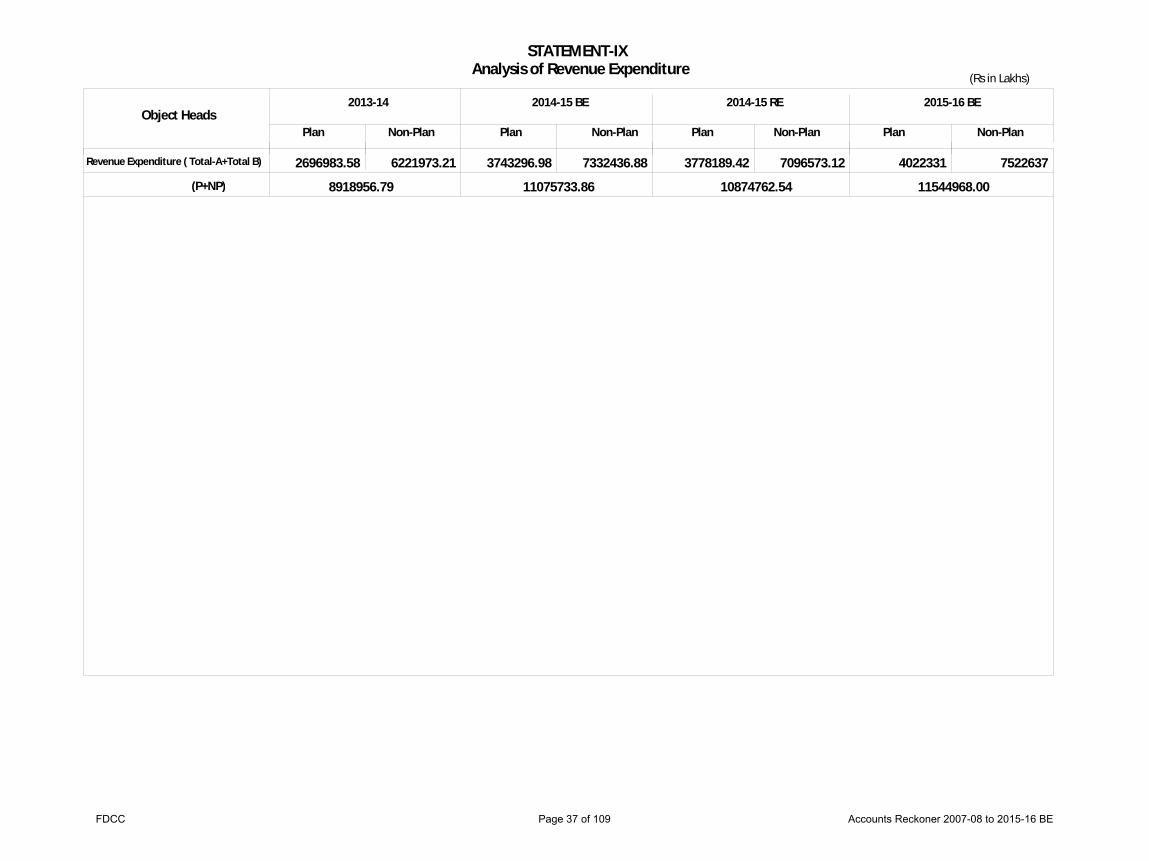
STATEMENT-IXAnalysis of Revenue Expenditure
Object HeadsPlan Non-Plan Plan Non-Plan Plan Non-Plan
(Rs in Lakhs)
Plan Non-Plan
2013-14 2014-15 BE 2014-15 RE 2015-16 BE
Revenue Expenditure ( Total-A+Total B) 2696983.58 6221973.21 3743296.98 7332436.88 3778189.42 7096573.12 4022331 7522637
(P+NP) 8918956.79 11075733.86 10874762.54 11544968.00
FDCC Page 37 of 109 Accounts Reckoner 2007-08 to 2015-16 BE
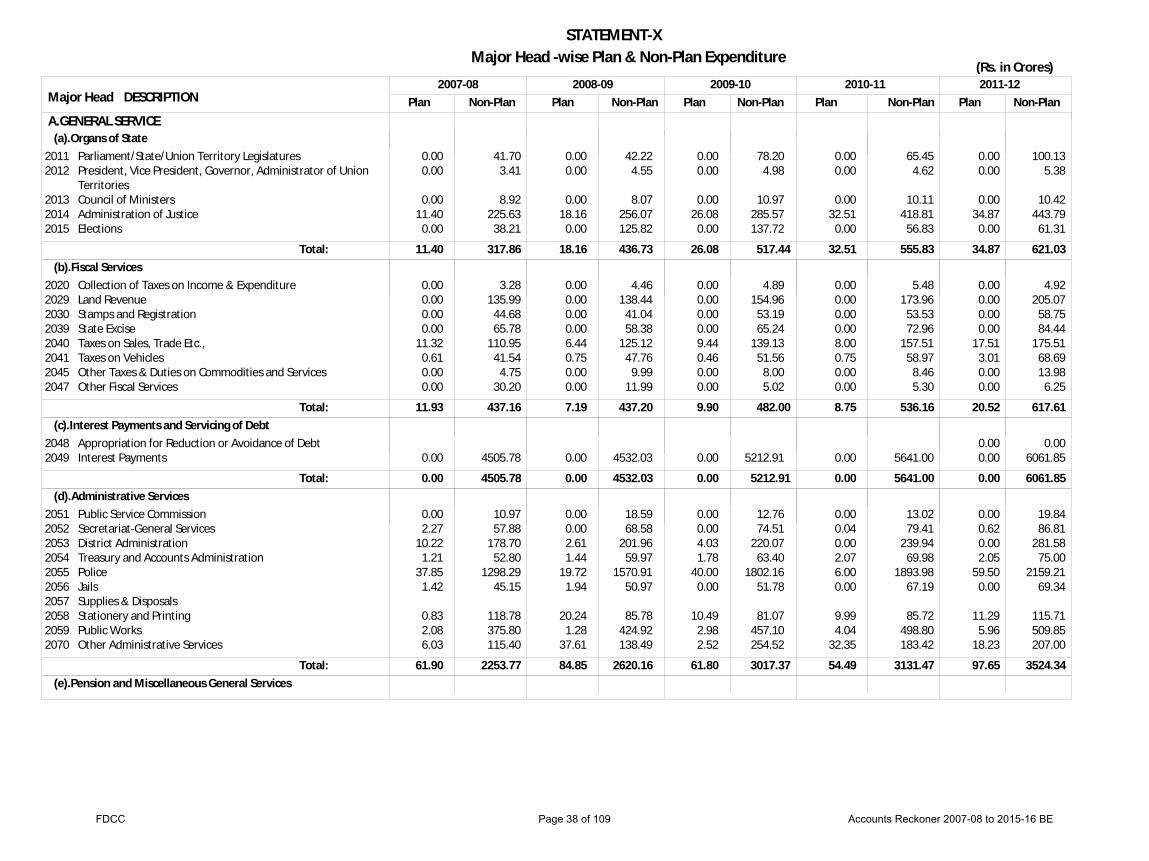
STATEMENT-XMajor Head -wise Plan & Non-Plan Expenditure
DESCRIPTION Plan Non-Plan Plan Non-Plan Plan Non-Plan Plan Non-Plan Plan Non-Plan2007-08 2008-09 2009-10 2010-11 2011-12
Major Head
(Rs. in Crores)
(a).Organs of State
(b).Fiscal Services
(c).Interest Payments and Servicing of Debt
(d).Administrative Services
(e).Pension and Miscellaneous General Services
11.40
11.93
0.00
61.90
317.86
437.16
4505.78
2253.77
18.16
7.19
0.00
84.85
436.73
437.20
4532.03
2620.16
26.08
9.90
0.00
61.80
517.44
482.00
5212.91
3017.37
32.51
8.75
0.00
54.49
555.83
536.16
5641.00
3131.47
34.87
20.52
0.00
97.65
621.03
617.61
6061.85
3524.34
20112012
201320142015
20202029203020392040204120452047
20482049
2051205220532054205520562057205820592070
Parliament/State/Union Territory LegislaturesPresident, Vice President, Governor, Administrator of UnionTerritoriesCouncil of MinistersAdministration of JusticeElections
Collection of Taxes on Income & ExpenditureLand RevenueStamps and RegistrationState ExciseTaxes on Sales, Trade Etc.,Taxes on VehiclesOther Taxes & Duties on Commodities and ServicesOther Fiscal Services
Appropriation for Reduction or Avoidance of DebtInterest Payments
Public Service CommissionSecretariat-General ServicesDistrict AdministrationTreasury and Accounts AdministrationPoliceJailsSupplies & DisposalsStationery and PrintingPublic WorksOther Administrative Services
0.00 0.00
0.00 11.40
0.00
0.00 0.00 0.00 0.00
11.32 0.61 0.00 0.00
0.00
0.00 2.27
10.22 1.21
37.85 1.42
0.83 2.08 6.03
41.70 3.41
8.92 225.63
38.21
3.28 135.99
44.68 65.78
110.95 41.54
4.75 30.20
4505.78
10.97 57.88
178.70 52.80
1298.29 45.15
118.78 375.80 115.40
0.00 0.00
0.00 18.16
0.00
0.00 0.00 0.00 0.00 6.44 0.75 0.00 0.00
0.00
0.00 0.00 2.61 1.44
19.72 1.94
20.24 1.28
37.61
42.22 4.55
8.07 256.07 125.82
4.46 138.44
41.04 58.38
125.12 47.76
9.99 11.99
4532.03
18.59 68.58
201.96 59.97
1570.91 50.97
85.78 424.92 138.49
0.00 0.00
0.00 26.08
0.00
0.00 0.00 0.00 0.00 9.44 0.46 0.00 0.00
0.00
0.00 0.00 4.03 1.78
40.00 0.00
10.49 2.98 2.52
78.20 4.98
10.97 285.57 137.72
4.89 154.96
53.19 65.24
139.13 51.56
8.00 5.02
5212.91
12.76 74.51
220.07 63.40
1802.16 51.78
81.07 457.10 254.52
0.00 0.00
0.00 32.51
0.00
0.00 0.00 0.00 0.00 8.00 0.75 0.00 0.00
0.00
0.00 0.04 0.00 2.07 6.00 0.00
9.99 4.04
32.35
65.45 4.62
10.11 418.81
56.83
5.48 173.96
53.53 72.96
157.51 58.97
8.46 5.30
5641.00
13.02 79.41
239.94 69.98
1893.98 67.19
85.72 498.80 183.42
0.00 0.00
0.00 34.87
0.00
0.00 0.00 0.00 0.00
17.51 3.01 0.00 0.00
0.00 0.00
0.00 0.62 0.00 2.05
59.50 0.00
11.29 5.96
18.23
100.13 5.38
10.42 443.79
61.31
4.92 205.07
58.75 84.44
175.51 68.69 13.98
6.25
0.00 6061.85
19.84 86.81
281.58 75.00
2159.21 69.34
115.71 509.85 207.00
Total:
Total:
Total:
Total:
A.GENERAL SERVICE
FDCC Page 38 of 109 Accounts Reckoner 2007-08 to 2015-16 BE

STATEMENT-XMajor Head -wise Plan & Non-Plan Expenditure
DESCRIPTION Plan Non-Plan Plan Non-Plan Plan Non-Plan Plan Non-Plan Plan Non-Plan2007-08 2008-09 2009-10 2010-11 2011-12
Major Head
(Rs. in Crores)
85.24Total A 10786.55 110.20 12165.37 97.79 12664.55 95.76 13959.34 153.04 16292.44 0.00 3271.98 0.00 4139.25 0.00 3434.84 0.00 4094.89 0.00 5467.61
20712075
Pension & Other Retirement BenefitsMiscellaneous General Services
0.00 0.00
3240.58 31.40
0.00 0.00
4112.63 26.62
0.00 0.00
3408.32 26.51
0.00 0.00
4069.94 24.95
0.00 0.00
5436.20 31.41
Total:
Education,Sports,Art and culture
Health and Family Welfare
Information and Broadcasting
Labour & Labour Welfare
Others
Social Welfare & Nutrition
Water Supply,sanitation and Housing
1409.40
456.44
7.02
86.92
15.00
603.47
5401.81
1021.50
22.45
56.86
85.68
1230.42
1884.41
667.58
17.39
119.52
40.63
1107.97
6607.96
1105.12
36.85
62.82
87.19
1432.28
1918.95
762.51
7.96
207.14
25.12
1747.11
6657.52
1164.66
29.52
65.34
111.42
3161.02
2850.37
998.41
24.89
172.12
40.63
2131.30
7939.95
1361.25
42.68
75.03
230.28
1734.99
2969.06
1203.96
24.25
179.03
45.38
2708.47
9270.99
1754.24
38.89
82.26
232.26
1850.66
2202220322042205
22102211
2220
2230
22502251
223522362245
2215
General EducationTechnical EducationSports and Youth ServicesArt & Culture
Medical and Public HealthFamily Welfare
Information and Publicity
Labour and Employment
Other Social ServicesSecretariat - Social Services
Social Security and WelfareNutritionRelief on Account of Natural Calamities
Water Supply and Sanitation
1217.56 79.23 22.29 90.32
260.29 196.15
7.02
86.92
15.00 0.00
492.22 111.26
0.00
164.83
5217.11 82.56 44.57 57.57
1011.39 10.10
22.45
56.86
73.44 12.24
922.70 136.12 171.60
10.78
1692.56 53.71 42.16 95.98
417.37 250.21
17.39
119.52
40.63 0.00
994.01 113.96
0.00
201.17
6429.14 91.86 32.39 54.58
1089.66 15.46
36.85
62.82
71.43 15.77
968.89 141.55 321.84
11.92
1611.72 65.61 99.50
142.12
476.11 286.40
7.96
207.14
25.12 0.00
1466.59 244.22
36.29
135.82
6439.11 110.04
29.03 79.34
1148.33 16.32
29.52
65.34
96.08 15.34
1012.39 322.20
1826.43
11.30
2481.43 122.47
55.29 191.18
699.89 298.52
24.89
172.12
40.63 0.00
1870.52 260.79
0.00
148.50
7671.29 151.30
35.27 82.10
1345.16 16.09
42.68
75.03
211.96 18.32
1230.75 338.08 166.17
11.90
2580.85 163.84
68.52 155.85
854.25 349.71
24.25
179.03
45.38 0.00
2393.71 314.76
0.00
194.14
8914.00 234.61
36.46 85.92
1735.09 19.15
38.89
82.26
210.58 21.69
1279.59 331.70 239.37
31.53
Total:
Total:
Total:
Total:
Total:
Total:
Total-A (P+NP) 10871.78 12275.57 12762.34 14055.10 16445.48
B.SOCIAL SERVICES
FDCC Page 39 of 109 Accounts Reckoner 2007-08 to 2015-16 BE

STATEMENT-XMajor Head -wise Plan & Non-Plan Expenditure
DESCRIPTION Plan Non-Plan Plan Non-Plan Plan Non-Plan Plan Non-Plan Plan Non-Plan2007-08 2008-09 2009-10 2010-11 2011-12
Major Head
(Rs. in Crores)
4784.09TOTAL B SOCIAL SERVICES 8339.58 5925.44 9947.55 7245.24 11873.61 9806.75 12301.06 11060.48 14111.26
Welfare of SC/ST/OBCs 1385.29
820.56
107.77
413.10
1238.56
849.38
145.76
469.55
1350.02
1226.45
207.84
476.30
1599.47
1989.56
402.06
514.83
1596.73
2333.59
276.03
605.92
22162217
2225
HousingUrban Development
Welfare of Scheduled Castes, Scheduled Tribes and OtherBackward Classes
294.36 926.09
820.56
45.42 51.57
413.10
558.17 479.23
849.38
51.57 82.27
469.55
602.70 611.50
1226.45
55.47 141.07
476.30
680.61 770.36
1989.56
174.23 215.94
514.83
880.21 522.38
2333.59
169.10 75.40
605.92
Total:
Total:
(a).Agriculture & Allied Activities
(b).Rural Development
(c).Special Area Programme
(d).Irrigation & Flood Control
1597.63
559.59
155.68
2920.42
399.81
171.36
1593.26
583.18
229.73
1745.16
358.25
0.19
1882.91
734.04
501.52
2375.20
498.48
0.00
2058.35
591.53
138.39
2718.61
779.52
0.00
3220.54
942.48
134.62
2280.54
1006.57
0.00
2401240224032404240524062408241524252435
2501250525062515
25512575
2700
Crop HusbandrySoil & Water ConservationAnimal HusbandryDairy DevelopmentFisheriesForestry and Wild LifeFood, Storage and Ware HousingAgricultural Research and EducationCo-OperationOther Agriculture Programme
Special Programmes for Rural DevelopmentRural EmploymentLand ReformsOther Rural Development Programmes
Hill AreasOther Special Area Programme
Major Irrigation
464.13 195.28
81.41 27.34 17.59
153.59 1.18
131.05 526.06
55.00 72.04
0.76 431.78
23.21 132.47
287.28 48.75
168.11 9.02
15.03 235.61 672.63 100.93
1383.07
0.43 0.00 2.77
396.62
0.00 171.36
755.23 114.73 115.16 117.48
37.46 215.91
0.00 69.13
168.17
66.69 78.87
1.55 436.07
31.73 198.00
0.00
232.86 59.68
192.63 0.00
17.21 252.38 752.10
97.59 140.71
0.44 0.00 2.86
354.95
0.00 0.19
28.67
793.61 56.49
143.92 249.02
66.86 263.09
13.00 72.45
224.47
56.17 275.32
1.18 401.36
26.60 474.91
0.00
254.27 51.93
193.46 0.00
18.63 512.82
1192.29 92.64 59.15
0.44 0.00 3.60
494.43
0.00 0.00
0.00
711.26 101.77 173.84 314.02
49.48 234.31
0.00 75.60
398.07
68.36 144.93
5.51 372.74
30.22 108.17
0.00
324.44 60.06
219.96 0.00
18.47 845.29 958.97 174.19 117.22
0.50 0.00 3.83
775.19
0.00 0.00
35.35
1389.70 160.67 252.27 368.14
78.59 245.43
0.16 191.91 533.66
55.34 160.98
5.94 720.21
31.57 103.05
0.00
302.12 65.81
258.98 0.00
20.49 558.42 828.91 173.95
71.85
0.53 0.00 3.99
1002.05
0.00 0.00
48.73
Total:
Total:
Total:
Total B (P+NP) 13123.67 15872.99 19118.86 22107.82 25171.74
C.ECONOMIC SERVICES
FDCC Page 40 of 109 Accounts Reckoner 2007-08 to 2015-16 BE
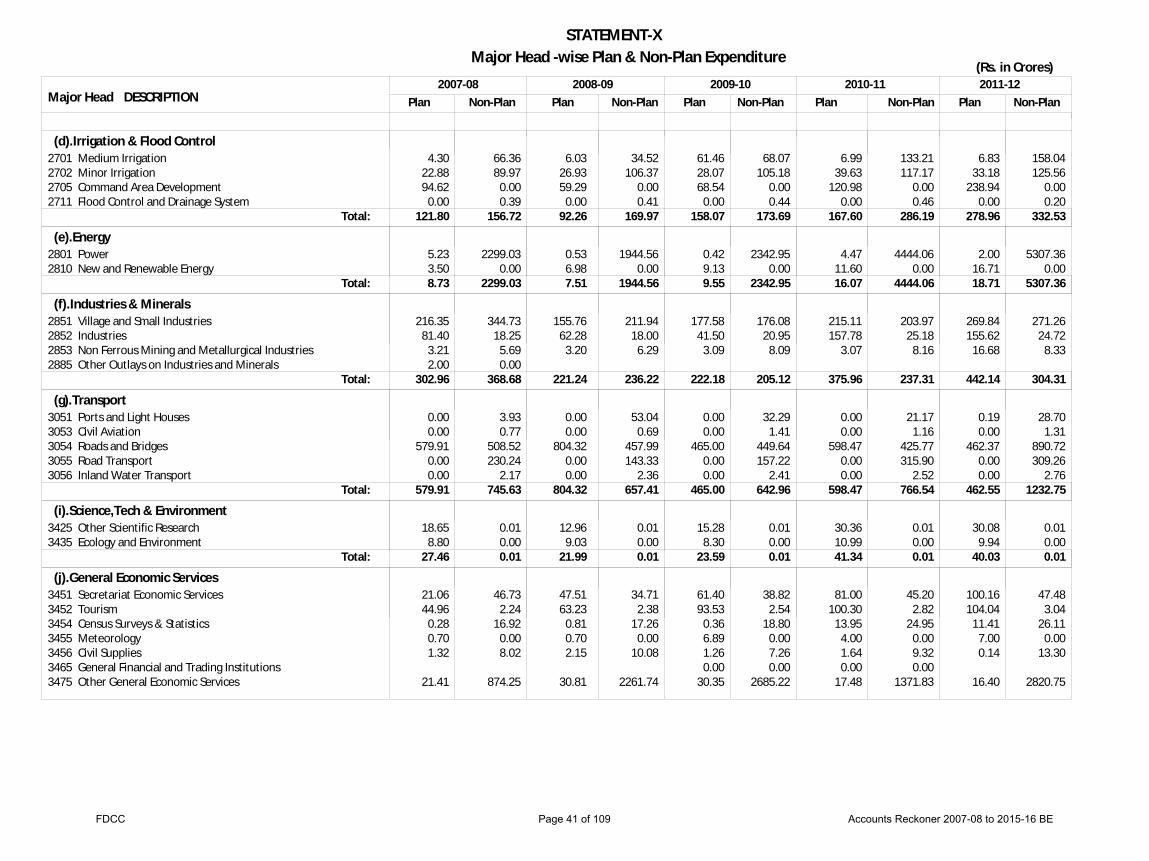
STATEMENT-XMajor Head -wise Plan & Non-Plan Expenditure
DESCRIPTION Plan Non-Plan Plan Non-Plan Plan Non-Plan Plan Non-Plan Plan Non-Plan2007-08 2008-09 2009-10 2010-11 2011-12
Major Head
(Rs. in Crores)
(d).Irrigation & Flood Control
(e).Energy
(f).Industries & Minerals
(g).Transport
(i).Science,Tech & Environment
(j).General Economic Services
121.80
8.73
302.96
579.91
27.46
156.72
2299.03
368.68
745.63
0.01
92.26
7.51
221.24
804.32
21.99
169.97
1944.56
236.22
657.41
0.01
158.07
9.55
222.18
465.00
23.59
173.69
2342.95
205.12
642.96
0.01
167.60
16.07
375.96
598.47
41.34
286.19
4444.06
237.31
766.54
0.01
278.96
18.71
442.14
462.55
40.03
332.53
5307.36
304.31
1232.75
0.01
2701270227052711
28012810
2851285228532885
30513053305430553056
34253435
3451345234543455345634653475
Medium IrrigationMinor IrrigationCommand Area DevelopmentFlood Control and Drainage System
PowerNew and Renewable Energy
Village and Small IndustriesIndustriesNon Ferrous Mining and Metallurgical IndustriesOther Outlays on Industries and Minerals
Ports and Light HousesCivil AviationRoads and BridgesRoad TransportInland Water Transport
Other Scientific ResearchEcology and Environment
Secretariat Economic ServicesTourismCensus Surveys & StatisticsMeteorologyCivil SuppliesGeneral Financial and Trading InstitutionsOther General Economic Services
4.30 22.88 94.62
0.00
5.23 3.50
216.35 81.40
3.21 2.00
0.00 0.00
579.91 0.00 0.00
18.65 8.80
21.06 44.96
0.28 0.70 1.32
21.41
66.36 89.97
0.00 0.39
2299.03 0.00
344.73 18.25
5.69 0.00
3.93 0.77
508.52 230.24
2.17
0.01 0.00
46.73 2.24
16.92 0.00 8.02
874.25
6.03 26.93 59.29
0.00
0.53 6.98
155.76 62.28
3.20
0.00 0.00
804.32 0.00 0.00
12.96 9.03
47.51 63.23
0.81 0.70 2.15
30.81
34.52 106.37
0.00 0.41
1944.56 0.00
211.94 18.00
6.29
53.04 0.69
457.99 143.33
2.36
0.01 0.00
34.71 2.38
17.26 0.00
10.08
2261.74
61.46 28.07 68.54
0.00
0.42 9.13
177.58 41.50
3.09
0.00 0.00
465.00 0.00 0.00
15.28 8.30
61.40 93.53
0.36 6.89 1.26 0.00
30.35
68.07 105.18
0.00 0.44
2342.95 0.00
176.08 20.95
8.09
32.29 1.41
449.64 157.22
2.41
0.01 0.00
38.82 2.54
18.80 0.00 7.26 0.00
2685.22
6.99 39.63
120.98 0.00
4.47 11.60
215.11 157.78
3.07
0.00 0.00
598.47 0.00 0.00
30.36 10.99
81.00 100.30
13.95 4.00 1.64 0.00
17.48
133.21 117.17
0.00 0.46
4444.06 0.00
203.97 25.18
8.16
21.17 1.16
425.77 315.90
2.52
0.01 0.00
45.20 2.82
24.95 0.00 9.32 0.00
1371.83
6.83 33.18
238.94 0.00
2.00 16.71
269.84 155.62
16.68
0.19 0.00
462.37 0.00 0.00
30.08 9.94
100.16 104.04
11.41 7.00 0.14
16.40
158.04 125.56
0.00 0.20
5307.36 0.00
271.26 24.72
8.33
28.70 1.31
890.72 309.26
2.76
0.01 0.00
47.48 3.04
26.11 0.00
13.30
2820.75
Total:
Total:
Total:
Total:
Total:
FDCC Page 41 of 109 Accounts Reckoner 2007-08 to 2015-16 BE

STATEMENT-XMajor Head -wise Plan & Non-Plan Expenditure
DESCRIPTION Plan Non-Plan Plan Non-Plan Plan Non-Plan Plan Non-Plan Plan Non-Plan2007-08 2008-09 2009-10 2010-11 2011-12
Major Head
(Rs. in Crores)
3443.49Total -C ECONOMIC SERVICES 8009.82 3698.70 7437.94 4190.64 8991.07 4206.09 10686.35 5779.16 13374.74
(j).General Economic Services 89.74 948.17 145.21 2326.17 193.79 2752.65 218.37 1454.12 239.14 2910.68Total:
D.GRANT-IN-AID & CONTRIBUTION
0.00 1926.00 795.96 1578.13 769.01 1705.00 1078.83 1899.66 1574.07 2769.89
3604 Compensation and Assignments to Local Bodies andPanchayat Raj Institutions
0.00 1926.00 795.96 1578.13 769.01 1705.00 1078.83 1899.66 1574.07 2769.89
Total:
A.GENERAL SERVICES
B.SOCIAL SERVICES 284.02TOTAL 55.00 422.73 52.63 433.40 56.46 414.96 50.51 600.87 24.62
A.GENERAL SERVICES
(a) Education,Sports,Art and culture
(b) Health and Family Welfare
(c) Water Supply,sanitation and Housing
284.02
113.82
354.24
1247.59
55.00
6.95
0.00
183.94
422.73
195.74
334.02
1601.65
52.63
3.59
-33.38
170.48
433.40
211.97
320.97
1602.66
56.46
3.73
0.00
207.07
414.96
418.43
436.86
1359.91
50.51
3.88
0.00
62.86
600.87
313.36
359.38
1603.01
24.62
11.11
-0.35
15.26
405540594070
4202
42104211
421542164217
Capital Outlay on PoliceCapital Outlay on Public WorksCapital Outlay on Other Administrative Services
Capital Outlay on Education, Sports, Art and Culture
Capital Outlay on Medical & Public HealthCapital Outlay on Family Welfare
Capital Outlay On Water Supply and SanitationCapital Outlay on HousingCapital Outlay on Urban Development
13.54 269.00
1.48
113.82
354.24
945.00 52.58
250.00
55.00 0.00 0.00
6.95
0.00
34.09 119.68
30.18
51.00 371.73
0.00
195.74
334.02
1147.23 56.51
397.91
52.63 0.00 0.00
3.59
-33.38
24.01 118.04
28.43
43.00 390.03
0.37
211.97
320.97
1092.21 46.22
464.23
56.46 0.00 0.00
3.73
0.00
34.11 146.68
26.28
51.25 363.61
0.09
418.43
436.86
991.71 36.78
331.42
50.51 0.00 0.00
3.88
0.00
21.58 24.72 16.56
71.00 525.81
4.07
313.36
359.38
1475.77 76.24 51.00
24.62 0.00 0.00
11.11
-0.35
-0.09 15.35
0.00
Total:
Total:
Total:
Total:
11453.31TOTAL C (P+NP) 11136.64 13181.71 14892.44 19153.90
8312.82 29061.95 10530.31 31128.99 12302.68 35234.24 15187.43 38846.41 18566.74 46548.33TOTAL-REVENUE ACCOUNT
TOTAL-REVENUE ACCOUNT (P+NP) 37374.77 41659.29 47536.92 54033.84 65115.07CAPITAL EXPENDITURE OUTSIDE REVENUE
A.GENERAL SERVICES
FDCC Page 42 of 109 Accounts Reckoner 2007-08 to 2015-16 BE

STATEMENT-XMajor Head -wise Plan & Non-Plan Expenditure
DESCRIPTION Plan Non-Plan Plan Non-Plan Plan Non-Plan Plan Non-Plan Plan Non-Plan2007-08 2008-09 2009-10 2010-11 2011-12
Major Head
(Rs. in Crores)
C.ECONOMIC SERVICES 1956.78TOTAL 190.89 2414.47 140.69 2439.88 210.79 2549.95 66.74 2669.28 25.91
(d) Information and Broadcasting
(e) Welfare of SC/ST/OBCs
(g) Other Social Services
(a).Agriculture & Allied Activities
(b).Rural Development
(c).Irrigation & Flood Control
1.04
201.25
19.57
19.28
80.15
136.09
0.00
0.00
0.00
0.00
-1.21
0.82
1.49
227.80
48.37
5.40
42.02
134.07
0.00
0.00
0.00
0.00
-2.17
0.27
6.00
239.74
48.19
10.35
64.93
73.00
0.00
-0.01
0.00
0.00
-1.04
0.93
9.20
211.50
99.88
14.17
101.03
501.86
0.00
0.00
0.00
0.00
-2.04
0.78
5.96
278.82
82.89
25.87
206.14
455.45
0.00
0.00
-0.10
0.00
-7.70
0.60
4220
4225
4235
4250
440144024403440444054406440844164425
45154575
4700470147024705
Capital Outlay on Information & Publicity
Capital Outlay on Welfare of Scheduled Castes, ScheduledTribes and Other Backward Classes
Capital Outlay on Social Security & Welfare
Capital Outlay on Other Social Services
Capital Outlay on Crop HusbandryCapital Outlay on Soil and Water ConservationCapital Outlay on Animal HusbandryCapital Outlay on Dairy DevelopmentCapital Outlay on FisheriesCapital Outlay on Forestry & Wild LifeCapital Outlay on Food Storage & Ware HousingInvestments in Agricultural InstitutionsCapital Outlay on Co-operation
Capital Outlay on Other Rural Development ProgrammesCapital Outlay on Other Special Area Programme
Capital Outlay on Major IrrigationCapital Outlay on Medium IrrigationCapital Outlay on Minor IrrigationCapital Outlay on Command Area Development
1.04
201.25
19.57
19.28
20.60 3.97
39.70
10.06 3.55
2.27
136.09
2148.67 344.95
0.00
0.00
0.00
0.00
0.00
0.00 0.00 0.00
0.00 0.00
-1.21
0.82
928.51 0.00 0.00
1.49
227.80
48.37
5.40
7.38 0.00
24.52
4.76 3.08
2.28
134.07 0.00
29.26 2165.78
432.76 5.28
0.00
0.00
0.00
0.00
0.00 0.00 0.00
0.00 0.00
-2.17
0.27 0.00
2.23 317.30
0.00 0.00
6.00
239.74
48.19
10.35
11.50 0.00
39.68 0.00 6.52 2.96
4.27
73.00 0.00
0.00 2839.36
523.78 23.93
0.00
-0.01
0.00
0.00
0.00 0.00 0.00 0.00-0.01 0.00
-1.03
0.93 0.00
0.00 540.83
0.00 0.00
9.20
211.50
99.88
14.17
35.15 0.00
39.27 0.00
21.69 4.04 0.00 0.00 0.88
124.47 377.39
28.27 3434.90
706.59 0.00
0.00
0.00
0.00
0.00
0.00 0.00-0.01 0.00 0.00 0.00 0.00 0.00-2.03
0.78 0.00
11.45 560.72
0.00 0.00
5.96
278.82
82.89
25.87
69.94 0.00
63.55 1.68
31.90 22.93 10.00
1.73 4.41
156.82 298.63
29.00 3949.06 1209.47
34.91
0.00
0.00
-0.10
0.00
0.00 0.00 0.00-2.99-0.01 0.00-0.43 0.00-4.27
0.60 0.00
12.08 429.35
0.00 0.00
Total:
Total:
Total:
Total:
Total:
Total:
B.SOCIAL SERVICES
FDCC Page 43 of 109 Accounts Reckoner 2007-08 to 2015-16 BE

STATEMENT-XMajor Head -wise Plan & Non-Plan Expenditure
DESCRIPTION Plan Non-Plan Plan Non-Plan Plan Non-Plan Plan Non-Plan Plan Non-Plan2007-08 2008-09 2009-10 2010-11 2011-12
Major Head
(Rs. in Crores)
7198.80 1450.14 9135.27 735.02 11117.97 1018.71 12581.72 773.44 14921.76 583.89 4958.00TOTAL 1204.25 6298.06 541.70 8244.69 751.46 9616.81 656.19 11651.61 533.36
(d).Energy
(e).Industries & Minerals
(f).Transport
(g).General Economic Services
2512.99
320.00
107.23
1381.66
419.88
928.51
112.90
-21.33
129.96
54.61
2666.36
850.00
261.43
2112.61
231.56
319.53
86.63
0.00
134.13
3.31
3401.16
1675.00
205.77
2513.99
310.84
540.83
75.37
-0.02
132.40
2.99
4193.10
1365.15
104.84
2944.36
406.48
572.17
15.95
-1.00
124.18
-53.83
5248.93
1065.00
372.09
3951.21
352.79
441.43
16.64
0.00
79.79
2.60
4711
4801
4851485248534858485948604885
50515053505450555075
545254655475
Capital Outlay on Flood Control Projects
Capital Outlay on Power Projects
Capital Outlay on Village & Small IndustriesCapital Outlay on Iron and Steel IndustriesCapital Outlay on Non-Ferrous Mining & Metallurgical IndustriesCapital Outlay on Engineering IndustriesCapital Outlay on Telecommunication and Electronics IndustriesCapital Outlay on Consumer IndustriesOther Capital Outlay on Industries & Minerals
Capital Outlay on Ports & Light HousesCapital Outlay on Civil AviationCapital Outlay on Roads & BridgesCapital Outlay on Road TransportCapital Outlay On Other Transport Services
Capital Outlay on TourismInvestments in General Financial and Trading InstitutionsCapital Outlay on Other General Economic Services
19.37
320.00
11.08 94.99
1.17
6.49
1270.17 105.00
50.86 362.90
6.12
0.00
112.90
-0.03-21.31
0.00
0.00
129.96 0.00
0.00 55.00-0.40
33.29
850.00
35.30 0.00
1.92 224.21
-6.49
1913.83 205.26
56.13 170.43
5.00
0.00
86.63
0.00 0.00
0.00 0.00
0.00
134.13 0.00
0.00 3.58-0.27
14.08
1675.00
24.87 68.76
2.15 110.00
0.00
2291.15 222.84
94.73 201.10
15.00
0.00
75.37
-0.01-0.01
0.00 0.00
0.00
132.40 0.00
0.00 3.30-0.31
23.34
1365.15
30.67 4.79
45.53 23.84
0.00
2782.60 161.76
105.98 290.64
9.86
0.00
15.95
-1.00 0.00
0.00 0.00
0.00
119.18 5.00
0.00-52.92
-0.91
26.50
1065.00
32.02 13.00
0.00
173.93 153.14
7.53
3790.18 153.49
175.33 162.50
14.96
0.00
16.64
0.00 0.00
0.00
0.00 0.00
0.00
79.79 0.00
0.00 2.85-0.25
Total:
Total:
Total:
Total:
Total:
LOANS FOR PUBLIC DEBT
1.Social Services 0.00 1328.77 0.00 1777.90 0.00 2308.33 0.00 2807.13 0.00 3319.88
60036004
Internal Debt of the State GovernmentLoans and Advances from Central Government
0.00 0.00
880.21 448.56
0.00 0.00
1316.46 461.43
0.00 0.00
1837.87 470.46
0.00 0.00
1916.17 890.96
0.00 0.00
2519.68 800.20
TOTAL:
C.ECONOMIC SERVICESTOTAL-CAPITAL ACCOUNT
CAPITAL ACCOUNT (P+NP) 8648.94 9870.29 12136.68 13355.17 15505.65
LOANS FOR PUBLIC DEB
FDCC Page 44 of 109 Accounts Reckoner 2007-08 to 2015-16 BE
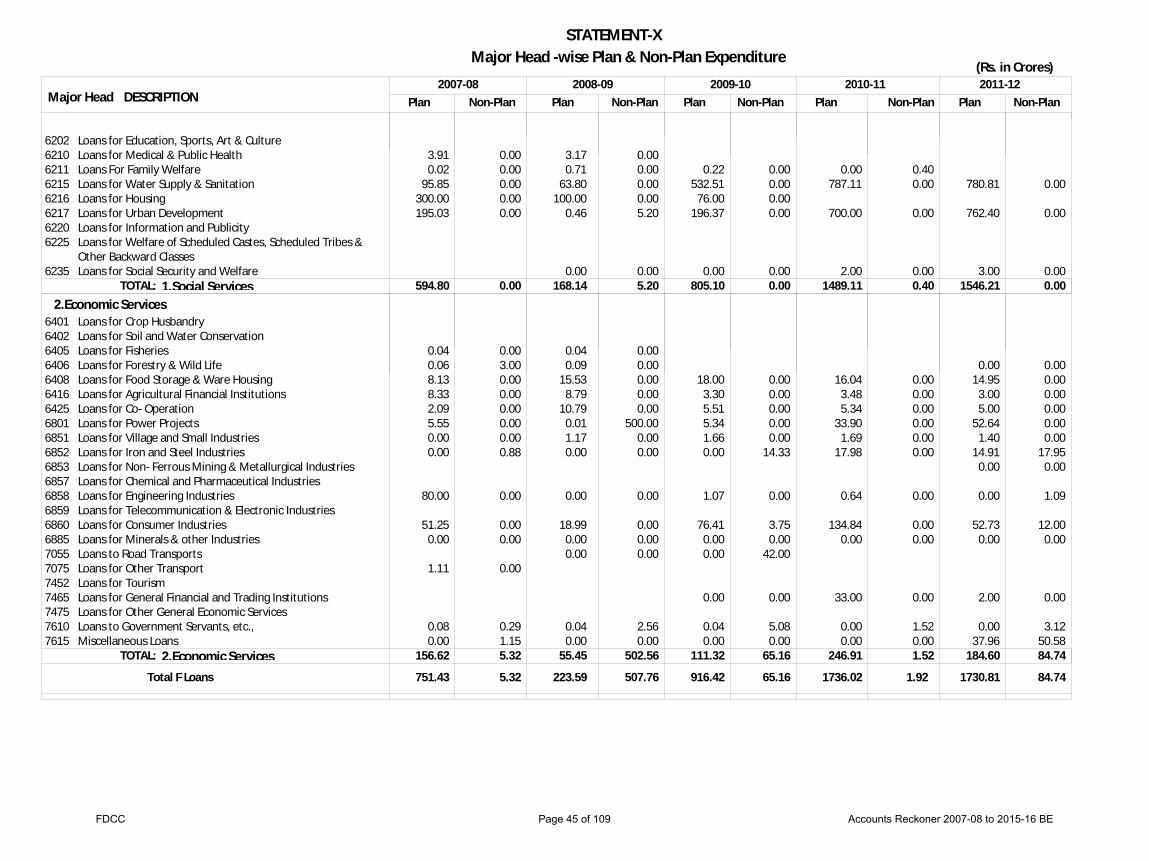
STATEMENT-XMajor Head -wise Plan & Non-Plan Expenditure
DESCRIPTION Plan Non-Plan Plan Non-Plan Plan Non-Plan Plan Non-Plan Plan Non-Plan2007-08 2008-09 2009-10 2010-11 2011-12
Major Head
(Rs. in Crores)
751.43Total F Loans 5.32 223.59 507.76 916.42 65.16 1736.02 1.92 1730.81 84.74
2.Economic Services 594.80
156.62
0.00
5.32
168.14
55.45
5.20
502.56
805.10
111.32
0.00
65.16
1489.11
246.91
0.40
1.52
1546.21
184.60
0.00
84.74
62026210621162156216621762206225
6235
64016402640564066408641664256801685168526853685768586859686068857055707574527465747576107615
Loans for Education, Sports, Art & CultureLoans for Medical & Public HealthLoans For Family WelfareLoans for Water Supply & SanitationLoans for HousingLoans for Urban DevelopmentLoans for Information and PublicityLoans for Welfare of Scheduled Castes, Scheduled Tribes &Other Backward ClassesLoans for Social Security and Welfare
Loans for Crop HusbandryLoans for Soil and Water ConservationLoans for FisheriesLoans for Forestry & Wild LifeLoans for Food Storage & Ware HousingLoans for Agricultural Financial InstitutionsLoans for Co- OperationLoans for Power ProjectsLoans for Village and Small IndustriesLoans for Iron and Steel IndustriesLoans for Non- Ferrous Mining & Metallurgical IndustriesLoans for Chemical and Pharmaceutical IndustriesLoans for Engineering IndustriesLoans for Telecommunication & Electronic IndustriesLoans for Consumer IndustriesLoans for Minerals & other IndustriesLoans to Road TransportsLoans for Other TransportLoans for TourismLoans for General Financial and Trading InstitutionsLoans for Other General Economic ServicesLoans to Government Servants, etc.,Miscellaneous Loans
3.91 0.02
95.85 300.00 195.03
0.04 0.06 8.13 8.33 2.09 5.55 0.00 0.00
80.00
51.25 0.00
1.11
0.08 0.00
0.00 0.00 0.00 0.00 0.00
0.00 3.00 0.00 0.00 0.00 0.00 0.00 0.88
0.00
0.00 0.00
0.00
0.29 1.15
3.17 0.71
63.80 100.00
0.46
0.00
0.04 0.09
15.53 8.79
10.79 0.01 1.17 0.00
0.00
18.99 0.00 0.00
0.04 0.00
0.00 0.00 0.00 0.00 5.20
0.00
0.00 0.00 0.00 0.00 0.00
500.00 0.00 0.00
0.00
0.00 0.00 0.00
2.56 0.00
0.22 532.51
76.00 196.37
0.00
18.00 3.30 5.51 5.34 1.66 0.00
1.07
76.41 0.00 0.00
0.00
0.04 0.00
0.00 0.00 0.00 0.00
0.00
0.00 0.00 0.00 0.00 0.00
14.33
0.00
3.75 0.00
42.00
0.00
5.08 0.00
0.00 787.11
700.00
2.00
16.04 3.48 5.34
33.90 1.69
17.98
0.64
134.84 0.00
33.00
0.00 0.00
0.40 0.00
0.00
0.00
0.00 0.00 0.00 0.00 0.00 0.00
0.00
0.00 0.00
0.00
1.52 0.00
780.81
762.40
3.00
0.00 14.95
3.00 5.00
52.64 1.40
14.91 0.00
0.00
52.73 0.00
2.00
0.00 37.96
0.00
0.00
0.00
0.00 0.00 0.00 0.00 0.00 0.00
17.95 0.00
1.09
12.00 0.00
0.00
3.12 50.58
TOTAL:
TOTAL:
1.Social Services
2.Economic Services
FDCC Page 45 of 109 Accounts Reckoner 2007-08 to 2015-16 BE
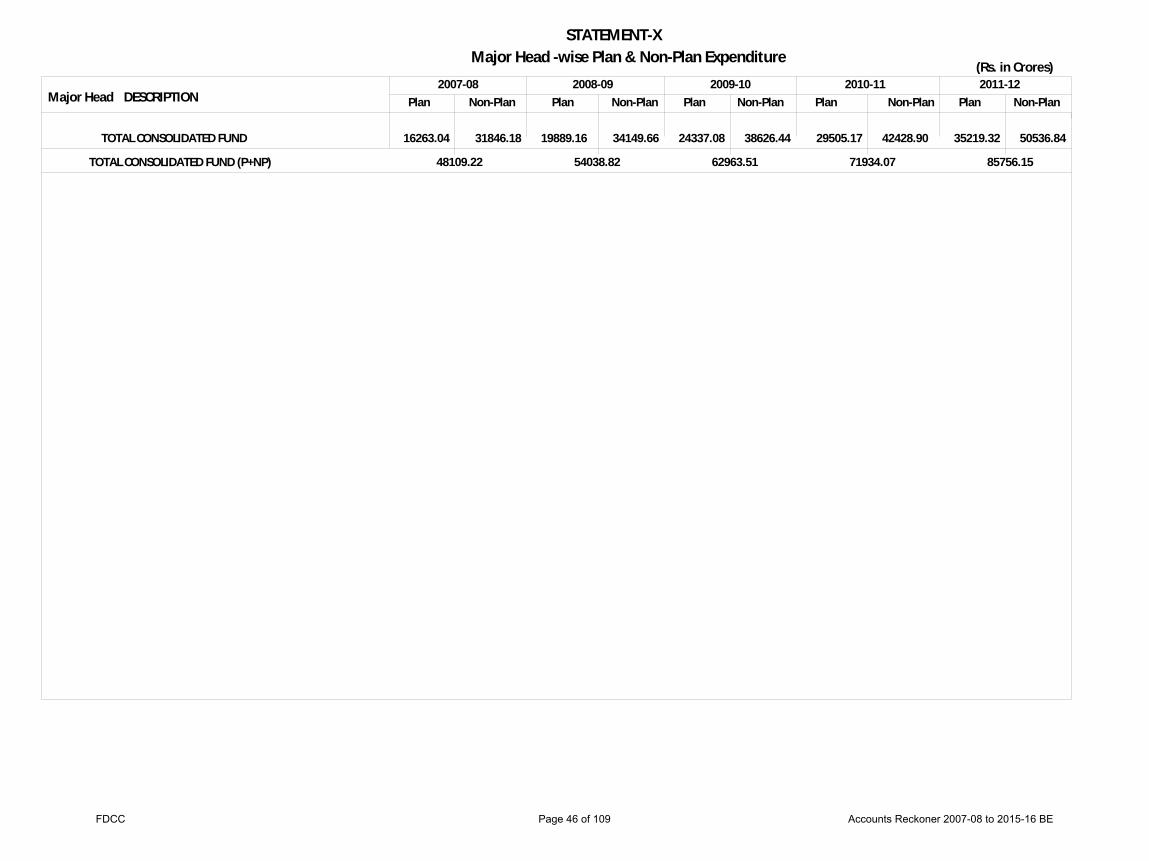
STATEMENT-XMajor Head -wise Plan & Non-Plan Expenditure
DESCRIPTION Plan Non-Plan Plan Non-Plan Plan Non-Plan Plan Non-Plan Plan Non-Plan2007-08 2008-09 2009-10 2010-11 2011-12
Major Head
(Rs. in Crores)
TOTAL CONSOLIDATED FUND 16263.04 31846.18 19889.16 34149.66 24337.08 38626.44 29505.17 42428.90 35219.32 50536.84
TOTAL CONSOLIDATED FUND (P+NP) 48109.22 54038.82 62963.51 71934.07 85756.15
FDCC Page 46 of 109 Accounts Reckoner 2007-08 to 2015-16 BE
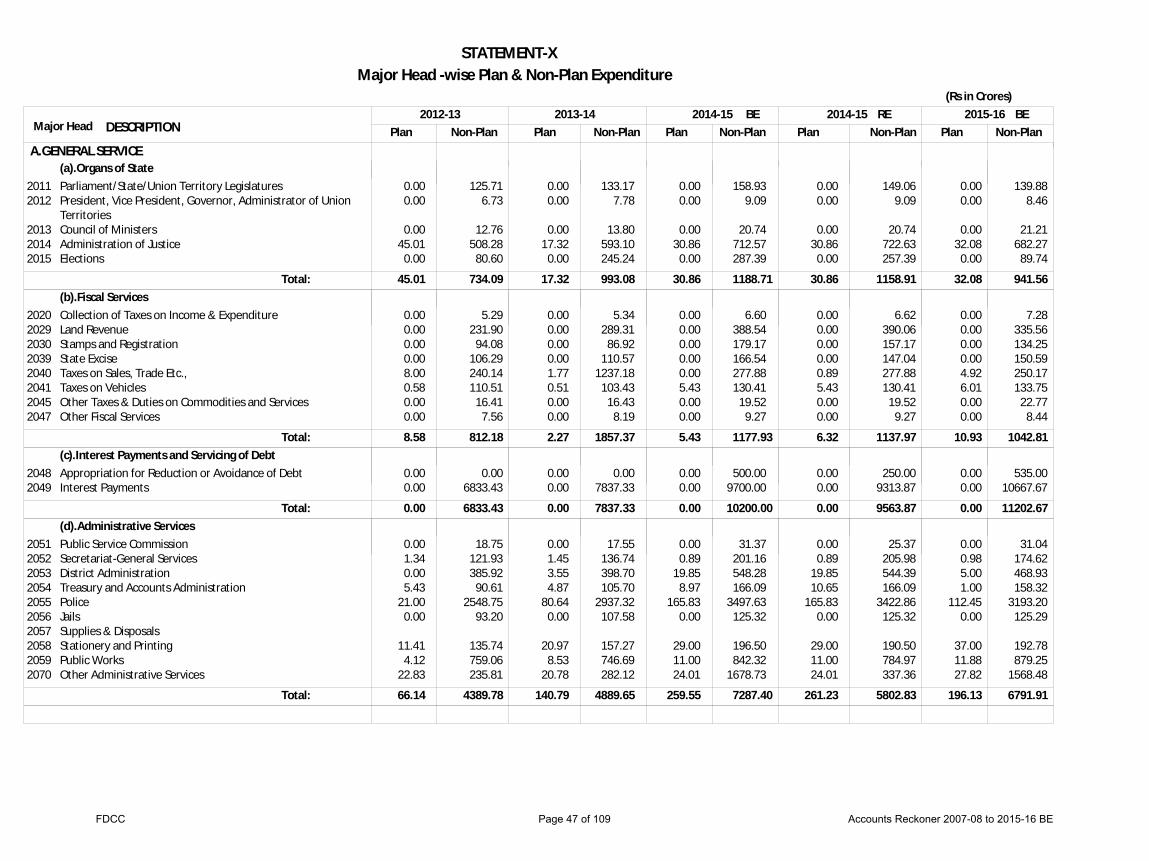
STATEMENT-XMajor Head -wise Plan & Non-Plan Expenditure
DESCRIPTION Plan Non-Plan Plan Non-Plan Plan Non-Plan Plan Non-Plan Plan Non-Plan2012-13 2013-14 2014-15 2014-15 2015-16 BERE
Major Head
(Rs in Crores)BE
(a).Organs of State
(b).Fiscal Services
(c).Interest Payments and Servicing of Debt
(d).Administrative Services
45.01
8.58
0.00
66.14
734.09
812.18
6833.43
4389.78
17.32
2.27
0.00
140.79
993.08
1857.37
7837.33
4889.65
30.86
5.43
0.00
259.55
1188.71
1177.93
10200.00
7287.40
30.86
6.32
0.00
261.23
1158.91
1137.97
9563.87
5802.83
32.08
10.93
0.00
196.13
941.56
1042.81
11202.67
6791.91
20112012
201320142015
20202029203020392040204120452047
20482049
2051205220532054205520562057205820592070
Parliament/State/Union Territory LegislaturesPresident, Vice President, Governor, Administrator of UnionTerritoriesCouncil of MinistersAdministration of JusticeElections
Collection of Taxes on Income & ExpenditureLand RevenueStamps and RegistrationState ExciseTaxes on Sales, Trade Etc.,Taxes on VehiclesOther Taxes & Duties on Commodities and ServicesOther Fiscal Services
Appropriation for Reduction or Avoidance of DebtInterest Payments
Public Service CommissionSecretariat-General ServicesDistrict AdministrationTreasury and Accounts AdministrationPoliceJailsSupplies & DisposalsStationery and PrintingPublic WorksOther Administrative Services
0.00 0.00
0.00 45.01
0.00
0.00 0.00 0.00 0.00 8.00 0.58 0.00 0.00
0.00 0.00
0.00 1.34 0.00 5.43
21.00 0.00
11.41 4.12
22.83
125.71 6.73
12.76 508.28
80.60
5.29 231.90
94.08 106.29 240.14 110.51
16.41 7.56
0.00 6833.43
18.75 121.93 385.92
90.61 2548.75
93.20
135.74 759.06 235.81
0.00 0.00
0.00 17.32
0.00
0.00 0.00 0.00 0.00 1.77 0.51 0.00 0.00
0.00 0.00
0.00 1.45 3.55 4.87
80.64 0.00
20.97 8.53
20.78
133.17 7.78
13.80 593.10 245.24
5.34 289.31
86.92 110.57
1237.18 103.43
16.43 8.19
0.00 7837.33
17.55 136.74 398.70 105.70
2937.32 107.58
157.27 746.69 282.12
0.00 0.00
0.00 30.86
0.00
0.00 0.00 0.00 0.00 0.00 5.43 0.00 0.00
0.00 0.00
0.00 0.89
19.85 8.97
165.83 0.00
29.00 11.00 24.01
158.93 9.09
20.74 712.57 287.39
6.60 388.54 179.17 166.54 277.88 130.41
19.52 9.27
500.00 9700.00
31.37 201.16 548.28 166.09
3497.63 125.32
196.50 842.32
1678.73
0.00 0.00
0.00 30.86
0.00
0.00 0.00 0.00 0.00 0.89 5.43 0.00 0.00
0.00 0.00
0.00 0.89
19.85 10.65
165.83 0.00
29.00 11.00 24.01
149.06 9.09
20.74 722.63 257.39
6.62 390.06 157.17 147.04 277.88 130.41
19.52 9.27
250.00 9313.87
25.37 205.98 544.39 166.09
3422.86 125.32
190.50 784.97 337.36
0.00 0.00
0.00 32.08
0.00
0.00 0.00 0.00 0.00 4.92 6.01 0.00 0.00
0.00 0.00
0.00 0.98 5.00 1.00
112.45 0.00
37.00 11.88 27.82
139.88 8.46
21.21 682.27
89.74
7.28 335.56 134.25 150.59 250.17 133.75
22.77 8.44
535.00 10667.67
31.04 174.62 468.93 158.32
3193.20 125.29
192.78 879.25
1568.48
Total:
Total:
Total:
Total:
A.GENERAL SERVICE
FDCC Page 47 of 109 Accounts Reckoner 2007-08 to 2015-16 BE
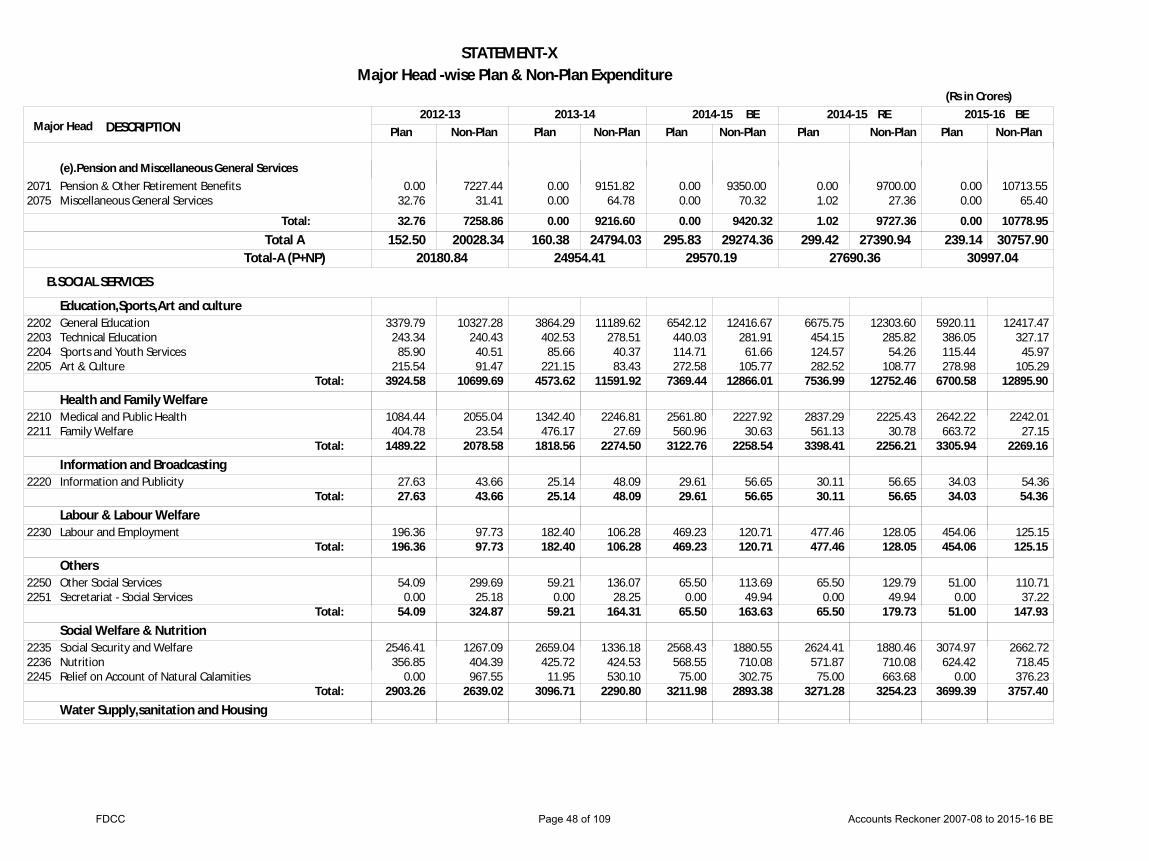
STATEMENT-XMajor Head -wise Plan & Non-Plan Expenditure
DESCRIPTION Plan Non-Plan Plan Non-Plan Plan Non-Plan Plan Non-Plan Plan Non-Plan2012-13 2013-14 2014-15 2014-15 2015-16 BERE
Major Head
(Rs in Crores)BE
152.50Total A 20028.34 160.38 24794.03 295.83 29274.36 299.42 27390.94 239.14 30757.90
(e).Pension and Miscellaneous General Services
32.76 7258.86 0.00 9216.60 0.00 9420.32 1.02 9727.36 0.00 10778.95
20712075
Pension & Other Retirement BenefitsMiscellaneous General Services
0.00 32.76
7227.44 31.41
0.00 0.00
9151.82 64.78
0.00 0.00
9350.00 70.32
0.00 1.02
9700.00 27.36
0.00 0.00
10713.55 65.40
Total:
Education,Sports,Art and culture
Health and Family Welfare
Information and Broadcasting
Labour & Labour Welfare
Others
Social Welfare & Nutrition
Water Supply,sanitation and Housing
3924.58
1489.22
27.63
196.36
54.09
2903.26
10699.69
2078.58
43.66
97.73
324.87
2639.02
4573.62
1818.56
25.14
182.40
59.21
3096.71
11591.92
2274.50
48.09
106.28
164.31
2290.80
7369.44
3122.76
29.61
469.23
65.50
3211.98
12866.01
2258.54
56.65
120.71
163.63
2893.38
7536.99
3398.41
30.11
477.46
65.50
3271.28
12752.46
2256.21
56.65
128.05
179.73
3254.23
6700.58
3305.94
34.03
454.06
51.00
3699.39
12895.90
2269.16
54.36
125.15
147.93
3757.40
2202220322042205
22102211
2220
2230
22502251
223522362245
General EducationTechnical EducationSports and Youth ServicesArt & Culture
Medical and Public HealthFamily Welfare
Information and Publicity
Labour and Employment
Other Social ServicesSecretariat - Social Services
Social Security and WelfareNutritionRelief on Account of Natural Calamities
3379.79 243.34
85.90 215.54
1084.44 404.78
27.63
196.36
54.09 0.00
2546.41 356.85
0.00
10327.28 240.43
40.51 91.47
2055.04 23.54
43.66
97.73
299.69 25.18
1267.09 404.39 967.55
3864.29 402.53
85.66 221.15
1342.40 476.17
25.14
182.40
59.21 0.00
2659.04 425.72
11.95
11189.62 278.51
40.37 83.43
2246.81 27.69
48.09
106.28
136.07 28.25
1336.18 424.53 530.10
6542.12 440.03 114.71 272.58
2561.80 560.96
29.61
469.23
65.50 0.00
2568.43 568.55
75.00
12416.67 281.91
61.66 105.77
2227.92 30.63
56.65
120.71
113.69 49.94
1880.55 710.08 302.75
6675.75 454.15 124.57 282.52
2837.29 561.13
30.11
477.46
65.50 0.00
2624.41 571.87
75.00
12303.60 285.82
54.26 108.77
2225.43 30.78
56.65
128.05
129.79 49.94
1880.46 710.08 663.68
5920.11 386.05 115.44 278.98
2642.22 663.72
34.03
454.06
51.00 0.00
3074.97 624.42
0.00
12417.47 327.17
45.97 105.29
2242.01 27.15
54.36
125.15
110.71 37.22
2662.72 718.45 376.23
Total:
Total:
Total:
Total:
Total:
Total:
Total-A (P+NP) 20180.84 24954.41 29570.19 27690.36 30997.04
B.SOCIAL SERVICES
FDCC Page 48 of 109 Accounts Reckoner 2007-08 to 2015-16 BE

STATEMENT-XMajor Head -wise Plan & Non-Plan Expenditure
DESCRIPTION Plan Non-Plan Plan Non-Plan Plan Non-Plan Plan Non-Plan Plan Non-Plan2012-13 2013-14 2014-15 2014-15 2015-16 BERE
Major Head
(Rs in Crores)BE
13309.41TOTAL B SOCIAL SERVICES 17110.39 14808.57 17813.32 22396.85 19719.92 23018.16 19978.95 24837.50 20890.91
Welfare of SC/ST/OBCs 1865.82
2848.46
494.04
732.79
2319.56
2733.36
350.60
986.80
4269.33
3859.01
367.16
993.84
4036.67
4201.73
357.36
994.26
6264.97
4327.53
494.07
1146.94
221522162217
2225
Water Supply and SanitationHousingUrban Development
Welfare of Scheduled Castes, Scheduled Tribes and OtherBackward Classes
248.89 1219.47
397.46
2848.46
32.82 333.68 127.55
732.79
492.35 1190.61
636.61
2733.36
32.72 213.60 104.27
986.80
1220.46 2205.22
843.65
3859.01
34.71 222.15 110.31
993.84
1162.33 2205.22
669.12
4201.73
34.71 212.15 110.51
994.26
2198.63 3309.00
757.34
4327.53
28.53 342.77 122.77
1146.94
Total:
Total:
(a).Agriculture & Allied Activities
(b).Rural Development
(c).Special Area Programme
(d).Irrigation & Flood Control
3985.71
1089.18
102.62
3431.76
1288.58
0.11
6941.89
963.84
152.39
5647.93
1318.99
0.00
5984.81
2881.61
304.97
6808.63
2262.13
0.00
5618.84
2858.97
304.97
5410.58
2760.32
0.00
6128.95
2736.37
718.47
4832.30
2029.94
0.00
2401240224032404240524062408241524252435
2501250525062515
25512575
Crop HusbandrySoil & Water ConservationAnimal HusbandryDairy DevelopmentFisheriesForestry and Wild LifeFood, Storage and Ware HousingAgricultural Research and EducationCo-OperationOther Agriculture Programme
Special Programmes for Rural DevelopmentRural EmploymentLand ReformsOther Rural Development Programmes
Hill AreasOther Special Area Programme
1397.04 147.43 203.58 339.86
61.70 246.39
0.00 172.45
1417.26
31.51 208.32
19.75 829.60
32.42 70.20
384.56 78.31
308.04 0.00
25.95 1339.28 1044.67
169.65 81.30
0.51 0.00 9.91
1278.16
0.11 0.00
1920.10 163.18 339.68 849.63
68.63 315.48
0.00 200.62
3084.58
101.58 269.02
13.39 579.85
32.46 119.93
467.12 71.81
353.06 0.00
28.07 1246.14 3106.65
292.00 83.07
0.61 0.00 5.43
1312.96
0.00 0.00
2891.03 839.28 362.41 893.00
78.14 262.04
0.00 276.23 382.69
153.30 1514.45
71.25 1142.61
41.47 263.50
443.14 77.65
390.74 0.00
28.80 1009.45 4438.43
331.98 88.45
0.67 0.00
11.77 2249.69
0.00 0.00
2748.43 512.79 365.33 893.00
73.14 346.61
0.00 276.23 403.32
154.30 1514.45
27.06 1163.16
41.47 263.50
443.14 78.25
390.94 0.00
28.80 1141.44 2907.59
331.98 88.45
0.67 0.00
11.77 2747.88
0.00 0.00
3074.51 292.60 279.79 992.27 167.73 149.76
0.00 167.42
1004.87
82.07 1513.10
10.93 1130.27
4.97 713.50
441.91 70.60
529.17 0.00
28.16 1173.18 2080.41
422.59 86.28
0.72 0.00 4.64
2024.58
0.00 0.00
Total:
Total:
Total:
Total B (P+NP) 30419.80 32621.89 42116.77 42997.10 45728.41
C.ECONOMIC SERVICES
FDCC Page 49 of 109 Accounts Reckoner 2007-08 to 2015-16 BE

STATEMENT-XMajor Head -wise Plan & Non-Plan Expenditure
DESCRIPTION Plan Non-Plan Plan Non-Plan Plan Non-Plan Plan Non-Plan Plan Non-Plan2012-13 2013-14 2014-15 2014-15 2015-16 BERE
Major Head
(Rs in Crores)BE
(d).Irrigation & Flood Control
(e).Energy
(f).Industries & Minerals
(g).Transport
(i).Science,Tech & Environment
(j).General Economic Services
276.36
16.12
400.88
367.13
60.08
471.61
7054.25
322.07
1656.73
0.01
230.36
32.73
556.88
520.04
60.84
501.96
5962.98
325.17
2040.05
0.01
438.21
36.11
647.97
1151.74
70.68
906.11
6703.00
463.94
2045.78
0.01
393.71
46.21
660.75
1211.88
80.68
808.11
6703.00
451.21
2069.96
0.01
395.18
37.34
671.93
1610.99
69.06
1211.62
8051.12
405.03
1734.50
0.01
27002701270227052711
28012810
2851285228532885
30513053305430553056
34253435
345134523454345534563465
Major IrrigationMedium IrrigationMinor IrrigationCommand Area DevelopmentFlood Control and Drainage System
PowerNew and Renewable Energy
Village and Small IndustriesIndustriesNon Ferrous Mining and Metallurgical IndustriesOther Outlays on Industries and Minerals
Ports and Light HousesCivil AviationRoads and BridgesRoad TransportInland Water Transport
Other Scientific ResearchEcology and Environment
Secretariat Economic ServicesTourismCensus Surveys & StatisticsMeteorologyCivil SuppliesGeneral Financial and Trading Institutions
0.00 6.10
38.58 231.68
0.00
0.00 16.12
255.28 133.80
11.81
0.41 0.00
364.21 2.52 0.00
51.01 9.08
126.24 86.48
5.85 8.00 0.14
69.64 262.02 139.44
0.00 0.50
7054.25 0.01
286.80 24.95 10.31
13.15 1.89
1255.77 382.90
3.02
0.01 0.00
58.35 3.16
28.61 0.00 9.39
0.00 10.19 42.05
178.12 0.00
20.00 12.73
343.94 198.80
14.15
1.02 0.00
519.02 0.00 0.00
52.17 8.67
109.81 105.54
30.35 8.00 0.10 0.00
158.16 174.42 175.56
-6.70 0.53
5962.98 0.00
290.02 24.58 10.57
12.42 4.19
1329.36 691.10
2.99
0.01 0.00
64.91 3.71
33.83 0.00
27.45 0.00
0.00 15.78 68.69
353.74 0.00
20.00 16.11
435.63 184.19
28.15
1.70 0.00
1150.04 0.00 0.00
55.17 15.50
272.41 118.23
18.17 8.00 0.35 0.00
208.97 512.40 184.18
0.00 0.55
6703.00 0.00
409.27 32.32 22.36
13.17 4.05
1373.16 651.86
3.53
0.01 0.00
93.48 4.11
53.55 0.00
13.54 0.00
0.00 9.78
71.19 312.74
0.00
20.00 26.21
459.30 161.69
39.75
1.70 0.00
1210.18 0.00 0.00
65.17 15.50
282.33 128.23
18.17 8.00 0.35 1.20
185.97 437.40 184.18
0.00 0.55
6703.00 0.00
398.61 25.24 27.36
5.17 4.05
1405.34 651.86
3.53
0.01 0.00
93.56 4.11
53.55 0.00
12.54 0.00
0.00 3.41
69.77 322.00
0.00
20.00 17.34
465.95 159.38
46.60
2.14 0.00
1608.85 0.00 0.00
53.76 15.30
182.09 126.91
5.51 8.00 0.18 0.20
255.00 740.14 215.90
0.00 0.58
8051.12 0.00
349.90 22.96 32.17
15.06 3.01
964.30 748.48
3.65
0.01 0.00
71.71 4.56
34.18 0.00
11.49 0.00
Total:
Total:
Total:
Total:
Total:
FDCC Page 50 of 109 Accounts Reckoner 2007-08 to 2015-16 BE
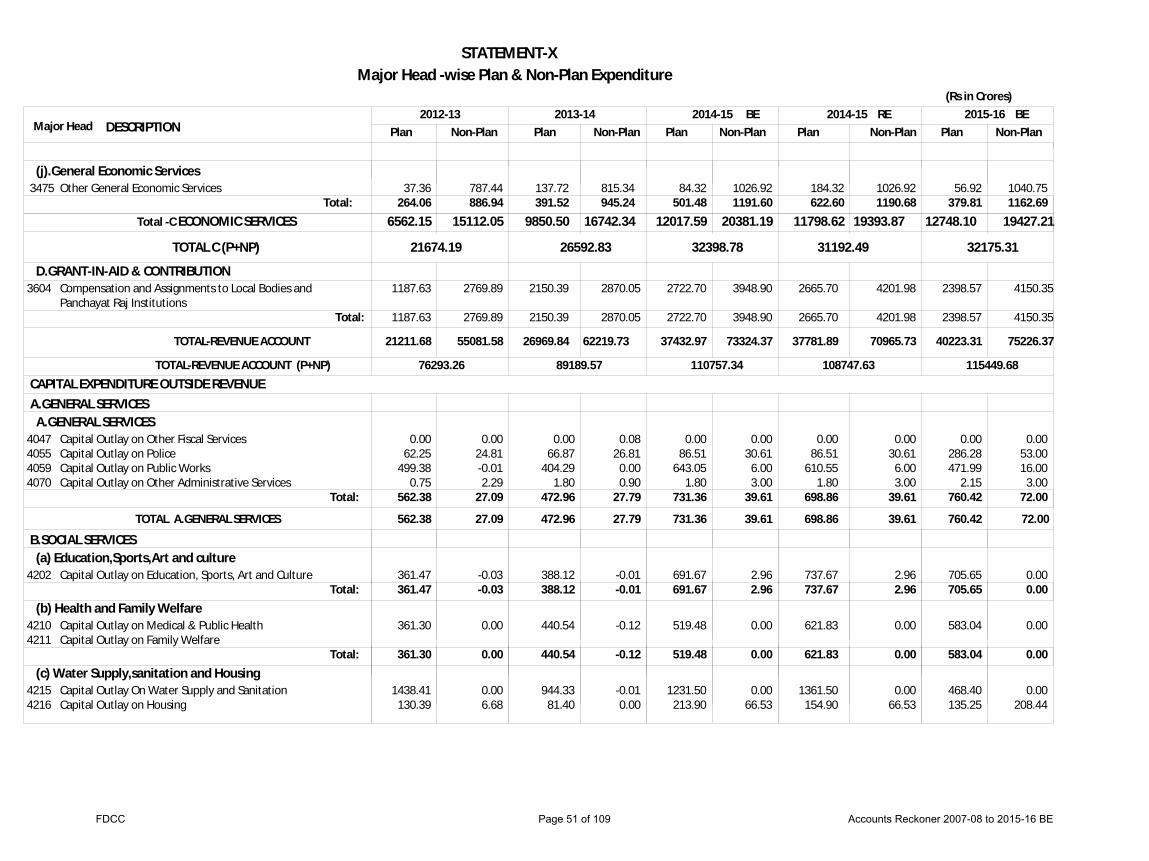
STATEMENT-XMajor Head -wise Plan & Non-Plan Expenditure
DESCRIPTION Plan Non-Plan Plan Non-Plan Plan Non-Plan Plan Non-Plan Plan Non-Plan2012-13 2013-14 2014-15 2014-15 2015-16 BERE
Major Head
(Rs in Crores)BE
6562.15Total -C ECONOMIC SERVICES 15112.05 9850.50 16742.34 12017.59 20381.19 11798.62 19393.87 12748.10 19427.21
(j).General Economic Services
264.06 886.94 391.52 945.24 501.48 1191.60 622.60 1190.68 379.81 1162.693475 Other General Economic Services 37.36 787.44 137.72 815.34 84.32 1026.92 184.32 1026.92 56.92 1040.75
Total:
D.GRANT-IN-AID & CONTRIBUTION
1187.63 2769.89 2150.39 2870.05 2722.70 3948.90 2665.70 4201.98 2398.57 4150.35
3604 Compensation and Assignments to Local Bodies andPanchayat Raj Institutions
1187.63 2769.89 2150.39 2870.05 2722.70 3948.90 2665.70 4201.98 2398.57 4150.35
Total:
A.GENERAL SERVICES
B.SOCIAL SERVICES 562.38TOTAL 27.09 472.96 27.79 731.36 39.61 698.86 39.61 760.42 72.00
A.GENERAL SERVICES
(a) Education,Sports,Art and culture
(b) Health and Family Welfare
(c) Water Supply,sanitation and Housing
562.38
361.47
361.30
27.09
-0.03
0.00
472.96
388.12
440.54
27.79
-0.01
-0.12
731.36
691.67
519.48
39.61
2.96
0.00
698.86
737.67
621.83
39.61
2.96
0.00
760.42
705.65
583.04
72.00
0.00
0.00
4047405540594070
4202
42104211
42154216
Capital Outlay on Other Fiscal ServicesCapital Outlay on PoliceCapital Outlay on Public WorksCapital Outlay on Other Administrative Services
Capital Outlay on Education, Sports, Art and Culture
Capital Outlay on Medical & Public HealthCapital Outlay on Family Welfare
Capital Outlay On Water Supply and SanitationCapital Outlay on Housing
0.00 62.25
499.38 0.75
361.47
361.30
1438.41 130.39
0.00 24.81-0.01 2.29
-0.03
0.00
0.00 6.68
0.00 66.87
404.29 1.80
388.12
440.54
944.33 81.40
0.08 26.81
0.00 0.90
-0.01
-0.12
-0.01 0.00
0.00 86.51
643.05 1.80
691.67
519.48
1231.50 213.90
0.00 30.61
6.00 3.00
2.96
0.00
0.00 66.53
0.00 86.51
610.55 1.80
737.67
621.83
1361.50 154.90
0.00 30.61
6.00 3.00
2.96
0.00
0.00 66.53
0.00 286.28 471.99
2.15
705.65
583.04
468.40 135.25
0.00 53.00 16.00
3.00
0.00
0.00
0.00 208.44
Total:
Total:
Total:
21674.19TOTAL C (P+NP) 26592.83 32398.78 31192.49 32175.31
21211.68 55081.58 26969.84 62219.73 37432.97 73324.37 37781.89 70965.73 40223.31 75226.37TOTAL-REVENUE ACCOUNT
TOTAL-REVENUE ACCOUNT (P+NP) 76293.26 89189.57 110757.34 108747.63 115449.68CAPITAL EXPENDITURE OUTSIDE REVENUE
A.GENERAL SERVICES
FDCC Page 51 of 109 Accounts Reckoner 2007-08 to 2015-16 BE
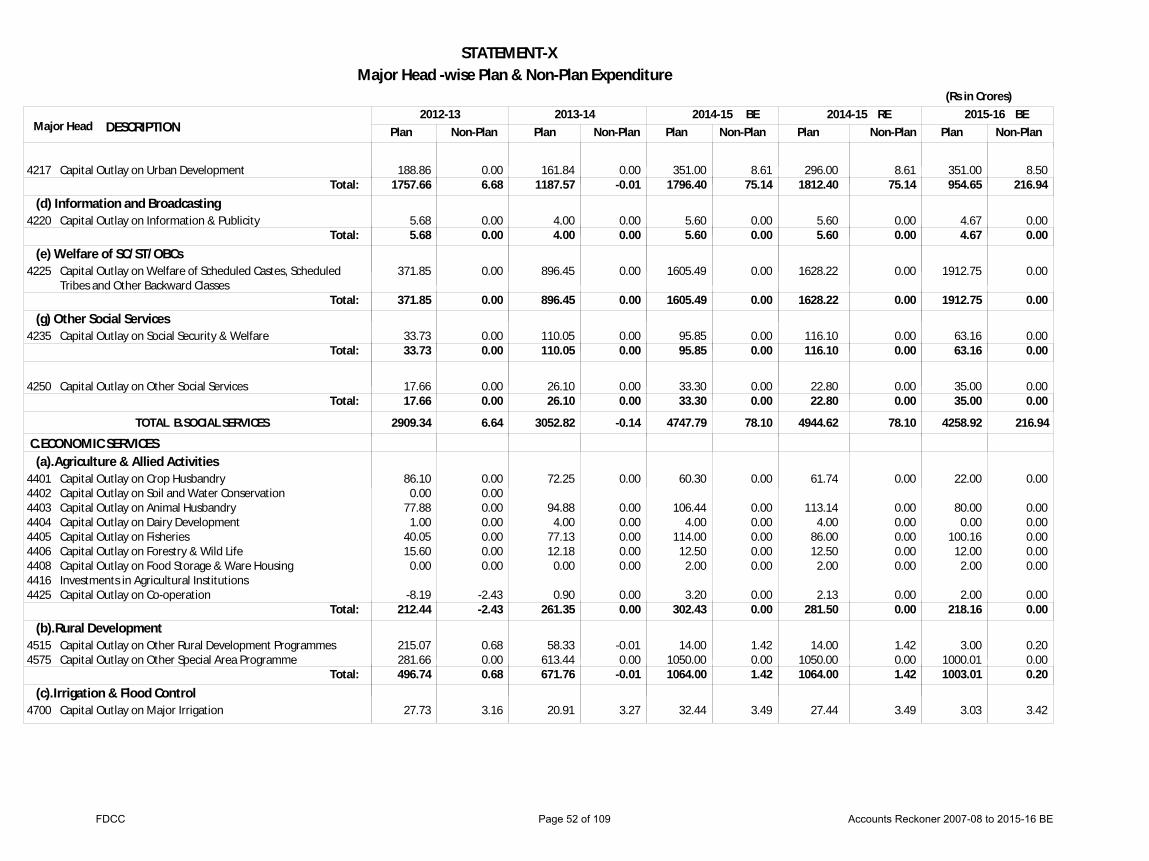
STATEMENT-XMajor Head -wise Plan & Non-Plan Expenditure
DESCRIPTION Plan Non-Plan Plan Non-Plan Plan Non-Plan Plan Non-Plan Plan Non-Plan2012-13 2013-14 2014-15 2014-15 2015-16 BERE
Major Head
(Rs in Crores)BE
C.ECONOMIC SERVICES 2909.34TOTAL 6.64 3052.82 -0.14 4747.79 78.10 4944.62 78.10 4258.92 216.94
(d) Information and Broadcasting
(e) Welfare of SC/ST/OBCs
(g) Other Social Services
(a).Agriculture & Allied Activities
(b).Rural Development
(c).Irrigation & Flood Control
1757.66
5.68
371.85
33.73
17.66
212.44
496.74
6.68
0.00
0.00
0.00
0.00
-2.43
0.68
1187.57
4.00
896.45
110.05
26.10
261.35
671.76
-0.01
0.00
0.00
0.00
0.00
0.00
-0.01
1796.40
5.60
1605.49
95.85
33.30
302.43
1064.00
75.14
0.00
0.00
0.00
0.00
0.00
1.42
1812.40
5.60
1628.22
116.10
22.80
281.50
1064.00
75.14
0.00
0.00
0.00
0.00
0.00
1.42
954.65
4.67
1912.75
63.16
35.00
218.16
1003.01
216.94
0.00
0.00
0.00
0.00
0.00
0.20
4217
4220
4225
4235
4250
440144024403440444054406440844164425
45154575
4700
Capital Outlay on Urban Development
Capital Outlay on Information & Publicity
Capital Outlay on Welfare of Scheduled Castes, ScheduledTribes and Other Backward Classes
Capital Outlay on Social Security & Welfare
Capital Outlay on Other Social Services
Capital Outlay on Crop HusbandryCapital Outlay on Soil and Water ConservationCapital Outlay on Animal HusbandryCapital Outlay on Dairy DevelopmentCapital Outlay on FisheriesCapital Outlay on Forestry & Wild LifeCapital Outlay on Food Storage & Ware HousingInvestments in Agricultural InstitutionsCapital Outlay on Co-operation
Capital Outlay on Other Rural Development ProgrammesCapital Outlay on Other Special Area Programme
Capital Outlay on Major Irrigation
188.86
5.68
371.85
33.73
17.66
86.10 0.00
77.88 1.00
40.05 15.60
0.00
-8.19
215.07 281.66
27.73
0.00
0.00
0.00
0.00
0.00
0.00 0.00 0.00 0.00 0.00 0.00 0.00
-2.43
0.68 0.00
3.16
161.84
4.00
896.45
110.05
26.10
72.25
94.88 4.00
77.13 12.18
0.00
0.90
58.33 613.44
20.91
0.00
0.00
0.00
0.00
0.00
0.00
0.00 0.00 0.00 0.00 0.00
0.00
-0.01 0.00
3.27
351.00
5.60
1605.49
95.85
33.30
60.30
106.44 4.00
114.00 12.50
2.00
3.20
14.00 1050.00
32.44
8.61
0.00
0.00
0.00
0.00
0.00
0.00 0.00 0.00 0.00 0.00
0.00
1.42 0.00
3.49
296.00
5.60
1628.22
116.10
22.80
61.74
113.14 4.00
86.00 12.50
2.00
2.13
14.00 1050.00
27.44
8.61
0.00
0.00
0.00
0.00
0.00
0.00 0.00 0.00 0.00 0.00
0.00
1.42 0.00
3.49
351.00
4.67
1912.75
63.16
35.00
22.00
80.00 0.00
100.16 12.00
2.00
2.00
3.00 1000.01
3.03
8.50
0.00
0.00
0.00
0.00
0.00
0.00 0.00 0.00 0.00 0.00
0.00
0.20 0.00
3.42
Total:
Total:
Total:
Total:
Total:
Total:
Total:
B.SOCIAL SERVICES
FDCC Page 52 of 109 Accounts Reckoner 2007-08 to 2015-16 BE

STATEMENT-XMajor Head -wise Plan & Non-Plan Expenditure
DESCRIPTION Plan Non-Plan Plan Non-Plan Plan Non-Plan Plan Non-Plan Plan Non-Plan2012-13 2013-14 2014-15 2014-15 2015-16 BERE
Major Head
(Rs in Crores)BE
15156.82 321.65 16620.11 326.75 19840.50 173.29 18706.77 173.29 20124.28 439.34 11685.10TOTAL 287.92 13094.34 299.10 14361.35 55.57 13063.29 55.57 15104.94 150.40
(d).Energy
(e).Industries & Minerals
(f).Transport
(g).General Economic Services
4834.16
1162.00
148.40
4639.57
191.78
280.96
-1.10
-32.76
43.80
-1.22
6116.18
300.00
191.30
5256.71
297.04
267.64
4.88
-14.01
41.77
-1.17
8015.92
800.00
218.36
3653.46
307.17
7.06
2.09
0.00
45.00
0.00
6617.58
300.00
330.56
4164.64
305.01
7.06
2.09
0.00
45.00
0.00
8996.49
0.02
280.09
4036.23
570.94
106.00
0.20
0.00
44.00
0.00
4701470247054711
4801
4851485248534858485948604885
50515053505450555075
545254655475
Capital Outlay on Medium IrrigationCapital Outlay on Minor IrrigationCapital Outlay on Command Area DevelopmentCapital Outlay on Flood Control Projects
Capital Outlay on Power Projects
Capital Outlay on Village & Small IndustriesCapital Outlay on Iron and Steel IndustriesCapital Outlay on Non-Ferrous Mining & Metallurgical IndustriesCapital Outlay on Engineering IndustriesCapital Outlay on Telecommunication and Electronics IndustriesCapital Outlay on Consumer IndustriesOther Capital Outlay on Industries & Minerals
Capital Outlay on Ports & Light HousesCapital Outlay on Civil AviationCapital Outlay on Roads & BridgesCapital Outlay on Road TransportCapital Outlay On Other Transport Services
Capital Outlay on TourismInvestments in General Financial and Trading InstitutionsCapital Outlay on Other General Economic Services
3664.48 1044.11
30.63 67.21
1162.00
14.54 1.00 0.00
12.33
66.87 53.66
15.07
4510.08 114.43
130.72 45.86 15.20
276.79 1.01 0.00 0.00
-1.10
0.00-32.76
0.00 0.00
0.00 0.00
0.00
43.80 0.00
0.00-1.02-0.21
4982.82 983.54
76.23 52.68
300.00
50.55 38.66
0.00
50.16 51.93
20.35
5171.48 64.88
194.22 86.51 16.30
264.39-0.02 0.00 0.00
4.88
0.00 0.00
0.00
-14.00 0.00
-0.14
41.91 0.00
-0.01-1.00-0.16
6689.59 1068.11
180.01 45.78
800.00
73.62 97.92
0.00
46.82 0.00
54.00
3517.46 82.00
276.77 12.00 18.40
3.58 0.00 0.00 0.00
2.09
0.00 0.00
0.00
0.00 0.00
0.00
45.00 0.00
0.00 0.00 0.00
5140.59 1226.77
175.01 47.78
300.00
72.12 76.92
22.92
83.60 75.00
45.00
4055.63 64.01
256.77 26.14 22.10
3.58 0.00 0.00 0.00
2.09
0.00 0.00
0.00
0.00 0.00
0.00
45.00 0.00
0.00 0.00 0.00
7591.85 1179.54
180.01 42.06
0.02
45.67 150.01
0.00
9.41 75.00
92.41
3885.81 58.01
275.00 217.68
78.26
102.58 0.00 0.00 0.00
0.20
0.00 0.00
0.00
0.00 0.00
0.00
44.00 0.00
0.00 0.00 0.00
Total:
Total:
Total:
Total:
Total:
LOANS FOR PUBLIC DEBT6003 Internal Debt of the State Government 0.00 3030.53 0.00 3122.57 0.00 5986.01 0.00 4034.25 0.00 5011.78
C.ECONOMIC SERVICESTOTAL-CAPITAL ACCOUNT
CAPITAL ACCOUNT (P+NP) 15478.47 16946.86 20013.79 18880.06 20563.62
FDCC Page 53 of 109 Accounts Reckoner 2007-08 to 2015-16 BE
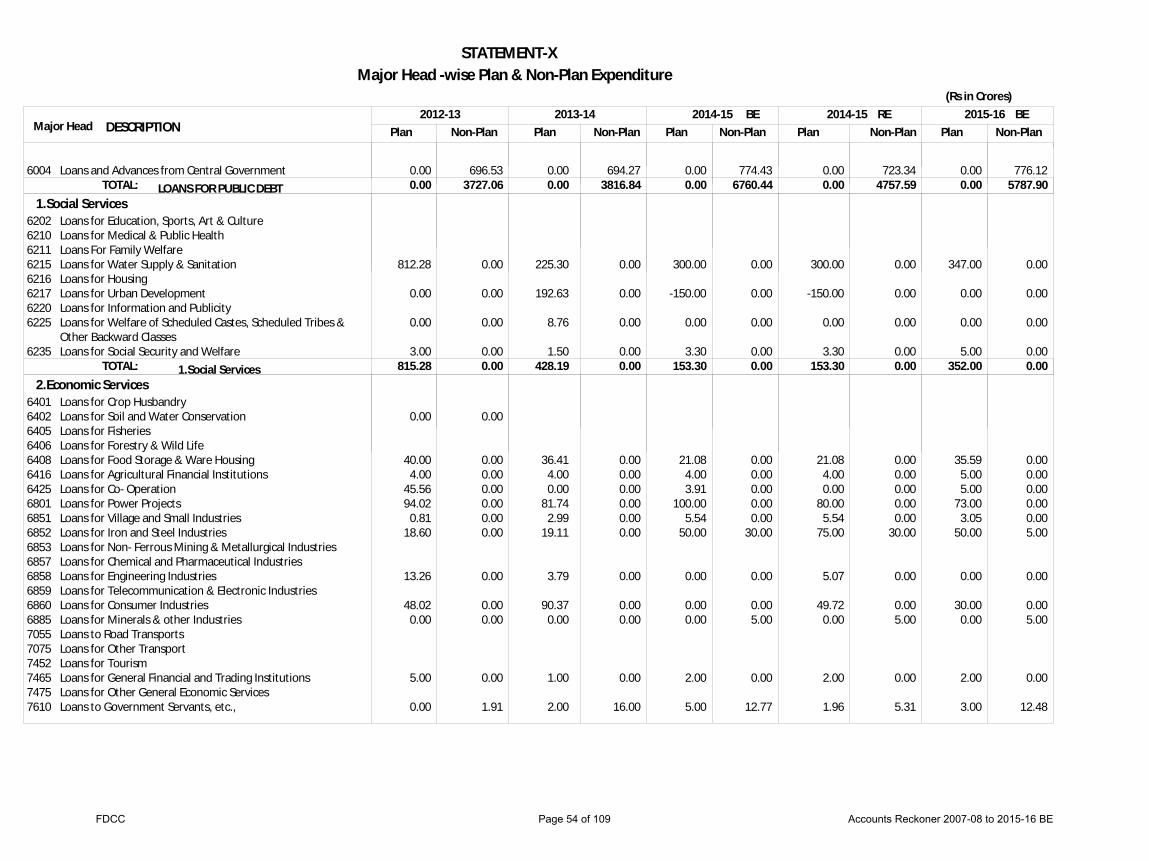
STATEMENT-XMajor Head -wise Plan & Non-Plan Expenditure
DESCRIPTION Plan Non-Plan Plan Non-Plan Plan Non-Plan Plan Non-Plan Plan Non-Plan2012-13 2013-14 2014-15 2014-15 2015-16 BERE
Major Head
(Rs in Crores)BE
1.Social Services
2.Economic Services
0.00
815.28
3727.06
0.00
0.00
428.19
3816.84
0.00
0.00
153.30
6760.44
0.00
0.00
153.30
4757.59
0.00
0.00
352.00
5787.90
0.00
6004
62026210621162156216621762206225
6235
6401640264056406640864166425680168516852685368576858685968606885705570757452746574757610
Loans and Advances from Central Government
Loans for Education, Sports, Art & CultureLoans for Medical & Public HealthLoans For Family WelfareLoans for Water Supply & SanitationLoans for HousingLoans for Urban DevelopmentLoans for Information and PublicityLoans for Welfare of Scheduled Castes, Scheduled Tribes &Other Backward ClassesLoans for Social Security and Welfare
Loans for Crop HusbandryLoans for Soil and Water ConservationLoans for FisheriesLoans for Forestry & Wild LifeLoans for Food Storage & Ware HousingLoans for Agricultural Financial InstitutionsLoans for Co- OperationLoans for Power ProjectsLoans for Village and Small IndustriesLoans for Iron and Steel IndustriesLoans for Non- Ferrous Mining & Metallurgical IndustriesLoans for Chemical and Pharmaceutical IndustriesLoans for Engineering IndustriesLoans for Telecommunication & Electronic IndustriesLoans for Consumer IndustriesLoans for Minerals & other IndustriesLoans to Road TransportsLoans for Other TransportLoans for TourismLoans for General Financial and Trading InstitutionsLoans for Other General Economic ServicesLoans to Government Servants, etc.,
0.00
812.28
0.00
0.00
3.00
0.00
40.00 4.00
45.56 94.02
0.81 18.60
13.26
48.02 0.00
5.00
0.00
696.53
0.00
0.00
0.00
0.00
0.00
0.00 0.00 0.00 0.00 0.00 0.00
0.00
0.00 0.00
0.00
1.91
0.00
225.30
192.63
8.76
1.50
36.41 4.00 0.00
81.74 2.99
19.11
3.79
90.37 0.00
1.00
2.00
694.27
0.00
0.00
0.00
0.00
0.00 0.00 0.00 0.00 0.00 0.00
0.00
0.00 0.00
0.00
16.00
0.00
300.00
-150.00
0.00
3.30
21.08 4.00 3.91
100.00 5.54
50.00
0.00
0.00 0.00
2.00
5.00
774.43
0.00
0.00
0.00
0.00
0.00 0.00 0.00 0.00 0.00
30.00
0.00
0.00 5.00
0.00
12.77
0.00
300.00
-150.00
0.00
3.30
21.08 4.00 0.00
80.00 5.54
75.00
5.07
49.72 0.00
2.00
1.96
723.34
0.00
0.00
0.00
0.00
0.00 0.00 0.00 0.00 0.00
30.00
0.00
0.00 5.00
0.00
5.31
0.00
347.00
0.00
0.00
5.00
35.59 5.00 5.00
73.00 3.05
50.00
0.00
30.00 0.00
2.00
3.00
776.12
0.00
0.00
0.00
0.00
0.00 0.00 0.00 0.00 0.00 5.00
0.00
0.00 5.00
0.00
12.48
TOTAL:
TOTAL:
LOANS FOR PUBLIC DEBT
1.Social Services
FDCC Page 54 of 109 Accounts Reckoner 2007-08 to 2015-16 BE
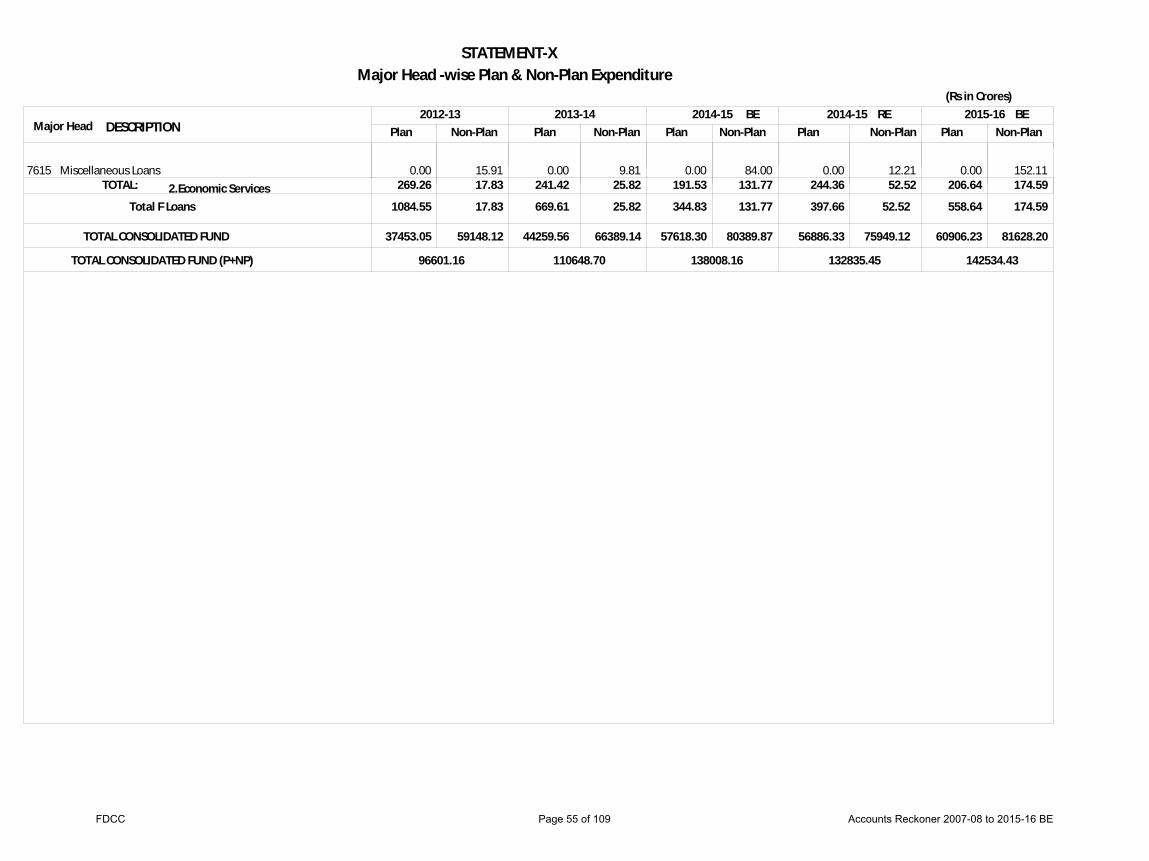
STATEMENT-XMajor Head -wise Plan & Non-Plan Expenditure
DESCRIPTION Plan Non-Plan Plan Non-Plan Plan Non-Plan Plan Non-Plan Plan Non-Plan2012-13 2013-14 2014-15 2014-15 2015-16 BERE
Major Head
(Rs in Crores)BE
1084.55Total F Loans 17.83 669.61 25.82 344.83 131.77 397.66 52.52 558.64 174.59
269.26 17.83 241.42 25.82 191.53 131.77 244.36 52.52 206.64 174.597615 Miscellaneous Loans 0.00 15.91 0.00 9.81 0.00 84.00 0.00 12.21 0.00 152.11
TOTAL:
TOTAL CONSOLIDATED FUND 37453.05 59148.12 44259.56 66389.14 57618.30 80389.87 56886.33 75949.12 60906.23 81628.20
TOTAL CONSOLIDATED FUND (P+NP) 96601.16 110648.70 138008.16 132835.45 142534.43
2.Economic Services
FDCC Page 55 of 109 Accounts Reckoner 2007-08 to 2015-16 BE

STATEMENT -XISummary of Appropriation Accounts Control Over Expenditure
(Rs in Crores)
2004-05 2005-06 2006-07 2007-08 2008-09 2009-10 2010-11 2011-12 2012-13 2013-14Original Grants/ AppropriationRevenueCaptialPublic DebitLoans & AdvancesOther (Intrersate Settlement)TotalSupplementaryRevenueCaptialPublic DebitLonas & AdvancesTotalTotal Grants/AppropriationRevenueCaptialPublic DebitLonas & AdvancesOther (Intrersate Settlement)TotalActual Expenditure(*)RevenueCaptialPublic DebitLonas & AdvancesOther (Intrersate Settlement)TotalVarations ( Excess(+) Savings(-)Revenue
22322.37 3865.57 2392.45
511.50
29091.89
2638.71 303.90
4931.67 139.31
8013.59
24961.08 4169.47 7324.12
650.81
37105.48
21413.72 3105.77 9323.06 1011.20
34853.75
-3547.36
26020.06 3969.48 3337.05
665.55
33992.14
1535.06 1240.51
500.40 111.94
3387.91
27555.12 5209.99 3837.45
777.49
37380.05
24667.34 4732.58 5492.19
611.42
35503.53
-2887.78
28862.79 5710.79 2246.17
343.63
37163.38
2692.16 1294.39
56.54 321.70
4364.79
31554.95 7005.18 2302.71
665.33
41528.17
28813.36 6192.64
810.86 391.80
36208.66
-2741.59
35183.86 7276.31 2304.39
334.53
45099.09
4013.30 3199.40
0.00 180.37
7393.07
39197.16 10475.71
2304.39 514.90
52492.16
33883.10 8679.33 1749.37
357.23
44669.03
-5314.06
39761.80 9115.48 2649.47
646.35
52173.10
2746.11 2217.76
0.00 302.18
5266.05
42507.91 11333.24
2649.47 948.53
57439.15
37595.68 8805.81 1328.77
756.74
48487.00
-4912.23
46306.82 11822.58
3157.18 1007.09
62293.67
3517.39 2186.72
0.00 537.51
6241.62
49824.21 14009.30
3157.18 1544.60
68535.29
42067.22 10363.85
1777.90 731.34
54940.31
-7756.99
47907.38 11950.85
3554.31 1009.09
64421.63
8212.26 3519.88
128.76 117.44
11978.34
56119.64 15470.73
3683.07 1126.53
76399.97
49469.60 12677.74
2308.33 981.58
65437.25
-6650.04
66180.72 15026.74
4462.11 2067.87
87737.44
6867.60 4653.21
0.00 486.41
12007.22
73048.32 19679.95
4462.11 2554.28
99744.66
65509.74 16013.85
3319.88 1986.15
86829.62
-7538.58
83182.85 16512.69
5670.08 2339.39
107705.01
14203.01 4424.91
0.00 62.26
18690.18
97385.86 20937.60
5670.08 2401.65
126395.19
78614.08 16309.68
3733.10 1298.09
99954.95
-18771.78
98640.19 19639.39
5840.42 995.93
125115.93
7763.23 4302.63
0.00 132.62
12198.48
106403.42 23942.02
5840.42 1128.55
137314.41
90862.30 18128.17
3823.46 902.80
113716.73
-15541.12
FDCC Page 56 of 109 Accounts Reckoner 2007-08 to 2015-16 BE
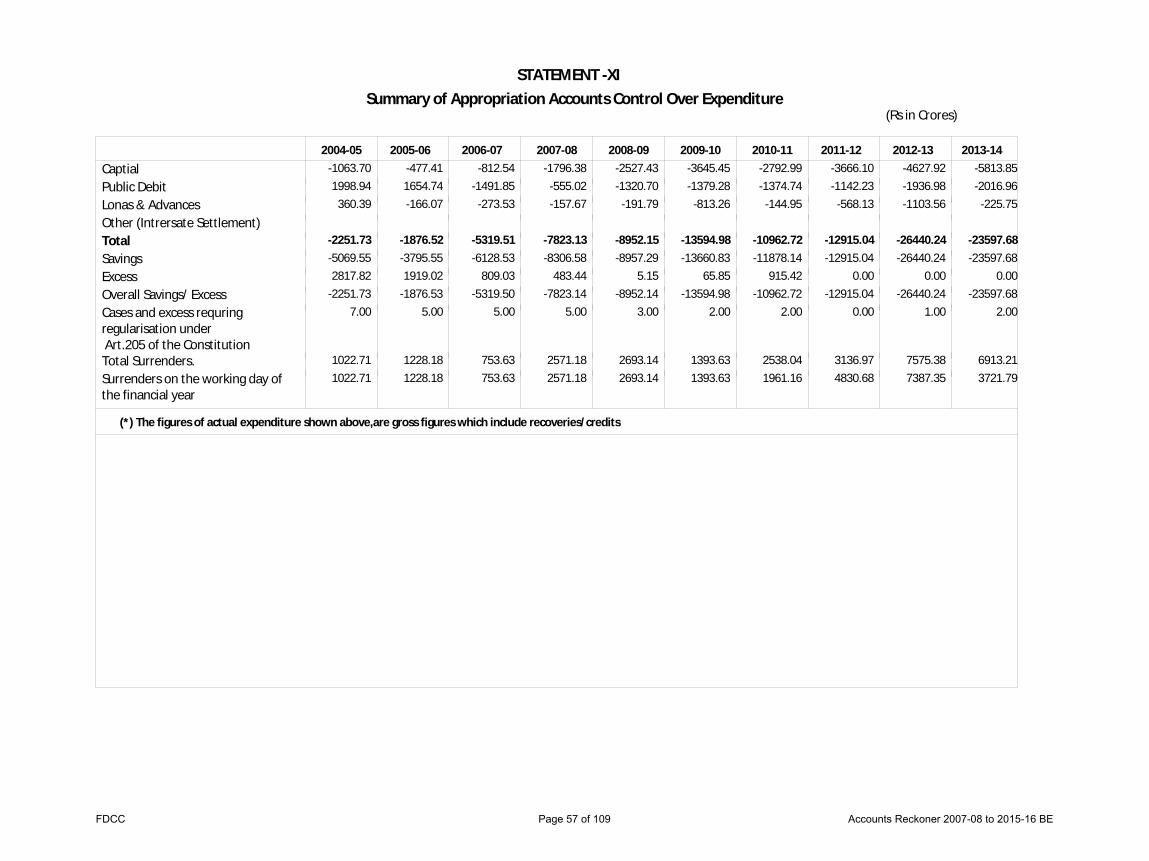
STATEMENT -XISummary of Appropriation Accounts Control Over Expenditure
(Rs in Crores)
2004-05 2005-06 2006-07 2007-08 2008-09 2009-10 2010-11 2011-12 2012-13 2013-14CaptialPublic DebitLonas & AdvancesOther (Intrersate Settlement)TotalSavingsExcessOverall Savings/ ExcessCases and excess requringregularisation under Art.205 of the ConstitutionTotal Surrenders.Surrenders on the working day ofthe financial year
-1063.70 1998.94
360.39
-2251.73-5069.55 2817.82-2251.73
7.00
1022.71 1022.71
-477.41 1654.74-166.07
-1876.52-3795.55 1919.02-1876.53
5.00
1228.18 1228.18
-812.54-1491.85
-273.53
-5319.51-6128.53
809.03-5319.50
5.00
753.63 753.63
-1796.38-555.02-157.67
-7823.13-8306.58
483.44-7823.14
5.00
2571.18 2571.18
-2527.43-1320.70
-191.79
-8952.15-8957.29
5.15-8952.14
3.00
2693.14 2693.14
-3645.45-1379.28
-813.26
-13594.98-13660.83
65.85-13594.98
2.00
1393.63 1393.63
-2792.99-1374.74
-144.95
-10962.72-11878.14
915.42-10962.72
2.00
2538.04 1961.16
-3666.10-1142.23
-568.13
-12915.04-12915.04
0.00-12915.04
0.00
3136.97 4830.68
-4627.92-1936.98-1103.56
-26440.24-26440.24
0.00-26440.24
1.00
7575.38 7387.35
-5813.85-2016.96
-225.75
-23597.68-23597.68
0.00-23597.68
2.00
6913.21 3721.79
(*) The figures of actual expenditure shown above,are gross figures which include recoveries/credits
FDCC Page 57 of 109 Accounts Reckoner 2007-08 to 2015-16 BE
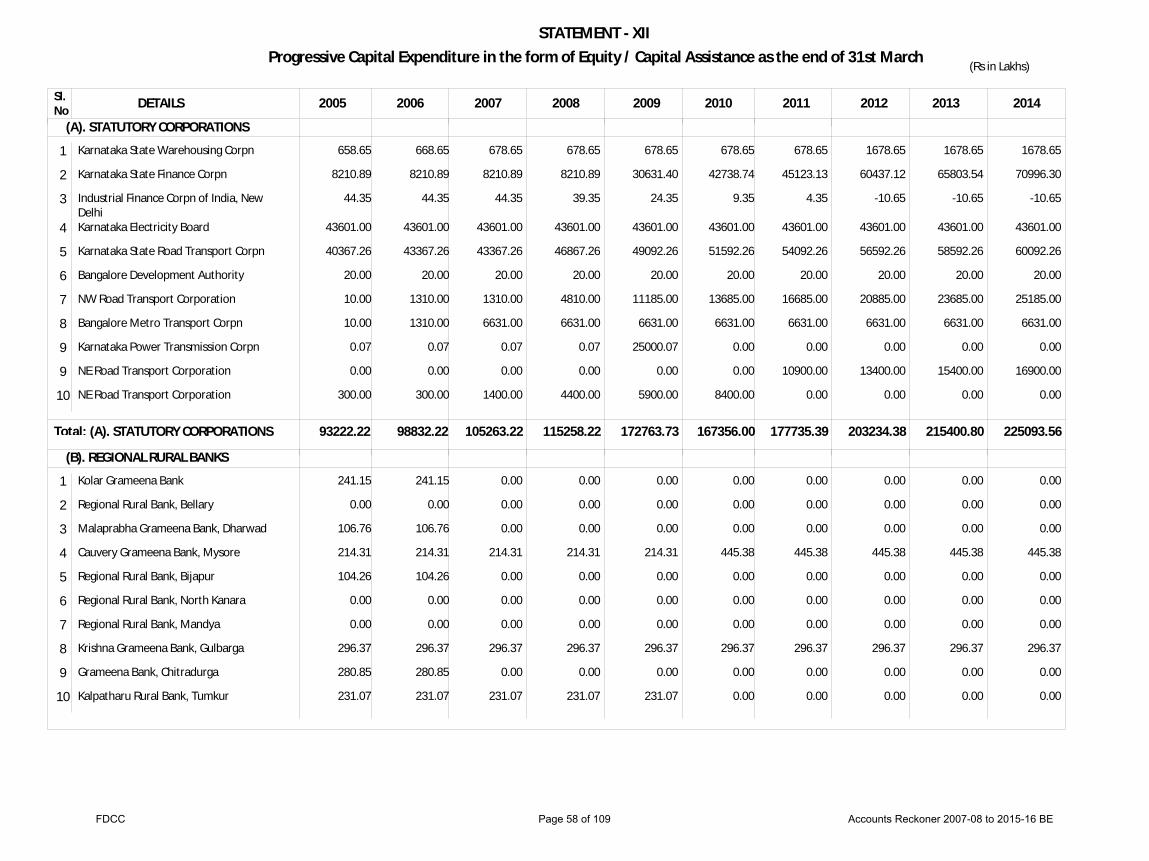
STATEMENT - XIIProgressive Capital Expenditure in the form of Equity / Capital Assistance as the end of 31st March
2005 2006 2007 2008 2009 2010 2014201320122011
(Rs in Lakhs)
DETAILSSl.No
(A). STATUTORY CORPORATIONS
(B). REGIONAL RURAL BANKS
93222.22 98832.22 105263.22 115258.22 172763.73 167356.00 177735.39 203234.38 215400.80 225093.56
Karnataka State Warehousing Corpn
Karnataka State Finance Corpn
Industrial Finance Corpn of India, NewDelhiKarnataka Electricity Board
Karnataka State Road Transport Corpn
Bangalore Development Authority
NW Road Transport Corporation
Bangalore Metro Transport Corpn
Karnataka Power Transmission Corpn
NE Road Transport Corporation
NE Road Transport Corporation
Kolar Grameena Bank
Regional Rural Bank, Bellary
Malaprabha Grameena Bank, Dharwad
Cauvery Grameena Bank, Mysore
Regional Rural Bank, Bijapur
Regional Rural Bank, North Kanara
Regional Rural Bank, Mandya
Krishna Grameena Bank, Gulbarga
Grameena Bank, Chitradurga
Kalpatharu Rural Bank, Tumkur
1
2
3
4
5
6
7
8
9
9
10
1
2
3
4
5
6
7
8
9
10
658.65
8210.89
44.35
43601.00
40367.26
20.00
10.00
10.00
0.07
0.00
300.00
241.15
0.00
106.76
214.31
104.26
0.00
0.00
296.37
280.85
231.07
668.65
8210.89
44.35
43601.00
43367.26
20.00
1310.00
1310.00
0.07
0.00
300.00
241.15
0.00
106.76
214.31
104.26
0.00
0.00
296.37
280.85
231.07
678.65
8210.89
44.35
43601.00
43367.26
20.00
1310.00
6631.00
0.07
0.00
1400.00
0.00
0.00
0.00
214.31
0.00
0.00
0.00
296.37
0.00
231.07
678.65
8210.89
39.35
43601.00
46867.26
20.00
4810.00
6631.00
0.07
0.00
4400.00
0.00
0.00
0.00
214.31
0.00
0.00
0.00
296.37
0.00
231.07
678.65
30631.40
24.35
43601.00
49092.26
20.00
11185.00
6631.00
25000.07
0.00
5900.00
0.00
0.00
0.00
214.31
0.00
0.00
0.00
296.37
0.00
231.07
678.65
42738.74
9.35
43601.00
51592.26
20.00
13685.00
6631.00
0.00
0.00
8400.00
0.00
0.00
0.00
445.38
0.00
0.00
0.00
296.37
0.00
0.00
678.65
45123.13
4.35
43601.00
54092.26
20.00
16685.00
6631.00
0.00
10900.00
0.00
0.00
0.00
0.00
445.38
0.00
0.00
0.00
296.37
0.00
0.00
1678.65
60437.12
-10.65
43601.00
56592.26
20.00
20885.00
6631.00
0.00
13400.00
0.00
0.00
0.00
0.00
445.38
0.00
0.00
0.00
296.37
0.00
0.00
1678.65
65803.54
-10.65
43601.00
58592.26
20.00
23685.00
6631.00
0.00
15400.00
0.00
0.00
0.00
0.00
445.38
0.00
0.00
0.00
296.37
0.00
0.00
1678.65
70996.30
-10.65
43601.00
60092.26
20.00
25185.00
6631.00
0.00
16900.00
0.00
0.00
0.00
0.00
445.38
0.00
0.00
0.00
296.37
0.00
0.00
Total: (A). STATUTORY CORPORATIONS
FDCC Page 58 of 109 Accounts Reckoner 2007-08 to 2015-16 BE

STATEMENT - XIIProgressive Capital Expenditure in the form of Equity / Capital Assistance as the end of 31st March
2005 2006 2007 2008 2009 2010 2014201320122011
(Rs in Lakhs)
DETAILSSl.No
(C). GOVERNMENT COMPANIES
1941.52 1941.52 1941.52 1941.52 1941.52 1841.52 1941.52 2114.52 2114.52 2114.52
Nethravathi Grameena Bank, Mangalore
Varada Grameena Bank, Kumta
Visveswaraiah Grameena Bank, Mandya
Sahyadri Grameena Bank, Shimoga
Thungabhadra Grameena Bank, Bellary
Grameena Bank, Chickmagalore
Regional Rural Bank, South Kanara
Karnataka Vikas Grameena Bank
Pragathi Grameen Bank (**)
Karnataka State Indl. Inv.& Dev. CorpnLtdKarnataka State HandicraftsDevelopment CorpnMysore Chrome Tanning Company Ltd.
Mysore Sugar Company Ltd.
Mysore Sales International Ltd.
Radio & Electricals Mfg. Company Ltd
Mysore Paints & Varnishes Ltd.
Thungabhadra Steel Products Ltd
Hutti Gold Mines Company Ltd
Karnataka State Small Industries Dev.Corpn LtdNew Government Electric Factory Ltd.
Visveswaraiah Iron & Steel Ltd.,BhadravathiIndian Telephone Industries Ltd.
11
12
13
14
15
16
17
18
19
1
2
3
4
5
6
7
8
9
10
11
12
13
72.41
69.91
78.49
84.91
55.46
105.57
0.00
0.00
0.00
28235.95
258.03
32.04
626.61
0.00
101.52
94.18
74.00
140.27
1997.72
1548.02
3276.23
31.25
72.41
69.91
78.49
84.91
55.46
105.57
0.00
0.00
0.00
44792.61
258.03
32.04
626.61
0.00
101.52
94.18
74.00
140.27
1997.72
1548.02
3276.23
31.25
0.00
0.00
78.49
0.00
0.00
105.57
0.00
353.34
662.37
62509.84
258.03
32.04
626.61
0.00
101.52
94.18
74.00
140.27
1997.72
1548.02
3276.23
31.25
0.00
0.00
78.49
0.00
0.00
105.57
0.00
353.34
662.37
92055.40
258.03
32.04
626.61
0.00
101.52
94.18
74.00
140.27
1997.72
1548.02
3276.23
31.25
0.00
0.00
78.49
0.00
0.00
105.57
0.00
353.34
662.37
106913.23
258.03
32.04
626.61
0.00
101.52
94.18
74.00
300.33
1997.72
1548.02
3276.23
31.25
0.00
0.00
78.49
0.00
0.00
105.57
0.00
353.34
562.37
127239.28
258.03
32.04
7402.36
0.00
101.52
94.18
74.00
300.33
1997.72
1548.02
3276.23
31.25
0.00
0.00
78.49
0.00
0.00
105.57
0.00
353.34
662.37
155246.52
258.03
32.04
11359.13
383.20
101.52
94.18
74.00
300.33
1997.72
1548.02
3276.23
31.25
0.00
0.00
78.49
0.00
0.00
278.57
0.00
353.34
662.37
169222.62
258.03
32.04
16518.00
383.20
101.52
94.18
74.00
300.33
1997.72
1548.02
3276.23
31.25
0.00
0.00
78.49
0.00
0.00
278.57
0.00
353.34
662.37
176464.44
258.03
32.04
20605.71
383.20
101.52
94.18
74.00
300.33
1997.72
1548.02
0.00
31.25
0.00
0.00
78.49
0.00
0.00
278.57
0.00
353.34
662.37
181573.22
258.03
32.04
21733.07
383.20
101.52
94.18
74.00
300.33
52.29
1548.02
0.00
31.25
Total: (B). REGIONAL RURAL BANKS
FDCC Page 59 of 109 Accounts Reckoner 2007-08 to 2015-16 BE
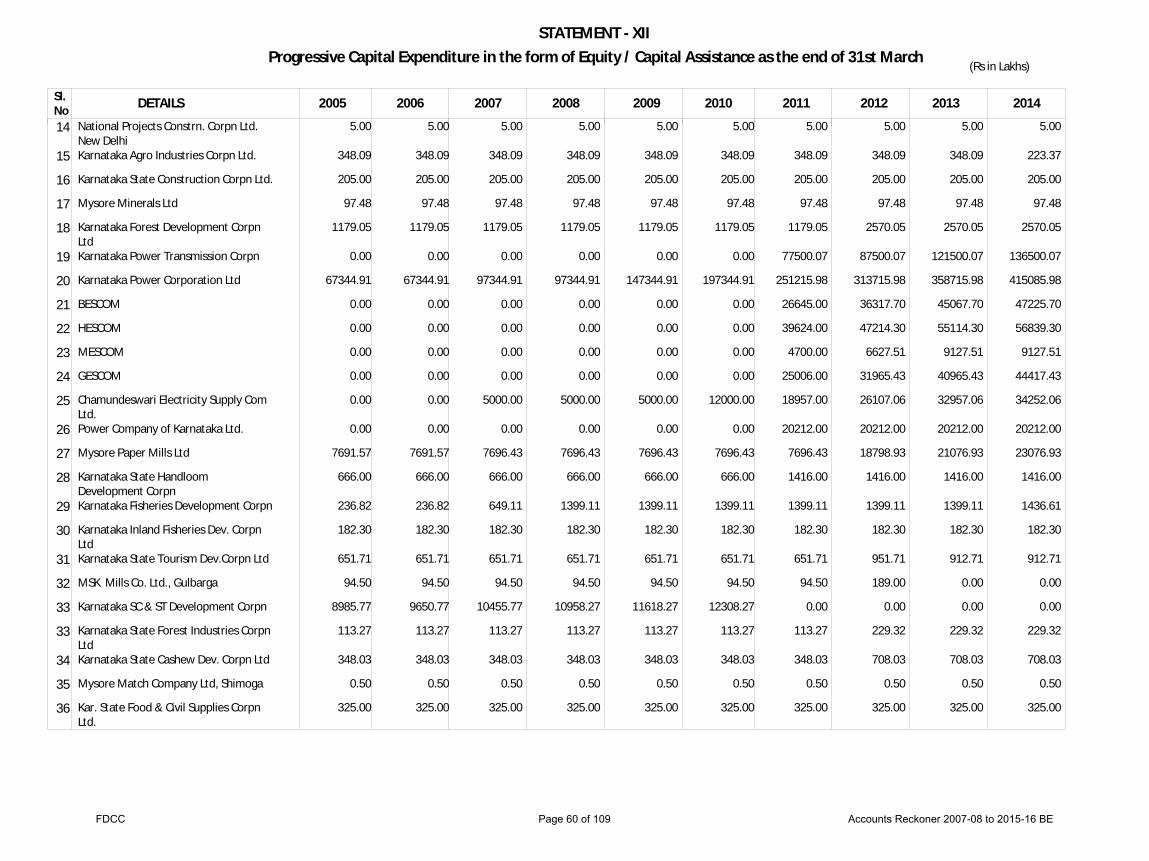
STATEMENT - XIIProgressive Capital Expenditure in the form of Equity / Capital Assistance as the end of 31st March
2005 2006 2007 2008 2009 2010 2014201320122011
(Rs in Lakhs)
DETAILSSl.No
National Projects Constrn. Corpn Ltd.New DelhiKarnataka Agro Industries Corpn Ltd.
Karnataka State Construction Corpn Ltd.
Mysore Minerals Ltd
Karnataka Forest Development CorpnLtdKarnataka Power Transmission Corpn
Karnataka Power Corporation Ltd
BESCOM
HESCOM
MESCOM
GESCOM
Chamundeswari Electricity Supply ComLtd.Power Company of Karnataka Ltd.
Mysore Paper Mills Ltd
Karnataka State HandloomDevelopment CorpnKarnataka Fisheries Development Corpn
Karnataka Inland Fisheries Dev. CorpnLtdKarnataka State Tourism Dev.Corpn Ltd
MSK Mills Co. Ltd., Gulbarga
Karnataka SC & ST Development Corpn
Karnataka State Forest Industries CorpnLtdKarnataka State Cashew Dev. Corpn Ltd
Mysore Match Company Ltd, Shimoga
Kar. State Food & Civil Supplies CorpnLtd.
14
15
16
17
18
19
20
21
22
23
24
25
26
27
28
29
30
31
32
33
33
34
35
36
5.00
348.09
205.00
97.48
1179.05
0.00
67344.91
0.00
0.00
0.00
0.00
0.00
0.00
7691.57
666.00
236.82
182.30
651.71
94.50
8985.77
113.27
348.03
0.50
325.00
5.00
348.09
205.00
97.48
1179.05
0.00
67344.91
0.00
0.00
0.00
0.00
0.00
0.00
7691.57
666.00
236.82
182.30
651.71
94.50
9650.77
113.27
348.03
0.50
325.00
5.00
348.09
205.00
97.48
1179.05
0.00
97344.91
0.00
0.00
0.00
0.00
5000.00
0.00
7696.43
666.00
649.11
182.30
651.71
94.50
10455.77
113.27
348.03
0.50
325.00
5.00
348.09
205.00
97.48
1179.05
0.00
97344.91
0.00
0.00
0.00
0.00
5000.00
0.00
7696.43
666.00
1399.11
182.30
651.71
94.50
10958.27
113.27
348.03
0.50
325.00
5.00
348.09
205.00
97.48
1179.05
0.00
147344.91
0.00
0.00
0.00
0.00
5000.00
0.00
7696.43
666.00
1399.11
182.30
651.71
94.50
11618.27
113.27
348.03
0.50
325.00
5.00
348.09
205.00
97.48
1179.05
0.00
197344.91
0.00
0.00
0.00
0.00
12000.00
0.00
7696.43
666.00
1399.11
182.30
651.71
94.50
12308.27
113.27
348.03
0.50
325.00
5.00
348.09
205.00
97.48
1179.05
77500.07
251215.98
26645.00
39624.00
4700.00
25006.00
18957.00
20212.00
7696.43
1416.00
1399.11
182.30
651.71
94.50
0.00
113.27
348.03
0.50
325.00
5.00
348.09
205.00
97.48
2570.05
87500.07
313715.98
36317.70
47214.30
6627.51
31965.43
26107.06
20212.00
18798.93
1416.00
1399.11
182.30
951.71
189.00
0.00
229.32
708.03
0.50
325.00
5.00
348.09
205.00
97.48
2570.05
121500.07
358715.98
45067.70
55114.30
9127.51
40965.43
32957.06
20212.00
21076.93
1416.00
1399.11
182.30
912.71
0.00
0.00
229.32
708.03
0.50
325.00
5.00
223.37
205.00
97.48
2570.05
136500.07
415085.98
47225.70
56839.30
9127.51
44417.43
34252.06
20212.00
23076.93
1416.00
1436.61
182.30
912.71
0.00
0.00
229.32
708.03
0.50
325.00
FDCC Page 60 of 109 Accounts Reckoner 2007-08 to 2015-16 BE
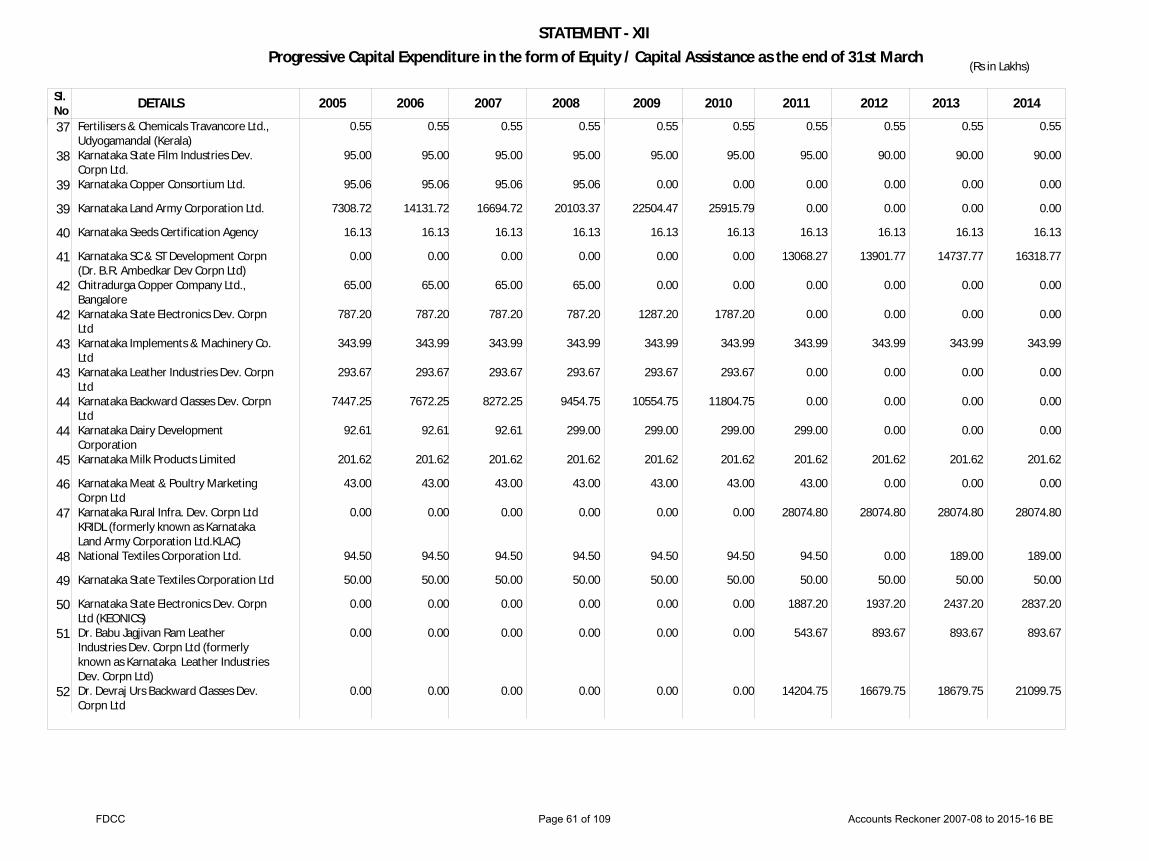
STATEMENT - XIIProgressive Capital Expenditure in the form of Equity / Capital Assistance as the end of 31st March
2005 2006 2007 2008 2009 2010 2014201320122011
(Rs in Lakhs)
DETAILSSl.No
Fertilisers & Chemicals Travancore Ltd.,Udyogamandal (Kerala)Karnataka State Film Industries Dev.Corpn Ltd.Karnataka Copper Consortium Ltd.
Karnataka Land Army Corporation Ltd.
Karnataka Seeds Certification Agency
Karnataka SC & ST Development Corpn(Dr. B.R. Ambedkar Dev Corpn Ltd)Chitradurga Copper Company Ltd.,BangaloreKarnataka State Electronics Dev. CorpnLtdKarnataka Implements & Machinery Co.LtdKarnataka Leather Industries Dev. CorpnLtdKarnataka Backward Classes Dev. CorpnLtdKarnataka Dairy DevelopmentCorporationKarnataka Milk Products Limited
Karnataka Meat & Poultry MarketingCorpn LtdKarnataka Rural Infra. Dev. Corpn LtdKRIDL (formerly known as KarnatakaLand Army Corporation Ltd.KLAC)National Textiles Corporation Ltd.
Karnataka State Textiles Corporation Ltd
Karnataka State Electronics Dev. CorpnLtd (KEONICS)Dr. Babu Jagjivan Ram LeatherIndustries Dev. Corpn Ltd (formerlyknown as Karnataka Leather IndustriesDev. Corpn Ltd)Dr. Devraj Urs Backward Classes Dev.Corpn Ltd
37
38
39
39
40
41
42
42
43
43
44
44
45
46
47
48
49
50
51
52
0.55
95.00
95.06
7308.72
16.13
0.00
65.00
787.20
343.99
293.67
7447.25
92.61
201.62
43.00
0.00
94.50
50.00
0.00
0.00
0.00
0.55
95.00
95.06
14131.72
16.13
0.00
65.00
787.20
343.99
293.67
7672.25
92.61
201.62
43.00
0.00
94.50
50.00
0.00
0.00
0.00
0.55
95.00
95.06
16694.72
16.13
0.00
65.00
787.20
343.99
293.67
8272.25
92.61
201.62
43.00
0.00
94.50
50.00
0.00
0.00
0.00
0.55
95.00
95.06
20103.37
16.13
0.00
65.00
787.20
343.99
293.67
9454.75
299.00
201.62
43.00
0.00
94.50
50.00
0.00
0.00
0.00
0.55
95.00
0.00
22504.47
16.13
0.00
0.00
1287.20
343.99
293.67
10554.75
299.00
201.62
43.00
0.00
94.50
50.00
0.00
0.00
0.00
0.55
95.00
0.00
25915.79
16.13
0.00
0.00
1787.20
343.99
293.67
11804.75
299.00
201.62
43.00
0.00
94.50
50.00
0.00
0.00
0.00
0.55
95.00
0.00
0.00
16.13
13068.27
0.00
0.00
343.99
0.00
0.00
299.00
201.62
43.00
28074.80
94.50
50.00
1887.20
543.67
14204.75
0.55
90.00
0.00
0.00
16.13
13901.77
0.00
0.00
343.99
0.00
0.00
0.00
201.62
0.00
28074.80
0.00
50.00
1937.20
893.67
16679.75
0.55
90.00
0.00
0.00
16.13
14737.77
0.00
0.00
343.99
0.00
0.00
0.00
201.62
0.00
28074.80
189.00
50.00
2437.20
893.67
18679.75
0.55
90.00
0.00
0.00
16.13
16318.77
0.00
0.00
343.99
0.00
0.00
0.00
201.62
0.00
28074.80
189.00
50.00
2837.20
893.67
21099.75
FDCC Page 61 of 109 Accounts Reckoner 2007-08 to 2015-16 BE

STATEMENT - XIIProgressive Capital Expenditure in the form of Equity / Capital Assistance as the end of 31st March
2005 2006 2007 2008 2009 2010 2014201320122011
(Rs in Lakhs)
DETAILSSl.No
Sree Kanteerava Studios Ltd.
Karnataka Shipping Corporation Ltd
Mysore Tobacco Company Ltd
Indian Iron & Steel Company Ltd.,CalcuttaMysore Acetate & Chemicals CompanyLtd.Mysore Electrical Industries Ltd.,BangaloreKarnataka Silk Marketing Board Ltd.
Karnataka Silk Industries Corpn
Karnataka State Seeds Corpn Ltd.
Karnataka Vidyuth Karkhane Ltd.
Chamundi Machine Tools Ltd
Karnataka Soaps & Detergents Ltd.
Karnataka Minorities DevelopmentCorpn LtdKarnataka State Police Housing CorpnLtdKarnataka State Women's Dev. CorpnLtdKarnataka Agro Corn Products Ltd
Karnataka Coir Development Corpn Ltd
Karnataka Small Industries MarketingCorpn LtdKarnataka State Power Loom Dev.Corpn
Mysore Lamp Works Ltd
Cauvery Basin Lift Irrigation Corpn,MysoreKarnataka State Agril.ProduceProcessing & Export Corpn LtdKrishna Basin Lift Irrigation Corpn,Bijapur
53
54
55
56
57
58
59
60
61
62
63
64
65
66
67
68
69
70
71
71
72
73
73
59.73
306.10
60.52
0.04
351.05
577.14
292.21
905.00
80.92
58.10
35.00
2163.00
4466.45
12.00
923.75
63.40
188.35
52.29
153.00
78.67
772.79
50.00
463.70
59.73
306.10
60.52
0.04
351.05
577.14
292.21
905.00
80.92
58.10
35.00
2163.00
4841.45
12.00
972.50
63.40
188.35
52.29
154.00
78.67
772.79
50.00
463.70
59.73
306.10
60.52
0.04
351.05
577.14
292.21
905.00
80.92
58.10
35.00
2163.00
6341.45
12.00
972.50
63.40
188.35
52.29
154.00
78.67
772.79
50.00
463.70
59.73
306.10
60.52
0.04
351.05
577.14
292.21
905.00
80.92
58.10
35.00
2163.00
7933.95
12.00
972.50
63.40
188.35
52.29
154.00
78.67
772.79
50.00
463.70
59.73
306.10
60.52
0.04
351.05
577.14
292.21
905.00
80.92
58.10
35.00
2163.00
10183.95
12.00
991.25
63.40
188.35
52.29
154.00
78.67
772.79
50.00
463.70
59.73
306.10
60.52
0.04
351.05
577.14
292.21
905.00
80.92
58.10
35.00
2163.00
12433.95
12.00
991.25
63.40
188.35
52.29
154.00
78.67
772.79
50.00
463.70
59.73
306.10
60.52
0.04
351.05
577.14
292.21
905.00
80.92
58.10
35.00
2163.00
15083.95
12.00
991.25
63.40
188.35
52.29
0.00
78.67
772.79
0.00
463.70
264.73
306.10
60.52
0.04
351.05
577.14
292.21
905.00
80.92
58.10
35.00
2163.00
18458.95
6012.00
1047.30
63.40
188.35
52.29
0.00
78.67
772.79
0.00
463.70
482.71
306.10
60.52
0.04
351.05
765.93
292.21
905.00
80.92
58.10
35.00
2163.00
23358.95
6012.00
1063.55
223.37
188.35
52.29
0.00
1123.09
772.79
0.00
463.70
532.71
306.10
60.52
0.04
351.05
765.93
292.21
905.00
80.92
58.10
35.00
2163.00
29479.95
6012.00
1096.05
348.09
188.35
1997.72
0.00
1123.09
772.79
0.00
463.70
FDCC Page 62 of 109 Accounts Reckoner 2007-08 to 2015-16 BE

STATEMENT - XIIProgressive Capital Expenditure in the form of Equity / Capital Assistance as the end of 31st March
2005 2006 2007 2008 2009 2010 2014201320122011
(Rs in Lakhs)
DETAILSSl.No
Konkan Railway Corporation
Vijayanagar Steel Plant
Karnataka Agro Proteins Ltd.
Karnataka Poultry Dev. FederationBoardKrishna Bhagya Jala Nigama Ltd
Karnataka State Textile InfrastructureDev. Corpn Ltd (formerly known asKarnataka State Power LoomDev.Corpn)Kar. Urban Infrastructure Dev & FinanceCorpnKarnataka State Agril.ProduceProcessing & Export Corpn LtdKarnataka State Agril.ProduceProcessing & Export Corpn LtdKarnataka Agriculture Dev. FinanceCorpn LtdInfrastructure Dev. Corpn (Karnataka)LtdKarnataka Neeravari Nigam Ltd
Visveswariah Vidyuth Nigam Ltd
Karnataka Power TransmissionCorporation Limited, BangaloreKarnataka Road Development Corpn Ltd
Bangalore Electricity Supply CompanyLimitedRajeev Gandhi Rural Housing Corpn
Hubli Electricity Supply CompanyLimitedKarnataka Housing Board
Mangalore Electricity Supply CompanyLimited
74
75
76
77
78
79
80
81
81
82
83
84
85
86
86
87
87
88
88
89
12097.00
687.29
0.00
40.00
603078.00
0.00
570.00
0.00
0.00
36.00
0.00
96990.04
0.07
0.00
23862.65
0.00
13028.93
0.00
27803.60
0.00
12097.00
687.29
0.00
40.00
801728.31
0.00
570.00
0.00
0.00
36.00
0.00
152664.95
0.07
0.00
36833.72
0.00
13028.93
0.00
49066.55
0.00
12097.00
687.29
0.00
40.00
1014175.72
0.00
570.00
0.00
0.00
36.00
0.00
274746.77
0.07
0.00
81251.72
0.00
13028.93
0.00
65080.48
0.00
12097.00
687.29
0.00
40.00
1172638.63
0.00
570.00
0.00
0.00
36.00
0.00
359205.70
0.07
0.00
121737.03
0.00
13028.93
0.00
80243.92
0.00
12097.00
687.29
0.00
40.00
1297852.77
0.00
570.00
0.00
0.00
36.00
0.00
400586.30
0.07
0.00
177950.42
0.00
13028.93
0.00
94338.50
0.00
12097.00
687.29
0.00
40.00
1426744.58
0.00
570.00
0.00
0.00
36.00
0.00
481662.22
0.07
47500.07
250460.15
17800.00
13028.93
31500.00
109006.53
4700.00
12097.00
687.29
0.00
40.00
1589063.78
254.00
570.00
0.00
50.00
0.00
0.00
603218.08
0.00
0.00
292378.48
0.00
13028.93
0.00
111478.89
0.00
12097.00
687.29
0.00
40.00
1761882.78
321.52
586.00
50.00
0.00
0.00
0.00
745759.83
0.00
0.00
345378.48
0.00
13028.93
0.00
113013.89
0.00
12097.00
687.29
0.00
40.00
1913713.75
321.52
586.00
50.00
0.00
0.00
0.00
896079.09
0.00
0.00
372758.03
0.00
13028.93
0.00
113681.68
0.00
12097.00
687.29
0.00
40.00
2127805.25
321.52
2086.00
0.00
0.00
50.00
0.00
1084539.60
0.00
0.00
376989.26
0.00
13028.93
0.00
113681.68
0.00
FDCC Page 63 of 109 Accounts Reckoner 2007-08 to 2015-16 BE

STATEMENT - XIIProgressive Capital Expenditure in the form of Equity / Capital Assistance as the end of 31st March
2005 2006 2007 2008 2009 2010 2014201320122011
(Rs in Lakhs)
DETAILSSl.No
(D). JOINT STOCK COMPANIES
941666.41 1261506.06 1725458.60 2073544.71 2405211.85 2934139.97 3471572.15 4031341.17 4536921.99 5089640.80
Rail Infrastructure Dev.Corpn(Karnataka) Ltd.Gulbarga Electricity Supply CompanyLimitedKar.State Brewerages Corpn
Mysore Sales International Limited
Sanna Neeravari Nigam
Karnataka Sheep & Wool DevelopmentCorpnKarnataka Scheduled TribeDevelopment Corporation Limited,BangaloreJungle Lodges & Resorts Ltd. (shownfrom 2013)Karnataka Renewable Energy Dev. Ltd.
Mysore Coffee Curing Works Ltd
Binny Ltd
Mysore Spinning & ManufacturingCompanyMysore Silk Filatures Ltd., Siddlaghatta
Mysore Kirloskar Ltd
IDL Industries Ltd., Hyderabad
Mysore Paints & Water Proofs Ltd.
Sri Shankara Textiles Mills Ltd.,DavanagereRelmar Electric Company Ltd., Madras
Sandur Plantation & Sandur Tobacco Co.LtdKobay Silk Mills Ltd., Modgi
89
90
90
91
91
92
93
94
95
1
2
3
4
5
6
7
8
9
10
11
9334.50
0.00
200.00
0.00
0.00
0.00
0.00
0.00
0.00
3.95
0.06
2.34
0.60
5.43
7.23
-0.40
0.00
0.02
1.60
0.16
15920.50
0.00
200.00
0.00
0.00
0.00
0.00
0.00
0.00
3.95
0.06
2.34
0.60
5.43
7.23
-0.40
0.00
0.02
1.60
0.16
26309.50
0.00
200.00
0.00
0.00
0.00
0.00
0.00
0.00
3.95
0.06
2.34
0.60
5.43
7.23
-0.40
0.00
0.02
1.60
0.16
38454.42
0.00
200.00
0.00
0.00
0.00
182.50
0.00
0.00
3.95
0.06
2.34
0.60
5.43
7.23
-0.40
0.00
0.02
1.60
0.16
61231.17
0.00
200.00
0.00
0.00
0.00
382.50
0.00
0.00
3.95
0.06
2.34
0.60
5.43
7.23
-0.40
0.00
0.02
1.60
0.16
81237.41
16500.00
1200.00
383.20
0.00
0.00
572.50
0.00
0.00
0.00
0.06
2.34
0.60
5.43
7.23
-0.40
0.00
0.02
1.60
0.16
111941.82
0.00
1200.00
0.00
0.00
600.00
822.50
0.00
0.00
0.00
0.06
2.34
0.60
5.43
7.23
-0.40
0.00
0.02
1.60
0.16
150279.50
0.00
1200.00
0.00
0.00
600.00
1072.50
0.00
0.00
0.00
0.06
2.34
0.60
5.43
7.23
-0.40
0.00
0.02
1.60
0.16
189968.04
0.00
1200.00
0.00
0.00
600.00
1372.50
39.00
1200.00
0.00
0.06
2.34
0.60
5.43
7.23
-0.40
0.00
0.02
1.60
0.16
235225.47
0.00
1200.00
0.00
0.00
600.00
1672.50
39.00
1200.00
0.00
0.06
2.34
0.60
5.43
7.23
-0.40
0.00
0.02
1.60
0.16
Total: (C). GOVERNMENT COMPANIES
FDCC Page 64 of 109 Accounts Reckoner 2007-08 to 2015-16 BE
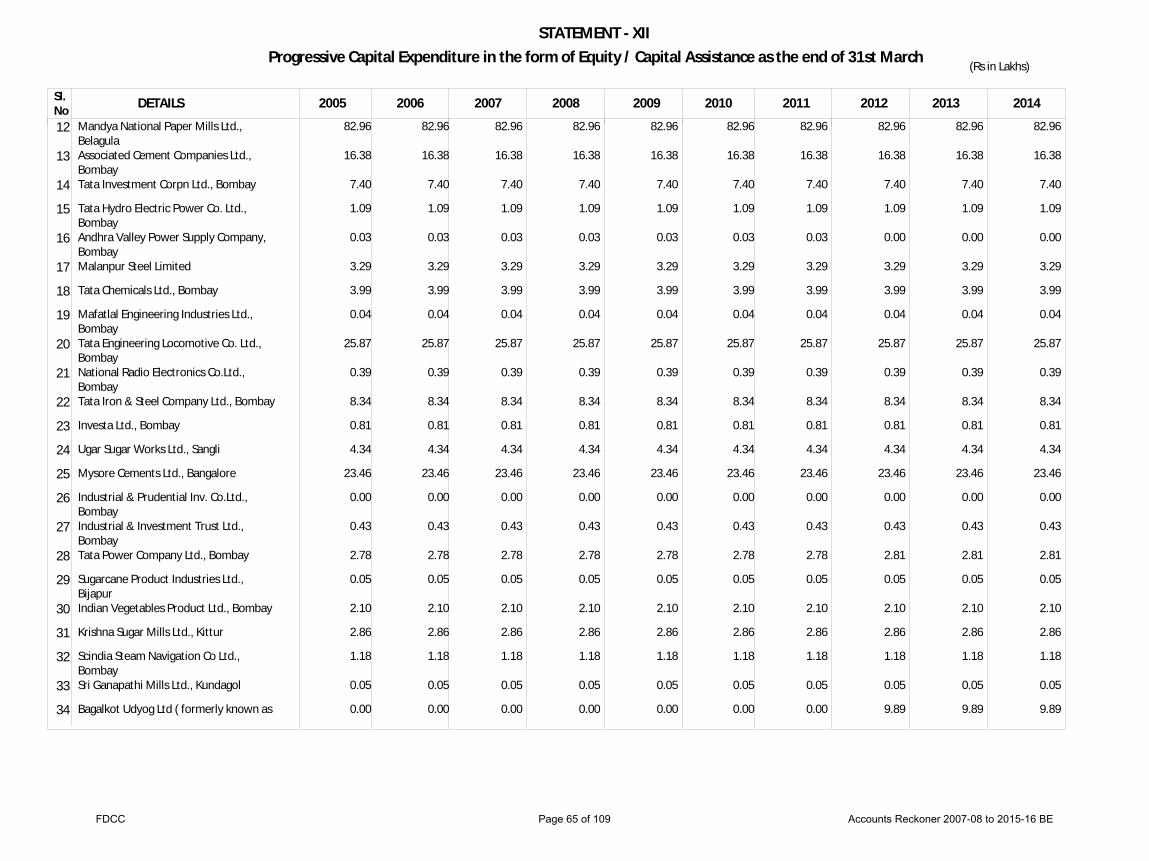
STATEMENT - XIIProgressive Capital Expenditure in the form of Equity / Capital Assistance as the end of 31st March
2005 2006 2007 2008 2009 2010 2014201320122011
(Rs in Lakhs)
DETAILSSl.No
Mandya National Paper Mills Ltd.,BelagulaAssociated Cement Companies Ltd.,BombayTata Investment Corpn Ltd., Bombay
Tata Hydro Electric Power Co. Ltd.,BombayAndhra Valley Power Supply Company,BombayMalanpur Steel Limited
Tata Chemicals Ltd., Bombay
Mafatlal Engineering Industries Ltd.,BombayTata Engineering Locomotive Co. Ltd.,BombayNational Radio Electronics Co.Ltd.,BombayTata Iron & Steel Company Ltd., Bombay
Investa Ltd., Bombay
Ugar Sugar Works Ltd., Sangli
Mysore Cements Ltd., Bangalore
Industrial & Prudential Inv. Co.Ltd.,BombayIndustrial & Investment Trust Ltd.,BombayTata Power Company Ltd., Bombay
Sugarcane Product Industries Ltd.,BijapurIndian Vegetables Product Ltd., Bombay
Krishna Sugar Mills Ltd., Kittur
Scindia Steam Navigation Co Ltd.,BombaySri Ganapathi Mills Ltd., Kundagol
Bagalkot Udyog Ltd ( formerly known as
12
13
14
15
16
17
18
19
20
21
22
23
24
25
26
27
28
29
30
31
32
33
34
82.96
16.38
7.40
1.09
0.03
3.29
3.99
0.04
25.87
0.39
8.34
0.81
4.34
23.46
0.00
0.43
2.78
0.05
2.10
2.86
1.18
0.05
0.00
82.96
16.38
7.40
1.09
0.03
3.29
3.99
0.04
25.87
0.39
8.34
0.81
4.34
23.46
0.00
0.43
2.78
0.05
2.10
2.86
1.18
0.05
0.00
82.96
16.38
7.40
1.09
0.03
3.29
3.99
0.04
25.87
0.39
8.34
0.81
4.34
23.46
0.00
0.43
2.78
0.05
2.10
2.86
1.18
0.05
0.00
82.96
16.38
7.40
1.09
0.03
3.29
3.99
0.04
25.87
0.39
8.34
0.81
4.34
23.46
0.00
0.43
2.78
0.05
2.10
2.86
1.18
0.05
0.00
82.96
16.38
7.40
1.09
0.03
3.29
3.99
0.04
25.87
0.39
8.34
0.81
4.34
23.46
0.00
0.43
2.78
0.05
2.10
2.86
1.18
0.05
0.00
82.96
16.38
7.40
1.09
0.03
3.29
3.99
0.04
25.87
0.39
8.34
0.81
4.34
23.46
0.00
0.43
2.78
0.05
2.10
2.86
1.18
0.05
0.00
82.96
16.38
7.40
1.09
0.03
3.29
3.99
0.04
25.87
0.39
8.34
0.81
4.34
23.46
0.00
0.43
2.78
0.05
2.10
2.86
1.18
0.05
0.00
82.96
16.38
7.40
1.09
0.00
3.29
3.99
0.04
25.87
0.39
8.34
0.81
4.34
23.46
0.00
0.43
2.81
0.05
2.10
2.86
1.18
0.05
9.89
82.96
16.38
7.40
1.09
0.00
3.29
3.99
0.04
25.87
0.39
8.34
0.81
4.34
23.46
0.00
0.43
2.81
0.05
2.10
2.86
1.18
0.05
9.89
82.96
16.38
7.40
1.09
0.00
3.29
3.99
0.04
25.87
0.39
8.34
0.81
4.34
23.46
0.00
0.43
2.81
0.05
2.10
2.86
1.18
0.05
9.89
FDCC Page 65 of 109 Accounts Reckoner 2007-08 to 2015-16 BE

STATEMENT - XIIProgressive Capital Expenditure in the form of Equity / Capital Assistance as the end of 31st March
2005 2006 2007 2008 2009 2010 2014201320122011
(Rs in Lakhs)
DETAILSSl.No
(E). CO-OPERATIVE SOCIEITES
3198.57 3248.57 3298.57 3398.57 53448.57 53444.62 155684.62 156168.62 156167.42 156175.32
Kanoria Industries Ltd., Bombay)
Bagalkot Udyog Ltd ( formerly known as Kanoria Industries Ltd., Bombay)Kanoria Industries Ltd., Bombay
Rainbow Record Company Ltd
Deepak Insulated Cable Corpn Ltd.,MadrasBanana & Fruit Development Corpn Ltd.,MadrasWalchandnagar Industries Ltd., Dharwad(Bombay)Sri Valliappa Textiles Ltd., Hejjala,BangalorePremier Construction Company Ltd.,BombayKarnataka Urban Development CorpnLtd.Karnataka Truck Terminals Pvt. Ltd.,BangaloreBangalore International Airport
Infrastructure Dev. Corpn (Karnataka)Ltd (*)Bagalkot Udyog Limited
Bangalore Metro Rail Corporation
Bangalore Metro Rail Corporation
NABARD Financial Services (formerlyknown as Kar. Agri. Dev. Finance CorpnLtd)Goods and Services Tax Network
Credit Co-operatives
Housing Co-operatives
34
34
35
36
37
38
39
40
41
42
43
44
45
45
46
46
47
1
2
0.00
9.89
0.01
4.20
1.44
2.00
1.20
0.00
16.00
15.00
260.00
2680.00
0.00
0.00
0.00
0.00
0.00
7155.35
189.63
0.00
9.89
0.01
4.20
1.44
2.00
1.20
0.00
16.00
15.00
260.00
2730.00
0.00
0.00
0.00
0.00
0.00
7155.22
189.63
0.00
9.89
0.01
4.20
1.44
2.00
1.20
0.00
16.00
15.00
260.00
2780.00
0.00
0.00
0.00
0.00
0.00
7155.22
189.63
0.00
9.89
0.01
4.20
1.44
2.00
1.20
16.00
15.00
260.00
2880.00
0.00
0.00
0.00
0.00
0.00
0.00
7155.22
189.63
0.00
0.00
0.01
4.20
1.44
2.00
1.20
0.00
16.00
15.00
260.00
2930.00
9.89
0.00
50000.00
0.00
0.00
7155.22
189.63
0.00
0.00
0.01
4.20
1.44
2.00
1.20
0.00
16.00
15.00
260.00
2930.00
9.89
0.00
50000.00
0.00
0.00
7473.22
189.63
9.89
0.00
0.01
4.20
1.44
2.00
1.20
0.00
16.00
15.00
260.00
30.00
0.00
154604.00
0.00
536.00
0.00
7493.22
189.63
0.00
0.00
0.01
4.20
1.44
2.00
1.20
0.00
0.00
15.00
260.00
30.00
0.00
154604.00
0.00
1036.00
0.00
7633.94
189.63
0.00
0.00
0.01
4.20
1.44
2.00
0.00
0.00
0.00
15.00
260.00
30.00
0.00
154604.00
0.00
1036.00
0.00
7431.27
189.63
0.00
0.00
0.01
4.20
1.44
2.00
0.00
0.00
0.00
15.00
260.00
30.00
0.00
154604.00
0.00
1036.00
7.90
7404.86
189.63
Total: (D). JOINT STOCK COMPANIES
FDCC Page 66 of 109 Accounts Reckoner 2007-08 to 2015-16 BE
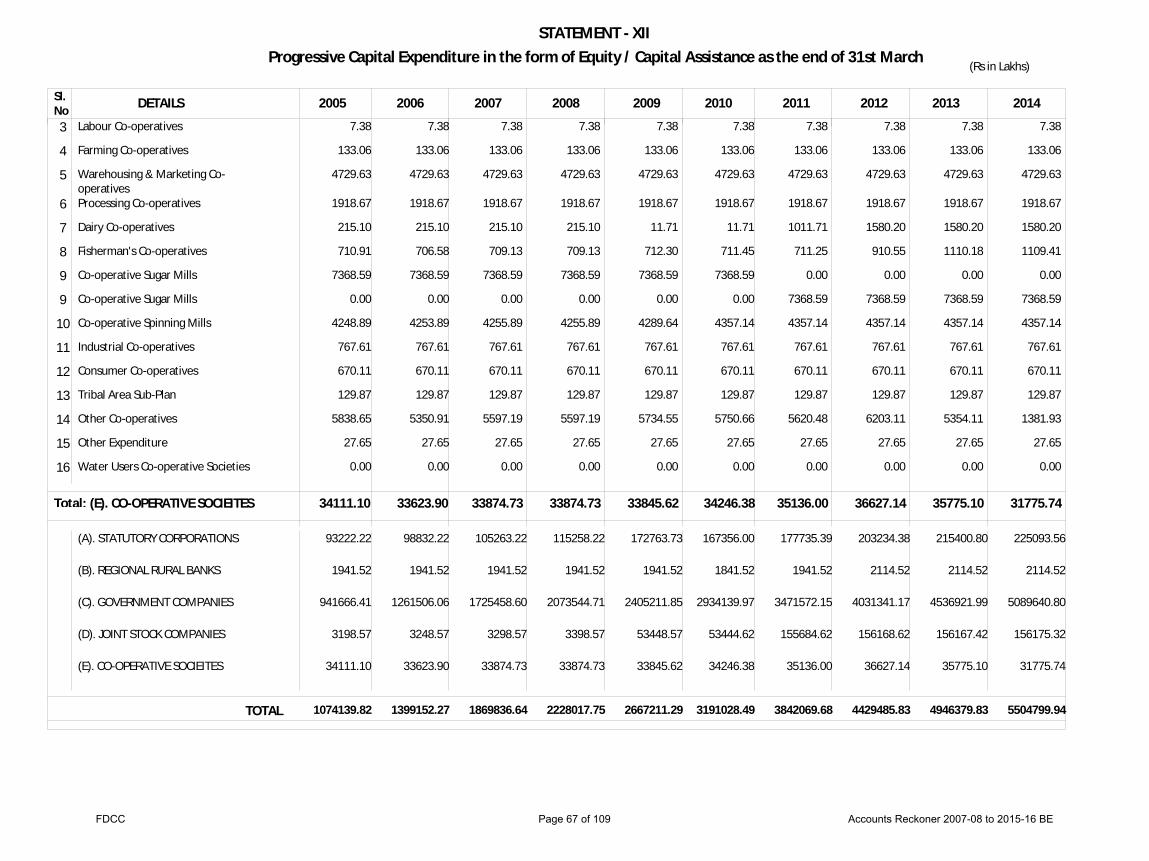
STATEMENT - XIIProgressive Capital Expenditure in the form of Equity / Capital Assistance as the end of 31st March
2005 2006 2007 2008 2009 2010 2014201320122011
(Rs in Lakhs)
DETAILSSl.No
34111.10 33623.90 33874.73 33874.73 33845.62 34246.38 35136.00 36627.14 35775.10 31775.74
Labour Co-operatives
Farming Co-operatives
Warehousing & Marketing Co-operativesProcessing Co-operatives
Dairy Co-operatives
Fisherman's Co-operatives
Co-operative Sugar Mills
Co-operative Sugar Mills
Co-operative Spinning Mills
Industrial Co-operatives
Consumer Co-operatives
Tribal Area Sub-Plan
Other Co-operatives
Other Expenditure
Water Users Co-operative Societies
3
4
5
6
7
8
9
9
10
11
12
13
14
15
16
7.38
133.06
4729.63
1918.67
215.10
710.91
7368.59
0.00
4248.89
767.61
670.11
129.87
5838.65
27.65
0.00
7.38
133.06
4729.63
1918.67
215.10
706.58
7368.59
0.00
4253.89
767.61
670.11
129.87
5350.91
27.65
0.00
7.38
133.06
4729.63
1918.67
215.10
709.13
7368.59
0.00
4255.89
767.61
670.11
129.87
5597.19
27.65
0.00
7.38
133.06
4729.63
1918.67
215.10
709.13
7368.59
0.00
4255.89
767.61
670.11
129.87
5597.19
27.65
0.00
7.38
133.06
4729.63
1918.67
11.71
712.30
7368.59
0.00
4289.64
767.61
670.11
129.87
5734.55
27.65
0.00
7.38
133.06
4729.63
1918.67
11.71
711.45
7368.59
0.00
4357.14
767.61
670.11
129.87
5750.66
27.65
0.00
7.38
133.06
4729.63
1918.67
1011.71
711.25
0.00
7368.59
4357.14
767.61
670.11
129.87
5620.48
27.65
0.00
7.38
133.06
4729.63
1918.67
1580.20
910.55
0.00
7368.59
4357.14
767.61
670.11
129.87
6203.11
27.65
0.00
7.38
133.06
4729.63
1918.67
1580.20
1110.18
0.00
7368.59
4357.14
767.61
670.11
129.87
5354.11
27.65
0.00
7.38
133.06
4729.63
1918.67
1580.20
1109.41
0.00
7368.59
4357.14
767.61
670.11
129.87
1381.93
27.65
0.00
Total:
(A). STATUTORY CORPORATIONS
(B). REGIONAL RURAL BANKS
(C). GOVERNMENT COMPANIES
(D). JOINT STOCK COMPANIES
(E). CO-OPERATIVE SOCIEITES
93222.22
1941.52
941666.41
3198.57
34111.10
98832.22
1941.52
1261506.06
3248.57
33623.90
105263.22
1941.52
1725458.60
3298.57
33874.73
115258.22
1941.52
2073544.71
3398.57
33874.73
172763.73
1941.52
2405211.85
53448.57
33845.62
167356.00
1841.52
2934139.97
53444.62
34246.38
177735.39
1941.52
3471572.15
155684.62
35136.00
203234.38
2114.52
4031341.17
156168.62
36627.14
215400.80
2114.52
4536921.99
156167.42
35775.10
225093.56
2114.52
5089640.80
156175.32
31775.74
TOTAL 1074139.82 1399152.27 1869836.64 2228017.75 2667211.29 3191028.49 3842069.68 4429485.83 4946379.83 5504799.94
(E). CO-OPERATIVE SOCIEITES
FDCC Page 67 of 109 Accounts Reckoner 2007-08 to 2015-16 BE
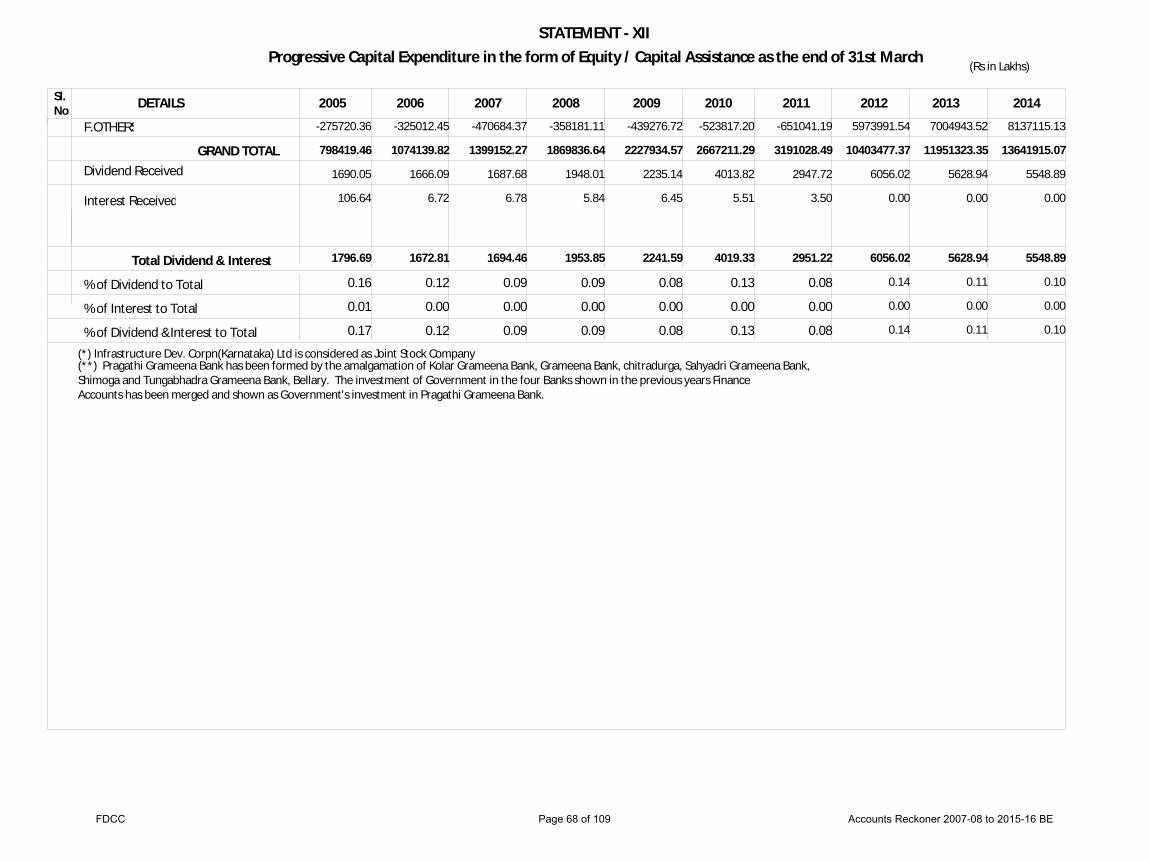
STATEMENT - XIIProgressive Capital Expenditure in the form of Equity / Capital Assistance as the end of 31st March
2005 2006 2007 2008 2009 2010 2014201320122011
(Rs in Lakhs)
DETAILSSl.No
GRAND TOTAL
F.OTHERS
Dividend Received
Interest Received
Total Dividend & Interest
8137115.13 7004943.52 5973991.54-651041.19-523817.20-439276.72-358181.11-470684.37-325012.45-275720.36
13641915.07 11951323.35 10403477.37 3191028.49 2667211.29 2227934.57 1869836.64 1399152.27 1074139.82 798419.46
1690.05 1666.09 1687.68 1948.01 2235.14 4013.82 2947.72 6056.02 5628.94 5548.89
0.00 0.00 0.00 3.50 5.51 6.45 5.84 6.78 6.72 106.64
2951.22 4019.33 2241.59 1953.85 1694.46 1672.81 1796.69 5548.89 5628.94 6056.02
% of Dividend to Total 0.08 0.13 0.08 0.09 0.09 0.12 0.16 0.10 0.11 0.14
% of Interest to Total 0.00 0.00 0.00 0.00 0.00 0.00 0.01 0.00 0.00 0.00
% of Dividend &Interest to Total 0.08 0.13 0.08 0.09 0.09 0.12 0.17 0.10 0.11 0.14
(*) Infrastructure Dev. Corpn(Karnataka) Ltd is considered as Joint Stock Company(**) Pragathi Grameena Bank has been formed by the amalgamation of Kolar Grameena Bank, Grameena Bank, chitradurga, Sahyadri Grameena Bank, Shimoga and Tungabhadra Grameena Bank, Bellary. The investment of Government in the four Banks shown in the previous years Finance Accounts has been merged and shown as Government's investment in Pragathi Grameena Bank.
FDCC Page 68 of 109 Accounts Reckoner 2007-08 to 2015-16 BE

STATEMENT - XIII
State Resources for Plan Expenditure (Rs in Crores)
2006-07 2007-08 2008-09 2009-10 2010-11 2011-12 2012-13 2013-14 2014-15 2015-16ITEM 2005-06 RE BECentral TaxesState TaxesState Non-TaxesOthersTotalNPREBCRA. Estimates at Current Prices.I. Budgetary Support.1. Balance From Current Revenues.2. Grants for Special Problems.3. Market Borrowings.4. Share of Small Savings.5. State Provident Funds.6. Loans From Finincal Institutions.7. Normal & Additional Central PlanAsst.7a. NCDC8. Misc.Captial Receipts.9. ARM Budgetry.10. Adjustment of OB & CB. (OB-CB)11. GOI LoansTotal Budgetry Support (1 to 11) - CSS/CPSLess Amt Spent on CSS/CPSII. IEBR1.Intrenal Resources of KEB/ KPC/KSRTC2. EBR of Boards & Corporations.Total IEBR (1+2) III.Amount Met by Reserve FundIV. Net Resources Available [I + II + III]
5374.33 23301.03
2928.77 2224.37
33828.50 24413.25
9415.25
9415.25 0.00
-232.54 2592.76
659.38 289.33
1927.68
9.40 772.97
0.00-179.33
0.00 15424.67
-169.77
602.67
2281.74 2884.41
0.00 18309.08
6779.23 25986.76
3291.30 1482.43
37539.72 28995.60
8544.12
8544.12 48.50
287.48 209.34 748.38 333.50
2707.56
0.79 1646.38
0.00 141.98
0.00 14741.94
-73.91
862.94
1622.03 2484.97
0.00 17226.91
7153.77 27645.66
3095.80 1651.57
39546.80 31065.79
8481.01
8481.00 42.03
6583.41-164.09
1176.24 459.60
2616.54
5.79-1378.00
0.00 448.35
0.00 18046.55
224.32
817.58
3712.62 4530.20
0.00 22576.75
7359.98 30578.60
3265.73 3399.71
44604.02 35166.16
9437.86
9347.86 29.97
4953.83 247.00
1467.51 620.80
3653.60
27.79 2668.65
0.00-250.77
0.00 22778.36
-12.12
704.88
3395.13 4100.01
0.00 26878.37
9506.31 38473.12
3189.73 2256.67
53425.83 38677.85 14747.98
3189.73 0.00
1037.25 1837.99 1607.05
734.52 4342.32
9.93 2866.03
0.00 549.45
0.00 16360.11
-185.84
477.39
2758.67 3236.06
0.00 19596.17
11074.99 46475.96
3880.09 2129.42
63560.46 46341.56 17218.90
17218.91 161.13
6207.50-844.14
1397.61 5512.87
590.76
4731.93 0.13
-1510.26-660.15
0.00 33584.70
-778.41
1096.69
3768.61 4865.30
0.00 38450.00
12647.14 53753.56
3966.11 2455.43
72822.24 55081.58 17740.66
17740.65 189.75
9148.69-517.49
1732.09 453.95
2507.85
0.00 2953.69
0.00-64.94
652.41 34200.69
-595.96
1309.49
3491.51 4801.00
762.93 39764.62
13810.27 62603.53
4031.89 2965.39
83411.08 62219.74 21191.34
21191.35 569.54
13406.31-344.12
2107.10-52.50
2947.90
0.00 1374.00
0.00-18.25
464.49 39981.23
-1664.59
1005.23
5357.68 6362.91 1694.74
48038.88
15410.00 68554.09
4465.32 3953.09
92382.50 70965.73 21416.77
21416.77 857.46
16733.71 1.12
1925.00 122.92
14045.63
0.00-276.34
0.00-170.29 603.20
55336.70
77.52
1328.00
7648.00 8976.00 1591.00
65903.70
24789.77 76445.40
5206.16 2071.98
108513.31 75226.37 33286.94
33286.94 0.00
17101.54-1031.96 2167.20
143.64 7051.35
0.00 58.28
0.00 390.78 942.81
60022.20
-88.38
1633.00
7012.00 8645.00 3929.61
72596.81
4213.42 18631.55
2158.01 1735.74
26738.72 21255.52
5483.20
5483.20 0.00
165.50 4327.25
655.87 250.93
1981.39
1.94-2646.93
0.00-29.59
0.00 10169.06
20.50
297.53
2211.69 2509.22
0.00 12678.28
FDCC Page 69 of 109 Accounts Reckoner 2007-08 to 2015-16 BE

STATEMENT - XIVSectoral Outlays of State Plan Schemes
(Rs in Crores)
Heads of Development 2007-08 2008-09 2009-10 2010-11 2011-12 2012-13 2013-142014-15 2014-15 2015-16
RE BEBE01
02
03
Agriculture & Allied Activities
Rural Development
Special Area Programe
1551.65
724.37
1541.40
1322.43
1832.13
1774.69
2027.47
1585.89
3280.46
2104.42
4069.31
1574.23
7128.44
1530.73
6474.74
4515.44
6194.86
4502.37
6609.61
5139.97
001002003004005006007008009010011
012
013014015016017018
018
Crop HusbandrySoil and Water ConservationAnimal HusbandryDairy DevelopmentFisheriesForestryEnvironmental Forestry and Wild LifeFood, Storage and WarehousingAgriculture Research & EducationInvestment in Agricultural Financial InstitutionsOther Agricultural Programmes, Marketing andQuality ControlCo-operation
Special Programme for Rural DevelopmentRural EmploymentLand ReformsOther Rural Development ProgrammeCommunity DevelopmentHyderabad-Karnataka Malanad and Border AreaDevelopment Programme
Hyderabad-Karnataka, Malnad and Border AreaDevelopment Programme
405.26 163.38 110.08
26.50 18.98
133.45 3.15 9.68
131.05 8.33
11.20
530.60
260.20 0.00 0.76
136.09 327.31
0.00
100.82
715.92 71.69
124.74 114.80
35.06 190.23
3.84 15.76 69.13
8.79 10.00
181.44
613.54 0.00
195.76 134.07 379.05
0.00
88.06
752.28 31.24
167.56 247.73
65.23 233.70
4.09 18.11 72.45
3.30 2.00
234.43
1107.60 0.00
299.67 60.00
307.41 0.00
132.53
685.70 66.36
192.53 312.85
61.32 194.08
11.77 16.07 75.60
3.48 3.25
404.45
1103.56 0.00
99.13 78.52
304.68 0.00
139.69
1419.98 138.78 292.24 350.53 102.61 208.29
16.10 24.98
170.91 4.73 3.50
547.80
1334.65 0.00
202.95 79.52
487.30 0.00
332.17
1349.27 99.71
262.55 340.86
83.03 218.28
18.43 40.00
172.45 4.00
10.00
1470.72
747.03 0.00
202.39 108.12 516.49
0.20
439.27
1902.19 118.18 399.92 853.48 121.52 219.35
75.72 37.02
200.62 4.00
100.00
3096.45
1014.91 0.00
278.09 28.90
178.76 30.08
865.87
3046.63 839.28 425.08 895.00 132.36 251.14 131.51
24.08 276.23
4.00 50.50
398.95
2949.09 0.00
268.25 15.10
683.00 600.00
342.89
2902.47 512.79 445.74 895.00 101.86 294.33 168.59
28.77 276.23
4.00 150.50
414.60
2950.16 0.00
224.06 15.10
713.00 600.05
333.39
3187.06 292.60 357.79 992.27 210.45 221.96
55.40 41.60
167.42 5.00
50.50
1027.56
2807.03 0.00
612.66 3.00
713.28 1004.00
368.86
Total:
Total:
01
02
FDCC Page 70 of 109 Accounts Reckoner 2007-08 to 2015-16 BE

STATEMENT - XIVSectoral Outlays of State Plan Schemes
(Rs in Crores)
Heads of Development 2007-08 2008-09 2009-10 2010-11 2011-12 2012-13 2013-142014-15 2014-15 2015-16
RE BEBE03
04
05
06
07
Special Area Programe
Irrigation & Flood Control
Energy
Industry & Minerals
Transport
100.82
2504.41
2049.75
510.28
2674.77
88.06
2581.41
3600.71
482.67
3781.09
132.53
3578.33
4063.38
490.94
3715.64
139.69
4278.82
3545.54
635.27
3894.77
332.17
6032.88
3464.42
833.38
5001.71
439.27
5154.17
4372.85
584.84
5667.44
865.87
7607.54
4305.16
823.77
6619.86
342.89
10454.14
4977.57
832.57
5422.23
333.39
9297.30
4376.02
1040.32
5903.55
368.86
11706.67
4812.94
948.02
5906.23
019020021022
023024
025026027
028029030031
Major and Medium IrrigationMinor IrrigationCommand Area DevelopmentFlood Control (Including Anti-Sea Erosion,etc.)
PowerNon-Conventional Source of Energy
Village & Small Industries (including Sericulture)Major & Medium IndustriesNon-Ferrous Mining and Mettallurgical Industries
Ports and Light HousesRoads and BridgesRoad TransportPollution Control and Inland Water Transport
2058.41 361.96
64.68 19.37
2047.78 1.97
174.38 330.69
5.21
6.49 1952.90
714.78 0.61
2043.16 457.13
47.82 33.29
3597.47 3.23
163.25 316.22
3.20
-6.49 2852.28
934.54 0.75
2939.40 551.85
73.00 14.08
4058.70 4.68
162.45 325.40
3.09
0.00 2813.98
901.19 0.46
3470.17 687.63
97.68 23.34
3540.74 4.80
199.87 432.34
3.07
0.00 3381.07
512.95 0.75
4567.39 1242.65
196.33 26.50
3457.80 6.61
225.03 591.67
16.68
7.71 4252.55
741.11 0.33
4006.32 907.69 172.95
67.21
4366.02 6.83
197.50 375.53
11.81
15.47 4858.72
792.66 0.58
6351.95 1025.43
177.48 52.68
4298.94 6.22
333.00 476.62
14.15
21.37 5658.69
939.29 0.51
8737.81 1136.80
533.75 45.78
4970.00 7.57
412.49 391.94
28.15
55.70 4667.50
698.03 1.00
7463.81 1297.96
487.75 47.78
4367.00 9.02
430.66 569.91
39.75
46.70 5265.81
590.04 1.00
9913.29 1249.31
502.01 42.06
4805.02 7.92
359.11 542.31
46.60
94.55 5494.66
316.01 1.01
Total:
Total:
Total:
Total:
Total:
03
04
05
06
07
FDCC Page 71 of 109 Accounts Reckoner 2007-08 to 2015-16 BE
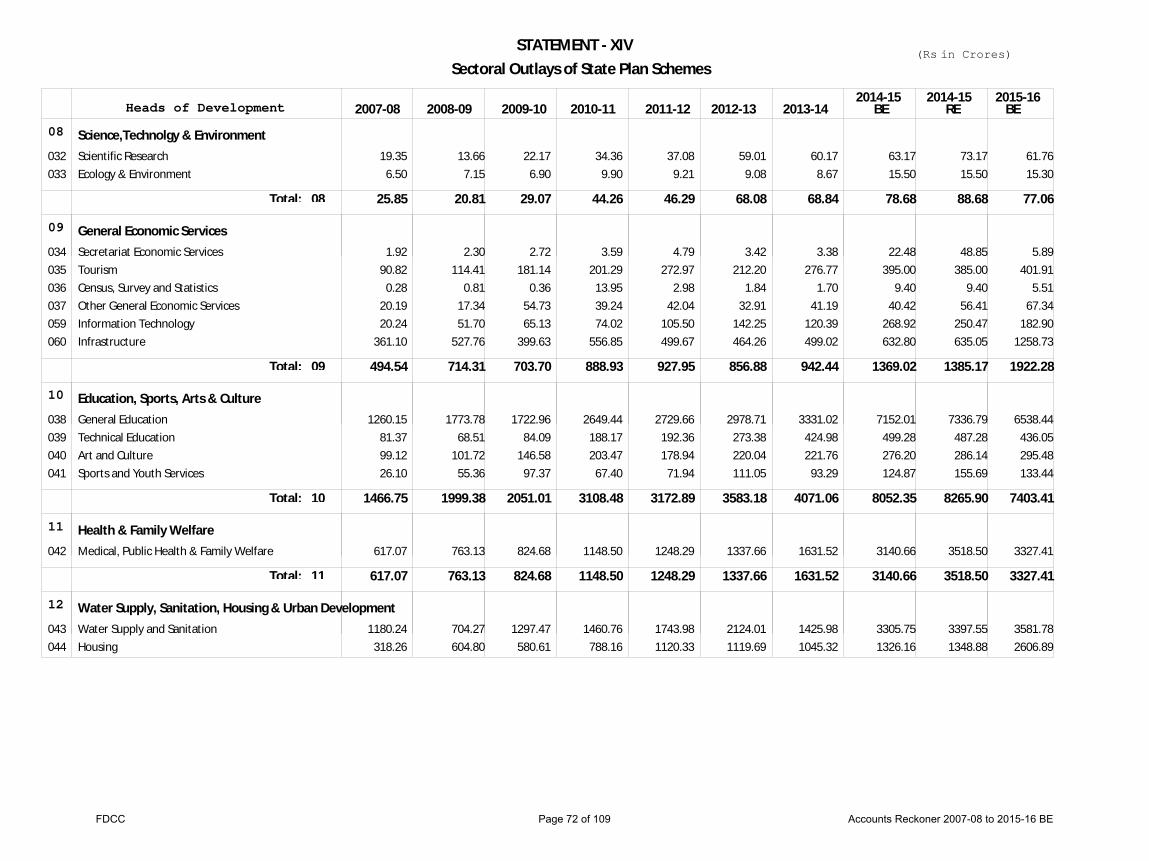
STATEMENT - XIVSectoral Outlays of State Plan Schemes
(Rs in Crores)
Heads of Development 2007-08 2008-09 2009-10 2010-11 2011-12 2012-13 2013-142014-15 2014-15 2015-16
RE BEBE08
09
10
11
12
Science,Technolgy & Environment
General Economic Services
Education, Sports, Arts & Culture
Health & Family Welfare
Water Supply, Sanitation, Housing & Urban Development
25.85
494.54
1466.75
617.07
20.81
714.31
1999.38
763.13
29.07
703.70
2051.01
824.68
44.26
888.93
3108.48
1148.50
46.29
927.95
3172.89
1248.29
68.08
856.88
3583.18
1337.66
68.84
942.44
4071.06
1631.52
78.68
1369.02
8052.35
3140.66
88.68
1385.17
8265.90
3518.50
77.06
1922.28
7403.41
3327.41
032033
034035036037059060
038039040041
042
043044
Scientific ResearchEcology & Environment
Secretariat Economic ServicesTourismCensus, Survey and StatisticsOther General Economic ServicesInformation TechnologyInfrastructure
General EducationTechnical EducationArt and CultureSports and Youth Services
Medical, Public Health & Family Welfare
Water Supply and SanitationHousing
19.35 6.50
1.92 90.82
0.28 20.19 20.24
361.10
1260.15 81.37 99.12 26.10
617.07
1180.24 318.26
13.66 7.15
2.30 114.41
0.81 17.34 51.70
527.76
1773.78 68.51
101.72 55.36
763.13
704.27 604.80
22.17 6.90
2.72 181.14
0.36 54.73 65.13
399.63
1722.96 84.09
146.58 97.37
824.68
1297.47 580.61
34.36 9.90
3.59 201.29
13.95 39.24 74.02
556.85
2649.44 188.17 203.47
67.40
1148.50
1460.76 788.16
37.08 9.21
4.79 272.97
2.98 42.04
105.50 499.67
2729.66 192.36 178.94
71.94
1248.29
1743.98 1120.33
59.01 9.08
3.42 212.20
1.84 32.91
142.25 464.26
2978.71 273.38 220.04 111.05
1337.66
2124.01 1119.69
60.17 8.67
3.38 276.77
1.70 41.19
120.39 499.02
3331.02 424.98 221.76
93.29
1631.52
1425.98 1045.32
63.17 15.50
22.48 395.00
9.40 40.42
268.92 632.80
7152.01 499.28 276.20 124.87
3140.66
3305.75 1326.16
73.17 15.50
48.85 385.00
9.40 56.41
250.47 635.05
7336.79 487.28 286.14 155.69
3518.50
3397.55 1348.88
61.76 15.30
5.89 401.91
5.51 67.34
182.90 1258.73
6538.44 436.05 295.48 133.44
3327.41
3581.78 2606.89
Total:
Total:
Total:
Total:
08
09
10
11
FDCC Page 72 of 109 Accounts Reckoner 2007-08 to 2015-16 BE

STATEMENT - XIVSectoral Outlays of State Plan Schemes
(Rs in Crores)
Heads of Development 2007-08 2008-09 2009-10 2010-11 2011-12 2012-13 2013-142014-15 2014-15 2015-16
RE BEBE12
13
14
15
16
17
Water Supply, Sanitation, Housing & Urban Development
Information and Publicty
SC, STs & Other Backword Classes
Labour & Labour Welfare
Social Welfare & Nutrition
Other Social Services
2729.36
8.06
856.51
95.70
436.26
3358.73
18.88
930.71
124.84
731.01
4603.95
13.96
1233.81
188.35
1142.81
5460.90
34.09
1818.89
181.43
1814.63
6552.12
30.21
2261.36
182.40
2127.69
6062.91
33.31
2867.01
167.15
2065.94
6123.47
29.14
3360.20
154.92
2066.74
10120.68
35.21
4949.03
427.52
2777.76
11126.20
35.71
5281.81
422.48
2840.77
12497.78
38.70
6110.40
384.73
3178.06
045
046
047048
049
050051
052053054056
Urban Development
Information and Publicity
Scheduled Castes and Scheduled TribesBackwarad Classes and Minorities
Labour And Employment
Social Security and WelfareNutrition and Civil Supplies
Fire Protection ServicesStationery & PrintingPublic WorksTraining
1230.86
8.06
581.81 274.70
95.70
323.96 112.31
5.00 0.83
254.59 0.45
2049.66
18.88
572.99 357.73
124.84
615.10 115.91
1.00 20.24
352.14 0.59
2725.87
13.96
792.33 441.47
188.35
884.53 258.29
1.11 10.49
331.24 0.72
3211.98
34.09
1301.27 517.62
181.43
1551.95 262.68
10.95 9.99
297.97 0.69
3687.81
30.21
1523.52 737.84
182.40
1813.34 314.36
6.00 11.29
479.00 5.70
2819.20
33.31
1903.32 963.69
167.15
1862.17 203.78
6.46 11.41
571.13 5.81
3652.16
29.14
2061.11 1299.08
154.92
1896.86 169.88
9.44 20.97
469.07 5.59
5488.77
35.21
3192.31 1756.72
427.52
2451.98 325.78
7.64 29.00
913.47 3.88
6379.77
35.71
3244.06 2037.75
422.48
2507.96 332.81
7.64 29.00
836.97 3.88
6309.11
38.70
3921.32 2189.08
384.73
2547.89 630.17
24.15 37.00
1617.88 3.67
Total:
Total:
Total:
Total:
Total:
12
13
14
15
16
FDCC Page 73 of 109 Accounts Reckoner 2007-08 to 2015-16 BE
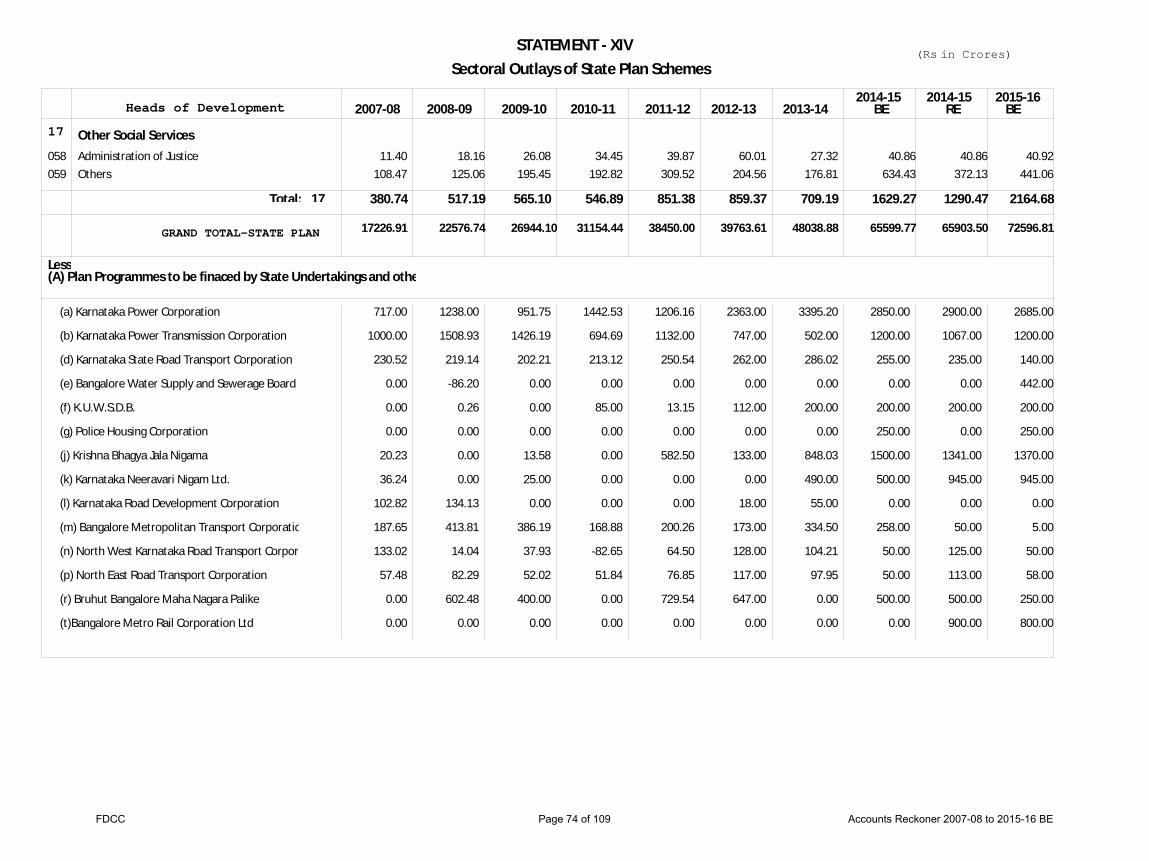
STATEMENT - XIVSectoral Outlays of State Plan Schemes
(Rs in Crores)
Heads of Development 2007-08 2008-09 2009-10 2010-11 2011-12 2012-13 2013-142014-15 2014-15 2015-16
RE BEBE
17226.91 22576.74 26944.10 31154.44 38450.00 39763.61 48038.88 65599.77 65903.50 72596.81
17 Other Social Services
380.74 517.19 565.10 546.89 851.38 859.37 709.19 1629.27 1290.47 2164.68
058059
Administration of JusticeOthers
11.40 108.47
18.16 125.06
26.08 195.45
34.45 192.82
39.87 309.52
60.01 204.56
27.32 176.81
40.86 634.43
40.86 372.13
40.92 441.06
Total:
GRAND TOTAL-STATE PLAN
17
Less(A) Plan Programmes to be finaced by State Undertakings and othe
(a) Karnataka Power Corporation
(b) Karnataka Power Transmission Corporation
(d) Karnataka State Road Transport Corporation
(e) Bangalore Water Supply and Sewerage Board
(f) K.U.W.S.D.B.
(g) Police Housing Corporation
(j) Krishna Bhagya Jala Nigama
(k) Karnataka Neeravari Nigam Ltd.
(l) Karnataka Road Development Corporation
(m) Bangalore Metropolitan Transport Corporatio
(n) North West Karnataka Road Transport Corpora
(p) North East Road Transport Corporation
(r) Bruhut Bangalore Maha Nagara Palike
(t)Bangalore Metro Rail Corporation Ltd
717.00
1000.00
230.52
0.00
0.00
0.00
20.23
36.24
102.82
187.65
133.02
57.48
0.00
0.00
1238.00
1508.93
219.14
-86.20
0.26
0.00
0.00
0.00
134.13
413.81
14.04
82.29
602.48
0.00
951.75
1426.19
202.21
0.00
0.00
0.00
13.58
25.00
0.00
386.19
37.93
52.02
400.00
0.00
1442.53
694.69
213.12
0.00
85.00
0.00
0.00
0.00
0.00
168.88
-82.65
51.84
0.00
0.00
1206.16
1132.00
250.54
0.00
13.15
0.00
582.50
0.00
0.00
200.26
64.50
76.85
729.54
0.00
2363.00
747.00
262.00
0.00
112.00
0.00
133.00
0.00
18.00
173.00
128.00
117.00
647.00
0.00
3395.20
502.00
286.02
0.00
200.00
0.00
848.03
490.00
55.00
334.50
104.21
97.95
0.00
0.00
2850.00
1200.00
255.00
0.00
200.00
250.00
1500.00
500.00
0.00
258.00
50.00
50.00
500.00
0.00
2900.00
1067.00
235.00
0.00
200.00
0.00
1341.00
945.00
0.00
50.00
125.00
113.00
500.00
900.00
2685.00
1200.00
140.00
442.00
200.00
250.00
1370.00
945.00
0.00
5.00
50.00
58.00
250.00
800.00
FDCC Page 74 of 109 Accounts Reckoner 2007-08 to 2015-16 BE

STATEMENT - XIVSectoral Outlays of State Plan Schemes
(Rs in Crores)
Heads of Development 2007-08 2008-09 2009-10 2010-11 2011-12 2012-13 2013-142014-15 2014-15 2015-16
RE BEBE(u) B M R D A
(v) K.U.I.D.F.C
(w) B.D.A
0.00
0.00
0.00
38.50
0.21
0.00
19.63
200.00
0.00
0.00
0.00
200.00
0.00
0.00
0.00
0.00
100.00
0.00
0.00
0.00
50.00
0.00
300.00
0.00
0.00
600.00
0.00
0.00
250.00
0.00
Total IEBR 2484.96 4165.59 3714.50 2773.41 4255.50 4800.00 6362.91 7913.00 8976.00 8645.00
(B). Amount Met from Cess Fund 0.00
0.00
0.00
0.00
0.00
0.00
0.00
0.00
0.00
0.00
0.00
364.61
0.00
0.00
0.00
0.00
0.00
0.00
0.00
0.00
57.83
219.74
107.94
0.00
0.00
0.00
0.00
0.00
0.00
0.00
69.40
263.71
129.54
0.00
0.00
0.00
0.00
0.00
0.00
0.00
66.91
347.29
170.60
25.00
0.00
0.00
0.00
0.00
0.00
0.00
107.76
429.46
195.72
29.99
0.00
0.00
0.00
0.00
0.00
0.00
111.09
422.15
207.37
47.48
455.15
451.46
0.00
0.00
0.00
0.04
146.00
628.80
650.00
56.00
0.00
0.00
0.00
0.00
0.00
109.61
146.00
628.80
650.00
56.00
0.00
0.00
0.00
0.00
0.00
110.00
151.00
1049.05
800.00
58.00
0.00
0.00
12.38
827.00
900.00
132.18
(a) C M R R F
(b) Infrastructure - Infrastructure Initiative Fun
(c) BMRC - BMRC Fund
(d) State Urban Transport Fund
(e) Education Expenditure - PRI Deposit Account
(g) RDPR Expenditure - PRI Deposit Account
(h) Port Development Fund
(i) Energy - Infrastructure Initiative Fund
(j)Road - IIF
Forest Development Fund
Total B 0.00 364.61 385.51 462.65 609.80 762.93 1694.74 1590.41 1590.80 3929.61
Net Outlay Provided for in the State Budget 14741.95 18046.54 22844.09 27918.38 33584.70 34200.68 39981.23 56096.36 55336.70 60022.20
FDCC Page 75 of 109 Accounts Reckoner 2007-08 to 2015-16 BE

STATEMENT - XVSectoral Outlay of Centrally Sponsored Schemes (Rs.in Crores)
Heads of Development 2007-08 2008-09 2009-10 2010-11 2011-12 2012-13 2013-142014-15 2014-15 2015-16
RE BEBE01
02
03
Agriculture & Allied Activities
Rural Development
Special Area Programe
148.72
2.47
0.49
132.02
0.83
0.56
119.85
0.71
0.84
156.83
6.35
0.85
181.80
6.07
1.20
227.48
12.93
0.73
207.11
6.29
0.77
91.51
0.00
36.45
81.51
0.00
36.45
71.01
0.00
0.00
001002003004005006007008009010011
012
013014015016017018
018
Crop HusbandrySoil and Water ConservationAnimal HusbandryDairy DevelopmentFisheriesForestryEnvironmental Forestry and Wild LifeFood, Storage and WarehousingAgriculture Research & EducationInvestment in Agricultural Financial InstitutionsOther Agricultural Programmes, Marketing andQuality ControlCo-operation
Special Programme for Rural DevelopmentRural EmploymentLand ReformsOther Rural Development ProgrammeCommunity DevelopmentHyderabad-Karnataka Malanad and Border AreaDevelopment Programme
Hyderabad-Karnataka, Malnad and Border AreaDevelopment Programme
82.91 32.87
6.79 0.84 8.71 7.61 8.99 0.00 0.00 0.00 0.00
0.00
2.11 0.00 0.00 0.00 0.36 0.00
0.49
50.12 40.14 10.47
2.68 7.20 8.76
12.65 0.00 0.00 0.00 0.00
0.00
0.00 0.00 0.43 0.00 0.39 0.00
0.56
55.69 22.49 12.75
1.29 8.15 9.18
10.30 0.00 0.00 0.00 0.00
0.00
0.00 0.00 0.28 0.00 0.43 0.00
0.84
67.28 34.58 20.26
1.17 9.84
11.55 12.15
0.00 0.00 0.00 0.00
0.00
2.89 0.00 2.99 0.00 0.48 0.00
0.85
79.78 20.98 26.45 16.31
7.55 10.66 20.07
0.00 0.00 0.00 0.00
0.00
2.05 0.00 3.00 0.00 1.02 0.00
1.20
124.74 47.47 14.77
0.00 18.72
8.59 13.18
0.00 0.00 0.00 0.00
0.00
0.00 0.00
12.36 0.00 0.58 0.00
0.73
82.32 45.00 26.14
0.14 24.24
7.88 21.38
0.00 0.00 0.00 0.00
0.00
0.00 0.00 5.62 0.00 0.67 0.00
0.77
0.00 0.00
29.73 2.00
59.78 0.00 0.00 0.00 0.00 0.00 0.00
0.00
0.00 0.00 0.00 0.00 0.00 0.00
36.45
0.00 0.00
22.23 2.00
57.28 0.00 0.00 0.00 0.00 0.00 0.00
0.00
0.00 0.00 0.00 0.00 0.00 0.00
36.45
1.50 0.00 0.00 0.00
57.44 3.67 8.40 0.00 0.00 0.00 0.00
0.00
0.00 0.00 0.00 0.00 0.00 0.00
0.00
Total:
Total:
Total:
01
02
03
FDCC Page 76 of 109 Accounts Reckoner 2007-08 to 2015-16 BE

STATEMENT - XVSectoral Outlay of Centrally Sponsored Schemes (Rs.in Crores)
Heads of Development 2007-08 2008-09 2009-10 2010-11 2011-12 2012-13 2013-142014-15 2014-15 2015-16
RE BEBE03
04
05
06
07
08
Special Area Programe
Irrigation & Flood Control
Energy
Industry & Minerals
Transport
Science,Technolgy & Environment
186.85
1.53
30.73
0.00
177.21
3.74
19.75
0.00
19.48
4.44
16.68
0.00
81.89
6.81
36.10
0.00
77.51
10.10
46.09
7.22
89.35
9.29
45.43
36.85
77.03
6.51
36.91
35.08
0.00
8.54
0.50
0.00
0.00
17.19
0.50
0.00
0.00
9.42
0.00
0.00
019020021022
023024
025026027
000028029030031
Major and Medium IrrigationMinor IrrigationCommand Area DevelopmentFlood Control (Including Anti-Sea Erosion,etc.)
PowerNon-Conventional Source of Energy
Village & Small Industries (including Sericulture)Major & Medium IndustriesNon-Ferrous Mining and Mettallurgical Industries
TransportPorts and Light HousesRoads and BridgesRoad TransportPollution Control and Inland Water Transport
151.04 5.87
29.94 0.00
0.00 1.53
30.73 0.00 0.00
0.00 0.00 0.00 0.00 0.00
157.91 2.56
16.74 0.00
0.00 3.74
19.75 0.00 0.00
0.00 0.00 0.00 0.00 0.00
0.00 0.00
19.48 0.00
0.00 4.44
16.68 0.00 0.00
0.00 0.00 0.00 0.00 0.00
0.00 58.59 23.30
0.00
0.00 6.81
35.88 0.22 0.00
0.00 0.00 0.00 0.00 0.00
0.00 0.00
77.51 0.00
0.00 10.10
45.18 0.91 0.00
0.00 0.00 0.00 7.22 0.00
0.00 0.00
89.35 0.00
0.00 9.29
45.43 0.00 0.00
0.00 0.00
36.08 0.77 0.00
0.00 0.16
76.87 0.00
0.00 6.51
36.91 0.00 0.00
0.00 0.00
31.81 3.27 0.00
0.00 0.00 0.00 0.00
0.00 8.54
0.50 0.00 0.00
0.00 0.00 0.00 0.00 0.00
0.00 0.00 0.00 0.00
0.00 17.19
0.50 0.00 0.00
0.00 0.00 0.00 0.00 0.00
0.00 0.00 0.00 0.00
0.00 9.42
0.00 0.00 0.00
0.00 0.00 0.00 0.00 0.00
Total:
Total:
Total:
Total:
04
05
06
07
FDCC Page 77 of 109 Accounts Reckoner 2007-08 to 2015-16 BE

STATEMENT - XVSectoral Outlay of Centrally Sponsored Schemes (Rs.in Crores)
Heads of Development 2007-08 2008-09 2009-10 2010-11 2011-12 2012-13 2013-142014-15 2014-15 2015-16
RE BEBE08
09
10
11
12
Science,Technolgy & Environment
General Economic Services
Education, Sports, Arts & Culture
Health & Family Welfare
Water Supply, Sanitation, Housing & Urban Development
2.30
5.00
25.13
23.51
1.88
4.95
40.05
17.71
1.40
7.13
43.47
18.75
1.09
5.00
120.91
20.83
0.74
14.82
52.46
26.32
0.00
9.01
643.79
26.69
0.00
52.45
1278.13
42.20
0.00
8.77
3.29
60.89
0.00
8.77
3.29
60.89
0.00
0.00
0.00
89.65
032033
034035036037059060
038039040041
042
043044
Scientific ResearchEcology & Environment
Secretariat Economic ServicesTourismCensus, Survey and StatisticsOther General Economic ServicesInformation TechnologyInfrastructure
General EducationTechnical EducationArt and CultureSports and Youth Services
Medical, Public Health & Family Welfare
Water Supply and SanitationHousing
0.00 2.30
0.00 5.00 0.00 0.00 0.00 0.00
23.56 0.00 0.00 1.57
23.51
373.59 0.08
0.00 1.88
0.00 4.95 0.00 0.00 0.00 0.00
38.30 0.00 0.00 1.75
17.71
640.67 0.04
0.00 1.40
0.00 7.13 0.00 0.00 0.00 0.00
35.35 0.00 0.00 8.12
18.75
382.75 0.04
0.00 1.09
0.00 5.00 0.00 0.00 0.00 0.00
103.50 0.30 0.00
17.11
20.83
171.61 0.00
0.00 0.74
0.00 6.40 8.42 0.00 0.00 0.00
26.98 5.59 0.00
19.89
26.32
7.24 0.00
0.00 0.00
0.00 5.00 4.01 0.00 0.00 0.00
626.99 0.00 0.01
16.79
26.69
96.70 0.00
0.00 0.00
0.00 23.00 28.65
0.80 0.00 0.00
1216.92 43.43
0.00 17.77
42.20
268.09 0.68
0.00 0.00
0.00 0.00 8.77 0.00 0.00 0.00
3.29 0.00 0.00 0.00
60.89
0.00 5.00
0.00 0.00
0.00 0.00 8.77 0.00 0.00 0.00
3.29 0.00 0.00 0.00
60.89
0.00 1.96
0.00 0.00
0.00 0.00 0.00 0.00 0.00 0.00
0.00 0.00 0.00 0.00
89.65
0.00 3.00
Total:
Total:
Total:
Total:
08
09
10
11
FDCC Page 78 of 109 Accounts Reckoner 2007-08 to 2015-16 BE
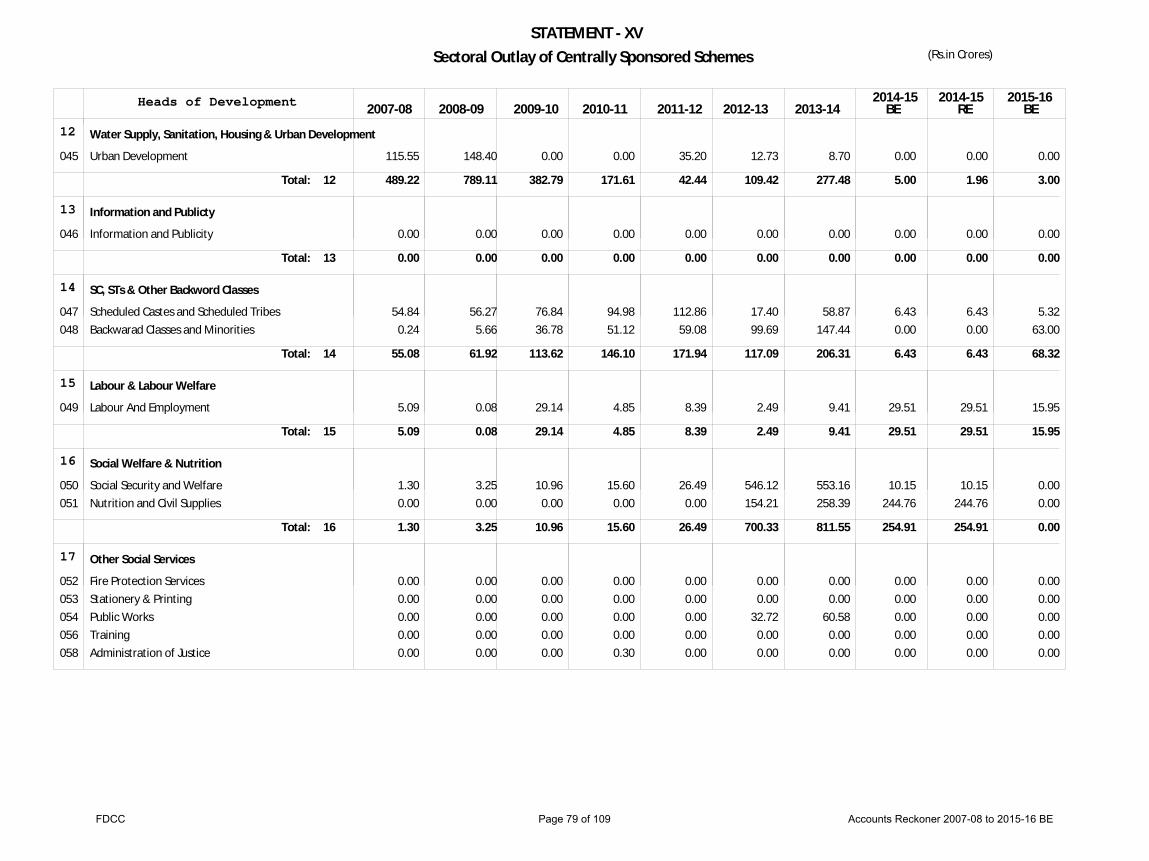
STATEMENT - XVSectoral Outlay of Centrally Sponsored Schemes (Rs.in Crores)
Heads of Development 2007-08 2008-09 2009-10 2010-11 2011-12 2012-13 2013-142014-15 2014-15 2015-16
RE BEBE12
13
14
15
16
17
Water Supply, Sanitation, Housing & Urban Development
Information and Publicty
SC, STs & Other Backword Classes
Labour & Labour Welfare
Social Welfare & Nutrition
Other Social Services
489.22
0.00
55.08
5.09
1.30
789.11
0.00
61.92
0.08
3.25
382.79
0.00
113.62
29.14
10.96
171.61
0.00
146.10
4.85
15.60
42.44
0.00
171.94
8.39
26.49
109.42
0.00
117.09
2.49
700.33
277.48
0.00
206.31
9.41
811.55
5.00
0.00
6.43
29.51
254.91
1.96
0.00
6.43
29.51
254.91
3.00
0.00
68.32
15.95
0.00
045
046
047048
049
050051
052053054056058
Urban Development
Information and Publicity
Scheduled Castes and Scheduled TribesBackwarad Classes and Minorities
Labour And Employment
Social Security and WelfareNutrition and Civil Supplies
Fire Protection ServicesStationery & PrintingPublic WorksTrainingAdministration of Justice
115.55
0.00
54.84 0.24
5.09
1.30 0.00
0.00 0.00 0.00 0.00 0.00
148.40
0.00
56.27 5.66
0.08
3.25 0.00
0.00 0.00 0.00 0.00 0.00
0.00
0.00
76.84 36.78
29.14
10.96 0.00
0.00 0.00 0.00 0.00 0.00
0.00
0.00
94.98 51.12
4.85
15.60 0.00
0.00 0.00 0.00 0.00 0.30
35.20
0.00
112.86 59.08
8.39
26.49 0.00
0.00 0.00 0.00 0.00 0.00
12.73
0.00
17.40 99.69
2.49
546.12 154.21
0.00 0.00
32.72 0.00 0.00
8.70
0.00
58.87 147.44
9.41
553.16 258.39
0.00 0.00
60.58 0.00 0.00
0.00
0.00
6.43 0.00
29.51
10.15 244.76
0.00 0.00 0.00 0.00 0.00
0.00
0.00
6.43 0.00
29.51
10.15 244.76
0.00 0.00 0.00 0.00 0.00
0.00
0.00
5.32 63.00
15.95
0.00 0.00
0.00 0.00 0.00 0.00 0.00
Total:
Total:
Total:
Total:
Total:
12
13
14
15
16
FDCC Page 79 of 109 Accounts Reckoner 2007-08 to 2015-16 BE
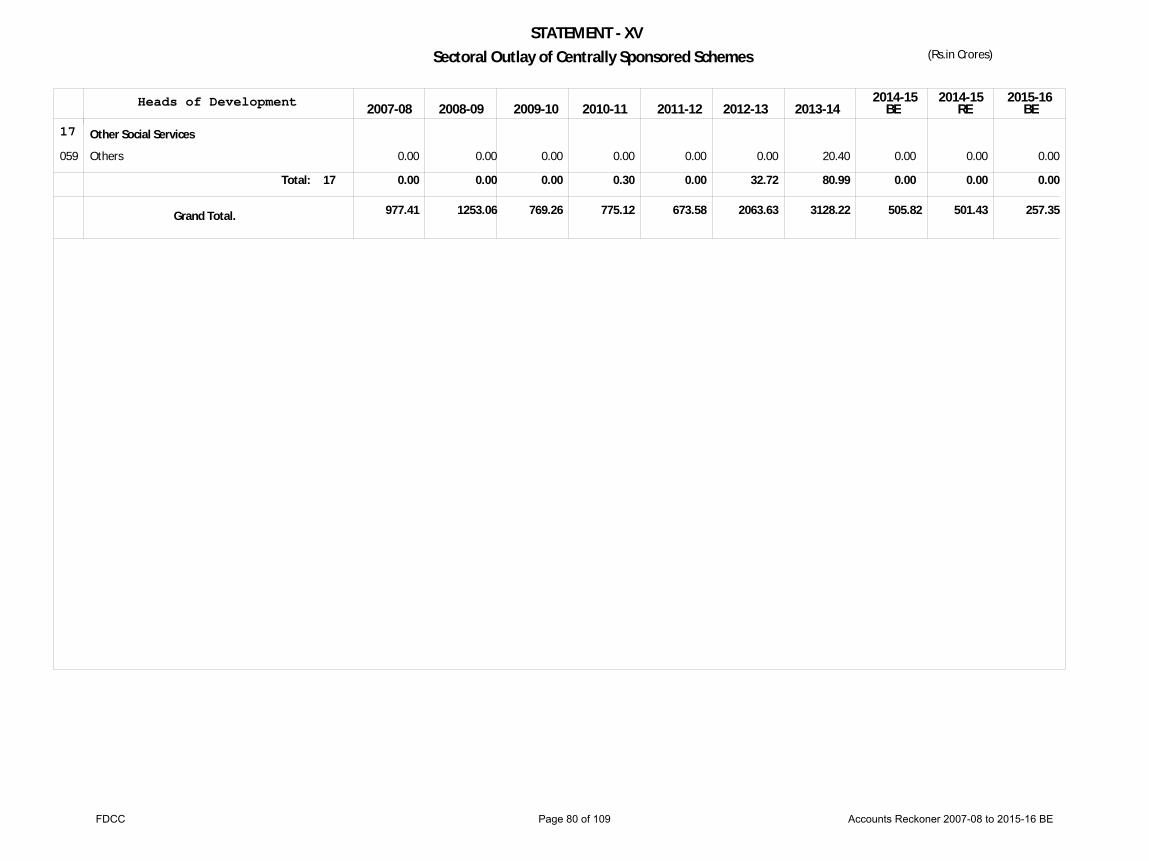
STATEMENT - XVSectoral Outlay of Centrally Sponsored Schemes (Rs.in Crores)
Heads of Development 2007-08 2008-09 2009-10 2010-11 2011-12 2012-13 2013-142014-15 2014-15 2015-16
RE BEBE
977.41 1253.06 769.26 775.12 673.58 2063.63 3128.22 505.82 501.43 257.35
17 Other Social Services
0.00 0.00 0.00 0.30 0.00 32.72 80.99 0.00 0.00 0.00
059 Others 0.00 0.00 0.00 0.00 0.00 0.00 20.40 0.00 0.00 0.00
Total:
Grand Total.
17
FDCC Page 80 of 109 Accounts Reckoner 2007-08 to 2015-16 BE

STATEMENT - XVISectoral Outlay of Central Plan Schemes (Rs in Crores)
Heads of Development 2007-08 2008-09 2009-10 2010-11 2011-12 2012-13 2013-142014-15 2014-15 2015-16
RE BEBE01
02
03
Agriculture & Allied Activities
Rural Development
Special Area Programe
6.25
0.00
0.20
7.30
0.00
0.24
12.01
0.00
0.00
3.36
0.00
1.07
2.79
0.00
0.00
24.06
207.80
0.00
27.19
315.82
0.00
14.04
0.00
0.00
10.50
0.00
0.00
2.00
0.00
0.00
001002003004005006007008009010011
012
013014015016017018
018
Crop HusbandrySoil and Water ConservationAnimal HusbandryDairy DevelopmentFisheriesForestryEnvironmental Forestry and Wild LifeFood, Storage and WarehousingAgriculture Research & EducationInvestment in Agricultural Financial InstitutionsOther Agricultural Programmes, Marketing andQuality ControlCo-operation
Special Programme for Rural DevelopmentRural EmploymentLand ReformsOther Rural Development ProgrammeCommunity DevelopmentHyderabad-Karnataka Malanad and Border AreaDevelopment Programme
Hyderabad-Karnataka, Malnad and Border AreaDevelopment Programme
0.01 0.00 4.24 0.00 0.00 0.00 2.01 0.00 0.00 0.00 0.00
0.00
0.00 0.00 0.00 0.00 0.00 0.00
0.20
0.00 0.00 4.47 0.00 0.00 0.00 2.83 0.00 0.00 0.00 0.00
0.00
0.00 0.00 0.00 0.00 0.00 0.00
0.24
4.83 0.00 3.29 0.00 0.00 0.00 3.89 0.00 0.00 0.00 0.00
0.00
0.00 0.00 0.00 0.00 0.00 0.00
0.00
0.00 0.00 0.33 0.00 0.00 0.00 3.03 0.00 0.00 0.00 0.00
0.00
0.00 0.00 0.00 0.00 0.00 0.00
1.07
0.00 0.00 0.11 0.00 0.32 0.00 2.36 0.00 0.00 0.00 0.00
0.00
0.00 0.00 0.00 0.00 0.00 0.00
0.00
17.22 0.00 4.13 0.00 0.00 0.00 2.70 0.00 0.00 0.00 0.00
0.00
202.92 0.00 0.00 0.00 4.88 0.00
0.00
15.89 0.00 8.50 0.00 0.00 0.00 2.81 0.00 0.00 0.00 0.00
0.00
311.67 0.00 0.00 0.00 4.15 0.00
0.00
0.00 0.00
14.04 0.00 0.00 0.00 0.00 0.00 0.00 0.00 0.00
0.00
0.00 0.00 0.00 0.00 0.00 0.00
0.00
0.00 0.00
10.50 0.00 0.00 0.00 0.00 0.00 0.00 0.00 0.00
0.00
0.00 0.00 0.00 0.00 0.00 0.00
0.00
0.00 0.00 2.00 0.00 0.00 0.00 0.00 0.00 0.00 0.00 0.00
0.00
0.00 0.00 0.00 0.00 0.00 0.00
0.00
Total:
Total:
Total:
01
02
03
FDCC Page 81 of 109 Accounts Reckoner 2007-08 to 2015-16 BE

STATEMENT - XVISectoral Outlay of Central Plan Schemes (Rs in Crores)
Heads of Development 2007-08 2008-09 2009-10 2010-11 2011-12 2012-13 2013-142014-15 2014-15 2015-16
RE BEBE04
05
06
07
08
Irrigation & Flood Control
Energy
Industry & Minerals
Transport
Science,Technolgy & Environment
0.00
0.00
3.15
0.00
0.00
0.00
0.00
3.21
0.00
0.00
0.00
0.00
2.40
0.00
0.00
0.00
0.00
0.47
0.00
0.00
0.00
0.00
0.79
0.00
0.00
0.00
0.00
0.64
0.00
0.00
0.00
0.00
0.00
0.00
0.00
0.00
0.00
0.00
1.40
0.00
0.00
0.00
0.00
1.40
0.00
0.00
0.00
0.00
0.00
0.00
019020021022
023024
025026027
028029030031
032033
Major and Medium IrrigationMinor IrrigationCommand Area DevelopmentFlood Control (Including Anti-Sea Erosion,etc.)
PowerNon-Conventional Source of Energy
Village & Small Industries (including Sericulture)Major & Medium IndustriesNon-Ferrous Mining and Mettallurgical Industries
Ports and Light HousesRoads and BridgesRoad TransportPollution Control and Inland Water Transport
Scientific ResearchEcology & Environment
0.00 0.00 0.00 0.00
0.00 0.00
3.15 0.00 0.00
0.00 0.00 0.00 0.00
0.00 0.00
0.00 0.00 0.00 0.00
0.00 0.00
3.21 0.00 0.00
0.00 0.00 0.00 0.00
0.00 0.00
0.00 0.00 0.00 0.00
0.00 0.00
2.40 0.00 0.00
0.00 0.00 0.00 0.00
0.00 0.00
0.00 0.00 0.00 0.00
0.00 0.00
0.47 0.00 0.00
0.00 0.00 0.00 0.00
0.00 0.00
0.00 0.00 0.00 0.00
0.00 0.00
0.79 0.00 0.00
0.00 0.00 0.00 0.00
0.00 0.00
0.00 0.00 0.00 0.00
0.00 0.00
0.64 0.00 0.00
0.00 0.00 0.00 0.00
0.00 0.00
0.00 0.00 0.00 0.00
0.00 0.00
0.00 0.00 0.00
0.00 0.00 0.00 0.00
0.00 0.00
0.00 0.00 0.00 0.00
0.00 0.00
0.00 0.00 0.00
0.00 0.00 1.40 0.00
0.00 0.00
0.00 0.00 0.00 0.00
0.00 0.00
0.00 0.00 0.00
0.00 0.00 1.40 0.00
0.00 0.00
0.00 0.00 0.00 0.00
0.00 0.00
0.00 0.00 0.00
0.00 0.00 0.00 0.00
0.00 0.00
Total:
Total:
Total:
Total:
Total:
04
05
06
07
08
FDCC Page 82 of 109 Accounts Reckoner 2007-08 to 2015-16 BE
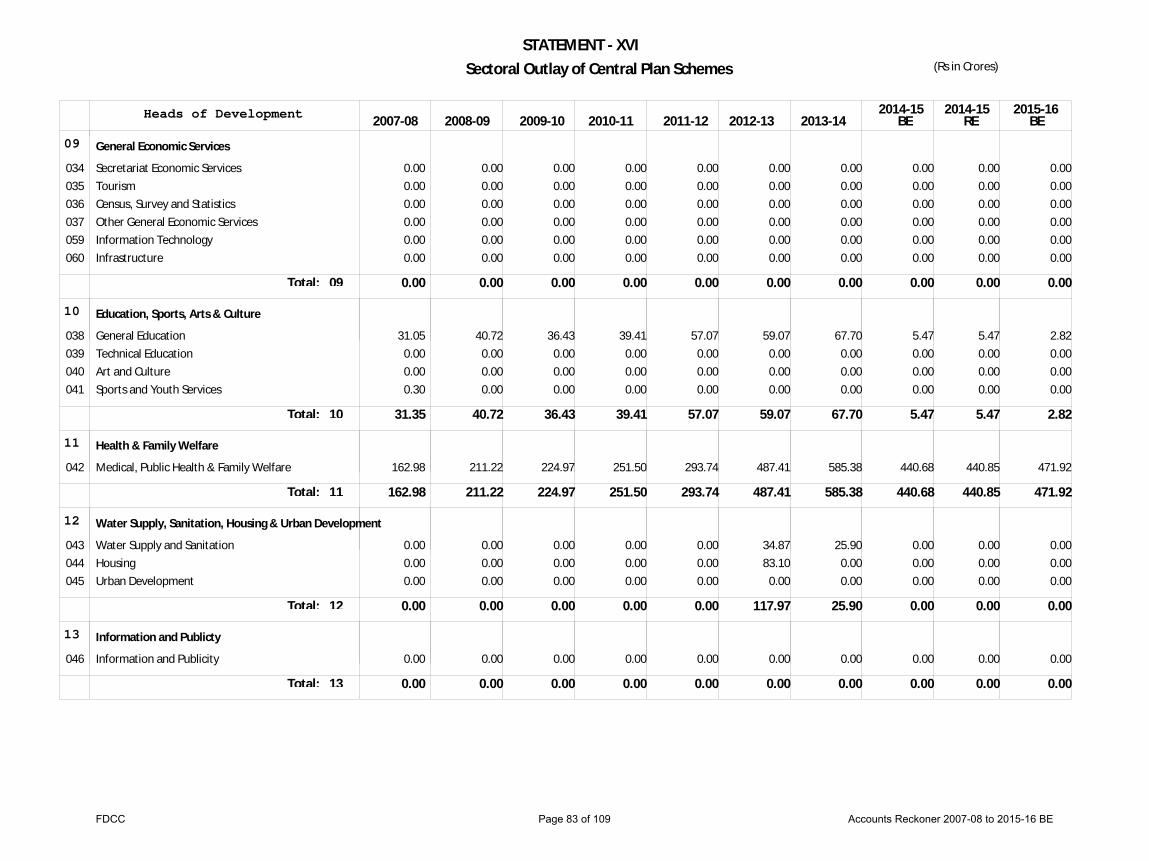
STATEMENT - XVISectoral Outlay of Central Plan Schemes (Rs in Crores)
Heads of Development 2007-08 2008-09 2009-10 2010-11 2011-12 2012-13 2013-142014-15 2014-15 2015-16
RE BEBE09
10
11
12
13
General Economic Services
Education, Sports, Arts & Culture
Health & Family Welfare
Water Supply, Sanitation, Housing & Urban Development
Information and Publicty
0.00
31.35
162.98
0.00
0.00
0.00
40.72
211.22
0.00
0.00
0.00
36.43
224.97
0.00
0.00
0.00
39.41
251.50
0.00
0.00
0.00
57.07
293.74
0.00
0.00
0.00
59.07
487.41
117.97
0.00
0.00
67.70
585.38
25.90
0.00
0.00
5.47
440.68
0.00
0.00
0.00
5.47
440.85
0.00
0.00
0.00
2.82
471.92
0.00
0.00
034035036037059060
038039040041
042
043044045
046
Secretariat Economic ServicesTourismCensus, Survey and StatisticsOther General Economic ServicesInformation TechnologyInfrastructure
General EducationTechnical EducationArt and CultureSports and Youth Services
Medical, Public Health & Family Welfare
Water Supply and SanitationHousingUrban Development
Information and Publicity
0.00 0.00 0.00 0.00 0.00 0.00
31.05 0.00 0.00 0.30
162.98
0.00 0.00 0.00
0.00
0.00 0.00 0.00 0.00 0.00 0.00
40.72 0.00 0.00 0.00
211.22
0.00 0.00 0.00
0.00
0.00 0.00 0.00 0.00 0.00 0.00
36.43 0.00 0.00 0.00
224.97
0.00 0.00 0.00
0.00
0.00 0.00 0.00 0.00 0.00 0.00
39.41 0.00 0.00 0.00
251.50
0.00 0.00 0.00
0.00
0.00 0.00 0.00 0.00 0.00 0.00
57.07 0.00 0.00 0.00
293.74
0.00 0.00 0.00
0.00
0.00 0.00 0.00 0.00 0.00 0.00
59.07 0.00 0.00 0.00
487.41
34.87 83.10
0.00
0.00
0.00 0.00 0.00 0.00 0.00 0.00
67.70 0.00 0.00 0.00
585.38
25.90 0.00 0.00
0.00
0.00 0.00 0.00 0.00 0.00 0.00
5.47 0.00 0.00 0.00
440.68
0.00 0.00 0.00
0.00
0.00 0.00 0.00 0.00 0.00 0.00
5.47 0.00 0.00 0.00
440.85
0.00 0.00 0.00
0.00
0.00 0.00 0.00 0.00 0.00 0.00
2.82 0.00 0.00 0.00
471.92
0.00 0.00 0.00
0.00
Total:
Total:
Total:
Total:
Total:
09
10
11
12
13
FDCC Page 83 of 109 Accounts Reckoner 2007-08 to 2015-16 BE

STATEMENT - XVISectoral Outlay of Central Plan Schemes (Rs in Crores)
Heads of Development 2007-08 2008-09 2009-10 2010-11 2011-12 2012-13 2013-142014-15 2014-15 2015-16
RE BEBE
509.63 576.13 708.43 797.23 946.92 1144.36 1105.94 970.62 999.93 538.30
14
15
16
17
SC, STs & Other Backword Classes
Labour & Labour Welfare
Social Welfare & Nutrition
Other Social Services
115.83
0.00
189.87
0.00
85.04
0.00
228.39
0.00
118.77
0.00
313.84
0.00
236.07
0.00
265.35
0.00
179.11
0.00
413.43
0.00
236.21
0.00
11.19
0.00
72.06
0.00
11.89
0.00
509.03
0.00
0.00
0.00
541.72
0.00
0.00
0.00
61.56
0.00
0.00
0.00
047048
049
050051
052053054056058059
Scheduled Castes and Scheduled TribesBackwarad Classes and Minorities
Labour And Employment
Social Security and WelfareNutrition and Civil Supplies
Fire Protection ServicesStationery & PrintingPublic WorksTrainingAdministration of JusticeOthers
115.83 0.00
0.00
189.87 0.00
0.00 0.00 0.00 0.00 0.00 0.00
77.60 7.44
0.00
228.39 0.00
0.00 0.00 0.00 0.00 0.00 0.00
100.42 18.35
0.00
313.84 0.00
0.00 0.00 0.00 0.00 0.00 0.00
218.38 17.70
0.00
265.35 0.00
0.00 0.00 0.00 0.00 0.00 0.00
158.12 20.99
0.00
413.43 0.00
0.00 0.00 0.00 0.00 0.00 0.00
202.45 33.76
0.00
11.19 0.00
0.00 0.00 0.00 0.00 0.00 0.00
72.06 0.00
0.00
11.89 0.00
0.00 0.00 0.00 0.00 0.00 0.00
509.03 0.00
0.00
0.00 0.00
0.00 0.00 0.00 0.00 0.00 0.00
541.72 0.00
0.00
0.00 0.00
0.00 0.00 0.00 0.00 0.00 0.00
61.56 0.00
0.00
0.00 0.00
0.00 0.00 0.00 0.00 0.00 0.00
Total:
Total:
Total:
Total:
Grand Total.
14
15
16
17
FDCC Page 84 of 109 Accounts Reckoner 2007-08 to 2015-16 BE

MajHead DESCRIPTION 2007-08 2008-09 2009-10 2010-11 2011-12 2012-13 2013-14 2014-15 2014-15 2015-16
STATEMENT- XVIIMajor Head-Wise Expenditure Under State Plan Schemes (Rs. in Lakhs)
RE BEBEA.REVENUE A/C
2014
2029
2030
2040
2041
2052
2053
2054
2055
2056
2058
2059
2070
2075
2202
2203
2204
2205
2210
2211
2215
2216
2217
2220
Administration of Justice
Land Revenue
Stamps and Registration
Taxes on Sales, Trade Etc.,
Taxes on Vehicles
Secretariat-General Services
District Administration
Treasury and AccountsAdministrationPolice
Jails
Stationery and Printing
Public Works
Other Administrative Services
Miscellaneous General Services
General Education
Technical Education
Sports and Youth Services
Art & Culture
Medical and Public Health
Family Welfare
Water Supply and Sanitation
Housing
Urban Development
Information and Publicity
1140.29
0.00
0.00
1131.69
61.38
226.68
1021.66
121.43
3785.24
142.00
82.82
207.52
602.81
0.00
116295.11
7923.41
2042.09
9031.82
24808.36
2188.37
13276.15
29436.49
81656.67
701.65
1816.29
0.00
0.00
644.34
74.92
0.00
260.85
143.98
1972.16
193.51
2024.24
128.45
3761.47
0.00
161354.34
5371.19
4041.42
9597.32
41401.23
2534.77
16978.19
48211.84
34245.32
1739.10
2608.38
0.00
0.00
943.50
46.46
0.00
402.86
177.90
4000.00
0.00
1049.08
298.26
252.06
0.00
153993.75
6561.00
9137.47
14212.36
47377.89
4522.90
12451.49
49530.00
61149.64
795.73
3220.45
0.00
0.00
799.99
75.35
4.22
0.00
206.81
600.00
0.00
999.46
404.18
3234.72
0.00
233851.08
12217.50
3817.68
19118.39
69738.28
2869.68
14806.24
59986.03
77035.92
2488.82
3486.73
0.00
0.00
1750.90
33.46
61.90
0.00
204.77
5950.00
0.00
1128.98
596.33
1823.18
0.00
250509.37
15825.03
4863.22
15585.33
85169.95
3220.45
19368.11
87343.03
52237.59
2425.03
4500.88
0.00
0.00
799.99
58.36
134.31
0.00
543.18
2100.00
0.00
1141.17
412.06
2283.46
3276.24
270512.51
24334.49
6910.74
21553.55
94234.80
3276.57
21345.87
104023.94
39745.61
2763.16
1731.56
0.00
0.00
176.62
50.79
144.75
354.80
487.17
6023.94
0.00
2096.99
853.06
2078.24
0.00
266156.78
35909.31
6788.54
22114.66
114257.37
4841.19
46613.37
119060.66
63660.59
2513.91
3085.52
0.00
0.00
0.00
543.01
89.29
1984.98
896.73
16583.00
0.00
2900.00
1100.00
2400.62
0.00
653335.97
44003.27
11471.14
27257.59
256061.95
6656.56
122046.43
220521.80
84365.00
2960.61
3085.52
0.00
0.00
89.15
543.01
89.29
1984.98
1064.73
16583.00
0.00
2900.00
1100.00
2400.62
101.52
666699.21
45414.80
12456.93
28252.09
283610.52
6656.56
116233.43
220521.80
66911.91
3010.61
3208.00
0.00
0.00
492.00
601.00
98.00
500.00
100.00
11245.00
0.00
3700.00
1188.00
2782.00
0.00
591729.00
38605.00
11544.00
27898.00
264099.00
14088.00
219863.00
330900.00
75734.00
3403.00
FDCC Page 85 of 109 Accounts Reckoner 2007-08 to 2015-16 BE

MajHead DESCRIPTION 2007-08 2008-09 2009-10 2010-11 2011-12 2012-13 2013-14 2014-15 2014-15 2015-16
STATEMENT- XVIIMajor Head-Wise Expenditure Under State Plan Schemes (Rs. in Lakhs)
RE BEBEA.REVENUE A/C
2225
2230
2235
2236
2245
2250
2251
2401
2402
2403
2404
2405
2406
2408
2415
2425
2435
2501
2505
2506
2515
2551
2575
Welfare of Scheduled Castes,Scheduled Tribes and OtherBackward ClassesLabour and Employment
Social Security and Welfare
Nutrition
Relief on Account of NaturalCalamitiesOther Social Services
Secretariat - Social Services
Crop Husbandry
Soil & Water Conservation
Animal Husbandry
Dairy Development
Fisheries
Forestry and Wild Life
Food, Storage and Ware Housing
Agricultural Research andEducationCo-Operation
Other Agriculture Programme
Special Programmes for RuralDevelopmentRural Employment
Land Reforms
Other Rural DevelopmentProgrammesHill Areas
Other Special Area Programme
66368.07
8182.23
30080.59
11125.50
0.00
1499.55
0.00
38165.99
16240.41
7038.50
2650.00
938.68
13453.68
118.40
13105.00
52606.14
0.00
5288.94
7203.98
76.36
43093.91
2300.96
13247.00
71725.32
11944.09
76236.76
11396.30
0.00
4062.76
0.00
70564.47
7458.71
10021.96
11480.12
3111.67
19113.35
0.00
6912.50
16817.18
0.00
6669.12
7886.74
112.20
43512.10
3149.04
19800.00
101378.32
17800.04
114179.54
24422.04
3628.99
2511.63
0.00
73309.11
3399.33
12788.22
24773.01
6001.60
23988.47
1300.00
7245.00
22446.61
0.00
5601.18
27532.43
90.63
40038.94
2630.46
47491.15
161807.68
16726.79
158956.85
26078.51
0.00
4063.06
0.00
64412.54
6719.09
15325.44
31285.03
4727.19
20743.34
0.00
7560.00
39807.11
0.00
6835.60
14492.58
251.87
36884.74
2882.21
10817.00
199928.59
17064.46
195379.57
31476.46
0.00
4538.28
0.00
131036.13
13969.76
22570.18
35183.11
7655.89
21191.27
16.20
19190.60
53366.41
0.00
5534.31
16098.01
294.89
71647.89
3102.08
10305.00
251484.19
19387.09
198909.77
20263.89
0.00
5408.69
0.00
125587.33
9995.55
18467.19
33986.44
5468.74
22110.98
0.00
17245.00
141725.93
0.00
1585.52
2105.90
738.72
82340.65
3242.00
7019.96
246585.27
17298.69
209399.14
16908.14
1195.06
5921.18
0.00
182223.96
11817.58
30503.97
84948.23
6658.24
28307.43
0.00
20061.50
308458.21
0.00
3084.68
2807.83
776.93
57425.87
3246.07
11993.41
360134.14
43972.21
255828.12
32378.27
7500.00
6550.00
0.00
289102.84
83927.54
31863.69
89100.00
7211.16
26203.70
0.00
27622.63
38269.19
0.00
15330.00
151445.00
7124.67
114261.37
502.00
26350.00
391138.52
44794.81
261426.25
32710.83
7500.00
6550.00
0.00
274842.68
51278.54
33260.10
89100.00
6711.16
34660.70
0.00
27622.63
40332.16
0.00
15430.00
151445.00
2705.67
116316.37
502.00
26350.00
419765.00
43811.00
307497.00
62442.00
0.00
5100.00
0.00
307451.00
29260.00
27779.00
99227.00
16029.00
13619.25
0.00
16742.00
100487.00
0.00
8207.00
151310.00
1093.00
113027.00
497.00
71350.00
FDCC Page 86 of 109 Accounts Reckoner 2007-08 to 2015-16 BE

MajHead DESCRIPTION 2007-08 2008-09 2009-10 2010-11 2011-12 2012-13 2013-14 2014-15 2014-15 2015-16
STATEMENT- XVIIMajor Head-Wise Expenditure Under State Plan Schemes (Rs. in Lakhs)
RE BEBEA.REVENUE A/C
2700
2701
2702
2705
2801
2810
2851
2852
2853
2885
3051
3053
3054
3055
3056
3425
3435
3451
3452
3454
3455
3456
3465
3475
Major Irrigation
Medium Irrigation
Minor Irrigation
Command Area Development
Power
New and Renewable Energy
Village and Small Industries
Industries
Non Ferrous Mining andMetallurgical IndustriesOther Outlays on Industries andMineralsPorts and Light Houses
Civil Aviation
Roads and Bridges
Road Transport
Inland Water Transport
Other Scientific Research
Ecology and Environment
Secretariat Economic Services
Tourism
Census Surveys & Statistics
Meteorology
Civil Supplies
General Financial and TradingInstitutionsOther General Economic Services
0.00
430.18
2287.95
6467.87
523.04
196.83
18247.23
8140.12
321.45
200.00
0.00
0.00
57990.59
0.00
0.00
1865.23
650.18
2106.03
3996.45
27.67
70.00
132.11
0.00
1538.71
0.00
603.45
2693.32
4254.79
53.33
323.41
13280.35
6227.80
319.50
0.00
0.00
0.00
80431.64
0.00
0.00
1296.02
715.00
4750.81
5827.70
80.82
70.00
214.96
0.00
1919.33
0.00
6146.09
2806.80
4906.61
42.32
468.48
15849.75
4150.40
309.22
0.00
0.00
0.00
46500.40
0.00
0.00
1528.20
690.33
6140.03
8640.05
36.25
688.90
125.55
0.00
3034.71
0.00
699.41
3963.07
9767.82
447.00
479.65
17877.14
15755.83
307.06
0.00
0.00
0.00
59846.89
0.00
0.00
3035.60
990.24
8100.36
9530.50
1394.79
400.00
164.09
0.00
1747.79
0.00
683.39
3318.46
16142.31
200.00
661.25
22387.72
15470.88
1667.56
0.00
18.51
0.00
46236.87
0.00
0.00
3008.36
920.86
10016.39
9763.57
298.37
700.00
13.70
0.00
1639.51
0.00
610.35
3858.03
14232.39
0.00
682.89
21103.24
13379.87
1180.87
0.00
40.63
0.00
36420.77
252.00
0.00
5100.76
907.62
12623.74
8147.76
184.07
800.00
13.62
0.00
3735.55
0.00
1018.73
4188.65
10125.12
2000.00
621.66
30703.00
19879.51
1414.97
0.00
101.73
0.00
51902.01
0.00
0.00
5217.18
866.72
10980.72
8254.25
169.76
800.00
9.62
0.00
13692.28
0.00
1578.00
6869.43
35374.04
2000.00
756.81
43512.77
18419.10
2815.11
0.00
170.00
0.00
115004.41
0.00
0.00
5517.15
1550.43
27241.19
11823.00
940.00
800.00
35.10
0.00
8432.00
0.00
978.00
7119.43
31274.04
2000.00
901.94
45880.45
16169.10
3975.11
0.00
170.00
0.00
121018.41
0.00
0.00
6517.15
1550.43
28232.95
12823.00
940.00
800.00
35.10
120.34
18432.00
0.00
341.00
6977.00
32200.00
2000.00
792.00
46595.00
15938.00
4660.00
0.00
214.00
0.00
160885.00
0.00
0.00
5376.00
1530.00
18209.00
12691.00
551.00
800.00
18.00
20.00
5692.00
FDCC Page 87 of 109 Accounts Reckoner 2007-08 to 2015-16 BE

MajHead DESCRIPTION 2007-08 2008-09 2009-10 2010-11 2011-12 2012-13 2013-14 2014-15 2014-15 2015-16
STATEMENT- XVIIMajor Head-Wise Expenditure Under State Plan Schemes (Rs. in Lakhs)
RE BEBEA.REVENUE A/C
B.CAPITAL A/C Capital Outlayon
733859.17 941127.84 1111032.20 1378241.36 1698166.43 1811788.58 2321650.22 3628048.54 3659894.55 3951816.25
3604
4055
4059
4070
4202
4210
4211
4215
4216
4217
4220
4225
4235
4250
4401
4402
4403
Compensation and Assignmentsto Local Bodies and Panchayat RajInstitutions
Capital Outlay on Police
Capital Outlay on Public Works
Capital Outlay on OtherAdministrative ServicesCapital Outlay on Education,Sports, Art and CultureCapital Outlay on Medical &Public HealthCapital Outlay on Family Welfare
Capital Outlay On Water Supplyand SanitationCapital Outlay on Housing
Capital Outlay on UrbanDevelopmentCapital Outlay on Information &PublicityCapital Outlay on Welfare ofScheduled Castes, ScheduledTribes and Other BackwardClassesCapital Outlay on Social Security &WelfareCapital Outlay on Other SocialServicesCapital Outlay on Crop Husbandry
Capital Outlay on Soil and WaterConservationCapital Outlay on AnimalHusbandry
0.00
1354.02
26899.68
148.14
11382.35
35423.79
0.00
60348.63
5258.36
25000.00
104.00
18745.82
1956.54
1928.13
2060.00
397.23
3969.50
79596.29
5100.00
37173.45
0.00
19573.64
33402.48
0.00
61398.79
5651.40
39791.00
149.23
21296.02
4836.57
539.55
737.70
0.00
2452.27
76900.68
4300.00
39002.71
36.79
21196.76
32097.12
0.00
82816.89
4621.98
46422.74
600.00
22002.32
4819.14
1035.29
1150.00
0.00
3967.83
107882.69
5125.00
36361.36
9.46
41842.87
43686.10
0.00
90128.27
3678.40
33142.00
920.07
20081.18
9988.46
1416.68
3515.13
0.00
3927.18
153886.27
7100.00
52580.54
406.50
30505.58
35938.27
0.00
147576.64
7624.14
5099.99
596.22
26207.48
8288.51
2586.71
6993.78
0.00
6354.99
117489.99
6225.10
46665.64
75.06
35006.74
36129.94
0.00
143841.29
13039.07
18885.96
567.50
35216.74
3372.85
1765.86
8609.99
0.00
7788.15
214168.62
6686.75
35604.98
180.00
30621.58
44053.65
0.00
67655.21
6905.60
16184.42
400.00
88558.27
11004.68
2610.07
7225.46
0.00
9487.93
272270.00
8651.20
64305.00
180.00
69167.21
51347.77
0.00
123150.00
21390.00
35100.00
560.00
134769.11
9585.00
3330.00
6030.00
0.00
10643.87
266570.00
8651.20
61055.00
180.00
73767.10
61582.77
0.00
136150.00
15490.00
29600.00
560.00
137042.11
11610.00
2280.00
6174.00
0.00
11313.87
239857.00
28628.00
47199.00
215.00
70565.00
54554.00
0.00
46840.00
13525.00
35100.00
467.00
191275.00
6316.00
3500.00
2200.00
0.00
8000.00
Total:
FDCC Page 88 of 109 Accounts Reckoner 2007-08 to 2015-16 BE
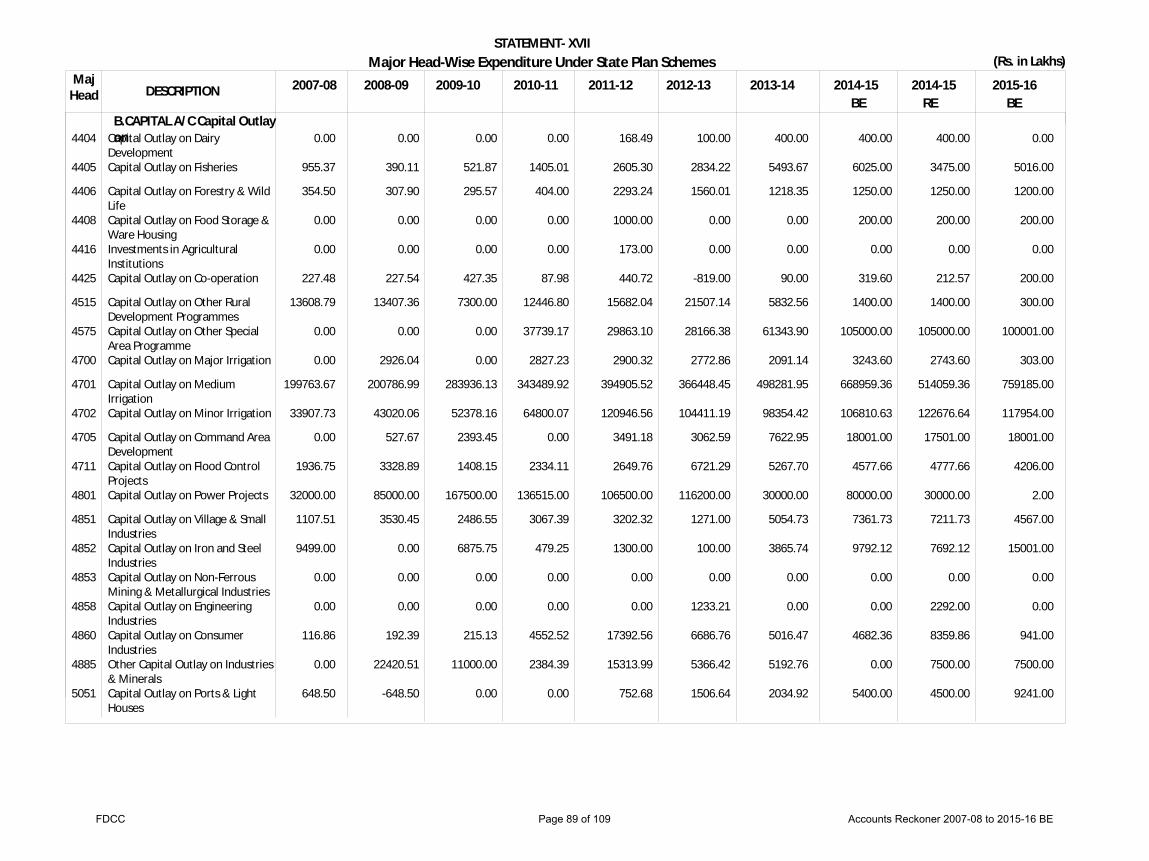
MajHead DESCRIPTION 2007-08 2008-09 2009-10 2010-11 2011-12 2012-13 2013-14 2014-15 2014-15 2015-16
STATEMENT- XVIIMajor Head-Wise Expenditure Under State Plan Schemes (Rs. in Lakhs)
RE BEBEB.CAPITAL A/C Capital Outlayon4404
4405
4406
4408
4416
4425
4515
4575
4700
4701
4702
4705
4711
4801
4851
4852
4853
4858
4860
4885
5051
Capital Outlay on DairyDevelopmentCapital Outlay on Fisheries
Capital Outlay on Forestry & WildLifeCapital Outlay on Food Storage &Ware HousingInvestments in AgriculturalInstitutionsCapital Outlay on Co-operation
Capital Outlay on Other RuralDevelopment ProgrammesCapital Outlay on Other SpecialArea ProgrammeCapital Outlay on Major Irrigation
Capital Outlay on MediumIrrigationCapital Outlay on Minor Irrigation
Capital Outlay on Command AreaDevelopmentCapital Outlay on Flood ControlProjectsCapital Outlay on Power Projects
Capital Outlay on Village & SmallIndustriesCapital Outlay on Iron and SteelIndustriesCapital Outlay on Non-FerrousMining & Metallurgical IndustriesCapital Outlay on EngineeringIndustriesCapital Outlay on ConsumerIndustriesOther Capital Outlay on Industries& MineralsCapital Outlay on Ports & LightHouses
0.00
955.37
354.50
0.00
0.00
227.48
13608.79
0.00
0.00
199763.67
33907.73
0.00
1936.75
32000.00
1107.51
9499.00
0.00
0.00
116.86
0.00
648.50
0.00
390.11
307.90
0.00
0.00
227.54
13407.36
0.00
2926.04
200786.99
43020.06
527.67
3328.89
85000.00
3530.45
0.00
0.00
0.00
192.39
22420.51
-648.50
0.00
521.87
295.57
0.00
0.00
427.35
7300.00
0.00
0.00
283936.13
52378.16
2393.45
1408.15
167500.00
2486.55
6875.75
0.00
0.00
215.13
11000.00
0.00
0.00
1405.01
404.00
0.00
0.00
87.98
12446.80
37739.17
2827.23
343489.92
64800.07
0.00
2334.11
136515.00
3067.39
479.25
0.00
0.00
4552.52
2384.39
0.00
168.49
2605.30
2293.24
1000.00
173.00
440.72
15682.04
29863.10
2900.32
394905.52
120946.56
3491.18
2649.76
106500.00
3202.32
1300.00
0.00
0.00
17392.56
15313.99
752.68
100.00
2834.22
1560.01
0.00
0.00
-819.00
21507.14
28166.38
2772.86
366448.45
104411.19
3062.59
6721.29
116200.00
1271.00
100.00
0.00
1233.21
6686.76
5366.42
1506.64
400.00
5493.67
1218.35
0.00
0.00
90.00
5832.56
61343.90
2091.14
498281.95
98354.42
7622.95
5267.70
30000.00
5054.73
3865.74
0.00
0.00
5016.47
5192.76
2034.92
400.00
6025.00
1250.00
200.00
0.00
319.60
1400.00
105000.00
3243.60
668959.36
106810.63
18001.00
4577.66
80000.00
7361.73
9792.12
0.00
0.00
4682.36
0.00
5400.00
400.00
3475.00
1250.00
200.00
0.00
212.57
1400.00
105000.00
2743.60
514059.36
122676.64
17501.00
4777.66
30000.00
7211.73
7692.12
0.00
2292.00
8359.86
7500.00
4500.00
0.00
5016.00
1200.00
200.00
0.00
200.00
300.00
100001.00
303.00
759185.00
117954.00
18001.00
4206.00
2.00
4567.00
15001.00
0.00
0.00
941.00
7500.00
9241.00
FDCC Page 89 of 109 Accounts Reckoner 2007-08 to 2015-16 BE

MajHead DESCRIPTION 2007-08 2008-09 2009-10 2010-11 2011-12 2012-13 2013-14 2014-15 2014-15 2015-16
STATEMENT- XVIIMajor Head-Wise Expenditure Under State Plan Schemes (Rs. in Lakhs)
RE BEBEB.CAPITAL A/C Capital Outlayon
C.LOAN A/C
668607.14 842585.55 1083290.38 1241438.84 1488633.49 1504262.34 1613996.45 1952155.06 1839032.14 2003678.00
5053
5054
5055
5452
5465
5475
6202
6210
6211
6215
6216
6217
6225
6235
6401
6402
6405
6406
6408
Capital Outlay on Civil Aviation
Capital Outlay on Roads & Bridges
Capital Outlay on Road Transport
Capital Outlay on Tourism
Investments in General Financialand Trading InstitutionsCapital Outlay on Other GeneralEconomic Services
Loans for Education, Sports, Art &CultureLoans for Medical & Public Health
Loans For Family Welfare
Loans for Water Supply &SanitationLoans for Housing
Loans for Urban Development
Loans for Welfare of ScheduledCastes, Scheduled Tribes & OtherBackward ClassesLoans for Social Security andWelfareLoans for Crop Husbandry
Loans for Soil and WaterConservationLoans for Fisheries
Loans for Forestry & Wild Life
Loans for Food Storage & WareHousing
0.00
127017.26
10500.00
5085.51
36290.23
611.79
0.00
391.15
0.00
9584.54
30000.00
19503.04
0.00
0.00
0.00
0.00
4.00
6.39
812.93
0.00
191383.40
20526.26
5613.00
17043.38
500.00
0.00
317.48
0.00
6379.75
10000.00
45.97
0.00
0.00
0.00
0.00
4.00
8.85
1553.03
0.00
229115.01
22284.18
9473.45
20110.06
1500.00
0.00
0.00
0.00
53251.41
7600.00
19637.00
0.00
0.00
0.00
0.00
0.00
0.00
1800.00
0.00
278260.16
16175.53
10598.11
29063.64
986.40
0.00
0.00
0.00
78710.58
0.00
70000.00
0.00
200.00
0.00
0.00
0.00
0.00
1604.23
0.00
379018.49
14895.54
17533.37
16249.78
1496.18
0.00
0.00
0.00
78081.46
0.00
76240.00
0.00
300.00
0.00
0.00
0.00
0.00
1494.79
0.00
447399.25
11366.13
13071.83
4586.08
1520.00
0.00
0.00
0.00
81228.27
0.00
0.00
0.00
300.00
0.00
0.00
0.00
0.00
4000.00
0.00
513967.04
6161.05
19422.30
8651.20
1455.00
0.00
0.00
0.00
22530.26
0.00
19263.00
876.00
150.00
0.00
0.00
0.00
0.00
3641.26
0.00
351745.76
8060.00
27677.00
1200.08
1840.00
0.00
0.00
0.00
30000.00
0.00
-15000.00
0.00
330.00
0.00
0.00
0.00
0.00
2107.58
0.00
405562.76
6261.00
25677.00
2613.79
2210.00
0.00
0.00
0.00
30000.00
0.00
-15000.00
0.00
330.00
0.00
0.00
0.00
0.00
2107.58
0.00
388581.00
5801.00
27500.00
21768.00
7826.00
0.00
0.00
0.00
34700.00
0.00
0.00
0.00
500.00
0.00
0.00
0.00
0.00
3559.00
Total:
FDCC Page 90 of 109 Accounts Reckoner 2007-08 to 2015-16 BE
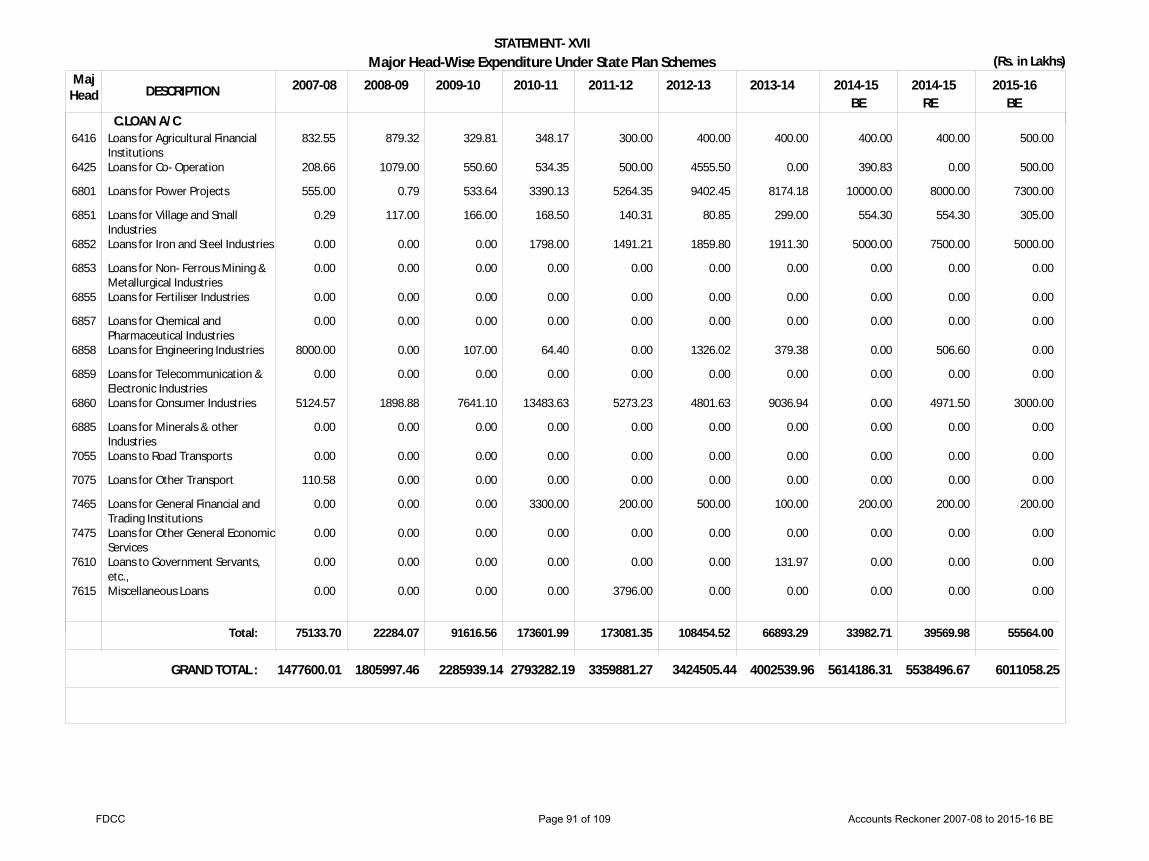
MajHead DESCRIPTION 2007-08 2008-09 2009-10 2010-11 2011-12 2012-13 2013-14 2014-15 2014-15 2015-16
STATEMENT- XVIIMajor Head-Wise Expenditure Under State Plan Schemes (Rs. in Lakhs)
RE BEBE
1477600.01 1805997.46 2285939.14 2793282.19 3359881.27 3424505.44 4002539.96 5614186.31 5538496.67 6011058.25
C.LOAN A/C
75133.70 22284.07 91616.56 173601.99 173081.35 108454.52 66893.29 33982.71 39569.98 55564.00
6416
6425
6801
6851
6852
6853
6855
6857
6858
6859
6860
6885
7055
7075
7465
7475
7610
7615
Loans for Agricultural FinancialInstitutionsLoans for Co- Operation
Loans for Power Projects
Loans for Village and SmallIndustriesLoans for Iron and Steel Industries
Loans for Non- Ferrous Mining &Metallurgical IndustriesLoans for Fertiliser Industries
Loans for Chemical andPharmaceutical IndustriesLoans for Engineering Industries
Loans for Telecommunication &Electronic IndustriesLoans for Consumer Industries
Loans for Minerals & otherIndustriesLoans to Road Transports
Loans for Other Transport
Loans for General Financial andTrading InstitutionsLoans for Other General EconomicServicesLoans to Government Servants,etc.,Miscellaneous Loans
832.55
208.66
555.00
0.29
0.00
0.00
0.00
0.00
8000.00
0.00
5124.57
0.00
0.00
110.58
0.00
0.00
0.00
0.00
879.32
1079.00
0.79
117.00
0.00
0.00
0.00
0.00
0.00
0.00
1898.88
0.00
0.00
0.00
0.00
0.00
0.00
0.00
329.81
550.60
533.64
166.00
0.00
0.00
0.00
0.00
107.00
0.00
7641.10
0.00
0.00
0.00
0.00
0.00
0.00
0.00
348.17
534.35
3390.13
168.50
1798.00
0.00
0.00
0.00
64.40
0.00
13483.63
0.00
0.00
0.00
3300.00
0.00
0.00
0.00
300.00
500.00
5264.35
140.31
1491.21
0.00
0.00
0.00
0.00
0.00
5273.23
0.00
0.00
0.00
200.00
0.00
0.00
3796.00
400.00
4555.50
9402.45
80.85
1859.80
0.00
0.00
0.00
1326.02
0.00
4801.63
0.00
0.00
0.00
500.00
0.00
0.00
0.00
400.00
0.00
8174.18
299.00
1911.30
0.00
0.00
0.00
379.38
0.00
9036.94
0.00
0.00
0.00
100.00
0.00
131.97
0.00
400.00
390.83
10000.00
554.30
5000.00
0.00
0.00
0.00
0.00
0.00
0.00
0.00
0.00
0.00
200.00
0.00
0.00
0.00
400.00
0.00
8000.00
554.30
7500.00
0.00
0.00
0.00
506.60
0.00
4971.50
0.00
0.00
0.00
200.00
0.00
0.00
0.00
500.00
500.00
7300.00
305.00
5000.00
0.00
0.00
0.00
0.00
0.00
3000.00
0.00
0.00
0.00
200.00
0.00
0.00
0.00
Total:
GRAND TOTAL :
FDCC Page 91 of 109 Accounts Reckoner 2007-08 to 2015-16 BE

MajorHead DESCRIPTION 2007-08 2008-09 2009-10 2010-11 2011-12 2012-13 2013-14 2014-15 2014-15 2015-16
STATEMENT- XVIIIMajor Head-wise Expenditure Under Centrally Sponsored Schemes (Rs. in Lakhs)
RE BEBEA.REVENUE A/C
2014
2041
2055
2202
2203
2204
2205
2210
2211
2215
2216
2217
2225
2230
2235
2236
2401
2402
2403
2404
2405
2406
2501
Administration of Justice
Taxes on Vehicles
Police
General Education
Technical Education
Sports and Youth Services
Art & Culture
Medical and Public Health
Family Welfare
Water Supply and Sanitation
Housing
Urban Development
Welfare of Scheduled Castes,Scheduled Tribes and OtherBackward ClassesLabour and Employment
Social Security and Welfare
Nutrition
Crop Husbandry
Soil & Water Conservation
Animal Husbandry
Dairy Development
Fisheries
Forestry and Wild Life
Special Programmes for Rural
0.00
0.00
0.00
2355.97
0.00
156.58
0.00
1086.40
1262.64
3207.26
0.00
10952.74
4178.30
509.39
154.14
0.00
8246.66
3287.39
678.69
83.89
819.88
1704.52
210.87
0.00
0.00
0.00
3829.53
0.00
175.00
0.33
246.31
1453.72
3138.67
7604.68
13677.62
4789.19
8.12
324.91
0.00
4958.40
4014.03
1046.87
268.06
633.97
2194.63
0.00
0.00
0.00
0.00
3534.68
0.00
812.18
0.00
185.07
1668.01
1130.68
10739.77
0.00
9470.89
2913.80
1095.62
0.00
5568.70
2249.34
1275.39
129.00
684.60
1932.33
15.39
30.34
0.00
0.00
10350.32
29.60
1710.82
0.00
112.35
1970.86
44.20
8074.56
0.00
13639.45
485.42
1559.82
0.00
6713.08
3457.99
2026.35
117.01
220.41
2384.70
0.00
0.00
268.00
0.00
2697.83
559.25
1988.68
0.00
87.24
2545.03
45.76
678.12
0.00
15519.34
838.97
2648.55
0.00
7933.99
2097.64
2645.36
1630.96
203.10
3116.32
0.00
0.00
0.00
0.00
62699.24
0.00
1679.34
0.75
77.76
2591.47
56.72
9612.91
0.00
9740.41
249.34
54611.70
15420.93
12393.85
4746.76
1477.35
0.00
701.59
2257.67
0.00
0.00
0.00
2040.06
114192.40
4343.39
1777.38
0.00
1109.93
3109.86
32.05
0.00
0.00
19544.95
941.43
55315.90
25663.75
8197.96
4500.00
2614.40
14.46
204.52
2959.58
0.00
0.00
0.00
0.00
329.17
0.00
0.00
0.00
0.00
5489.37
0.00
0.00
0.00
643.35
2951.00
1014.93
24476.42
0.00
0.00
2973.00
200.00
603.10
0.00
0.00
0.00
0.00
0.00
329.17
0.00
0.00
0.00
0.00
5489.37
0.00
0.00
0.00
643.35
2951.00
1014.93
24476.42
0.00
0.00
2223.00
200.00
603.10
0.00
0.00
0.00
0.00
0.00
0.00
0.00
0.00
0.00
0.00
5215.00
0.00
0.00
0.00
6832.00
1595.00
0.00
0.00
0.00
0.00
0.00
0.00
744.00
1356.75
0.00
FDCC Page 92 of 109 Accounts Reckoner 2007-08 to 2015-16 BE
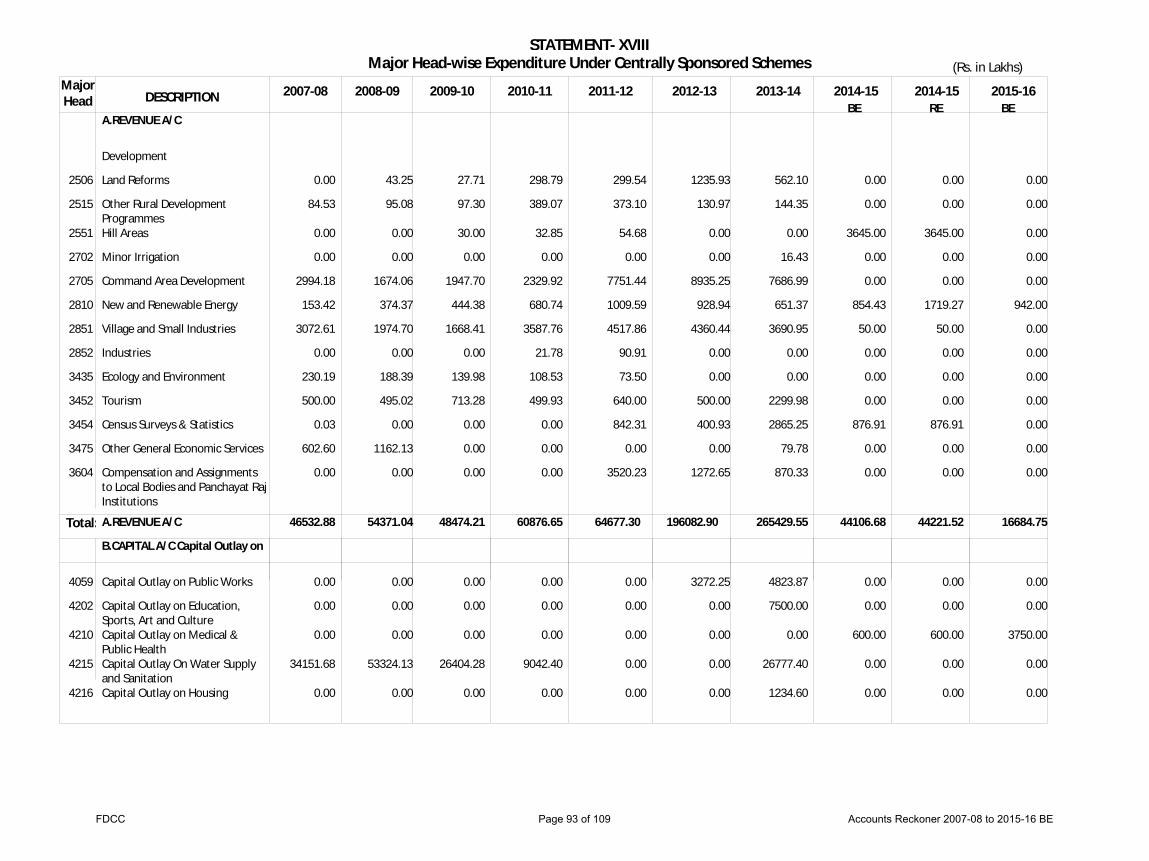
MajorHead DESCRIPTION 2007-08 2008-09 2009-10 2010-11 2011-12 2012-13 2013-14 2014-15 2014-15 2015-16
STATEMENT- XVIIIMajor Head-wise Expenditure Under Centrally Sponsored Schemes (Rs. in Lakhs)
RE BEBEA.REVENUE A/C
B.CAPITAL A/C Capital Outlay on
46532.88 54371.04 48474.21 60876.65 64677.30 196082.90 265429.55 44106.68 44221.52 16684.75
2506
2515
2551
2702
2705
2810
2851
2852
3435
3452
3454
3475
3604
4059
4202
4210
4215
4216
Development
Land Reforms
Other Rural DevelopmentProgrammesHill Areas
Minor Irrigation
Command Area Development
New and Renewable Energy
Village and Small Industries
Industries
Ecology and Environment
Tourism
Census Surveys & Statistics
Other General Economic Services
Compensation and Assignmentsto Local Bodies and Panchayat RajInstitutions
Capital Outlay on Public Works
Capital Outlay on Education,Sports, Art and CultureCapital Outlay on Medical &Public HealthCapital Outlay On Water Supplyand SanitationCapital Outlay on Housing
0.00
84.53
0.00
0.00
2994.18
153.42
3072.61
0.00
230.19
500.00
0.03
602.60
0.00
0.00
0.00
0.00
34151.68
0.00
43.25
95.08
0.00
0.00
1674.06
374.37
1974.70
0.00
188.39
495.02
0.00
1162.13
0.00
0.00
0.00
0.00
53324.13
0.00
27.71
97.30
30.00
0.00
1947.70
444.38
1668.41
0.00
139.98
713.28
0.00
0.00
0.00
0.00
0.00
0.00
26404.28
0.00
298.79
389.07
32.85
0.00
2329.92
680.74
3587.76
21.78
108.53
499.93
0.00
0.00
0.00
0.00
0.00
0.00
9042.40
0.00
299.54
373.10
54.68
0.00
7751.44
1009.59
4517.86
90.91
73.50
640.00
842.31
0.00
3520.23
0.00
0.00
0.00
0.00
0.00
1235.93
130.97
0.00
0.00
8935.25
928.94
4360.44
0.00
0.00
500.00
400.93
0.00
1272.65
3272.25
0.00
0.00
0.00
0.00
562.10
144.35
0.00
16.43
7686.99
651.37
3690.95
0.00
0.00
2299.98
2865.25
79.78
870.33
4823.87
7500.00
0.00
26777.40
1234.60
0.00
0.00
3645.00
0.00
0.00
854.43
50.00
0.00
0.00
0.00
876.91
0.00
0.00
0.00
0.00
600.00
0.00
0.00
0.00
0.00
3645.00
0.00
0.00
1719.27
50.00
0.00
0.00
0.00
876.91
0.00
0.00
0.00
0.00
600.00
0.00
0.00
0.00
0.00
0.00
0.00
0.00
942.00
0.00
0.00
0.00
0.00
0.00
0.00
0.00
0.00
0.00
3750.00
0.00
0.00
Total: A.REVENUE A/C
FDCC Page 93 of 109 Accounts Reckoner 2007-08 to 2015-16 BE

MajorHead DESCRIPTION 2007-08 2008-09 2009-10 2010-11 2011-12 2012-13 2013-14 2014-15 2014-15 2015-16
STATEMENT- XVIIIMajor Head-wise Expenditure Under Centrally Sponsored Schemes (Rs. in Lakhs)
RE BEBE
97741.05 125305.92 76925.82 77511.90 67358.23 206362.54 312822.07 50581.68 50142.52 25734.75
B.CAPITAL A/C Capital Outlay on
C.LOAN A/C
51199.17
9.00
70860.38
74.50
28425.82
25.79
16635.25
0.00
2680.93
0.00
10279.64
0.00
47324.69
67.83
5975.00
500.00
5725.00
196.00
8750.00
300.00
4225
4405
4701
4702
4851
5054
5055
5475
6211
7610
Capital Outlay on Welfare ofScheduled Castes, ScheduledTribes and Other BackwardClassesCapital Outlay on Fisheries
Capital Outlay on MediumIrrigationCapital Outlay on Minor Irrigation
Capital Outlay on Village & SmallIndustriesCapital Outlay on Roads & Bridges
Capital Outlay on Road Transport
Capital Outlay on Other GeneralEconomic Services
Loans For Family Welfare
Loans to Government Servants,etc.,
1305.64
50.77
15103.66
587.42
0.00
0.00
0.00
0.00
1.50
7.50
1403.27
86.26
15791.00
255.72
0.00
0.00
0.00
0.00
70.75
3.75
1890.94
130.60
0.00
0.00
0.00
0.00
0.00
0.00
22.00
3.79
970.70
763.52
0.00
5858.63
0.00
0.00
0.00
0.00
0.00
0.00
1674.87
552.19
0.00
0.00
0.00
0.00
453.87
0.00
0.00
0.00
1968.10
1170.89
0.00
0.00
182.97
3608.27
77.16
0.00
0.00
0.00
1086.39
2219.74
0.00
0.00
0.00
3180.75
326.94
175.00
0.00
67.83
0.00
5375.00
0.00
0.00
0.00
0.00
0.00
0.00
0.00
500.00
0.00
5125.00
0.00
0.00
0.00
0.00
0.00
0.00
0.00
196.00
0.00
5000.00
0.00
0.00
0.00
0.00
0.00
0.00
0.00
300.00
Total:
Total:
GRAND TOTAL
B.CAPITAL A/C Capital Outlay on
C.LOAN A/C
FDCC Page 94 of 109 Accounts Reckoner 2007-08 to 2015-16 BE
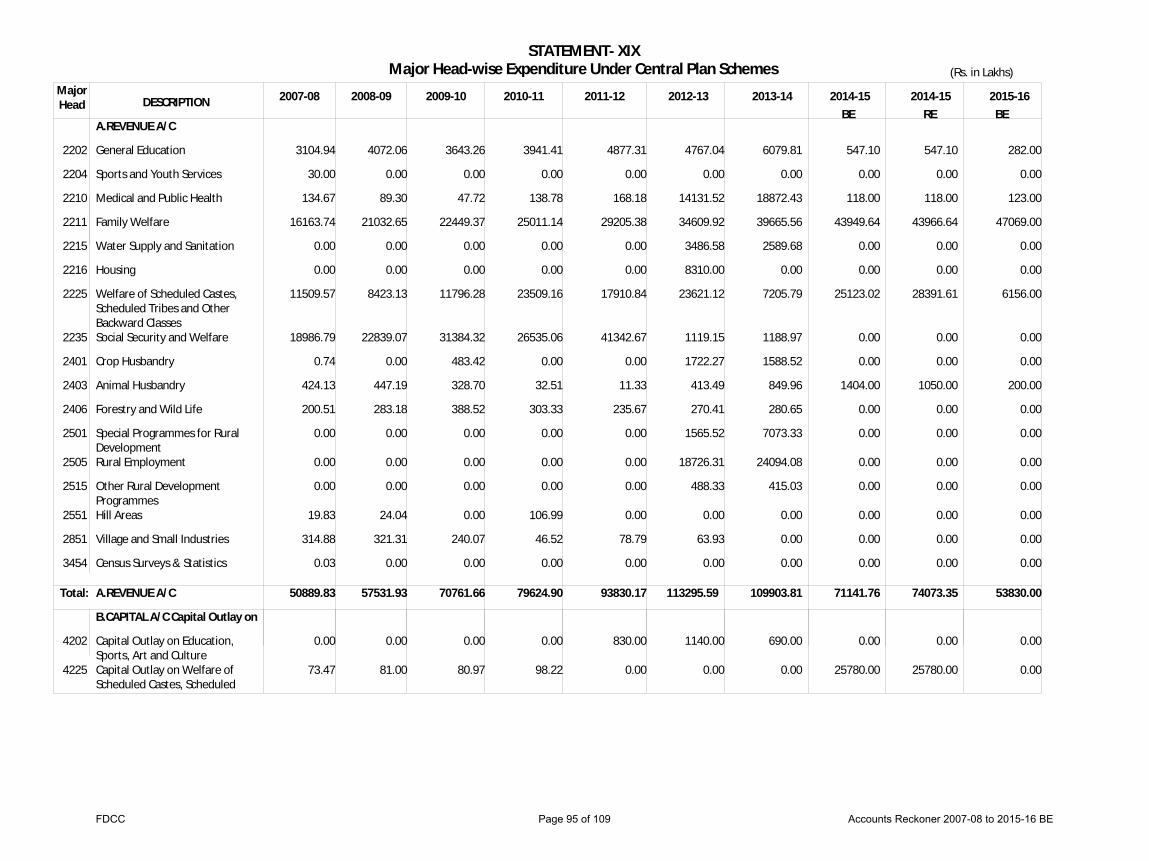
MajorHead DESCRIPTION 2007-08 2008-09 2009-10 2010-11 2011-12 2012-13 2013-14 2014-15 2014-15 2015-16
STATEMENT- XIXMajor Head-wise Expenditure Under Central Plan Schemes (Rs. in Lakhs)
RE BEBEA.REVENUE A/C
B.CAPITAL A/C Capital Outlay on
50889.83 57531.93 70761.66 79624.90 93830.17 113295.59 109903.81 71141.76 74073.35 53830.00
2202
2204
2210
2211
2215
2216
2225
2235
2401
2403
2406
2501
2505
2515
2551
2851
3454
4202
4225
General Education
Sports and Youth Services
Medical and Public Health
Family Welfare
Water Supply and Sanitation
Housing
Welfare of Scheduled Castes,Scheduled Tribes and OtherBackward ClassesSocial Security and Welfare
Crop Husbandry
Animal Husbandry
Forestry and Wild Life
Special Programmes for RuralDevelopmentRural Employment
Other Rural DevelopmentProgrammesHill Areas
Village and Small Industries
Census Surveys & Statistics
Capital Outlay on Education,Sports, Art and CultureCapital Outlay on Welfare ofScheduled Castes, Scheduled
3104.94
30.00
134.67
16163.74
0.00
0.00
11509.57
18986.79
0.74
424.13
200.51
0.00
0.00
0.00
19.83
314.88
0.03
0.00
73.47
4072.06
0.00
89.30
21032.65
0.00
0.00
8423.13
22839.07
0.00
447.19
283.18
0.00
0.00
0.00
24.04
321.31
0.00
0.00
81.00
3643.26
0.00
47.72
22449.37
0.00
0.00
11796.28
31384.32
483.42
328.70
388.52
0.00
0.00
0.00
0.00
240.07
0.00
0.00
80.97
3941.41
0.00
138.78
25011.14
0.00
0.00
23509.16
26535.06
0.00
32.51
303.33
0.00
0.00
0.00
106.99
46.52
0.00
0.00
98.22
4877.31
0.00
168.18
29205.38
0.00
0.00
17910.84
41342.67
0.00
11.33
235.67
0.00
0.00
0.00
0.00
78.79
0.00
830.00
0.00
4767.04
0.00
14131.52
34609.92
3486.58
8310.00
23621.12
1119.15
1722.27
413.49
270.41
1565.52
18726.31
488.33
0.00
63.93
0.00
1140.00
0.00
6079.81
0.00
18872.43
39665.56
2589.68
0.00
7205.79
1188.97
1588.52
849.96
280.65
7073.33
24094.08
415.03
0.00
0.00
0.00
690.00
0.00
547.10
0.00
118.00
43949.64
0.00
0.00
25123.02
0.00
0.00
1404.00
0.00
0.00
0.00
0.00
0.00
0.00
0.00
0.00
25780.00
547.10
0.00
118.00
43966.64
0.00
0.00
28391.61
0.00
0.00
1050.00
0.00
0.00
0.00
0.00
0.00
0.00
0.00
0.00
25780.00
282.00
0.00
123.00
47069.00
0.00
0.00
6156.00
0.00
0.00
200.00
0.00
0.00
0.00
0.00
0.00
0.00
0.00
0.00
0.00
Total: A.REVENUE A/C
FDCC Page 95 of 109 Accounts Reckoner 2007-08 to 2015-16 BE

MajorHead DESCRIPTION 2007-08 2008-09 2009-10 2010-11 2011-12 2012-13 2013-14 2014-15 2014-15 2015-16
STATEMENT- XIXMajor Head-wise Expenditure Under Central Plan Schemes (Rs. in Lakhs)
RE BEBE
50963.30 57612.93 70842.63 79723.12 94692.24 114435.59 110593.81 97061.76 99993.35 53830.00
B.CAPITAL A/C Capital Outlay on
73.47 81.00 80.97 98.22 862.07 1140.00 690.00 25920.00 25920.00 0.00
4405
5055
Tribes and Other BackwardClassesCapital Outlay on Fisheries
Capital Outlay on Road Transport
0.00
0.00
0.00
0.00
0.00
0.00
0.00
0.00
32.07
0.00
0.00
0.00
0.00
0.00
0.00
140.00
0.00
140.00
0.00
0.00
Total:
GRAND TOTAL
B.CAPITAL A/C Capital Outlay on
FDCC Page 96 of 109 Accounts Reckoner 2007-08 to 2015-16 BE

STATEMENT - XXPublic Debt and Liabilities as on 31st March (Rs in Crores)
2006 2008 2009 2010 2011 2012 2013DETAILS
2007 2014
I. Internal Debt
1. Market Loans
2. Others.
Total Internal Debt.
II. Loans & Adv. From central Govt.
Public Debt(I& II)
III. Other Liabilities.
(a) Small Savings, PF, etc
(c) Intrest Bearing Obligations.
(d) Non-Intrest Beraing Obligations
Other Liabilities (III)
IV. Total Liabilities ( I+II+III)
V. Intrest Payments
VI. Debt Service.
(a) Repayment of Principal-Government Of India
(b) Payment of Intrest -Government Of India
Total
(a) Repayment of Principal -Intrenal Debt.
(b) Payment of Intrest- Internal Debt.
Total
© Loans Received During the year.
(d) Net Receipts after deducting the Repayment.
(e) Percentage of Repayment incl. Intrest to Loans Received.
11769.50
14395.68
26165.18
9031.06
35196.24
6469.68
277.36
4996.63
11743.67
46939.91
3794.05
3407.59
1296.15
4703.74
621.81
2043.12
2664.93
8509.43
1140.76
87.00
11935.00
18831.71
30766.71
9282.22
40048.93
7125.55
366.20
4695.38
12187.13
52236.06
3764.82
417.50
715.16
1132.66
393.36
2517.46
2910.82
5663.54
1620.06
71.00
11702.46
20943.40
32645.86
9199.64
41845.50
7784.93
408.98
7642.76
15836.67
57682.17
4236.40
737.03
754.38
1491.41
1012.34
2913.64
3925.98
3545.94
-1871.45
153.00
11989.95
21326.39
33316.34
9557.08
42873.42
8498.05
308.10
8427.65
17233.80
60107.22
4505.78
448.56
746.13
1194.69
802.08
3100.57
3902.65
2278.55
-2818.79
224.00
18573.35
21422.51
39995.86
9691.81
49687.67
9709.55
347.70
11805.25
21862.50
71550.17
4532.00
461.43
757.69
1219.12
482.99
963.81
1446.80
8592.15
5926.23
31.00
23257.18
21940.79
45197.97
9902.21
55100.18
11183.78
274.53
17640.48
29098.79
84198.97
5213.00
470.46
752.21
1222.67
791.75
3674.54
4466.29
7990.86
2301.90
71.00
30771.93
23561.32
54333.25
10981.62
65314.87
14181.71
380.43
23153.17
37715.31
103030.18
6061.85
800.20
775.75
1575.95
2519.68
4185.55
6705.23
9357.95
1076.77
88.00
39920.62
23497.76
63418.38
11634.08
75052.46
15914.02
313.04
25487.25
41714.31
116766.77
6833.43
696.53
761.37
1457.90
3030.53
4823.41
7853.94
13464.66
4152.82
69.00
53326.91
23101.17
76428.08
12094.37
88522.45
18020.87
414.14
28360.86
46795.87
135318.32
7837.32
694.27
754.86
1449.13
7837.33
5597.74
13435.07
16132.25
1248.05
83.29
FDCC Page 97 of 109 Accounts Reckoner 2007-08 to 2015-16 BE

STATEMENT- XXI
As on 31st March Max.amount guaranteed (Principal only)
Amount Outstanding
Principal Interest
(Rs in Crores)Contingent Liabilities for Guarntees given by the Government
2003
2004
2005
2006
2007
2008
2009
2010
2011
2012
2013
2014
20972.85
21224.69
19909.51
20107.33
19792.93
23108.87
18732.42
18420.17
19149.76
13262.17
14306.30
16144.86
12799.61
13913.93
11293.11
8875.88
9728.54
10390.27
8177.69
6953.88
6448.40
6490.70
6564.95
7670.51
514.07
265.30
280.89
108.04
150.94
396.13
5151.28
249.17
169.30
148.83
122.86
112.21
FDCC Page 98 of 109 Accounts Reckoner 2007-08 to 2015-16 BE

STATEMENT- XXII
Loans and Advances by the State Government ( Rs in Crores)
2015-16BE
2014-15RE
2014-152013-142012-132011-122010-112009-102008-092007-08BE
2006-07
Opening Balance
Amount advanced during the year
Amount repaid during the year
Closing Balance
Net increase(+)/decrease(-)
Interest received and credited to Revenue
Interest recived as % to Outstanding Loan
6240.82
756.74
52.07
6945.49
704.67
53.23
0.77
6945.49
731.34
56.65
7620.18
674.69
32.39
0.43
7620.18
981.58
555.36
8046.40
426.22
59.05
0.73
8046.40
1737.93
161.37
9622.96
1576.56
166.11
1.73
9622.96
1815.55
240.39
11198.12
1575.16
33.65
0.30
11198.14
1102.37
157.61
12142.90
944.78
246.63
2.03
12142.90
695.43
109.28
12729.05
586.15
234.67
1.84
12729.05
476.60
92.73
13112.92
383.87
60.64
0.46
12729.05
450.18
60.45
13118.78
389.73
60.64
0.46
12729.05
723.23
91.21
13361.07
248.15
73.65
0.55
5943.56
357.23
59.97
6240.82
297.26
32.85
0.53
FDCC Page 99 of 109 Accounts Reckoner 2007-08 to 2015-16 BE
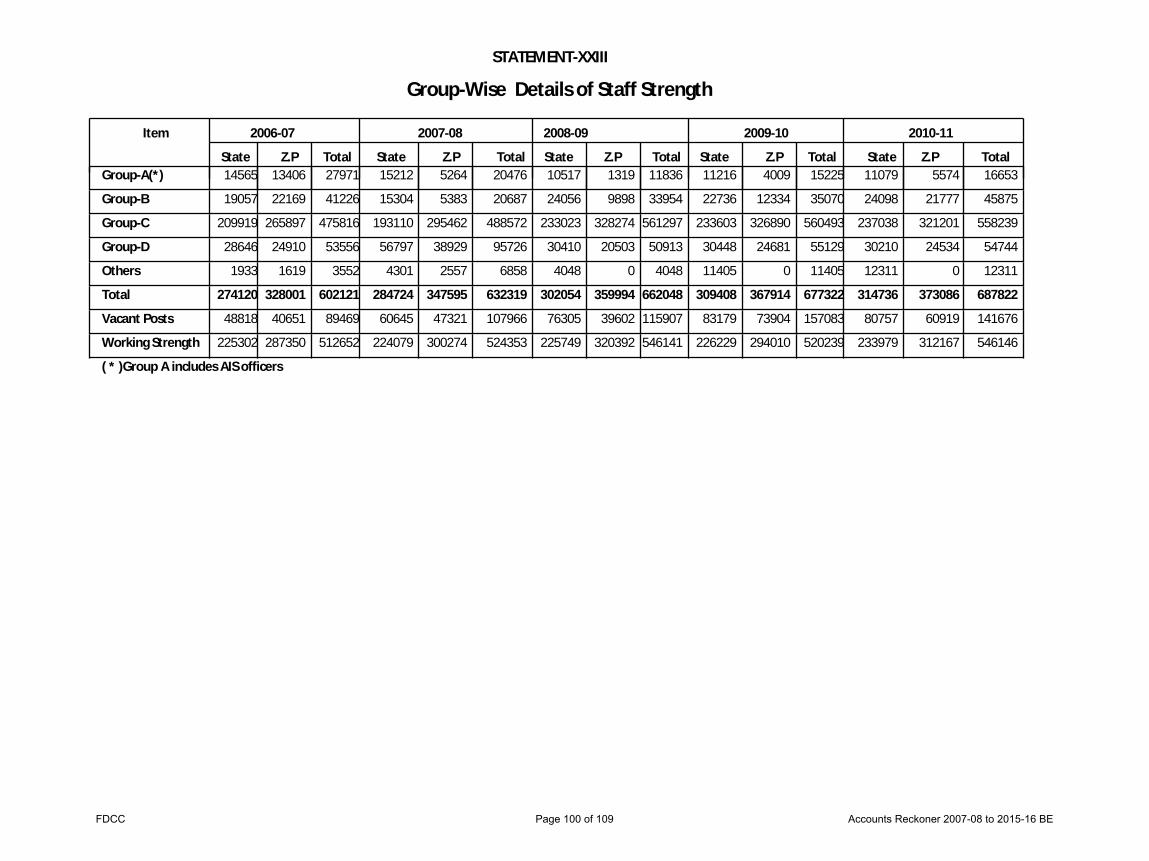
2006-07 2007-08 2008-09 2009-10 2010-11
State Z.P Total State Z.P Total State Z.P Total State Z.P Total State Z.P Total
Item
Group-Wise Details of Staff Strength
STATEMENT-XXIII
Group-A(*)
Group-B
Group-C
Group-D
Others
Total
Vacant Posts
Working Strength
14565
19057
209919
28646
1933
274120
48818
225302
13406
22169
265897
24910
1619
328001
40651
287350
15212
15304
193110
56797
4301
284724
60645
224079
5264
5383
295462
38929
2557
347595
47321
300274
10517
24056
233023
30410
4048
302054
76305
225749
1319
9898
328274
20503
0
359994
39602
320392
11216
22736
233603
30448
11405
309408
83179
226229
4009
12334
326890
24681
0
367914
73904
294010
11079
24098
237038
30210
12311
314736
80757
233979
5574
21777
321201
24534
0
373086
60919
312167
27971
41226
475816
53556
3552
602121
89469
512652
20476
20687
488572
95726
6858
632319
107966
524353
11836
33954
561297
50913
4048
662048
115907
546141
15225
35070
560493
55129
11405
677322
157083
520239
16653
45875
558239
54744
12311
687822
141676
546146
( * )Group A includes AIS officers
FDCC Page 100 of 109 Accounts Reckoner 2007-08 to 2015-16 BE

2011-12 2012-13 2013-14 2014-15 2015-16
State Z.P Total State Z.P Total State Z.P Total State Z.P Total State Z.P Total
Group
Group-Wise Details of Staff StrengthSTATEMENT-XXIII
Group-A(*)
Group-B
Group-C
Group-D
Others
Total
Vacant Posts
Working Strength
10542
27833
241794
30956
13060
324185
84895
239290
5515
16516
327202
22824
0
372057
57435
314622
11695
27615
247694
31068
12944
331016
81641
249375
7669
79815
241205
42824
1102
372615
84473
288142
11906
27831
250571
31893
12996
335197
193590
141607
7710
76429
283420
25343
17541
410443
84471
325972
23514
55318
438404
118154
25428
660818
201886
458932
7867
77989
289204
25860
18998
419918
93137
326781
14164
26041
229154
55015
13331
337705
112547
225158
7259
18849
357860
28643
1118
413729
109739
303990
16057
44349
568996
53780
13060
696242
142330
553912
19364
107430
488899
73892
14046
703631
166114
537517
19616
104260
533991
57236
30537
745640
278061
467579
31381
133307
727608
144014
44426
1080736
295023
785713
21423
44890
587014
83658
14449
751434
222286
529148
( * )Group A includes AIS officers For the Year 2015-16 ZP numbers under Gorup-A,B and C under reconcilation
FDCC Page 101 of 109 Accounts Reckoner 2007-08 to 2015-16 BE

STATEMENT-XXIVExpenditure on Salaries ( Rs in Crores)
Plan Non-Plan Plan Non-Plan Plan Non-Plan Plan Non-Plan Plan Non-Plan Plan Non-Plan
2010-112009-102008-092007-082006-072005-06
336.74 5576.23 434.54 6110.82 600.54 7120.65 757.92 8398.29 912.94 8689.96 1187.84 10179.63
A.REVENUE ACCOUNT
B.CAPITAL ACCOUNT 311.10
25.64
5572.95
3.28
421.81
12.73
6109.12
1.70
585.57
14.97
7118.74
1.91
742.08
15.84
8396.20
2.09
899.73
13.21
8687.73
2.23
1173.06
14.78
10177.26
2.37
State Sector
ZP Sector
State Sector
ZP Sector
114.46
196.64
12.82
12.82
2599.58
2973.37
1.64
1.64
119.31
302.50
12.73
2691.28
3417.84
1.70
168.75
416.82
14.97
3325.80
3792.94
1.91
250.48
491.60
15.84
3822.83
4573.37
2.09
324.49
575.24
13.21
4070.24
4617.49
2.23
510.76
662.30
14.78
0.00
4690.13
5487.13
2.37
0.00
Total
Total
5912.97 6545.36 7721.19 9156.21 9602.90 11367.47Total Salary Expenditure
(Plan+ Non-Plan)
Grand Total
A.REVENUE ACCOUNT
B.CAPITAL ACCOUNT
FDCC Page 102 of 109 Accounts Reckoner 2007-08 to 2015-16 BE

STATEMENT-XXIV
Expenditure on Salaries (Rs in Crores)
Plan Non-Plan Plan Non-Plan Plan Non-Plan Plan Non-Plan
BE2011-12 2012-13 2013-14 2015-16ACCOUNTS
1502.76 11326.21 2398.38 13685.69 2758.78 15050.42 3371.49 19205.08
A.REVENUE ACCOUNT
B.CAPITAL ACCOUNT 1487.26
15.50
11323.66
2.55
2382.19
16.19
13682.72
2.97
2741.63
17.15
15047.33
3.09
3367.04
4.45
19201.95
3.13
State SectorZP Sector
State SectorZP Sector
657.76 829.50
15.50 0.00
5323.00 6000.66
2.55 0.00
826.22 1555.97
16.19 0.00
6266.47 7416.25
2.97 0.00
947.84 1793.79
17.15 0.00
7007.34 8039.99
3.09 0.00
1224.83 2142.21
4.45 0.00
9031.61 10170.34
3.13 0.00
Total
Total
Grand Total :
Total Salary Expenditure
(Plan + Non-Plan)
12828.97 16084.07 17809.2 22576.57
A.REVENUE ACCOUNT
B.CAPITAL ACCOUNT
FDCC Page 103 of 109 Accounts Reckoner 2007-08 to 2015-16 BE

STATEMENT- XXV
No.of Pensioners & Expenditure thereon
Year No.of Pensioners Expenditure( Rs.in Crores)
2006-07
2007-08
2008-09
2009-10
2010-11
2011-12
2012-13
2013-14
434100
450000
434100
426000
468000
492000
501000
501000
2495.88
3295.94
2495.88
3408.32
4069.94
5436.20
7227.44
9151.82
FDCC Page 104 of 109 Accounts Reckoner 2007-08 to 2015-16 BE
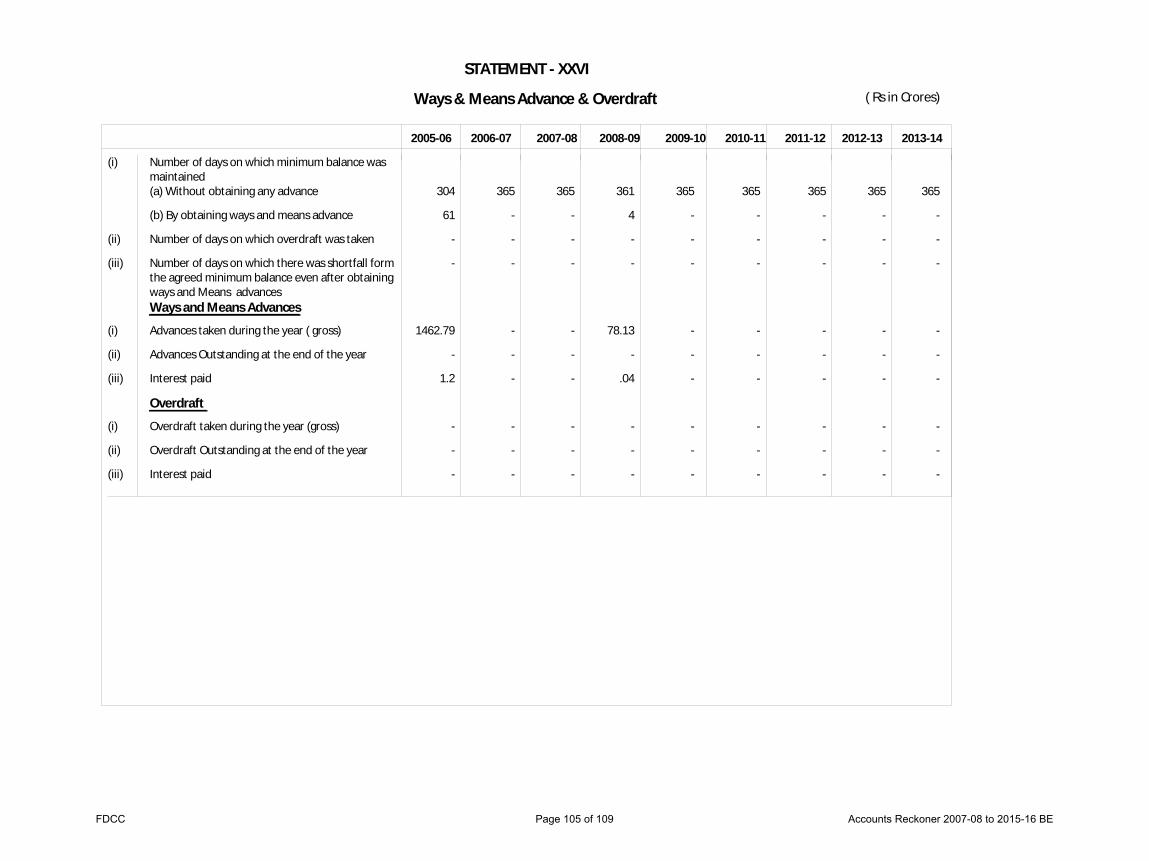
STATEMENT - XXVI
Ways & Means Advance & Overdraft ( Rs in Crores)
2013-142012-132011-122010-112009-102008-092007-082006-072005-06
(i)
(ii)
(iii)
(i)
(ii)
(iii)
(i)
(ii)
(iii)
Number of days on which minimum balance wasmaintained(a) Without obtaining any advance
(b) By obtaining ways and means advance
Number of days on which overdraft was taken
Number of days on which there was shortfall formthe agreed minimum balance even after obtainingways and Means advancesWays and Means Advances
Advances taken during the year ( gross)
Advances Outstanding at the end of the year
Interest paid
Overdraft
Overdraft taken during the year (gross)
Overdraft Outstanding at the end of the year
Interest paid
304
61
-
-
1462.79
-
1.2
-
-
-
365
-
-
-
-
-
-
-
-
-
365
-
-
-
-
-
-
-
-
-
361
4
-
-
78.13
-
.04
-
-
-
365
-
-
-
-
-
-
-
-
-
365
-
-
-
-
-
-
-
-
-
365
-
-
-
-
-
-
-
-
-
365
-
-
-
-
-
-
-
-
-
365
-
-
-
-
-
-
-
-
-
FDCC Page 105 of 109 Accounts Reckoner 2007-08 to 2015-16 BE

STATEMENT -XXVII
Misappropriations, Defalcations etc.
The State Government reported cases of Misappropriations, defalcation etc., involving Government money
amounting to Rs lakhs upto the period 31st March on which final action is pending. Department-wise detials are as follows.
Sl.No Department No.of CasesAmount
( Rs. in Lakhs)
56
1735.81 2014
56 1735.81
123456789
10111213141516171819
HorticultureAnimal Husbandry & Veterinary ServicesCommerce & IndustriesLabourLaw & Parlimentary AffairsEducationFinanceForest, Environment & EcologyHealth & Family WelfareHomeInfromation, Tourism & Youth Service.PlanningPublic WorksWater ResourcesRevenueRural Development & Panchayat RajSocial WelfareWomen & Child DevelopmentDPAR
01327604
101005
1410101
0.00 1.10 2.38 3.99 4.47 4.53 0.00
132.86 1.60 0.64 0.00 0.00
1155.30 425.37
0.20 0.00 2.69 0.00 0.68
Total:
FDCC Page 106 of 109 Accounts Reckoner 2007-08 to 2015-16 BE

Developmental & Non-Developmental Expenditure
(Rs. in Crores)
2007-08 2008-09 2009-10 2010-11 2011-12 2012-13 2013-14 2013-15 2014-15 2015-16
STATEMENT XXVIII
BEREBE
1
(a)(b)(c)(d)
2
(a)(b)(c)
3
(a)(b)(c)
4
(a)
i)ii)iii)
(b)
i)ii)
CONSOLIDATED FUND [1 to 6]REVENUEGeneral ServicesSocial ServicesEconomic ServicesGrant-in-AidTotal(1)CAPITALGeneral ServicesSocial ServicesEconomic ServicesTotal(2)LOANGeneral ServicesSocial ServicesEconomic ServicesTotal (3)PUBLIC DEBTInternal DebtWays and MeansOverdraftOthersTotal 4(a)GOI LoansDebt SwapÓthersTotal 4(b)Total (4)=(a)+(b)
48109.21
10871.78 13123.67 11453.31
1926.00 37374.76
339.02 2147.68 6162.24
8648.94
0.00 594.80 161.94
756.74
0.00 78.13
0.00 802.08
880.21
0.00 448.56
448.56
1328.77
54038.81
12275.57 15872.99 11136.64
2374.09 41659.29
475.36 2555.16 6839.76
9870.28
0.00 173.34 558.01
731.35
0.00 0.00 0.00
1316.46 1316.46
0.00 461.43
461.43
1777.89
62963.51
12762.34 19118.86 13181.71
2474.01 47536.92
489.85 2650.68 8996.15
12136.68
0.00 805.10 176.48
981.58
0.00 0.00 0.00
1837.87 1837.87
0.00 470.46
470.46
2308.33
71934.09
14055.10 22107.82 14892.44
2978.49 54033.85
465.46 2616.70
10273.01 13355.17
0.00 1489.51
248.43 1737.94
0.00 0.00 0.00
1916.17 1916.17
0.00 890.96
890.96
2807.13
85756.17
16445.48 25171.74 19153.90
4343.96 65115.08
625.49 2695.20
12184.97 15505.66
0.00 1546.21
269.34 1815.55
0.00 0.00 0.00
2519.68 2519.68
0.00 800.20
800.20
3319.88
96601.14
20180.84 30419.80 21674.19
4018.42 76293.25
589.47 2915.98
11973.01 15478.46
0.00 815.28 287.09
1102.37
0.00 0.00 0.00
3030.53 3030.53
0.00 696.53
696.53
3727.06
110648.70
24954.41 32621.89 26592.83
5020.44 89189.57
500.74 3052.68
13393.44 16946.86
0.00 428.19 267.24
695.43
0.00 0.00 0.00
3122.57 3122.57
0.00 694.27
694.27
3816.84
138008.16
29570.19 42116.77 32398.78
6671.60 110757.34
770.97 4825.89
14416.92 20013.78
0.00 153.30 323.30
476.60
0.00 1500.00
500.00 3986.01
5986.01
0.00 774.43
774.43
6760.44
132835.45
27690.36 42997.10 31192.49
6867.68 108747.63
738.47 5022.72
13118.86 18880.05
0.00 153.30 296.88
450.18
0.00 0.00 0.00
4034.25 4034.25
0.00 723.34
723.34
4757.59
142534.43
30997.04 45728.41 32175.31
6548.92 115449.68
832.42 4475.86
15255.34 20563.62
0.00 352.00 381.23
733.23
0.00 1500.00
500.00 3011.78
5011.78
0.00 776.12
776.12
5787.90
FDCC Page 107 of 109 Accounts Reckoner 2007-08 to 2015-16 BE

Developmental & Non-Developmental Expenditure
(Rs. in Crores)
2007-08 2008-09 2009-10 2010-11 2011-12 2012-13 2013-14 2013-15 2014-15 2015-16
STATEMENT XXVIII
BEREBE5
6
1
(a)(b)(c)
2
(a)(b)(c)
3
(a)(b)(c)
1
(a)(b)(c)(d)
2
Inter-State SettlementTransfer to Contingenecy FundTotal (G+H)I Developmental ExpenditureRevenueGeneral ServicesSocial ServicesEconomic ServicesTotal (1)CapitalGeneral ServicesSocial ServicesEconomic ServicesTotal (2)LoanGeneral ServicesSocial ServicesEconomic ServicesTotal (3)II Total Non-DevlopmentalExpenditureRevenueGeneral ServicesSocial ServicesEconomic ServicesGrant-in-AidTotal (1)Capital
0.00
0.00
0.00
34118.89
377.88 12952.07 11453.31
24783.26
270.48 2147.68 6162.24
8580.40
0.00 594.80 160.43
755.23
12661.56
10493.91 171.60
0.00 1926.00
12591.51
0.00
0.00
0.00
37609.41
426.21 15551.16 11136.64
27114.01
371.73 2555.16 6839.76
9766.65
0.00 173.34 555.41
728.75
14651.53
11849.37 321.84
0.00 2374.09
14545.30
0.00
0.00
0.00
43911.61
460.08 17256.13 13181.71
30897.92
390.40 2650.68 8996.15
12037.23
0.00 805.10 171.36
976.46
16743.57
12302.26 1862.72
0.00 2474.01
16638.99
0.00
0.00
0.00
52326.77
502.84 21941.65 14892.44
37336.93
363.71 2616.70
10273.01 13253.42
0.00 1489.51
246.91 1736.42
16800.19
13552.25 166.17
0.00 2978.49
16696.91
0.00
0.00
0.00
61736.01
515.81 24932.37 19153.90
44602.08
529.87 2695.20
12184.97 15410.04
0.00 1546.21
177.68 1723.89
20700.28
15929.67 239.37
0.00 4343.96
20513.00
0.00
0.00
0.00
68365.56
763.18 29452.25 21674.19
51889.62
502.41 2915.98
11973.01 15391.40
0.00 815.28 269.26
1084.54
24508.52
19417.66 967.55
0.00 4018.42
24403.63
0.00
0.00
0.00
76948.69
755.22 32079.84 26592.83
59427.89
407.07 3052.68
13393.44 16853.19
0.00 428.19 239.42
667.61
29883.18
24199.19 542.05
0.00 5020.44
29761.68
0.00
0.00
0.00
95262.61
853.32 41739.02 32398.78
74991.12
653.85 4825.89
14416.92 19896.66
0.00 153.30 221.53
374.83
35985.10
28716.86 377.75
0.00 6671.60
35766.21
0.00
0.00
0.00
93440.51
795.97 42258.42 31192.49
74246.88
621.35 5022.72
13118.86 18762.93
0.00 153.30 277.40
430.70
34637.35
26894.39 738.68
0.00 6867.68
34500.75
0.00
0.00
0.00
99208.60
891.13 45352.18 32175.31
78418.62
493.14 4475.86
15255.34 20224.34
0.00 352.00 213.64
565.64
37537.93
30105.91 376.23
0.00 6548.92
37031.06
FDCC Page 108 of 109 Accounts Reckoner 2007-08 to 2015-16 BE

Developmental & Non-Developmental Expenditure
(Rs. in Crores)
2007-08 2008-09 2009-10 2010-11 2011-12 2012-13 2013-14 2013-15 2014-15 2015-16
STATEMENT XXVIII
BEREBE(a)(b)(c)
3
(a)(b)(c)
III
General ServicesSocial ServicesEconomic ServicesTotal (2)LoanGeneral ServicesSocial ServicesEconomic ServicesTotal (3)PUBLIC DEBTCONSOLIDATED FUND [I to III]
68.54 0.00 0.00
68.54
0.00 0.00 1.51
138.59
1328.77
48109.22
103.63 0.00 0.00
103.63
0.00 0.00 2.60
209.86
1777.89
54038.83
99.46 0.00 0.00
99.46
0.00 0.00 5.12
204.04
2308.33
62963.51
101.76 0.00 0.00
101.76
0.00 0.00 1.52
205.04
2807.13
71934.09
95.62 0.00 0.00
95.62
0.00 0.00
91.66 282.90
3319.88
85756.17
87.06 0.00 0.00
87.06
0.00 0.00
17.83 191.95
3727.06
96601.14
93.68 0.00 0.00
93.68
0.00 0.00
27.82 215.18
3816.84
110648.71
117.12 0.00 0.00
117.12
0.00 0.00
101.77 336.01
6760.44
138008.15
117.12 0.00 0.00
117.12
0.00 0.00
19.48 253.72
4757.59
132835.45
339.28 0.00 0.00
339.28
0.00 0.00
167.59 846.15
5787.90
142534.43
FDCC Page 109 of 109 Accounts Reckoner 2007-08 to 2015-16 BE