foot pathology mri part 1.shorouk zaki
TRANSCRIPT

MRI OF THE FOOTPART II
Represented byRepresented by
Shorouk ZakiAssistant lecturer of radiology
Benha faculty of medicine

patHoloGY of tHe foot
structuresstructures

plantar fascIa

Plantar Fasciitis
Refers to inflammation of the plantar fascia of the foot which is considered the most common cause of heel pain.
Clinical
Obese women, runners, or patients with seronegative arthritis with heel pain
Etiology
It can arise from several factors:
1. Mechanical: stress of repetitive trauma (more common)
2. Degenerative
3. Systemic: as an enthesopathy in association with seronegative spondyloarthropathies as ankylosing spondyolitis , reiter’ssyndrome and psoriatic artheritis.
Pathology : Tears, myxoid degeneration, inflammation

MRIT1/PD: intermediate signal
T2: high signal
STIR: very sensitive in the detection of both fascial and perifascial oedema, which appear as poorly marginatedareas of high signal intensity
Other MRI features include:
1. Plantar fascial thickening: often fusiform and typically involves the proximal portion and extends to the calcanealinsertion
2. Oedema of the adjacent fat pad and underlying soft tissues
3. Limited marrow oedema within the medial calcanealtuberosity may also be seen

NORMAL
A, T1W sagittal image of the hindfoot. The proximal plantar fascia is thickened and high signal (between arrowheads). There is an erosion of the adjacent calcaneal tuberosity (arrow). B, T2*W sagittal image of the hindfoot. The same findings are seen as in A, but the signal in the fascia is higher, and the abnormality is easier to identify. C, T1W coronal image of the hindfoot. The calcaneal erosion and marrow edema are evident (arrow). The plantar fascia on the medial side of the calcaneus is about four times its normal
thickness (between arrowheads) and higher signal than normal


Extensive fluid accumulation around the plantar facia.

Thickened plantar fascia with mild fluid collection seen around the fascia, findings are suggestive of

High signal surrounding the attachementof the plantar fascia to the calcaneum. A spur is also present.

+Gd
MRI demonstrates fascial and perifascial oedema associated with calcaneal osteitis. Note the contrast enhancement after the intravenous administration of gadolinium.

•Plantar fascial fusiform thickening which involves its proximal portion and extends to the calcaneal insertion, it elicits increased signal at STIR WI, yet with no complete fiber disruption.•Oedema of the adjacent fat pad and underlying soft tissues.•Calcaneal marrow oedema at its insertion.

PLANTAR FASCIAL TEAR OR RUPTURE
It refer to disruption of plantar fascial fibres which can occur in associated with longstanding plantar fascitisor those treated with steroid injections or even in cases of forced dorsiflexion.
The tears can be complete (i.e. rupture) or incomplete.
Radiographic featuresRadiographic features
MRI
T1Absence of T1-weighted low signal intensity at the site of
complete rupture or partial loss of T1-weighted low signal intensity.
Abnormal thickening of the plantar aponeorosis at the site of disruption (either complete or partial)

Plantar fascia: rupture. STIR sagittal image of the hindfoot. There is disruption of the plantar fascia (arrow) about 2 cm from its origin on the calcaneus. There is surrounding high signal edema/hemorrhage


Plantar fibromatosis, or Ledderhose disease
• Refers to a benign fibroblastic proliferation of the plantar fascia.
• It is classified as a type of musculoskeletal fibromatosis.
• Nodules or masses of plantar fibromatosis are • Nodules or masses of plantar fibromatosis are typically located in the middle to the medial aspectof the plantar arch and may extend to involve the skin or deep structures of the foot.
• Lesions may be symptomatic because of a mass effect or invasion of adjacent muscles or neurovascular structures.
• Exact etiology of plantar fibromatosis is not well understood.

MRITypically seen as a relatively well-defined region of multinodular thickening about the inferiormargin of the plantar fascia.Signal characteristicsT1: iso to low signal compared with muscleT1 C+ (Gd): demonstrates variable contrast T1 C+ (Gd): demonstrates variable contrast enhancementT2: low to intermediate signal compared with muscle


plantar plate
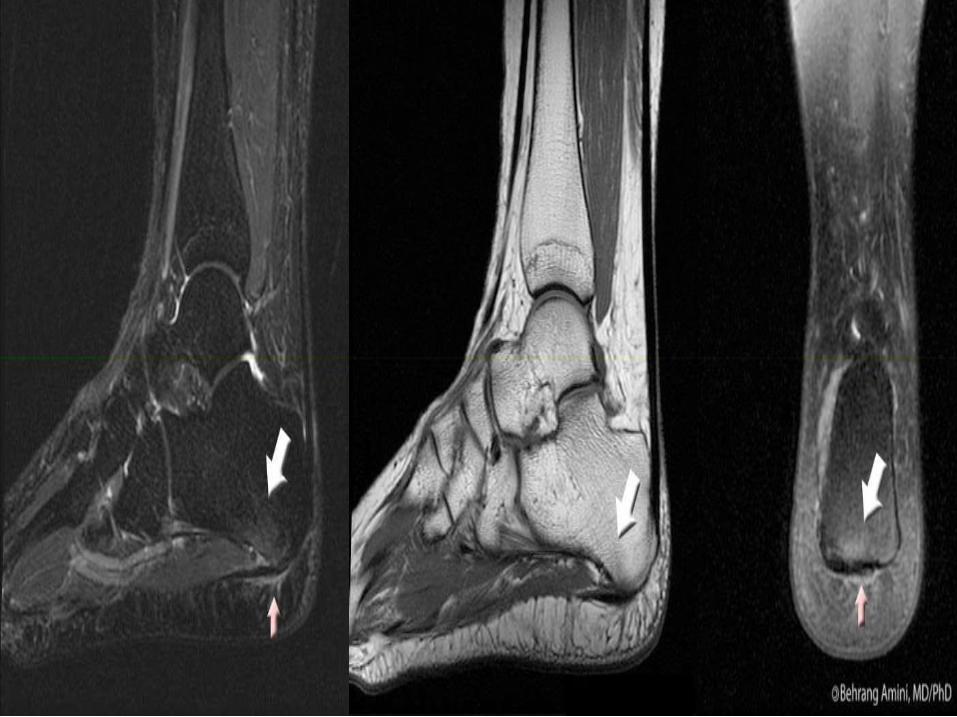
PLANTAR PLATE TEARSThe plantar plate tears are classified in 4 grades:
Grade 1: the signal intensity of the plantar plate is increased without loss the continuity of its fibers.
Grade 2: there is a "buttonhole" tear at the point of maximum weight bearing.maximum weight bearing.
Grade 3: there is a rupture that compromise less than the 50% of its thickness.
Grade 4: rupture that compromise 50% or more of the plantar plate thickness; you should always look for laxation of the plantar plate that is present when there is a tear of the collateral ligament.

NORMAL BLUE

NORMAL BLUE

NORMAL BLUE

NORMAL BLUE


• Turf toe is an extreme traumatic dorsiflexion(hyperextension) injury of the toe results in plantar plate injury from sprain to complete tear of the plantar plate capsuloligamentous complex and allows unrestricted range of motion of the first metatarsophalangeal (MTP) joint.
• Grading: according to severity:
grade 1 - stretch or minor tearing of the 1st MTP grade 1 - stretch or minor tearing of the 1st MTP capsuloligamentous structures
grade 2 - partial tearing of the capsuloligamentousstructures with intact articular surface
grade 3 - complete disruption of the capsuloligamentousstructures with impaction deformity of the MTP, articularcartilage damage, trabecular edema, sesamoidal fracture, or diastasis of sesamoidal fragments

VariantsMany variants of turf toe injury have been described and include1. Valgus mechanism with injury of the medial
capsuloligamentous structures2. Varus mechanism with injury of the lateral
capsuloligamentous structures and adductor hallucis tendon
3. Hyperflexion injury (forced plantar flexion) also 3. Hyperflexion injury (forced plantar flexion) also known as “sand toe” as this is common in sand volleyball players and skimboarders causing injury to the dorsal capsular structures

There is a large defect within the plantar plate of the first MTP joint along with a tear of the intersesamoid ligament. Slight proximal sesamoid migration only. There is oedema within the plantar medial aspect of the metatarsal head associated with a region of subchondral bony depression and presumed osteochondral injury. The dorsal capsule of the MTPThe dorsal capsule of the MTPjoint is avulsed from the distalattachment and has stripped a small amount of periosteum. Associated slight plantar subluxation of the proximal phalanx relative to the MTP head. A joint effusion is present with evidence of leakage of joint fluid at the plantar proximal aspect of the capsule. Normal appearance of the flexor hallucis tendon.

MR images demonstrate high signal intensity of the medial aspect of the plantar plate of great toe, well seen on the coronal and sagittal T2W Fat Sat images. It corresponds to streching of the medial phalangeo-seasamoid ligament. No retraction of seasamoid bones or oedemaof flexor hallucis brevis or abductor hallucis.
trauma

ROLE OF MRI IN TRAUMA:
I. Stress fractures
II. Bone contusion
III.Occult fractures
IV.Osteochondral lesions of talusIV.Osteochondral lesions of talus
V. Ligamentous injuries
VI.Miscellaneous injuries

STRESS FRACTURES -I
• Normal bone is exposed to repeated abnormal stress.
• Insufficiency fractures: if normal stress is placed on bones with compromised elastic resistance.
• Stress fractures of the foot and ankle are common in• Stress fractures of the foot and ankle are common insport activities and in athletes engaged in sports that involve jumping and running.
• Metatarsals, tarsal bones, sesamoids, medial malleolus, talus, and fibula can all be involved and less frequently the tibia.

CLASSIFICATION OF STRESS FRACTURES
• Based on its location, stress fractures of the foot and ankle may be classified in high, medium, and low risk fractures.
• Early diagnosis is especially important in high risk stress fractures, in which potentially serious sequelae including joint involvement, displacement, delayed union, nonunion, and recurrence of fracture may occur.union, nonunion, and recurrence of fracture may occur.
• Stress fractures of tarsal navicular and sesamoids are high risk injuries.
• In the medial mallelus and proximal diaphysis of the fifth metatarsal, stress fractures are considered as medium risk fractures.
• Whereas distal fibula, calcaneus and distal diaphysisof the second to fifth metatarsals are low risk stress fractures locations.

• Clinical history is paramount in the diagnosis of a stress fracture.
• Patients usually report increased intensity or duration of exercise regimen, or a change in the type of activity or the surface on which the activity occurs.
• Because of the low sensitivity of radiographs, bone scintigraphy has usually been used to confirm the diagnosis of stress fractures.
• Recently, MRI is being considered the modality of choice to confirm the diagnosis in cases in which radiographs are normal or equivocal, because it is as sensitive but more specific than bone scintigraphy, and permit to detect associated soft-tissue injuries.

In the very early stages, a condition known as “stress response” occurs:•Edema, hyperemia, and osteoclastic activity develop within the stressed area of the bone. •At this stage, MRI often demonstrates signal intensity alteration in the marrow space, with ill-defined low signal intensity on T1-weighted and high signal intensity
MRI findings of stress fractures depend on the stage of the disease:
signal intensity on T1-weighted and high signal intensity on T2-weighted and STIR images. •This abnormal signal intensity is similar to that seen in a bone contusion. •Early findings also include edematous changes on the periosteal surface of bone. •Muscle edema adjacent to stressed bone seems to appear more lately.

• As the stress persists and a fracture develops, MRI will disclose a well-defined low signal fracture line.
• Periosteal callus formation appears as a low signal rim running parallel to the cortex.
Kiuru et al have described a classification-grading system for stress fractures based on MR findings:
Grade I: endosteal marrow edema
Grade II: periosteal edemaGrade II: periosteal edema
Grade III: associated muscle edema changes
Grade IV : marked by the detection of a fracture line
Grade V: periosteal callus formation is present


• Trabecular micro fractures associated with medullary edema and hemorrhage.
• On MRI, bone contusion appears as ill-definedreticulated areas confined to the medullary space of cancellous bone, with low signal intensity on T1-weighted images and high signal intensity on
BONE CONTUSION OR BRUISES -II
T2 weighted images, especially fat suppressed T2 weighted and STIR images.
• These changes are more patent in the acutestage and in most cases resolve in 2 to 3 months .
• Identifying the contusion indicates the cause of pain and avoids further costly or invasive investigations.


• Calcaneus and talus are the most common location of occult fractures of the ankle and foot.
• MRI can help detect these radiographically“occult” fractures of the ankle.
• In such cases, a traumatic injury has recently
OCCULT FRACTURES -III
• In such cases, a traumatic injury has recently occurred and MRI discloses a fracture line with very low signal intensity associated with cortical interruption as well as signal intensity changes representing edema and medullary hemorrhage

Occult fracture of the anterosuperior
calcaneal process in asoccer-player.
Sagittal STIR MRI shows a small fracture
(arrow). The bony fragment and the adjacent calcaneusshows ill-defined high
signal changes representing bone marrow edema

status post inversion injury with persistent ankle pain and normal radiographic examination MRI revealed an occult non displaced distal fibular fracture


• Articular surface injuries of the talar dome have been variously termed as:
1. Osteochondral defects/ fractures/ injuries
2. Osteochondritis dissecans
3. Transchondral fractures
• The term osteochondritis dissecans was initially
) OLTOSTEOCHONDRAL LESIONS OF THE TALUS (-IV
used to design a lesion, which was thought to be ischemic, resulting in the separation of a fragment of subchondral bone and cartilage from the articularsurface.
• Currently, osteochondral lesion of the talus (OLT) is the accepted term for a variety of disorders including osteochondritis dissecans, osteochondralfracture, transchondral fracture, and talar dome fracture

• The classification introduced by Berndt and Harty is the most widely accepted staging system of osteochondral talarlesions:
It describes four stages depending on the integrity of the articular cartilage and the condition of the subchondral bone .
Stage I represents subchondral compressionfracture, but the overlying articularcartilage remains intact cartilage remains intact
Stage II consists of a partially detached osteochondral fragment
Stage III, the osteochondral fragment is completely detached from the talus but is not displaced
Stage IV, the osteochondral fragment is detached and displaced, located away from the fracture site.

• Radiographs are less sensitive in the detection of the first two stages of the bernd and harris classification and are also relatively insensitive in evaluating the stability of these lesions.
• Both CT and MRI are superior to radiographs in thediagnosis of OLT with MRI being more and more sensitive compared to CT.
• MR arthrography (MRA) may provide a betterdepiction of the talar chondral surface and may be depiction of the talar chondral surface and may be useful in differentianting a stage II versus a stage IIIlesion.
• MRI can also assess viability of the osteochondralfragment.
Necrotic fragments present low signal intensity on both T1- and T2-weighted images and do not enhanceafter gadolinium injection

• For a treatment decision, it is important to distinguish between stable and unstable lesions
• De Smet et al have described four MRI criteria thatindicate instability of the osteochondral lesions:
1. A high signal intensity line on T2-weighted images measuring at least 5 mm in length at the junction of the osteochondral fragment and the underlying bone
2. A discrete area of homogeneously high signal intensity on T2-weighted images (cyst-like lesion) deep to the on T2-weighted images (cyst-like lesion) deep to the osteochondral lesion, measuring at least 5 mm.
3. A focal defect in the articular cartilage measuring at least 5 mm
4. A high signal intensity line traversing the cartilage and subchondral bone plate on T2-weighted images, which represents an articular complete fracture

• On MRI, stage Ilesions appear as ill-defined subchondralareas of bone contusion with intact articular cartilage.


Stage III


• Ankle sprain is the most common sportsrelated injury, accounting for 16% to 21% of all sports-related injuries
• 85% involve the lateral collateral ligamentous complex.
• Syndesmosis sprains are the second most prevalent representing 10%
• And isolated medial sprains are third
• Sprains of the ankle ligaments have been classifiedinto three grades, according to severity:
LESIONSLIGAMENTOUS-V
into three grades, according to severity:
Grade I : stretching of the ligament with an intraligamentoustear associated with minimal swelling and tenderness, slight or no functional loss, and no laxity.
Grade II injury is a partial tear of the ligament with moderate pain, swelling, and tenderness. There is mild to moderate laxity.
Grade III injuries are complete ruptures of the ligament(s), severe swelling, hemorrhage, and tenderness, associated with gross ankle instability.

• Most Ligamentous injuries are diagnosed clinicallywithout the need for diagnostic imaging
• The role of imaging methods in diagnosis of anklesprains is controversial.
• Because acute ankle Ligamentous injuries are rarelytreated surgically, indications for the useof MRI may be limited to:of MRI may be limited to:
1. Acute ankle injuries that demonstrate instability
2. Stable acute injuries involving athletes
3. Patients with repeated injuries or instability in whom surgery is contemplated.

The MRI criteria for the diagnosis of acute ligament tears include:
• Primary signs include morphologic and signal intensity alterations of ligament:
1. Discontinuity, detachment, or thickening of the ligament
2. Increased intraligamentous signal intensity on t2-weighted images indicative of edema or hemorrhage.
• Secondary signs of acute ligament injury include • Secondary signs of acute ligament injury include extravasation of joint fluid into the adjacent soft tissues (soft tissue edema), joint effusion, and bone bruises.
In chronic tears :
• Secondary signs disappear
• The ligament can show thickening, thinning, elongation, or wavy contour.
MRA is more sensitive and accurate that MRI in the evaluation of ligaments tears.


The plantar calcaneonavicular ligament is sometimes termed the ‘‘spring ligament’’ :
• Most commonly, spring ligament injury and degeneration is seen with chronic posterior tibial tendon dysfunction.dysfunction.
• However, the spring ligament can be injured traumatically, and such injuries demonstrate a specific pattern of soft tissue and osseous edema.

• The spring ligament is comprised of three bundles and in effect serves as a hammock, to cradle the anteromedial head of the talus and preserve the midfoot arch.
• With traumatic disruption of one or more of the spring ligament bundles and incompetence of the plantar arch, the anterior, plantar aspect of the talus can anterior, plantar aspect of the talus can impact the dorsal, proximal aspect of the cuboid manifesting as an osteochondralimpaction contusion pattern in both locations


THE TIBIALIS ANTERIOR TENDON TEAR
• It is a structure that can be traumatically injured without magnetic resonance evidence of accompanying ligamentous or bony pathology.
• It can be presented as ‘‘anterior ankle mass.’’
• A ruptured tibialis anterior tendon almost invariably occurs at the level of the tibiotalar
LESIONSMISCELLENEOUS -VI
invariably occurs at the level of the tibiotalarjoint and demonstrates marked fusiformenlargement of the tendon itself, which can be mistaken for a soft tissue mass.
• Peritendinous fluid signal and a history of adorsoflexion trauma.
• The other extensor tendons are rarely injured in isolation

sagittal T1-weighted MR image shows some intact fibers coursing through the soft tissue abnormality that was seen previously on ultrasound. On axial oblique MR images (not shown), the soft tissue abnormality tissue abnormality corresponded to the anterior tibialistendon (ATT). Given the presence of intact tendon fibers, a partial tear of the ATT is the likely diagnosis
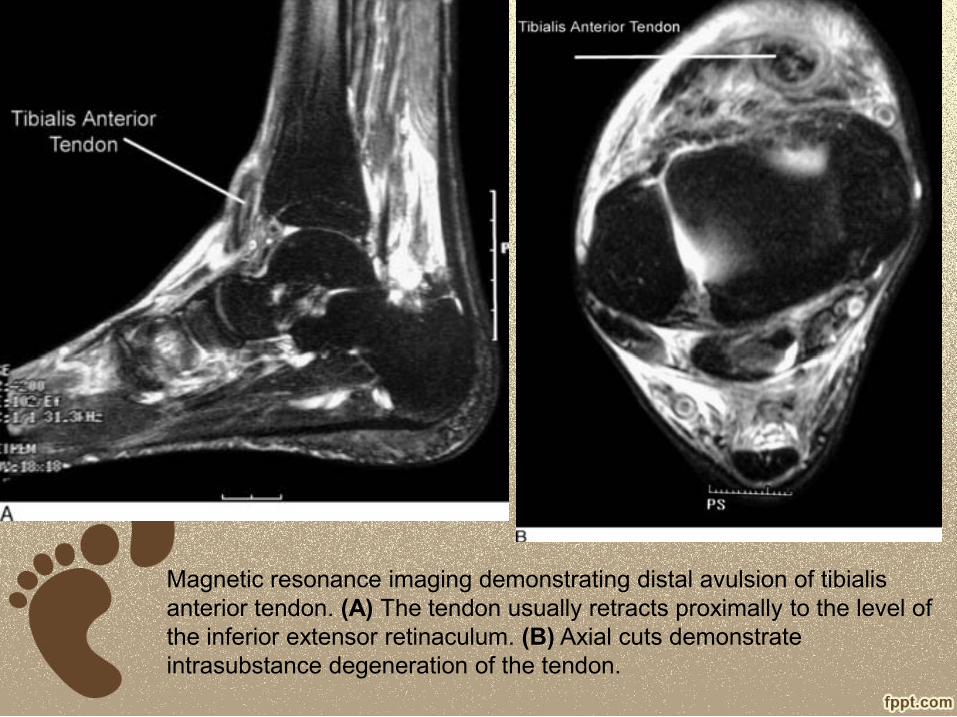
Magnetic resonance imaging demonstrating distal avulsion of tibialisanterior tendon. (A) The tendon usually retracts proximally to the level of the inferior extensor retinaculum. (B) Axial cuts demonstrate intrasubstance degeneration of the tendon.

INJURIES TO THE LISFRANC LIGAMENT• Lisfranc’s ligament have long been a primary concern for
both radiologists and foot and ankle surgeons.
• It extends from the lateral surface of medial cuneiform to the medial aspect of the base of the second metatarsal
• MRI is a useful tool for evaluating:
1. Lisfranc ligament injuries as it can be sensitive to malalignments
2. Osseous contusions about the ligament suggesting a significanttraumatrauma
3. Evidence for an early focal arthropathy suggesting lisfrancinstability.
• Evaluation of the first lisfranc’s ligament is a primary consideration for acquisition of at least one long axis sequence of the foot in a plane bisecting the second through fourth metatarsal heads on a short axis image.
• This plane section should allow for confirmation of an intact first lisfranc’s ligament on one image extending from the distal and lateral aspect of the medial cuneiform to the proximal andmedial aspect of the second metatarsal

Axial STIR image demonstrating a normal interosseous component of the Lisfranc ligament complex (arrow).
Axial T2 image demonstrating a normal plantar component of the Lisfranc ligament complex (arrowhead).

Avulsion fracture (arrow) of the Lisfranc ligament origin from the medial cuneiform. Ligament remains in continuity. Fluid fills the fracture site.

The axial image demonstrates mid substance disruption of the interosseouscomponent of the Lisfranc ligament complex (arrow).
The coronal image demonstrates mid substance disruption of the dorsal (arrowhead) and interosseous (arrow) components of the Lisfranc ligament complex.

Axial T2 image demonstrating tear of the interosseous component of the Lisfranc ligament complex(arrow) in a 15 year old following a jet ski accident. The patient also suffered disruption of the other Lisfranc components, other Lisfranc components, as well as comminuted fracture of the base of the second metatarsal.

Axial T2 with fat saturation image demonstrating thickening and increased signal of the interosseouscomponent (arrow) as well as multiple midfootcontusions (asterisks) three months following a soccer injury.

The sesamoids
• The sesamoids themselves can also be traumatically injured, even with intact plantar plate structures
• A sesamoid fracture can be difficult to distinguish from a congenitally or developmentally bipartitesesamoid with reactive bone marrow edema.
• Some clues to help discriminate between these two conditions include:conditions include:
1. Two osseous structures with borders thatappear to fit together like puzzle pieces, suggesting a fracture
2. Two osseous structures that in aggregate are significantly larger than the other sesamoid, suggesting a bipartite


Injury to the medial or tibial sesamoid only.

T1- and PD-weighted (with fat saturation) sequences show hypointense line (red arrows) within the lateral sesamoid bone associated with bone marrow edema. Slight adjacent joint effusion. Normal aspect of surrounfing soft tissues.


DIaBetIc foot

mIscellaneous

MORTON'S NEUROMAINTERDIGITAL NEUROMA)or(
• Morton's neuroma,, previously was believed to represent a neoplastic process of the nerve, but now is thought to be secondary to chronic nerve entrapment with subsequent perineural fibrosis, neural degeneration, and often adjacent intermetatarsal bursitis.
• The usual location is around the plantar digital nerve of • The usual location is around the plantar digital nerve of the second or third intermetatarsal space.
• Symptoms include pain, often electrical in nature, and throbbing in the affected web space, radiating to the toes.
• Young and middle-aged women most commonly are affected; this may be due to chronic trauma to the nerve from wearing high-heeled shoes.
• Morton's neuromas and intermetatarsal bursitis may be present on MRI in patients who are asymptomatic

Morton's neuroma: anatomy. Diagram of the forefoot in cross section. The plantar digital nerves are located deep to the transverse metatarsal ligament between metatarsal heads. Above the nerves are the intermetatarsal bursae.Entrapment of the plantar digital nerve may lead to perineuralfibrosis and neural degeneration (Morton's neuroma). Intermetatarsal bursitis is a common accompaniment

MRI FINDINGS• A teardrop-shaped soft tissue mass between the
metatarsal heads that projects inferiorly into the plantar subcutaneous fat.
• The signal intensity is intermediate on T1W and usually low signal intensity on T2W images because of the abundant fibrosis present. It enhances on the abundant fibrosis present. It enhances on gadolinium but this was found as unnecessary criteria.
• Fluid in the adjacent intermetatarsal bursa secondary to inflammation often is present as well .
• The intermetatarsal bursa runs in a vertical direction between (not beneath) metatarsal heads; bursitis shows low signal intensity on T1W images and high signal intensity on T2W images.


Morton's neuroma.A, T1W short-axis axial image of the
forefoot. A low signal, teardrop-shaped mass (arrow) from Morton's neuroma is seen below the metatarsal heads in the
third web space. B, STIR short-axis axial image of the forefoot. Morton's neuroma (arrow)
becomes high signal, but is more difficult to see than on the T1W image

Morton's neuroma. Morton's neuroma. A, T1W short-axis axial image of the
forefoot. There is a mass (arrow) in the third web space beneath the metatarsal
heads that is difficult to detect on this sequence.
B, T1W short-axis axial image of the forefoot with contrast enhancement and fat suppression. The mass enhances diffusely
(arrow) and is an easy diagnosis on this image.

Morton's neuroma.T1W short-axis axial image of the forefoot
with contrast enhancement and fat suppression. A teardrop-shaped mass
(arrow) is diagnostic of Morton's neuromain the third web space. The lining of the
inflamed intermetatarsal bursa also enhances (arrowhead) between the
metatarsal heads

Small soft-tissue noted replacing normal fat between the third and fourth metatarsals head which is isointense to muscle on T1-
weighted images and hyperintense on T2-weighted
STIR images.

Ovoid, T1- and STIR hypointensemass in the 3rd intermetatarsalspace with some rim enhancement at the dorsal border.

This case shows the typical findings of Morton neuroma and bursitis between the metatarsal heads. Bursitis is bright on T2 with rim enhancement whereas the "neuroma" (actually perineuralfibrosis) is relatively low signal on T2 and shows patchy enhancement.

TARSAL COALITION
• Describes complete or partial union between two or more bones in the mid foot and hindfoot.
• It is thought to represent either:
1. A congenital failure of proper segmentation of the tarsal bones
2. Or it can be acquired secondary to rheumatoid 2. Or it can be acquired secondary to rheumatoid arthritis or trauma.
• Males are affected approximately four times more frequently than females, and it is bilateral in about 50% of individuals.

The two most common types are:1.Calcaneonavicular : which often is asymptomatic and diagnosed on medial oblique foot films rather than MRI.2.Talocalcaneal, which usually occurs between the sustentaculum tali process of the calcaneus and the adjacent talus at the middle facet of the subtalar joint.Symptoms generally occur because of limited motion in the subtalar joint, which places increased stresses in the subtalar joint, which places increased stresses elsewhere in the tarsus, leading to spasm of the peronealsand extensors, with an associated flatfoot deformity as well as nerve entrapments. Coalitions may be Osseous (synostosis) , fibrous (syndesmosis) , cartilaginous (synchondrosis), or a combination.

• Calcaneonavicular : 1. usually involves the anterior process of the
calcaneus
2. Best seen on oblique views
3. The anteater nose sign may sometimes be seen

Talocalcaneal: 1. Usually involves the middle facet 2. Best seen on the lateral view3. C-sign: A continuous C-shaped arc is seen on a lateral ankle radiograph which
is formed by the medial outline of the talar dome and posteroinferior aspect of the sustentaculum tali.
4. Talar beak sign a superior projection of the distal aspect of the talus, due to impaired subtalar movement


1. Show the presence of the coalition and how extensive it is .
2. Assess surrounding structures for impingement by the hypertrophic bony mass, such as displacement of the tibialisposterior and flexor hallucis longus tendons in the tarsal tunnel.
3. Secondary degenerative joint disease in the posterior subtalarjoint is common and can be documented with MRI.
4. Shows narrowing and irregularity, or osseous fusion, of the middle facet of the subtalar joint. The angle of this joint is often abnormal, with a coalition being directed inferiorly (see below).
USES OF MRI IN COALITION
5. May help distinguish between:
A. Osseous coalition: continuity of marrow signal
B. Fibrous coalition
- Proximity of surfaces with loss of fat plane
- Low signal on T1/T2 weighted sequences
C. Cartilaginous coalition
- Proximity of surfaces with loss of fat plane
- Intermediate T2/STIR +/- fluid signal

calcaneonavicular

Talar Beak Sign Is Seen In Talocalceneal Coalition

Middle facet of the subtalar joint:
normal. A The joint between the
sustentaculum tali and talus is straight
and uniform, without features of coalition. and uniform, without features of coalition.
B, T2*W coronal image of the hindfoot.
Uniform high signal cartilage is present in
the middle facet of the subtalar joint
(between arrows).
Tarsal coalition: osseous. T1W coronal image of the hindfoot. There is complete osseous ankylosis with no joint in the expected location (arrow) for the middle facet. This hypertrophic bone mass placed pressure on the adjacent posterior tibial nerve; the patient presented with
tarsal tunnel syndrome.

Tarsal coalition: fibrocartilaginous.A, T1W coronal image of the hindfoot. The joint between the
sustentaculum tali and the talus is narrowed and irregular (between arrows).
B, STIR sagittal image of the hindfoot. The joint of the middle facet is irregular and narrowed from fibrocartilaginous coalition (arrows).
There is high signal bone marrow edema on both sides of the abnormal joint.

IN THE FOOTOSTEONECROSIS
1. Navicular “Köhler disease” in children “Mueller Weiss” in adults.
2. Metatarsal heads, especially second and third “Freiberg disease” while Iselin disease is a benign and self-limiting condition, defined as apophysitis of base of condition, defined as apophysitis of base of 5th metatarsal.
3. Talar dome (talar neck fracture)
4. Lateral hallux sesamoid
5. Anywhere else

• The MRI appearance of osteonecrosis in the foot and ankle is identical to other bones in the skeleton: serpiginous low signal intensity lines creating a geographic pattern, or diffuse low signal on T1W images that may or may not become higher signal on T2W images.
• The differential diagnosis for the marrow changes in osteonecrosis, other than the changes in osteonecrosis, other than the pathognomonic serpiginous lines, include occult fractures, abnormal increased stresses, osteomyelitis, and regional migratory osteoporosis with bone marrow edema.


MRI findings:navicular bone and head of talus appears hyperintense on STIR imagesperipheral enhancement of navicular bone and enhancing areas at head of talus on T1C+the enhanced areas are confirmed and better visualised on the SUBTRACTED images

MR images reveal oedema in the shaft and head of 4th metatarsal - consistent with Freiberg infarction

• caused by various fungi (e.g. madurellamycetomi) or actinomycetes (e.g. nocardiabrasiliensis) which usually affects the feet.
• Initially a nodule, or abscess over months to years progresses to a chronic infection with the formation of granulomatous nodules drained by
)MADUROMYCOSISMADURA FOOT (
sinuses connecting with the skin. Superimposed bacterial infection may result in larger open ulcers.
• These changes eventually lead to deformity. The changes on imaging are remarkable with the bones being destroyed and remodeled.

MRI
• Some publications have stated a "dot in a circle sign" as a characteristic MRI feature for this condition (this feature has also been described on ultrasound).


ACCESSORY MUSCLES• Anomalous or accessory muscles in the foot or ankle are
common.
• The accessory soleus and peroneus quartus muscles are the most common accessory muscles encountered in this region.
• The MRI appearance is diagnostic because the signal and appearance are identical to other muscle on all pulse sequences.
1. The accessory soleus muscle is an anatomic normal variant 1. The accessory soleus muscle is an anatomic normal variant of the calf musculature that manifests as a mass on the medial aspect of the ankle, may be the source of pain secondary to ischemia that occurs during exercise as a form of a localized compartment syndrome, or may compress the posterior tibialnerve in the tarsal tunnel, resulting in tarsal tunnel syndrome.
• On MRI, it is located medial to the Achilles tendon and has a tendon of its own that inserts either into the Achilles tendon or to the calcaneus .


2. The peroneus quartus accessory muscle also lies in the posterior ankle, just anterior and lateral to the Achilles tendon
• Similar to the accessory soleus muscle, the peroneusquartus may manifest as a mass or be an incidental finding on MRI.
• Peroneus quartus accessory muscles occur in 13% to 25% of individuals.
• They often are asymptomatic, but have been considered responsible for lateral ankle pain and considered responsible for lateral ankle pain and ankle joint instability.
• The accessory muscle may predispose to subluxation of the peroneal tendons because of its mass effect within the confined space created by the peroneal retinaculum and subsequent stretching and laxity of the retinaculum.

Accessory peroneus quartus. A, T1W axial image of the ankle. There are three tendons posterior to the lateral malleolus. The peroneus longus and brevis are the two most lateral tendons. The most posteromedial tendon (arrowhead) is surrounded by muscle, and this is the peroneus quartus accessory muscle and tendon. The peroneal retinaculum is stretched because of the increased volume in the confined space, and this may predispose to peroneus brevis splits. B, T1W axial image of the ankle (different patient than in A). Three tendons are posterior to the lateral malleolus: peroneus longus (solid arrow), peroneus brevis(arrowhead), and peroneus quartus (open arrow), which is the most medial tendon. The peroneus quartus simulates the appearance of a split peroneus brevis tendon. Each tendon has its own muscle belly on more proximal cuts, allowing differentiation
