food passage and intestinal nutrient absorption in ... · food passage and intestinal nutrient...
TRANSCRIPT

THE AUK A QUARTERLY JOURNAL OF
ORNITHOLOGY
VOL. 103 JULY 1986 NO. 3
FOOD PASSAGE AND INTESTINAL NUTRIENT
ABSORPTION IN HUMMINGBIRDS
WILLIAM H. K•RASOV, 1'3 DUONG PHAN, • JARED M. DIAMOND, • AND F. LYNN CARPENTER 2
•Physiology Department, University of California Medical School, Los Angeles, California 90024 USA, and =Zoology Department, Oregon State University, Corvallis, Oregon 97331-2914 USA
ABSTRACT.--We studied adaptations of digestive physiology that permit Rufous (Selasphorus rufus) and Anna's hummingbirds (Calypte anna) to absorb sugar-water meals rapidly and efficiently. As measured with soluble markers, transit times (<15 min) and mean retention times (ca. 48 min) of meals in the hummingbird digestive tract are brief compared with values for most other vertebrates. Glucose is extracted with an efficiency of 97%. We describe a new method, employing double isotope dilution, for measuring crop-emptying kinetics. Based on this method, the crop empties half of a meal in ca. 4 min and all of the meal in 15-20 min. Rufous and Anna's hummingbirds may be energy maximizers limited by crop emptying times, rather than foraging-time minimizers. This would explain why humming- birds spend a majority of each hour sitting rather than feeding.
The intestine's passive permeability to glucose is the lowest of any vertebrate studied to date. This may be an adaptation to prevent solute loss from the blood in the face of high fluid transit rates through the intestine. Active transport accounts for essentially all intestinal glucose absorption. Compared with intestines of other vertebrates, the glucose absorption sites of hummingbird intestines have normal binding constants but are present at extremely high densities. Comparisons of hummingbirds, chickens, and shrikes suggest that intestinal absorption rates for amino acids are independent of trophic habits in birds as in other vertebrate classes, but that sugar absorption decreases in the sequence herbivore > omni- vote > carnivore. Received 5 July 1985, accepted 6 January 1986.
HUMMINGBIRDS include the smallest endo-
thermic vertebrates. Because basal metabolic
rates normalized to body mass increase with decreasing mass among endotherms, hum- mingbirds are among the animals with the highest known mass-specific basal metabolic rates. They also have exceptionally high met- abolic rates during activity, as they forage by energetically costly hovering. To fuel these high metabolic rates, they obtain most of their cal- ories from nectar high in easily metabolized
3 Present address: Department of Wildlife Ecology, University of Wisconsin, Madison, Wisconsin 53706 USA,
energy sources, mainly mono- and disac- charides, which are extracted rapidly and effi- ciently (Hainsworth 1974, 1981; Hainsworth and Wolf 1972, 1976).
A more complete understanding of the be- havior, evolution, and ecology of humming- birds will require more information about their digestive physiology, which has been little studied. In the present paper we address three problems in hummingbird digestive physiol- ogy. First, we measured the rapidity and pat- tern of crop emptying into the stomach. Crop emptying rates are an important variable in models of optimal meal size (DeBenedictis et al. 1978) and other aspects of foraging ecology (Hixon et al. 1983). For example, a key question
453 The Auk 103: 453-464. July 1986
454 KARA$OV ET AL. [Auk, Vol. 103
in behavioral ecology concerns whether an an- imal is an energy maximizer or a foraging-time minimizer (Hixon 1982). For time minimizers, food intake beyond a certain level does not increase potential reproductive success; for en- ergy maximizers it does. Energy maximizers spend as much time foraging as possible, whereas time minimizers are selected to maxi-
mize nonforaging time and therefore to mini- mize foraging time. The fact that humming- birds typically spend 75% of each waking hour perched suggests that they are time minimiz- ers, but they actually might be energy maxi- mizers if this sitting time is required for crop emptying, i.e. food "handling" (Hixon 1982). Measurements of food intake as a function of
duration of food deprivation have yielded in- direct estimates of crop emptying time (Hains- worth and Wolf 1972). We present a new, direct method for measuring crop-emptying kinetics in live birds.
Second, we examined the digestive adapta- tions that enable hummingbird intestine to ex- tract sugar from nectar meals rapidly and effi- ciently. In our studies of intestinal nutrient absorption in herbivorous, omnivorous, and carnivorous vertebrate species, we found that intestinal capacity to absorb sugar increases with the carbohydrate content of the species' natural diet (Karasov et al. 1985a). Hence, we tested whether hummingbirds fit this pattern and define the high-carbohydrate extreme of it. To our knowledge, we here provide the first measurements of intestinal nutrient absorption in a nectarivore, avian or otherwise. We find
that hummingbirds have the highest intestinal capacity for sugar absorption of any animal studied to date.
Finally, intestines of other studied verte- brates absorb sugar by an energy-consuming process (termed active transport), whose rate saturates at low sugar concentrations (Karasov and Diamond 1983b, Karasov et al. 1985a). En- ergy expenditure is necessary for absorption because sugar concentrations in the intestinal lumen are often below those in the animal's
blood. Hummingbird diets are unusual because they contain sugar at concentrations far above blood levels. As a result, the question arises whether sugar absorption by hummingbird in- testine saturates only at high concentrations, or whether hummingbird intestine could absorb sugar without any energy expenditure (by pas-
sive diffusion of sugar down a concentration gradient from intestinal lumen to blood).
A brief summary of some of these results has been published (Diamond et al. 1986).
METHODS
We captured 13 Rufous Hummingbirds (Selaspho- rus rufus, weighing ca. 3 g) in mist nets in the Sierra Nevada east of Bishop, California in August 1984. We captured 4 Anna's Hummingbirds (Calypte anna, ca. 5 g) in mist nets in October and November 1981 and July 1984 in the Santa Anna Mountains east of Irvine, California, where they are a resident species. Birds were kept in the laboratory in flight cages (ca. 0.5 m s ) and were provided with sugar water (200 g sucrose/ kg = 0.585 molal) ad hl•itum and wingless fruit flies. All individuals maintained or gained weight during their 11 days or less in captivity. We used birds of both sexes in all experiments. We performed the measurements of food passage rate, extraction effi- ciency, and crop emptying time at room temperature, 24 + IøC.
Food passage rate.--We measured the kinetics of food passage from mouth to cloaca with two soluble mark- ers that do not pass in significant quantities from the intestinal lumen across the intestinal wall into the
bloodstream in the vertebrate species we have stud- ied (Karasov and Diamond 1983a). For preliminary studies we used Schilling red food dyes FDA nos. 3 and 40, whose presence or absence in excreta we not- ed qualitatively by eye. For quantitative measure- ments we used polyethylene glycol (PEG, molecular weight 4,000), which was radioactively labeled with •H. Activity (counts per minute, cpm) was deter- mined by liquid scintillation counting (see Karasov and Diamond 1983a for details).
A Rufous Hummingbird was placed over parafilm in an uncovered, hardware-cloth cage (ca. 15 cmx 15 cm x 6 cm). Within the first minute birds settled down and sat quietly in the cage for the duration of the experiment. While they fasted for 30 min, drop- lets of excreta beneath them were collected with 100-
/•1 capillary tubes for measurement of background color or radioactivity. We then provided birds with dyed sugar water ad libitum, or with 100/•1 of sugar water labeled with 3H PEG at 50 microcuries/cc. The
birds drank readily from capillary tubes and eye droppers whose tips were painted red. After the birds drank the marker solution, they remained in the cage for 4 or 9 h, during which time we fed them undyed, unlabeled sugar water at intervals of 15-30 min and collected excreta for dye or PEG determinations. The 4- and 9-h experiments began at 1230 and 0845, re- spectively. We plotted cumulative marker excretion against time (Fig. 1) and calculated from this graph several parameters describing passage.
We could not collect all excreta because some re-

July 1986] Nutrient Absorption in Hummingbirds 455
mained on cage wiring and the birds' feathers, and because birds sometimes ejected excreta a consider- able distance horizontally. We recovered about half the excreta: our calculated recovery of the PEG mark- er was 54 + 7% (mean + SE, n = 4), and our collec- tions for four Rufous Hummingbirds yielded an ex- creta production rate of 124 + 8/•l/h, which over 12 h is 55% of the expected output for this species (2,700 /•l/day; Calder and Hiebert 1983). We calculated PEG excretion at each sampling as (cpm//•l excreta) x (/•1 excreta collected) and expressed PEG excretion in each sample as a percentage of the total excreted PEG col- lected over the duration of the experiment.
Extraction efficiency.--In some of the experiments to measure passage rates, we also measured extraction efficiency (otherwise known as digestibility) for glu- cose in sugar water. We included •4C(U) (U = uni- formly labeled) D-glucose at 1.3 microcuries/cc in the 3H PEG-labeled sugar water, and counted excreta for •H and •4C using double-isotope counting proce- dures (see Karasov and Diamond 1983a for details). Extraction efficiency was then calculated by the inert- indicator ratio method (Kotb and Luckey 1972) as
I00- 100[(cpmpzG/cpmg• ..... )fooa x (cpmg• .... /cpm•EG) ...... ]. (i)
This expression yields an extraction efficiency of 100% if (cpmg•u½o•) ...... is zero because all glucose has been extracted, and an efficiency of 0% if the ratio cpm•_ ½•/cpm•a has the same value in excreta as in food because all glucose as well as PEG remained unex- tracted.
Crop emptying time.--We used a double-isotope di- lution technique to measure the volume of crop con- tents at various times after feeding birds I00-/•1 meals of sugar water. We chose I00/•1 because the mean meal size of Rufous Hummingbirds in the field mea- sured using electronic perch balances is ca. 70 (Carpenter and Hixon 1984).
Birds in uncovered hardware-cloth cages fasted up to 2 h. We then fed them I00 •1 of sugar water la- beled with •C PEG, which they generally drank in 10-30 s. They then sat quietly in the dark in cloth- covered cages for 2, 5, I0, 15, or 20 min, after which we fed them I0 or I00/•1 of sugar water labeled with 500 or 50 microcuries/cc of •H PEG, respectively. The I0-•1 meal was given after 2 or 5 min because the crop was still sufficiently full then to permit subse- quent sampling, but the larger I00-/•1 meal was given at I0, 15, or 20 min because the crop otherwise would have contained too little remaining fluid to permit sampling. When an equilibration period (see below) had passed after the •H PEG feeding, we removed a liquid sample from the crop with a I0-/•1 capillary tube introduced orally. The sample was counted for •H and •C PEG activity.
The principle underlying this method is that di-
lution of the •C PEG fed at time t = 0 results from
any fluid already in the crop at t = 0, while dilution of SH PEG fed at 2, 5, I0, 15, or 20 min results from fluid remaining in the crop at those times. If the added isotope becomes uniformly distributed throughout the crop contents (see below), and if crop fluid thereafter passes in bulk into the stomach, PEG activity per mi- croliter of crop contents would remain constant through time such that
(Cs/Es) = Ci](Vo •- El),
where V, = volume of crop contents analyzed, C, = cpm in that sample volume, V• = volume of marker solution placed into the crop, Vo = volume of crop contents just before addition of that marker solution, and C, = cpm in that volume V• of marker solution. Thus, the volume of crop contents Vo may be calcu- lated from the dilution of marker as
V o = (VsCi/Cs) - V i. (2)
We performed preliminary experiments to deter- mine an appropriate equilibration time for PEG marker in the crop. Birds that already had fluid in their crops were allowed to drink a volume of marker solution, and several consecutive crop samples were taken and counted. A sample was always taken at 5 min after feeding the marker, so that cpm at other times could be expressed as relative activity: i.e. as cpm per •1 at t = x min after feeding the marker, divided by cpm per/•1 at 5 min. In three Rufous and one Anna's Hummingbird, relative activities in sam- ples taken 1 min after feeding the marker were quite variable and averaged considerably above 1.0 (range, 0.93-2.69; mean + SE, 1.61 + 0.42; n = 4). The vari- ability and high mean indicated that I min was too brief for equilibration: introduced isotope had not yet mixed with pools of poorly accessible crop fluid that did equilibrate by 5 min. Relative activities at 2 min were less variable but still significantly greater than 1.0 (1.19 + 0.02, n = 3; P < 0.001, two-tailed t-test). However, relative activities at 3 min (0.91 + 0.08, n = 5), I0 min (0.96 + 0.04, n = 12), and 15 min (0.97 + 0.01, n = 3) did not differ significantly from 1.0 (P > 0.2, 0.2, and 0.05, respectively). Thus, equil- ibration was essentially complete in 3 min. To be conservative, we chose a 5-min equilibration period between feeding a marker solution and taking a sam- ple of crop fluid.
Intestinal absorption of glucose and amino acid.-- We used a modification of the simple in vitro procedure that we developed for studying intestinal nutrient absorption in other species of birds and nonavian vertebrates (Karasov and Diamond 1983a). Briefly, a cylindrical sleeve of intestine is excised, everted, mounted on a solid glass rod, and incubated in a solution whose ionic composition mimics that of plasma. A radioactively labeled solute is added to the

456 KARASOV ET AL. [Auk, Vol. 103
incubation solution, and after several minutes the in-
testinal sleeve is removed for counting. Thus, the method determines uptake of nutrient into the epi- thelial cells across the cell surface facing the intestin- al lumen in the animal. The whole absorptive process in vivo also involves subsequent nutrient transfer from the epithelial cells to the bloodstream, but the former step may be the rate-limiting one and the main site of physiological regulation. Uptake rates measured in vitro by this technique are of the same order of magnitude as those measured in vivo for the same animal species (Karasov pets. obs.) and display similar physiological regulatory phenomena (Kara- sov and Diamond 1983b).
Further details of the method are given by Karasov and Diamond (1983a). We note only the specific de- tails and modifications relevant to hummingbirds. Birds were anesthetized with Metafane, and the in-
testine was excised and placed in an avian Ringer's solution at 5øC. Solution composition in millimoles/1 was 161 NaC1, 4.7 KC1, 2.5 CaC12, 1.2 KH2PO•, 1.2 MgSO4, and 20 NaHCO3. The solution was oxygen- ated with 95% O2/5%CO2 to yield pH 7.3-7.4 at 37øC; osmolarity was 350 mOsM. Because we were unable to evert hummingbird intestine, it was instead slit open lengthwise, and a longitudinal strip 0.6 cm long was tied to a glass rod 3 mm in diameter, with the' apical (= lumen-facing) surface of the intestine fac- ing outward. Tissues were incubated for 1-4 min at 37øC in Ringer's solution with radioactively labeled nutrient stirred at 1,200 rpm. We measured stereo- specific active transport of D-glucose by double-label techniques employing •4C or 1-3Iff D-glucose plus tracer concentrations of L-glucose (1-3H or 1-•4C, re- spectively) to correct simultaneously for D-glucose in adherent fluid and D-glucose taken up passively (Karasov and Diamond 1983a). Amino acid absorp- tion was measured as uptake of •4C(U) L-proline, us- ing 1,2-•H PEG to correct for L-proline in adherent fluid. Glucose passive permeation was measured as •4C L-glucose uptake, using aH PEG to correct for L-glucose in adherent fluid.
Statistics.--Results are given as means + SE (n = sample size). Student's t-test was used for tests of significance at the P < 0.05 level, while analysis of covariance (ANCOVA; Dunn and Clark 1974) was used to test for significance of correlation of linear regressions.
RESULTS
Passage rate.--We studied passage rates crudely in 4 Rufous Hummingbirds using red dye, and quantitatively in 8 using •H PEG and •4C D-glucose. Passage rate can be characterized by the time for first appearance of ingested matter in excreta, time for last detectable ap-
pearance, and the mean residence time of in- gested matter.
Excreta of the 4 birds fed red dye appeared clear to the eye when collected after 6, 8, 10, and 13 min but were definitely colored at 21 _+ 4 min (n = 4). In the 8 birds fed radioactive solutions, 3H PEG and •4C D-glucose activities were both measurable in the first samples of excreta, which were taken at 15 min in all 8
birds. The 15-min sample already accounted for 25% of the total cumulative PEG excretion. Thus,
"transit time," the time between feeding and first appearance of a marker in the excreta, is somewhat less than 15 min.
Of the 8 birds fed •H PEG and •C D-glucose, we collected excreta of 4 for 9 h and found that
3H PEG activity per unit volume peaked in the first hour and declined to near background (<3 times background activity) by 8 h. •C D-glu- cose activity also peaked in the first hour and declined to near background by 3 h. Of the total PEG activity excreted by those 4 birds, 97 _+ 1% was excreted in the first 4 h. Hence, we terminated collections in the other 4 birds at 4
h. PEG excretion rates and cumulative excre-
tions for all 8 birds are depicted in Fig. 1. We used Fig. 1 to calculate a mean retention time (see Discussion).
Crop emptying time.--We performed prelimi- nary experiments to determine how long the birds should be fasted to ensure empty crops before feeding the 100-#1 test meal. Using Eq. 2 to calculate crop contents, we found that cal- culated volumes were essentially the same for 30-90 min of fasting: 25 _+ 5 #l (n = 3) after 30 min, 27 + 1 #1 (n = 6) after 60, and 22 + 4 #1 (n = 3) after 90. Whether this calculated resi- due of ca. 25 #1 represents a small volume of fluid always present in the crop or an artifact due to either marker dilution by fluid secretion into the crop or some marker loss into the stomach is unclear. We therefore refer to the
measured volume of crop contents as "appar- ent" volume. Because by 30 min the crop was as "empty" as it could be, we conservatively chose a 1-h fasting period to empty the crop.
To determine how fast and in what pattern the crop empties, we fasted Rufous Humming- birds 1 h, allowed them to drink 100 #1 of •C PEG-labeled sugar water, and measured appar- ent crop content volume with •H PEG-labeled sugar water 2, 5, 10, 15, or 20 min later. As a criterion for determining at what point crops

July 1986] Nutrient Absorption in Hummingbirds 457
tag
40-
• 80
õ
x 60
tag
• ao
• 20
O
0 2 4 6 8 I0
lime (h)
Fig. 1. Excretion of the liquid market PEG by Ru- fous Hummingbirds as a function of time since the marker was fed. Top: percentage of total excreted PEG excreted each 15 or 30 rain; bottom: cumulative ex-
cretion. The results (means _+ SE) of two experiments are shown, one carried out for 9 h (open circles), the other for 4 h (closed circles). Four different birds were used in each experiment. Note that excretion rates peak, and cumulative excretion reaches 50%, in about 0.5 h.
became "empty" after feeding the test meal, we compared (t-test) the calculated apparent vol- umes at each time point with that of birds fast- ed 60-90 min (26 _+ 1 •1, n = 12). All measure- ments of apparent volumes at 2, 5, or 10 min were much greater than 26 •1 (42-110 •1; Fig. 2). The mean value at 15 min (51 _+ 11 •1, n = 4) was still well above the "empty" value of 26 •1, but one of the four individual values (24 •1) was in the "empty" range. At 20 min the mean value (33 _+ 12 •1, n = 5) did not differ signifi-
0 5 I0 15 20
elopsed time since meol (m•n)
Fig. 2. Apparent volume of crop contents in fast- ed Rufous Hummingbirds as a function of elapsed time since they drank 100 •1 of a sucrose solution. Each symbol represents one bird. A crop with an ap- parent volume of 26 •1 is consi,dered empty (see text). Note that the crop is emptied within about 20 min.
cantly from that of fasted birds, and the mean of the lowest four values was 21 ñ 2 •1. Thus, the 100-•1 test meal was cleared from the crop in >15 and <20 min.
Whether the crop empties in a linear or ex- ponential fashion affects model predictions of optimal meal size and foraging-bout frequency (DeBenedictis et al. 1978), such as those that will be presented in paragraph 3 of our Dis- cussion. Hence, we analyzed the time course of crop emptying for 7 Rufous Hummingbirds for which the apparent volume of crop contents had been measured at three of four times on
different days (Fig. 2). In other monogastric an- imals (i.e. ones with a single simple stomach, unlike ruminants), such data are almost always described by a negative exponential (Sibley 1983), and this also seems to be true for our hummingbirds. To test our data against an ex- ponential model, we subtracted 26 •! from each value so that crop content volume at t = 0 was 100 •1 and an "empty" crop contained 0 •! rath- er than 26 •1. The data were then fitted by ANCOVA to the equation
in Vt = in 100 - kt, (3)
where Vt is the crop content volume at time t and k is the crop emptying rate constant. The resultant XY correlation was significant (P < 0.005), with a pooled k value of 0.17/min. The

458 KARASOV ET AL. [Auk, Vol. 103
2.5
2'01
1,5 - (4• 0.5- o.o o
0oglu½ose ½oncenfrofion (raM)
Fiõ. 3. D-•lucose active •a•s•o•t A•a's •ummi•i•ds, as a fu•ctio• of •at• D-•lu- cose concentration. Vertical •a•s •i•e S•, •it• t•e •um•e• of •alues i• •a•e•t•eses. •e cu•e is t•e least-s•ua•es •o•li•ea• Qt of t•e data to t•e •ic•ae- lis-•e•te• e•uatio•. Values a•e •o•malized to t•e •luco• t•a•s•o•t measured at t•e •e a•imal. Results a•e •a•d o• fou• •i•ds. Note
t•at t•a•s•o• •ates a•e •i•tually •tu•ated at 25-50 m• a•d a•e •alf •tu•ated at • m•.
data also yielded a significant fit to a negative straight line (Vt = 100 - bt; P < 0.005, the com- mon slope b = 4.5/min), but the correlation coefficient for the negative exponential fit ex- ceeded that of the linear fit in 5 of the 7 birds.
The rate constants (k and b values) mean that the time for emptying half of a 100-/•1 meal from the crop is 4.1 min by the exponential model, 11.0 min by the linear model.
Passive glucose permeability.--L-glucose and D-glucose, being optical isomers, are expected to have identical rates of passive permeation across the intestine, but only D-glucose is sub- ject to active transport in vertebrate intestine. Hence, L-glucose absorption may be taken as a measure of passive glucose permeability. We measured L-glucose absorption in five tissues from the proximal intestine of four Rufous Hummingbirds with •4C L-glucose as a probe and 3H PEG as an adherent fluid marker. All
five tissues yielded zero uptake, meaning that glucose has negligible passive permeability and its absorption is mainly by an active process.
Dependence of D-glucose active transport on con- centration.--Like most enzymatic processes, ac- tive absorption of glucose by vertebrate intes- tine is dependent on concentration and exhibits saturable kinetics. That is, the glucose transport rate rises sublinearly with increasing glucose
concentration and levels off at a plateau value. In the usual representation of saturable kinet- ics by the Michaelis-Menten equation, the pa- rameters that describe this relationship are the maximal transport rate (abbreviated V•) and the binding constant K• (the concentration at which absorption equals V•/2). Because hum- mingbirds consume nectar with very high sug- ar concentrations (200-2,000 mM; Hainsworth and Wolf 1972, Hainsworth 1981), we won- dered whether hummingbird intestine might have an exceptionally high K• value compared with other vertebrates we have studied (gen- erally <5 mM; see Discussion). Hence, we de- termined the concentration dependence of D-glucose active transport.
We incubated adjacent tissues from the prox- imal intestine of Anna's Hummingbirds for 4 min in 1-3H D-glucose, plus tracer 1-•C L-glu- cose to correct for passive transport and glu- cose in adherent fluid (Karasov and Diamond 1983a). For each bird we incubated four tissues at a different concentration (0.5, 5, 25, or 50 mM) and expressed transport at 0.5, 25, and 50 mM relative to transport in the same animal at 5 mM. These procedures minimize the effects of interindividual variation in transport and of variation in transport with position along the intestine (see below).
In Anna's Hummingbirds, as in other terres- trial vertebrates, D-glucose transport increased with concentration to reach a plateau at 25-50 mM (Fig. 3). We fitted the data to the Michae- lis-Menten equation by nonlinear curve fitting and calculated that mean transport at 25 mM was 85% and at 50 mM was 97% of the derived
maximal transport rate (V•), and that the ap- parent K• averaged 4.3 + 1.1 mM (n = 4 birds). The K• value is considered apparent (K•*) be- cause it is uncorrected for effects of unstirred
layers (see Karasov and Diamond 1983a, Dia- mond and Karasov 1984, Barry and Diamond 1984). Our use of 1-3H D-glucose and 4-min incubation periods in these experiments may have led to some underestimation of transport rates and, therefore, of V•x and K•* (see Kar- asov and Diamond 1983a for discussion), but would not change our qualitative conclusion that K•* and the form of the relationship be- tween transport and glucose concentration for Anna's Hummingbird are not at all exceptional for a terrestrial vertebrate.
Transport as a function of position along the in-
July 1986] Nutrient Absorption in Hummingbirds 459
800
600 •
•; 400- •E
• • 200- œ
g o
80
2• 6O
E
(4)
55••(5 ) • 0 i 2 5 4 5
distance from pylorus (cm)
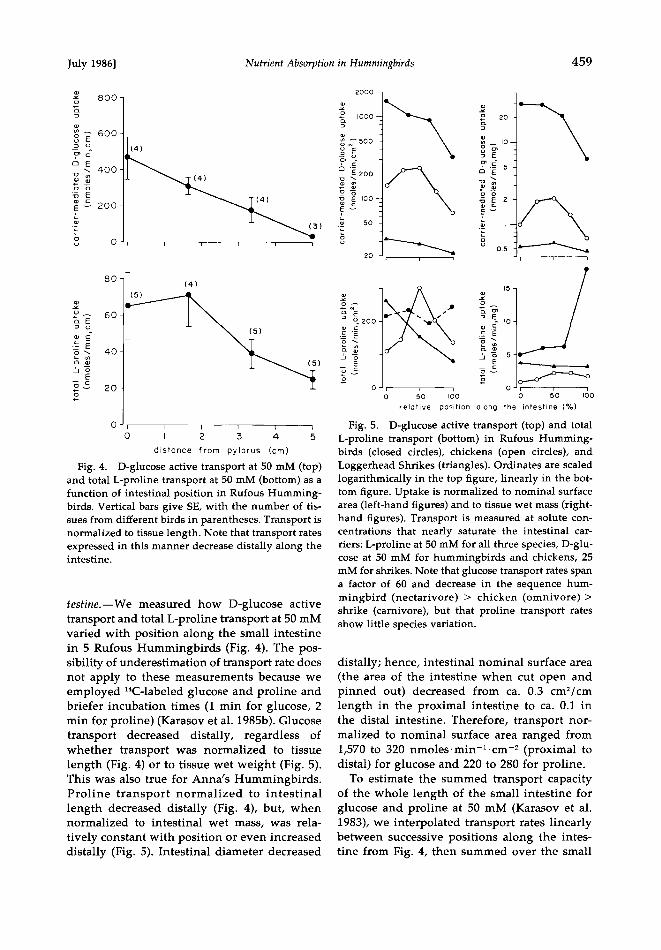
Fig. 4. D-glucose active transport at 50 mM (top) and total L-proline transport at 50 mM (bottom) as a function of intestinal position in Rufous Humming- birds. Vertical bars give SE, with the number of tis- sues from different birds in parentheses. Transport is normalized to tissue length. Note that transport rates expressed in this manner decrease distally along the intestine.
testine.--We measured how D-glucose active transport and total L-proline transport at 50 mM varied with position along the small intestine in 5 Rufous Hummingbirds (Fig. 4). The pos- sibility of underestimation of transport rate does not apply to these measurements because we employed •4C-labeled glucose and proline and briefer incubation times (1 min for glucose, 2 min for proline) (Karasov et al. 1985b). Glucose transport decreased distally, regardless of whether transport was normalized to tissue length (Fig. 4) or to tissue wet weight (Fig. 5). This was also true for Anna's Hummingbirds. Proline transport normalized to intestinal length decreased distally (Fig. 4), but, when normalized to intestinal wet mass, was rela-
tively constant with position or even increased distally (Fig. 5). Intestinal diameter decreased
Fig. 5.
0.5
relative position along the intestine (%)
D-glucose active transport (top) and total L-proline transport (bottom) in Rufous Humming- birds (closed circles), chickens (open circles), and Loggerhead Shrikes (triangles). Ordinates are scaled logarithmically in the top figure, linearly in the bot- tom figure. Uptake is normalized to nominal surface area (left-hand figures) and to tissue wet mass (right- hand figures). Transport is measured at solute con- centrations that nearly saturate the intestinal car- riers: L-proline at 50 mM for all three species, D-glu- cose at 50 mM for hummingbirds and chickens, 25 mM for shrikes. Note that glucose transport rates span a factor of 60 and decrease in the sequence hum- mingbird (nectarivore) > chicken (omnivore) > shrike (carnivore), but that proline transport rates show little species variation.
distally; hence, intestinal nominal surface area (the area of the intestine when cut open and pinned out) decreased from ca. 0.3 cm•/cm length in the proximal intestine to ca. 0.1 in the distal intestine. Therefore, transport nor- malized to nominal surface area ranged from 1,570 to 320 nmoles.min-•.cm -• (proximal to distal) for glucose and 220 to 280 for proline.
To estimate the summed transport capacity of the whole length of the small intestine for glucose and proline at 50 mM (Karasov et al. 1983), we interpolated transport rates linearly between successive positions along the intes- tine from Fig. 4, then summed over the small

460 KARASOV ET AL. [Auk, Vol. 103
intestine's length (5.0 + 0.1 cm in 9 Rufous Hummingbirds weighing 3.20 + 0.04 g). Summed transport was 1,260 + 150 nmoles/ min (n = 4) for glucose, 240 + 30 (n = 5) for proline.
Extraction efficiency for glucose.--The amount of glucose absorbed by the intestine is a func- tion of the glucose transport rate of the intes- tine and the contact time between glucose in the lumen and the absorptive surface (i.e. the passage time). We can calculate what propor- tion of the glucose freed by hydrolysis of the sucrose in the test meals was absorbed by the intestine. Calculated from cumulative PEG and
glucose activity excreted in 1-1.5 h as ex- plained in the Methods (Eq. 1), the extraction efficiency for glucose was 97.1 + 0.3% (n = 8) in Rufous Hummingbirds.
DISCUSSION
Crop emptying time.--We found that the crop of Rufous Hummingbirds was emptied of a 100- •1 meal of sugar water (0.585 molal) in 15-20 min, and was half emptied in 4 min if the ex- ponential model of crop emptying is correct (or in 11 rain if, as is less likely, the linear model is correct). These rates are of the same order as those estimated by Hainsworth and Wolf (1972) for other hummingbird species by two other methods. Hainsworth and Wolf concluded from
x-ray studies of three individuals in two species that "most of the food had passed from the crop by 30-40 min after feeding." They found for three individuals of Fiery-throated Humming- bird (Panterpe insignis) that food intake in- creased with increasing times of food depri- vation up to 25-30 min, which may represent the time required for crop emptying. Exami- nation of their fig. 2 suggests a half-time around 10 min. Hainsworth and Wolf's (1972) x-ray study indicated that feeding hummingbirds initially filled their crops, whose contents then began to pass to the rest of the digestive sys- tem.
These data suggest that crop emptying time is a major component of a hummingbird's time budget. In the field, hummingbirds sit for about 75% of the time and feed 20% of the time (Stiles 1971, Wolf and Hainsworth 1971, Ewald and
Carpenter 1978, Hixon et al. 1983). Our esti- mated crop emptying time is much greater than the time needed to consume a meal [<1 min in
the laboratory (Wolf and Hainsworth 1977) and in the field (Hixon et al. 1983)]. This compari- son raises the question of whether crop emp- tying could limit the frequency of feeding bouts in the field.
To evaluate this possibility, consider the fol- lowing arguments. Feeding-bout frequencies of Rufous Hummingbirds in the field are about 14-18 bouts/h (Hixon et al. 1983), and mean meal size is 70 •1 (Carpenter and Hixon 1984), yielding a feeding rate of about 1,000 •l/h. Ac- tually, this is an overestimate because all feed- ing bouts, including interrupted ones, were in- cluded in the feeding-frequency measurements, but not all feeding bouts were included in the meal-size measurement. In our laboratory, birds that were offered 100-•1 meals every 20 min consumed them and thus could maintain feed-
ing rates of at least 300 •l/h. On the other hand, those birds emptied their crops of the 100-•1 meal with a half-time of about 4 min (exponen- tial model). If feeding bouts are initiated when the crop is half empty (50 •1 processed) at 4 min, a bird could feed at 50 x (60/4) = 750 •1/ h; if feeding is initiated when the crop is 75% empty (75 •1 processed) at 8 min, a bird could feed at 75 x (60/8)= 560 •l/h. Thus, actual feeding rates of 300-1,000 •l/h are comparable to the limit imposed by crop emptying times (ca. 560 or 750 •l/h).
This comparison is obviously crude for sev- eral reasons. We do not know what fraction of
a meal must be cleared from the crop before the bird reinitiates feeding. A linear model of crop emptying would yield somewhat different numbers (11 min for 50% and 17 min for 75% emptying). Our measurement of crop empty- ing employs an invasive technique that could affect emptying rate. Emptying rate and feed- ing rate may vary with sugar concentration in the meal, meal size, air temperature, and the bird's metabolic rate and degree of starvation. However, the fact that feeding rates are not obviously greater than the limit imposed by crop emptying rates alone (in the absence of any other limiting factors) makes it possible that crop emptying is what limits feeding rates in the field. If so, this could explain why hum- mingbirds spend most of each hour sitting. They may be energy maximizers that ingest en- ergy as fast as their digestive processes permit (energy maximizers with processing con- straints, sensu Schoener 1983).

July 1986] Nutrient Absorption in Hummingbirds 461
What determines crop emptying time? Why does a hummingbird hold a sugar-water meal in its crop, rather than transmit the meal di- rectly into the stomach or intestine? It seems likely that either or both of two digestive pro- cesses set crop emptying time. These are the time required for the stomach to acidify its vol- ume, which is considerably less than the vol- ume of the crop, and the time required for the small intestine to cleave disaccharides and ab-
sorb monosaccharides. This in turn begs the question of why natural selection has not in- creased the rates of these processes and thereby increased crop emptying rates. As we shall show later, however, sugar absorption rates in hum- mingbirds are already the highest recorded for any vertebrate, and the very high rate of fluid transit through hummingbird intestine re- quires very high gastric acidification rates. Thus, crop emptying rates are probably already at the maximum feasible value, and it is plausible that they should set an upper limit on feeding rates.
Passage rate.--Our measurements of PEG pas- sage rates (Fig. 1) indicate that a liquid meal from the crop does not simply pass from crop to anus in conveyor-beltlike fashion as an in- dividual bolus. Were this so, PEG excretion
would mirror crop emptying after a lag equal to the bolus transit time. Instead, PEG excretion
and the excretion of unabsorbed D-glucose ex- tend over a much longer time (one to several hours) than does crop emptying (ca. 20 min). Thus, the actual time for which much of the meal undergoes digestion is greater than the transit time for the leading edge of the bolus (-< 15 min).
We estimated a "mean retention time" for
food within the hummingbird digestive tract by two methods. The strictly empirical method of Castle (1956) makes no assumption about the digestive process but merely adds the times re- quired for excretion of 5%, 15%, 25% .... 95% of the meal (at 10% intervals), then divides by 10. Applied to PEG excretion by Rufous Hum- mingbirds (Fig. 1), this method yields a mean retention time of 49 _+ 3 rain (n = 8). An alter- native method (Brandt and Thacker 1958) as- sumes a specific simple model of the digestive process: discontinuous flow through one com- partment. Marker excretion is fitted to the equation
Y(t) = Yo e-k(t-tt), (4)
where t is time since feeding the marker, tt is the transit time for the leading edge of the bo- lus, Y(t) is marker activity in the excreta after time tt, Yo is a constant depending on the level of dye in the food, and k is the rate constant for excretion. The calculated rate constant was
-0.0218 _+ 0.0012 (n = 4 birds). The inverse of this rate constant is equal to the average time that particles of digesta remain in the gastroin- testinal tract (Hungate 1966), i.e. the mean re- tention time. This value, 47 _+ 2 min, is in close
agreement with the value of 49 min from Cas- tle's method.
Thus, under the conditions in our laboratory, a sugar-water meal has a transit time of -<15 min and a mean retention time of about 48 min.
The amount of that time spent on average in the crop is given by the inverse of the crop emptying rate constant, 1/0.17 = 6 min. These are rapid times compared with those in which other vertebrate species process other food ma- terials. The transit time for sugar-water meals in hummingbirds is rivaled only by the value of 29 min (range 12-45) for mistletoe berry meals in the Phainopepla (Phainopepla nitens; Walsburg 1975). Transit times for omnivorous and herbivorous birds are in the range of 1-2 h (cf. Robbins 1983: fig. 14.2), and for frugivo- rous birds 25-185 min (Herrera 1984, Johnson et al. 1985). Mean retention times for mammals and lizards are mostly in the range of 2-150 h and depend on the type of food and on the body size and metabolic rate of the animal (Karasov et al. 1986).
The short retention times for sugar-water meals by hummingbirds depend partly on the fact that sugar requires much less intestinal processing for absorption than most other foods: no metabolic processing for glucose, no meta- bolic processing except cleaving by disacchari- dases for sucrose, and no mechanical process- ing for any dissolved sugar. Comparison of passage times for meals of sucrose water and of glucose water could suggest whether the time required for hydrolysis of sucrose by intestinal brush-border disaccharidases is significant. We have not measured hummingbirds' retention times of insect meals, which probably would be longer than those of sugar-water meals. The short retention times of sugar-water meals mean that sugar must be absorbed at unusually rapid rates by hummingbird intestine.
Active or passive absorption of sugar?--Most
462 KARASOV ET AL. [Auk, Vol. 103
vertebrates have to expend energy for intesti- nal sugar absorption, as it occurs up a concen- tration gradient. That is, sugar concentrations in the intestinal lumen are often below those
in the bloodstream. A priori, hummingbirds might save the energy needed for active trans- port, as sugar from their highly concentrated meals could diffuse down a concentration gra- dient from intestinal lumen to blood if the in-
testine's passive permeability were sufficiently high. Two facts mitigate against this option.
First, we found that the intestine's passive permeability to glucose is immeasurably low. It is lower than in any other vertebrate species that we have studied (Karasov et al. 1985a, b). We speculate that this low passive permeability may be an adaptation to the high rates of fluid transit through hummingbird intestine. High passive permeability would enable solutes to diffuse rapidly from blood to intestinal lumen, and vice versa. In effect, high passive perme- ability in the face of rapid fluid transit would convert the hummingbird intestine into a harmful renal dialysis machine, draining the bloodstream of valuable solutes as well as of
waste solutes.
Second, rates of active absorption alone ap- pear to account for all glucose absorbed. To es- timate actual rates of glucose absorbed, consid- er that a 100-•1 meal of 20% sucrose (yielding 58.5 •moles of glucose after cleavage of the di- saccharide) is processed with an estimated mean retention time of 48 min. Subtracting the mean residence time of 6 rain in the crop and further time in the stomach, mean retention time in
the small intestine is probably about 40 min. During that 40 rain, the 58.5 •moles of glucose are absorbed with 97% efficiency, or 58.5 x 0.97 = 57 •moles in 40 min. Consider now the potential rate of active glucose absorption alone. The intestinal glucose carriers are half-saturat- ed at a K• value of 4 raM. In the intestinal lumen the glucose is at high concentration (585 mM in the meal itself), probably resulting in absorption occurring at the saturating rate for all except the last dregs of the sugar meal (Fig. 3). Under nearly saturating (actually, 97% of saturating) concentrations of 50 mM at 37øC, summed D-glucose uptake over the length of the small intestine was 1,260 nmoles/min. In a bird operating at 40øC we estimate that the ab- sorption rate in vivo would be 16% higher, be- cause the Q•0 (rate change with a 10 ø C increase)
for glucose uptake that we measured in other terrestrial vertebrates between 37 and 45øC is
1.66 (Karasov et al. 1985b). The maximal rate of active glucose absorption by the small intestine in 40 rain is therefore [40 rain x (1,260/1,000) •moles/min x 1.16] = 58 •moles in 40 rain, slightly more than the 57 •moles actually ab- sorbed.
Thus, active glucose absorption alone ac- counts for all glucose absorption. This compar- ison also suggests that the rates of glucose ab- sorption that we measured in vitro are not very different from those prevailing in vivo.
Comparison of absorption rates by intestine of hummingbirds and of other vertebrates.--The ap- parent K• for glucose absorption by humming- birds is 4 raM, toward the high end of the range in other vertebrates (0.5-6 raM; Karasov et al. 1985a). The apparent K• value is conservative among vertebrates, and we have not been able to discern species differences of adaptive sig- nificance. Instead, species variation is in V•, a measure of the number of absorptive sites per quantity of intestinal tissue. In essence, the mo- lecular machinery for sugar absorption in hum- mingbirds is qualitatively similar to that of oth- er vertebrates, but hummingbirds are distinctive in having more copies of the machinery.
We previously found for other vertebrate classes that intestinal rates (V•) of amino acid absorption show little species variation but that glucose absorption rates vary markedly with carbohydrate levels in the natural diet. Glucose absorption is highest in herbivores, next high- est in omnivotes, and lowest in carnivores (Karasov et al. 1985a, Buddington and Dia- mond 1985). In interpreting this pattern, recall that sugars are a source only of calories and are not essential nutrients. Thus, herbivores on
high-carbohydrate diets have high numbers of glucose absorption sites for quick processing of glucose, while carnivores on low-carbohydrate diets repress the glucose absorptive machinery to save unnecessary biosynthetic costs. Protein, however, is a source not only of calories but also of nitrogen and essential amino acids. Thus, no species, whether a herbivore or a carnivore, can afford to save on costs of amino acid ab-
sorptive machinery. Hummingbirds provide an extreme test of
this interpretation because of their very high levels of dietary carbohydrate. In addition, the results reported here for nectarivorous hum-

July 1986] Nutrient Absorption in Hummingbirds 463
mingbirds, plus our previous results (Karasov and Diamond 1983a, Karasov et al. 1985a, Bud-
dington and Diamond unpubl. obs.) for an avi- an omnivote (domestic chicken, Gallus gallus) and an avian carnivore (Loggerhead Shrike, Lanius ludovicianus), permit us to test whether the relations between diet and intestinal ab-
sorption rates observed for other vertebrate classes also apply to birds. A simple test is the ratio of summed intestinal transport capacity for glucose to that for proline in the same species, because this ratio is independent of body size and intestinal morphology (Karasov et al. 1985a). As expected from our results with other vertebrate classes, this ratio is highest in the nectarivorous hummingbird (5.26), inter- mediate in the omnivorous chicken (0.95), and lowest in the carnivorous shrike (0.19). The ra- tio in hummingbirds is higher than in any of the 21 other vertebrate species that we have studied; the only species that comes close is the granivorous kangaroo rat (Dipodomys merriami), where the ratio equals 2.58 (Karasov et al. 1985a).
The differences in glucose/proline ratios among bird species with different food habits result from differences in glucose transport (the numerator), not from differences in amino acid transport (the denominator). Hummingbirds, chickens, and shrikes have comparable proline transport rates (Fig. 5, bottom). However, glu- cose transport rates (Fig. 5, top) of humming- birds are 5-10 times greater than those of chickens, which are in turn 2-10 times greater than those of shrikes, depending on whether absorption rates are normalized to intestinal nominal surface area or wet mass (Fig. 5, top). [We prefer normalization to nominal surface area because comparison of uptake rates nor- malized to intestinal mass is complicated by the fact that the proportions of the mass that are mucosa (the transporting tissue) and underly- ing muscle layers are not known.] Humming- birds have the highest maximal glucose trans- port rates (Vmax) that we have measured in any vertebrate, whether normalized to nominal surface area or to wet mass. They also have the highest summed transport rate for glucose, per gram of body weight. It remains to be seen whether hummingbird intestine is also distin- guished by a high density of fructose absorp- tive sites.
For hummingbirds and most other verte-
brate species, we do not know the relative con- tributions of phenotypic and genotypic factors to the rate of intestinal glucose transport. Thus, we do not know whether hummingbirds' very high rates of glucose transport are a genetically fixed or a phenotypically reversible adaptation to their nectar diet. In mice, by comparison, variation in dietary carbohydrate levels in- duces and represses intestinal glucose trans- port reversibly (Karasov et al. 1983, Diamond and Karasov 1984). Differences in carbohydrate levels of natural diets are associated with ge- netic differences among fish species in rates of intestinal glucose transport (Buddington and Diamond 1985).
Extraction efficiency for glucose.--The extrac- tion efficiency of 97% for glucose measured in Rufous Hummingbirds is similar to values of 97-99% for total sugars in two other humming- bird species (Hainsworth 1974). We are not aware of extraction-efficiency measurements for nectar or sugar solutions in other vertebrates. A fruit bat, Artibeus jamaicensis, appears to di- gest almost all of the juice it ingests from a diet of figs (Morrison 1980). Among vertebrates, ap- parent values of overall extraction efficiency for solid plant material (leaves, shoots) are gener- ally 45-70%, while apparent values for seeds and animal food are around 80-90%. These dif-
ferences by food category arise because sugars can be completely absorbed and metabolized, while solid plant and animal food contains un- utilizable or poorly utilizable components such as cellulose, lignin, and chitin.
ACKNOWLEDGMENTS
It is a pleasure to acknowledge our debt to David Solberg, Meredith Hughes, and Edith Read for lab- oratory assistance. Collections were made under per- mits PRT2-1068-SC and CA 0762. Don Powers pro- vided some Anna's Hummingbirds, and Dr. W. Weathers provided the shrikes. Dr. R. K. Buddington graciously shared some of his unpublished data on chickens with us. Supported by National Institutes of Health grant GM 14772 to J.M.D. and National Science Foundation grant DEB 8022575 to F.L.C.
LITERATURE CITED
BARRY, P. H., & J. M. DIAMOND. 1984. Effects of un- stirred layers on membrane phenomena. Phys- iol. Rev. 64: 763-872.
BRANDT, C. S., & E. J. THACKER. 1958. A concept of

464 KARASOV ET AL. [Auk, Vol. 103
rate of food passage through the gastrointestinal tract. J. Anim. Sci. 17: 218-224.
BUDDINGTONß R. K., & J. M. DIAMOND. 1985. Diet dependence of vertebrate intestinal nutrient transport: a genotypic component. Fed. Proc. 44:
CALDERß W. A., & $. M. HIEBERT. 1983. Nectar feed-
ingß diuresisß and electrolyte replacement of hummingbirds. Physiol. Zool. 56: 325-334.
CARPENTER, F. L., •: M. A. HIXON. 1984. Energetics of feeding territoriality in hummingbirds. NSF proposalß Grant No. BSR 8400669.
CASTLE, E.J. 1956. The rate of passage of foodstuffs through the alimentary tract of the goat. Brit. J. Nutr. 10: 15-23.
DEBENEDICTIS, P. A., F. B. GILLß F. R. HAINSWORTH, G. H. PYKE, & L. L. WOLf. 1978. Optimal meal size in hummingbirds. Amer. Natur. 112: 301-316.
DIAMOND, J. M., & W. H. KARASOV. 1984. Effect of dietary carbohydrate on monosaccharide uptake by mouse small intestine in vitro. J. Physiol. (London) 349: 419-440.
--, D. PHAN, & F. L. CARPENTER. 1986. Hummingbird digestive physiology, a determi- nant of foraging bout frequency. Nature 320: 62- 63.
DUNN, D. $., & V. A. CLARK. 1974. Applied statistics: analysis of variance and regression. New York, J. Wiley & Sons.
EWALD, P. W., & F. L. CARPENTER. 1978. Territorial
responses to energy manipulations in the Anna Hummingbird. Oecologia 31: 277-292.
HAINSWORTH, F.R. 1974. Food quality and foraging efficiency. J. Comp. Physiol. 88: 425-431.
1981. Energy regulation in hummingbirds. Amer. Scientist 69: 420-429.
--, & L. L. WOLf. 1972. Crop volume, nectar concentrationß and hummingbird energetics. Comp. Blochem. Physiol. 42A: 359-366.
ß & . 1976. Nectar characteristics and food selection by hummingbirds. Oecologia 25:
HERRERAß C. M. 1984. Adaptation to frugivory of Mediterranean avian seed dispersers. Ecology 65: 609-617.
HIXON, M. A. 1982. Energy maximizers and time minimizers: theory and reality. Amer. Natur. 119: 596-599.
., F. L. CARPENTER, •: D.C. PAtON. 1983. Ter-
ritory areaß flower densityß and time budgeting in hummingbirds: an experimental and theoret- ical analysis. Amer. Natur. 122: 366-391.
HUNGATEß R.E. 1966. The rumen and its microbes. New York, Academic Press.
JOHNSONß R. A., M. F. WILLSON, J. N. THOMPSON, & R. I. BERTIN. 1985. Nutritional values of wild
fruits and consumption by migrant frugivorous birds. Ecology 66: 819-827.
I•a•sov, W. H., R. K. BUDDINGTONß & J. M. DIAMOND. 1985a. Adaptation of intestinal sugar and amino acid transport in vertebrate evolution. Pp. 227- 239 in Transport processesß ion- and osmoregu- lation (R. Gilles and M. Gilles-Baillien, Eds.). Berlin, Springer-Verlag.
--, & J. M. DIAMOND. 1983a. A simple method for measuring intestinal solute uptake in vitro. J. Comp. Physiol. B 152: 105-116.
--, & --. 1983b. Adaptive regulation of sugar and amino acid transport by vertebrate in- testine. Amer. J. Physiol. 245: G443-462.
--, R. S. POND, D. H. SOLBERG, •: J. M. DIAMOND. 1983. Regulation of proline and glucose trans- port in mouse intestine by dietary substrate levels. Proc. Natl. Acad. Sci. 80: 7674-7677.
-, L. ROSENBERG, E. PETROSSIAN, & J. M. DIAMOND.
1986. How do food passage rate and assimila- tion differ between herbivorous lizards and non-
ruminant mammals? J. Comp. Physiol. in press. --, D. H. SOLBERG, & J. M. DIAMOND. 1985b.
What transport adaptations enable mammals to absorb sugars and amino acids faster than rep- tiles? Amer. J. Physiol. 249: G271-283.
KOTB, A. R., & T. D. LUCKEY. 1972. Markers in nu- trition. Nutr. Abs. Rev. 42: 813-844.
MORRISON, D.W. 1980. Efficiency of food utilization by fruit bats. Oecologia 45: 270-273.
ROBBINSß C. T. 1983. Wildlife feeding and nutrition. New York, Academic Press.
SCHOENER, T. W. 1983. Simple models of optimal feeding-territory size: a reconciliation. Amer. Natur. 121: 608-629.
SIBLE¾, R.M. 1983. Strategies of digestion and def- ecation. Pp. 109-142 in Physiological ecology: an evolutionary approach to resource use (C. R. Townsend and P. Calow, Eds.). Sunderlandß Massachusetts, Sinauer Assoc.
STILES, F. G. 1971. Time, energy, and territoriality of the Anna Hummingbird (Calypte anna). Sci- ence 173: 818-821.
WALSBURG, G. E. 1975. Digestive adaptations of Phainopepla nitens associated with the eating of mistletoe berries. Condor 77: 169-174.
WOLf, L. L., & F. R. HAINSWORTH. 1971. Time and energy budgets of territorial hummingbirds. Ecology 52: 980-988.
ß & -- 1977. Temporal patterning of feeding by hummingbirds. Anim. Behav. 25: 976- 989.