food labeling: nutrition labeling of standard menu … · food labeling: nutrition labeling of...
TRANSCRIPT
DEPARTMENT OF HEALTH AND HUMAN SERVICES
Food and Drug Administration
Food Labeling: Nutrition Labeling of Standard Menu Items
in Restaurants and Similar Retail Food Establishments Notice of Proposed
Rulemaking
Docket No. FDA-2011-F-0172
Preliminary Regulatory Impact Analysis
Office of Regulations Policy and Social Sciences Center for Food Safety and Applied Nutrition
March 2011

ii
iii
SUMMARY: The Food and Drug Administration (FDA) is proposing requirements for
providing certain nutrition information for standard menu items in certain chain
restaurants and similar retail food establishments to implement the menu labeling
provisions of the Patient Protection and Affordable Care Act of 2010 (Affordable Care
Act). The Affordable Care Act, in part, amended the Federal Food, Drug and Cosmetic
Act (FD&C Act), among other things, to require restaurants and similar retail food
establishments that are part of a chain with 20 or more locations doing business under the
same name and offering for sale substantially the same menu items to provide calorie and
other nutrition information for standard menu items, including food on display and self-
service food. Under provisions of the Affordable Care Act, restaurants and similar retail
food establishments not otherwise covered by the law may elect to become subject to the
Federal requirements by registering every other year with FDA. Providing calorie and
other nutrition information in restaurants and similar retail food establishments would
assist consumers in making healthier dietary choices. The analysis of benefits and costs
included in this document is the basis for the summary analysis included in the notice of
proposed rulemaking for the Food Labeling: Nutrition Labeling of Standard Menu Items
in Restaurants and Similar Retail Food Establishments proposed rule, Docket # FDA-
2011-F-0172.
iv
Table of Contents
I. INTRODUCTION..................................................................................................................... 1
A. Need for This Regulation........................................................................................... 3 B. Summary of Costs and Benefits of the Proposed Requirements and Regulatory Options............................................................................................................................ 6 C. Regulatory Options .................................................................................................. 13
II. COSTS AND BENEFITS OF REGULATORY OPTIONS: DETAILED ANALYSIS .................................................................................................................................. 16
A. Baseline for the purpose of analysis – No new federal regulatory action................ 16 B. Option 1, the Proposed Rule .................................................................................... 18 C. Option 2: Limited Scope .......................................................................................... 54 D. Option 3. Broader Scope.......................................................................................... 57 E. Option 4. Shorter Compliance Time ........................................................................ 75 F. Option 5. Longer Compliance Time......................................................................... 78 G. Uncertainty Analysis................................................................................................ 79
III. REFERENCES..................................................................................................................... 81
I. Introduction
FDA has examined the impacts of the proposed rule under Executive Orders
12866 and 13563, the Regulatory Flexibility Act (5 U.S.C. 601-612), and the Unfunded
Mandates Reform Act of 1995 (Public Law 104-4). Executive Orders 13563 and 12866
direct agencies to assess all costs and benefits (both quantitative and qualitative) of
available regulatory alternatives and, if regulation is necessary, to select regulatory
approaches that maximize net benefits (including potential economic, environmental,
public health and safety effects, distributive impacts, and equity). Executive Order 13563
emphasizes the importance of quantifying both costs and benefits, of reducing costs, of
harmonizing rules, and of promoting flexibility. This rule has been designated an
“economically” significant rule, under section 3(f)(1) of Executive Order 12866.
Accordingly, the rule has been reviewed by the Office of Management and Budget.
The Regulatory Flexibility Act requires agencies to analyze regulatory options
that would minimize any significant impact of a rule on small entities. Using the Small
Business Administration (SBA) definitions of small for industrial subsectors in
accommodations, food service, recreation, and retail food stores (NAICS 72, 71, 445),
FDA tentatively concludes that a significant number of firms affected by this proposed
rule are small businesses.
Section 4205 of the Affordable Care Act and the proposed requirements apply to
chain retail food establishments, as that term is used in this document (i.e., a restaurant or
similar retail food establishment that is part of a chain with 20 or more locations doing
business under the same name (regardless of the type of ownership of the locations) and
offering for sale substantially the same menu items), and establishments that voluntarily
2
register with FDA to become subject to the requirements of section 4205. Some chain
retail food establishments may meet the SBA definitions of: less than $7 million in
annual sales for most accommodation and food service or recreation subsectors (NAICS
72, 71); less than $20.5 million in annual sales for Food Service Contractors (NAICS
722310); or less than $27 million in annual sales for supermarkets and convenience store
chains (NAICS 44510 and 445120). In addition, some chain retail food establishments
are owned or operated by entities, including franchisees or cooperative members that may
meet the SBA definitions described above.
Establishments that voluntarily register to be subject to the Federal requirements,
which may be individually owned or part of a firm that controls establishments within a
chain of less than 20 locations, may meet the SBA definition described above. While the
voluntary nature of the registration implies that these latter firms see a positive net benefit
from becoming subject to the Federal requirements, this does constitute a potentially
significant economic impact. Therefore, the agency tentatively concludes that the rule
will have a significant economic impact on a substantial number of small entities. This
conclusion is discussed further in section V.
Section 202(a) of the Unfunded Mandates Reform Act of 1995 requires that
agencies prepare a written statement, which includes an assessment of anticipated costs
and benefits, before proposing “any rule that includes any Federal mandate that may
result in the expenditure by State, local, and tribal governments, in the aggregate, or by
the private sector, of $100,000,000 or more (adjusted annually for inflation) in any one
year.” The current threshold after adjustment for inflation is $135 million, using the most
current (2009) Implicit Price Deflator for the Gross Domestic Product. FDA expects this
3
proposed rule to result in 1-year expenditures that would meet or exceed this amount.
This conclusion is discussed further in section VI.
FDA asks for comments about the data and the methods used for estimating the
regulatory impact of the proposed rule.
A. Need for This Regulation
This proposed rule is necessary to implement Section 4205 of the Affordable Care
Act, which amends sections 403(q)(5) and 403A of the FFDCA, and requires disclosure
of calorie and other nutrition information by covered establishments. These nutrition
labeling requirements should help consumers to make more informed choices about the
nutritional content of the food they purchase. The provision of calorie and other nutrition
information for restaurant and restaurant-type foods, as those terms are used in this
document, offered for sale by covered establishments should help consumers limit excess
calorie intake and understand how the foods that they purchase at these establishments fit
within their daily caloric and other nutritional needs. FDA notes as well that Executive
Order 13563 specifically directs agencies to “identify and consider regulatory approaches
that reduce burdens and maintain flexibility and freedom of choice for the public. These
approaches include . . . disclosure requirements as well as provision of information to the
public in a form that is clear and intelligible.”
Economic justifications for regulatory interventions in private markets rely on the
presence of some market failure. In the case of restaurant and restaurant-type foods, the
private market is particularly robust and competitive. Hundreds of thousands of retail
food establishments and tens of thousands of individual firms vie for consumer dollars
across the United States. High estimates of failure rates for restaurants (Ref. 1), with
4
relatively steady growth rates in number of establishments (Ref. 2) indicate that entry in
the industry occurs often, and survival is hard fought: restaurants must be responsive to
consumer needs and desires in order to survive. The competitiveness of the industry
suggests that if a sizable fraction of consumers were willing to pay for – and discriminate
based on – the availability of nutrition information, then the industry would provide it to
them. In fact, many retail food establishments do provide nutrition information for at
least a fraction of their offerings, either through available brochures, or, increasingly, on
the Internet. A 2006 study found that 34 percent of the top 300 chain restaurants (by sales
volume) had nutrition information available to consumers in some form (Ref. 3).
Notwithstanding this point, and although many of the usual market failures that
justify regulatory action, such as the existence of market power or public goods, cannot
be found here (Refs. 4 and 5), the primary support for government intervention is an
absence of sufficient nutritional information, produced by an inadequate incentive for
restaurants to produce that information on their own. An absence of adequate
information is of course a standard market failure, justifying disclosure requirements or
provision of information in many contexts.
In terms of explaining the inadequate incentive for restaurants to provide
sufficient nutrition information, a central reason involves consumer demand. There are
systematic biases in how consumers weigh current or immediate benefits (from eating
more, or higher calorie, foods) against future or long term costs (higher probability of
obesity and its co-morbidities). These biases are directly related to the proposed
requirements: the temporal disconnect inherent between food consumption choices and
their potential health costs may work against an efficient provision of nutrition
5
information for food (Ref. 6). A primary issue here is that long-term risks may not be
sufficiently salient to produce adequate consumer demand for relevant information
disclosure. And without that information, consumers may fail to make informed choices
and may undervalue the future costs of excessive calorie consumption, relative to the
current benefits from such consumption (Refs. 6, 7 and 8).
Studies suggest that one problem involves the fact that because food decisions
are made so often, and the marginal effect of any one meal on future obesity is small, the
cumulative costs of a large number of relevant decisions may be neglected. These studies
suggest that some or many consumers will not demand calorie information, because the
issue of calories often lacks salience, or relevance, for consumers at the time of purchase
and consumption, even though they may experience regret about their decisions at a latter
date. This tendency may explain why consumers have not generally demanded calorie
and other nutrition information for restaurant and restaurant-type food, although they do,
at a later point in time, value that information. Furthermore, restaurants and similar
retail establishments have costs of providing calorie and other nutrition information,
including opportunity costs of limited time and space in which to convey information to
the consumer. That is, just as a firm has to decide which possible menu items to leave off
a menu board with limited space (thus giving up the opportunity to sell those items), it
must choose which pieces of information about its menu items it wants to convey.
Adding an additional piece of information means that a firm may need to downplay or
remove some other valuable piece of information. In addition, providing calorie
information may have complex and unintended effects on revenue and profits as
consumers respond to that information. Given the costs and the uncertain reception of
6
displayed calorie information most restaurants have chosen not to display this
information at the point of purchase.
The proposed requirements respond to the apparent market failure in information
provision stemming from existing restaurant incentives and present-biased preferences.
Specifically, the proposed requirements provide that calorie information for standard
menu items must be posted in covered establishments. Providing this nutrition
information will likely increase the salience of the information and promote informed
choice as well. It will also likely raise consumer awareness regarding the number of
calories in restaurant and restaurant-type foods, and thus may serve to highlight the
potential future costs of additional calorie consumption. This increased attention to the
number of calories in food offered for sale by covered establishments may then result in
an increased availability of lower calorie options, and an increased demand for these
options.
B. Summary of Costs and Benefits of the Proposed Requirements and Regulatory
Options
In this section FDA describes the bases of benefits and costs of the proposed
requirements and summarizes the results of the Preliminary Regulatory Impact Analysis
(PRIA).
Benefits in response to the proposed requirements Obesity and overweight are major
public health concerns in the United States and among the top leading health indicators
addressed by the United States Healthy People 2020 goals. Nationally representative data
have consistently exhibited a steady increase in the prevalence of obesity over the past
three decades (Ref. 9). As noted in section I. A., 34 percent of the adult U.S. population is
7
obese and 34 percent is overweight (Ref. 10). In addition, about 31 percent of children
and adolescents, aged 2 to 19, are overweight or obese (Ref. 11).
Excess body weight has many health (Ref. 12), social (Refs. 13 and 14),
psychological (Refs. 15 and 16), and economic consequences (Ref. 17) for the affected
individuals. Lower life expectancy, elevated risk of diabetes, hypertension, stroke and
other cardiovascular disease has been documented to rise simultaneously with the
increased prevalence of obesity (Ref. 12). The economic impact is especially evident for
health-care costs in terms of greater health-care utilization and higher medical
expenditures (Ref. 18). More specifically, as noted, medical expenditures attributable to
overweight and obesity accounted for more than 9 percent of the total U.S. medical
expenditures in 1998, or between $86 billion, and $147 billion (Ref. 18). Another
estimate indicates that obesity costs American families, businesses and government
approximately $117 billion in 2010 (Ref. 19).
The primary risk factors for overweight and obesity in the general population are
overconsumption of calories (i.e., eating more calories than are needed to maintain body
weight) and physical inactivity (i.e., getting an amount of exercise below the amount
required to burn excess calories consumed over the amount needed to maintain body
weight (Ref. 20).
One contributor out of the complex and multi-facet set of factors is food offered
for sale by restaurants and similar retail food establishments. The proportion of total
food expenditure spent on such foods increased from 34 percent during the 1970s up to
approximately 50 percent by 2004, where it has remained through 2009 (Ref. 21). These
foods are generally high in calories, fat and portion size (Ref. 22), and they tend to be
8
lower in fiber and other essential nutrients such as calcium as compared to home-
prepared foods (Ref. 23).
Restaurant food and restaurant-type food form a significant and increasing part of
U.S. diets. According to one study, “food away from home” (this term is roughly
comparable to restaurant and restaurant-type foods ) constituted about a third of calories
consumed annually by the average adult or child in the United States in the most recent
comprehensive published study (Ref. 23). Another study of adults found that “food away
from home” adds an additional 130 calories per meal, on average, relative to a similar
meal prepared at home (Ref. 24). The difference in calorie consumption between “food
away from home” and food prepared at home was greater for study participants who were
overweight or obese; among those individuals, the away-from-home meals had 240 more
calories per meal relative to meals prepared at home (Ref. 24).
Although many factors contribute to obesity, to the extent that the proposed
requirements would mitigate the prevalence of obesity and of co-morbidities, society
would gain the opportunity cost of the averted medical expenditures and an increase in
productivity from averted debilitation and death. In addition to informing consumers
about the calorie content for restaurant and restaurant-type foods offered for sale by
covered food establishments, major predicted elements of the consumer and industry
response to this proposed rule may include:
1. Increased awareness regarding the caloric content for foods offered for sale by
covered establishments, which may help reduce the present-bias in preferences,
and thus encourage the consumption of lower calorie options.
9
2. Increased consumer interest in lower calorie options, and greater transparency
regarding calorie content of menu items, which may give firms an incentive to:
a. Reduce the calorie content of existing items through reformulation or by
decreasing portion size.
b. Provide additional items with lower calorie formulations.
These changes may reduce consumers’ caloric intake from foods sold in covered
establishments, and this reduction in caloric intake may in turn contribute to a reduction
in obesity in the U.S. population. Note that any reduction in calorie intake in these
settings may be at least partially offset by increases in calorie intake during other meals
or snacks. This substitution of one calorie source for another has been demonstrated in
the context of menu labeling (Ref. 25) and in the context of other attempts to modify food
choices (Ref. 26). Because FDA lacks data on how consumers will substitute between
caloric sources, as well as specific information on the responsiveness of calorie demand
to new information, the benefit estimations given here may be higher or lower than those
that will be realized if the rule is finalized as proposed. Finally, there may be additional
benefits to the extent that consumers use the written nutrition information to make food
selections.
Industry and consumer costs in response to the proposed requirements
Meeting the proposed requirements will have costs for both the industry and consumers.
Typically, new costs to an industry are borne by both consumers and firms: prices rise to
reflect new costs, but generally not by enough to completely offset them. If the expense
of meeting the proposed requirements cause prices to increase for some or all restaurant
and restaurant-type foods offered for sale by covered establishments, then the
10
consumption of these foods will fall, further reducing profits for some, or all, of these
establishments. Consumers would need to pay more for this food, requiring some
reduction in other, valued, consumption.
One difficulty in determining the cost burden stems from the relatively
complicated ownership structures in some of the covered sectors. Restaurants and similar
retail food establishments can be corporate-owned, franchised as part of a large or small
independent chain, or cooperatively-organized and doing business under the same name.
Data for separate firms operating under the same name, such as franchises of a particular
brand or corporate name, are difficult or impossible to acquire. Therefore, for this
analysis FDA counts affected establishments and chains, which may in fact serve one,
several, or many, underlying firms. Except for some potential costs of nutrition analysis,
the costs of the proposed rule are analyzed at either the chain or the establishment level,
so that the overall costs are not primarily a function of the actual number of firms
affected.
The major elements of cost for this proposed rule are:
1. Collecting and managing records of nutritional analysis for each standard menu
item.
2. Revising or replacing existing menus, menu boards and other affected displays.
3. Training employees to understand nutrition information in order to help ensure
compliance with the proposed requirements.
Although not required by the proposed requirements, some chains or
establishments may respond to increased consumer interest on caloric content of
restaurant and restaurant-type food by reformulating existing menu items or by
11
introducing new, lower calorie items. While the costs associated with formulating these
items have not been included in the cost estimation, FDA has included the cost associated
with analyzing new or reformulated items. Because the rate at which these items are
introduced may be affected by the propose requirements, FDA requests comment and
data on whether the proposed requirements will accelerate the rate of new item
introduction and how the cost of these items may be affected by the proposed
requirements.
Finally, because they are not required by the proposal, FDA has not included any
costs associated with developing online or other electronic calorie calculators for variable
menu items. FDA requests comment and data on the costs of these kinds of calorie tools.
Summary of benefits and costs We summarize the estimated costs and benefits of the
proposed requirements and some regulatory options in Tables 1a-1b. Costs of complying
with the proposed requirements have been estimated for three major areas: cost of
nutrition analysis, cost of menu and menu board replacement, and costs of training. These
costs have been aggregated across an estimate of the total number of chains and
establishments that would be defined as covered under the proposed rule. In the case of
the proposed rule, FDA estimates that there would be approximately 278,600 covered
establishments organized under 1,640 chains. The initial mean estimated cost of
complying with the proposed requirements is $315.1 million, with an estimated mean
ongoing cost of $44.2 million. Annualized over 10 years, the mean estimated annual cost
of the proposed requirements is $76.8 million at a 3 percent discount rate, and $82.3
million at a 7 percent discount rate. FDA has estimated low and high annualized cost
12
estimates for the proposed requirements of $33.4 million and $120.5 million with a 3
percent discount rate, and $34.9 million and $130.1 million with a 7 percent discount
rate. The bases for this wide range of cost estimates and the main drivers of this
uncertainty are collected and discussed in the full, detailed PRIA.
Initial costs are estimated to be $1,100 per covered establishment. Note however,
that this figure combines the average per establishment cost of $1,800 per limited service
eating establishments – i.e. those most likely to have more than one menu board or major
display serving as a menu - with full service restaurants averaging less than $1,000 per
establishment. These averages do not show the very wide range of costs that individual
establishments and chains will bear, based on their very different approaches to nutrition
analysis, menu design and overall market niche.
FDA has not estimated the actual benefits associated with proposed requirements.
Food choice and consumption decisions are complex, and FDA is unaware of any
comprehensive data allowing accurate predictions of the effect of the proposed
requirements on consumer choice and establishment menus. Therefore, FDA has
constructed a plausible individual effect of the proposed rule, and has conducted a break-
even analysis in order to determine the proportion of the U.S. obese adult population that
would need to attain this minimal response in order for the proposed requirement to yield
a positive net benefit. Using a 100 calorie per week reduction in intake as the benchmark
effect, FDA estimates that at least 0.06 percent of the adult obese population would need
to reach at least this benchmark in order for the rule to break even on the primary, or
mean annualized cost.
13
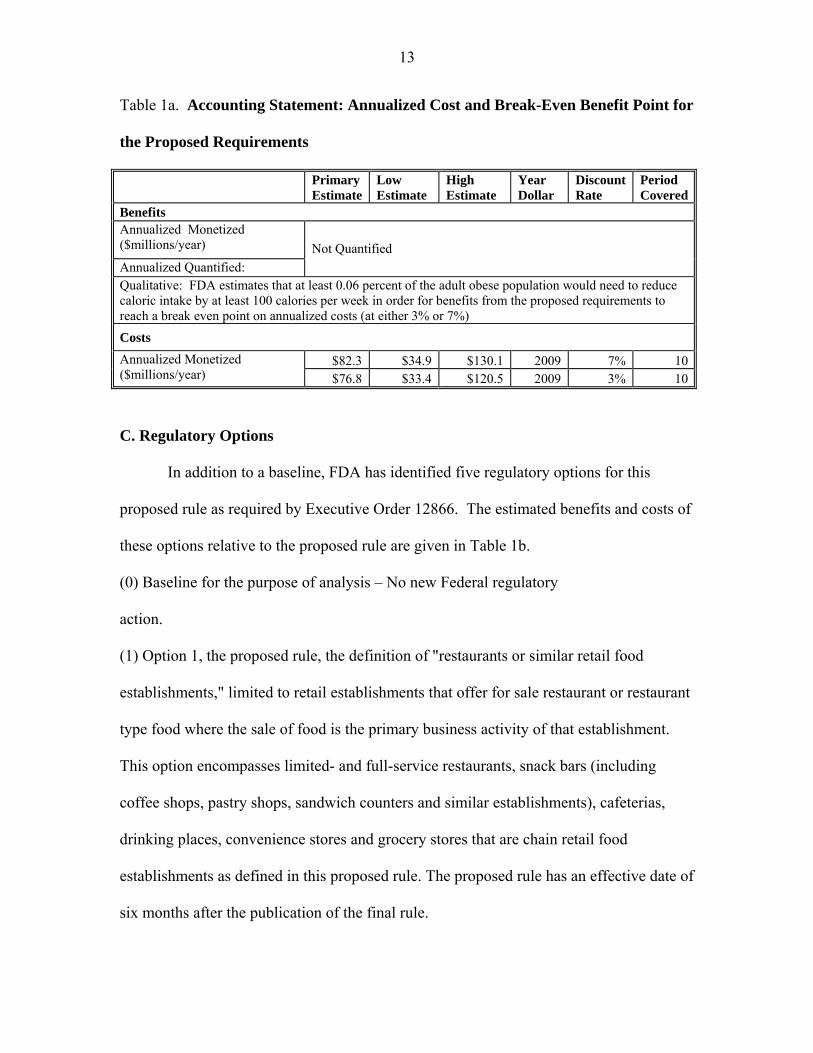
Table 1a. Accounting Statement: Annualized Cost and Break-Even Benefit Point for
the Proposed Requirements
Primary Estimate
Low Estimate
High Estimate
Year Dollar
Discount Rate
Period Covered
Benefits Annualized Monetized ($millions/year)
Annualized Quantified:
Not Quantified
Qualitative: FDA estimates that at least 0.06 percent of the adult obese population would need to reduce caloric intake by at least 100 calories per week in order for benefits from the proposed requirements to reach a break even point on annualized costs (at either 3% or 7%)
Costs
$82.3 $34.9 $130.1 2009 7% 10Annualized Monetized ($millions/year) $76.8 $33.4 $120.5 2009 3% 10
C. Regulatory Options
In addition to a baseline, FDA has identified five regulatory options for this
proposed rule as required by Executive Order 12866. The estimated benefits and costs of
these options relative to the proposed rule are given in Table 1b.
(0) Baseline for the purpose of analysis – No new Federal regulatory
action.
(1) Option 1, the proposed rule, the definition of "restaurants or similar retail food
establishments," limited to retail establishments that offer for sale restaurant or restaurant
type food where the sale of food is the primary business activity of that establishment.
This option encompasses limited- and full-service restaurants, snack bars (including
coffee shops, pastry shops, sandwich counters and similar establishments), cafeterias,
drinking places, convenience stores and grocery stores that are chain retail food
establishments as defined in this proposed rule. The proposed rule has an effective date of
six months after the publication of the final rule.
14
(2) Option 2, with requirements similar to the proposed rule, but with "restaurant or
similar retail food establishment" limited to retail establishments where the sale of
restaurant food or restaurant-type food is the primary business activity. This option
covers all establishments included in Option 1, with the exception that grocery and
convenience stores would not be subject to the proposed requirements.
(3) Option 3, with requirements similar to the proposed rule, but with scope broadened to
include a wide variety of establishments that serve restaurant or restaurant-type food.
(4) Option 4, with requirements similar to the proposed rule, but with an effective date
starting three months after publication of the final rule instead of six months after
publication of the final rule.
(5) Option 5, with requirements similar to the proposed rule, but with an effective date
starting 12 months after publication of the final rule instead of six months after
publication of the final rule.
15
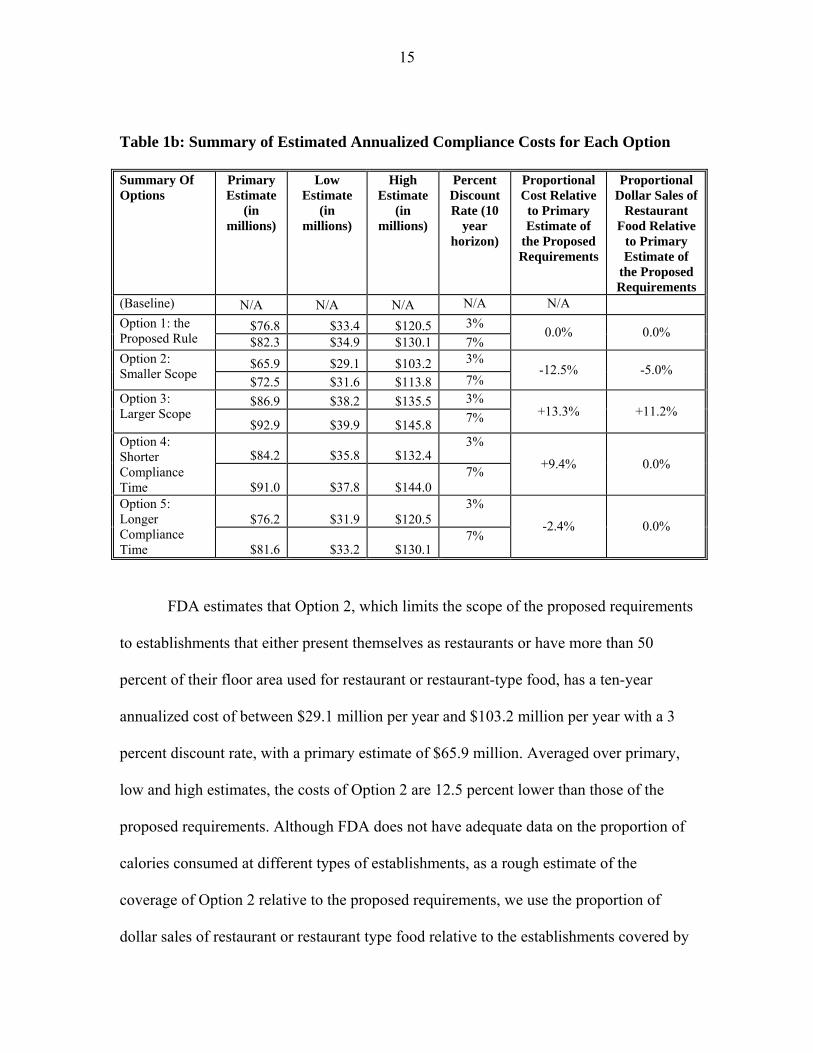
Table 1b: Summary of Estimated Annualized Compliance Costs for Each Option
Summary Of Options
Primary Estimate
(in millions)
Low Estimate
(in millions)
High Estimate
(in millions)
Percent Discount Rate (10
year horizon)
Proportional Cost Relative to Primary Estimate of
the Proposed Requirements
Proportional Dollar Sales of
Restaurant Food Relative
to Primary Estimate of
the Proposed Requirements
(Baseline) N/A N/A N/A N/A N/A
$76.8 $33.4 $120.5 3% Option 1: the Proposed Rule $82.3 $34.9 $130.1 7%
0.0% 0.0%
$65.9 $29.1 $103.2 3% Option 2: Smaller Scope
$72.5 $31.6 $113.8 7% -12.5% -5.0%
$86.9 $38.2 $135.5 3% Option 3: Larger Scope
$92.9 $39.9 $145.8 7% +13.3% +11.2%
$84.2 $35.8 $132.4 3% Option 4:
Shorter Compliance Time $91.0 $37.8 $144.0
7% +9.4% 0.0%
$76.2 $31.9 $120.5 3% Option 5:
Longer Compliance Time $81.6 $33.2 $130.1
7% -2.4% 0.0%
FDA estimates that Option 2, which limits the scope of the proposed requirements
to establishments that either present themselves as restaurants or have more than 50
percent of their floor area used for restaurant or restaurant-type food, has a ten-year
annualized cost of between $29.1 million per year and $103.2 million per year with a 3
percent discount rate, with a primary estimate of $65.9 million. Averaged over primary,
low and high estimates, the costs of Option 2 are 12.5 percent lower than those of the
proposed requirements. Although FDA does not have adequate data on the proportion of
calories consumed at different types of establishments, as a rough estimate of the
coverage of Option 2 relative to the proposed requirements, we use the proportion of
dollar sales of restaurant or restaurant type food relative to the establishments covered by
16
the proposed rule. In the case of Option 2, limiting the scope of covered establishments
would reduce the coverage of restaurant or restaurant-type food sales by 5.0 percent.
These changes are discussed more fully in the detailed analysis.
Option 3 which considers a wider set of establishments that service restaurant or
restaurant-type foods, including lodging, transport, entertainment, general retail and other
establishments, has costs that are 13.3 percent higher than those of the proposed
requirements and coverage of sales that is 11.2 percent higher. Option 4, which shortens
the compliance time to 3 months, has costs that are 9.4 percent higher than the proposed,
and Option 5, which lengthens compliance time to 12 months has costs that are estimated
to be 2.4 percent lower. These options do not change the set of covered establishments
relative to the proposed rule.
Finally, although registration by firms wishing to register with FDA in order to
come under the proposed requirements and the associated preemption from State or local
regulations is voluntary, and is only likely to occur to the extent that the costs of
registration and compliance with federal regulation is lower than that of State or local
regulation, this registration constitutes a collection of information under the Paperwork
Reduction Act of 1995. Therefore, FDA has also estimated the burden associated with
this collection of information in sections V.D. and VI of this document.
II. Costs and Benefits of Regulatory Options: Detailed Analysis
This section describes the costs and benefits for the proposed rule and the
regulatory options.
A. Baseline for the purpose of analysis – No new federal regulatory action
17
Imposing no new federal nutrition labeling requirements for restaurant or
restaurant-type foods is the baseline in our analysis. Section 4205 requires that FDA
issue menu labeling regulations, so this is not a legally viable option. However, OMB
Circular A-4 recommends discussing statutory requirements that affect the selection of
regulatory approaches. These guidelines also recommend analyzing the opportunity costs
of legal constraints that prevent the selection of the regulatory action that best satisfies
the philosophy and principles of Executive Order 12866. All options will be measured for
assessing costs and benefits against this baseline. Before the enactment of the Affordable
Care Act, some restaurants and similar retail food establishments were subject to State
and local menu labeling laws. Further, many restaurant and similar retail food
establishment chains had to deal with an increasing number of different nutrition
disclosure requirements because their establishments were not all located in the same
jurisdiction. Because of different requirements among jurisdictions, these establishments
needed to develop and track multiple approaches for disclosing nutrition information in
order to meet each jurisdiction’s requirements. Consequently, the potential cost to
industry in the absence of this new federal regulatory policy (legislation and FDA
regulation combined) could have been several times the cost of the proposed rule, which
proposes national uniform requirements.
FDA cannot predict the number of regulations that the industry would have had to
comply with if the Affordable Care Act had not been enacted. Therefore FDA is unable
to estimate the total cost and benefit for the baseline. Instead, we take a conservative
approach by counting only those costs that would have been incurred by covered under
18
State and local laws that would have been in effect if the Affordable Care Act had not
been enacted, and that would be applicable to meeting the proposed requirements.
Although these State and local menu labeling laws differed, all imposed
requirements on stand-alone full-and-limited-service eating places. Using data from
2007 County Business Patterns, (Ref. 2), FDA estimates that approximately 27 percent of
chain retail food establishments would have been in jurisdictions with State and local
nutrition labeling laws if the Affordable Care Act had not been enacted. These
establishments would have had to acquire nutrition analysis for their menu items and
train employees. In order to account for these baseline costs, 27 percent of the nutrition
analysis costs and employee training costs have been subtracted from the costs incurred
by full and limited service eating places as calculated in the analysis of the options.
Chain retail food establishments that were subject to pre-existing State or local
laws will likely need to redesign and replace some of their menus and menu boards to
comply with the proposed requirements. The expenses that these establishments incurred
to comply with State and local laws will not reduce the cost of complying with the
proposed requirements because the proposed requirements differ from the State and local
laws.
B. Option 1, the Proposed Rule
Under this, and all other options, FDA proposes that covered establishments are
required to disclose in a clear and conspicuous manner:
a. on menus and menu boards: (1) the number of calories for each standard menu
item; (2) a succinct statement concerning daily caloric intake; and (3) a statement
indicating that additional nutrition information is available upon request;
19
b. in a written form, available on the premises of the establishment, and to the
consumer upon request, additional nutrition information for standard menu items; and
c. for standard menu items that are food on display or for self-service, the number
of calories contained in each item or per serving.
The proposed rule specifies how restaurants and similar retail food establishments
not subject to the requirements of section 4205 can voluntarily register with FDA to
become subject to the Federal requirements. The primary benefit for restaurants and
similar retail food establishments that voluntarily register with FDA is the preemption of
State and local nutrition labeling laws that are not identical to the Federal requirements.
By registering, a restaurant or similar retail food establishment need only comply with the
Federal requirements, and any identical State or local requirements. Costs borne by
restaurants and similar retail food establishments that voluntarily register to be subject to
section 4205 will be lower than the costs of complying with preempted State and local
laws because otherwise no firm would voluntarily do so. Therefore, the registration is
taken to have positive net benefit. To the extent that these establishments register, the
estimates presented here may underestimate the total net benefit of the proposed rule.
We note that although voluntary registration under section 4205 has been
available to restaurants and similar retail food establishments that are not subject to the
requirements of section 4205 since July 23, 2010; as of March 7, 2011, no firms have
attempted to register with FDA. Note that implementation of the proposed requirements,
and the resulting attention to the calorie content of restaurant and restaurant-type foods,
may give non-covered establishments an incentive to voluntarily disclose calorie and
other nutrition information. However, this incentive does not imply that establishments
20
would voluntarily restrict their options for disclosure by registering under the proposed
requirements.
Finally, the proposed rule tentatively sets an effective date of six months after the
publication of the final rule. Option 4 analyzes the benefits and costs under a three-
month effective date and Option 5 analyzes the benefits and costs under a 12 month
effective date. A shorter timeframe will primarily impact the costs of updating or
replacing menus and menu boards.
The proposed rule covers chain retail food establishments and other restaurants
and similar retail food establishments that voluntarily register with FDA to become
subject to the Federal requirements. A “restaurant or similar retail food establishment” is
defined in the proposed rule as an establishment that offers for sale restaurant or
restaurant-type food whose primary business activity is the sale of food.
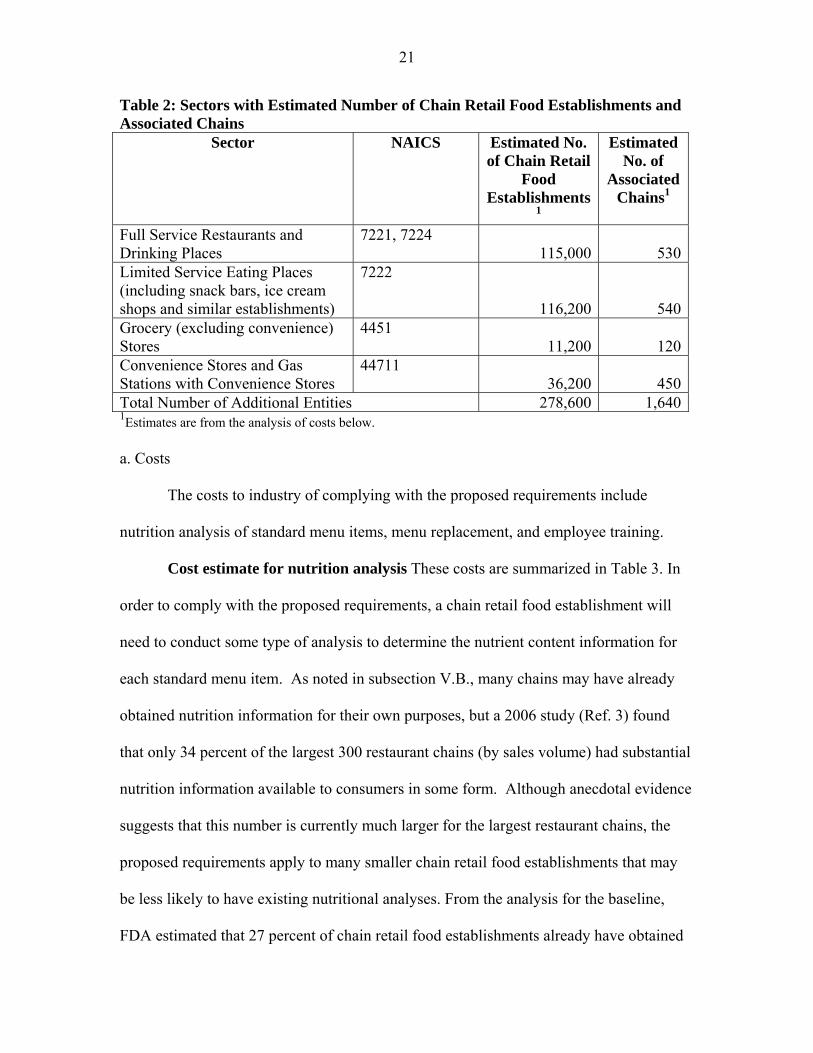
For the purposes of this analysis, the universe of chain retail food establishments
as defined in the proposed rule is drawn from the industry sectors listed in Table 2 as
classified by the North American Industry Classification System (NAICS) (Ref. 27),
including eating and drinking places such as full- and limited-service restaurants, snack
bars (including, for example, ice cream, donut, and bagel shops and similar
establishments), cafeterias and drinking places.1,2 Chain retail food establishments may
also include some grocery stores and convenience stores.
� 1 “[NAICS] is the standard used by Federal statistical agencies in classifying business establishments for the purpose of collecting, analyzing, and publishing statistical data related to the U.S. business economy.” (Ref. 28) Note that businesses self-report their sector. 2 This list is not definitive in any legal sense. Its creation and use is in fulfilling the requirements for estimating the benefits and costs of the proposed rule. As such, some covered establishments may be in sectors not listed below, and many establishments in the listed sectors are not covered, because they do not meet the conditions of Section 4205 and the proposed rule.
21
Table 2: Sectors with Estimated Number of Chain Retail Food Establishments and Associated Chains
Sector NAICS Estimated No. of Chain Retail
Food Establishments
1
Estimated No. of
Associated Chains1
Full Service Restaurants and Drinking Places
7221, 7224 115,000 530
Limited Service Eating Places (including snack bars, ice cream shops and similar establishments)
7222
116,200 540Grocery (excluding convenience) Stores
4451 11,200 120
Convenience Stores and Gas Stations with Convenience Stores
44711 36,200 450
Total Number of Additional Entities 278,600 1,6401Estimates are from the analysis of costs below.
a. Costs
The costs to industry of complying with the proposed requirements include
nutrition analysis of standard menu items, menu replacement, and employee training.
Cost estimate for nutrition analysis These costs are summarized in Table 3. In
order to comply with the proposed requirements, a chain retail food establishment will
need to conduct some type of analysis to determine the nutrient content information for
each standard menu item. As noted in subsection V.B., many chains may have already
obtained nutrition information for their own purposes, but a 2006 study (Ref. 3) found
that only 34 percent of the largest 300 restaurant chains (by sales volume) had substantial
nutrition information available to consumers in some form. Although anecdotal evidence
suggests that this number is currently much larger for the largest restaurant chains, the
proposed requirements apply to many smaller chain retail food establishments that may
be less likely to have existing nutritional analyses. From the analysis for the baseline,
FDA estimated that 27 percent of chain retail food establishments already have obtained
22
nutrition analysis in order to comply with State and local laws that were in effect before
the enactment of the Affordable Care Act. Therefore, we take the remaining fraction of
the chain retail food establishments (73 percent) and combine it with the fraction of
chains with nutrition information prior to the enactment of the Affordable Care Act or
State and local menu labeling rules (66 percent is (100%-34%), or the fraction of
restaurant chains that already had nutrition information), to get the fraction of restaurant
chains that will need new analyses under the proposed rule: 0.48 (0.73 x 0.66). Note that
because of their more expansive geographic coverage, larger chains are more likely to be
part of the 27 percent than smaller ones. To the extent that larger chains were also more
(or less) likely to have had nutrition information available prior to the enactment of the
Affordable Care Act or State and local menu labeling rules than smaller chains, this
estimate may be too low (or too high). FDA requests comment on this estimate.
In practice, many food items are manufactured elsewhere and are delivered as
complete products (both packaged and unpackaged) – for example, sodas or completed
food items from food service distributers – and may thus have nutrition information
already available. Because FDA does not have data on how many products are currently
shipped with nutrition information to chain retail food establishments, we conservatively
estimate costs given that each standard menu item will need analysis. Nutrition analyses
for standard menu items with multiple sizes will also be cheaper on a per-item basis
because the analyses can be adjusted proportionally up or down based on the size
difference; therefore, we estimate the cost of nutrition analysis based on the number of
unique items on the menu.
23
Cost estimates for nutrition analyses vary widely: by complexity of the item,
sophistication and accuracy of the analysis, detail of the nutrition report, and by whether
the analysis is based on existing databases or on item-specific laboratory testing. FDA’s
2003 Labeling Cost Model reports a cost for full NLEA lab analyses of $560 (Ref. 29).
This is higher than the price, $495 per item, quoted for a lab analysis in fall 2010 (Ref.
30). Lab testing typically requires the shipment of between 10 and 12 replicates of the
item to be tested. At an average food and preparation cost of $5 per item, and an average
of 11 replicates sent, the food cost would be $55 ($5/replicate x 11 replicates) per menu
item tested.3 We estimate the cost of packing and cold shipping to be approximately
$100/menu item.
Database nutrition analysis services quote prices as low as $25 per item, going up
to $100 per item for more complicated items (Ref. 32). At least one service offers flat
rates of $49 for ten items where the purchaser enters the recipe into a calculator (Ref. 33).
A senior dietician or nutritionist earns $35.91/hour (Ref. 34). Taking into account 50
percent overhead costs, the wage cost to a firm of one hour to enter a recipe is
approximately $54. The total cost per item at this website would be approximately $59
per item (lower with high volume discounts).
Based on data from FDA’s Recordkeeping Cost Model (Ref. 35), we estimate
approximately 4 hours in time burden per standard menu item for creating and
administering the record of nutrition analysis. Again using the hourly wage plus
overhead for dietitians and nutritionists of $54/hour, we estimate the costs for
� 3 Average price (excluding tax and tip) for a meal is approximately $8 (Ref. 63). Using a 60 percent markup, food costs are approximately $5. This may be an overestimate given that meals are comprised of individual food items.
24
administering the records of menu item nutritional analysis to be $216 per item (4
hours/item x $54/hour).
The per-item estimated cost of nutrition analysis ranges from $275 per item ($59
database +$216 administrative cost) to $866/item ($495 lab work+$216 administrative
cost +$100 shipping+$55 food cost), with a mean estimate of $571 per item.
Restaurants For purposes of this analysis, we are using the term “restaurant” to
mean those establishments that self-identify as establishments whose primary business
activity is the sale of “meals and beverages for immediate consumption” in economic
census surveys, some of which will be chain retail food establishments, as that term is
used in this document. The category of restaurants includes full and limited service eating
places that have traditionally been thought of as restaurants in that they primarily serve
meals and have seating, although they may also have, or be, drive-through or takeout
operations. This category also includes establishments serving more limited restaurant or
restaurant-type food, such as ice cream or donut shops, coffee bars, and drinking
establishments. All of these establishments are defined by the U.S. Census Bureau as
belonging under NAICS 7221, 7222 and 7224. FDA estimates that there are 1,070 chains
that will need to comply with the proposed requirements, if finalized as proposed (Ref.
36). These establishments serve as the basis in this analysis for the actual “restaurants and
similar retail food establishments” that will be covered by the proposed requirements if
finalized as proposed.
The 600 largest restaurant chains (by sales) have an average of 80 unique menu
items, excluding alcoholic beverages (Ref. 37). If this average holds for all restaurant
establishments that are subject to the proposed requirements, the average per chain cost
25
of analysis ranges from $22,000 ($275/item x 80 items) to $69,300 ($866/item x 80
items), with a mean estimate of $45,600. As noted earlier in the analysis, of 1,070
restaurant chains, we estimate that only 48 percent, or 514, will need nutritional analyses
because the rest will have already acquired this information. The estimated costs of
analysis for restaurant chains range from a low of $11.3 million (514 chains x
$22,000/chain) to a high of $35.6 million (514 chains x $69,300/chain), with a mean
estimate of $23.5 million. Again, the variation depends on how heavily the chains rely
on database analysis versus laboratory testing.
In addition to nutrition analysis by restaurant chains, individual firms that make
up these chains may need to acquire analyses for standard menu items that are subject to
the proposed requirements but are specific to certain establishments, and thus not dealt
with at the chain level. FDA lacks data both on the number of firms and the number of
standard menu items each of these firms would need to analyze. If the number of firms is
represented by between 0 and 10 percent of the total number of chain restaurant
establishments, then between 0 and 23,100 (231,200 establishments x .1) additional firms
would need nutrition analysis. Because these firms are likely to have fewer resources than
the larger chains, FDA expects these firms to use the less expensive database nutrition
analyses, at an estimated cost of $275 per item. If each of these firms needed analysis for
an average of 5 menu items then the cost of these additional nutrition analyses would be
between $0 and $31.8 million (23,100 firms x 5 items/firm x $275/item), with a mean of
$15.9 million. FDA requests data and comment on these estimates.
Grocery and convenience stores FDA estimates that there are approximately
120 grocery chains with 20 or more establishments, accounting for approximately 31,000
26
establishments (Ref. 38 and 39). Not all of these stores sell restaurant or restaurant-type
food. The Census Bureau’s 2007 Economic Census data reports that 36 percent of total
establishments report sales of “meals or beverages for immediate consumption.”
Applying this proportion to all establishments that are part of chains of 20 or more, FDA
estimates that approximately 36 percent of grocery store establishments, or 11,200
(31,000 establishments x 0.36), would be considered chain retail food establishments
under this option, and therefore would be subject to the proposed requirements under this
option. Note that this estimate is limited to those establishments serving restaurant or
restaurant-type food. All grocery stores are expected to meet the criterion of greater than
50 percent of floor space devoted to food.
Based on firm counts from the 2007 Economic Census, FDA estimates that there
are approximately 450 convenience store chains with 20 or more establishments,
accounting for approximately 60,000 convenience stores (Refs. 40 and 41). Again using
the proportion of total establishments reporting sales of “meals or beverages for
immediate consumption” from 2007 Economic Census data on convenience stores, FDA
estimates that 60 percent, or 36,200 convenience stores, would be defined as chain retail
food establishments under this option. . Again, this estimate is limited to those
establishments serving restaurant or restaurant-type food. Most if not all convenience
stores are expected to meet the criterion of greater than 50 percent of floor space devoted
to food.
27
Taken together, there would be 47,400 grocery and convenience stores that would
need to comply with the proposed requirements, and 570 chains that are made up of these
establishments.
Because of the more limited offerings for restaurant or restaurant-type foods at
grocery and convenience stores, FDA estimates that these establishments have, on
average, approximately one half the number of menu items of an average restaurant, or
40 menu items. FDA requests comment on this estimate. The per item costs, multiplied
by the number of items per chain, yield average costs of nutrition analysis per grocery or
convenience store chain of between $11,000 ($275/item x 40 items/chain) and $34,600
($866/item x 40 items/chain), with a mean estimate of $22,800 per chain. Because
nutrition analysis for restaurant or restaurant-type food generally is less common for
grocery and convenience store chains, we calculate the total nutrition analysis costs for
grocery and convenience store chains for all 570 chains. The estimated cost of nutrition
analysis for grocery and convenience store chains ranges from $6.3 million (570 chains x
$11,000/chain) to $19.8 million (570 chains x $34,600/chain), with a mean estimate of
$13.0 million.
Individual firms that make up these chains may need to acquire analysis for
standard menu items that are subject to the proposed requirements, but are specific to
their establishments, and thus not dealt with at the chain level. FDA lacks data both on
the number of firms and the number of standard menu items each of these firms would
need to analyze. If the number of firms can be represented by between 0 and 10 percent
of the total number of chain grocery and convenience store establishments, then between
0 and 4,700 additional firms would need nutrition analysis. If each of these firms needed
28
analysis for an average of 5 menu items, then the cost of these additional nutrition
analyses would add between $0 and $6.5 million (4,700 firms x 5 items/firm x $275/item)
to the cost of nutrition analysis, with a mean of $3.3 million. FDA requests data and
comment on these estimates.
In total, the initial costs of nutrition analysis for restaurants and similar retail food
establishments are estimated as between $17.6 million and $93.7 million, with a mean
estimate of $55.7 million.
Recurring Costs From Mintel Menu Insights data, FDA estimates that restaurant
chains introduced, on average, 24 new menu items in 2009 (Ref. 42). Because the
proposed requirements do not apply to temporary menu items, daily specials, and foods
that are part of a customary market test, only a fraction of these items would need
nutrition analysis. FDA requests comment and data on the number of new and reformulated
items that would require nutrition analysis under the proposed requirements.
FDA tentatively estimates that existing restaurant chains or establishments would
need new nutrition analysis on between 0 and 50 percent, for an average of 25 percent, of
new standard menu items, or 6 items per year. If in addition to these new standard menu
items, chains need nutrition analysis on 6 reformulated standard menu items, then there
would be a total of 12 nutrition analyses per chain needed on an annual basis. With an
estimated total of 1,070 chains associated with establishments that could be subject to the
proposed requirements, the annually recurring costs of nutrition analysis for restaurant
chains would be $3.5 million (1,070 chains x 12 items/chain x $275/item) to $11.1
million (1,070 chains x 12 items/chain x $866/item), with a mean estimate of $7.3
million. Based on growth of the number of establishments in the limited and full service
eating place sectors from U.S. 2000-2008 County Business Patterns data, FDA estimates
29
that the number of chains with establishments that would be newly subject to the
proposed requirements would be approximately 2 percent per year (Ref. 2).4 Given this
growth rate, there would be an estimated 20 new restaurant chains (1,070 chains x .02)
with establishments that would be subject to the proposed requirements every year. If
each new chain has an average of 80 standard menu items, then the recurring costs
associated with these new chain retail food establishments is between $0.4 million (20
chains x 80 items/chain x $275/item) and $1.4 million (20 chains x 80 items/chain x
$866/item), with a mean of $0.9 million each year.
Using the same estimate as for restaurants of 12 new standard menu items per
year, FDA estimates that the 570 additional grocery and convenience store chains would
have annually recurring costs of nutrition analysis would be of between $1.9 million (570
chains x 12 items/chain x $275/item) to $5.9 million (570 chains x 12 items/chain x
$866/item), with a mean estimate of $3.9 million.
Based on growth in the covered sectors from U.S. 2000-2008 County Business
Patterns data (Ref. 2), FDA estimates that the number of chains with establishments that
would be subject to the proposed requirements would grow by approximately 2 percent
per year. Given this growth rate, there would be an estimated 10 new chains (570 chains
x .02) with establishments that would be subject to the proposed requirements every year.
If each new chain has an average of 40 standard menu items, then the recurring costs
associated with these new chain retail food establishments is between $0.1 million (10
chains x 40 items/chain x $275/item) and $0.3 million (10 chains x 40 items/chain x
$866/item), with a mean of $0.2 million each year.
� 4 Note that any firms that lost establishments, and thus were no longer subject to the proposed requirements would not be able to recoup the costs already incurred.
30
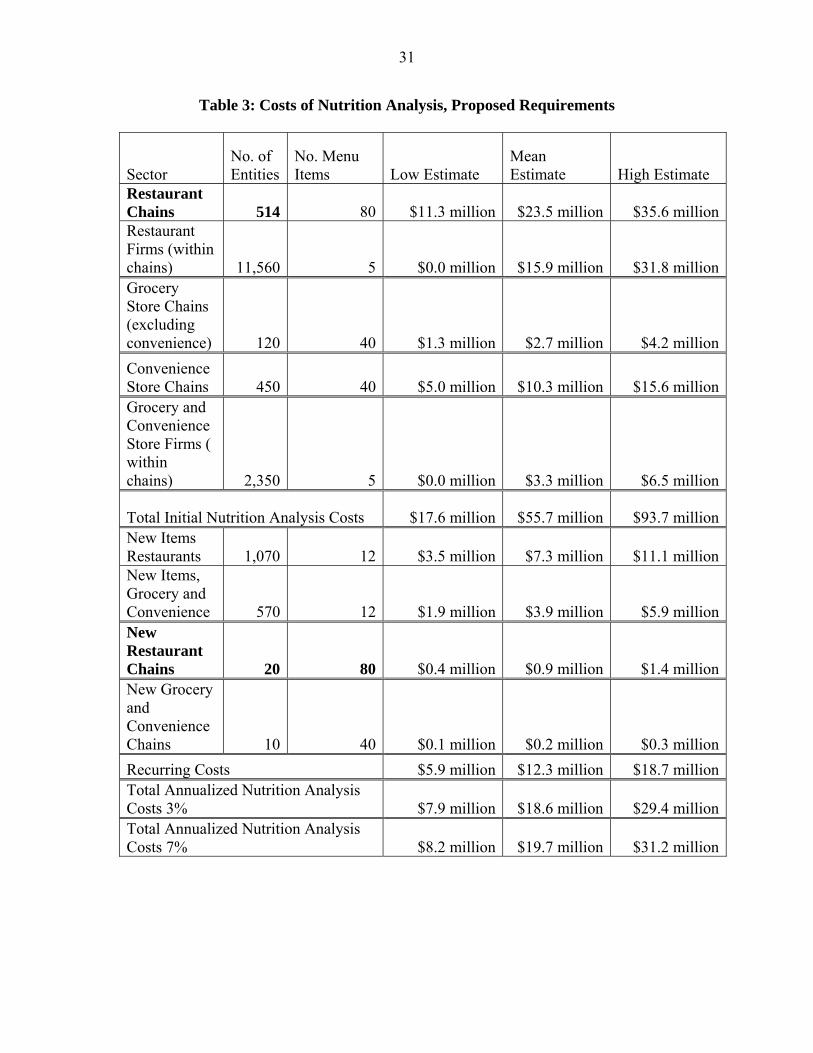
Including the costs to restaurants, total recurring nutrition analysis costs for the
proposed rule are between $5.9 million and $18.7 million, with a mean estimate of $12.3
million.
Annualized Costs Annualized costs are calculated by adding the recurring costs
to the initial costs annualized over 10 years at 3 percent and 7 percent discount rates.
Using the 3 percent discount rate over 10 years yields an annualizing factor of 8.79 and
using 7 percent yields an annualizing factor of 7.52.5 With a 3 percent discount rate, the
annualized mean cost of nutrition analysis is estimated to be $18.6 million ($12.3 million
+ $55.7 million/8.79), or between $7.9 million and $29.4 million. With a 7 percent
discount rate, the annualized mean cost of nutrition analysis is estimated to be $19.7
million ($12.3 million + $55.7 million/7.52), or between $8.2 million and $31.2 million.
� 5 The annualizing factors are calculated by summing the inverse of 1 plus the discount rate to the power of
the year. In mathematical notation this is:
9
0 )1(1
t r t where t is the year from zero to 9 and r is the
discount rate, either 3 or 7.
31
Table 3: Costs of Nutrition Analysis, Proposed Requirements
Sector No. of Entities
No. Menu Items Low Estimate
Mean Estimate High Estimate
Restaurant Chains 514 80 $11.3 million $23.5 million $35.6 millionRestaurant Firms (within chains) 11,560 5 $0.0 million $15.9 million $31.8 millionGrocery Store Chains (excluding convenience) 120 40 $1.3 million $2.7 million $4.2 million
Convenience Store Chains 450 40 $5.0 million $10.3 million $15.6 millionGrocery and Convenience Store Firms ( within chains) 2,350 5 $0.0 million $3.3 million $6.5 million
Total Initial Nutrition Analysis Costs $17.6 million $55.7 million $93.7 millionNew Items Restaurants 1,070 12 $3.5 million $7.3 million $11.1 millionNew Items, Grocery and Convenience 570 12 $1.9 million $3.9 million $5.9 millionNew Restaurant Chains 20 80 $0.4 million $0.9 million $1.4 millionNew Grocery and Convenience Chains 10 40 $0.1 million $0.2 million $0.3 million
Recurring Costs $5.9 million $12.3 million $18.7 millionTotal Annualized Nutrition Analysis Costs 3% $7.9 million $18.6 million $29.4 millionTotal Annualized Nutrition Analysis Costs 7% $8.2 million $19.7 million $31.2 million
32
Menu Replacement Costs Menu replacement costs are summarized in Table 4.
Chain retail food establishments will need to redesign and replace their existing menus
and menu boards in order to comply with the proposed requirements. For full service
restaurants and drinking places with only personal menus and no menu boards, this cost
will be relatively low. Most menus are replaced frequently as they wear out, are lost, or
as prices and menu items change. For many of these establishments, the cost of updating
menus to comply with the proposed requirements would be limited to design and
associated administrative burdens. However, some establishments have more durable
menus, and longer menu design cycles. These firms would need to discard and replace
their menus.
Because of the longer lifespan of menu boards, limited-service eating places
would likely need both menu/menu board redesign and replacement of one or more menu
boards. In addition, some chains would need to update self-serve and display signs.
Because of the wide variation in styles of menu and economies of scale, reprint
costs can run from pennies to several dollars per menu. Based on published printing
costs, FDA estimates the range of average materials and printing costs to be between $1
and $3 per copy, with some individual chains spending much less and others much more.
The number of menus that an establishment will keep on hand is also highly variable. A
full-service restaurant, where each order is placed using a menu, will need more than a
quick-service establishment that uses menus just for takeout orders. The number of
menus is also tied to the seating capacity of the restaurant, and whether the menu is
laminated or paper. Because paper menus are more fragile and cheaper to print in bulk,
33
an establishment may keep a large reserve in stock, whereas establishments using more
durable and expensive laminated menus may only keep a few extra on hand.
Estimates for the cost of updating menu boards, other major displays that serve as
menus – such as electronic displays – or major materials needed to disclose calories for
self-serve or displayed foods to comply with the proposed requirements will vary widely
across chains and establishments because of different menu board and display types.
Although FDA has no data on the costs of menu board design per se, FDA’s Labeling
Cost Model uses design and administrative costs ranging from $2,250 to $4,690 per label
(updated using the latest, 2009 GDP deflator) (Ref. 29). Costs of new menu boards or
other major displays may range from $100 to $1,000 per menu board or major display
depending on the materials, size and format (Ref. 43). FDA estimates that the in-store
labor needed to change out menu boards or other major displays will be one hour for
managers and one hour for staff-level employees. Establishments that are part of larger
chains with more displays and more sophisticated ordering technology estimate that the
cost may range between $1,500 and $2,500 per establishment; this estimate is in line with
FDA’s high estimate of per establishment costs (Ref. 44).
Restaurants Of the 1,070 restaurant chains with 20 or more establishments, FDA
estimates that 420 are limited-service restaurants that have menu boards, with a total of
91,000 chain retail food establishments. If each of these establishments has, on average,
3 menu boards or major displays, for example a main menu board, a drive-through board
and self-service displays, then the cost of replacing menu boards to comply with the
proposed requirements will be between $410 (3 boards x ($100/board equip + $36/board
labor)) and $3,110 (3 boards x ($1000/board equip + $36/board labor)) per
34
establishment, with an average cost of $1,760. The estimated cost for replacing limited
service restaurant menu boards is between $37.3 million (91,000 establishments x
$410/establishments) and $283.0 million (91,000 establishments x
$3,110/establishments), with a mean estimated cost of $160.2 million. Each of these
chains will also need to redesign their menus and menu boards, at an estimated cost of
between $0.9 million (420 chains x $2,251/chain and $2.0 million (420 chains x
$4,695/chain). FDA estimates that the total cost to limited-service restaurants is between
$38.3 million and $285 million.
In addition to limited-service restaurants, FDA estimates that there are
approximately 25,200 snack bars and cafeteria establishments from 120 chains that would
need to replace menu boards under the proposed requirements. If each of these
establishments has, on average, 1 menu board or major display, then the cost of replacing
a menu board to comply with the proposed requirements will be between $140 (1 board x
($100/board equip + $36/board labor)) and $1,040 (1 board x ($1000/board equip +
$36/board labor)) per establishment, with an average cost of $590. The estimated cost for
replacing snack bar and cafeteria menu boards is between $3.5 million (25,200
establishments x $140/establishment) and $26.2 million (25,200 establishments x
$1,040/establishment), with a mean estimated cost of $14.9 million. Each of these chains
will also need to redesign their menus and menu boards, at an estimated cost of between
$0.3 million (120 chains x $2,251/chain and $0.6 million (120 chains x $4,695/chain).
The total cost to snack bars and cafeterias is estimated to be between $3.8 million and
$26.8 million, with a mean estimate of $15.3 million. Total estimated costs for all limited
35
service eating places are between $42.1 million and $311.8 million, with a mean estimate
of $176.9 million.
FDA estimates that 90 chains made up of drinking establishments that are chain
retail food establishments would need to redesign their menus, at an estimated cost of
between $0.2 million (90 chains x $2,251/chain and $0.4 million (90 chains x
$4,695/chain) with a mean estimate of $0.3 million. FDA estimates that 440 chains of full
service restaurants would also need to redesign their menus, at an estimated cost of
between $1.0 million (440 chains x $2,251/chain and $2.1 million (440 chains x
$4,695/chain).
FDA lacks data on the distribution of menu durability across the affected sectors.
However, if between 0 and 50 percent of full service restaurants need to discard and
replace existing menus before the end of their normal lifespan, then between 0 and
47,800 full-service restaurant establishments (95,500 establishments x 50%) would need
new menus under the proposed requirements. We focus on full-service restaurants here
because they have relatively durable menus. Based on U.S. 2007 Economic Census data,
there is an average of 81 seats per establishment for full-service restaurants (Ref. 45). If
the average full-service restaurant establishment must discard and reprint one menu for
each seat, plus 10 extra, for a total of 91 menus per establishment, then the estimated cost
of menu replacement for these restaurants is between $0 and $13.0 million (47,800
establishments x 91 menus/establishment x $3/menu) with a mean estimate of $4.3
million (23,900 establishments x 91 menus/establishment x $2/menu). The total cost to
full-service restaurants is estimated to be between $1.0 million and $15.1 million, with a
mean estimate of $8.0 million. Total estimated costs for full-service restaurants and
36
drinking places are estimated to be between $1.2 million and $15.5 million, with a mean
estimate of $6.1 million
Grocery and convenience stores FDA estimates that grocery and convenience
stores will have an average of one menu board per establishment. With approximately
570 chains that would include 47,400 chain retail food establishments under this option,
the cost of redesigning and replacing menu boards at these stores is between $7.9 million
(47,400 establishments x $140/establishment + 570 chains x $2,250/chain) and $52.0
million (47,400 establishments x $1,040/estab + 570 chains x $4,690/chain), with a mean
estimate of $29.9 million.
The total estimated costs to restaurants and similar retail food establishments for
updating menus and menu boards to comply with the proposed requirements are between
$51.2 and $379.3 million, with a mean of $212.9 million.
Recurring Costs Recurring changes to menus or menu boards will be tied to new
or reformulated standard menu items. In general, these changes will require menu
updates independent of the proposed requirements. Therefore, there are no recurring costs
specific to new standard menu items.
All chain retail food establishments will need to provide additional written
nutrition information. This analysis estimates that there are 278,600 chain retail food
establishments under the proposed requirements. If, in complying with the requirement of
additional written nutrition information each of these establishments distributed between
10 and 50 written nutrition information documents per month, on average, then the yearly
recurring number would be between 33.4 million and 167.1 million documents. At an
37
estimated cost of $0.20 per document, the yearly cost would be between $0.7 million and
$3.4 million, with a mean cost of $2.1 million.
The estimated recurring costs for chains that expand to include 20 or more
locations and, as a result, have establishments that become subject to the proposed
requirements, will be between $0.2 million and $1.0 million, with a mean of $0.6 million.
This figure uses the estimate of 30 additional chains with establishments that would
become subject to the proposed requirements from Table 3 with 20 establishments each,
for a total of 600 new chain retail food establishments. Multiplying the number of new
chains by the average costs per establishment – $190 to $1,420 (mean, $800) – yields the
range of recurring costs. The menu design costs for these newly covered establishments
would add an additional $0.1 million to each of the low, mean and high estimated costs.
Annualized costs Annualized costs are calculated by adding the recurring costs to
the initial costs annualized over 10 years at 3 percent and 7 percent discount rates. Using
the 3 percent discount rate over 10 years yields an annualizing factor of 8.79 and using 7
percent yields an annualizing factor of 7.52 as noted in the section on nutrition analysis.
With a 3 percent discount rate, the annualized mean cost of menu and menu board
updates is estimated to be $26.9 million ($2.5 million + $212.9 million/8.79), or between
$6.7 million and $47.5 million. With a 7 percent discount rate, the annualized mean cost
of menu and menu board updates is estimated to be $31.0 million ($2.5 million + $212.9
million/7.52), or between $7.7 million and $54.8 million.
38
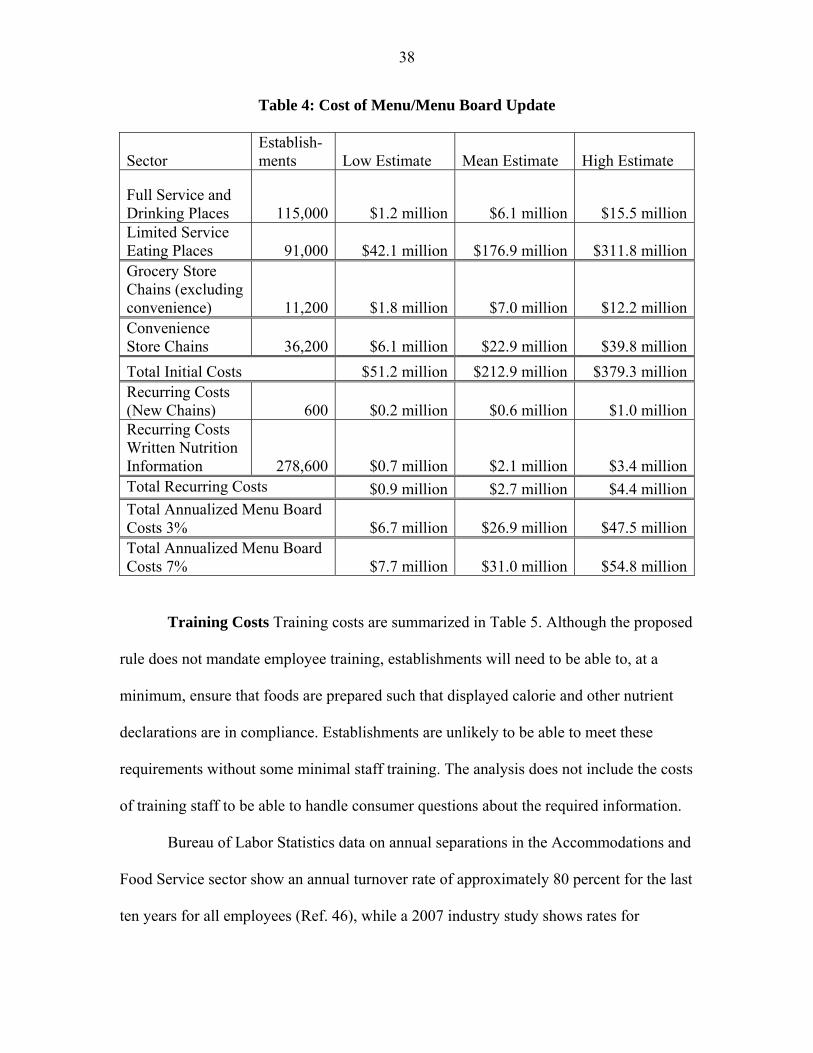
Table 4: Cost of Menu/Menu Board Update
Sector Establish-ments Low Estimate Mean Estimate High Estimate
Full Service and Drinking Places 115,000 $1.2 million $6.1 million $15.5 millionLimited Service Eating Places 91,000 $42.1 million $176.9 million $311.8 millionGrocery Store Chains (excluding convenience) 11,200 $1.8 million $7.0 million $12.2 millionConvenience Store Chains 36,200 $6.1 million $22.9 million $39.8 million
Total Initial Costs $51.2 million $212.9 million $379.3 millionRecurring Costs (New Chains) 600 $0.2 million $0.6 million $1.0 millionRecurring Costs Written Nutrition Information 278,600 $0.7 million $2.1 million $3.4 millionTotal Recurring Costs $0.9 million $2.7 million $4.4 millionTotal Annualized Menu Board Costs 3% $6.7 million $26.9 million $47.5 millionTotal Annualized Menu Board Costs 7% $7.7 million $31.0 million $54.8 million
Training Costs Training costs are summarized in Table 5. Although the proposed
rule does not mandate employee training, establishments will need to be able to, at a
minimum, ensure that foods are prepared such that displayed calorie and other nutrient
declarations are in compliance. Establishments are unlikely to be able to meet these
requirements without some minimal staff training. The analysis does not include the costs
of training staff to be able to handle consumer questions about the required information.
Bureau of Labor Statistics data on annual separations in the Accommodations and
Food Service sector show an annual turnover rate of approximately 80 percent for the last
ten years for all employees (Ref. 46), while a 2007 industry study shows rates for
39
restaurants of 105 percent for full service restaurants and 150 percent for quick service
restaurants (Ref. 47). Based on these turnover rates, and allowing for necessary updates
in training even for continuing employees, FDA estimates that 100 percent of employees
at the chain retail food establishments will need to be trained annually.
Although data on employee training are scarce, the high rate of turnover means
that, typically, formal training times are kept to a minimum. At least one large quick
service chain has a three hour formal training program for new employees (Ref. 48). If
the proposed rule increases formal training time by between 10 and 30 minutes, this
would be an increase of between 5 percent and 16 percent.6
In addition to staff-level training, FDA expects managers to need more intensive
training in order to be able to ensure compliance at the establishment level, and to acquire
the knowledge needed to train retail level employees. Although the Bureau of Labor
Statistics does not break out manager turnover by industry, one 2007 study found
manager turnover to be 40 percent for limited service restaurants and 26 percent for other
restaurants (Ref. 47). Allowing for retraining, FDA estimates that 50 percent of
foodservice managers at covered establishments will need training annually. FDA
expects managers to need an additional 4 to 8 hours of training based on the availability
and length of online nutrition training courses for food service professionals.
Restaurants In order to estimate the number of employees that are directly
involved with either the sale or the preparation of food subject to the proposed
requirements, we take Bureau of Labor Statistics estimates of the number of “Food
Preparation and Serving Related Occupations (SOC code 350000)” in that sector. This
� 6 Note that while additional training will need to occur on the job, this additional time cost should be offset by lower probationary period wages for beginning workers.
40
estimate excludes, for example, administrative and janitorial staff. There are 8.1 million
food service employees working in eating and drinking places, making an average wage
of $9.64 per hour (Ref. 49).7 With 50 percent overhead, the average hourly cost to the
establishment is $14.50. Based on the estimated fraction of restaurants and similar retail
food establishments that would be subject to the proposed requirements, 40 percent, there
are approximately 3.2 million food service employees at chain retail food establishments.
From the analysis for the pre-statute baseline, we estimated that 27 percent of these
establishments were subject to pre-existing State or local laws. Therefore, we take 73
percent of the 3.2 million employees to get 2.4 million employees. If each employee
receives between 10 and 30 extra minutes of training, then the formal employee training
costs for restaurants would be between $5.8 million (2.4 million x 1/6 hour x
$14.50/hour) and $17.4 million (2.4 million x 1/2 hour x $14.50/hour), with an average
cost of $11.6 million.
There are approximately 750,000 food service managers at eating and drinking
places (Refs. 50 and 51). Again using 40 percent fraction of chain restaurants and 76
percent not previously covered by other labeling regulations, FDA estimates that there
are approximately 220,000 food service managers that will need training. The average
cost, including overhead, for these managers is $25.50 per hour (Refs. 80 and 81). If each
manager needs four to eight hours of training, then the wage cost to the industry will be
between $22.4 million (220,000 x 4 hour x $$25.50/hour) and $44.9 million (220,000 x 8
hour x $25.50/hour), with an average cost of $33.7 million. In total, the training costs for
restaurants will be $28.2 million to $62.3 million, with a mean estimate of $45.3 million.
� 7 All estimates of number of employees and wages are drawn from Bureau of Labor Statistics data.
41
Grocery and convenience stores As with the analysis of restaurants, FDA
includes only those employees that are directly involved in the sale or preparation of
covered food. This is a small fraction of the total employees at grocery and convenience
stores. There are approximately 293,000 food service employees working in grocery
stores, at an average cost to the employer of $16 per hour. Based on the estimated
fraction of those establishments within these sectors that would be subject to the
proposed requirements under this option – approximately 18 percent – there are 52,000
food service employees at grocery establishments that would need training. If each
employee receives between 10 and 30 extra minutes of training, then the formal
employee training costs for grocery store establishments would be between $0.1 million
(52,000 x 1/6 hour x $16/hour) and $0.4 million (72,000 x 1/2 hour x $16/hour), with an
average cost of $0.3 million.
There are approximately 20,000 convenience store employees that would need
training at chain retail food establishments under this option. With an average cost to the
employer of $13 per hour, the formal employee training costs for convenience store
establishments would be between $0.04 million (20,000 x 1/6 hour x $13/hour) and $0.13
million (20,000 x 1/2 hour x $13/hour), with an average cost of $0.085 million.
Again using fractions of establishments given above, FDA estimates that there are
approximately 4,800 food service managers that will need training at grocery stores. The
average cost of these managers is $26 per hour. If each manager needs four to eight hours
of training, then the wage cost to the industry will be between $0.5 million (4,800 x 4
hour x $26/hour) and $1.0 million (4,800 x 8 hour x $26/hour), with an average cost of
$0.7 million. FDA estimates that there are approximately 1,200 food service managers
42
that will need training at convenience stores. The average cost of these managers is $22
per hour. If each manager needs four to eight hours of training, then the wage cost to the
industry will be between $0.1 million (1,200 x 4 hour x $22/hour) and $0.2 million
(1,200 x 8 hour x $22/hour), with an average cost of $0.16 million.
Training costs associated with grocery and convenience establishments would be
between $0.7 million and $1.7 million, with a mean added cost of $1.2 million. Added to
the initial costs of training for restaurants, the total estimated training costs under the
proposed rule are between $28.9 million and $64 million, with a mean estimate of $46.5
million.
Recurring Costs Given the estimated 100 percent turnover rate for restaurant
employees, general employee costs will recur annually. With the estimated 50 percent
turnover in managers, half of management training costs will recur annually. To the
extent that grocery and convenience store employees have higher retention rates, these
estimates may be too high. Training costs for employees of new chains are within
rounding margins for these estimates.
Annualized costs Because most of the initial costs are also recurring, the
annualized costs are calculated by adding the recurring costs to the difference between
initial and recurring costs annualized over 10 years at 3 percent and 7 percent discount
rates. Using the 3 percent discount rate over 10 years yields an annualizing factor of 8.79
and using 7 percent yields an annualizing factor of 7.52 as noted in the section on
nutrition analysis. With a 3 percent discount rate, the annualized mean cost of menu and
menu board updates is estimated to be $26.8 million ($2.4 million + $212.9 million/8.79),
or between $6.6 million and $47.4 million. With a 7 percent discount rate, the annualized
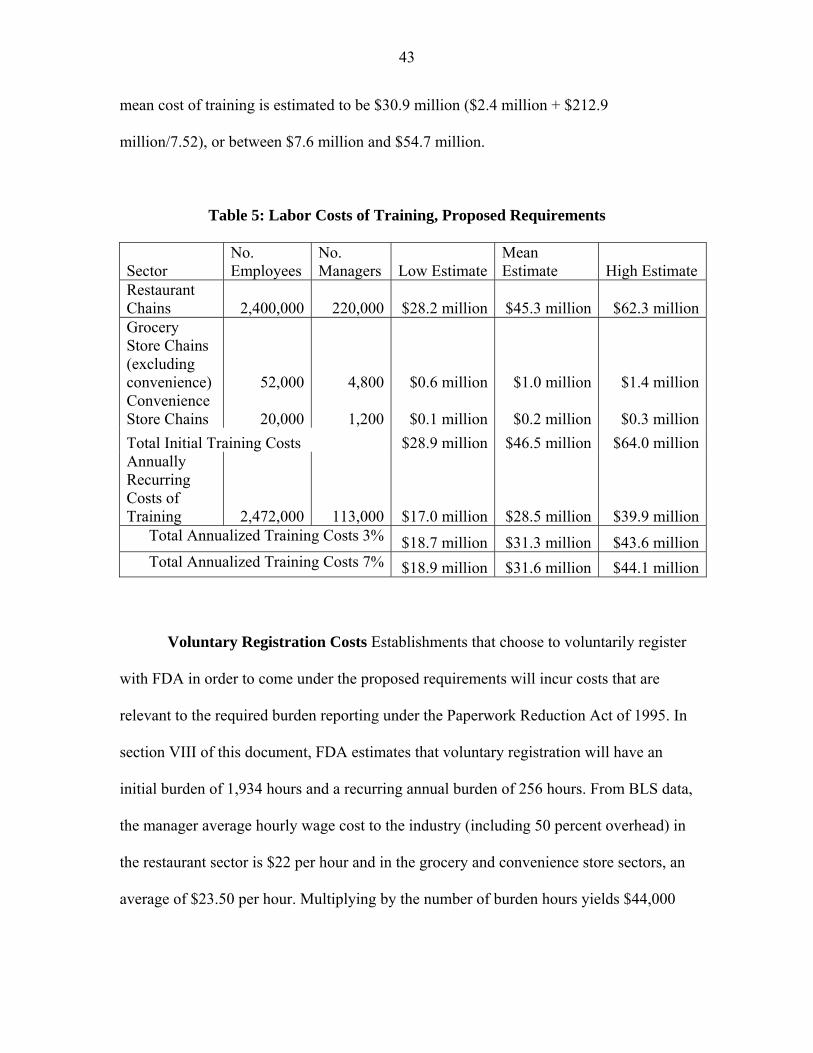
43
mean cost of training is estimated to be $30.9 million ($2.4 million + $212.9
million/7.52), or between $7.6 million and $54.7 million.
Table 5: Labor Costs of Training, Proposed Requirements
Sector No. Employees
No. Managers Low Estimate
Mean Estimate High Estimate
Restaurant Chains 2,400,000 220,000 $28.2 million $45.3 million $62.3 millionGrocery Store Chains (excluding convenience) 52,000 4,800 $0.6 million $1.0 million $1.4 millionConvenience Store Chains 20,000 1,200 $0.1 million $0.2 million $0.3 million
Total Initial Training Costs $28.9 million $46.5 million $64.0 millionAnnually Recurring Costs of Training 2,472,000 113,000 $17.0 million $28.5 million $39.9 million
Total Annualized Training Costs 3% $18.7 million $31.3 million $43.6 millionTotal Annualized Training Costs 7% $18.9 million $31.6 million $44.1 million
Voluntary Registration Costs Establishments that choose to voluntarily register
with FDA in order to come under the proposed requirements will incur costs that are
relevant to the required burden reporting under the Paperwork Reduction Act of 1995. In
section VIII of this document, FDA estimates that voluntary registration will have an
initial burden of 1,934 hours and a recurring annual burden of 256 hours. From BLS data,
the manager average hourly wage cost to the industry (including 50 percent overhead) in
the restaurant sector is $22 per hour and in the grocery and convenience store sectors, an
average of $23.50 per hour. Multiplying by the number of burden hours yields $44,000
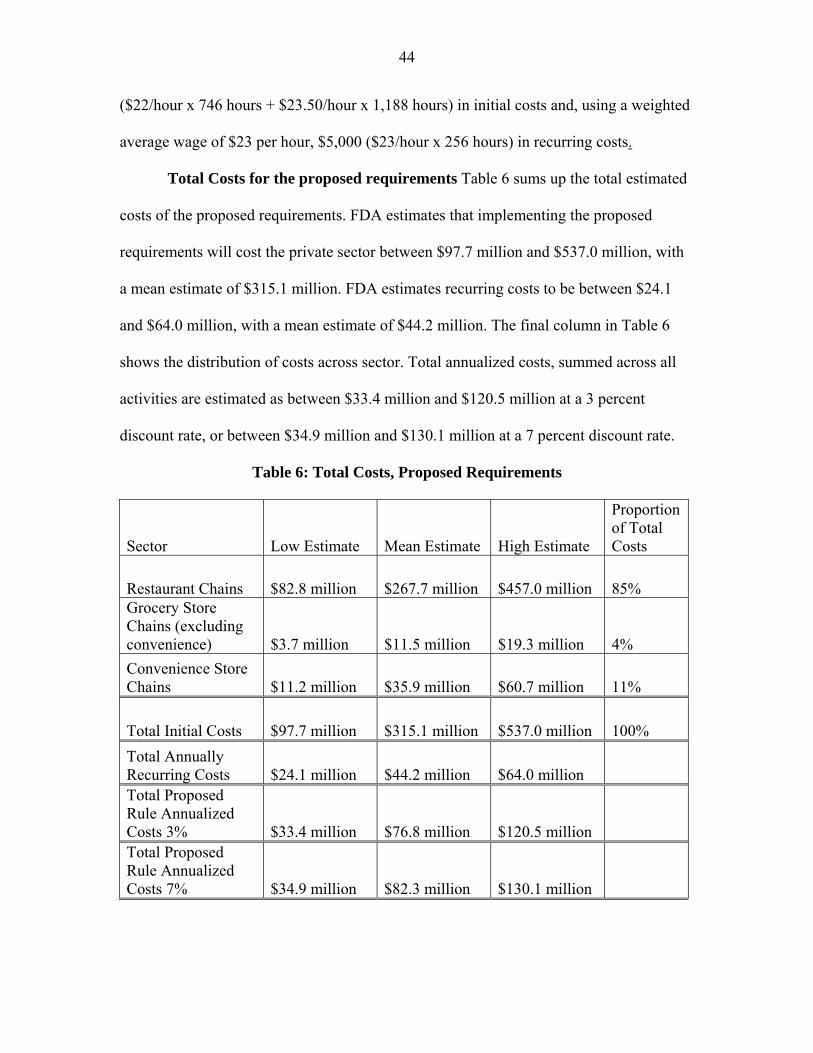
44
($22/hour x 746 hours + $23.50/hour x 1,188 hours) in initial costs and, using a weighted
average wage of $23 per hour, $5,000 ($23/hour x 256 hours) in recurring costs.
Total Costs for the proposed requirements Table 6 sums up the total estimated
costs of the proposed requirements. FDA estimates that implementing the proposed
requirements will cost the private sector between $97.7 million and $537.0 million, with
a mean estimate of $315.1 million. FDA estimates recurring costs to be between $24.1
and $64.0 million, with a mean estimate of $44.2 million. The final column in Table 6
shows the distribution of costs across sector. Total annualized costs, summed across all
activities are estimated as between $33.4 million and $120.5 million at a 3 percent
discount rate, or between $34.9 million and $130.1 million at a 7 percent discount rate.
Table 6: Total Costs, Proposed Requirements
Sector Low Estimate Mean Estimate High Estimate
Proportion of Total Costs
Restaurant Chains $82.8 million $267.7 million $457.0 million 85% Grocery Store Chains (excluding convenience) $3.7 million $11.5 million $19.3 million 4%
Convenience Store Chains $11.2 million $35.9 million $60.7 million 11%
Total Initial Costs $97.7 million $315.1 million $537.0 million 100%
Total Annually Recurring Costs $24.1 million $44.2 million $64.0 million Total Proposed Rule Annualized Costs 3% $33.4 million $76.8 million $120.5 million Total Proposed Rule Annualized Costs 7% $34.9 million $82.3 million $130.1 million
45
As noted, costs borne by restaurants and similar retail food establishments that
voluntarily register to be subject to section 4205 will be lower than the costs of
complying with preempted State and local laws because otherwise no firm would
voluntarily do so. Therefore, the registration is taken to have positive net benefit. To the
extent that these establishments register, the estimates presented here may underestimate
the total net benefit of the proposed rule. However, FDA estimates that registration will
create approximately 1,934 hours of burden for the registration process by voluntarily
registering entities and would cost less than $45,000.
b. Benefits
The potential benefit from the proposed rule stems from the effect that decreasing
the consumption of calories from restaurant and restaurant-type food has on mitigating
obesity rates and growth in the U.S. population. While survey data has shown that calorie
labeling increases the number of people who see, and claim to use, this information (Ref.
52), the literature has found mixed results on the effect of calorie posting on actual food
consumption. Bollinger and colleagues analyzed transaction data in a large number of
Starbucks stores for a period of time running from 3 months before until 11 months after
calorie posting commenced in New York City (Ref. 53). They found a 6 percent
decrease in calories consumed per transaction, and that the decrease resulted from a
decline in accompanying food purchases, rather than substitution towards lower calorie
beverages. Bassett and colleagues studied consumer food purchasing behavior and
calorie information availability at 275 randomly selected locations in New York City of
11 fast food chains such as McDonalds, KFC, Taco Bell, and Subway in the spring of
2007 before New York City’s mandatory labeling requirements went into effect (Ref.
46
54). They found that among the chains included in the study, only Subway had calorie
information at the point of purchase. They also found that, during the study period,
Subway costumers who did report seeing calorie information purchased an average of 52
fewer calories per transaction than customers who did not see calorie information. In
contrast, in three New York City restaurants, Down and colleagues found that calorie
posting had a modest impact consumers’ food selections. However, because not all
consumers use calorie information for the same purpose (some use the information to
shift calorie intake between meals, or to increase intake, or to feel like they are getting a
better “value”) they also found that calorie labeling in some cases induced consumers to
purchase higher calorie items (Ref. 55). Similarly, Elbel and colleagues found that
calorie labeling did not have a significant effect on food purchase behaviors in low-
income minority neighborhoods (Ref. 56). In a study of adolescent fast food
consumption, Yamamoto and colleagues found little difference in food choices made by
the study participants when the participants made food choices from menus that included
calorie information in comparison to menus that did not include calorie information (Ref.
57). These results are consistent with those of Variyam for packaged foods, who found
in a study that consumers’ use of the Nutrition Facts alone does little to improve dietary
intakes (Ref. 58).
Two of the most recent studies of local calorie disclosure laws, one of calorie
disclosure use in a taco chain in King County, Washington (Ref. 59) and another studying
child and adolescent fast-food choice in New York City (Ref. 60), found no significant
change in calorie intake. In another study of restaurant calorie labeling, Tandon and
colleagues found that menu labeling of fast food reduced the number of calories in meals
47
that parents ordered for their children (Ref. 61). In addition, none of these studies
examined total diet. This means that consumers may have compensated by increasing
calorie intake during other meals or snacks for the observed reduction in calories.
However, it could be that the effect of menu labeling is more likely to manifest in
a longer time frame than that measured in these studies. Another long term effect could
be producer-driven reductions in calories through portion size reduction and
reformulation.
Because FDA does not have comprehensive data on how consumption patterns
would change in the long run due to the proposed requirements, and because FDA does
not have data on how chains and establishments would respond to the proposed
requirements, FDA has estimated a benchmark response by the adult obese population
that would be needed for the proposed requirements to have a positive net benefit. This
benchmark is not an estimate of the real effect of the implementation of the proposed
requirements, but an exercise to illustrate the magnitude of the response needed. This
response may stem from some combination of reformulation or introduction of new menu
items with fewer calories or consumer purchase of fewer calories from existing menu
items. The benchmark benefits are calculated by summing quality adjusted life years
gained and medical costs averted from the benchmark decline in obesity.
Quality adjusted life years (QALYs) QALYs can be used to measure the loss of
well-being that an individual suffers due to a disease or condition. QALYs are measured
on a range from 0 to 1 where 0 is equivalent to death, 1 is equivalent to perfect health for
1 year, and intermediate values are higher or lower depending on how much a person is
suffering over a year. A number of methods have been constructed to measure QALYs.
48
In this analysis we rely on estimates of the obesity related QALYs by Jia and Lubetkin
that use a statistical method developed by Cutler and Richardson (Refs. 62, 63 and 64). In
this context, the method uses regression analysis to estimate the effect of particular
conditions on overall health status (Ref. 64). The QALYs used in this analysis do not
include the value of health expenditures caused by obesity; we estimate health
expenditures separately. The study finds that the QALYs lost by the U.S. adult population
due to annual obesity related illness and lost quality adjusted life expectancy based on
2005-2008 data are .0410 per adult, for all U.S. adults in all weight categories. Mortality
losses in this study are measured as the probability of premature death in a given year
multiplied by the sum of QALYs over life expectancy. Approximately 57 percent of this
burden comes from disability and activity limitations rather than premature death (Refs.
63 and 64). Based on the U.S. Census Bureau Statistical Abstract of the United States:
2011, the 18 and over population of the U.S. in 2009 was 232,458,000 (Ref. 65). The
total estimate of lost QALYs from obesity for adults in the U.S. is then 9,530,778
QALYs. FDA notes in section I.A. of this document that 34 percent of the adult
population is obese. Therefore, approximately 79,035,720 adults (232,458,000 x 34%)
are obese, and the lost QALY per obese adult is 0.121 QALY.
FDA uses a range to estimate the value of an additional year of life to reflect the
uncertainty in the literature on valuation. Beginning with an estimate of the value of a
statistical life year (VSL) of $7.9 million, we annualize this estimate to yield a value of
an additional year of life of $106,000, $213,000, $319,000 and $532,000. Calculations
for estimated benefits will reflect these four estimates of the value of a statistical life year
(VSLY). Using these values and the estimate of 0.121 QALY per obese adult, the
49
annualized cost per obese adult of lost QALYs, including both disability and premature
death due to obesity is estimated as in the range of $13,000 ($106,000 x 0.121), $26,000
($213,000 x 0.121), $38,000 ($319,000 x 0.121) and $64,000 ($532,000 x 0.121). The
corresponding total burdens from lost QALYs associated with obesity in the U.S. adult
population are then $1.028 trillion, $2.055 trillion, $3.003 trillion and $5.058 trillion.
Note that these estimates are for the annual lost QALYs of all obese adults and are not
estimates of the benefits of the proposed requirements.
Medical costs The estimated medical expense reduction is calculated using data
from the Medical Expenditure Panel Survey (MEPS). MEPS is a nationally
representative survey of the civilian non- institutionalized population. MEPS contain
detailed information on the respondents’ medical expenditures, such as total annual
medical expense by type of service and source of payment. In addition, the data also
include demographic information (age, race, gender etc.) along with individual’s body
mass index (BMI) based on self-reported measure of height and weight.
Using 2006 MEPS data, Finkelstein and colleagues found that the annual obesity
attributable medical costs for obese adults (BMI greater or equal to 30) relative to normal
weight adults (BMI greater than or equal to 18.5 and less than 25) was between $85,739,
million and $146,624 million in 2008 dollars (Ref. 18). From Flegal and colleagues, 34
percent of adults were obese in 2006 (Ref. 9). With an adult population in 2006 of
224,583,000, the number of obese adults in 2006 was approximately 76,358,220
(224,583,000 x 34%), yielding a cost of between $1.14 and $1.94 per obese adult in 2010
dollars (Ref. 18). Using the previous estimate of 79,035,720 obese adults, this translates
into between $89.9 billion and $153.7 billion in medical costs associated with obesity,
50
and a mean estimate of $121.8 billion. Note that these estimates are additional medical
costs for all obese adults and are not estimates of the benefits of the proposed
requirements.
Calorie reduction Based on 2003-2004 National Health and Nutrition
Examination Survey (NHANES) data, Mancino and colleagues estimate that consuming a
meal not prepared at home added an extra 239 calories to the diet of obese individuals
when compared to consuming a meal prepared at home (Ref. 24). NHANES data shows
an estimated four meals eaten away from home per week (Ref. 24). This translates to an
average of roughly 140 extra calories per day (239 cal/meal x 4 meals/week / 7
days/week).
Because of the complexity of the causes of overweight and obesity, and the
complexity of the choices involved in purchasing and preparing restaurant or restaurant-
type food, we do not expect the proposed requirements to reduce calorie intake by an
amount as large as this. Furthermore, we know from the Mancino study cited in the last
paragraph that while individuals who are not overweight also consume more calories
when eating restaurant food in comparison to the foods they prepare themselves, the
calorie differential is not as great (134 calories per meal versus 239 for obese
individuals).
The studies discussed elsewhere in this section found that responses to calorie
information on menus were often small or insignificant, but varied widely across
different subgroups, ranging from increases in calorie intake for some populations to
reductions of up to approximately 50 calories per meal for other groups. Consumer
response to reformulations and menu changes are also likely to be highly diverse. Taking
51
a rough, unweighted average of the range of observed consumer responses suggests that a
10 percent reduction in the additional calories consumed in restaurant or restaurant-type
food may be possible for at least some populations, and may be supported by additional
changes to the calorie amounts in offered menu items. We therefore base our benchmark
on an average decrease in calorie intake of 24 calories per meal (240 calories per meal x
10%). Equivalently, we can characterized this benchmark as 14 calories per day (240
calories per meal x 4 meals per week /7 days/week x 10%), or about 100 calories per
week (14 calories/day x 7 days/week) by obese adults.
Weight and BMI reduction In order to convert this benchmark calorie reduction
to U.S. population weight and BMI reductions we use a steady state model developed by
Hall and Jordan for the calculation of individual weight loss using daily calorie reduction,
height, initial weight, age, gender, fat mass, physical activity level, (Ref. 66). In order to
calculate weight loss using NHANES U.S. population we implemented this model using
symbolic algebra software.
On the advice of Hall and Jordan, we use 2003-2004 NHANES data rather than
the most recent 2007-2008 NHANES data in order to be able to use the dual energy x-ray
absorptiometry (DEXA) data file. This data measures total fat mass for individuals,
allowing for a much more accurate calculation of weight reduction than would be
possible without this data. We do not use the MEPS data because height and weight are
needed for calculating weight loss, and are not given in the public dataset. Furthermore,
height and weight are self reported in MEPS, and may therefore be biased.
In addition to the NHANES DEXA data file, we use demography, body
measurement and physical activity questionnaire data. The physical activity data is into
52
PAL/MET scores using the recommended values given in the NHANES documentation.
For missing values (approximately 1/3 of the observations), we assume the lowest level
of activity (1.4). Individuals with lower levels of background activity are predicted to
lose more weight for a given calorie reduction. Therefore, the replacement of missing
physical activity levels with a relatively low PAL score means that estimated weight
reductions may be slightly higher than if all PAL scores were known.
Using the weight reduction calculator and NHANES data, we estimate that a 14
calorie per day or 100 calorie per week reduction translates to a mean steady state weight
loss of 1.2 kilograms, from a range of 0.5 to 1.8 kilograms for U.S. adults over the age of
18. This is not an annual decrease, but the total weight loss that would result from a
permanent reduction of calorie intake. This decrease in weight translates to a mean
decline in BMI of 0.455 BMI per obese adult from a range of 0.14 to 0.73. We
contextualize this drop against the decline in BMI needed to bring the average obese
adult BMI down to the average non-obese BMI. From NHANES 2003-2004 data the
mean non-obese BMI is 24.7 and the mean obese BMI is 35.4, for a difference of 10.7
BMI units. We can then characterize the 0.455 drop in BMI as a 4.3 percent drop in
obesity as measured by excess BMI relative to the non-obese. Summing the estimates of
QALY gains and medical cost abatement for all obese adults and taking 4.3 percent
yields a range of $91 billion to $222 billion, with an intermediate estimate of $133 billion
for the total cost of obesity in adults. Note that this is not an estimate of the benefit of the
proposed requirements.
Benchmark fraction of obese adults Because studies on menu disclosure of
calories show that in most cases only a fraction of consumers reduce their calorie intake
53
in response to the information, there may only be a small group of consumers that
respond to the new information or purchase newly reformulated or offered lower calorie
menu items. As an illustration of the magnitude of the benefits from a reduction in
calorie intake we consider the benefit associated with the 4.3 percent reduction in excess
BMI, or 100 calorie reduction per week by a small fraction of obese consumers. In
particular, we calculate the minimum percentage of obese consumers that would need to
reduce calorie intake by at least 100 calories per week in order for the proposed
requirements to have positive net benefits.
Given the mean annualized cost estimate for the proposed requirements of
approximately $ 76.8 million at 3 percent discount rate (Table 1a), and the estimated
intermediate benefit of a 100 calorie per week reduction in intake by all obese adults of
$133 billion, if at least 0.06 percent ($76.8 million/$133 billion) of the adult obese
population reduced their total calorie intake from restaurant or restaurant-type food by at
least 100 calories per week, the proposed requirements would result in a net benefit.
Using the low and high estimates of annualized cost for the proposed rule, the break-even
estimate of the proportion of obese adults that would need to reduce their total calorie
intake from restaurant or restaurant-type food by at least 100 calories per week ranges
from 0.03 percent to 0.09 percent. Using the high and low estimates of the cost of obesity
developed in this section of $222 billion and $91 billion, the break even proportion
ranges from 0.03 percent to 0.08 percent, respectively.
It is important to note that this benchmark benefit analysis has been restricted to
adults only (age greater than 18). In addition, normal weight and underweight
individuals have been excluded because the literature identifies body weight that exceeds
54
the recommended weight range poses health risks that are directly attributable to the
higher medical expenses (Refs. 12). Note that the benefit estimation takes the current
prevalence of obesity as fixed, particularly in terms of population size and the
demographic distribution of that population.
Although this analysis does not include an estimate of the benefits or costs of
obesity in children, reduction in childhood obesity has been linked with educational,
social and career outcomes (Ref. 17). It is reasonable to expect that the impact on their
adult caregivers of this proposed rule in terms of the reduction in calorie intake due to
menu labeling, and any changes toward more balanced nutrient intake, will benefit
children and adolescents. Because the estimated reductions in medical expenses
discussed in this analysis are only those expenses currently incurred by obese individuals,
the benefit estimate of this proposed rule is conservative and actual reduced medical costs
may be greater.
C. Option 2: Limited Scope
Option 2 is similar to the proposed rule, but with scope limited from the proposed
rule to include establishments whose primary business activity is selling restaurant food
or restaurant-type food directly to the consumer. For the purposes of this analysis, this
effectively limits the scope to the sectors shown in Table 7.
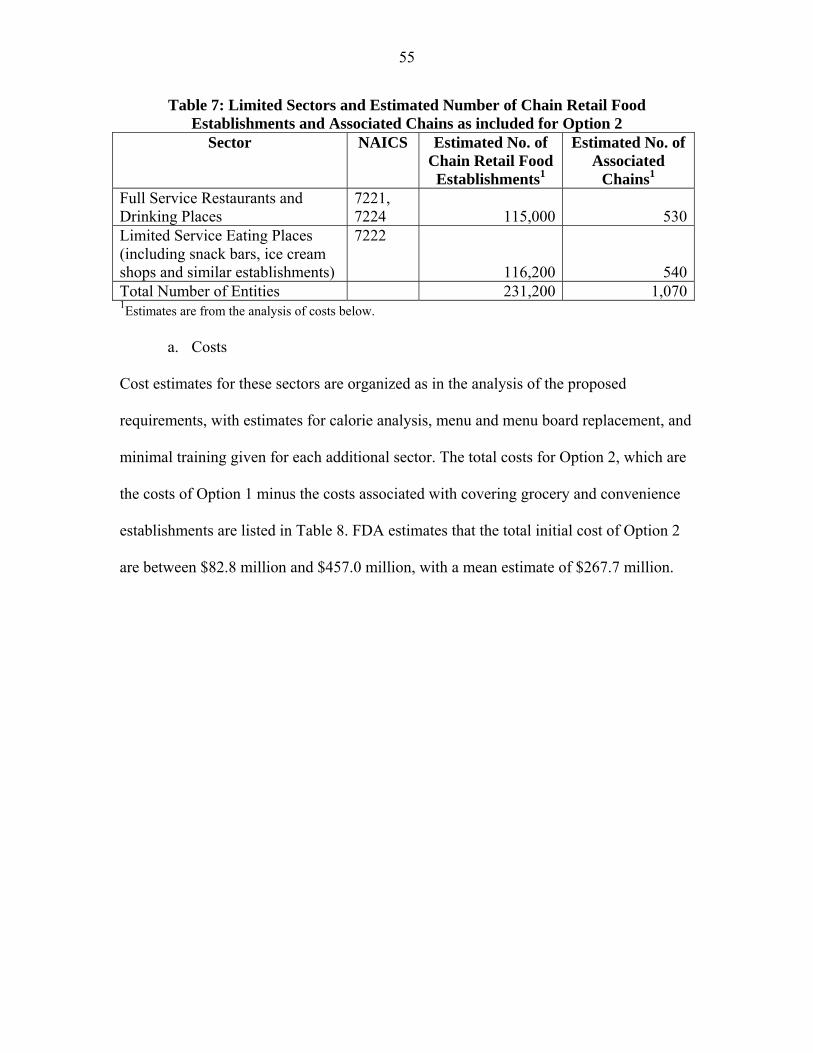
55
Table 7: Limited Sectors and Estimated Number of Chain Retail Food Establishments and Associated Chains as included for Option 2
Sector NAICS Estimated No. of Chain Retail Food Establishments1
Estimated No. of Associated
Chains1 Full Service Restaurants and Drinking Places
7221, 7224 115,000 530
Limited Service Eating Places (including snack bars, ice cream shops and similar establishments)
7222
116,200 540Total Number of Entities 231,200 1,0701Estimates are from the analysis of costs below.
a. Costs
Cost estimates for these sectors are organized as in the analysis of the proposed
requirements, with estimates for calorie analysis, menu and menu board replacement, and
minimal training given for each additional sector. The total costs for Option 2, which are
the costs of Option 1 minus the costs associated with covering grocery and convenience
establishments are listed in Table 8. FDA estimates that the total initial cost of Option 2
are between $82.8 million and $457.0 million, with a mean estimate of $267.7 million.
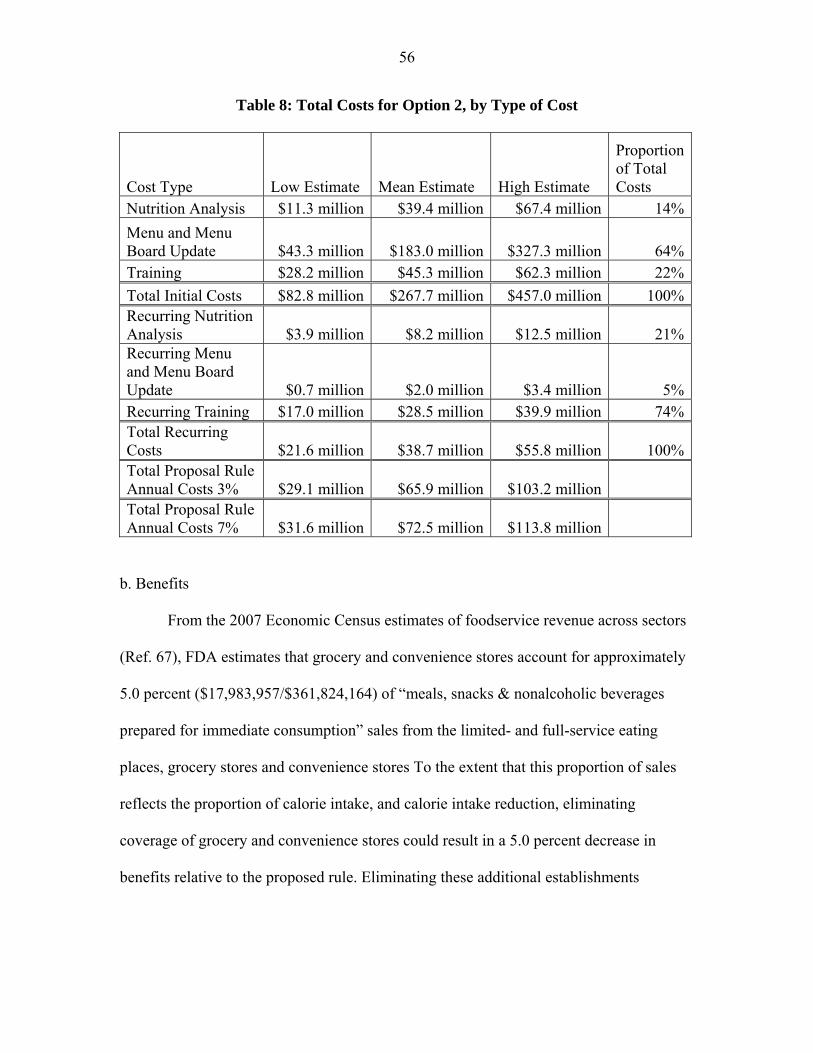
56
Table 8: Total Costs for Option 2, by Type of Cost
Cost Type Low Estimate Mean Estimate High Estimate
Proportion of Total Costs
Nutrition Analysis $11.3 million $39.4 million $67.4 million 14%
Menu and Menu Board Update $43.3 million $183.0 million $327.3 million 64%Training $28.2 million $45.3 million $62.3 million 22%
Total Initial Costs $82.8 million $267.7 million $457.0 million 100%Recurring Nutrition Analysis $3.9 million $8.2 million $12.5 million 21%Recurring Menu and Menu Board Update $0.7 million $2.0 million $3.4 million 5%Recurring Training $17.0 million $28.5 million $39.9 million 74%Total Recurring Costs $21.6 million $38.7 million $55.8 million 100%Total Proposal Rule Annual Costs 3% $29.1 million $65.9 million $103.2 million Total Proposal Rule Annual Costs 7% $31.6 million $72.5 million $113.8 million
b. Benefits
From the 2007 Economic Census estimates of foodservice revenue across sectors
(Ref. 67), FDA estimates that grocery and convenience stores account for approximately
5.0 percent ($17,983,957/$361,824,164) of “meals, snacks & nonalcoholic beverages
prepared for immediate consumption” sales from the limited- and full-service eating
places, grocery stores and convenience stores To the extent that this proportion of sales
reflects the proportion of calorie intake, and calorie intake reduction, eliminating
coverage of grocery and convenience stores could result in a 5.0 percent decrease in
benefits relative to the proposed rule. Eliminating these additional establishments
57
represent an average 12.5 percent decrease relative to the annualized costs of the
proposed rule.8
This estimate of the changes in potential benefits depends on a uniform response
by consumers and firms to the required nutrient information across all sectors. It is likely
that different settings result in different responses to the same required information.
Therefore, these estimates may be biased up or down depending on how consumer
response and chain response varies across sectors. Furthermore, many of the grocery and
convenience stores compete directly with restaurant chains. To the extent that this holds,
exempting grocery and convenience stores from coverage may contribute to a less
competitive environment because they would not be required to comply with the
proposed requirements. In addition, restaurant food and restaurant-type food is a growing
market for many grocery and convenience store chains.
D. Option 3. Broader Scope
Option 3 is similar to the proposed rule, but considers a broader application to
establishments that offer for sale restaurant or restaurant-type food.
For the purposes of the preliminary regulatory impact analysis, FDA has analyzed
the costs and benefits associated with covering establishments in a wider range of sectors
that may not be commonly understood to be restaurants, but that serve restaurant or
restaurant-type food. These include concessions that are embedded within general
merchandise stores, lodging places, entertainment, sports or recreation facilities,
transportation carriers and facilities generally served by foodservice contractors. The
sectors, and the estimates of the number of chains and establishments that might meet the
� 8 Average percentage change is calculated by calculating the percent change for low, mean and high estimates, then averaging these averages.
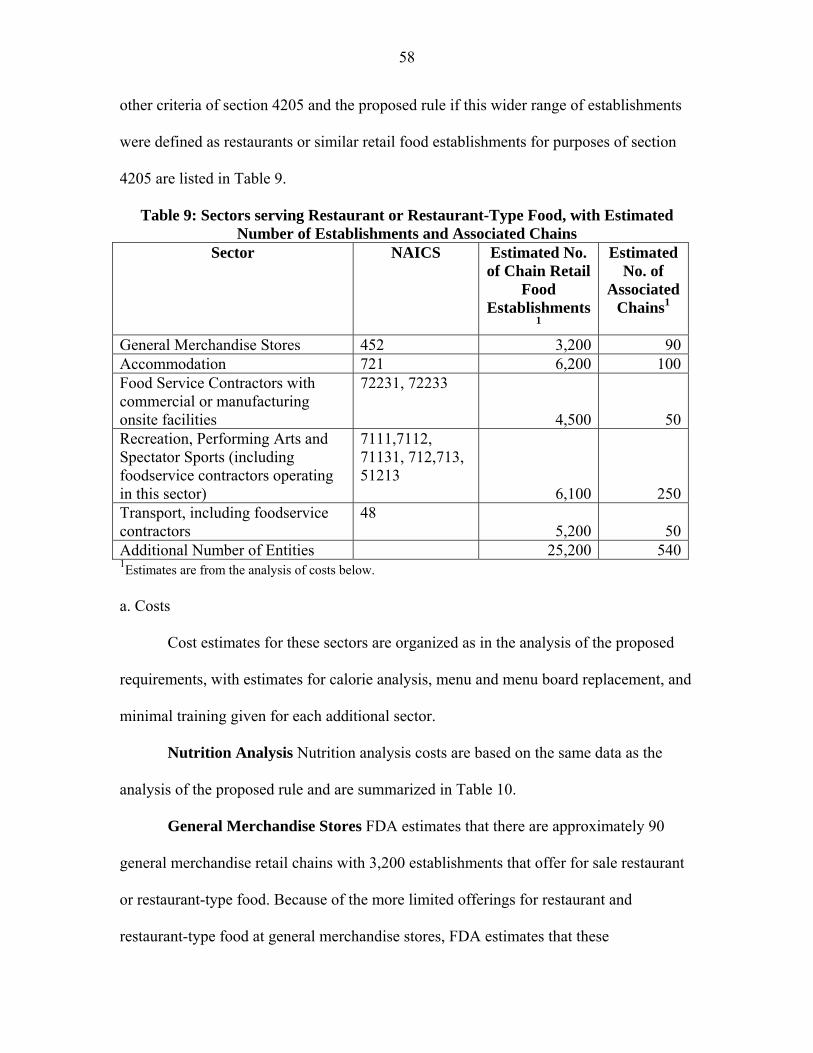
58
other criteria of section 4205 and the proposed rule if this wider range of establishments
were defined as restaurants or similar retail food establishments for purposes of section
4205 are listed in Table 9.
Table 9: Sectors serving Restaurant or Restaurant-Type Food, with Estimated Number of Establishments and Associated Chains
Sector NAICS Estimated No. of Chain Retail
Food Establishments
1
Estimated No. of
Associated Chains1
General Merchandise Stores 452 3,200 90Accommodation 721 6,200 100Food Service Contractors with commercial or manufacturing onsite facilities
72231, 72233
4,500 50Recreation, Performing Arts and Spectator Sports (including foodservice contractors operating in this sector)
7111,7112, 71131, 712,713, 51213
6,100 250Transport, including foodservice contractors
48 5,200 50
Additional Number of Entities 25,200 5401Estimates are from the analysis of costs below.
a. Costs
Cost estimates for these sectors are organized as in the analysis of the proposed
requirements, with estimates for calorie analysis, menu and menu board replacement, and
minimal training given for each additional sector.
Nutrition Analysis Nutrition analysis costs are based on the same data as the
analysis of the proposed rule and are summarized in Table 10.
General Merchandise Stores FDA estimates that there are approximately 90
general merchandise retail chains with 3,200 establishments that offer for sale restaurant
or restaurant-type food. Because of the more limited offerings for restaurant and
restaurant-type food at general merchandise stores, FDA estimates that these
59
establishments would have the same average costs of nutrition analysis as grocery or
convenience store chain of between $11,000 ($275/item x 40 items/chain) and $34,600
($866/item x 40 items/chain), with a mean estimate of $22,800 per chain. The estimated
cost of nutrition analysis for general merchandise store chains ranges from $1.0 million
(90 chains x $11,000/chain) to $3.1 million (90 chains x $34,600/chain), with a mean
estimate of $2.1 million.
Lodging Using 2007 Economic Census data (Ref. 68), and similar industry
patterns of ownership to other sectors, FDA estimates that there are 6,200 lodging
establishments associated with 100 chains that would be subject to the proposed
requirements under this option, not including establishments that voluntarily register to
become subject to the requirements. Although some of these establishments have full-
service restaurants, many are limited to basic breakfast offerings. Therefore, FDA
estimates that these chains also have an average of one third of the restaurant offerings, or
40 standard menu items. The per item costs, multiplied by the average number of items
per chain, would yield average costs of nutrition analysis per lodging chain of between
$11,000 ($275/item x 40 items/chain) and $34,600 ($866/item x 40 items/chain), with a
mean estimate of $22,800 per chain. With 100 chains, the cost of nutritional analysis in
the lodging sector would be between $1.1 million (100 chains x $11,000/chain) and $3.5
million (100 chains x $34,600/chain), with a mean estimate of $2.3 million.
Entertainment, Sports and Recreation From 2007 Economic Census data, FDA
estimates that there are approximately 6,100 entertainment, sports and recreational
establishments, associated with 250 chains, that would be chain retail food establishments
as the term is used in this option (Refs. 69 and 70). These include approximately 2,800
60
movie theaters associated with 50 chains and 1,300 performing arts, entertainment or
spectator sports establishments associated with 150 chains. In addition, using the
National Restaurant Association’s data on foodservice contracting revenue from
recreation sites (Ref. 71), FDA estimates that an additional 50 chains and 2,000
establishments are run in this sector by foodservice contractors.
Using the more limited set of standard menu items from the analysis of grocery
and convenience stores, FDA estimates an average cost of nutrition analysis per chain of
between $11,000 and $34,600, with a mean estimate of $22,800 per chain. With 250
chains, this would yield a total cost for these chains of between $2.8 million (250 chains
x $11,000/chain) and $8.7 million (250 chains x $34,600/chain), with a mean estimate of
$5.7 million.
Transport The Air Transport Association 2010 Economic Report counts 6,278
passenger aircraft in 2009 (Ref. 72). Of these, the report estimates that 3,521 are operated
by 14 mainline carriers. MIT’s Airline Data Project calculates 3,507 by 15 mainline
carriers in 2009 (Ref, 73). The Airline Data Project also calculated that the average seat
capacity in 2009 was 168 seats per plane for the 15 carriers (Ref. 74). Not all carriers or
aircraft operated by these carriers offer restaurant or restaurant-type foods. FDA therefore
takes this set of mainline carriers, rounded to 20 carriers and 3,500 aircraft, as an estimate
of the number of chains with establishments that sell restaurant or restaurant-type food,
and might be defined as chain retail food establishments if they were restaurants or
similar retail food establishments. FDA requests data and comment on this estimate.
The Bureau of Transportation Statistics counts 278 Amtrak locomotives (Ref. 75).
Amtrak’s 2009 Annual Report, cites “up to 300 daily Amtrak trains” (Ref. 76). Although
61
there are a small number of local or regional lines that may offer for sale restaurant or
restaurant-type food, 300 is a likely upper bound to the number of establishments serving
restaurant or restaurant-type food and might otherwise be defined as chain retail food
establishments if they were restaurants or similar retail food establishments. FDA
requests data and comment on this estimate.
The National Census of Ferry Operators, 2008 lists 490 ferries with capacity
greater than 100 passengers, operated by 127 different entities that also are likely to have
concessions (Ref. 77). Given that in order to be subject to the proposed requirements, a
restaurant or similar retail food establishment must be part of a chain with at least 20
locations, some of these ferries will be excluded. If 19 operators of ferry-based
establishments that offer for sale restaurant or restaurant-type food at least 20
establishments, doing business under the same name and offering for sale substantially
the same menu items, and all other operators have only 1 (19 operators x 20
ferries/operator + 110 ferries=490 ferries), then the 380 ferry-based establishments
operated by the 19 ferry operators (19 operators x 20 ferries/operator = 380 ferries) would
be subject to the proposed requirements. FDA requests data and comment on this
estimate.
Again using NRA’s 2010 data on foodservice sales, FDA estimates that an
additional 10 food service contractor chains, operating 1,000 establishments, operate in
the transport sector. In total, FDA estimates that there are 50 chains, with 5,200
establishments in the transport sector that serve restaurant or restaurant-type food, and
might otherwise be defined as chain retail food establishments if they were restaurants or
similar retail food establishments.
62
Using 40 menu items per chain, FDA estimates costs of nutrition analysis per
chain to be between $11,000 and $34,600, with a mean estimate of $22,800. With a total
of 50 transport chains, this yields a total cost for these chains of between $0.6 million (50
chains x $11,000/chain) and $1.7 million (50 chains x $34,600/chain), with a mean
estimate of $1.1 million.
Managed Food Service From 2007 Economic Census data, and NRA’s 2010
Forecast (Refs.68 and 71), FDA estimates that there are approximately 4,500
establishments, controlled by 50 chains in the general managed food sector. FDA uses the
same per-chain estimate of number of menu items as restaurants, 80 per chain. This
results in a per chain estimated cost of between $1.1 million ($22,000/chain x 50 chains)
and $3.5 million ($69,300/chain x 50 chains), with a mean estimate of $2.3 million.
If all of these establishments were restaurants or similar retail food establishments
that were subject to the proposed requirements, they would add between $6.6 million and
$20.5 million, with a mean estimate of $13.5 million, to the initial costs of nutrition
analysis.
Recurring Costs Using the same estimate as for restaurants of 12 new standard
menu items per year, FDA estimates that these 530 chains would have annually recurring
costs of nutrition analysis cost of between $1.7 million (530 chains x 12 items/chain x
$275/item) to $5.5 million (530 chains x 12 items/chain x $866/item), with a mean
estimate of $3.6 million.
Given the 2 percent growth rate used in other options, there would be an
estimated 10 new chains (530 chains x .02) every year. If each new chain has an average
of 40 standard menu items, then the recurring costs associated with these new
63
establishments would be between $0.1 million (10 chains x 40 items/chain x $275/item)
and $0.3 million (10 chains x 40 items/chain x $866/item), with a mean of $0.2 million
each year. Total estimated additional recurring costs for the establishments discussed in
this option are between $1.8 million and $5.8 million, with a mean of $3.8 million.
Annualized costs The annualized costs are calculated by adding the recurring
costs to initial costs annualized over 10 years at 3 percent and 7 percent discount rates.
With a 3 percent discount rate, the annualized mean cost of nutrition analysis for these
additional sectors is estimated to be $5.3 million, or between $2.6 million and $8.1
million. With a 7 percent discount rate, the annualized mean cost of nutrition analysis for
these additional sectors is estimated to be $5.6 million or between $2.7 million and $8.5
million.
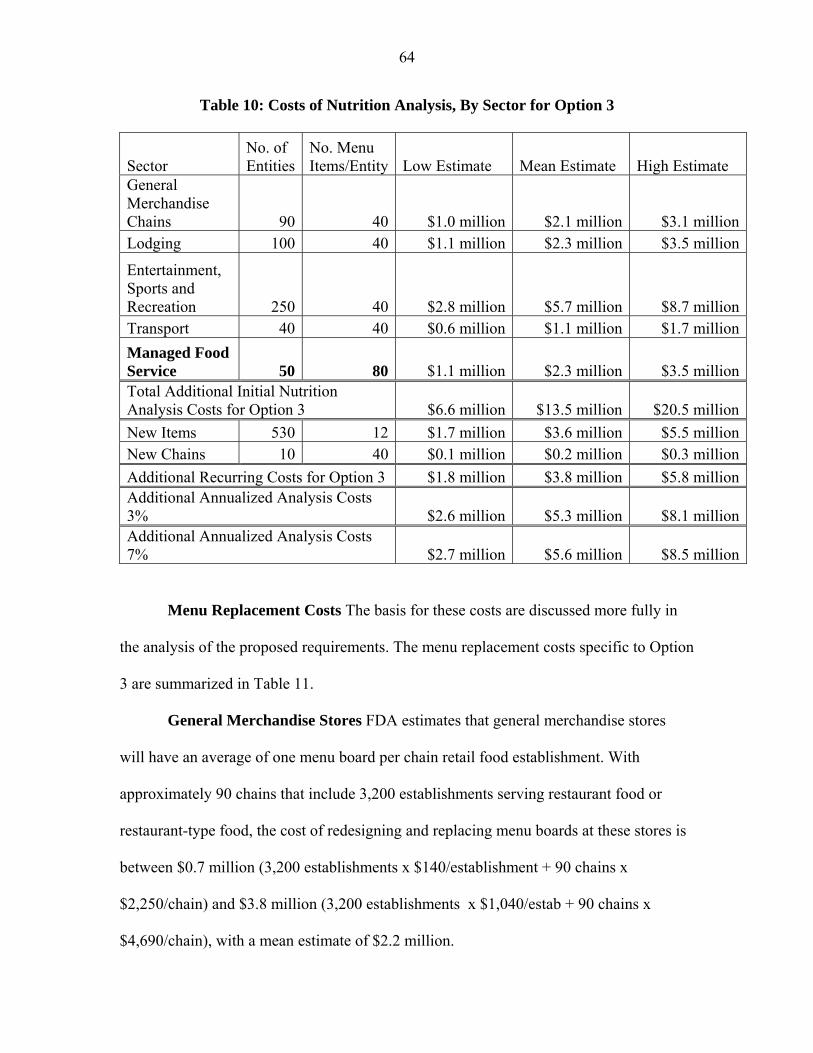
64
Table 10: Costs of Nutrition Analysis, By Sector for Option 3
Sector No. of Entities
No. Menu Items/Entity Low Estimate Mean Estimate High Estimate
General Merchandise Chains 90 40 $1.0 million $2.1 million $3.1 millionLodging 100 40 $1.1 million $2.3 million $3.5 million
Entertainment, Sports and Recreation 250 40 $2.8 million $5.7 million $8.7 millionTransport 40 40 $0.6 million $1.1 million $1.7 million
Managed Food Service 50 80 $1.1 million $2.3 million $3.5 millionTotal Additional Initial Nutrition Analysis Costs for Option 3 $6.6 million $13.5 million $20.5 million
New Items 530 12 $1.7 million $3.6 million $5.5 millionNew Chains 10 40 $0.1 million $0.2 million $0.3 million
Additional Recurring Costs for Option 3 $1.8 million $3.8 million $5.8 millionAdditional Annualized Analysis Costs 3% $2.6 million $5.3 million $8.1 millionAdditional Annualized Analysis Costs 7% $2.7 million $5.6 million $8.5 million
Menu Replacement Costs The basis for these costs are discussed more fully in
the analysis of the proposed requirements. The menu replacement costs specific to Option
3 are summarized in Table 11.
General Merchandise Stores FDA estimates that general merchandise stores
will have an average of one menu board per chain retail food establishment. With
approximately 90 chains that include 3,200 establishments serving restaurant food or
restaurant-type food, the cost of redesigning and replacing menu boards at these stores is
between $0.7 million (3,200 establishments x $140/establishment + 90 chains x
$2,250/chain) and $3.8 million (3,200 establishments x $1,040/estab + 90 chains x
$4,690/chain), with a mean estimate of $2.2 million.
65
Lodging Lodging places generally have menus instead of menu boards;
therefore, the menu replacement costs for establishments in the lodging sector would be
limited to menu replacement and redesign and administrative costs. With approximately
100 chains, the estimated cost of redesign is between $0.2 million (100 chains x
$2,250/chain) and $0.5 million (100 chains x $4,690/chain), with a mean of $0.3 million.
The 2007 Economic Census data gives an average number of rooms per lodging
establishment of 77. If between 0 and 50 percent of these lodging establishment must
discard and reprint one menu for each room, plus 10 extra, for a total of 87 menus per
establishment, then the estimated cost of menu replacement for lodging establishments is
between $0 and $0.8 million (3,100 establishments x 87 menus/establishment x $3/menu)
with a mean estimate of $0.4 million. The total estimated cost for lodging places is
between $0.2 million and $1.3 million, with a mean estimate of $0.8 million.
Entertainment, Sports and Recreation FDA estimates that entertainment, sports
or recreational facilities have an average of one menu board per establishment. With an
estimated 250 chains including 6,100 establishments, the cost of redesigning and
replacing menu boards at these establishments is between $1.4 million (6,100
establishments x $140/estab + 250 chains x $2,250/chain) and $7.5 million (6,100
establishments x $1,040/estab + 250 chains x $4,690/chain), with a mean estimate of $4.5
million.
Transport With an estimated 30 air passenger carriers or food service contractors
serving aircraft that serve restaurant or restaurant-type food, the cost of menu redesign for
air passenger carriers is estimated to be between $68,000 (30 chains x $2,251/chain) and
$141,000 (30 chains x $4695/chain), with a mean estimate of $104,000.
66
For rail and ferry establishments, with an estimated 20 carriers and 700
establishments that serve restaurant or restaurant-type food the cost of replacing menu
boards is estimated to be between $143,000 (700 establishments x $140/estab + 20 chains
x $2,250/chain) and $822,000 (700 establishments x $1,040/estab + 20 chains x
$4,690/chain), with a mean estimate of $482,000. Total estimated costs to the transport
sector of menu and menu board replacement and redesign are between $0.2 million and
$1.0 million, with a mean estimated cost of $0.6 million.
Managed Food Service FDA estimates that establishments associated with
managed food services will have an average of one menu board per establishment. With
approximately 50 chains including 4,500 establishments, the estimated cost of replacing
menu boards at these establishments is between $0.7 million (4,500 establishments x
$140/estab + 50 chains x $2,250/chain) and $4.9 million (4,500 establishments x
$1,040/estab + 50 chains x $4,690/chain), with a mean estimate of $2.8 million.
In total, these additional establishments would have initial costs of menu and
menu board replacement of between $3.2 million and $18.5 million, with a mean increase
of $10.9 million.
Recurring Costs All these establishments would need to provide additional
nutrition information if they were restaurants or similar retail food establishments. There
are 26,200 additional establishments under this option. If each of these establishments
distributed between 10 and 50 written nutrition information documents per month, on
average, then the yearly recurring number would be between 3.1 million and 15.7 million
documents. At an estimated cost of $0.20 per document, the yearly cost would be
between $0.1 million and $.3 million, with a mean cost of $.2 million.
67
Using average, per-establishment costs of between $120 and $1330, the recurring
costs from the entry of chains growing to include 20 or more establishments would be for
200 establishments (10 new chains x 20 establishments/chain), between $24,000
($120/establishment x 200 establishments) and $0.3 million ($1,330/establishment x 200
establishments). Total recurring costs for these establishments is between $0.1 million
and $0.6 million, with a mean estimate of $0.2 million.
Annualized costs The annualized costs are calculated by adding the recurring
costs to initial costs annualized over 10 years at 3 percent and 7 percent discount rates.
With a 3 percent discount rate, the annualized mean cost of menu update for these
additional sectors is estimated to be $1.4 million, or between $0.5 million and $2.4
million. With a 7 percent discount rate, the annualized mean cost of menu update for
these additional sectors is estimated to be $1.7 million or between $0.5 million and $2.8
million.
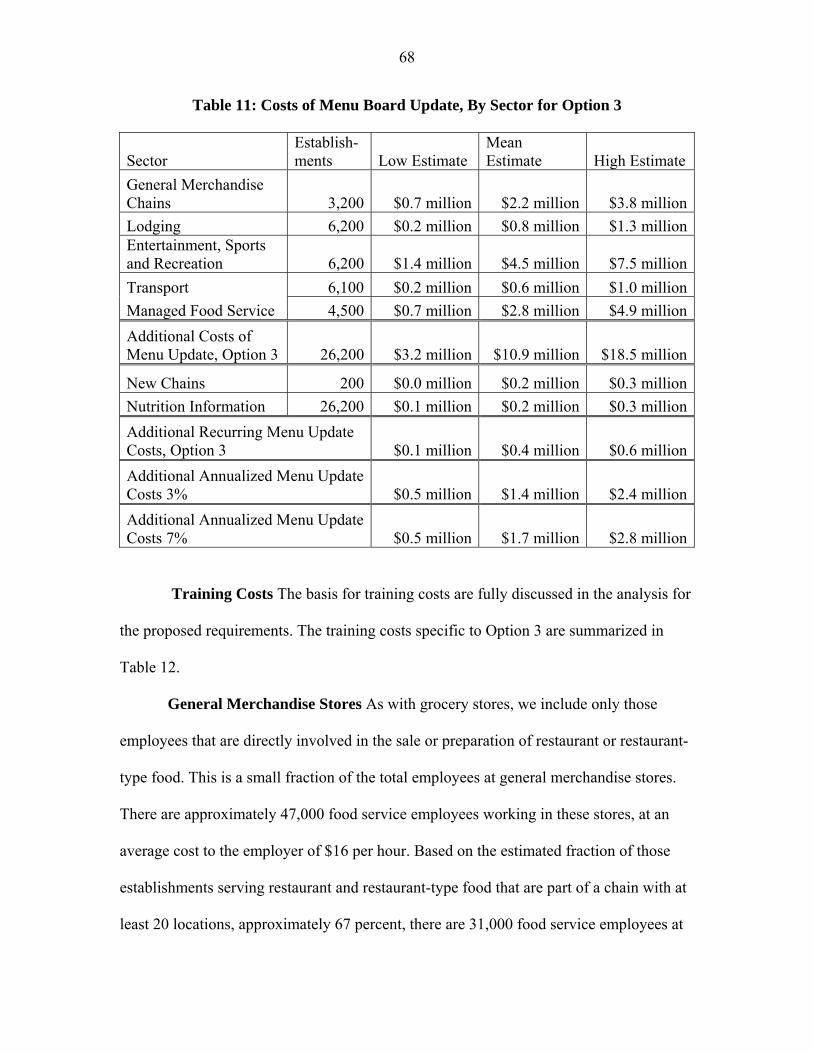
68
Table 11: Costs of Menu Board Update, By Sector for Option 3
Sector Establish-ments Low Estimate
Mean Estimate High Estimate
General Merchandise Chains 3,200 $0.7 million $2.2 million $3.8 million
Lodging 6,200 $0.2 million $0.8 million $1.3 millionEntertainment, Sports and Recreation 6,200 $1.4 million $4.5 million $7.5 million
Transport 6,100 $0.2 million $0.6 million $1.0 million
Managed Food Service 4,500 $0.7 million $2.8 million $4.9 million
Additional Costs of Menu Update, Option 3 26,200 $3.2 million $10.9 million $18.5 million
New Chains 200 $0.0 million $0.2 million $0.3 million
Nutrition Information 26,200 $0.1 million $0.2 million $0.3 million
Additional Recurring Menu Update Costs, Option 3 $0.1 million $0.4 million $0.6 million
Additional Annualized Menu Update Costs 3% $0.5 million $1.4 million $2.4 million
Additional Annualized Menu Update Costs 7% $0.5 million $1.7 million $2.8 million
Training Costs The basis for training costs are fully discussed in the analysis for
the proposed requirements. The training costs specific to Option 3 are summarized in
Table 12.
General Merchandise Stores As with grocery stores, we include only those
employees that are directly involved in the sale or preparation of restaurant or restaurant-
type food. This is a small fraction of the total employees at general merchandise stores.
There are approximately 47,000 food service employees working in these stores, at an
average cost to the employer of $16 per hour. Based on the estimated fraction of those
establishments serving restaurant and restaurant-type food that are part of a chain with at
least 20 locations, approximately 67 percent, there are 31,000 food service employees at
69
general merchandise stores that would need training.9 If each employee receives between
10 and 30 extra minutes of training, then the formal employee training costs for grocery
and convenience store establishments would be between $0.1 million (31,000 x 1/6 hour
x $16/hour) and $0.2 million (31,000 x 1/2 hour x $16/hour), with an average cost of $0.2
million.
There are approximately 4,000 food service managers employed by these general
merchandise stores that would need training. The average cost of these managers is $22
per hour. If each manager needs four to eight hours of training, then the wage cost to the
industry will be between $0.4 million (4,000 x 4 hour x $26/hour) and $0.7 million
(4,000 x 8 hour x $226/hour), with an average cost of $0.5 million. In total, the training
costs for general merchandise stores will be $0.5 million to $0.9 million, with a mean
estimate of $0 million.
Lodging FDA estimates that there are approximately 440,000 food service
employees working in lodging establishments, at an average cost of $18 per hour. Based
on the estimated 9.8 percent of the lodging establishments that are subject to the proposed
requirements without having to register with FDA to become subject to the requirements,
there are approximately 43,000 food service employees at these lodging establishments.
This fraction is derived from the number of establishments estimated in this document,
6,200 divided by the total number of establishments from the 2008 County Business
Practices data. If each employee receives between 10 and 30 extra minutes of training,
then the formal employee training costs for lodging establishments would be between
� 9 The percent of covered employees at general merchandise stores is higher than for grocery and convenience stores because food service workers at these latter establishments are less likely to be involved in restaurant foods.
70
$0.1 million (43,000 x 1/6 hour x $18/hour) and $0.4 million (43,000 x 1/2 hour x
$18/hour), with an average cost of $0.3 million.
There are approximately 29,000 food service managers at lodging establishments.
Again using the 9.8 percent of lodging establishments that are subject to the proposed
requirements, without having to register with FDA to become subject to the requirements,
FDA estimates that there are approximately 2,800 food service managers that will need
training. The average cost of these managers is $31 per hour. If each manager needs four
to eight hours of training, then the wage cost to the industry will be between $0.3 million
(2,800 x 4 hour x $31/hour) and $0.7 million (2,800 x 8 hour x $31/hour), with an
average cost of $0.5 million. In total, the training costs for lodging places will be $0.4
million to $1.1 million, with a mean estimate of $0.8 million.
Entertainment, Sports and Recreation FDA estimates that there are
approximately 43,000 food service employees working in movie theaters, at an average
cost of $14 per hour. 2008 County Business Patterns data shows the total number of
theaters to be 5,120. The number of establishments estimated for this analysis is 2,800,
accounting for 54 percent of all movie theaters. Based on this fraction there are
approximately 23,000 food service employees at these establishments. There are 28,000
food service employees at other entertainment, sports or recreational establishments that
are not otherwise counted as employees of food service contractors. Out of roughly
110,000 total establishments in the 2008 County Business Patterns data, only 1 percent
sells restaurant or restaurant-type food and are part of chains of twenty or more. Based on
this 1 percent, approximately 300 employees would need training. If each employee
receives between 10 and 30 extra minutes of training, then the formal employee training
71
costs for all these establishments would be between $0.1 million (24,000 x 1/6 hour x
$16/hour) and $0.2 million (24,000 x 1/2 hour x $16/hour), with an average cost of $0.1
million.
Using the same 54 percent and 1 percent for managers, there are approximately
3,000 food service managers at these kinds of establishments. The average cost of these
managers is $36 per hour. If each manager needs four to eight hours of training, then the
wage cost to the industry will be between $0.4 million (3,000 x 4 hour x $36/hour) and
$0.9 million (3,000 x 8 hour x $36/hour), with an average cost of $0.7 million. In total,
the estimated training costs for entertainment, sports and recreation establishments will
be $0.5 million to $1.3 million, with a mean estimate of $1.0 million.
Transport Because of the way that food service is organized in the transportation
sector, almost all of the employees that would need the minimal training discussed in this
section would be counted as employees of the managed food service sector. Bureau of
Labor Statistics data show only a few hundred direct food service employees in the entire
transportation sector. Using NRA’s foodservice revenue numbers, approximately 5
percent of managed service sales are in the transport sector. Because FDA estimates that
76 percent of foodservice contractor establishments have at least 20 locations, we take
approximately 4 percent of the 423,000 foodservice employees, or 16,000 employees that
may need training. This yields training costs between $50,000 (16,000 x 1/6 hour x
$17/hour) and $140,000 (91,000 x 1/2 hour x $17/hour), with an average cost of $95,000.
Using the 4 percent proportion for managers, FDA estimates that approximately
2,000 managers would need training in this sector. The average cost of these managers is
$29 per hour. If each manager needs four to eight hours of training, then the wage cost to
72
the industry will be between $0.2 million (2,000 x 4 hour x $29/hour) and $0.5 million
(2,000 x 8 hour x $29/hour), with a mean cost of $0.4 million.
Managed Food Service Because the 4,500 establishments estimated for this
analysis account for 18 percent of the 25,500 total managed food service establishments
in 2008 County Business Practices, FDA estimates that approximately 91,000 employees
of the 423,000 total food service employees in this sector work at these establishments, at
an hourly cost of $17. If each employee receives between 10 and 30 extra minutes of
training, then the formal employee training costs for all these establishments would be
between $0.3 million (91,000 x 1/6 hour x $17/hour) and $0.8 million (91,000 x 1/2 hour
x $17/hour), with an average cost of $0.6 million.
Using the same 18 percent for managers, there are approximately 7,000 food
service managers at these kinds of establishments. The average cost of these managers is
$29 per hour. If each manager needs four to eight hours of training, then the wage cost to
this sector would be between $0.8 million (7,000 x 4 hour x $29/hour) and $1.6 million
(7,000 x 8 hour x $29/hour), with a mean cost of $1.2 million.
In total, training costs associated with the additional establishments analyzed in
Option 3 would be between $2.8 million and $6.3 million, with a mean added cost of $4.8
million.
Recurring Costs Given the estimated 100 percent turnover rate for restaurant
employees, general employee costs would recur annually. With the estimated 50 percent
turnover in managers, half of management training costs would recur annually. Training
costs for employees of new chains are within rounding margins for these estimates. These
recurring costs are between $1.7 million and $4.2 million with a mean of $3.1 million.
73
Annualized costs Because nearly all the initial training costs are recurring,
annualized training costs are calculated by adding the recurring costs to the difference
between the initial costs and the recurring costs annualized over 10 years at 3 percent and
7 percent discount rates. With a 3 percent discount rate, the annualized mean cost of
training for these additional establishments is estimated to be $26.8 million ($2.4 million
+ $212.9 million/8.79), or between $6.6 million and $47.4 million. With a 7 percent
discount rate, the annualized mean cost of training is estimated to be $30.9 million ($2.4
million + $212.9 million/7.52), or between $7.6 million and $54.7 million.
Table 12: Training Costs, Option 3 by Sector
Sector # employees
# managers Low Estimate
Mean Estimate High Estimate
General Merchandise Chains 31,000 4,000 $0.5 million $0.7 million $0.9 million
Lodging 43,000 4,000 $0.4 million $0.8 million $1.1 million
Entertainment, Sports and Recreation 62,000 3,000 $0.5 million $1.0 million $1.3 millionTransport 16,000 2,000 $0.3 million $0.5 million $0.6 million
Managed Food Service 91,000 7,000 $1.1 million $1.8 million $2.4 millionAdditional Initial Wage Costs of Training 152,000 13,000 $2.8 million $4.8 million $6.3 millionAdditional Recurring Training Costs 152,000 7,000 $1.7 million $3.1 million $4.2 million
Additional Annualized Training Costs 3% $1.8 million $3.3 million $4.4 million
Additional Annualized Training Costs 7% $1.8 million $3.3 million $4.5 million

74
The total additional costs of Option 3 are given in Table 13.
Table 13: Total Additional Costs of Option 3, by Sector
Sector Low Estimate Mean Estimate High Estimate General Merchandise Chains $2.2 million $5.0 million $7.8 million
Lodging $1.7 million $3.9 million $5.9 millionEntertainment, Sports and Recreation $4.7 million $11.2 million $17.5 million
Transport $1.1 million $2.2 million $3.3 million
Managed Food Service $2.9 million $6.9 million $10.8 millionAdditional Initial Costs, Option 3 $12.6 million $29.2 million $45.3 millionAdditional Recurring Costs, Option 3 $3.6 million $7.3 million $10.6 millionAdditional Annualized Costs, 3 Percent $4.8 million $10.1 million $15.0 millionAdditional Annualized Costs, 7 Percent $5.1 million $10.6 million $15.8 million
b. Benefits
Sectors considered under this option account for approximately 11.2 percent
($40,579,831/$361,824,164) of “meals, snacks & nonalcoholic beverages prepared for
immediate consumption” food sales relative to the establishments covered by the
proposed rule, as calculated using 2007 Economic Census Data. The additional costs of
Option 3 represent a 13.3 percent increase in annualized costs over those in Option 1.
This increase was calculated using the same formula as the cost change for Option 2. .
75
This estimate depends on a uniform response by consumers and chains to the
required nutrient information across all sectors. It is likely that different settings result in
different responses to the same required information. Therefore, these estimates may be
biased up or down depending on how consumer and chain response varies across sectors.
Furthermore, many of these additional do not have food as their primary business
activity. In these cases, the cost of compliance on these individual establishments,
relative to the importance or size of the food service, may constitute a substantially larger
regulatory burden than for the establishments covered in the proposed rule. FDA requests
comment and data on these estimates.
E. Option 4. Shorter Compliance Time
Option 4 is similar to the proposed requirements, but with a 3-month time compliance
time from the final rule.
With such a short time to compliance, most or all affected chains will need to
begin the process of compliance before the final rule has been published, meaning that
they may need to change their menus twice in order to comply with any changes made
between the proposed rule and the final rule. Because the proposal addresses include
issues that are integral to the design of the menu – such as treatment of disclosure for
variable menu items – this option would substantially increase the cost of compliance.
Such a short compliance time would also require chains with more disposable menus to
discard them prematurely, further driving up the cost of the proposed rule.
In addition to the costs estimated for the proposed requirements, FDA estimates
that the costs of menu and menu board redesign and replacement would increase by
76
approximately 25 percent, based on the ability of covered establishments to design in
anticipation of issues subject to change.
We estimate the additional costs of discarding and printing new menus for all full
service restaurants, or approximately 95,000 establishments. Using the same estimate as
in the analysis of the proposed rule, of 91 menus per establishment, the estimated cost of
menu replacement for full service restaurants is between $8.7 million (95,000
establishments x 91 menus/establishment x $1/menu) and $26.0 million (95,000
establishments x 91 menus/establishment x $3/menu) with a mean estimate of $17.4
million. All other menu or menu board related costs increase by 25 percent, these menu-
related costs are given in Table 14.
Annualized costs The annualized costs are calculated by adding the recurring
costs to initial costs annualized over 10 years at 3 percent and 7 percent discount rates.
With a 3 percent discount rate, the annualized mean cost of menu update for this option is
estimated to be $1.4 million, or between $0.5 million and $2.4 million. With a 7 percent
discount rate, the annualized mean cost of menu update for these additional sectors is
estimated to be $1.7 million or between $0.5 million and $2.8 million.
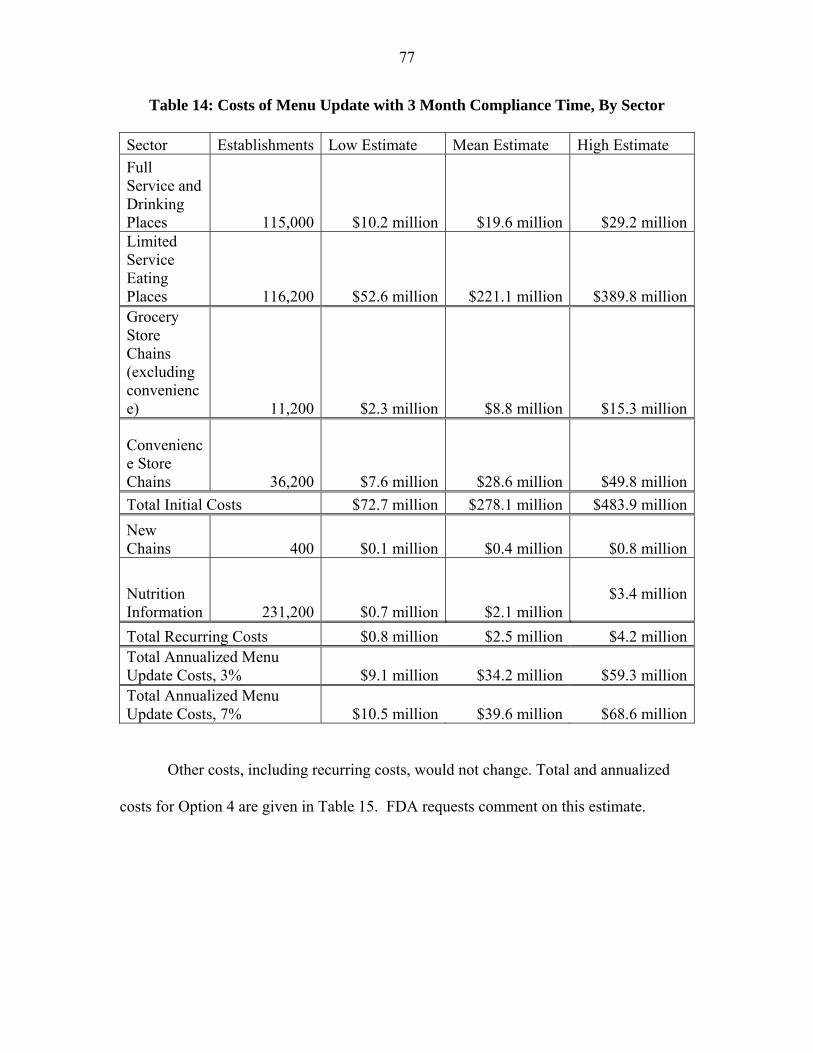
77
Table 14: Costs of Menu Update with 3 Month Compliance Time, By Sector
Sector Establishments Low Estimate Mean Estimate High Estimate
Full Service and Drinking Places 115,000 $10.2 million $19.6 million $29.2 millionLimited Service Eating Places 116,200 $52.6 million $221.1 million $389.8 millionGrocery Store Chains (excluding convenience) 11,200 $2.3 million $8.8 million $15.3 million
Convenience Store Chains 36,200 $7.6 million $28.6 million $49.8 million
Total Initial Costs $72.7 million $278.1 million $483.9 million
New Chains 400 $0.1 million $0.4 million $0.8 million
Nutrition Information 231,200 $0.7 million $2.1 million
$3.4 million
Total Recurring Costs $0.8 million $2.5 million $4.2 millionTotal Annualized Menu Update Costs, 3% $9.1 million $34.2 million $59.3 millionTotal Annualized Menu Update Costs, 7% $10.5 million $39.6 million $68.6 million
Other costs, including recurring costs, would not change. Total and annualized
costs for Option 4 are given in Table 15. FDA requests comment on this estimate.
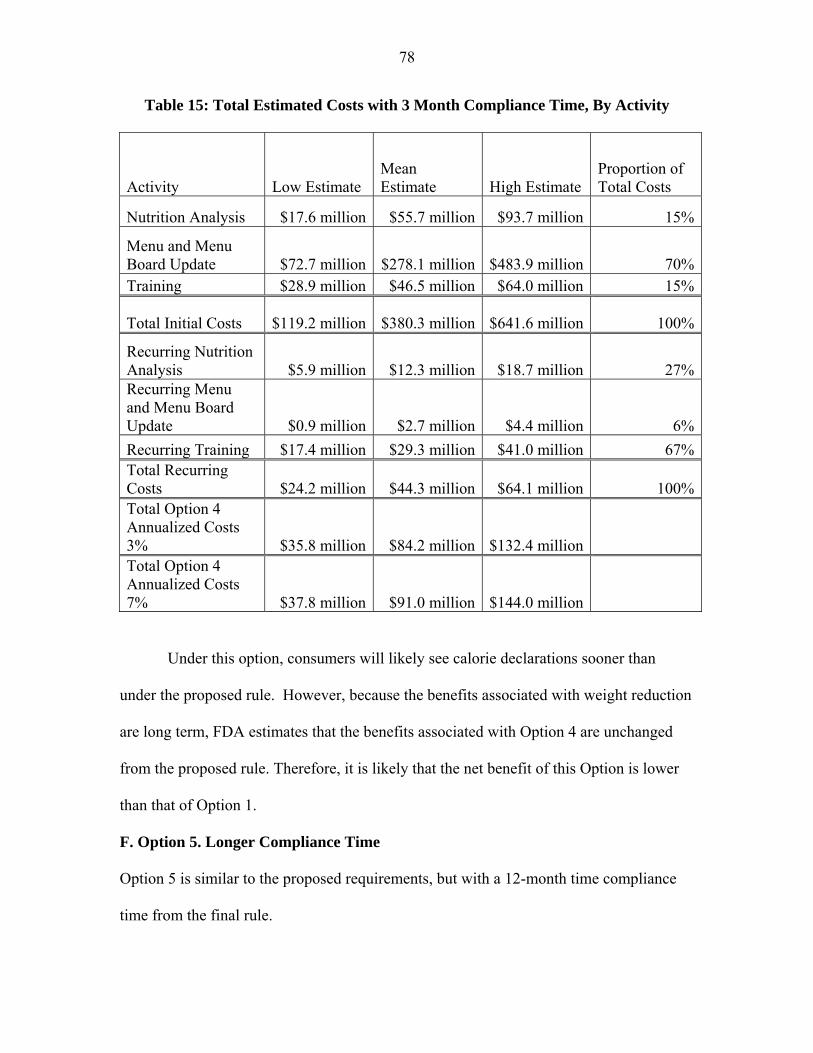
78
Table 15: Total Estimated Costs with 3 Month Compliance Time, By Activity
Activity Low Estimate Mean Estimate High Estimate
Proportion of Total Costs
Nutrition Analysis $17.6 million $55.7 million $93.7 million 15%
Menu and Menu Board Update $72.7 million $278.1 million $483.9 million 70%Training $28.9 million $46.5 million $64.0 million 15%
Total Initial Costs $119.2 million $380.3 million $641.6 million 100%
Recurring Nutrition Analysis $5.9 million $12.3 million $18.7 million 27%Recurring Menu and Menu Board Update $0.9 million $2.7 million $4.4 million 6%
Recurring Training $17.4 million $29.3 million $41.0 million 67%Total Recurring Costs $24.2 million $44.3 million $64.1 million 100%Total Option 4 Annualized Costs 3% $35.8 million $84.2 million $132.4 million Total Option 4 Annualized Costs 7% $37.8 million $91.0 million $144.0 million
Under this option, consumers will likely see calorie declarations sooner than
under the proposed rule. However, because the benefits associated with weight reduction
are long term, FDA estimates that the benefits associated with Option 4 are unchanged
from the proposed rule. Therefore, it is likely that the net benefit of this Option is lower
than that of Option 1.
F. Option 5. Longer Compliance Time
Option 5 is similar to the proposed requirements, but with a 12-month time compliance
time from the final rule.
79
Under the analysis of the proposed requirements, the only cost that was estimated
as dependent on the timing of compliance as the cost of menu replacement for full-
service restaurants. Extending the effective date by 6 months relative to the proposed rule
would allow more of these restaurants to coordinate menu replacement with an already
scheduled menu change. We had estimated in the analysis of the proposed requirements
that the cost of menu replacement for these restaurants was between $0 and $13.0 million
(47,800 establishments x 91 menus/establishment x $3/menu) with a mean estimate of
$4.3 million (23,900 establishments x 91 menus/establishment x $2/menu). Extending the
effective date to 12 months could then save up to $13 million. All other costs would still
apply. Subtracting these costs from those estimated for the proposed requirements yields
annualized costs of $76.2 million, with low and high estimates of $31.9 million and
$120.5 million at a 3 percent discount rate or $81.6 million, with low and high estimates
of $33.2 million and $130.1 million. FDA recognizes that there may be additional
savings from an extension of the effective date from logistical issues. FDA requests
comment and data on how a longer time to compliance would affect costs. An increase
in the time to compliance is unlikely to substantially affect any ongoing stream of
benefits from the proposed requirements. However, because of the attention that menu
labeling is currently receiving, to the extent that this attention may be declining over
time, delaying compliance may reduce the initial impact of the requirements.
G. Uncertainty Analysis
Table 1a shows that the estimated annualized cost of the proposed requirements
range from $33.4 million to $130.1 million. FDA has identified several areas of
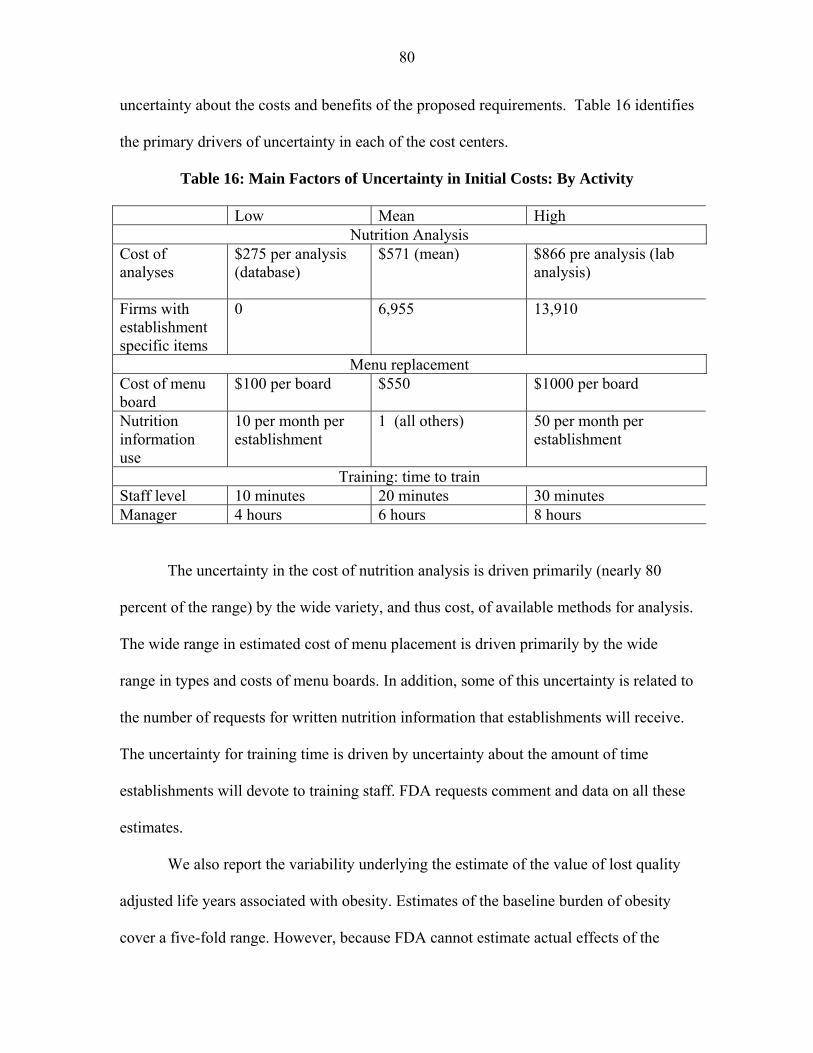
80
uncertainty about the costs and benefits of the proposed requirements. Table 16 identifies
the primary drivers of uncertainty in each of the cost centers.
Table 16: Main Factors of Uncertainty in Initial Costs: By Activity
Low Mean High Nutrition Analysis
Cost of analyses
$275 per analysis (database)
$571 (mean) $866 pre analysis (lab analysis)
Firms with establishment specific items
0 6,955 13,910
Menu replacement Cost of menu board
$100 per board $550 $1000 per board
Nutrition information use
10 per month per establishment
1 (all others) 50 per month per establishment
Training: time to train Staff level 10 minutes 20 minutes 30 minutes Manager 4 hours 6 hours 8 hours
The uncertainty in the cost of nutrition analysis is driven primarily (nearly 80
percent of the range) by the wide variety, and thus cost, of available methods for analysis.
The wide range in estimated cost of menu placement is driven primarily by the wide
range in types and costs of menu boards. In addition, some of this uncertainty is related to
the number of requests for written nutrition information that establishments will receive.
The uncertainty for training time is driven by uncertainty about the amount of time
establishments will devote to training staff. FDA requests comment and data on all these
estimates.
We also report the variability underlying the estimate of the value of lost quality
adjusted life years associated with obesity. Estimates of the baseline burden of obesity
cover a five-fold range. However, because FDA cannot estimate actual effects of the
81
proposed requirements on obesity reduction, and because the estimated costs of the rule
are so small relative to the estimated costs of obesity, the break-even point is not
particularly sensitive to the variability in these values.
III. References
1. Parsa, H.G., John T. Self, David Njite and Tiffany King. “Why Restaurants
Fail.” Cornell Hotel and Restaurant Administration Quarterly, 46(3): 304-322,
August 2005.
2. US Census Bureau. County Business Patterns, United States NAICS 722
2000-2008, http://www.census.gov/econ/cbp/index.html, accessed October 18,
2010.
3. Wootan, M. and M. Osborn. “Availability of Nutrition Information from
Chain Restaurants in the United States.” American Journal of Preventive
Medicine, 30(3): 266-268, March 2006.
4. Finkelstein, E.A. and K.L. Strombotne. “The Economics of Obesity.”
American Journal of Clinical Nutrition, 91(5): 1520S-1524S, May 2010.
5. Philipson, T. and R. Posner. “Is the Obesity Epidemic a Public Health
Problem? A Decade of Research on the Economics of Obesity.” NBER
Working Paper Series, 14010, May 2008.
6. Downs, J.S., G. Loewenstein, and J. Wisdom. “Strategies for Promoting
Healthier Food Choices.” American Economic Review: Papers and
Proceedings, 99(2): 1-10, 2009.
7. O’Donoghue, T. and M. Rabin. “The Economics of Immediate Gratification.”
Journal of Behavioral Decision Making, 13(2): 233-250, 2000.
82
8. O’Donoghue, T. and M. Rabin. “Doing it Now or Later.” American
Economic Review, 89(1): 103-124, 1999.
9. Flegal K.M., M.D. Carroll, C.L. Ogden, and L.R. Curtin. “Prevalence and
Trends in Obesity Among U.S. Adults 1999-2008.” Journal of the American
Medical Association, 303:235-241, 2010.
10. Ogden, C.L. and M.D. Carroll. “Prevalence of Overweight, Obesity, and
Extreme Obesity Among Adults: United States, Trends 1976–1980 Through
2007–2008.” National Center for Health Statistics, June 2010.
www.cdc.gov/NCHS/data/hestat/obesity_adult_07_08/obesity_adult_07_08.p
df., accessed on October 17, 2010.
11. Ogden, C.L., M.D. Carroll, L.R. Curtin, M.M. Lamb, and K.M. Flegal.,
“Prevalence of High Body Mass Index in US Children and Adolescents, 2007-
2008,” Journal of American Medical Association, 303(3), 242-249, 2010.
12. Sullivan, P.W., V. Ghusheyan, and R.H. Ben-Joseph. “The Effect of Obesity
and Cardiometabolic Risk Factor on Expenditures and Productivity in the
US.” Obesity, 16: 2155 – 2162, 2008.
13. Ali, M.M., A. Amialchuk, and F. Renna, “Social Network and Weight
Misperception among Adolescents.” Southern Economic Journal,
Forthcoming, 2010a.
14. Cawley, J., K. Joyner, and J. Sobal. “Size Matters: The Influence of
Adolescent’s Weight and Height on Dating and Sex.” Rationality and Society,
18(1): 67 – 94, 2006.
83
15. Ali, M.M., H. Fang, H. and J. Rizzo (2010b). “Body Weight, Self-Perception
and Mental Health among Adolescents.” Journal of Mental Health Policy and
Economics, 13(2): 53 – 63, 2010b.
16. Puhl, R., and K.D. Brownell. “Bias, Discrimination, and Obesity.” Obesity
Research, 9(12): 788-805, 2001.
17. Cawley, J. “The Impact of Obesity on Wages.” Journal of Human Resources,
39(2): 451 – 474, 2004.
18. Finkelstein, E.A., J.G. Trogdon, J.W. Cohen, and W. Dietz. “Annual Medical
Spending Attributable to Obesity: Payer- and Service-Specific Estimates.”
Health Affairs, 28(5): w822-w831, 2009.
19. Wang, Y., M.A. Beydoun, L. Liang, B. Cabellero, and S.K. Kumanyika.
“Will all Americans become Overweight or Obese? Estimating the
Progression and Cost of the US Obesity Epidemic.” Obesity, 16(10): 2323 –
2330, 2008.
20. U.S. Department of Health and Human Services and U.S. Department of
Agriculture, “2010 Dietary Guidelines for Americans,” 7th ed., Washington
DC: U.S. Government Printing Office, 2010.
21. Lakdawalla, D., T.J. Philipson. “The Growth of Obesity and Technological
Change: A Theoretical and Empirical Examination,” NBER Working Paper
No. 8946, 2002.
22. Philipson, T. J. and R.A. Posner. “The Long-Run Growth in Obesity as a
Function of Technological Change.” NBER Working Paper No. 7423, 1999.
84
23. Lin, B-H., J. Guthrie and E. Frazão. "Nutrient Contribution of Food Away
From Home." In America's Eating Habits: Changes and Consequences,
Elizabeth Frazão (ed), USDA Agriculture Information Bulletin No. (AIB750),
May 1999.
24. Mancino, L., J. Todd, and B.H. Lin. “Separating what We Eat from where:
Measuring the Effect of Food Away from Home on Diet.” Food Policy, 34:
557 – 562, 2009.
25. Robert Wood Johnson Foundation. “Menu Labeling: Does Providing
Nutrition Information at the Point of Purchase Affect Consumer Behavior?”
Healthy Eating Research, 2009.
26. Smith, T.A., B.-H. Lin. and J.-Y. Lee. “Taxing Caloric Sweetened Beverages:
Potential Effects on Beverage Consumption, Calorie Intake, and Obesity.”
Economic Research Report, ERR-100, July 2010.
27. US Census Bureau. “2007 North American Industry Classification System.”
2007. http://www.census.gov/eos/www/naics/index.html, accessed on October
18, 2010.
28. US Census Bureau. “FAQS (Ask Dr. NAICS),”
http://www.census.gov/eos/www/naics/faqs/faqs.html., accessed on February
16, 2011.
29. RTI International. “FDA Labeling Cost Model, Final Report.” Prepared for
Amber Jessup, DHHS/PHS/FDA/CFSAN. Prepared by Muth, M., E. Gledhill,
and S. Karns. RTI Project Number 06673.010. January 2003.
30. Silliker Inc. “Silliker Information.” Memo to File, September 8, 2010.
85
31. Anderson, M.L. and D.A. Matsa. “Online Appendix for ‘Are Restaurants
Really Supersizing America?’”
http://www.aeaweb.org/include/forthcoming_test_include/output/retrieve_file.
php?id=506, accessed on October 20, 2010.
32. RL Food Testing Laboratory. “Quality Nutrition Analysis.”
http://www.rlfoodtestinglaboratory.com/services.asp, accessed on September
23, 2010.
33. FoodCalc LLC. “Menucalc Plans.”
http://www.menucalc.com/recipeanalysisplans.aspx, accessed on September
23, 2010.
34. Bureau of Labor Statistics, U.S. Department of Labor, Occupational
Employment Statistics, http://www.bls.gov/oes/current/oes_nat.htm, accessed
on September 23, 2010.
35. Eastern Research Group, Inc. “Evaluation Of Recordkeeping Costs For Food
Manufacturers, Final Report.” Prepared for Andy Estrin and Cristina
McLaughlin DHHS/PHS/FDA/CFSAN. Prepared by Aylin Sertkaya, Ayesha
Berlind and Seda Erdem. Contract No. 223-01-2461, Task Order Number 5,
February 2007.
36. NPD Group. “FDA Report,” ReCount Restaurant Census. Spring 2010.
37. Technomic Inc. “FDA Report” MenuMonitor, Summer 2010.
38. Editors. “2010 North American Food Retailers.” Supermarket News, 58(4) 6-
9, January 25, 2010.
86
39. Zwiebach, E. “Under the Radar: Top 50 Independents.” Supermarket News,
14-20, February 8, 2010.
40. Longo, D. “Acquisition Pace Quickens in 2010, but Despite Consolidation,
Top Chains Still Account for Nearly 40 Percent of Industry’s Total Stores.”
Convenience Store News, 46(10): 31-36, July 26, 2010.
41. U.S. Census Bureau. “Sector 72: Sub: Single Unit & Multiunit Firms for the
U.S: 2007.” 2007 Economic Census,
http://factfinder.census.gov/home/saff/main.html?_lang=en, accessed on
February 16, 2011.
42. Mintel Menu Insights “New menu items at restaurants” Memo to File.
February, 2010.
43. Display Signs & Design “Order/Get Menu Pricing” website
http://www.dsdsign.com/Pages/menus3.htm. accessed on October 6, 2010.
44. Memo to File. McDonald’s meeting October 4, 2010.
45. U.S. Census Bureau. “Sector 72: Sub: Seating Capacity for the U.S. and
States: 2007.” 2007 Economic Census,
http://factfinder.census.gov/home/saff/main.html?_lang=en. Accessed
February 16, 2011.
46. Bureau of Labor Statistics. “Job Openings and Labor Turnover Survey:
Accommodation and food services, Total US, Total Separations, Rate, Series
Id: JTU72000000TSR (3,9),” accessed February 16, 2011.
47. Berta, D. “Paying Attention to Retention.” Nation’s Restaurant News, 42(4):
24-24, January 28, 2008.
87
48. Ruggles, R. “KFC’s New Computer-Based Training Program Proves a Time
Saver and Better Tool for Learning.” Nation’s Restaurant News, 31(50): 40,
December 15, 1997.
49. Bureau of Labor Statistics. “Occupational Employment Statistics Query
System: SOC code 350000, NAICS 7221,7222,7224,”
http://www.bls.gov/oes/data.htm., accessed February 16, 2011.
50. Bureau of Labor Statistics. “Occupational Employment Statistics Query
System: SOC code 351012, NAICS 7221,7222,7224,”
http://www.bls.gov/oes/data.htm., accessed February 16, 2011.
51. Bureau of Labor Statistics. “Occupational Employment Statistics Query
System: SOC code 119051, NAICS 7221,7222,7224,”
http://www.bls.gov/oes/data.htm., accessed February 16, 2011.
52. Dumanovsky T, C.Y. Huang, M.T. Bassett, and L.D. Silver. “Consumer
Awareness of Fast-Food Calorie Information in New York City After
Implementation of a Menu Labeling Regulation.” American Journal of Public
Health, 2010:e1-e6
53. Bollinger, B., P. Leslie, and A. Sorensen. "Calorie Posting in Chain
Restaurants." American Economic Journal: Economic Policy, 2011, 3(1): 91–
128, 2011.
54. Bassett, M. T., T. Dumanovsky, C. Huang, L. D. Silver, C. Young, C. Nonas,
T. D. Matte, S. Chideya, and T. R. Frieden. "Purchasing Behavior and Calorie
Information at Fast-Food Chains in New York City, 2007." American Journal
of Public Health, 98(8):1457-59, 2008.
88
55. Downs, J.S., G. Lowenstein, and J. Wisdom, J. “The Psychology of Food
Consumption: Strategies for Promoting Healthier Food Choices”. American
Economic Review: Papers & Proceedings, 99(2): 159-164, 2009.
56. Elbel, B., R. Kersh, V. L. Brescoll, and L. B. Dixon. "Calorie Labeling And
Food Choices: A First Look At The Effects On Low-Income People In New
York City." Health Affairs, 28(6):W1110-W1121, 2009.
57. Yamamoto, J.A., J.B. Yamamoto, B.E. Yamamoto, and L.G. Yamamoto.
“Adolescent Fast Food and Restaurant Ordering Behavior with and without
Calorie and Fat Content Menu Information.” Journal of Adolescent Health,
37: 397-402, 2005.
58. Variyam, J.N. “Do Nutrition Labels Improve Dietary Outcomes? Health
Economics, 17: 695 – 708, 2008.
59. Finkelstein, E.A., L. Kiersten, N.L. Strombotne, L. Chan and J. Krieger.
“Mandatory Menu Labeling in One Fast-Food Chain in King County,
Washington,” American Journal of Preventive Medicine, 40(2):122-127,
2011.
60. Elbel, B., J. Gyamfi, and R. Kersh. “Child and Adolescent Fast-Food Choice
and the Influence of Calorie Labeling: A Natural Experiment,” International
Journal of Obesity, Advance online publication, February 15, 2011
http://www.nature.com/ijo/journal/vaop/ncurrent/pdf/ijo20114a.pdf, accessed
onFebruary 16, 2011.
89
61. Tandon, P. S., J. Wright, C. Zhou, C. B. Rogers, and D. A. Christakis.
"Nutrition Menu Labeling May Lead to Lower-Calorie Restaurant Meal
Choices for Children." Pediatrics, 125(2):244-48, 2010.
62. Cutler, D. M. and E. Richardson, “Measuring the Health of the U.S.
Population,” Brookings Paper, Microeconomics, pp. 217–271, 1997.
63. Jia, H. and E. Lubetkin. “Obesity-Related Quality-Adjusted Life Years Lost in
the U.S. from 1993-2008,” American Journal of Preventive Medicine,
39(3):220-227, 2010.
64. Jia, H. and E. Lubetkin. “Trends in Quality-Adjusted Life-Years Lost
Contributed by Smoking and Obesity,” American Journal of Preventive
Medicine, 38(2):138-144, 2010.
65. U.S. Census Bureau, Statistical Abstract of the United States: 2011 (130th
Edition) Washington, DC, 2010; <http://www.census.gov/statab/www/>.
66. Hall, K. and P. Jordan. “Modeling Weight-Loss Maintenance to Help Prevent
Body Weight Regain,” American Journal of Clinical Nutrition, 88:1495-
1503, 2008.
67. U.S. Census Bureau. “Sectors 44-45: Sub: Single Unit & Multiunit Firms for
the U.S: 2007.” 2007 Economic Census,
http://factfinder.census.gov/home/saff/main.html?_lang=en., accessed on
February 16, 2011.
68. US Census Bureau. “Sector 72: Sub: Single Unit & Multiunit Firms for the
US: 2007.” 2007 Economic Census,
90
http://factfinder.census.gov/home/saff/main.html?_lang=en, accessed on
February 16, 2011.
69. US Census Bureau. “Sector 71: Sub: Single Unit & Multiunit Firms for the
US: 2007.” 2007 Economic Census,
http://factfinder.census.gov/home/saff/main.html?_lang=en, accessed on
February 16, 2011.
70. US Census Bureau. “Sector 51: Sub: Single Unit & Multiunit Firms for the
US: 2007.” 2007 Economic Census,
http://factfinder.census.gov/home/saff/main.html?_lang=en, accessed on
February 16, 2011.
71. National Restaurant Association. 2010 Restaurant Industry Forecast,
Washington DC, 2010.
72. Air Transport Association. When American Flies, it Works: 2010 Economic
Report, Washington DC, 2010.
73. Global Airline Industry Program, “Total Operating Fleet,” Airline Data
Project. MIT 2010 http://web.mit.edu/airlinedata/www/default.html, accessed
on February 16, 2011.
74. Global Airline Industry Program, “Average Seat Capacity of Total Operating
Fleet,” Airline Data Project. MIT 2010
http://web.mit.edu/airlinedata/www/default.html, accessed on February 16,
2011.
75. Bureau of Transportation Statistics. “Appendix D – Modal Profiles, Rail
Profile,” National Transportation Statistics.
91
http://www.bts.gov/publications/national_transportation_statistics/#appendix_
d, accessed on February 16, 2011.
76. Amtrak. The Partner of Choice: Annual Report FY 2009, Amtrak,
Washington DC.
77. Bureau of Transportation Statistics. National Census of Ferry Operators. 2008.
http://www.transtats.bts.gov/DatabaseInfo.asp?DB_ID=616&Link=0.,
accessed on February 16, 2008.