food labeling: nutrition labeling of standard menu … · center for food safety and applied...
TRANSCRIPT
DEPARTMENT OF HEALTH AND HUMAN SERVICES
Food and Drug Administration
Food Labeling: Nutrition Labeling of Standard Menu Items in
Restaurants and Similar Retail Food Establishments
Final Regulatory Impact Analysis FDA–2011–F–0172
Office of Regulations, Policy, and Social Sciences Center for Food Safety and Applied Nutrition
NOVEMBER 2014
2
SUMMARY: The Food and Drug Administration (FDA) is finalizing requirements for
providing certain nutrition information for standard menu items in certain chain restaurants and
similar retail food establishments, to implement the menu labeling provisions of the Patient
Protection and Affordable Care Act of 2010 (Affordable Care Act). The Affordable Care Act, in
part, amended the Federal Food, Drug and Cosmetic Act (FD&C Act), among other things, to
require restaurants and similar retail food establishments (R/SRFE) that are part of a chain with
20 or more locations, doing business under the same name and offering for sale substantially the
same menu items, to provide calorie and other nutrition information for standard menu items,
including food on display and self-service food. Under provisions of the Affordable Care Act,
restaurants and similar retail food establishments not otherwise covered by the law may elect to
become subject to the Federal requirements by registering every other year with the FDA. The
analysis of benefits and costs included in this document is the basis for the summary analysis
included in the Food Labeling: Nutrition Labeling of Standard Menu Items in Restaurants and
Similar Retail Food Establishments final rule [FDA-2011-F-0172].
3
Table of Contents I. INTRODUCTION ........................................................................................................................4
A. Summary of Costs and Benefits of the Final Requirements .................................................6 Summary of Costs ................................................................................................................6 Summary of Potential Benefits ............................................................................................7 Summary of Costs and Benefits of Menu Labeling and Vending Machine Rules ..............9
B. Need for This Regulation ....................................................................................................10 C. Comments on the Preliminary Regulatory Impact Analysis and Our Responses ...............13
II. COSTS AND BENEFITS OF REGULATORY OPTIONS .....................................................29 A. Baseline: No New Regulatory Action .................................................................................30 B. Option 1: The Final Rule .....................................................................................................31
Estimated Costs ..................................................................................................................33 Cost of Nutrition Analysis ...........................................................................................34 Cost of Menu Replacement ..........................................................................................46 Cost of Training ...........................................................................................................53 Cost of Legal Review...................................................................................................59 Cost of Voluntary Registration (Not Quantified) ........................................................60 Cost of Voluntary Reformulation (Not Quantified).....................................................61 Total Costs for the Final Requirements .......................................................................61
Potential Benefits ...............................................................................................................62 Translating Changes in Behavior from Menu Labeling into Potential Welfare Gains 63 Welfare Estimates ........................................................................................................66 Stream of Benefits........................................................................................................76 Total Net Benefits ........................................................................................................78 Literature on the Potential Effects of Menu Labeling on Consumer Behavior ...........79 Alternative Calculation of Benefits (Not Included in Final Estimates) .......................84 Other Benefits (Not Quantified) ..................................................................................95
Uncertainty of Costs and Potential Benefits ......................................................................96 C. Option 2: Limited Scope ...................................................................................................100
Costs .................................................................................................................................100 Benefits ............................................................................................................................102
D. Option 3. Shorter Compliance Time .................................................................................103 Estimated Costs ................................................................................................................103 Potential Benefits .............................................................................................................104
III. REGULATORY FLEXIBILITY ANALYSIS ......................................................................105 A. Introduction .......................................................................................................................105 B. Estimating the Number of Covered Small Businesses ......................................................106 C. Regulatory Options ...........................................................................................................107 D. Summary ...........................................................................................................................108
IV. UNFUNDED MANDATES ..................................................................................................109 V. APPENDIX A .........................................................................................................................111 VI. APPENDIX B ........................................................................................................................121 VII. APPENDIX C.......................................................................................................................124 VIII. REFERENCES....................................................................................................................126
4
I. INTRODUCTION
We have examined the impacts of the final rule under Executive Orders 12866 and
13563, the Regulatory Flexibility Act (5 U.S.C. 601-612), and the Unfunded Mandates Reform
Act of 1995 (Public Law 104-4). Executive Orders 12866 and 13563 direct agencies to assess all
costs and benefits (both quantitative and qualitative) of available regulatory alternatives and, if
regulation is necessary, to select regulatory approaches that maximize net benefits (including
potential economic, environmental, public health and safety effects, distributive impacts, and
equity). Executive Order 13563 emphasizes the importance of quantifying both costs and
benefits, reducing costs, harmonizing rules, and promoting flexibility. This rule is designated an
“economically” significant rule, under section 3(f)(1) of Executive Order 12866. Accordingly,
the rule was reviewed by the Office of Management and Budget.
In particular, Executive Order 12866 directs each agency engaged in rulemaking to
"identify the problem that it intends to address"-- that is, the essential purpose of the rule. As a
separate step in its rulemaking, Executive Order 12866 directs the agency to "assess both the
costs and the benefits of the intended regulation ... , recognizing that some costs and benefits are
difficult to quantify." Executive Order 13563 confirms that "each agency is directed to use the
best available techniques to quantify anticipated present and future benefits and costs as
accurately as possible. Where appropriate and permitted by law, each agency may consider (and
discuss qualitatively) values that are difficult or impossible to quantify.” Here, the essential
purpose of the rule is to make nutrition information for certain foods available to consumers in a
direct, accessible, and consistent manner to enable consumers to make informed dietary choices.
The following analysis of anticipated and quantifiable costs and benefits from the promulgation
of the rule does not alter this fundamental purpose.
5
The Regulatory Flexibility Act requires agencies to analyze regulatory options that would
minimize any significant impact of a rule on small entities. We use the Small Business
Administration (SBA) definitions of small for industrial subsectors in accommodations, food
service, recreation, and retail food stores.
Section 4205 of the Affordable Care Act and the finalized requirements apply to chain
retail food establishments, as that term is used in this document [i.e., a restaurant or similar retail
food establishment that is part of a chain with 20 or more locations doing business under the
same name (regardless of the type of ownership of the locations) and offering for sale
substantially the same menu items], and establishments that voluntarily register with FDA to
become subject to the requirements of section 4205. Some chain retail food establishments may
meet the SBA definitions: less than $7 million in annual sales for most accommodation and food
service or recreation subsectors; less than $20.5 million in annual sales for Food Service
Contractors; or less than $27 million in annual sales for supermarkets and convenience store
chains. In addition, some chain retail food establishments are owned or operated by entities,
including franchisees or cooperative members that may meet the SBA definitions described
above.
Finally, establishments that voluntarily register to become subject to the Federal
requirements may be individually-owned or part of a firm that controls establishments within a
chain of fewer than 20 locations. These firms may meet the SBA definition described above.
Therefore, the agency concludes that the rule will have a significant economic impact on a
substantial number of small entities.
Section 202(a) of the Unfunded Mandates Reform Act of 1995 requires that agencies
prepare a written statement, which includes an assessment of anticipated costs and benefits,
6
before finalizing “any rule that includes any Federal mandate that may result in the expenditure
by State, local, and tribal governments, in the aggregate, or by the private sector, of
$100,000,000 or more (adjusted annually for inflation) in any one year.” The current threshold
after adjustment for inflation is $141 million, using a recent (2013) Implicit Price Deflator for the
Gross Domestic Product. We expect this final rule to result in 1-year expenditures that would
meet or exceed this amount.
A. SUMMARY OF COSTS AND BENEFITS OF THE FINAL REQUIREMENTS
Summary of Costs
Meeting the requirements of this final rule will lead to costs for both the industry and
consumers. Typically, new costs to an industry are borne by both consumers and firms: prices
rise to reflect new costs, but generally not by enough to completely offset them. If the expense of
meeting the final requirements causes prices to increase for some or all standard menu items
offered for sale by covered establishments, then the consumption of these foods will fall, further
reducing profits for some, or all, of these establishments. Consumers would need to pay more
for this food, requiring some reduction in other, valued, consumption.
The major elements of cost for this final rule are:
1. Collecting and managing records of nutritional analysis for each standard menu item.
2. Revising or replacing existing menus, menu boards, and providing full written
nutrition information.
3. Training employees to understand nutrition information in order to help ensure
compliance with the final requirements.
4. Legal review.
7
These costs have been aggregated across an estimate of the total number of chains and
establishments that would be defined as covered under the rule.
We estimate that there would be approximately 298,600 covered establishments,
organized under 2,130 chains. Our estimate of the mean initial cost of complying with the final
requirements is $388.43 million, with a mean recurring cost of $55.13 million. Annualized over
20 years1, the mean estimated annual cost of the final requirements is $76.90 million at a 3
percent discount rate, and $84.50 million at a 7 percent discount rate. We estimate the range of
annualized costs for the final requirements to be $46.91 million to $106.56 million under a 3
percent discount rate, and $53.38 million to $115.28 million under a 7 percent discount rate.
Although not required by the final rule, some chains or establishments may respond to
increased consumer interest on caloric content standard menu items by reformulating existing
menu items or by introducing new, lower calorie items. While the change in manufacturing
costs associated with reformulating these items has not been included in the cost estimation, we
include the cost associated with analyzing the nutrition information of new or reformulated
items.
Summary of Potential Benefits
Obesity and overweight are major public health concerns in the United States. Nationally
representative data from the National Center for Health Statistics reveal that 34 percent of adults
in the U.S. are obese and 34 percent are overweight (Ref. 1). In addition, about 31 percent of
children and adolescents, aged 2 to 19, are overweight or obese (Ref. 2).
The primary risk factors for overweight and obesity in the general population (i.e., not
including those with significant health disorders) are overconsumption of calories (i.e. eating
8
more calories than are needed to maintain body weight) and inadequate physical activity (i.e.
getting an amount of exercise below the amount required to burn excess calories consumed over
the amount needed to maintain body weight) (Ref. 2). Food offered for sale by restaurants and
similar retail food establishments represent one of the many complex factors that contribute to
over-consumption and obesity. It is estimated that the proportion of total food calories
consumed at restaurants increased from 18% in the 1970s to 32% in the 1990s (Ref. 3).
Restaurant foods typically have more calories, fat and larger portion sizes (Ref. 4), and they tend
to be lower in fiber and other essential nutrients than home-prepared foods (Ref. 5).
The estimated benefits from this final rule stem from the nutrition information made
available to consumers in a direct and accessible manner to enable consumers to make informed
and healthful dietary choices, and are based on the assumption that increasing the accessibility of
the nutrition information for certain foods will increase the likelihood that consumers will use
them to make informed and healthful dietary choices. Specifically, the benefits estimates
presented below are contingent on our predictions regarding the consumer and industry response
to this rule, including:
1. Increased awareness regarding the caloric content for foods offered for sale by covered
establishments, which may help reduce the present-bias in consumer preferences, thus
encouraging the consumption of lower calorie options.
2. Increased consumer interest in lower calorie options, and greater transparency
regarding calorie content of menu items, which may give firms an incentive to:
a. Reduce the calorie content of existing items through reformulation or by
decreasing portion sizes.
b. Provide additional menu items with lower calorie formulations.
9
These changes may reduce consumers’ caloric intake from foods sold in covered
establishments,2 and this reduction in caloric intake may in turn contribute to a reduction in
obesity in the U.S. population. Finally, to the extent that, in addition to considering the calorie
information, consumers also request and use the written nutrition information required by the
rule, we include those associated benefits.
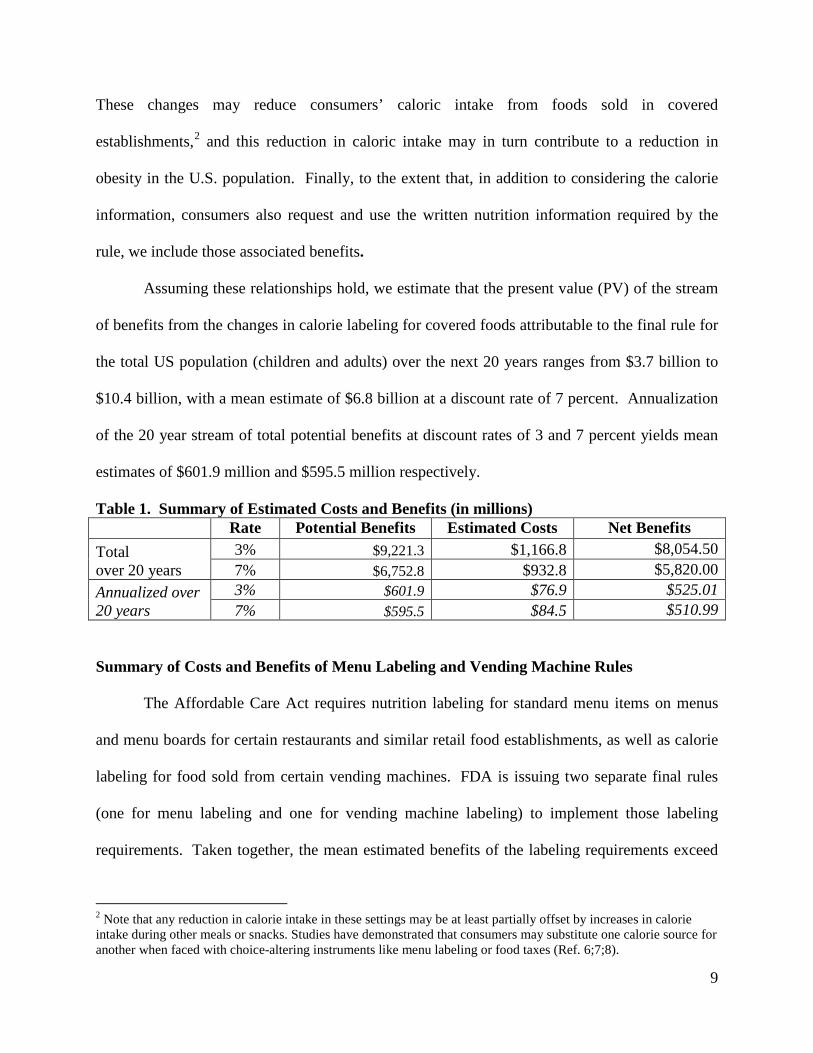
Assuming these relationships hold, we estimate that the present value (PV) of the stream
of benefits from the changes in calorie labeling for covered foods attributable to the final rule for
the total US population (children and adults) over the next 20 years ranges from $3.7 billion to
$10.4 billion, with a mean estimate of $6.8 billion at a discount rate of 7 percent. Annualization
of the 20 year stream of total potential benefits at discount rates of 3 and 7 percent yields mean
estimates of $601.9 million and $595.5 million respectively.
Table 1. Summary of Estimated Costs and Benefits (in millions) Rate Potential Benefits Estimated Costs Net Benefits
Total over 20 years
3% $9,221.3 $1,166.8 $8,054.50 7% $6,752.8 $932.8 $5,820.00
Annualized over 20 years
3% $601.9 $76.9 $525.01 7% $595.5 $84.5 $510.99
Summary of Costs and Benefits of Menu Labeling and Vending Machine Rules
The Affordable Care Act requires nutrition labeling for standard menu items on menus
and menu boards for certain restaurants and similar retail food establishments, as well as calorie
labeling for food sold from certain vending machines. FDA is issuing two separate final rules
(one for menu labeling and one for vending machine labeling) to implement those labeling
requirements. Taken together, the mean estimated benefits of the labeling requirements exceed
2 Note that any reduction in calorie intake in these settings may be at least partially offset by increases in calorie intake during other meals or snacks. Studies have demonstrated that consumers may substitute one calorie source for another when faced with choice-altering instruments like menu labeling or food taxes (Ref. 6;7;8).
10
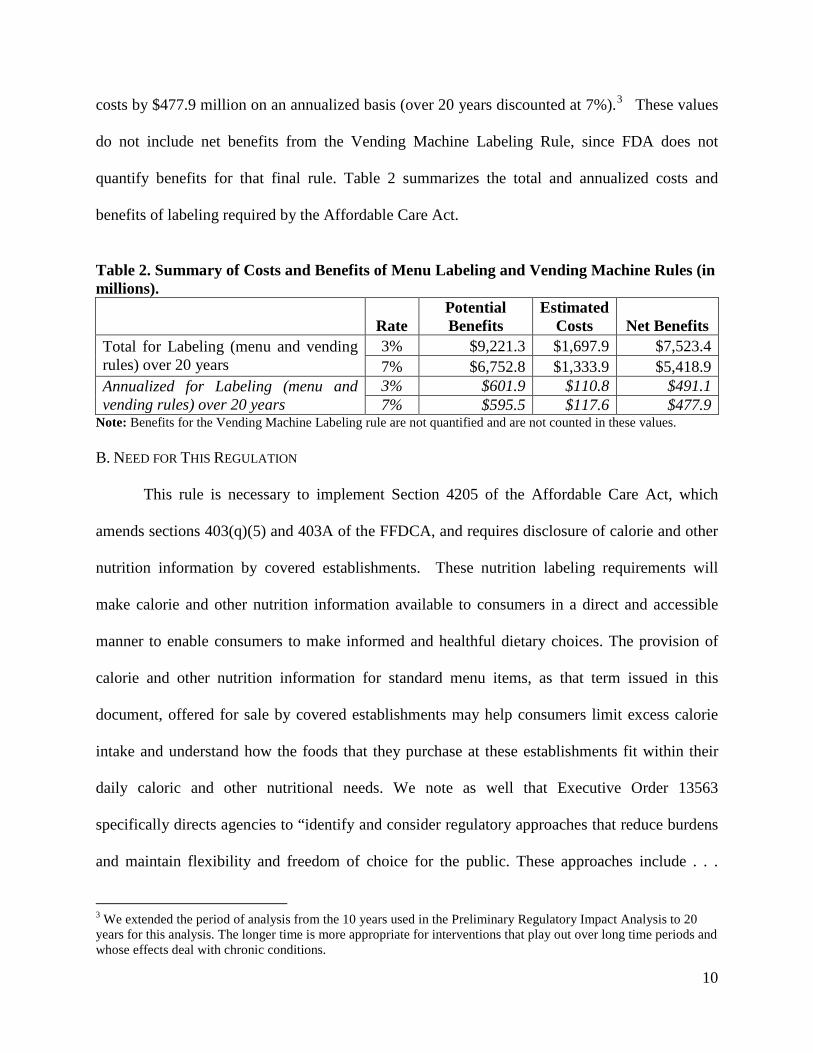
costs by $477.9 million on an annualized basis (over 20 years discounted at 7%).3 These values
do not include net benefits from the Vending Machine Labeling Rule, since FDA does not
quantify benefits for that final rule. Table 2 summarizes the total and annualized costs and
benefits of labeling required by the Affordable Care Act.
Table 2. Summary of Costs and Benefits of Menu Labeling and Vending Machine Rules (in millions).
Rate Potential Benefits
Estimated Costs Net Benefits
Total for Labeling (menu and vending rules) over 20 years
3% $9,221.3 $1,697.9 $7,523.4 7% $6,752.8 $1,333.9 $5,418.9
Annualized for Labeling (menu and vending rules) over 20 years
3% $601.9 $110.8 $491.1 7% $595.5 $117.6 $477.9
Note: Benefits for the Vending Machine Labeling rule are not quantified and are not counted in these values. B. NEED FOR THIS REGULATION
This rule is necessary to implement Section 4205 of the Affordable Care Act, which
amends sections 403(q)(5) and 403A of the FFDCA, and requires disclosure of calorie and other
nutrition information by covered establishments. These nutrition labeling requirements will
make calorie and other nutrition information available to consumers in a direct and accessible
manner to enable consumers to make informed and healthful dietary choices. The provision of
calorie and other nutrition information for standard menu items, as that term issued in this
document, offered for sale by covered establishments may help consumers limit excess calorie
intake and understand how the foods that they purchase at these establishments fit within their
daily caloric and other nutritional needs. We note as well that Executive Order 13563
specifically directs agencies to “identify and consider regulatory approaches that reduce burdens
and maintain flexibility and freedom of choice for the public. These approaches include . . .
3 We extended the period of analysis from the 10 years used in the Preliminary Regulatory Impact Analysis to 20 years for this analysis. The longer time is more appropriate for interventions that play out over long time periods and whose effects deal with chronic conditions.
11
disclosure requirements as well as provision of information to the public in a form that is clear
and intelligible.”
Market failure arising from inadequate information can provide an economic rationale for
the mandatory disclosure of nutrition information. The government does not necessarily have to
intervene to address a market failure from a lack of information. However, when individuals
find collecting information costly, time-consuming, or both, the revealed private demand for
information may differ from the socially optimal level of information. Mandatory nutrition
information disclosure is a tool that can address information asymmetries regarding the
nutritional content of standard menu items. Given that consumers have limited time, attention,
and resources for seeking out new information, the final rule provides nutrition information for
standard menu items to better inform choices at the point of purchase. The final rule enables
consumers to make informed and healthful food choices by reducing uncertainty about the
underlying nutritional content of standard menu items.
The final rule may also assist consumers by making the long-term health consequences
of consumer food choices more salient and by providing contextual cues of food consumption.
The behavioral economics literature suggests that distortions internal to consumers (or
internalities) due to time-inconsistent preferences, myopia or present-biased preferences,
visceral factors (e.g., hunger), or lack of self-control, can also create the potential for policy
intervention to improve consumer welfare (Refs. 9;10;11;12).4 In a study that examines one of
the possible factors that drive obesity, Ruhm (2012) finds that standard economic models of
rational preferences and optimal consumption, which emphasize changes in the price of calorie
4 An individual has time inconsistent preferences if his welfare-maximizing consumption choice for a particular date changes depending on when he is asked. An individual has present-biased preferences when, in comparing payoffs at two different time periods, she gives stronger relative weight to the earlier payoff if it is nearer in time to the present—for example, if she is indifferent between a $100 payoff in one month and a $105 payoff in 13 months but prefers an immediate $100 payoff over a $105 payoff in 12 months (Ref. 12).
12
consumption and expenditure as the primary causes of obesity, have a limited ability to explain
the rapid and continuing increase in the prevalence of obesity. The author suggests that we can
characterize decisions related to eating and body weight as an interaction between a
“deliberative system,” where individuals trade off the “utility from current food intake against
the associated monetary expense and disutility of future weight gains to achieve a constrained
optimum,” and an “affective system,” which “responds to cues and stimuli but does not consider
long-term effects of current actions.”5 Akerlof (1991) proposes that when consumers face
repeated decisions with a short span of time in between each decision, e.g., choosing food items
or meals, and consumers give the present benefits of consumption undue salience relative to
their future costs, then small deviations from the utility maximizing (rational) level of
consumption can quickly accumulate into large mistakes (Ref. 13).6
Consistent with predictions based on models of bounded rationality, consumers can
systematically make suboptimal dietary choices because they discount future health
consequences relative to immediate benefits more than they would if they chose according to
their underlying or true preferences, leading them to regret their decisions at a later date.7 To the
extent that some form of intrapersonal market failure characterizes diet-related decisions,
changes in labeling may increase internalization of future costs into current decision-making by
5 In the behavioral economics and psychology literatures the dual decision maker systems are also referred to as the reflective and automatic, long-run and short-run, or cold and hot systems (or selves). 6 Several other behavioral economics or bounded rationality models exist. These models can account for the seemingly irrational behaviors of over eating and continually postponing efforts at weight loss by incorporating the effects of visceral factors, present-biased preferences, heuristics, and other factors that influence decision making (Refs. 14;15;16). 7 Bounded rationality refers to models of decision making that take the cognitive constraints of the decision maker, e.g., present biased preferences, into account. Individuals use heuristics or rules of thumb to simplify the decision making process, but they often sacrifice judgment accuracy for the reduction in cognitive effort in systematic ways (Ref. 16).
13
making the long-term health consequences of consumer food choices more salient and by
providing contextual cues of food consumption.
Consumer research supports the importance of salience and cues in immediate
consumption decisions. For example, some research has found evidence that visual cues related
to portion size can influence food intake without changing people’s feelings of satiation (Ref.
14). There is also evidence that types of cues such as package size, plate shape, lighting, etc. are
a few of many environmental factors that can influence individuals’ consumption behavior (Ref.
15). Similarly, calories, along with the succinct statement concerning daily caloric intake, on
menus and menu boards can visually cue the consumer into considering consequences of
consuming a standard menu item and reduce the undue salience consumers place on the utility of
consuming such food. Further, the availability of such information can enable individuals to
make informed and healthful dietary choices.
C. COMMENTS ON THE PRELIMINARY REGULATORY IMPACT ANALYSIS AND OUR RESPONSES
FDA’s proposed rule “Food Labeling; Nutrition Labeling of Standard Menu Items in
Restaurants and Similar Retail Food Establishments” (76 FR 19192) was published on April 6,
2011 and its comment period ended July 5, 2011. We had prepared a full “Preliminary
Regulatory Impact Analysis” in connection with the proposed rule. We also included sections
titled “Summary Preliminary Regulatory Impact Analysis” and “Initial Regulatory Flexibility
Analysis” in the preamble to the proposed rule (76 FR 19192 at 19220-19225). In the following
paragraphs, we describe and respond to the comments we received on our analysis of the impacts
presented in those sections. We have numbered each comment to help distinguish between
different comments. The number assigned to each comment is purely for organizational
14
purposes and does not signify the comment’s value, importance, or the order in which it was
received.
(Comment 1) Several comments suggested the need for extending the compliance time to a
minimum of 1 year due.
(Response 1) We agree that the complexity of the market and compliance issues support a
longer compliance time. Therefore, we have delayed the effective date of the final rule to
one year after its publication.
(Comment 2) One comment stated that as the performance of a menu item is evaluated, it is
subject to change. Test results may lead to changes in product makeup, including size,
shape, taste profile, and preparation. Therefore, the underlying nutritionals are also
subject to change. From start to finish, the testing of a product easily takes 6 months.
(Response 2) We have provided flexibility in the permissible methods for calorie and nutrition
analysis, including a 90 day window for testing, which should allow firms to acquire this
information more quickly.
(Comment 3) One comment stated that small businesses would incur higher costs per
establishment than the average estimated in the PRIA.
(Response 3) Due to the limitations in our data, we are unable to break our cost estimates down
according to those associated only with small businesses. Although costs are not
necessarily correlated with output, revenue, number of employees, or the number of
establishments, we do not expect them to vary widely by the size of the business. Costs
are mainly correlated with the number of menu items, which is likely independent of the
size of the business. However, according to our analysis, we expect the rule to have a
15
significant economic impact on small businesses, simply because of the
disproportionately large number of small businesses operating in the industry. Because
of the complicated market structure, and because a majority of affected establishments
are part of small businesses, we have built substantial flexibility into the rule for all
establishments rather than adopting special extensions or rules for small entities. In
addition to the flexibility provided in the proposed rule, in the final rule, we have
lengthened the compliance time, allowed greater flexibility in background color, and
clarified existing flexibility in determining the appropriate ranges of posted calorie
content.
(Comment 4) Several comments stated that the proposed rule would require labeling a very
broad range of products in grocery stores, from several hundred to thousands per chain.
One of these comments gave an explicit calculation of the average number of items that
they expect to be covered, with a range of 700-1500 items (rounded to 1000-2000) that
do not currently have nutrition labels. The comments stated that the number of covered
standard menu items would far exceed the number of standard menu items used in the
Preliminary Regulatory Impact Analysis. These comments also stated that grocery stores
did not have centralized signage for these menu items. These comments stated that 95
percent of food items sold in a typical store carry nutrition labeling. This statement was
used to support the statement that the costs of requiring the additional 5 percent
outweighed the benefits of doing so. However a separate comment suggested the PRIA’s
estimate of 40 standard menu items in a grocery would be “closer to reality” if only
restaurant food were covered.
16
(Response 4) The proposed rule provided that the scope of food eligible for coverage under the
proposed rule included both restaurant and restaurant-type food. In the final rule, we have
clarified that the scope of food eligible for coverage under the final rule includes only
“restaurant-type food,” which means food that is:
(1) Usually eaten on the premises, while walking away, or soon after arriving at
another location; and
(2) Either:
(a) Served in restaurants or other establishments in which food is served for
immediate human consumption or which is sold for sale or use in such
establishments; or
(b) Processed and prepared primarily in a retail establishment, ready for human
consumption, of the type described in subparagraph (a) of this definition, and
offered for sale to consumers but not for immediate human consumption in such
establishment and which is not offered for sale outside such establishment.
Because of this definition of restaurant-type food, we believe that our estimate of the
potential costs to grocery stores is appropriate and accurate given the available data.
(Comment 5) Four separate comments provided specific cost estimates based upon other
analyses. Since they each address the same topic, we have summarized them together
and address them in turn:
a. One comment gave estimates of $1.7 million to replace signage, $690,000 for nutrition
costs and $3.8 million for conveying nutrition information to consumers. These costs
were for 6,400 items at 1,114 stores over 10 chains.
17
b. One comment gave a surveyed range of obtaining nutrition information from $10,000 to
$1.5 million. The comment did not specify the number of items. The comment stated that
the costs to replace menu boards would be between $2,000 and $5 million.
c. One comment gave an estimate of costs at between $8 million and $25 million annually,
for 1,600 stores and over 500 products. The comment stated that over $500,000 would be
needed to train staff to handle new rules. The comment stated that much of this training
cost would be annual.
d. One comment estimated an initial cost nutrition analysis of $2.5 million with an ongoing
cost of $450,000 for new and altered items. The comment did not specify the number of
products. The comment stated that initial signage costs would be $15 million, with an
ongoing component of $5 million. The comment stated that administrative and
maintenance costs would be $20 million annually. The costs related to a chain of 2,400
stores. Total estimated costs in the comment were initial costs of $21,600,000 and
ongoing costs of $24,194,775.
(Response 5) Our results represent our best cost estimates for all covered establishments as a
whole, given the data available. We recognize that the costs of nutrition analysis, menu
replacement, and training will vary for different establishments. We report a range of
estimates to capture both uncertainty and variability of the identified cost inputs. Our
cost analysis is based on average costs of compliance. Due to chain- or establishment-
specific policies and different regional markets, individual chains and establishments may
individually have higher, or lower, costs of compliance. We address each specific point
in order:
a. The values provided in comment a) translate generally to:
18
i. Nutrition analysis costs of $69,000 per firm, $619 per establishment, or $108
per item. This value is lower than the average cost we estimate, but generally
within the range that our data support (i.e. $11,000–$120,000 per firm and $0–
$1,400 per establishment, depending on the type of chain/establishment).
ii. Signage costs of $170,000 per firm, $1,526 per establishment, or $266 per item.
These values are higher than the industry averages supported by our data (i.e.
above our range of averages, $39–$1,200 per establishment), but are within the
range supported by our data when factoring in establishment-specific variability
(i.e. $39–$2,146 per establishment).
iii. Training costs of $380,000 per firm, $3,411 per establishment, or $594 per item.
These values are much higher than our data support, which range from $21–
$1,125 per establishment.
b. The values presented in this comment do not provide enough context to make a
reliable comparison on a per-establishment basis. Greater detail would need to be
provided in order to address the comment directly.
c. The values presented by this firm translate generally to a total burden of $5,000–
$15,625 per establishment. These values are significantly higher than the industry
averages supported by our data, which indicate a total cost range of $90 - $2,163 per
establishment. However, their estimate of $500,000 (or $313 per establishment) to
train employees is consistent with our data (i.e. $21 - $1,125 per establishment).
d. The values provided by this firm translate generally to:
i. Nutrition costs of $1,042 per establishment (initial) and $188 per establishment
(recurring). These values are consistent with our data.
19
ii. Signage costs of $6,250 per establishment (initial) and $2,083 per establishment
(recurring). These values are well beyond the range supported by our data.
(Comment 6) One comment stated that FDA’s estimated average cost of nutrition analysis of
$269 per item “is significantly underestimating the cost…” The comment states that
many chains may have to hire additional staff to handle this task, at a cost of $70,000 to
$120,000 annually. The comment states that some retailers may need to hire several new
employees. The comment states that outside analysis would cost between $500 and
$1000 per item. The comment also cites a range of $750-$1000 per item. The comment
states that only simple items with supplier provided information will have costs close to
the $269 figure. Another comment cited a cost of $350 per sample for nutrition testing
(479).
(Response 6) The per-item cost estimates used in the RIA range from $280 (labor costs of
referring to a nutrition database) to $880 (laboratory nutrition analysis), with a primary
(mean) estimate of $580. These estimates are consistent with all but the very highest end
of the range suggested by the comment. We have modified the section on the reasonable
basis for nutrition analysis, which would allow the use of nutrition databases. As such,
the nutrition analysis can be achieved at a much lower cost. Therefore, FDA concludes
that its per-item estimates are accurate.
(Comment 7) One comment cited costs of menu board redesign of 8-15 hours per board.
(Response 7) Our estimate of menu board redesign has changed based on an updated model of
the costs of redesigning labels. The new average cost estimate of menu board design is
$3,706, with a range of $2,402 to $5,011, which inherently takes into consideration the
20
labor cost of design. Using a labor cost (plus overhead and employee benefits) of $41 per
hour, 8-15 labor hours translates to between $328 and $615 per menu board. These
values are well below what our data indicate as the cost.
(Comment 8) One comment cited an average of five menu boards per store in grocery stores,
with an upper end of 30 or more.
(Response 8) With the criteria of limiting the scope of the rule in grocery stores, the number of
menu board per store would also be limited. However, the number of menu boards in
grocery stores varies. In recognition that some of these stores do have an increasing
selection of covered foods, we have increased the average number of menu boards in
grocery and convenience stores to two. Note that the range underlying this average could
include many stores with a limited selection of covered foods and one menu board, and
some stores with up to five or more menu boards.
(Comment 9) One comment stated that menu board replacement costs would be between $1,000
and $1,500 per board. The comment stated that the total cost of replacement for some
chains would be several million dollars.
(Response 9) We agree that the requirements will cost some large chains several million dollars
to replace menus and menu boards. We estimate that the industry average cost to replace
a single menu board is between $100 and $1,000 (Ref. 17). We recognize that some
chains will bear higher than average costs, but we have no new data to revise estimates
upward for all chains.
(Comment 10) Several comments stated that some grocery store chains use non-standard menu
item assortments across their store locations. These comments used this as evidence for
21
the statement that calorie information will vary widely across stores, and standardization
would be difficult.
(Response 10) To the extent that grocery stores or other establishments do not sell substantially
the same menu items, in terms of ingredients, recipe, and preparation, they are not
covered by the requirements of the final rule.
(Comment 11) One comment cited Executive Order 13563 and its directive to justify benefits in
terms of costs, and to impose the least burden on society as a reason to exempt grocery
and convenience stores from the requirements of Section 4205 and the proposed rule. The
comment estimates that the ratio of cost to sales would be approximately 20 to 1.
(Response 11) The comment does not describe how their estimate of cost to sales ratios was
calculated. Our estimated average annualized cost to grocery, convenience, and general
merchandise stores, is approximately $12.26 million over 20 years. From the 2007
Economic Census, these stores had annual receipts of $12.8 billion for the product
categories: “meals snacks & nonalcoholic beverages prepared for immediate
consumption” and “alcoholic beverages served for immediate consumption.” This yields
a ratio of dollar sales to cost burden of approximately $1,044 in sales to $1 in cost
burden.
Furthermore, we did not have data to calculate quantified benefits in the proposed
regulatory impact analysis and instead relied on a break even analysis. In the final
regulatory impact analysis, we are able to estimate quantified benefits and show that they
might be higher than the estimated costs of the rule. The quantified benefits are
discussed in detail in section II-B.
22
(Comment 12) One comment included a table of regulations that it states apply to groceries, and
not restaurants, as evidence of the burden of cumulative regulations. The comment states
that EO 13563 and 12866 require FDA to take this cumulative burden into consideration,
and therefore exempt grocery stores.
(Response 12) FDA must take into account the cumulative burdens to all affected industries
associated with all new regulations. We do not explicitly add the costs of local regulation
that are already in place primarily because the costs of those individual regulations are
already realized and not a burden of new rulemaking. Also, we do not have data that
would allow us to quantify every beneficial or costly interactive effect this rule may have
with local regulations already in place. In the proposed RIA, we did include a discussion
which stated that the federal regulation may make compliance somewhat simpler, in that
it contains one unified set of requirements that an establishment must undertake, rather
numerous levels of local requirements.
(Comment 13) One comment stated that FDA has not quantified the benefits of section 4205 and
the proposed rule.
(Response13) The Executive Orders require us to use the best available techniques to quantify
the anticipated benefits as accurately as possible. New data have been made available
since the publication of the proposed rule that allows us to estimate potential benefits of
this rule. These estimates are discussed in detail later in this analysis.
(Comment 14) One comment cited a survey that yielded a per-establishment average cost of
$1,333 as evidence that FDA had underestimated the costs of the proposed rule.
Methodology of the study was not given.
23
(Response 14) We did not receive details on the survey, and therefore cannot assess the
applicability of the cited survey to the cost estimate of the rule. For the analysis of the
final rule our revised estimates include a per-establishment initial cost of $1,239 and a
per-establishment recurring cost of $162. The present value of the initial cost plus 20
years of recurring costs is $2,806 per establishment.
(Comment 15) One comment cited the cost of adding calorie information to a pizza chain menu
board would add $800 to the base cost of $100 to print. It continued to state that this is
the cost required to pay an external vendor to customize the nutrition information for
each franchisee. The comments stated that sometimes the franchisor required up to 4
menu changes per year, although 2 were more usually required. The comment stated that
the annual per establishment cost of menu boards and custom nutrition information would
be between $1,600 and $3,200 per year.
(Response 15) The comment did not provide evidence of why the requirements of the rule
would mean an 800 percent increase in costs annually. Establishments are covered if they
are part of a chain with 20 or more locations, but more importantly (with regard to this
comment’s concerns) each establishment must provide substantially the same menu
items. Beyond initial design costs, and the initial costs of changing menus before a
scheduled change, FDA has no data that would indicate an ongoing cost of that
magnitude from firm-mandated menu changes that could be attributed to the
requirements.
(Comment 16) One comment stated that the annual labor cost of compliance would be $800 per
establishment for a particular chain.
24
(Response 16) The comment does not provide details on how they arrived at an $800 estimate.
We acknowledge that a given establishment’s cost of training largely depends upon the
type of industry, the number of employees and managers, and the turnover rates of
employees and managers. Recurring labor costs are mainly associated with employee and
manager training. We use average industry wages and reasonable estimates of time for
training, and data on average turnover rates to estimate the recurring costs of training.
While it is feasible that a given establishment could incur costs of $800 per year, this
estimate would be substantially above the industry average. The data and analysis
indicate the average cost is ranges from $60 to $145 per establishment. We arrive at this
estimate range by dividing the total training costs, $18.74 million to $42.84 million (see
Table 6 of RIA), by the total number of covered establishments (298,600).
(Comment 17) Two comments gave annual estimates of the cost of providing written nutrition
information (printing costs). One cited $90 annually, the other $70 annually, per
establishment.
(Response 17) Our estimates for the costs providing written nutrition information to customers
reflect the cost of compliance. Based upon average daily customer service rates and a
published measurement of the rate of consumer access of nutrition information in chain
restaurants, we estimate the average cost of providing written nutrition information to
range from $7 to $36 dollars per year. We arrive at this estimate range by dividing the
total recurring menu costs, $2.15 million to $10.75 million (see Table 5 of the RIA), by
the total number of covered establishments (298,600). These estimates are lower than
those provided in the public comments and better reflect the average costs to chain
restaurants and other retail food establishments.
25
(Comment 18) One comment from a retail food chain stated that its cost per store, just for menu
board replacement, would be $6,245 because the chain would upgrade menus at some
stores for standardization.
(Response 18) We estimate the cost for a chain to redesign a standardized menu board template
for use by each of its associated retail establishments to range from $2,402 to $5,011,
with an average of $3,706. We estimate the cost to replace or update a single menu board
within an establishment to be approximately $600, on average (which includes materials,
printing, and installation costs). Again, our cost analysis is based on average costs of
compliance. Due to chain- or establishment-specific policies and different regional
markets, individual chains and establishments may individually have higher, or lower,
costs of compliance.
(Comment 19) One comment stated that each establishment would spend $1,100 annually on
training, and the corporate parent would spend $40,000 in developing training materials.
(Response 19) The final rule does not mandate any training. However, our cost analysis includes
a cost of training employees and managers to both respond to consumer questions and
provide standardized portion sizes, and allows for a wide range of possible responses to
the rule. Our estimated ranges in training costs account for the extra time to train
employees to control portion sizes.
(Comment 20) One comment stated that the limited space on menus would mean leaving off
some items. The comment stated that the entire revenue associated with these left off
items would be lost. The comment stated that its first year costs per store, including lost
revenue, would be $56,000 per establishment plus $1.4 million to the parent corporation.
26
Of these costs, $7,345 are the costs, not including estimated lost sales, to the
establishments, and approximately $40,000 to the franchisor.
(Response 20) The available literature shows that most consumers will likely substitute other
available foods for the missing items, rather than not purchasing at all (Refs. 4;5). We
acknowledge that some loss of revenue could occur should some individuals decide to
not purchase at all in the face of having their preferred menu item be removed due to
space constraints on the menu board. We do not have sufficient data to quantify the
magnitude of this issue. As noted in the RIA below, our estimates can be considered
slightly underestimated with respect to this issue.
(Comment 21) One comment stated that the rule would add a significant barrier to the
introduction of new items into the market, which would lead to diminished innovation
and limit consumer choices.
(Response 21) We acknowledge that the added costs associated with introducing new items to
the market (particularly the cost of full nutrition analysis) will be an added barrier.
However, this cost is relatively small compared to other existing barriers such as research
and development of new recipes, process development, market testing, and advertising
and marketing. Although regulatory costs can limit innovation (in terms of product
variety and market experimentation), we expect such an impact to be small. Furthermore,
the expected consumer response to the required calorie disclosure may also likely spur
innovation in the development of healthier options for consumers to choose from. We
have provided substantial flexibility for establishments to meet the requirements, while
still supporting the statutory requirements of Section 4205, and therefore attempted to
minimize the impact on menu design and selection.
27
(Comment 22) One comment laid out a number of additional costs, including legal review of
regulations; legal review of nutrition analysis (they will need to tighten up current
contract, given new liability); collection and management of nutritional information;
lower sales volume; new exposure to lawsuits; possible fines; and potential for required
replacement of noncompliant menus and higher menu maintenance costs.
(Response 22) We added a cost of legal review to the analysis. The cost of collection and
management of nutrition information was included in our analysis of the proposed rule
and is included in the analysis of this final rule.
(Comment 23) One comment provided a breakdown of costs for a chain of over 850 stores,
including costs of reprogramming its online menu board ordering system ($75,000),
producing and shipping new menu boards ($200,000), designing new menu boards
(1,700-2,550 hours, or 2-3 hours per menu board), training franchisees (750 hours), and
follow up calls for administrative and compliance issues (1,250 hours).
(Response 23) The estimates provided in this comment roughly (assuming a labor cost of
$41/hour) translate to per-establishment menu board replacement costs of $406 to $447
and training costs of $36. These estimates fall within the lower portion of the ranges we
estimate in our cost analysis. It is important to reiterate that our cost analysis is based on
average costs of compliance. Due to chain- or establishment-specific policies and
different regional markets, individual chains and establishments may individually have
higher, or lower, costs of compliance.
(Comment 24) One comment stated that its use of buffets meant that hundreds of menu items,
including over 60 individual foods on a salad bar would need to be labeled and analyzed.
28
(Response 24) We estimated that an average of 117 items per chain would need to be labeled
and analyzed. This estimate is in line with the data supplied by the comment.
(Comment 25) One comment stated that its costs of sampling would increase relative to the size
of the brewer, ranging from 56.7 hours (brewers with fewer than 1,000 barrels) to 930
(brewers with over 100,000 barrels) hours. The costs associated with continual sampling
to ensure compliance with the rule would likely reduce the number of products made
available from smaller brewers.
(Response 25) Our requirements do not include lab analysis or continual sampling. Standard
nutritional databases can use recipes to determine calorie and other nutritional content.
Furthermore, if a brewer is only manufacturing alcoholic beverages and not serving them
for consumption on-site or is not otherwise a covered establishment, then the brewer
would not be covered by the rule.
(Comment 26) One comment stated that the cost of the proposed rule would be between $50,000
and $100,000 just for menu and menu board replacement. The comment cited 4 menu
boards, plus multiple sit down menus.
(Response 26) The comment did not provide the basis for such a large marginal cost per menu
replacement. According to our data, the industry average cost of menu boards ranges
from $2,800 to $7,100 for design, materials, and installation and the average cost to
replace menus is $2 per menu. The average cost per establishment ranges from $779 to
$823. The values provided in the comment are well beyond the range supported by our
data, which incorporate the costs of menu design, materials, printing, and installation.
29
However, we acknowledge that individual chains and establishments, because of their
particular policies and markets, may have higher, or lower, costs to replace their menus.
(Comment 27) Some comments opposed the requirements for menu labeling stating that the
costs of the proposed requirements outweigh the benefits and that costs will be passed to
consumers.
(Response 27) Our analysis of the economic impacts of the final requirements indicates that the
benefits of the rule likely outweigh the costs. Our estimates are based on measurements
of consumer willingness to pay for nutrient content information. We fully expect that
some proportion of the costs imposed by the regulation will be passed on to consumers,
who are generally willing to accept some degree of price increase in exchange for an
increase in the nutrient content information of standard menu items. We also estimate the
welfare gains from potential reductions in mortality (i.e. the additional life years gained
from improved nutrition). The monetized value of benefits may indeed represent a low
estimate since the reported value does not incorporate further benefits including, such as
the effects of potential reformulation on consumer health, the reduction of morbidity (in
the form of obesity, diabetes, or other nutrition-related disease), and the possible effects
of the reduction of medical costs associated with nutrition-related illness.
II. COSTS AND BENEFITS OF REGULATORY OPTIONS
This section describes the final rule’s costs and benefits and other regulatory options that
we considered.
30
A. BASELINE: NO NEW REGULATORY ACTION
Imposing no new federal nutrition labeling requirements for standard menu items is the
baseline in our analysis. Section 4205 requires that we issue menu labeling regulations.
Therefore, this is not a legally viable option. Before the enactment of the Affordable Care Act,
some restaurants and similar retail food establishments were subject to State and local menu
labeling laws. Further, many restaurant and similar retail food establishment chains were subject
to a number of different nutrition disclosure requirements because their establishments were not
all located in the same jurisdiction. Because of different requirements among jurisdictions, these
establishments needed to develop and track multiple approaches for disclosing nutrition
information in order to meet each jurisdiction’s requirements. Consequently, the potential cost to
industry in the absence of this new federal regulatory policy (legislation) could have been several
times the cost of the final rule, which establishes national uniform requirements. In addition,
some of the benefits attributed to this final rule would likely have been accrued as a result of the
individual jurisdiction’s requirements; however, these benefits could not have been accrued
nationally, with a single cost of compliance, without this final rule.
Although there are differences among the State and local menu labeling laws that were in
effect or under consideration at the time the Affordable Care Act was enacted, all imposed
requirements on stand-alone full-and-limited-service eating places. Using data from 2007
County Business Patterns, we estimate that approximately 27 percent of chain retail food
establishments would have been in jurisdictions with State and local nutrition labeling laws if the
Affordable Care Act had not been enacted (Ref. 18). These establishments would have had to
acquire nutrition analysis for their menu items and train employees. In order to account for these
baseline costs, 27 percent of the nutrition analysis costs and employee training costs have been
31
subtracted from the costs incurred by full and limited service eating places as calculated in the
analysis of the options.
Chain retail food establishments that were subject to state or local menu labeling
requirements in effect at the time the Affordable Care Act was enacted will likely need to
redesign and replace some of their menus and menu boards to comply with the final federal
requirements. Although some of the non-federal requirements may be similar to the final federal
requirements, we assume in this analysis that the expenses these establishments incurred to
comply with State and local laws will not reduce the cost of complying with the final
requirements.
B. OPTION 1: THE FINAL RULE
Under this, and all other options, covered establishments will be required to disclose in a
clear and conspicuous manner (effective one year after publication of the rule):
a. on menus and menu boards: (1) the number of calories for each standard menu item;
(2) a succinct statement concerning daily caloric intake; and (3) a statement indicating
that additional nutrition information is available upon request;
b. in a written form, available on the premises of the establishment, and to the consumer
upon request, additional nutrition information for standard menu items; and
c. for standard menu items that are food on display or for self-service, the number of
calories contained in each item or per serving.
The final rule specifies that only establishments operating in a fixed location are covered.
The final rule sets forth a mechanism under which restaurants and similar retail food
establishments not subject to the requirements of section 4205 can voluntarily register with FDA
to become subject to the Federal requirements. The primary benefit for restaurants and similar
32
retail food establishments that voluntarily register with FDA is the preemption of state and local
nutrition labeling laws that are not identical to the Federal requirements. By registering, a
restaurant or similar retail food establishment need only comply with the Federal requirements
and any identical State or local requirements. Costs to restaurants and similar retail food
establishments that voluntarily register to be subject to section 4205 will be lower than the costs
of complying with preempted state and local laws because otherwise no firm would voluntarily
do so. Therefore, the registration is assumed to be undertaken by the industry as a cost savings
measure, with no substantial impact on the level of public health benefits provided from either
the local or national labeling requirements.
We note that although voluntary registration under section 4205 has been available to
restaurants and similar retail food establishments that are not subject to the requirements of
section 4205 since July 23, 2010; as of July 5, 2013, no firms have attempted to register with
FDA. Implementation of the final requirements, and the resulting attention to the calorie content
of standard menu items, may give non-covered establishments an incentive to voluntarily
disclose calorie and other nutrition information. However, this incentive does not imply that
establishments would voluntarily restrict their options for disclosure by registering under the
final requirements.
For this analysis, the universe of chain retail food establishments as defined in the final
rule is drawn from the industry sectors listed in Table 3 as classified by the North American
Industry Classification System (NAICS) , including eating and drinking places such as full- and
limited-service restaurants, snack bars (including, for example, ice cream, donut, and bagel shops
and similar establishments), cafeterias and drinking places, managed food service facilities (Ref.
33
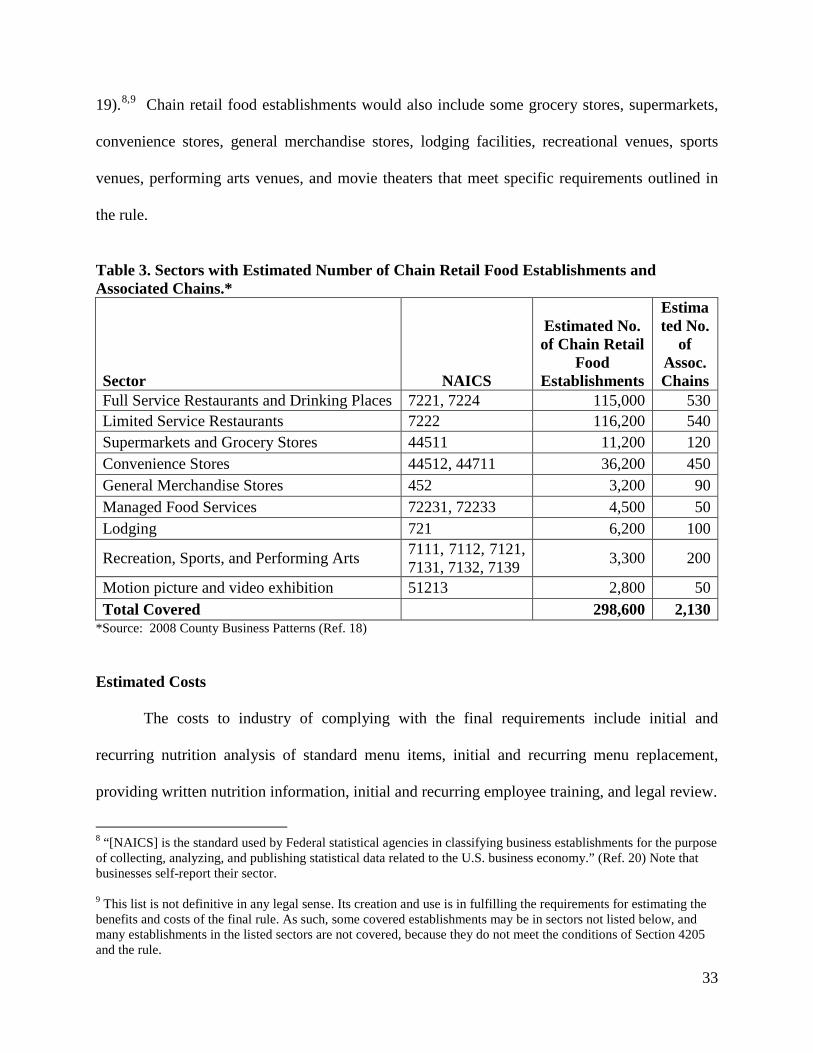
19).8,9 Chain retail food establishments would also include some grocery stores, supermarkets,
convenience stores, general merchandise stores, lodging facilities, recreational venues, sports
venues, performing arts venues, and movie theaters that meet specific requirements outlined in
the rule.
Table 3. Sectors with Estimated Number of Chain Retail Food Establishments and Associated Chains.*
Sector NAICS
Estimated No. of Chain Retail
Food Establishments
Estimated No.
of Assoc. Chains
Full Service Restaurants and Drinking Places 7221, 7224 115,000 530 Limited Service Restaurants 7222 116,200 540 Supermarkets and Grocery Stores 44511 11,200 120 Convenience Stores 44512, 44711 36,200 450 General Merchandise Stores 452 3,200 90 Managed Food Services 72231, 72233 4,500 50 Lodging 721 6,200 100
Recreation, Sports, and Performing Arts 7111, 7112, 7121, 7131, 7132, 7139 3,300 200
Motion picture and video exhibition 51213 2,800 50 Total Covered 298,600 2,130
*Source: 2008 County Business Patterns (Ref. 18)
Estimated Costs
The costs to industry of complying with the final requirements include initial and
recurring nutrition analysis of standard menu items, initial and recurring menu replacement,
providing written nutrition information, initial and recurring employee training, and legal review.
8 “[NAICS] is the standard used by Federal statistical agencies in classifying business establishments for the purpose of collecting, analyzing, and publishing statistical data related to the U.S. business economy.” (Ref. 20) Note that businesses self-report their sector. 9 This list is not definitive in any legal sense. Its creation and use is in fulfilling the requirements for estimating the benefits and costs of the final rule. As such, some covered establishments may be in sectors not listed below, and many establishments in the listed sectors are not covered, because they do not meet the conditions of Section 4205 and the rule.
34
Cost of Nutrition Analysis
Initial Costs of Nutrition Analysis. In order to comply with the requirements, a chain
retail food establishment will need to conduct some type of analysis to determine the nutrient
content information for each standard menu item. Many chains may have already obtained
nutrition information for their own purposes, but a 2006 study by Wootan and Osborn found that
only 34 percent of the largest 300 restaurant chains (by sales volume) had substantial nutrition
information available to consumers in some form (Ref. 21). Although anecdotal evidence
suggests that this number is currently much larger for the largest restaurant chains, the final
requirements apply to many smaller chain retail food establishments that may be less likely to
have existing nutritional analyses. Wootan and Osborn also estimate 46 percent of restaurant
chains would likely need new nutritional analysis (based on 2004 data).
We estimate that currently, 27 percent of chain retail food establishments already have
obtained nutrition analysis in order to comply with State and local laws that were in effect at the
time of enactment of the Affordable Care Act. Therefore, combining the remaining fraction of
the chain retail food establishments without nutrition analysis (73 percent) with the fraction of
other chain retail food establishments without nutrition information prior to the enactment of the
Affordable Care Act or State and local menu labeling rules (66 percent) (Ref. 21), we get an
estimate of the fraction of restaurant chains that will need new analyses under the final rule: 0.48
(0.73 x 0.66). Because of their more expansive geographic coverage, larger chains are more
likely to be part of the 27 percent than smaller ones. If larger chains are also more likely to have
had nutrition information available prior to the enactment of the Affordable Care Act or State
and local menu labeling rules than smaller chains, this estimate may be too low; if they were less
35
likely, this estimate may be too high. In this analysis, we use an average of the above two
estimates, or 47 percent.
In practice, many food items are manufactured elsewhere and are delivered as complete
products (both packaged and unpackaged) – for example, sodas or completed food items from
food service distributers – and may thus have nutrition information already available. Because
we do not have data on how many products are currently shipped with nutrition information to
chain retail food establishments, we estimate costs assuming that each standard menu item will
need analysis. Nutrition analyses for standard menu items with multiple sizes will also be
cheaper on a per-item basis because the analyses can be adjusted proportionally up or down
based on the size difference; therefore, we estimate the cost of nutrition analysis based on the
number of unique items on the menu.
Cost estimates for nutrition analyses vary widely by complexity of the item,
sophistication and accuracy of the analysis, detail of the nutrition report, and by whether the
analysis is based on existing databases or on item-specific laboratory testing. FDA’s 2011
Labeling Cost Model reports a cost for full nutrition lab analyses of $650 per food item (Ref.
22). This cost is higher than the price of $511 ($495 x 1.021 to adjust for inflation) per item,
quoted for a lab analysis in fall 2010 (Ref. 23). Lab testing typically requires the shipment of
between 10 and 12 replicates of the item to be tested. At an average food and preparation cost of
$5 per item, and an average of 11 replicates sent, the food cost would be $55 ($5/replicate x 11
replicates) per menu item tested.10 We estimate the cost of packing and cold shipping to be
approximately $100/menu item.
10 We estimate the average price (excluding tax and tip) for a meal to be $8 (Ref. 24). Using a 60 percent markup, food costs are approximately $5. This may be an overestimate given that meals are comprised of individual food items.
36
Database nutrition analysis services quote prices as low as $25 per item and up to $100
per item for more complicated items (Ref. 25). At least one service offers flat rates of $49 for
ten items where the purchaser enters the recipe into a calculator (Ref. 26). A senior dietician or
nutritionist earns $36.29/hour (Ref. 27). Taking into account an upward adjustment of 50 percent
to account for employee benefits and overhead costs as well as an inflation adjustment of 1.021,
the wage cost to a firm of one hour to enter a recipe is approximately $56.
Based on data from FDA’s Recordkeeping Cost Model (Ref. 17), we estimate
approximately 4 hours in time burden per standard menu item for creating and administering the
record of nutrition analysis. Again using the hourly labor cost for dietitians and nutritionists of
$56/hour, we estimate the costs for organizing the information of nutritional analysis for each
menu item nutritional analysis to be $224 per item (4 hours/item x $56/hour).
The per-item estimated cost of nutrition analysis ranges from $280 per item ($56
database +$224 administrative cost) to a rounded $1,030/item ($650 lab work + $224
administrative cost + $100 shipping + $55 food cost), with a mean, rounded estimate of $660 per
item.
Restaurants. For this analysis, the term “restaurant” means those establishments that
identify themselves as establishments whose primary business activity is the sale of “meals and
beverages for immediate consumption” in economic census surveys, some of which will be chain
retail food establishments, as that term is used in this document. The category of restaurants
includes full and limited service eating places that have traditionally been thought of as
restaurants in that they primarily serve meals and have seating, although they may also have, or
be, drive-through or takeout operations. This category also includes establishments that serve
restaurant-style food, but serve more limited standard menu items, such as ice cream or donut

37
shops, coffee bars, and drinking establishments. All of these establishments are defined by the
U.S. Census Bureau as belonging under NAICS 7221, 7222 and 7224. We estimate that there
are 1,070 chains that will need to comply with the final requirements (Ref. 28). These
establishments serve as the basis in this analysis for the actual restaurants that will be covered by
the final requirements.
The 600 largest restaurant chains (by sales) have an average of 117 unique menu items.
This estimate includes both food and beverage (Ref. 29). If this average estimate holds for all
restaurant establishments that are subject to the final requirements, then most chains should incur
a cost of analysis between $32,800 ($280/item x 117 items) and $120,500 ($1,030/item x 117
items), with a mean estimate of $77,200 ($660/item x 117 items). We estimate that of the total
1,070 restaurant chains, only 47 percent, or 503, will need new nutritional analyses. Thus, the
estimated costs of analysis for restaurant chains range from a low of $16.5 million (503 chains x
117 items/chain x $280/item) to a high of $60.6 million (503 chains x 117 items/chain x
$1,030/item), with a mean estimate of $38.8 million (503 chains x 117 items/chain x $660/item).
Again, this variation depends on how heavily the chains rely on database analysis versus
laboratory testing.
In addition to nutrition analysis by restaurant chains, individual establishments within
these chains may need to acquire analyses for standard menu items that are unique on the
establishment level, and thus not made for sale at the chain level. Though we lack specific data
to estimate the number of establishment level analyses needed, because only chains with 20 or
more establishments are covered by the regulation, FDA estimates that the actual percentage of
establishments acquiring analysis for unique menu items will be small. In the Proposed
Regulatory Impact Analysis (PRIA) we estimated the number of establishments needing
38
establishment-level nutrition analysis to be between 0 and 10 percent of the pool of chain
restaurant establishments that do not already have nutrition analysis (i.e. 47 percent of all
establishments), a range 0 to 10,866 establishments. Because these establishments are likely to
have fewer resources than the larger chains, we expect these firms to use the less expensive
database nutrition analyses, at an estimated cost of $280 per item. If each of these firms needed
analysis for an average of 5 menu items then the cost of these additional nutrition analyses would
be between $0 and $15.2 million (10,866 firms x 5 items/firm x $280/item), with a mean of $7.6
million. In the PRIA, we specifically requested comments on these estimates. We received a
large number of industry comments on many aspects of the analysis, but received no comments
specific to this particular estimation.11 We have no reason or basis to adjust the estimate made in
the PRIA.12
Grocery, Convenience, & General Merchandise (GCGM) Stores. We estimate that there
are approximately 120 grocery chains with approximately 20 or more establishments. In total,
these grocery chains oversee approximately 31,000 establishments (Refs. 24;30). However, not
all of these stores sell standard menu items. The Census Bureau’s 2007 Economic Census data
reports that 36 percent of these establishments report sales of “meals or beverages for immediate
consumption.” Applying this proportion to the total establishment count, we estimate that
11 Some commenters stated that a menu item like hot dogs, even within a single chain, may come from different suppliers and therefore may have minor variations in nutritional content. Using this as a proxy for other examples of minor variations in nutritional content between menu items used by establishments in the same chain, it seems likely that nutrient analyses for such items would be performed at the corporate level as doing so would be the most efficient and thus likely for individual establishments to use the provided information. For example, a search for “hot dogs” in the USDA National Nutrient Database for Standard References quickly results in generic and branded frankfurter categories, any number of which could be quickly catalogued at the corporate level for use by individual establishments. This method could be used for other menu items where there may be minor variations in nutritional content between items sold by different establishment in the same chain, resulting in fewer nutritional analyses performed by individual establishments and relatively easy collection and display of the nutritional information required. 12 It is possible that more than 10,866 firms may need establishment-level nutrition analysis. To the extent this is true, some nutrition analysis costs assumed to be incurred at the chain-level may actually be incurred at the establishment-level. In addition, if each of these firms requires analysis for more (less) than 5 menu items, the estimated costs at the establishment level may be underestimated (overestimated).
39
approximately 36 percent, or 11,200, would be covered under the rule. This estimate is limited to
those establishments serving standard menu items.
Based on establishment counts from the 2007 Economic Census, we estimate that there
are approximately 450 convenience store chains with 20 or more establishments, accounting for
approximately 60,000 convenience stores (Refs. 31;32). The Economic Census also reports that
60 percent of convenience stores have sales of “meals or beverages for immediate consumption.”
Thus, we estimate that 36,200 convenience stores (60,000 establishments x 0.60), would be
covered under the rule. Similarly, we estimate that there are approximately 90 covered general
merchandise retail chains with 3,200 establishments that offer for sale standard menu items. In
total, we estimate 50,600 covered grocery, convenience, and general merchandise stores under a
total of 660 chains that would need to comply with the final requirements.
Because of the more limited offerings for standard menu items at GCGM establishments,
we estimate that these establishments have, on average, approximately one half of the number of
non-alcoholic menu items of an average restaurant, or 40 menu items. We estimate the costs of
nutrition analysis per chain within this group to range from $11,200 ($280/item x 40 items/chain)
to $41,200 ($1,030/item x 40 items/chain), with a mean estimate of $26,400 ($660/item x 40
items/chain). Since nutrition analysis for standard menu items generally is less common for
grocery, convenience and general merchandise store chains, we calculate the total nutrition
analysis costs for all 660 chains. The estimated cost of nutrition analysis for GCGM chains
ranges from $7.4 million (660 chains x $11,200/chain) to $27.2 million (660 chains x
$41,200/chain), with a mean estimate of $17.4 million (660 chains x $26,400/chain).
Individual establishments within the grocery, convenience, and general merchandise store
chains may also need to acquire nutrition analyses for standard menu items that are unique to
40
their own respective establishments and not made for sale at the chain level. We lack specific
data on both the number of establishments and the number of standard menu items each of these
establishments would need to analyze. As a result, we estimate the number of establishments
needing establishment-level nutrition analysis to be between 0 and 10 percent of total chain
grocery, convenience and general merchandise store establishments, or between 0 and 5,060
establishments. If each of these firms needed analysis for an average of 5 menu items, then the
cost of these additional nutrition analyses would add to the costs between $0 and $7.1 million
(5,060 firms x 5 items/firm x $280/item), with a mean of $3.5 million.
Managed Food Services. We estimate that there are approximately 4,500 managed food
service establishments under 50 different chains (Ref. 19), with an average 80 menu items per
chain (the average managed food service establishment is unlikely to serve alcoholic beverages.)
The estimated cost of nutrition analysis per managed food service chain ranges between $22,400
($280/item x 80 items/chain) and $82,400 ($1,030/item x 80 items/chain), with a mean estimate
of $52,800 ($660/item x 80 items/chain). Total nutrition analysis costs over all 50 chains ranges
between $1.1 million (50 chains x $22,200/chain) and $4.1 million (50 chains x $82,400/chain),
with a mean estimate of $2.6 million (50 chains x $52,800/chain).
We estimate the number of firms with establishment-specific menu items to range
between 0 and 10 percent of the total number of chain managed food service establishments, or
between 0 and 450 establishments. Thus, the cost of establishment-specific nutrition analyses
would add between $0 and $0.6 million (450 firms x 5 items/firm x $280/item), with a mean of
$0.3 million.
Lodging. We estimate that there are approximately 6,200 lodging establishments
associated with 100 chains that would be covered under the final rule (Ref. 19). This estimate
41
represents approximately 10 percent of all lodging establishments. Although some of these
establishments have full-service restaurants, many are limited to basic breakfast offerings. We
estimate that these chains have an average of 40 standard menu items that would need nutrition
analyses. The estimated cost of nutrition analysis per lodging chain ranges between $11,200
($280/item x 40 items/chain) and $41,200 ($1,030/item x 40 items/chain), with a mean estimate
of $26,400 ($660/item x 40 items/chain). Total nutrition analysis costs over all 100 chains ranges
between $1.1 million (100 chains x $11,200/chain) and $4.1 million (100 chains x
$41,200/chain), with a mean estimate of $2.6 million (100 chains x $26,400/chain).
We estimate the number of firms with establishment-specific menu items to range
between 0 and 10 percent of the total number of lodging establishments, or between 0 and 620
establishments. Thus, the cost of establishment-specific nutrition analyses would add between
$0 and $0.9 million (620 firms x 5 items/firm x $280/item), with a mean of $0.4 million.
Sports, Recreation, & Entertainment. We estimate that there are approximately 6,100
covered sports, recreational, and entertainment establishments (SRE), associated with 250
chains, that would fall under the definition of “restaurant or similar retail food establishment” as
defined in the final rule (Ref. 19). These establishments include approximately 2,800 movie
theaters associated with 50 chains and 1,300 performing arts, entertainment or spectator sports
establishments associated with 150 chains. In addition, using the National Restaurant
Association’s data on food service contracting revenue from recreation sites (Ref. 33), we
estimate that an additional 50 chains and 2,000 establishments are run in this sector by food
service contractors.
Using the more limited set of standard menu items from the analysis of grocery stores
and convenience stores, we estimate that SRE chains also have an average of one half of the
42
restaurant offerings (including alcoholic beverages), or 59 standard menu items. We estimate the
cost of nutrition analysis per SRE chain to be between $16,520 ($280/item x 59 items/chain) and
$60,770 ($1,030/item x 59 items/chain), with a mean estimate of $38,940 ($660/item x 59
items/chain). With 250 chains, the total chain-level cost of nutrition analysis in this sector would
be between $4.1 million (250 chains x $16,520/chain) and $15.2 million (250 chains x
$60,770/chain), with a mean estimate of $9.7 million (250 chains x $38,940/chain).
We estimate the number of firms with establishment-specific menu items to range
between 0 and 10 percent of the total number of SRE establishments, or between 0 and 610
establishments. The cost of establishment-specific nutrition analyses would add between $0 and
$0.9 million (610 firms x 5 items/firm x $280/item), with a mean of $0.4 million.
Recurring Costs of Nutrition Analysis. The recurring costs refer to the nutrition cost that
will be incurred by the covered establishments due to the introduction of new standard or
reformulated standard menu items in their menus and also the cost that will be incurred by new
chains entering the industry.
Restaurants. From Mintel Menu Insights data, we estimate that restaurant chains
introduced, on average, 24 new menu items in 2009 (Ref. 34). Because the final requirements do
not apply to temporary menu items, daily specials, and foods that are part of a customary market
test, only a fraction of these items will need nutrition analysis. We estimate that existing
restaurant chains or individual establishments would need new nutrition analysis for 25 percent
of new menu items, or 6 new standard menu items per year. If in addition to these new standard
menu items, chains need nutrition analysis on 6 reformulated standard menu items, there would
be a total of 12 nutrition analyses per chain needed on an annual basis.
43
With an estimated total of 1,070 chains associated with establishments that could be
subject to the final requirements, the annually recurring costs of nutrition analysis for restaurant
chains would be $3.6 million (1,070 chains x 12 items/chain x $280/item) to $13.2 million
(1,070 chains x 12 items/chain x $1,030/item), with a mean estimate of $8.5 million (1,070
chains x 12 items/chain x $660/item). Based on growth of the number of establishments in the
limited and full service eating place sectors from U.S. 2000-2008 County Business Patterns data,
we estimate that the annual growth rate in the number of chains subject to the final requirements
is approximately 2 percent13, or 20 new restaurant chains per year (1,070 chains x .02) (Ref.
18).14 If each new chain has an average of 117 standard menu items (including alcoholic
beverages), then the estimated recurring costs associated with these new chain retail food
establishments are between $0.7 million (20 chains x 117 items/chain x $280/item) and $2.4
million (20 chains x 117 items/chain x $1,030/item), with a mean of $1.5 million (20 chains x
117 items/chain x $660/item) each year.
Grocery, Convenience and General Merchandise Stores. Using the same estimate
applied to restaurants (12 new standard menu items per year), we estimate that the 660 grocery,
convenience and general merchandise store chains would have annually recurring costs of
nutrition analysis between $2.2 million (660 chains x 12 items/chain x $280/item) and $8.2
million (660 chains x 12 items/chain x $1,030/item), with a mean estimate of $5.2 million (660
chains x 12 items/chain x $660/item).
13 Note that any firms that lost establishments, and thus were no longer subject to the final requirements, would not be able to recoup the costs already incurred. 14 The data does not allow us to observe if chains typically plateau below 20 establishments. This may be important if some chains decide to remain below this threshold in order to avoid becoming subject to the requirements of this rule. To the extent that this rule may slow growth in the industry, those costs are not be accounted for in this analysis.
44
Based on the aforementioned growth rate (2 percent) of covered restaurants, we estimate
that the number of covered grocery, convenience, and general merchandise store chains would
increase by approximately 5 per year (240 chains x 0.02). If each new chain has an average of
40 standard menu items, then the estimated recurring costs associated with these new chain retail
food establishments are between $0.06 million (5 chains x 40 items/chain x $280/item) and $0.21
million (5 chains x 40 items/chain x $1,030/item), with a mean of $0.16 million (5 chains x 40
items x $660/item) each year.
Managed Food Service. We estimate that the 50 managed food service chains would
have annually recurring costs of nutrition analysis between $0.2 million (50 chains x 12
items/chain x $280/item) and $0.6 million (50 chains x 12 items/chain x $1,030/item), with a
mean estimate of $0.4 million (50 chains x 12 items/chain x $660/item).
Based on growth in the covered sectors from U.S. 2000-2008 County Business Patterns
data (Ref. 18), we estimate the growth rate of covered managed food service chains to be 6
percent per year, which translates to 3 new covered chains (50 chains x .06) per year. If each
new chain has an average of 80 standard menu items, then the recurring costs associated with
new chains would be between $0.07 million (3 chains x 80 items/chain x $280/item) and $0.25
million (3 chains x 80 items/chain x $1,030/item), with a mean of $0.16 million (3 chains x 80
items x $660/item) each year.
Lodging. We estimate that the 100 lodging chains would have annually recurring costs of
nutrition analysis between $0.3 million (100 chains x 12 items/chain x $280/item) and $1.2
million (100 chains x 12 items/chain x $1,030/item), with a mean estimate of $0.8 million (100
chains x 12 items/chain x $660/item).
45
Based on a growth rate of 2 percent, we estimate that the number of covered lodging
chains would increase by approximately 2 per year (100 chains x 0.02). If each new chain has
an average of 40 standard menu items, then the recurring costs associated with new chains would
be between $0.02 million (2 chains x 40 items/chain x $280/item) and $0.08 million (2 chains x
40 items/chain x $1,030/item), with a mean of $0.05 million (2 chains x 40 items x $660/item)
each year.
Sports, Recreation, & Entertainment. We estimate that the 250 SRE chains would have
annually recurring costs of nutrition analysis between $0.8 million (250 chains x 12 items/chain
x $280/item) and $3.1 million (250 chains x 12 items/chain x $1,030/item), with a mean estimate
of $2.0 million (250 chains x 12 items/chain x $660/item).
Based on a growth rate of 2 percent, we estimate that the number of covered SRE chains
would increase by approximately 5 per year (250 chains x 0.02). If each new chain has an
average of 59 standard menu items, then the recurring costs associated with new chains would be
between $0.08 million (5 chains x 59 items/chain x $280/item) and $0.31 million (5 chains x 59
items/chain x $1,030/item), with a mean of $0.19 million (5 chains x 59 items x $660/item) each
year.
Table 4 shows the initial and recurring costs of nutrition analysis costs for the final rule.
We estimate the initial costs of nutrition analysis for restaurants and similar retail food
establishments to be between $30.2 million and $135.9 million, with a mean estimate of $83.3
million. Recurring costs are between $8.03 million and $29.54 million, with a mean estimate of
$18.93 million.
Table 4. Estimated Costs of Nutrition Analysis (in $millions)
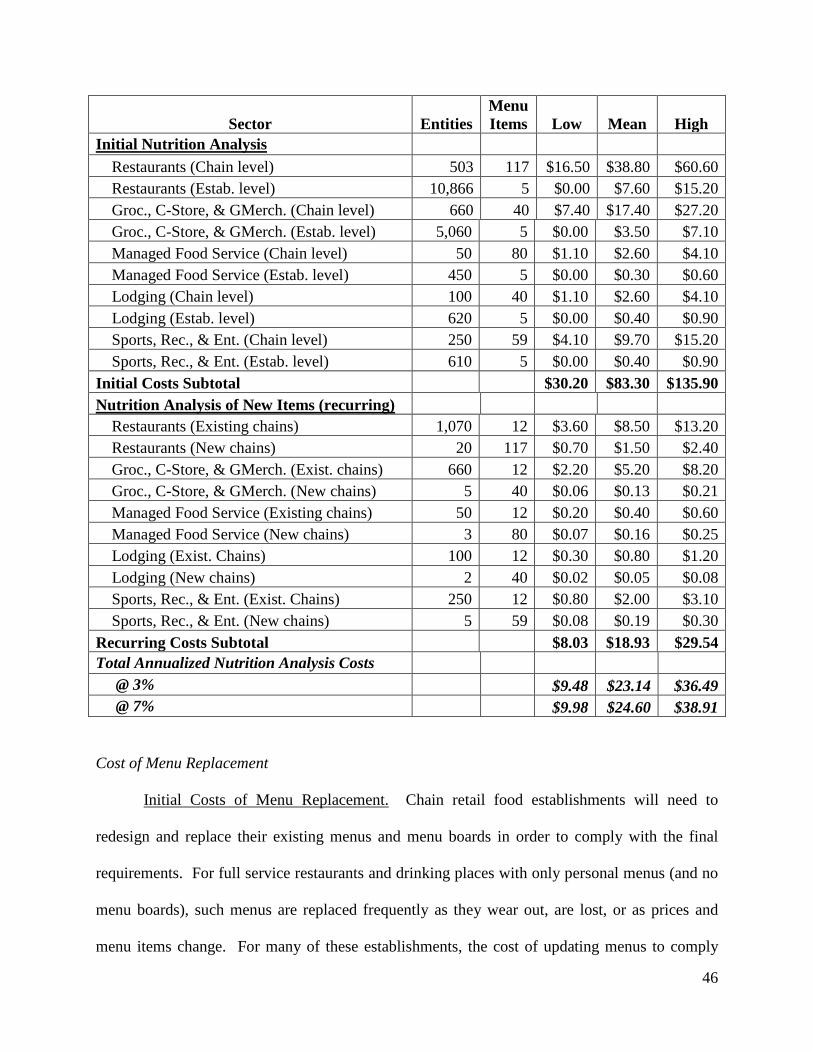
46
Sector Entities
Menu Items Low Mean High
Initial Nutrition Analysis Restaurants (Chain level) 503 117 $16.50 $38.80 $60.60 Restaurants (Estab. level) 10,866 5 $0.00 $7.60 $15.20 Groc., C-Store, & GMerch. (Chain level) 660 40 $7.40 $17.40 $27.20 Groc., C-Store, & GMerch. (Estab. level) 5,060 5 $0.00 $3.50 $7.10 Managed Food Service (Chain level) 50 80 $1.10 $2.60 $4.10 Managed Food Service (Estab. level) 450 5 $0.00 $0.30 $0.60 Lodging (Chain level) 100 40 $1.10 $2.60 $4.10 Lodging (Estab. level) 620 5 $0.00 $0.40 $0.90 Sports, Rec., & Ent. (Chain level) 250 59 $4.10 $9.70 $15.20 Sports, Rec., & Ent. (Estab. level) 610 5 $0.00 $0.40 $0.90 Initial Costs Subtotal $30.20 $83.30 $135.90 Nutrition Analysis of New Items (recurring) Restaurants (Existing chains) 1,070 12 $3.60 $8.50 $13.20 Restaurants (New chains) 20 117 $0.70 $1.50 $2.40 Groc., C-Store, & GMerch. (Exist. chains) 660 12 $2.20 $5.20 $8.20 Groc., C-Store, & GMerch. (New chains) 5 40 $0.06 $0.13 $0.21 Managed Food Service (Existing chains) 50 12 $0.20 $0.40 $0.60 Managed Food Service (New chains) 3 80 $0.07 $0.16 $0.25 Lodging (Exist. Chains) 100 12 $0.30 $0.80 $1.20 Lodging (New chains) 2 40 $0.02 $0.05 $0.08 Sports, Rec., & Ent. (Exist. Chains) 250 12 $0.80 $2.00 $3.10 Sports, Rec., & Ent. (New chains) 5 59 $0.08 $0.19 $0.30 Recurring Costs Subtotal $8.03 $18.93 $29.54 Total Annualized Nutrition Analysis Costs @ 3% $9.48 $23.14 $36.49 @ 7% $9.98 $24.60 $38.91 Cost of Menu Replacement
Initial Costs of Menu Replacement. Chain retail food establishments will need to
redesign and replace their existing menus and menu boards in order to comply with the final
requirements. For full service restaurants and drinking places with only personal menus (and no
menu boards), such menus are replaced frequently as they wear out, are lost, or as prices and
menu items change. For many of these establishments, the cost of updating menus to comply
47
with the final requirements would be limited to design and associated administrative burdens.
However, some establishments have more durable menus, and longer menu design cycles. These
firms would need to discard and replace their old menus with new, updated ones over the
window between release of the final rule and the effective date.15
The longer lifespan of menu boards in limited-service eating places would likely require
the redesign of menus and menu boards and the replacement of one or more menu boards. In
addition, some chains would need to update self-serve and display signs. Due to the wide
variation in styles of menu and economies of scale, reprint costs can run from pennies to several
dollars per menu. Based on published printing costs, we estimate the range of average materials
and printing costs to be between $1 and $3 per copy, with some individual chains spending much
less and others much more. The number of menus that an establishment will keep on hand is
also highly variable. A full-service restaurant, where each order is placed using a menu, will
need more than a quick-service establishment that uses menus just for takeout orders. The
number of menus is also tied to the seating capacity of the restaurant, and whether the menu is
laminated or paper. Because paper menus are more fragile and cheaper to print in bulk, an
establishment may keep a large reserve in stock, whereas establishments using more durable and
expensive laminated menus may only keep a few extra on hand.
Estimates for the cost of updating menu boards, other major displays that serve as menus,
such as electronic displays, or major materials needed to disclose calories for self-serve or
displayed foods to comply with the final requirements, will vary widely across chains and
establishments because of different menu board and display types. FDA’s Labeling Cost Model
provides estimates for design and administrative costs ranging from $2,402 to $5,011 per label,
with a mean of $3,706 (Ref. 22). Costs of new menu boards or other major displays may range 15 We do not include the cost of voluntary renovation or menu changes.
48
from $100 to $1,000 (average $550) per menu board or major display depending on the
materials, size and format (Ref. 35). We estimate that the in-store labor needed to change out
menu boards or other major displays will be one hour for managers and one hour for staff-level
employees. Establishments that are part of larger chains with more displays and more
sophisticated ordering technology estimate that the cost may range between $1,500 and $2,500
per establishment; this estimate is in line with our high estimate of per-establishment costs (Ref.
36). In addition, these estimates are in line with many of the values provided in the public
comments we received.
Space constraints may require some chains to remove items from the menu to make room
to add new calorie information while redesigning menus and menu boards While studies have
demonstrated that consumers may substitute one calorie source for another when faced with
choice altering instruments like menu labeling or food taxes (Refs. 4;5), it is possible (should
items get removed from the menu as a direct result of such constraints) that some people may
decide not to purchase at all if their item of choice gets removed. This would, in turn, yield some
loss in revenue to the establishment.
Restaurants. Of the 1,070 covered restaurant chains, we estimate that 420 are limited-
service restaurants that have menu boards, with a total of 91,000 chain retail food establishments.
If each of these establishments has, on average, 3 menu boards or major displays (for example a
main menu board, a drive-through board, and self-service displays), we estimate the cost of
replacing menu boards to comply with the final requirements will be, on average $1,773 [3
boards x ($550/board equip + $41/board labor)] per establishment.16 The estimated cost for
replacing limited service restaurant menu boards is, on average, $161.3 million (91,000
16 Based on 2010 BLS Occupational Employment Statistics, we estimate the hourly wage rate for a manager (plus overhead) is $26.03. The hourly wage rate for a non-manager is estimated to be $14.52. Thus an hour of labor for a staff member and manager is approximately $41 (=$26.03+14.52).
49
establishments x $1,773/establishment). Each of these chains will also need to redesign their
menus and menu boards, at an estimated cost on average of $1.6 million (420 chains x
$3,706/chain). We estimate that the total cost to limited-service restaurants of menu replacement
to be $162.9 million, on average.
In addition to limited-service restaurants, we estimate that there are approximately 25,200
snack bars and cafeteria establishments from 120 chains that would need to replace menu boards
under the final requirements. If each of these establishments has, on average, one menu board or
major display, then the average cost per establishment of replacing a menu board to comply with
the final requirements would be $591 [1 board x ($550/board equip + $41/board labor)], and the
average cost for replacing all covered snack bar and cafeteria menu boards would be $14.9
million (25,200 establishments x $591/establishment). Each of the associated snack bar and
cafeteria chains will also need to redesign their menus and menu boards, at an estimated cost of
$0.4 million (120 chains x $3,706/chain). The total cost to snack bars and cafeterias is estimated
to be $15.3 million, on average. The total estimated cost for all limited service eating places is
$178.2 million, on average.
We estimate that 90 chains made up of drinking establishments that are chain retail food
establishments would need to redesign their menus, at an estimated average cost of $0.33 million
(90 chains x $3,706/chain). We estimate that 440 chains of full service restaurants would also
need to redesign their menus, at an estimated average cost of $1.63 million (440 chains x
$3,706/chain).
We lack data on the distribution of menu durability across the affected sectors. However,
if between 0 and 50 percent of full service restaurants need to discard and replace existing menus
before the rule is in full effect, then between 0 and 47,800 full-service restaurant establishments
50
(95,500 establishments x 50 percent) and between 0 and 9,750 drinking places (19,500
establishments x 50 percent) would need new menus under the final requirements. Based on U.S.
2007 Economic Census data, there is an average of 81 seats per establishment for full-service
restaurants and 68 seats for drinking places (Ref. 37). We estimate that the average full-service
restaurant or drinking place must discard and reprint one menu for each seat, plus 10 extra, for a
total of 91 menus per full-service restaurant and 78 menus per drinking place. Thus the
estimated cost of menu replacement for these restaurants is between $0 and $10.2 million
[(47,800 establishments x 91 menus/establishment x $2/menu) + (9,750 x 78
menus/establishments x $2/menu)] with a mean estimate of $5.1 million. The total cost of menu
replacement to full- and limited-service restaurants and drinking places is estimated to be
between $180.16 million and $190.36 million, with a mean estimate of $185.26 million.
Grocery, Convenience and General Merchandise Stores. We estimated in the analysis
of the proposed rule that grocery and convenience stores have an average of one menu board per
establishment. Based on comments that indicate a wider range of standard menu items being sold
in grocery and convenience stores, we have increased this estimate to an average of 2 per
establishment. We estimate average cost per establishment of updating/replacing menu boards to
be $1,181 [2 boards x ($550 in materials + $41 in labor)]. With approximately 660 chains that
would include 50,600 chain retail food establishments under this option, the cost of redesigning
and replacing menu boards at these stores would be, on average, $62.2 million (50,600
establishments x $1,181/establishment + 660 chains x $3,706/chain).
Managed Food Service. We estimate that establishments associated with managed food
services will each have an average of one menu board. We estimate average cost per
establishment of updating/replacing menu boards to be $602 [1 board x ($550 in materials + $52
51
in labor)]. With approximately 50 chains including 4,500 establishments, the estimated average
cost of replacing menu boards at these establishments is $2.9 million (4,500 establishments x
$602/establishment + 50 chains x $3,706/chain).
Lodging. Lodging places generally have menus instead of menu boards; therefore, the
menu replacement costs for establishments in the lodging sector would be limited to menu
replacement and redesign and administrative costs. With approximately 100 chains, the
estimated average cost of redesign is $0.37 million (100 chains x $3,706/chain). According to the
2007 Economic Census data, the average number of rooms per lodging establishment is 77. If
between 0 and 50 percent of these lodging establishment must discard and reprint one menu for
each room, plus 10 extra, for a total of 87 menus per establishment, then the estimated cost of
menu replacement for lodging establishments is between $0 and $0.5 million (3,100
establishments x 87 menus x $2/menu). The total estimated cost for lodging places ranges from
$0.24 million to $0.87 million, with a mean estimate of $0.67 million.
Sports, Recreation, and Entertainment. We estimate that sports, entertainment, and
recreational facilities have an average of one menu board per establishment. We estimate
average cost per establishment of updating/replacing menu boards to be $566 [1 board x ($550 in
materials + $16 in labor)]. With an estimated 250 chains including 6,100 establishments, the
average cost of redesigning and replacing menu boards at these establishments is $4.4 million
(6,100 establishments x $566/establishment + 250 chains x $3,706/chain).
The total estimated initial costs to restaurants and similar retail food establishments for
updating menus and menu boards to comply with the final requirements are between $245.26
and $256.15 million, with a mean of $250.36 million.
52
Recurring Menu Replacement Costs. Recurring changes to menus or menu boards will be
tied to new or reformulated standard menu items. In general, these future changes to menus will
be incorporated into the natural menu replacement cycle, so there will be no additional recurring
menu update costs. However, all chain retail food establishments will need to provide additional
written nutrition information. This analysis estimates that there are 298,600 chain retail food
establishments covered by the final requirements. According to a study of consumer access of
nutrition information in chain restaurants (Ref. 38), approximately 0.6 percent of customers
either request nutrition pamphlets or approach wall posters with detailed nutrition information.
Accounting for an average food service rate of 50 to 300 customers per day, we estimate 10 to 50
pamphlets will be requested at each establishment per month, on average. Thus, the yearly
recurring total of nutrition pamphlets to be printed would be between 35.8 million (298,600 x 10
x 12) and 179.1 million (298,600 x 50 x 12). At an estimated cost of $0.06 per document, the
yearly cost would be between $2.15 million and $10.75 million, with a mean cost of $6.45
million.
The estimated recurring costs of menu replacement for chains that expand into the
covered range of 20 or more locations will be, on average, $0.54 million (700 establishments x
$591/establishment + 35 new chains x $3,706/chain). This figure uses the estimate of 35
additional chains with establishments of 20 or more locations that would become subject to the
final requirements, for a total of 700 (35 x 20) new chain retail food establishments.
Table 5 shows the initial and recurring costs of menu and menu board replacement. We
estimate the initial costs of nutrition analysis for restaurants and similar retail food
establishments to be between $249.9 million and $261 million, with a mean estimate of $255
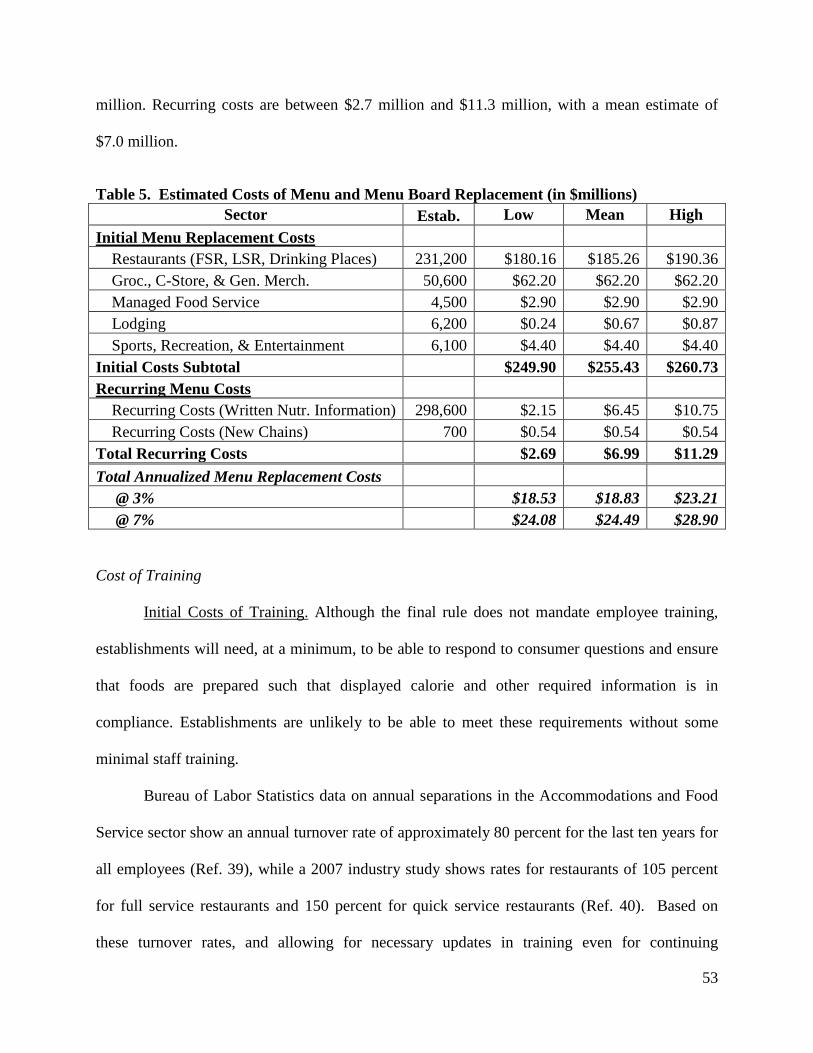
53
million. Recurring costs are between $2.7 million and $11.3 million, with a mean estimate of
$7.0 million.
Table 5. Estimated Costs of Menu and Menu Board Replacement (in $millions) Sector Estab. Low Mean High
Initial Menu Replacement Costs Restaurants (FSR, LSR, Drinking Places) 231,200 $180.16 $185.26 $190.36 Groc., C-Store, & Gen. Merch. 50,600 $62.20 $62.20 $62.20 Managed Food Service 4,500 $2.90 $2.90 $2.90 Lodging 6,200 $0.24 $0.67 $0.87 Sports, Recreation, & Entertainment 6,100 $4.40 $4.40 $4.40 Initial Costs Subtotal $249.90 $255.43 $260.73 Recurring Menu Costs Recurring Costs (Written Nutr. Information) 298,600 $2.15 $6.45 $10.75 Recurring Costs (New Chains) 700 $0.54 $0.54 $0.54 Total Recurring Costs $2.69 $6.99 $11.29 Total Annualized Menu Replacement Costs @ 3% $18.53 $18.83 $23.21 @ 7% $24.08 $24.49 $28.90
Cost of Training
Initial Costs of Training. Although the final rule does not mandate employee training,
establishments will need, at a minimum, to be able to respond to consumer questions and ensure
that foods are prepared such that displayed calorie and other required information is in
compliance. Establishments are unlikely to be able to meet these requirements without some
minimal staff training.
Bureau of Labor Statistics data on annual separations in the Accommodations and Food
Service sector show an annual turnover rate of approximately 80 percent for the last ten years for
all employees (Ref. 39), while a 2007 industry study shows rates for restaurants of 105 percent
for full service restaurants and 150 percent for quick service restaurants (Ref. 40). Based on
these turnover rates, and allowing for necessary updates in training even for continuing
54
employees, we estimate that 100 percent of employees at the covered chain retail food
establishments will need to be trained annually.
Although data on employee training are scarce, the high rate of turnover means that,
typically, formal training times are kept to a minimum. One large quick-service chain has a three
hour formal training program for new employees (Ref. 41). If the final rule increases formal
training time by between 10 and 30 minutes, this would be an increase of between 5 percent and
16 percent.
We expect managers to need more intensive training in order to be able to ensure
compliance at the establishment level, and to acquire the knowledge needed to train retail-level
employees. Although the Bureau of Labor Statistics does not separately identify manager
turnover rates by industry, one 2007 study found manager turnover rates to be 40 percent for
limited service restaurants and 26 percent for other restaurants (Ref. 40). Allowing for retraining,
we estimate that 50 percent of food service managers at covered establishments will need
training annually. We expect managers to need an additional 4 to 8 hours of training based on the
availability and length of online nutrition training courses for food service professionals.
To estimate the number of employees directly involved with either the sale or the
preparation of food subject to the final requirements, we use Bureau of Labor Statistics National
Industry-Specific Occupational Employment and Wage Estimates in that sector (Ref. 42). These
data provide specific counts of manager and non-manager employees in food service for each of
the covered sectors as well as average hourly wages.
The following estimates of expected training costs take into consideration the need to
train employees to maintain relatively uniform serving amounts (i.e. portion amounts) when
preparing and serving food.

55
Restaurants. There are 7.0 million non-managerial food service employees working in
eating and drinking places that work directly with food preparation and service, making an
average wage of $9.50 per hour. With a 50 percent upward adjustment to account for overhead
and employee benefits, the average hourly cost to the establishment is $14. Based on the
estimated fraction of restaurants and similar retail food establishments that would be subject to
the final requirements (40 percent) there are approximately 2.8 million food service employees at
chain retail food establishments. In the analysis for the pre-statute baseline, we estimated that 27
percent of these establishments were subject to pre-existing State or local laws. Therefore, we
take 73 percent of the 2.8 million employees, or 2.0 million employees. If each employee
receives between 10 and 30 extra minutes of training, then the formal employee training costs for
restaurants would be between $4.8 million (2.0 million x 1/6 hour x $14/hour) and $14.3 million
(2.0 million x 1/2 hour x $14/hour), with an average cost of $9.5 million.
There are approximately 730,000 food service managers at eating and drinking places.
Again using 40 percent fraction of chain restaurants and 73 percent not previously covered by
non-federal menu labeling requirements, we estimate that there are approximately 213,000
(730,000 x 0.40 x 0.73) food service managers that will need training. The average cost,
including overhead and employee benefits, for these managers is $25 per hour. If each manager
needs four to eight hours of training, then the cost will be between $21.31 million (213,000 x 4
hour x $25/hour) and $42.62 million (213,000 x 8 hour x $25/hour), with an average cost of
$31.96 million. In total, the training costs for covered restaurants will be $26.07 million to
$56.90 million, with a mean estimate of $41.49 million.
Grocery, Convenience and General Merchandise Stores. As in the analysis of
restaurants, we include only those employees who are directly involved in the sale or preparation
56
of covered food, a small fraction of the total employees at grocery and convenience stores. There
are approximately 418,000 non-managerial food service employees working in grocery,
convenience, and general merchandise stores (298,000 grocery + 78,100 convenience store +
41,900 gen. merchandise) with an overall average labor cost to employers of $15 per hour. Based
on the estimated fraction of those establishments within these sectors that would be subject to the
final requirements under this option – approximately 18 percent, 30 percent, and 7 percent,
respectively for the three sectors – there are an estimated 79,000 food service employees at these
establishments who would need training. If each employee receives between 10 and 30 extra
minutes of training, then the formal employee training costs for these store establishments would
be between $0.20 million (79,000 x 1/6 hour x $15/hour) and $0.59 million (79,000 x 1/2 hour x
$15/hour), with a mean estimate of $0.40 million.
Again using the fractions of establishments given above, we estimate that there are
approximately 7,200 food service managers that will need training at these stores. The average
cost of these managers is $25 per hour. If each manager needs four to eight hours of training,
then the wage cost to the industry will be between $0.72 million (7,200 x 4 hour x $25/hour) and
$1.5 million (7,200 x 8 hour x $25/hour), with an average cost of $1.1 million. Total initial
training costs associated with grocery, convenience and general merchandise store
establishments would be between $0.92 million and $2.04 million, with a mean estimated cost of
$1.48 million.
Managed Food Service. There are 387,000 non-managerial food service employees
working in the managed food service sector that work directly with food preparation and service,
making an average wage (plus overhead and employee benefits) of $16 per hour. Based on the
estimated fraction establishments that would be subject to the final requirements (23 percent)
57
there are approximately 90,000 non-manager employees at managed food service establishments.
If each employee receives between 10 and 30 extra minutes of training, then the formal
employee training costs for all these establishments would be between $0.24 million (90,000 x
1/6 hour x $16/hour) and $0.72 million (90,000 x 1/2 hour x $17/hour), with an average cost of
$0.48 million.
There are approximately 61,000 food service managers in the managed food service
sector. Using the same 23 percent coverage for managers, there are approximately 14,100 food
service managers at covered food service establishments. The average cost of these managers is
$30 per hour. If each manager needs four to eight hours of training, then the wage cost to this
sector would be between $1.69 million (14,100 x 4 hour x $30/hour) and $3.39 million (14,100 x
8 hour x $30/hour), with a mean cost of $2.54 million. In total, the initial training costs for
managed food service establishments will be $1.93 million to $4.10 million, with a mean
estimate of $3.02 million.
Lodging. There are 365,000 non-managerial food service employees working in the
lodging sector that work directly with food preparation and service, making an average wage
(plus overhead and employee benefits) of $17 per hour. Based on the estimated fraction of
establishments that would be subject to the final requirements (10 percent) there are
approximately 36,000 non-manager employees at lodging establishments. If each employee
receives between 10 and 30 extra minutes of training, then the formal employee training costs for
all these establishments would be between $0.10 million (36,000 x 1/6 hour x $16/hour) and
$0.31 million (36,000 x 1/2 hour x $17/hour), with an average cost of $0.20 million.
There are approximately 39,000 food service managers in the lodging sector. Using the
same 10 percent coverage for managers, there are approximately 3,900 food service managers at

58
covered lodging establishments. The average cost of these managers is $33 per hour. If each
manager needs four to eight hours of training, then the wage cost to this sector would be between
$0.51 million (3,900 x 4 hour x $33/hour) and $1.01 million (3,00 x 8 hour x $33/hour), with a
mean cost of $0.76 million. In total, the initial training costs for lodging establishments will be
$0.61 million to $1.32 million, with a mean estimate of $0.96 million.
Sports, Entertainment, and Recreation. There are approximately 302,000 non-
managerial food service employees working in sports, entertainment, and recreation subsectors
(260,000 arts, entertainment, and rec. + 42,000 motion picture) with respective overall average
costs to employers of $16 per hour for the arts subsector and $13 per hour for motion pictures.
Based on the estimated fraction of those establishments within these subsectors subject to the
final requirements under this option – approximately 1 percent for arts and 54 percent for motion
pictures – there are an estimated 23,800 food service employees at these establishments who
would need training. If each employee receives between 10 and 30 extra minutes of training,
then the formal employee training costs for these store establishments would be between $0.05
million (1,600 x 1/6 hour x $16/hour + 22,200 x 1/6 hour x $13/hour) and $0.16 million (1,600 x
1/2 hour x $16/hour + 22,200 x 1/2 hour x $13/hour), with an mean estimate of $0.11 million.
Again using the fractions of establishments given above, we estimate that there are
approximately 3,300 food service managers that will need training at these stores. The average
cost of these managers is $32 per hour for arts etc. and $21 for motion picture. If each manager
needs four to eight hours of training, then the wage cost to the industry will be between $0.39
million (300 x 4 hour x $32/hour + 3,000 x 4 hour x $21/hour) and $0.78 million (300 x 8 hour x
$32/hour + 3,000 x 8 hour x $21/hour), with an average cost of $0.60 million. Total initial
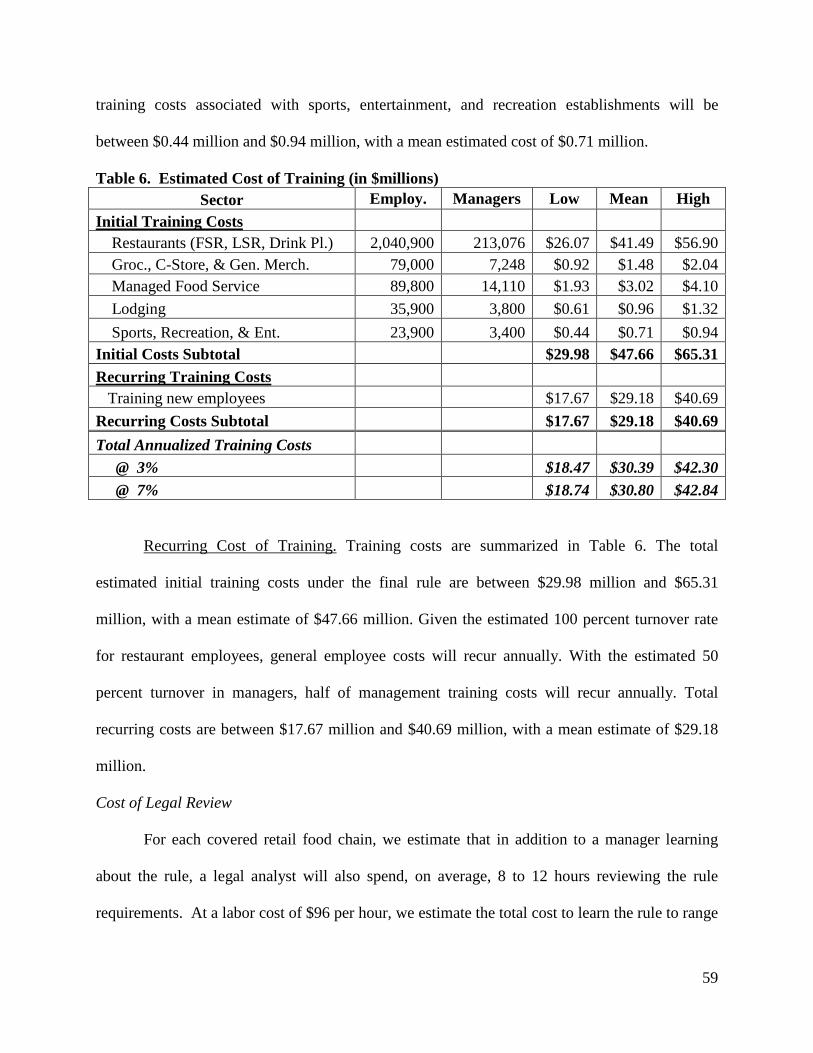
59
training costs associated with sports, entertainment, and recreation establishments will be
between $0.44 million and $0.94 million, with a mean estimated cost of $0.71 million.
Table 6. Estimated Cost of Training (in $millions) Sector Employ. Managers Low Mean High
Initial Training Costs Restaurants (FSR, LSR, Drink Pl.) 2,040,900 213,076 $26.07 $41.49 $56.90 Groc., C-Store, & Gen. Merch. 79,000 7,248 $0.92 $1.48 $2.04 Managed Food Service 89,800 14,110 $1.93 $3.02 $4.10 Lodging 35,900 3,800 $0.61 $0.96 $1.32 Sports, Recreation, & Ent. 23,900 3,400 $0.44 $0.71 $0.94 Initial Costs Subtotal $29.98 $47.66 $65.31 Recurring Training Costs Training new employees $17.67 $29.18 $40.69 Recurring Costs Subtotal $17.67 $29.18 $40.69 Total Annualized Training Costs @ 3% $18.47 $30.39 $42.30 @ 7% $18.74 $30.80 $42.84
Recurring Cost of Training. Training costs are summarized in Table 6. The total
estimated initial training costs under the final rule are between $29.98 million and $65.31
million, with a mean estimate of $47.66 million. Given the estimated 100 percent turnover rate
for restaurant employees, general employee costs will recur annually. With the estimated 50
percent turnover in managers, half of management training costs will recur annually. Total
recurring costs are between $17.67 million and $40.69 million, with a mean estimate of $29.18
million.
Cost of Legal Review
For each covered retail food chain, we estimate that in addition to a manager learning
about the rule, a legal analyst will also spend, on average, 8 to 12 hours reviewing the rule
requirements. At a labor cost of $96 per hour, we estimate the total cost to learn the rule to range
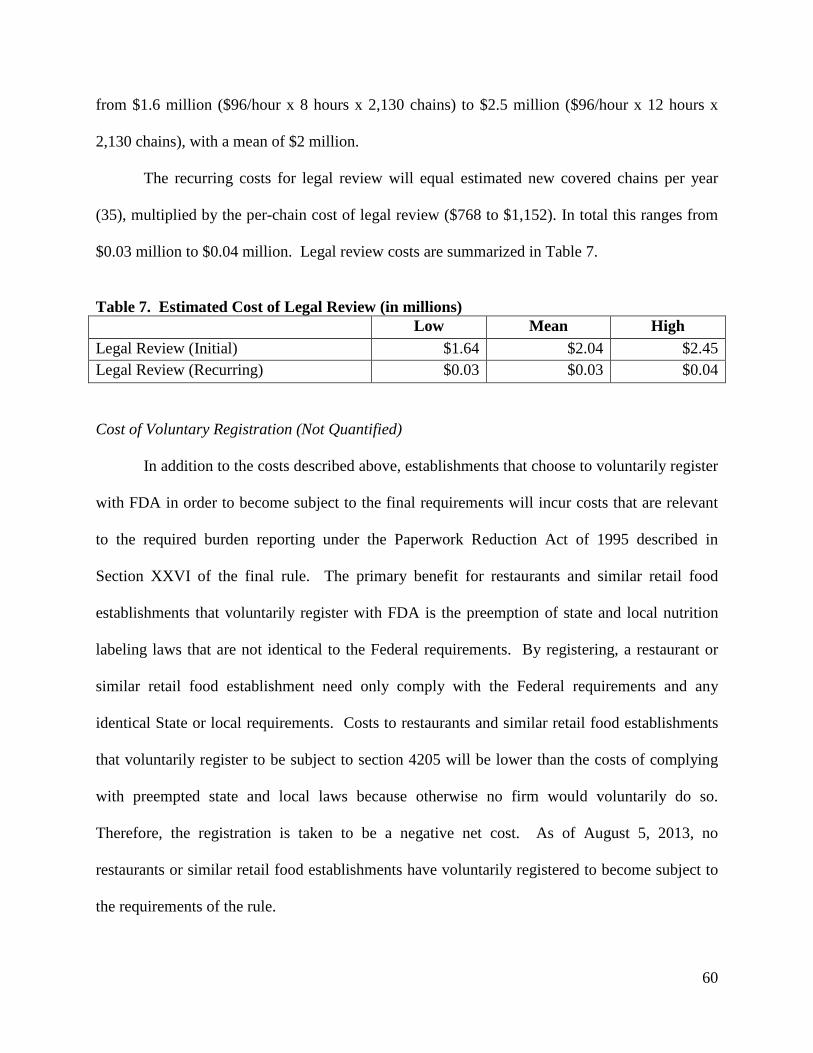
60
from $1.6 million ($96/hour x 8 hours x 2,130 chains) to $2.5 million ($96/hour x 12 hours x
2,130 chains), with a mean of $2 million.
The recurring costs for legal review will equal estimated new covered chains per year
(35), multiplied by the per-chain cost of legal review ($768 to $1,152). In total this ranges from
$0.03 million to $0.04 million. Legal review costs are summarized in Table 7.
Table 7. Estimated Cost of Legal Review (in millions) Low Mean High Legal Review (Initial) $1.64 $2.04 $2.45 Legal Review (Recurring) $0.03 $0.03 $0.04
Cost of Voluntary Registration (Not Quantified)
In addition to the costs described above, establishments that choose to voluntarily register
with FDA in order to become subject to the final requirements will incur costs that are relevant
to the required burden reporting under the Paperwork Reduction Act of 1995 described in
Section XXVI of the final rule. The primary benefit for restaurants and similar retail food
establishments that voluntarily register with FDA is the preemption of state and local nutrition
labeling laws that are not identical to the Federal requirements. By registering, a restaurant or
similar retail food establishment need only comply with the Federal requirements and any
identical State or local requirements. Costs to restaurants and similar retail food establishments
that voluntarily register to be subject to section 4205 will be lower than the costs of complying
with preempted state and local laws because otherwise no firm would voluntarily do so.
Therefore, the registration is taken to be a negative net cost. As of August 5, 2013, no
restaurants or similar retail food establishments have voluntarily registered to become subject to
the requirements of the rule.
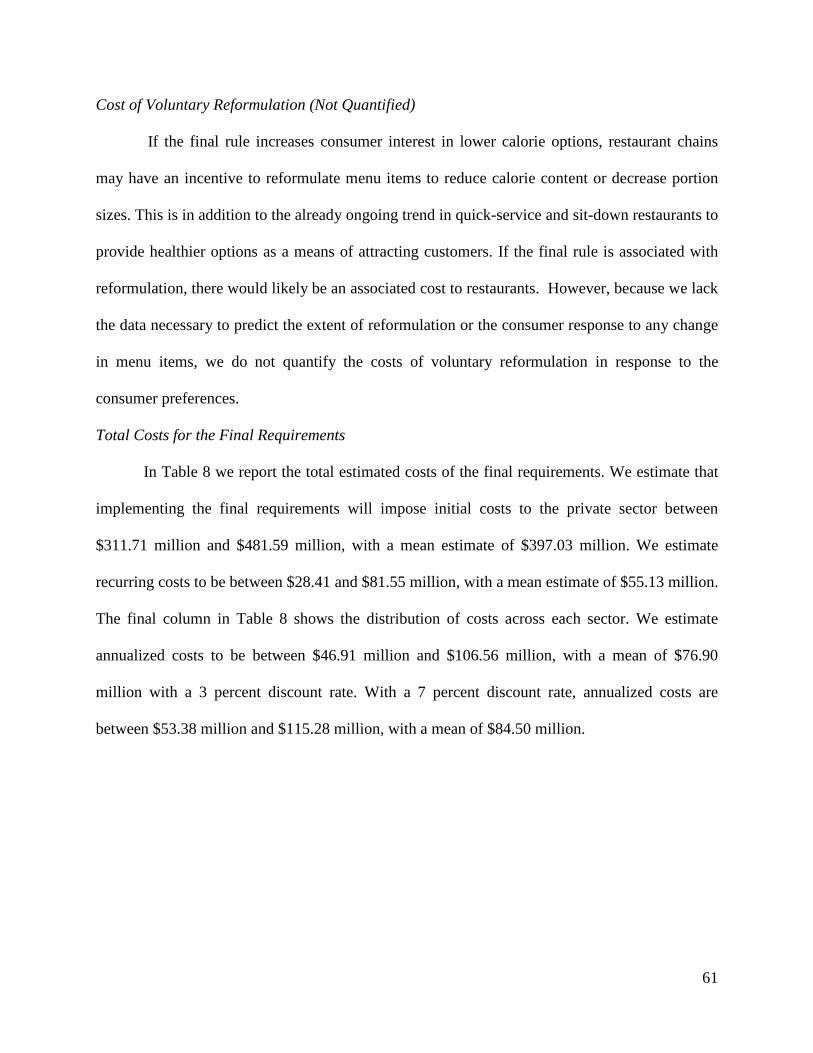
61
Cost of Voluntary Reformulation (Not Quantified)
If the final rule increases consumer interest in lower calorie options, restaurant chains
may have an incentive to reformulate menu items to reduce calorie content or decrease portion
sizes. This is in addition to the already ongoing trend in quick-service and sit-down restaurants to
provide healthier options as a means of attracting customers. If the final rule is associated with
reformulation, there would likely be an associated cost to restaurants. However, because we lack
the data necessary to predict the extent of reformulation or the consumer response to any change
in menu items, we do not quantify the costs of voluntary reformulation in response to the
consumer preferences.
Total Costs for the Final Requirements
In Table 8 we report the total estimated costs of the final requirements. We estimate that
implementing the final requirements will impose initial costs to the private sector between
$311.71 million and $481.59 million, with a mean estimate of $397.03 million. We estimate
recurring costs to be between $28.41 and $81.55 million, with a mean estimate of $55.13 million.
The final column in Table 8 shows the distribution of costs across each sector. We estimate
annualized costs to be between $46.91 million and $106.56 million, with a mean of $76.90
million with a 3 percent discount rate. With a 7 percent discount rate, annualized costs are
between $53.38 million and $115.28 million, with a mean of $84.50 million.
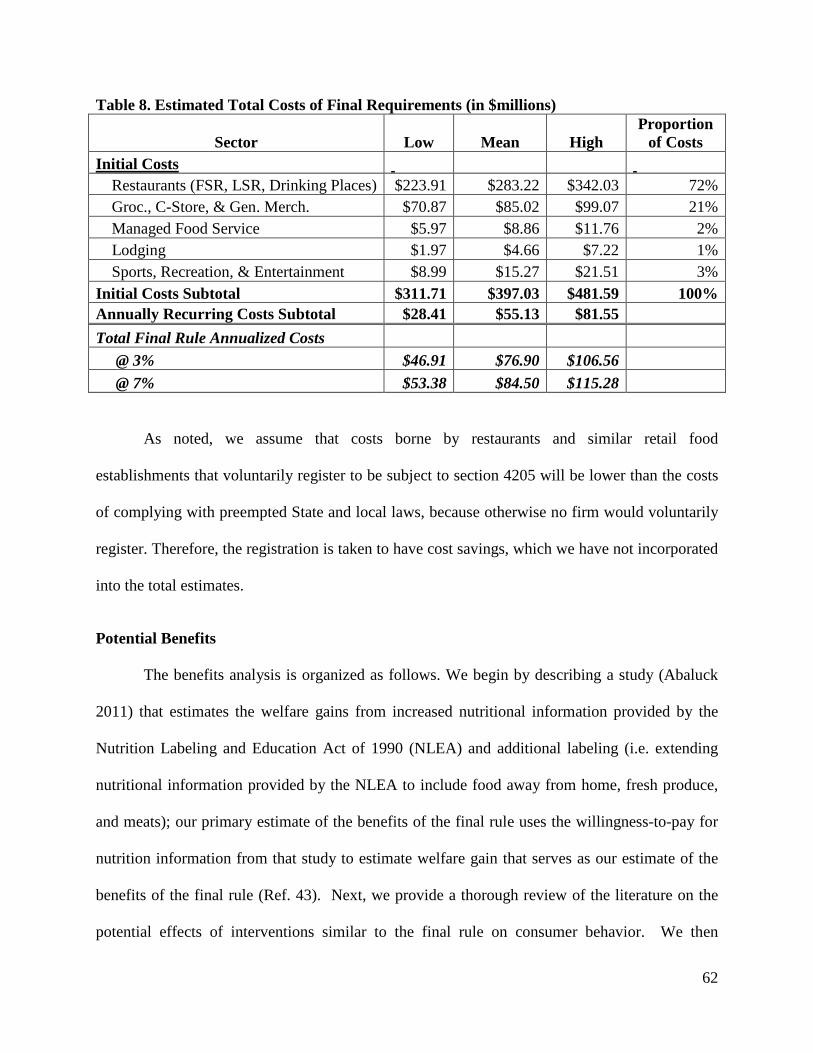
62
Table 8. Estimated Total Costs of Final Requirements (in $millions)
Sector Low Mean High Proportion
of Costs Initial Costs Restaurants (FSR, LSR, Drinking Places) $223.91 $283.22 $342.03 72% Groc., C-Store, & Gen. Merch. $70.87 $85.02 $99.07 21% Managed Food Service $5.97 $8.86 $11.76 2% Lodging $1.97 $4.66 $7.22 1% Sports, Recreation, & Entertainment $8.99 $15.27 $21.51 3% Initial Costs Subtotal $311.71 $397.03 $481.59 100% Annually Recurring Costs Subtotal $28.41 $55.13 $81.55 Total Final Rule Annualized Costs @ 3% $46.91 $76.90 $106.56 @ 7% $53.38 $84.50 $115.28
As noted, we assume that costs borne by restaurants and similar retail food
establishments that voluntarily register to be subject to section 4205 will be lower than the costs
of complying with preempted State and local laws, because otherwise no firm would voluntarily
register. Therefore, the registration is taken to have cost savings, which we have not incorporated
into the total estimates.
Potential Benefits
The benefits analysis is organized as follows. We begin by describing a study (Abaluck
2011) that estimates the welfare gains from increased nutritional information provided by the
Nutrition Labeling and Education Act of 1990 (NLEA) and additional labeling (i.e. extending
nutritional information provided by the NLEA to include food away from home, fresh produce,
and meats); our primary estimate of the benefits of the final rule uses the willingness-to-pay for
nutrition information from that study to estimate welfare gain that serves as our estimate of the
benefits of the final rule (Ref. 43). Next, we provide a thorough review of the literature on the
potential effects of interventions similar to the final rule on consumer behavior. We then
63
compare the main benefit estimate with two supplemental, illustrative examples of benefits using
the literature’s average reduction in calories consumed at restaurants due to menu labeling.
These supplemental estimates are not included in the final reported values. Last, we conduct a
sensitivity analysis and discuss the sources of uncertainty in our estimates.
Translating Changes in Behavior from Menu Labeling into Potential Welfare Gains
Americans are increasingly eating more “Food-Away-From-Home” (FAFH) at fast-food
and sit-down style restaurants, potentially contributing to an overconsumption of calories
because restaurant meals tend to have more calories than similar meals prepared at home (Refs.
6;44). In general, consumption of more calories than is necessary to maintain a healthy weight is
one of the primary risk factors for overweight and obesity among otherwise healthy people (Ref.
45). Due to the data limitations inherent in such estimation, we do not explicitly model the
improved human health outcomes that may result from this final rule. Instead, we provide an
estimate of consumer's willingness-to-pay for nutritional information as it encompasses these
outcomes. While many menu labeling studies provide evidence to suggest that calorie intake
will be influenced by the nutrition labeling requirements of this final rule, for the purposes of
quantifying benefits it is difficult to translate estimated changes in calories purchased or
consumed per transaction into their equivalent health and longevity welfare effects without
knowing the impact of menu labeling on the total daily diet. In other words, the value of the
menu labeling information depends, in part, on how much individuals shift their consumption
towards a healthier diet. Furthermore, the approach to measuring welfare gains from estimates
of the gross value of health and longevity improvements would have to be adjusted for utility
losses from reducing consumption.

64
To our knowledge, Abaluck (2011) is the only study that translates the potential effect of
increasing nutrition information on consumption into estimates of welfare gains using
willingness-to-pay based on revealed preferences (Ref. 43). This study uses the variation in
nutrition information generated by Nutrition Labeling and Education Act (NLEA) as a method to
determine how changes in individuals’ beliefs about nutrient content affect consumption
decisions. The differential changes in nutrition information across food categories, measured in
units of calories per gram, allow the study to identify a general model of food demand as a
function of nutrient characteristics that accounts for the total daily diet, prior beliefs about
nutrient content, and preferences, including willingness to substitute across food categories.
This approach hinges on the idea that when labeling reveals the true marginal health and
longevity cost of consumption, an individual responds to that information by internalizing the
health costs as if they have experienced a change in the price of that good. Then one can
compare the change in nutrient intake to the equivalent price change that would have to occur to
produce the same response given that preferences and tastes also influence the demand for food.
One can then use the difference in the perceived price of consumption before and after receipt of
the information to value the measured change in nutrient intake.
In addition to estimating the welfare gains of NLEA from his model, which he estimates
as having an impact of a daily reduction of 50-90 calories among label users, Abaluck extends
the model to estimate the potential welfare gains under the scenario in which nutrition labeling
requirements are extended to foods that are not covered by the Nutrition Labeling and Education
Act (NLEA), such as food away from home, fresh produce, and meats. These estimates are
referred to as the willingness-to-pay for “additional labeling”. Since the menu labeling final rule
establishes requirements for certain restaurants and similar retail food establishments, we can use
65
the willingness-to-pay for “additional labeling” to estimate the benefits associated with changes
in food choices that may be brought about by menu labeling. However, it is important to point
out here, and reiterate in the subsequent section, “Uncertainty of Costs and Potential Benefits”
that Abaluck’s model is based on the following assumptions:
• Consumers will change behavior as a result of reading menu labeling;
• Consumer behavior will change enough in the long term to lead to real reductions in
disease and thus medical expenditures;
• All consumers have the same preferences (i.e. homogenous consumers)
• Consumers that are overweight or obese are equally likely to read labels as non-obese
consumers;17 and
• Consumers do not experience diminishing returns to new nutrition information
We note that the willingness-to-pay estimates for mechanisms that shift consumers
toward a healthier diet based on revealed preference data reflects only the nutrition effects that
consumers can internalize; they reflect the parameters of a consumer’s utility function, such as
age and cultural norms, but may not fully reflect their underlying preferences because of time-
inconsistent behavior, problems with self-control, addiction, or poor information.18 Thus,
Abaluck’s estimates may understate the full welfare gain from improved diets. In addition, these
welfare estimates are likely characterized by substantial uncertainty because the model assumes
that all consumers have the same preferences (i.e., homogeneous consumers).
17 Using 2007-2010 NHANES data, we found there is a small but statistically significant difference in the awareness and use of menu labeling across weight categories. 18 An individual has time inconsistent preferences if his welfare-maximizing consumption choice for a particular date changes depending on when he is asked. An individual has present-biased preferences when, in comparing payoffs at two different time periods, she gives stronger relative weight to the earlier payoff if it is nearer in time to the present—for example, if she is indifferent between a $100 payoff in one month and a $105 payoff in 13 months but prefers an immediate $100 payoff over a $105 payoff in 12 months (Refs. 12;46).
66
Welfare Estimates
Using the parameters and assumptions discussed in the following sections, we estimate
the annual welfare gain (benefit) from the final menu labeling rule, ,tB using the formula
Bt = s1 × ΔW × POPt (1)
Here W∆ represents Abaluck’s (2011) estimate of the annual welfare gain per label user
from “additional labeling”, which includes certain categories of food labeling not covered by this
rule; s1 represents the scale factor to adjust for differences between Abaluck’s (2011) estimate of
the welfare gains from “additional labeling” relative to the gains attributable to the menu labeling
final rule, including differences in the types of foods covered, baseline assumptions on the
prevalence of menu labeling in the absence of the final rule, and prevalence of menu labeling use
based on the share of individuals in the NHANES 2007-2008 survey who indicated they would
use restaurant menu labeling; and POPt is the (adult or child and adolescent) population of the
United States in period t.19 Our approach to estimating potential benefits is contingent upon a
number of assumptions, explicitly listed above. This same model has been applied in the RIA of
the proposed Food Labeling: Revision of the Nutrition and Supplement Facts Label rulemaking
and may be applied to future nutrition-related rulemakings. As such, we are continuing to
develop and improve the application of this model to such rulemakings in the future.
19 We assume that parents purchase food with their children’s health in mind. However, we do not know how often children (under 18 years of age) purchase foods at covered establishments without their parents present. In the absence of better data, we assume that children and adolescents (under 18 years of age) value nutritional information provided by menu labeling equally with or without a parent or guardian present. It is possible that adolescents in particular have a different willingness to pay for nutrition labeling, possibly due to peer influences or self-perception of body weight (Refs. 47;48). If children and adolescents (or parents purchasing on their behalf) have a smaller willingness to pay than adult females purchasing for themselves, the presented benefits may be somewhat overstated. If children and adolescents have a larger willingness to pay, the presented benefits may be somewhat understated.
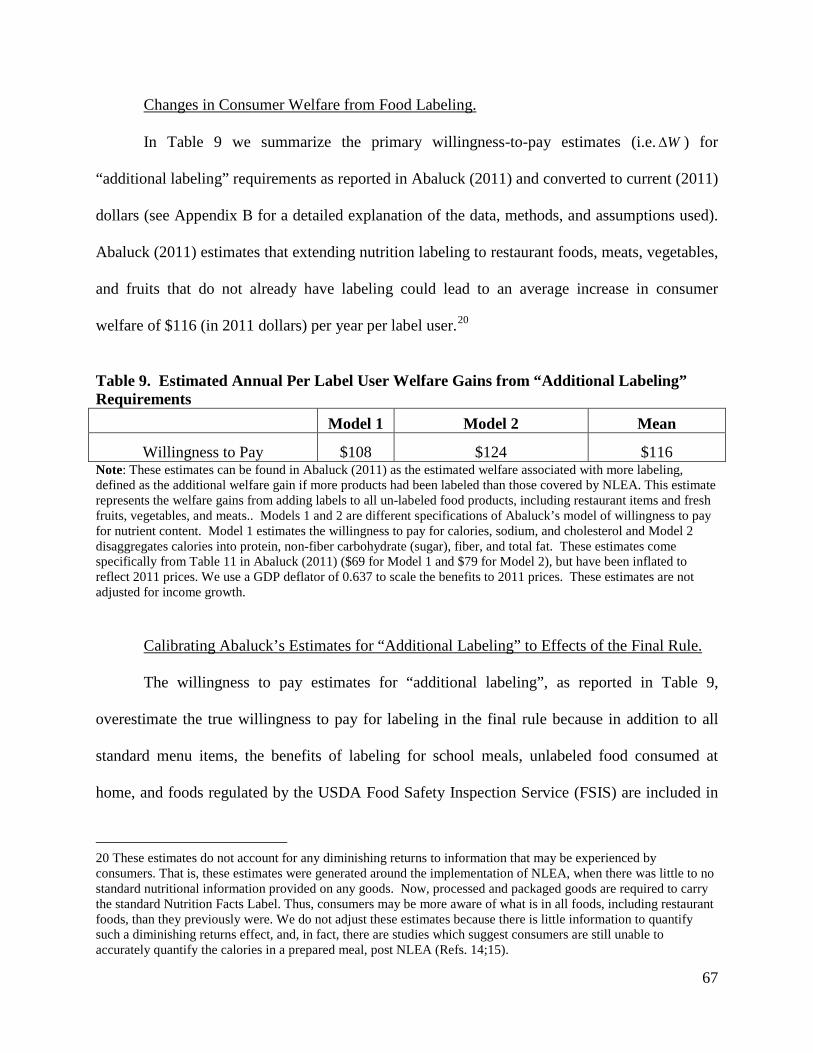
67
Changes in Consumer Welfare from Food Labeling.
In Table 9 we summarize the primary willingness-to-pay estimates (i.e. W∆ ) for
“additional labeling” requirements as reported in Abaluck (2011) and converted to current (2011)
dollars (see Appendix B for a detailed explanation of the data, methods, and assumptions used).
Abaluck (2011) estimates that extending nutrition labeling to restaurant foods, meats, vegetables,
and fruits that do not already have labeling could lead to an average increase in consumer
welfare of $116 (in 2011 dollars) per year per label user.20
Table 9. Estimated Annual Per Label User Welfare Gains from “Additional Labeling” Requirements
Model 1 Model 2 Mean
Willingness to Pay $108 $124 $116 Note: These estimates can be found in Abaluck (2011) as the estimated welfare associated with more labeling, defined as the additional welfare gain if more products had been labeled than those covered by NLEA. This estimate represents the welfare gains from adding labels to all un-labeled food products, including restaurant items and fresh fruits, vegetables, and meats.. Models 1 and 2 are different specifications of Abaluck’s model of willingness to pay for nutrient content. Model 1 estimates the willingness to pay for calories, sodium, and cholesterol and Model 2 disaggregates calories into protein, non-fiber carbohydrate (sugar), fiber, and total fat. These estimates come specifically from Table 11 in Abaluck (2011) ($69 for Model 1 and $79 for Model 2), but have been inflated to reflect 2011 prices. We use a GDP deflator of 0.637 to scale the benefits to 2011 prices. These estimates are not adjusted for income growth.
Calibrating Abaluck’s Estimates for “Additional Labeling” to Effects of the Final Rule.
The willingness to pay estimates for “additional labeling”, as reported in Table 9,
overestimate the true willingness to pay for labeling in the final rule because in addition to all
standard menu items, the benefits of labeling for school meals, unlabeled food consumed at
home, and foods regulated by the USDA Food Safety Inspection Service (FSIS) are included in
20 These estimates do not account for any diminishing returns to information that may be experienced by consumers. That is, these estimates were generated around the implementation of NLEA, when there was little to no standard nutritional information provided on any goods. Now, processed and packaged goods are required to carry the standard Nutrition Facts Label. Thus, consumers may be more aware of what is in all foods, including restaurant foods, than they previously were. We do not adjust these estimates because there is little information to quantify such a diminishing returns effect, and, in fact, there are studies which suggest consumers are still unable to accurately quantify the calories in a prepared meal, post NLEA (Refs. 14;15).

68
the estimate; therefore, we need to calibrate the willingness to pay for “additional labeling” to
match the specific requirements and predicted effects of the menu labeling rule. Moreover, the
estimates are based on the behavioral effects of adding full nutrition information for products for
which, at the time of the estimated changes, little nutritional information was readily available.
The final rule will require covered restaurants to provide nutrition information, but it will
only require the declaration of calories on menus and menu boards and written nutrition
information to be made available upon request. We model the welfare gains of increased
information of menu labeling as proportional to those derived by Abaluck adjusting for the
difference in the amount of information made available by the final rule and the amount assumed
available in the model.
We use several factors to determine a reasonable range for the relative effect of the final
menu labeling rule as compared with Abaluck’s estimate of welfare gains for “additional
labeling”, including the percent change in informational content and differences in nutrient
intake for individuals who report the intent to use the nutrition information on restaurant menus.
We assume that the share of the welfare gains per capita attributable to menu labeling relative to
those derived by Abaluck vary in proportion to: (i) the share of energy consumption from food
away from home, (ii) the share of food consumption from establishments covered by the final
rule, (iii) the share of establishments that have yet to meet the requirements of the menu labeling
rule, and (iv) the prevalence of the use of calorie information provided in menu labeling.
(i) Estimating the Percentage Change in Restaurant Labeling Relative to Abaluck’s
Assumptions
Abaluck assumes that the percent of restaurants providing calorie labeling increases from
0 to 100 percent for his estimate of welfare gains of “additional labeling”. Therefore, we need to
69
adjust for differences in the baseline assumption of restaurant labeling and the incremental
increase attributable to the menu labeling final rule. In the preceding sections we estimate that
40 percent of restaurants (full and limited service) will be covered by the final rule. We expect
that due to chain restaurants’ larger market share, more than 40 percent of calories consumed at
restaurants will be covered by the final rule. The NPD group estimates that chain restaurants
represent 73 percent of visits to food establishments (Ref. 49). Therefore, we estimate that 40 to
73 percent calories consumed at full service restaurants and 100 percent of calories consumed at
fast-food restaurants will be covered by this rule and scale the estimate accordingly.21, 22
We make a parallel adjustment for calories consumed at non-restaurant establishments.
In previous sections, we estimate that 18 percent of grocery stores, 30 percent of convenience
stores, 7 percent of general merchandise stores; 18 percent of managed food service
establishments; 10 percent of lodging establishments, 54 percent of motion picture exhibition
establishments; and 3 percent of sports or recreation establishments will be covered by the final
rule, or an average of 20 percent of non-restaurants. Without additional information about the
market share of these types of establishments, we estimate that 20 to 100 percent of calories
consumed at non-restaurant establishments will be covered by this rule.
Some establishments covered by the final rule are already displaying calorie information
for their menu items (either voluntarily or due to local menu labeling requirements). We adjust
the “additional labeling” welfare gains to account for the 40 to 57 percent of all restaurants that
21 Because of limited information on how buffets or self-service type restaurants operate differently from standard type restaurants, we assume that costs will be accrued and consumers will react identically in either restaurant type. 22 The final rule requires calorie labeling on all standard-menu items. Due to data limitations, the analysis does not account for the possibility of non-standard menu items (e.g. seasonal or promotional items) at covered establishments that will not require calorie labeling. To the extent that this reduces the number of calorie labeled menu items, the analysis may overestimate potential benefits.
70
do not already display calorie information for their menu items. We assume that 100 percent of
all non-restaurant establishments do not already display calorie information for their menu items.
(ii) Estimating the Share of Total Daily Calorie Intake Affected by the Rule Relative to
the Share of Total Daily Calorie Intake Assumed in Abaluck’s willingness-to-pay for “Additional
Labeling”
To adjust for Abaluck’s inclusion of calories consumed in his willingness-to-pay
estimates that would not be affected by this final rule, we estimate the ratio of the share of
calories consumed that will be affected by the menu labeling final rule to the share of calories
considered in Abaluck’s welfare gains from “additional labeling”. Adults in the United States
consume 31 percent of daily total energy or kilocalorie intake from food consumed away from
home (FAFH), and 69 percent of calories from food consumed at home (FAH) (see Table 10)
(Ref. 50). Fresh fruits and vegetables do not carry nutrition labels and some fresh meats and
meat products carry labels regulated by the USDA FSIS. We estimate that up to 8.1 percent of
the average American’s daily calories come from the consumption of fresh fruits and
vegetables.23 The USDA Food Safety Inspection Service regulates the labeling of certain meat,
certain poultry, and certain egg products (Ref. 51). Using Table 2-2 (p. 12) of the Dietary
Guidelines for Americans, 2010, we estimate that approximately 353 of the 2,157 calories (16.4
percent) an average American consumes daily come from foods that may be regulated by the
USDA if they are purchased from a store rather than a food service establishment. These
products include chicken and chicken mixed dishes, beef and beef mixed dishes, burgers,
sausage, franks, bacon, ribs, certain egg products and egg mixed dishes, and cold cuts. Given
that some of these foods may come from restaurants and other food service establishments, and
23 U.S. Department of Agriculture, Economic Research Service. Food Availability (Per Capita) Data System. Last updated: 11-7-2012. Available at: http://www.ers.usda.gov/data-products/food-availability-%28per-capita%29-data-system.aspx#.UXq6CYaUNhE
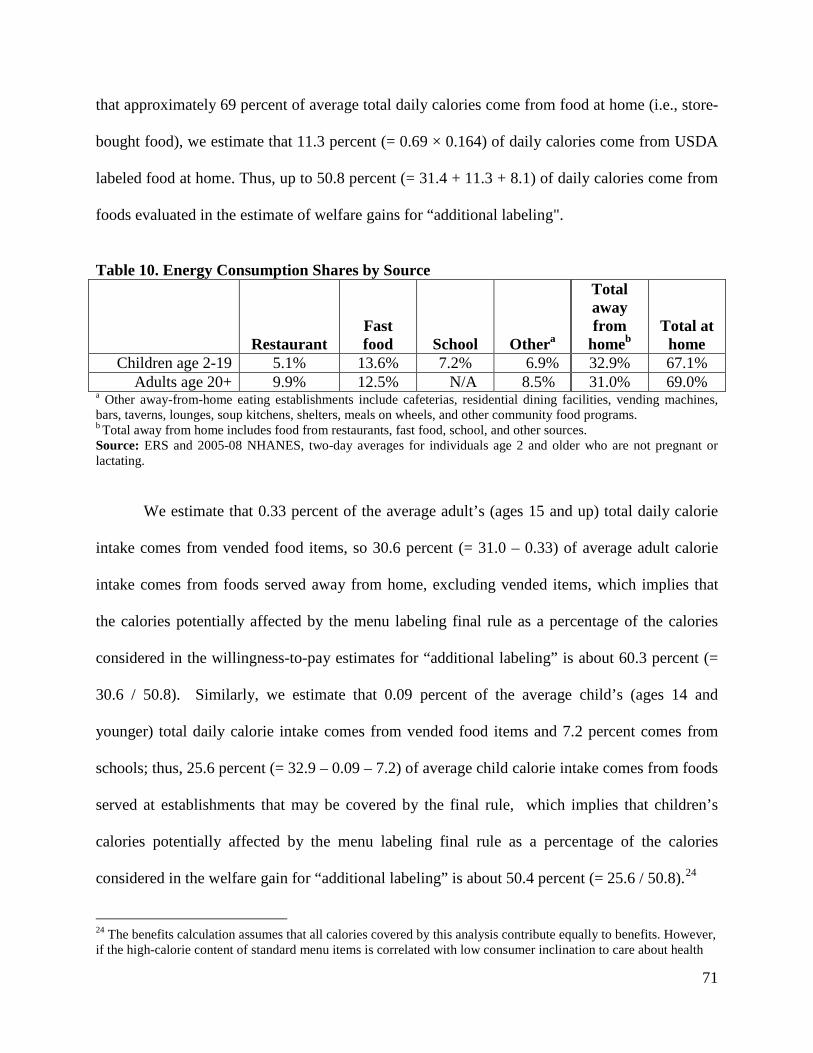
71
that approximately 69 percent of average total daily calories come from food at home (i.e., store-
bought food), we estimate that 11.3 percent (= 0.69 × 0.164) of daily calories come from USDA
labeled food at home. Thus, up to 50.8 percent (= 31.4 + 11.3 + 8.1) of daily calories come from
foods evaluated in the estimate of welfare gains for “additional labeling".
Table 10. Energy Consumption Shares by Source
Restaurant Fast food School Othera
Total away from
homeb Total at
home Children age 2-19 5.1% 13.6% 7.2% 6.9% 32.9% 67.1%
Adults age 20+ 9.9% 12.5% N/A 8.5% 31.0% 69.0% a Other away-from-home eating establishments include cafeterias, residential dining facilities, vending machines, bars, taverns, lounges, soup kitchens, shelters, meals on wheels, and other community food programs. b Total away from home includes food from restaurants, fast food, school, and other sources. Source: ERS and 2005-08 NHANES, two-day averages for individuals age 2 and older who are not pregnant or lactating.
We estimate that 0.33 percent of the average adult’s (ages 15 and up) total daily calorie
intake comes from vended food items, so 30.6 percent (= 31.0 – 0.33) of average adult calorie
intake comes from foods served away from home, excluding vended items, which implies that
the calories potentially affected by the menu labeling final rule as a percentage of the calories
considered in the willingness-to-pay estimates for “additional labeling” is about 60.3 percent (=
30.6 / 50.8). Similarly, we estimate that 0.09 percent of the average child’s (ages 14 and
younger) total daily calorie intake comes from vended food items and 7.2 percent comes from
schools; thus, 25.6 percent (= 32.9 – 0.09 – 7.2) of average child calorie intake comes from foods
served at establishments that may be covered by the final rule, which implies that children’s
calories potentially affected by the menu labeling final rule as a percentage of the calories
considered in the welfare gain for “additional labeling” is about 50.4 percent (= 25.6 / 50.8).24
24 The benefits calculation assumes that all calories covered by this analysis contribute equally to benefits. However, if the high-calorie content of standard menu items is correlated with low consumer inclination to care about health
72
Another consideration in extrapolating from Abaluck’s willingness-to-pay estimates for
“additional labeling” is that his estimates are based on labeling containing the nutrition
information provided on the Nutrition Facts label, which is more than the amount of information
that will be provided for standard menu items on menus and menu boards by this final rule. The
final rule requires the declaration of calories for standard menu items on menus and menu boards
as well as making full nutrition information available in written form upon request. We chose to
take a conservative approach: we scale the effects based on the differences between the amount
of information provided by the Nutrition Facts label and a menu with calorie information for
standard menu items.
A product’s calorie content is one of 13 principal pieces of nutrition information that
manufacturers must declare in the Nutrition Facts label.25 Thus the final rule requires that
restaurants and similar retail food establishments provide approximately 7.7 percent of the
information at the point of purchase that manufacturers must list in the Nutrition Facts label. If,
as is likely, consumers focus on calorie content of nutrition labeling more than the other nutrients
or serving size information, then the final rule would represent a larger proportion of nutrition
information available to consumers at the point of purchase. For other reasons (e.g.
characteristics of the context in which decisions are made), it is also possible that the final rule
would represent a smaller proportion of nutrition information available to consumers at the point
of purchase. We will use a range of 3.8–15.4 percent as our estimate of the proportion of
and thus use labels, the presented benefits may be somewhat overestimated. If the high-calorie content of standard menu items is correlated with low consumer information relative to other foods, thus motivating them to alter their behavior more drastically, the presented benefits may be somewhat underestimated. In the absence of better data on consumer behavior, we assume that all calories are viewed equally. 25 Under NLEA, manufacturers are required to declare serving size, calories, total fat, saturated fat, trans fat, cholesterol, sodium, protein, carbohydrates, sugars, dietary fiber, iron, vitamin A, vitamin C, and Calcium in the Nutrition Facts label. Manufacturers are also required to state “* Percent Daily Values are based on a 2,000 calorie diet. Your daily values may be higher or lower depending on your calorie needs” in the footnote section of the Nutrition Facts label. (21 CFR 101.9)
73
nutrition information available to consumers relative to the Nutrition Facts label as a result of the
final rule. The final rule requires that restaurants and similar retail food establishments provide
the remaining nutrition information that manufacturers must list in the Nutrition Facts label upon
request at the point of purchase (ranging from 84.6 percent (=100-15.4) to 96.2 (=100-3.8)
percent, depending on how consumers weigh extra written nutrition information relative to the
calorie declarations provided on the menus and menu boards).
Lastly, using data from the 2007-2008 National Health and Nutrition Examination Survey
(NHANES), Parks (2013) estimated that approximately 53 percent of American adults would use
calorie information provided in menu labeling (Ref. 52). Of those individuals with children, 57
percent indicated that they would use calorie information provided in menu labeling (Ref. 52).
Using more recent NHANES data through 2010, we estimate that of the adults that saw nutrition
information in fast food or sit down restaurants, about 50 percent also reported using the
information to inform food purchasing decisions.
There is some uncertainty regarding these estimates. First, the estimated proportion of
labeling users represents a pre-treatment estimate. It is possible that as menu labeling becomes
more ubiquitous, adults will become more aware of the calorie information and use it more often.
Thus, using 53 percent as an estimate of the percent of adults using restaurant menu labeling may
lead to an underestimate of the potential benefits. Second, it is unclear whether consumers
reporting using calorie labeling will always use labeling to inform his/her food purchase. For
example, if a consumer would only use calorie labeling half the time, then using 53 percent as an
estimate of the percent of adults using menu labeling would lead to an overestimate of potential
benefits. Taking into consideration the frequency of labeling use (often, sometimes, rarely, or
never) and using 2007-2010 NHANES data, we estimate that American adults would use calorie
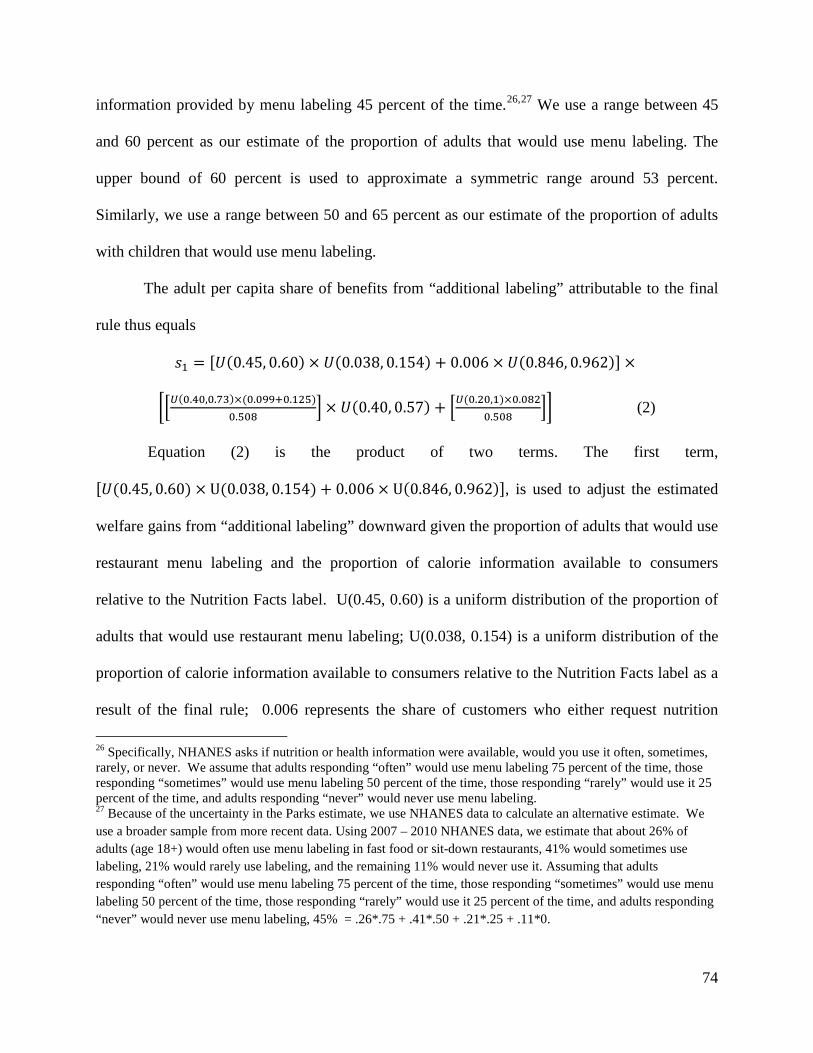
74
information provided by menu labeling 45 percent of the time.26,27 We use a range between 45
and 60 percent as our estimate of the proportion of adults that would use menu labeling. The
upper bound of 60 percent is used to approximate a symmetric range around 53 percent.
Similarly, we use a range between 50 and 65 percent as our estimate of the proportion of adults
with children that would use menu labeling.
The adult per capita share of benefits from “additional labeling” attributable to the final
rule thus equals
𝑠1 = [𝑈(0.45, 0.60) × 𝑈(0.038, 0.154) + 0.006 × 𝑈(0.846, 0.962)] ×
��𝑈(0.40,0.73)×(0.099+0.125)0.508
� × 𝑈(0.40, 0.57) + �𝑈(0.20,1)×0.0820.508
�� (2)
Equation (2) is the product of two terms. The first term,
[𝑈(0.45, 0.60) × U(0.038, 0.154) + 0.006 × U(0.846, 0.962)], is used to adjust the estimated
welfare gains from “additional labeling” downward given the proportion of adults that would use
restaurant menu labeling and the proportion of calorie information available to consumers
relative to the Nutrition Facts label. U(0.45, 0.60) is a uniform distribution of the proportion of
adults that would use restaurant menu labeling; U(0.038, 0.154) is a uniform distribution of the
proportion of calorie information available to consumers relative to the Nutrition Facts label as a
result of the final rule; 0.006 represents the share of customers who either request nutrition 26 Specifically, NHANES asks if nutrition or health information were available, would you use it often, sometimes, rarely, or never. We assume that adults responding “often” would use menu labeling 75 percent of the time, those responding “sometimes” would use menu labeling 50 percent of the time, those responding “rarely” would use it 25 percent of the time, and adults responding “never” would never use menu labeling. 27 Because of the uncertainty in the Parks estimate, we use NHANES data to calculate an alternative estimate. We use a broader sample from more recent data. Using 2007 – 2010 NHANES data, we estimate that about 26% of adults (age 18+) would often use menu labeling in fast food or sit-down restaurants, 41% would sometimes use labeling, 21% would rarely use labeling, and the remaining 11% would never use it. Assuming that adults responding “often” would use menu labeling 75 percent of the time, those responding “sometimes” would use menu labeling 50 percent of the time, those responding “rarely” would use it 25 percent of the time, and adults responding “never” would never use menu labeling, 45% = .26*.75 + .41*.50 + .21*.25 + .11*0.

75
pamphlets or approach wall posters with detailed nutrition information (Ref. 39); U(0.846,
0.962) is a uniform distribution of the proportion of non-calorie nutrition information available to
consumers relative to the Nutrition Facts label as a result of the final rule.
The second term is used to adjust the estimated welfare gains from “additional labeling”
downward given the expected coverage of the final rule and the current compliance rates at both
restaurant and non-restaurant establishments. U(0.40, 0.73) is a uniform distribution of the share
of calories from restaurants covered by the final rule, 0.099 and 0.125 are the share of calories
from full service and fast food restaurants, respectively; 0.508 is the average share of daily
calories consumed from foods not covered under NLEA28; U(0.40, 0.57) is a uniform
distribution of the number of restaurants currently not in compliance; U(0.20, 1) is a uniform
distribution of the share of calories from non-restaurant establishments covered by the final rule;
and 0.082 (=0.306 – [0.099+0.125]) is the share of calories from non-restaurant establishments.
Similarly, the child per capita share of benefits from “additional labeling” attributable to
the final rule equals
𝑠1 = [𝑈(0.50, 0.65) × 𝑈(0.038, 0.154) + 0.006 × 𝑈(0.846, 0.962)] ×
��𝑈(0.40,0.73)×(0.051+0.136)0.508
� × 𝑈(0.40, 0.57) + �𝑈(0.20,1)×0.0690.508
�� (3)
where U(0.50, 0.65) is a uniform distribution of the proportion of parents who would use
restaurant menu labeling; 0.051 and 0.136 are the share of calories from full service and fast food
restaurants, respectively; and 0.069 is the share of calories from non-restaurant establishments.
All other parameters are described above.
Thus, we estimate that on average adults and children could potentially realize 1.5
percent and 1.4 percent, respectively, of the benefits associated with the final menu labeling rule
28 We apply these shares (0.306 & 0.508) to the composite nutrition information set as well.
76
relative to the welfare gains for “additional labeling”.29 Applying these percentages to the
welfare gains per label user generates the welfare gains per capita.
Stream of Benefits
The final regulation would generate a stream of annual benefits from the effective date of
the final rule. We adjust the annual stream of benefits from the final rules for the projected
growth in the total population in the United States from 2015 to 2034 from the U.S. Census
Bureau International Data Base.30
We estimated the present value of the potential benefits over 20 years using a simulation
to account for the uncertain parameters. Using the @Risk software, we carried out a simulation
with 10,000 iterations to estimate benefits (Ref. 53). Each iteration of the simulation randomly
draws a value for s1 from a uniform distribution and calculates the present value of the stream of
benefits over the next 20 years using Equations (1)–(3). Table 11 contains a summary of all the
parameters used to calculate welfare gains and Table 12 displays the results of this simulation
using a 1 year delayed effective date.
29 The willingness-to-pay estimates are derived from a time before consumer information was as readily available as it is today. For example, in some cases, a consumer can access nutritional information at the point of sale with a smart phone. To the extent that consumers are more aware of caloric information at the point of sale due to new technologies, then the benefits estimated may be somewhat overstated. We do not make any downward adjustment due to a lack of relevant empirical evidence . 30 Available at: http://www.census.gov/population/international/data/idb/informationGateway.php . Even though consumers have willingness-to-pay at the time when consumption is selected, the resulting health and longevity benefits will mostly occur in the more distant future.
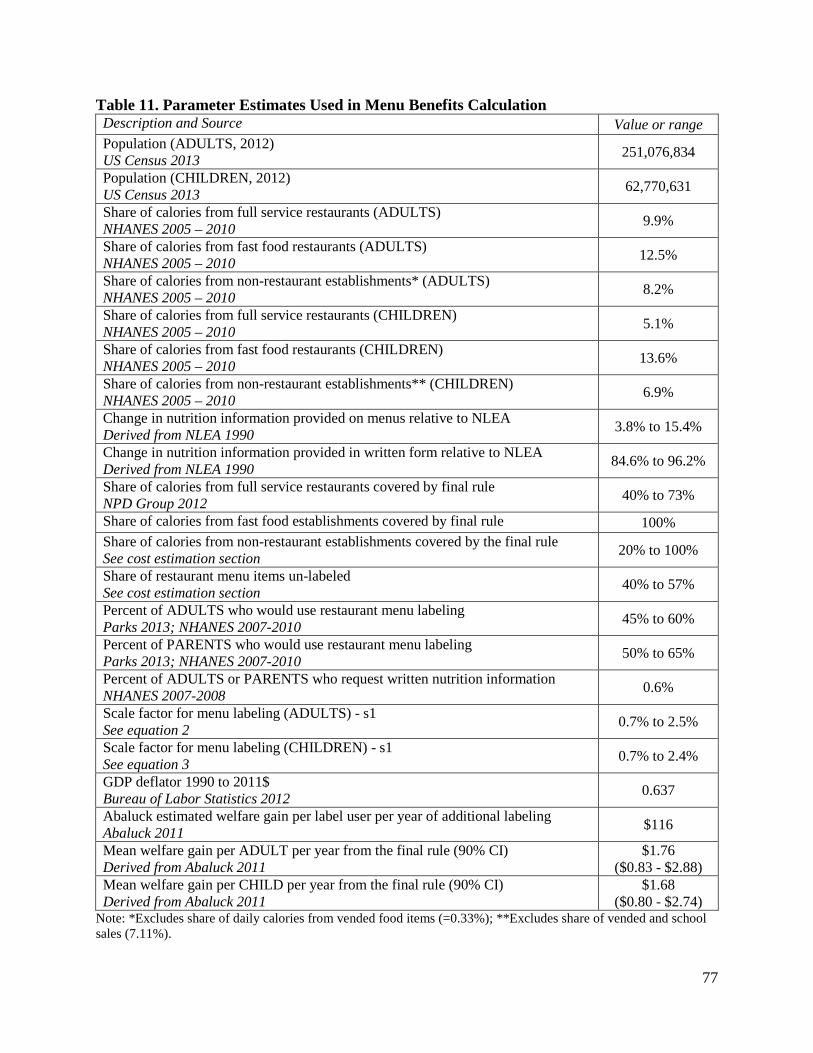
77
Table 11. Parameter Estimates Used in Menu Benefits Calculation Description and Source Value or range Population (ADULTS, 2012) US Census 2013 251,076,834
Population (CHILDREN, 2012) US Census 2013 62,770,631
Share of calories from full service restaurants (ADULTS) NHANES 2005 – 2010 9.9%
Share of calories from fast food restaurants (ADULTS) NHANES 2005 – 2010 12.5%
Share of calories from non-restaurant establishments* (ADULTS) NHANES 2005 – 2010 8.2%
Share of calories from full service restaurants (CHILDREN) NHANES 2005 – 2010 5.1%
Share of calories from fast food restaurants (CHILDREN) NHANES 2005 – 2010 13.6%
Share of calories from non-restaurant establishments** (CHILDREN) NHANES 2005 – 2010 6.9%
Change in nutrition information provided on menus relative to NLEA Derived from NLEA 1990 3.8% to 15.4%
Change in nutrition information provided in written form relative to NLEA Derived from NLEA 1990 84.6% to 96.2%
Share of calories from full service restaurants covered by final rule NPD Group 2012 40% to 73%
Share of calories from fast food establishments covered by final rule 100% Share of calories from non-restaurant establishments covered by the final rule See cost estimation section 20% to 100%
Share of restaurant menu items un-labeled See cost estimation section 40% to 57%
Percent of ADULTS who would use restaurant menu labeling Parks 2013; NHANES 2007-2010 45% to 60%
Percent of PARENTS who would use restaurant menu labeling Parks 2013; NHANES 2007-2010 50% to 65%
Percent of ADULTS or PARENTS who request written nutrition information NHANES 2007-2008 0.6%
Scale factor for menu labeling (ADULTS) - s1 See equation 2 0.7% to 2.5%
Scale factor for menu labeling (CHILDREN) - s1 See equation 3 0.7% to 2.4%
GDP deflator 1990 to 2011$ Bureau of Labor Statistics 2012 0.637
Abaluck estimated welfare gain per label user per year of additional labeling Abaluck 2011 $116
Mean welfare gain per ADULT per year from the final rule (90% CI) Derived from Abaluck 2011
$1.76 ($0.83 - $2.88)
Mean welfare gain per CHILD per year from the final rule (90% CI) Derived from Abaluck 2011
$1.68 ($0.80 - $2.74)
Note: *Excludes share of daily calories from vended food items (=0.33%); **Excludes share of vended and school sales (7.11%).

78
We estimate that the present discounted value of the 20-year stream of benefits from the
final rule for the whole population under a 3 percent discount rate ranges (90 percent CI) from
$5.1 billion to $14.2 billion, with a mean estimate of $9.2 billion. We estimate that the present
discounted value of the 20-year stream of benefits from the final menu labeling rule for the
whole population under a 7 percent discount rate ranges (90 percent CI) from $3.7 billion to
$10.4 billion, with a mean estimate of $6.8 billion (see Appendix C, Table C1 and C2 for total
welfare benefits accrued per year for the 20-year time horizon).
Table 12. Estimated Present Value of Potential Benefits from Menu Labeling Rule, 2015–2034 (in $billions).
Discount rate Low Mean High 3% $5.10 $9.22 $14.18 7% $3.74 $6.75 $10.38
Total Net Benefits
We estimate potential welfare gains annually over a 20-year time horizon for the cohort
in that period. The willingness-to-pay in any given year, however, is not limited to that year or to
20 years. The willingness to pay for a healthier diet in a given year incorporates the effects on
lifetime health and longevity for each cohort. In particular, the benefits include the value of
reduced probabilities of mortality stretching well beyond 20 years. Indeed, the welfare gain in
year 20 of the time frame for this analysis almost entirely reflects health effects occurring more
than 20 years after the final rule takes effect.
We estimate net quantified potential benefits (totaled over 20 years) to be $8.1 billion
($9.22 billion in benefits minus $1.17 billion in costs) under a 3 percent discount rate and $5.8
billion ($6.75 billion in benefits minus $0.93 billion in costs) under a 7 percent interest rate (see
Table 2).
79
Literature on the Potential Effects of Menu Labeling on Consumer Behavior
The menu labeling final rule requires covered establishments to provide calorie and other
nutrition information to consumers in a direct and accessible manner to enable consumers to
make informed dietary choices. Recent research has shown that calorie labeling increases the
number of people who see and claim to use nutrition information on restaurant menus (Refs.
54;55;56;57). The literature that has investigated the potential effect of calorie labeling on
calories purchased or consumed is mixed; the majority of studies have found that calorie labeling
is associated with reduced calorie consumption by a small but statistically significant amount
(see Table A1). However, most studies have measured short-term impacts, and causality cannot
be inferred from most of these investigations of menu labeling due to the design of the studies.
There is evidence that these effects could be larger in the long run, which would hopefully
translate into a reduction in consumers’ average Body Mass Index (BMI) and probability of
being obese (Refs. 58;59).
Of the 20 studies reviewed, three-quarters were conducted in retail food establishments
(e.g. restaurant, cafeteria, convenience store) and the remaining studies were conducted in
controlled environments observing actual food purchased or consumed (simulated experiment) or
purchase intentions of hypothetical choices (survey-based experiment). Researchers investigated
the effect of menu labeling on outcomes such as: 1) labeling use, 2) labeling awareness, and 3)
mean calories purchased or consumed. The remainder of this section describes the relevant
literature in detail. Further details regarding the sample, study design, and relevant results of
each study referenced can be found in Table A1 in Appendix A.
In July 2008, New York City became the first locality to implement mandatory calorie
labeling. Cross-sectional surveys of residents before and after implementation can be used to
80
generate hypotheses about the potential causes of differences in residents’ purchasing and
consumption behaviors before and after the policy change. However, comparisons of two cross-
sectional samples cannot be used to infer causality. With those caveats, the following the studies
reviewed below are of interest. In the spring of 2007, before New York City’s calorie posting
requirements went into effect, Bassett and colleagues (2008) surveyed consumer food purchasing
behavior and calorie information availability at 275 randomly selected locations in New York
City of 11 fast food chains, such as McDonalds®, KFC®, Taco Bell®, and Subway® (Ref. 54).
They found that among the chains included in the study only Subway® had calorie information
at the point of purchase. They also found that, during the study period, Subway® customers who
reported seeing calorie information purchased an average of 52 fewer calories per transaction
than customers who did not report seeing calorie information. Bollinger and colleagues analyzed
transaction data in every New York City Starbucks® location for a period of time running from 3
months before until 11 months after New York City’s calorie posting requirements went into
effect (Ref. 60). They found a 6 percent decrease in calories consumed per transaction, and that
the decrease resulted from a decline in accompanying food purchases, rather than substitution
towards lower calorie beverages. In another study, Downs and colleagues (2009) found that
calorie posting may have had a modest impact on consumers’ food selections in three New York
City restaurants. However, because not all consumers use calorie information for the same
purpose (e.g., some may use the information to shift calorie intake between meals, or to increase
intake, or to feel like they are getting a better “value”) they also found that calorie labeling in
some cases may have induced consumers to purchase higher calorie items (Ref. 61).
Some studies suggest that calorie labeling did not have a statistically significant effect on
food purchase behaviors (Refs. 62;63;64;65). Finkelstein et al. (2011) collected transaction data
81
in a restaurant chain with locations in and out of King County (Ref. 64). Using a difference-in-
difference approach, the authors compared patrons’ purchasing behaviors among similarly
selected but different samples of patrons before and after menu labeling and found that calories
per transaction were not reduced among the group studied after menu labeling was introduced. In
two additional studies examining the potential implications on consumer behavior of menu
labeling in New York City, the authors did not find a significant difference in the food purchase
behaviors among samples of adults or adolescents in low-income minority neighborhoods (Refs.
62;63). In an experimental-design study of adolescent fast food consumption, Yamamoto and
colleagues (2005) found little difference in food choices made by the study participants when the
participants made food choices from menus that included calorie information in comparison to
menus that did not include calorie information (Ref. 65). However, these results may not hold
for the general population: two of the studies limit their analysis to children or adolescents (Refs.
63;65) and one study focused on food purchases within low-income minority neighborhoods
(Ref. 62). Lastly, the authors of the study in King County, Washington suggest that menu
labeling may not have led to changes in calorie consumption among patrons of King County
because they were already consuming lower calorie options than non-King County patrons (Ref.
64).
Two experimental studies using children and adolescents as subjects found that menu
labeling did reduce the number of calories purchased. Tandon and colleagues (2010) found that
menu labeling of fast food reduced the number of calories in meals that parents ordered for their
children (Ref. 66). Similarly, another experimental study conducted in Baltimore, Maryland
found that providing calorie information of sugar-sweetened beverages reduced purchases of
such beverages among adolescents (Ref. 67).
82
Brissette et al. (2013) compared restaurant customers in counties with and without menu
labeling regulations and found that customers purchased fewer calories in counties with labeling
(Ref. 68). In addition, customers who reported that they used the calorie information ordered 84
fewer calories than customers who reported that they did not use the calorie information.
Auchincloss et al. (2013) chose to investigate consumer behavior at one restaurant chain where
some locations had implemented menu labeling and other locations had not (Ref. 69). Customers
at restaurants with menu labeling (in Philadelphia, PA) purchased food with fewer calories,
sodium, and saturated fat than customers at identical restaurants without menu labeling.
Four experimental studies have estimated the effect of calorie labeling on calories
ordered and calories consumed and found mixed results. One small experimental study found
that, relative to individuals who ordered dinner from a menu with no calorie information,
individuals who ordered from a menu with calorie labels ordered and consumed significantly
fewer calories. The study also asked individuals what they consumed in the hours following the
evening meal and determined that while calorie labeling reduced the number of calories
consumed during the meal, these individuals ate more after the meal, negating any positive
effects (Ref. 70). However, when the menu included both calorie information and a
recommended daily intake statement, individuals consumed 250 fewer kilocalories from dinner
and after-dinner snacks. The three other studies found mixed and small effects of labeling in a
restaurant setting on intake for men and women and depending on whether the labeling also
provided a recommended daily calorie intake statement (Refs. 71;72;73).
The effect of menu labeling may be different in the long-run versus the short-run.
Repeated exposure to calorie information may make some consumers more vigilant about calorie
consumption over time; alternatively, long-run exposure may desensitize consumers to the
83
information. Krieger et al. (2013) compared two cross-sectional samples to get an indication of
see if customer awareness and use of calorie information was different six and eighteen months
after implementation in King County (Ref. 58). The authors found that, compared to one to three
months before calorie posting was required, calories purchased did not decrease four to six
months post requirement. However, sixteen to eighteen months post-requirement, they found a
modest decline in the calorie content of foods purchased at taco, sandwich, and burger
restaurants as well as coffee chains.
None of these studies examined total diet; consumers may have compensated by
increasing calorie intake during other meals or snacks throughout the day, offsetting the observed
reduction in calories. However, there is research that has tried to assess whether the introduction
of nutrition labels in general and menu labeling specifically is associated with a reduction in
body weight (Refs. 59;74). A recent comparison of cross-sectional samples before and after
mandatory calorie labeling in New York State on BMI suggests that implementation of menu
labeling is associated with a reduction in the average BMI and in the probability of being obese
(Ref. 59). This study uses body weight, not calories consumed or purchased, as an endpoint.
Restrepo (2014) uses data from independent cross-sectional samples of individuals in New York
between 2004 and 2012 and county level data regarding implementation of mandatory calorie
labeling in New York City and six other counties, in an ordinary least squares regression to
estimate the association between changes in BMI and menu labeling. The main result suggests
that, on average, implementation of menu labeling is associated with a BMI reduction of 1.6
percent (0.4 units). It is possible that the menu labeling impacts food choices differently
depending on whether or not the person is obese. The author estimates the differential
association with calorie labeling for overweight and obese individuals by performing a quantile

84
regression. At the 80th percentile, which corresponds to obese individuals, implementing menu
labeling is associated with a reduction in BMI by 0.895 units, or 3 percent. The quantile
regression results show that the policy was effective in disproportionately affecting the behavior
of obese individuals.
The majority of the literature suggests that consumers may respond to calorie labeling by
decreasing the average calories purchased. The evidence, however, indicates that the response
may vary across different subgroups and contexts, ranging from small increases in calorie intake
for some populations to reductions of up to approximately 85 calories per meal in the short term
for other groups (Refs. 68;71). It could be that the effect of menu labeling takes more time to
manifest itself than these studies measured: consumers may change their behavior more
gradually over a longer period of time than what was studied.31
Alternative Calculation of Benefits (Not Included in Final Estimates)
Recent studies using local and municipal menu labeling regulations as natural
experiments provide some insight into how we expect consumers may respond to the final rule.
However, we do not use these studies to calculate the primary benefits estimates for a few
reasons. First, no study is nationally representative, nor provides enough information to scale the
estimates to the national level. Second, as described above, most studies have a limited
timeframe, calculating consumer responses to menu labeling less than a year after
implementation. Third, the studies do not include information on consumption of foods away
from restaurants and other covered establishments.
The primary benefit estimate has many advantages to the alternative calculations. First, it
provides a direct estimate of the value of information, including consumer’s perceived health
31 Only five studies discussed above examined the effect of menu labeling on consumer behavior for more than a year after local implementation (Refs. 58;59;64;68;69).
85
effects. Second, Abaluck uses food consumption data spanning ten years to calculate his
willingness-to-pay estimates. Thus we are able to evaluate the change in consumption over a
longer period of time than if we based our primary benefit estimate on current literature
regarding menu labeling. The estimate does rely on the assumption that consumers value
information on menus and menu boards the same as the nutrition information on the nutrition
facts panel of packaged foods. While it is a distinct possibility that in the long run consumers
will treat the information the same, the current literature, based on relatively short run
experiments, does not necessarily support this conclusion.
This section provides two alternative calculations of benefits that provide a robustness
check for the primary final estimates. It is important to note that neither alternative calculation
captures potential benefits accrued to children under the age of 18.
Alternative Calculations of Benefits: Derived from Existing Data on Responses to Menu
Labeling (Not Included in Final Estimates)
The method used in the previous section to derive the primary estimates of benefits is
top-down. We started with an estimate of the welfare gains from “additional labeling” and
adjusted it downward for changes in the baseline availability and incremental amount of
information relative to the estimate from Abaluck. An alternative, bottom-up approach is to use
the estimated changes in calories per meal and multiply that by the implicit value of a caloric
reduction. As described in more detail in the literature review, some of the scientific literature
suggests that consumers may respond to calorie labeling by decreasing the average calories
purchased (see Table A1). Associations varied widely across different subgroups, ranging from
small increases in calorie intake per meal for some sub-populations to about 85 calories per meal
for other groups (Refs. 68;71). Given the current economic literature on the effect of menu

86
labeling on observed consumer responses, we estimate, on average, a 1.8 percent reduction
(range of -3.2 to -0.4) in the additional calories consumed of standard menu items due to menu
labeling.32 Mancino and colleagues estimated that for non-overweight individuals, consuming a
meal not prepared at home added an extra 134 calories when compared to consuming a meal
prepared at home (Ref. 6). They also estimated that four meals are eaten away from home per
week. Given our previous estimate that 73 percent of restaurant visits are to chain restaurant
establishments, three restaurant meals per week are covered by the final rule (4
meals/week*0.73=2.92 meals/week). With about 140 additional calories per restaurant meal, a
1.8 percent reduction yields a decrease of 2.5 calories per meal, or 1 calorie per day (2.5
kcal/meal x 3 meals/week /7 days/week). If we apply Abaluck’s (2011) 0.19 cent willingness-to-
pay per calorie reduction,33 we get an annual willingness-to-pay of about (1 kcal/day x 365 days
x $0.0019) = $0.73 (range of $0.18 to $1.27). Unlike our primary benefit estimate, this
alternative estimate does not capture the potential benefits of the final rule on children (under the
age of 18) due to possible differences in food consumption between adults and children (e.g. the
calorie difference between a meal served to a child at home versus at a restaurant). We remove
children from the main analysis when comparing the primary estimate to both illustrative
examples in the summary section below. Thus the total present values are not directly
comparable to the primary estimate. The estimated $0.73 falls below the confidence interval
estimated for adults using the top-down adjustment model (see Table 11).
32 All studies that provided enough information to calculate a percent change in calories purchased due to menu labeling were used to estimate the 1.8 percent reduction. If we limited the estimate to studies with interventions occurring at least one year after labeling regulations were enforced, the average calorie reduction due to menu labeling is 2%. If we limit the estimate to studies with less than three shortcomings (see Table A1 for details), the average calorie reduction due to menu labeling is only 1%. 33 Using 1990 dollars, Abaluck (2011) estimates that when a consumer learns that a food has one more calorie than she previously thought, she is willing to pay 0.1214 cent to avoid that calorie. We use a GDP deflator of 0.637 to adjust this estimate to 2011 dollars (0.1214/0.637=0.19).
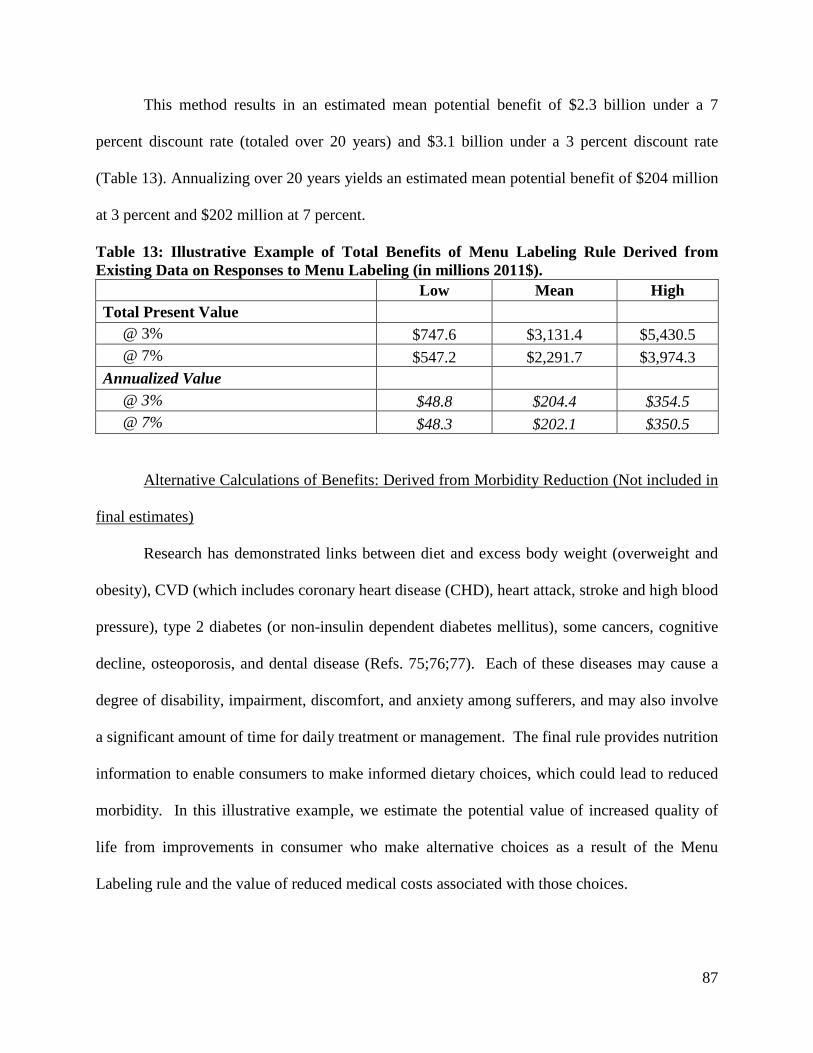
87
This method results in an estimated mean potential benefit of $2.3 billion under a 7
percent discount rate (totaled over 20 years) and $3.1 billion under a 3 percent discount rate
(Table 13). Annualizing over 20 years yields an estimated mean potential benefit of $204 million
at 3 percent and $202 million at 7 percent.
Table 13: Illustrative Example of Total Benefits of Menu Labeling Rule Derived from Existing Data on Responses to Menu Labeling (in millions 2011$). Low Mean High Total Present Value @ 3% $747.6 $3,131.4 $5,430.5 @ 7% $547.2 $2,291.7 $3,974.3 Annualized Value @ 3% $48.8 $204.4 $354.5 @ 7% $48.3 $202.1 $350.5
Alternative Calculations of Benefits: Derived from Morbidity Reduction (Not included in
final estimates)
Research has demonstrated links between diet and excess body weight (overweight and
obesity), CVD (which includes coronary heart disease (CHD), heart attack, stroke and high blood
pressure), type 2 diabetes (or non-insulin dependent diabetes mellitus), some cancers, cognitive
decline, osteoporosis, and dental disease (Refs. 75;76;77). Each of these diseases may cause a
degree of disability, impairment, discomfort, and anxiety among sufferers, and may also involve
a significant amount of time for daily treatment or management. The final rule provides nutrition
information to enable consumers to make informed dietary choices, which could lead to reduced
morbidity. In this illustrative example, we estimate the potential value of increased quality of
life from improvements in consumer who make alternative choices as a result of the Menu
Labeling rule and the value of reduced medical costs associated with those choices.
88
As mentioned above, Mancino and colleagues found that meals consumed away from
home typically have more calories than those prepared at home. Furthermore, the authors found
that this differential is even greater for obese individuals, who consume an additional 239
calories per meal away from home (compared to 134 calories for non-overweight individuals).
This translates to an average of roughly 100 extra calories per day consumed at covered
establishments by obese individuals (240 kcal/meal x 3 meals/week / 7 days/week).
Applying the same 1.8 percent reduction in the additional calories consumed in standard
menu items as described above, we base our benchmark on an average decrease in calorie intake
of 4 calories per meal (240 calories per meal x 1.8%) by obese adults. Equivalently, we can
characterize this benchmark as a reduction of 2 calories per day (240 calories per meal x 3 meals
per week /7 days/week x 1.8%), or about 14 calories per week (2 calories/day x 7 days/week) by
obese adults.
In order to convert this benchmark calorie reduction to U.S. population weight and BMI
reductions, we use a steady state model developed by Hall and Jordan for the calculation of
individual weight loss using daily calorie reduction, height, initial weight, age, gender, fat mass,
and physical activity level (Ref. 78). Using the weight reduction calculator and NHANES data,
we estimate that a 2 calorie per day or 14 calorie per week reduction translates to a mean steady
state weight loss of 0.1 kilograms for U.S. adults over the age of 18. This is not an annual
decrease, but the total weight loss that would result from a permanent reduction of calorie intake.
This decrease in weight translates to a mean decline in BMI of 0.1 BMI per obese adult.34
We contextualize this drop against the decline in BMI needed to bring the average obese
adult BMI down to the average non-obese BMI. According to NHANES 2011-2012, the mean
34 This estimated reduction in BMI is more conservative than other literature suggests. A recent preliminary long-term study suggests that menu labeling in New York State has led to a reduction in BMI ranging between 0.236 and 0.895 BMI, or 0.442 points at the sample median BMI (Ref. 59).
89
non-obese BMI is 24.7 and the mean obese BMI is 36.0, for a difference of 11.3 BMI units. We
then characterize the 0.1 drop in BMI as a 1.0% percent drop in obesity as measured by excess
BMI relative to the non-obese (= 0.1 point reduction in BMI / 11.3 point difference in BMI
between non-obese and obese individuals).
Since the potential benefit from the final rule stems from the effect that decreasing the
consumption of calories from standard menu items has on mitigating the obesity rate in the U.S.
population, we estimate benefits as the direct medical costs and total burden of lost quality
adjusted life years (QALYs) that could be averted from an improved diet among the U.S. adult
population minus the value of lost utility from reduced or altered consumption.
QALYs can be used to measure the loss of well-being that an individual suffers due to a
disease or condition and are measured on a range from 0 to 1 where 0 is equivalent to death, 1 is
equivalent to perfect health for 1 year, and intermediate values are higher or lower depending on
how much a person is suffering over a year. A number of methods have been constructed to
measure QALYs. In this illustrative example we rely on two separate estimates of the obesity-
related QALYs.
The first, by Jia and Lubetkin, uses a statistical method developed by Cutler and
Richardson (Refs. 79;80;81). Their method uses regression analysis to estimate the effect of
particular conditions on overall health status. The QALYs used in this analysis do not include
the value of health expenditures caused by obesity; we estimate health expenditures separately.
The study finds that the QALYs lost by the U.S. adult population due to obesity-related illness
and lost quality adjusted life expectancy are 0.0410 per adult, or 0.115 per obese adult. The
second estimate measures the loss of QALYs among obese adults using QALY weights reported
in the literature. Jia and Lubetkin (2010) reports an average weight of 0.867, which represent the
90
QALY weight of the average representative individual (Ref. 80). Sullivan & Ghushchyan report
an average QALY for obese individuals to be 0.744 (Ref. 82). Thus, we compute the difference
(QALY loss due to obesity) to be 0.123. By averaging the results of the two methods, we arrive
at a final QALY loss estimate of 0.119 [(0.115 + 0.123)/2].
In order to identify the QALYs gained as a result of this final rule, we multiply the
QALY loss of obesity (0.119) by the estimated percent reduction in obesity estimated earlier in
this section (1.0%) and the estimated average percentage of adults who would use menu labeling
(53%), resulting in 0.003 QALYs gained per obese individual.
We estimate the total burden from lost QALYs associated with obesity, by scaling a
range of estimates for the value of a statistical life year (VSLY) by our final QALY gain
estimate. For this analysis, we rely upon the FDA standard measures of VSLY (as of 2012), or
$109,813, $219,262, and $329,439. Scaling the VSLY values accordingly yields the baseline
monetized QALYs gained per obese adult, or $61 ($109,813 x 0.001), $122 ($219,262 x 0.001),
and $183 ($329,439 x 0.001). Multiplying these baseline, per-obese-adult estimates by the total
number of obese individuals, 85.7 million individuals (Ref. 83), yields the total value of QALYs
gained from this final rule, or $5.2 billion ($61 x 85.7 million) (low), $10.5 billion ($122 x 85.7
million) (mid), and $15.7 billion ($183 x 85.7 million) (high).
Medical Costs: Using data on how consumers’ dietary patterns could change due to the
final regulations, we present an illustrative example of the potential averted medical costs based
on the following framework: We attempt to identify only those medical costs that can be directly
attributed to obesity by only counting a percentage of total medical costs. We identify the portion
of those costs that could be avoided by the final rule.
91
According to Finkelstein et al. (2011), medical expenses attributed to the U.S. adult obese
population (BMI greater or equal to 30) as of 2008 amount to $147.0 billion (Ref. 64). Adjusted
for inflation, this estimate becomes $156.0 billion. However, these medical costs should not be
taken as an estimate of the total burden of obesity. In our adjustment, we assume that the
mortality rate of diseases potentially associated with obesity represents the percentage of medical
costs associated with obesity (rather than other medical conditions that obese people happen to
experience). Since the literature supports a range of estimates for the rate of mortality potentially
associated with obesity, we use a range of 5.0 percent to 18.2 percent, with a mid-range estimate
of 11.6 percent (Refs. 84;85)35. Thus, to estimate the net lifetime medical costs attributed to
obesity we multiply the total medical cost with the obesity mortality rate, which results in a base
range of $7.9 billion ($156.0 billion x 0.050) to $28.4 billion ($156.0 billion x 0.182), with a
mid-range estimate of $18.1 billion ($156.0 billion x 0.116).
In order to account only for the predicted effect on reduced incidence of obesity resulting
from the final rule, we multiply the base range of medical costs by 1 percent to account for the
rule’s estimated percentage reduction in obesity and by 53% to account for the estimated
percentage of adults that would use menu labeling. Therefore, attributing this effectiveness rate
to the base range of medical costs yields a final range of $36.8 million ($7.9 billion x 0.01 x
0.53) to $132.9 million ($28.4 billion x 0.01 x 0.53), with a mid-range estimate of $84.9 million
($18.1 billion x 0.01 x 0.53).
Total Benefits: Total estimated value of gross health benefits according to this illustrative
example are presented in Table 14. Total benefits from QALYs gained and avoided medical
costs range from $5.300 billion to $15.8 billion, with a mid-range estimate of $10.5 billion.
35 These estimates are derived by dividing the estimated deaths potentially associated with obesity (e.g., heart disease) by the total deaths in the US. For lack of a more precise measure, we use these as a proxy for the deaths directly attributable to obesity.
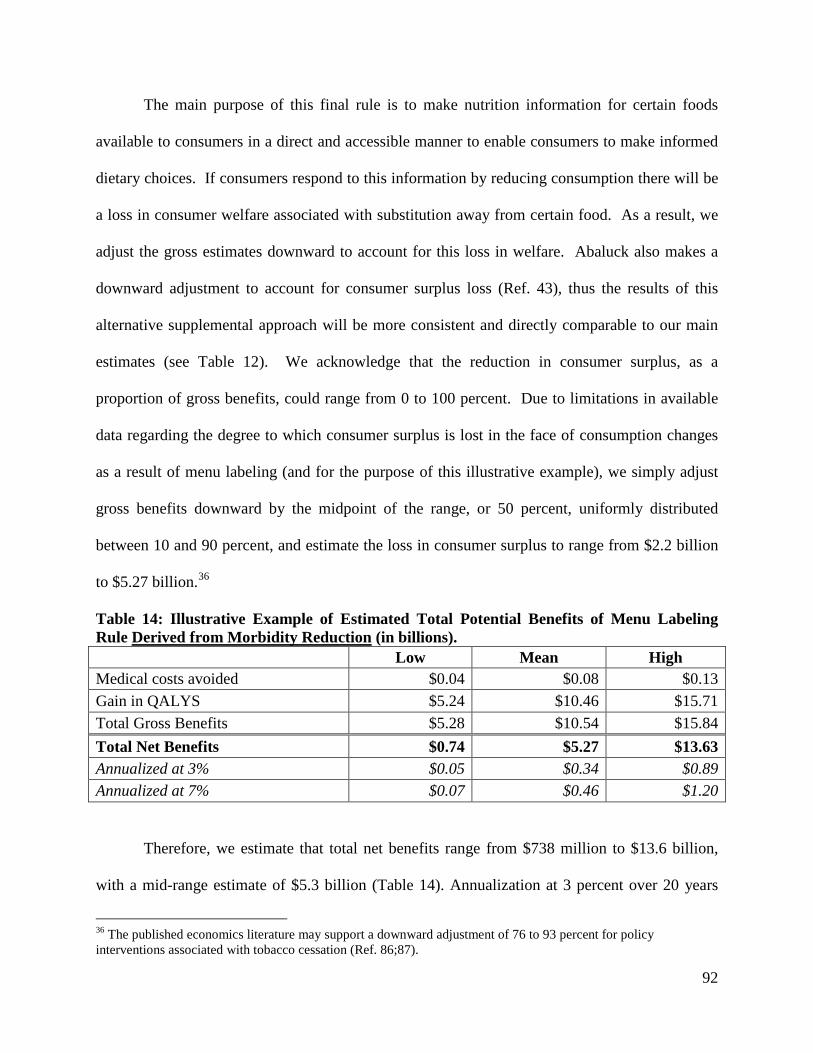
92
The main purpose of this final rule is to make nutrition information for certain foods
available to consumers in a direct and accessible manner to enable consumers to make informed
dietary choices. If consumers respond to this information by reducing consumption there will be
a loss in consumer welfare associated with substitution away from certain food. As a result, we
adjust the gross estimates downward to account for this loss in welfare. Abaluck also makes a
downward adjustment to account for consumer surplus loss (Ref. 43), thus the results of this
alternative supplemental approach will be more consistent and directly comparable to our main
estimates (see Table 12). We acknowledge that the reduction in consumer surplus, as a
proportion of gross benefits, could range from 0 to 100 percent. Due to limitations in available
data regarding the degree to which consumer surplus is lost in the face of consumption changes
as a result of menu labeling (and for the purpose of this illustrative example), we simply adjust
gross benefits downward by the midpoint of the range, or 50 percent, uniformly distributed
between 10 and 90 percent, and estimate the loss in consumer surplus to range from $2.2 billion
to $5.27 billion.36
Table 14: Illustrative Example of Estimated Total Potential Benefits of Menu Labeling Rule Derived from Morbidity Reduction (in billions). Low Mean High Medical costs avoided $0.04 $0.08 $0.13 Gain in QALYS $5.24 $10.46 $15.71 Total Gross Benefits $5.28 $10.54 $15.84 Total Net Benefits $0.74 $5.27 $13.63 Annualized at 3% $0.05 $0.34 $0.89 Annualized at 7% $0.07 $0.46 $1.20
Therefore, we estimate that total net benefits range from $738 million to $13.6 billion,
with a mid-range estimate of $5.3 billion (Table 14). Annualization at 3 percent over 20 years
36 The published economics literature may support a downward adjustment of 76 to 93 percent for policy interventions associated with tobacco cessation (Ref. 86;87).
93
yields a range of $48 million to $890 million. Annualization at 7 percent over 20 years yields a
range of $65 million to $1.2 billion.
It is important to note that this example has been restricted to adults only (age greater
than 18) due to potential differences between QALYs lost to obesity for adults versus children.
In addition, normal weight, overweight but non-obese, and underweight individuals have been
excluded because the literature indicates that body weight that exceeds the recommended weight
range poses health risks that are directly attributable to the higher medical expenses (Ref. 82).
Note that the benefit estimation takes the current prevalence of obesity as fixed, particularly in
terms of population size and the demographic distribution of that population. Furthermore, we
interpret these estimates to represent the equivalent of a one-time reduction in weight in response
to the final rule. We acknowledge that the true steady state effect of the rule (in terms of reduced
incidence of obesity) may only be arrived at gradually over the course of several years.
However, we lack sufficient data to develop a more dynamic prediction.
Although this analysis does not include an estimate of the benefits or costs of obesity in
children, reduction in childhood obesity has been linked with educational, social and career
outcomes (Refs. 47;48;88;89). It is reasonable to expect that the impact on their adult caregivers
of this final rule in terms of the potential reduction in calorie intake due to menu labeling, and
any changes toward more balanced nutrient intake, will benefit children and adolescents.
Because the estimated reductions in medical expenses discussed in this analysis are only those
expenses currently incurred by obese individuals, the benefit estimate of this final rule may be an
underestimate.
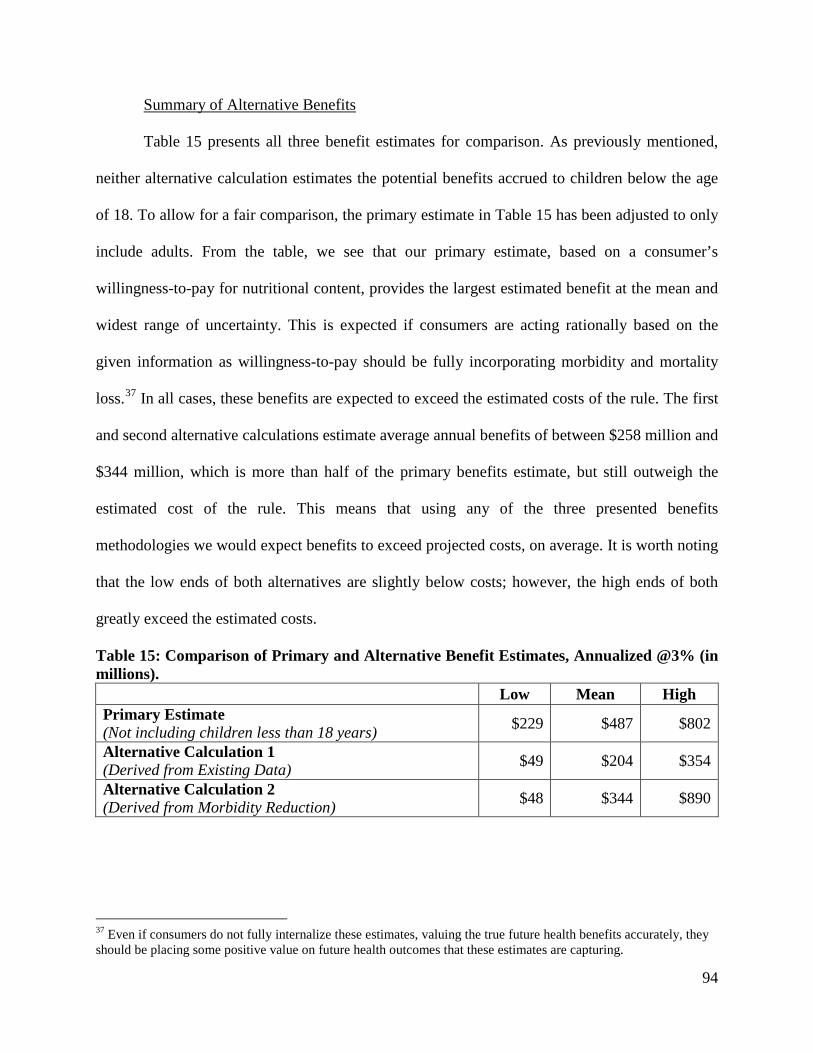
94
Summary of Alternative Benefits
Table 15 presents all three benefit estimates for comparison. As previously mentioned,
neither alternative calculation estimates the potential benefits accrued to children below the age
of 18. To allow for a fair comparison, the primary estimate in Table 15 has been adjusted to only
include adults. From the table, we see that our primary estimate, based on a consumer’s
willingness-to-pay for nutritional content, provides the largest estimated benefit at the mean and
widest range of uncertainty. This is expected if consumers are acting rationally based on the
given information as willingness-to-pay should be fully incorporating morbidity and mortality
loss.37 In all cases, these benefits are expected to exceed the estimated costs of the rule. The first
and second alternative calculations estimate average annual benefits of between $258 million and
$344 million, which is more than half of the primary benefits estimate, but still outweigh the
estimated cost of the rule. This means that using any of the three presented benefits
methodologies we would expect benefits to exceed projected costs, on average. It is worth noting
that the low ends of both alternatives are slightly below costs; however, the high ends of both
greatly exceed the estimated costs.
Table 15: Comparison of Primary and Alternative Benefit Estimates, Annualized @3% (in millions). Low Mean High Primary Estimate (Not including children less than 18 years) $229 $487 $802
Alternative Calculation 1 (Derived from Existing Data) $49 $204 $354
Alternative Calculation 2 (Derived from Morbidity Reduction) $48 $344 $890
37 Even if consumers do not fully internalize these estimates, valuing the true future health benefits accurately, they should be placing some positive value on future health outcomes that these estimates are capturing.
95
Other Benefits (Not Quantified)
Reformulation: If the final rule increases consumer interest in lower calorie options and
the transparency about the caloric content of standard menu items, restaurant chains may have an
incentive to reformulate menu items to reduce calorie content or decrease portion sizes. Based
primarily on evidence in the packaged food industry as a result of NLEA (Ref. 90), researchers
have noted that calorie labeling may motivate restaurants to offer healthier choices (Refs.
91;92;93). Anecdotal evidence (e.g., from trade magazines, reports, advertisements) suggests that
calorie labeling may prompt restaurants to change the nutritional profile of menu items (Refs.
94;95;96).
In addition, there is already a trend in quick-service and sit-down restaurants to provide
healthier options as a means of attracting customers. An assessment of menu items offered by
eight major fast-food chains between 2005-2006 and 2009-2010 found the median number of
calories decreased in entrees and sides, but increased in desserts (Ref. 97). A similar study,
between 2005-2006 and 2009-2010, also finds mixed results, indicating an improvement in
overall nutritional content at some establishments and a decline in others (Ref. 98). A smaller
study of nine major fast-food chains between 2005 and 2011 suggested little changes in the
average number of calories in adult entrees over time (Ref. 99). Nevertheless, the proportion of
“healthier” (based on the study’s criteria) entrees rose from 13% to 20%.
More recent studies, published by the Robert Wood Johnson Foundation, point to
substantial incentives for food companies to reduce the calories contained in either their
packaged or prepared food offerings. A February 2013 report indicates that lower calorie foods
are the highest growth items in 21 major chain restaurants, both in terms of sales and total
servings (Ref. 100). An additional report finds that food companies sold 6.4 trillion fewer

96
calories in 2012 in the U.S. than in 2007, exceeding a pledge made by the companies by over
400% (Ref. 101). These changes in calories sold have not come from a reduction in the
company’s revenues; rather, the changed has stemmed primarily from product reformulation and
serving size changes.
If the final rule is associated with reformulation and consumers reduce their intake of
calories from standard menu items, then the overall health of consumers could increase.
However, reformulation could also lead to a long term steady state of consumer calorie intake
that is not currently reflected in contemporary menu items.).38 We lack the data necessary to
predict the extent of reformulation or the consumer response to any change in menu items and
quantify the benefits of reformulation in response to the final rule. Thus, to the extent that we
have not quantified the value of the expected changes in health from the final rule through
reformulation, the quantified benefits may be somewhat understated.
Uncertainty of Costs and Potential Benefits
Our approach to estimating potential benefits is contingent upon a number of
assumptions, both about the extent to which menu labeling will lead to changes and the
application of the willingness-to-pay model proposed by Abaluck. This same model has been
applied in the RIA of the proposed Food Labeling: Revision of the Nutrition and Supplement
38 There may be some reformulation that occurs simultaneously with the implementation of the final rule. However, some of the reformulation may occur sometime after implementation. So consumers may revisit their initial decisions based on the calorie and other nutrition information when later presented with new menu items and reformulated menu items. It is even possible that a consumer who makes a choice to change from a preferred high-calorie menu item to one that is much lower in calories may later choose a reformulated menu item that is relatively higher in calories than their initial choice after menu labeling occurs (but still lower than what they chose before the menu labeling was implemented). Thus reformulation of the menu item would potentially serve to decrease some of the initial benefits of the regulation for this particular consumer. While this effect is certainly possible and will occur in some instances, labeling menus with calorie information is most likely to lead to reformulation to reduce the overall average calorie content of menu items, either through a reduction in calories of existing menu items or through the introduction of new low-calorie options. This reformulation is most likely to reduce calorie consumption in aggregate, in addition to the decrease that happens due to static choices made by consumers simply using the new information on the menus. The labeling of trans fat is an example of a similar situation, in which reformulation led to a greater decline in average trans fat intake than would have occurred through consumer substitutions alone.
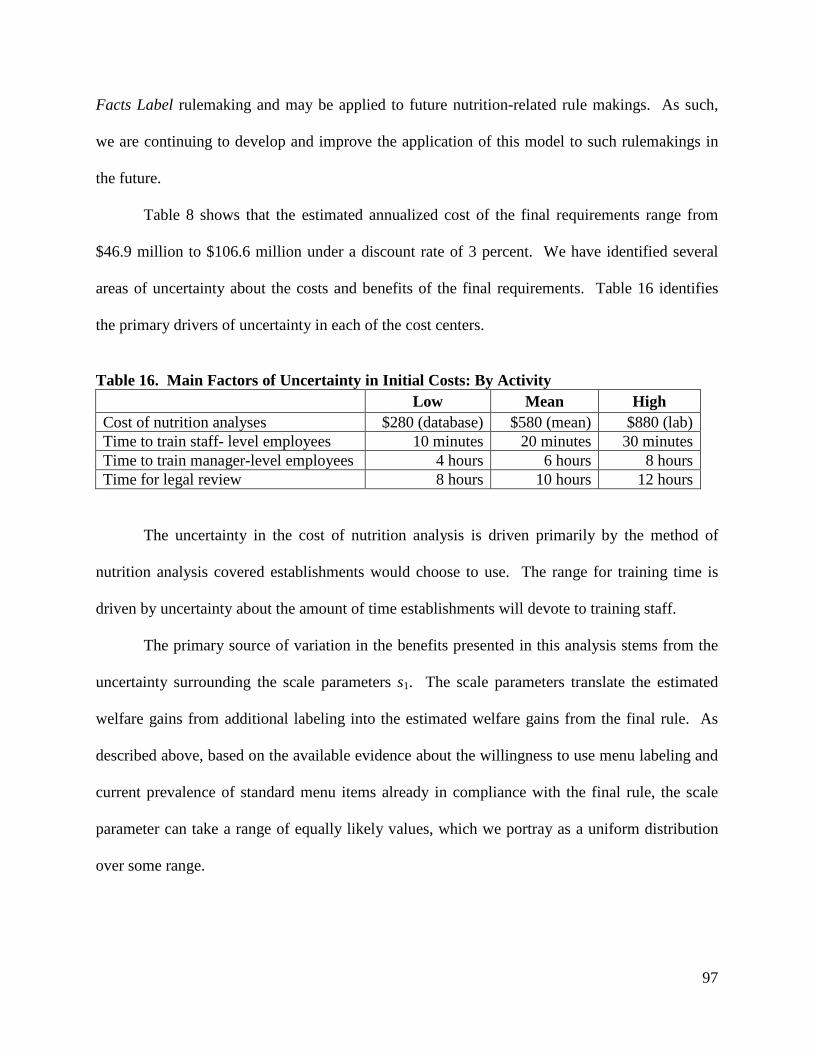
97
Facts Label rulemaking and may be applied to future nutrition-related rule makings. As such,
we are continuing to develop and improve the application of this model to such rulemakings in
the future.
Table 8 shows that the estimated annualized cost of the final requirements range from
$46.9 million to $106.6 million under a discount rate of 3 percent. We have identified several
areas of uncertainty about the costs and benefits of the final requirements. Table 16 identifies
the primary drivers of uncertainty in each of the cost centers.
Table 16. Main Factors of Uncertainty in Initial Costs: By Activity Low Mean High Cost of nutrition analyses $280 (database) $580 (mean) $880 (lab) Time to train staff- level employees 10 minutes 20 minutes 30 minutes Time to train manager-level employees 4 hours 6 hours 8 hours Time for legal review 8 hours 10 hours 12 hours
The uncertainty in the cost of nutrition analysis is driven primarily by the method of
nutrition analysis covered establishments would choose to use. The range for training time is
driven by uncertainty about the amount of time establishments will devote to training staff.
The primary source of variation in the benefits presented in this analysis stems from the
uncertainty surrounding the scale parameters s1. The scale parameters translate the estimated
welfare gains from additional labeling into the estimated welfare gains from the final rule. As
described above, based on the available evidence about the willingness to use menu labeling and
current prevalence of standard menu items already in compliance with the final rule, the scale
parameter can take a range of equally likely values, which we portray as a uniform distribution
over some range.
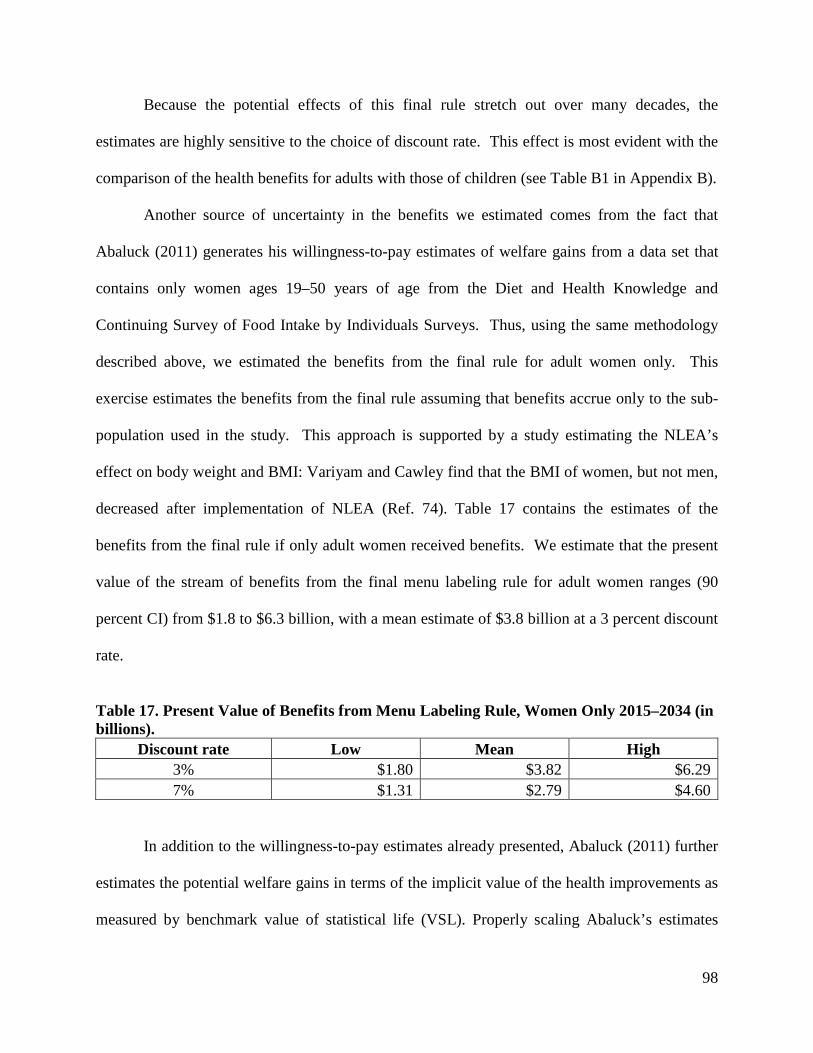
98
Because the potential effects of this final rule stretch out over many decades, the
estimates are highly sensitive to the choice of discount rate. This effect is most evident with the
comparison of the health benefits for adults with those of children (see Table B1 in Appendix B).
Another source of uncertainty in the benefits we estimated comes from the fact that
Abaluck (2011) generates his willingness-to-pay estimates of welfare gains from a data set that
contains only women ages 19–50 years of age from the Diet and Health Knowledge and
Continuing Survey of Food Intake by Individuals Surveys. Thus, using the same methodology
described above, we estimated the benefits from the final rule for adult women only. This
exercise estimates the benefits from the final rule assuming that benefits accrue only to the sub-
population used in the study. This approach is supported by a study estimating the NLEA’s
effect on body weight and BMI: Variyam and Cawley find that the BMI of women, but not men,
decreased after implementation of NLEA (Ref. 74). Table 17 contains the estimates of the
benefits from the final rule if only adult women received benefits. We estimate that the present
value of the stream of benefits from the final menu labeling rule for adult women ranges (90
percent CI) from $1.8 to $6.3 billion, with a mean estimate of $3.8 billion at a 3 percent discount
rate.
Table 17. Present Value of Benefits from Menu Labeling Rule, Women Only 2015–2034 (in billions).
Discount rate Low Mean High 3% $1.80 $3.82 $6.29 7% $1.31 $2.79 $4.60
In addition to the willingness-to-pay estimates already presented, Abaluck (2011) further
estimates the potential welfare gains in terms of the implicit value of the health improvements as
measured by benchmark value of statistical life (VSL). Properly scaling Abaluck’s estimates
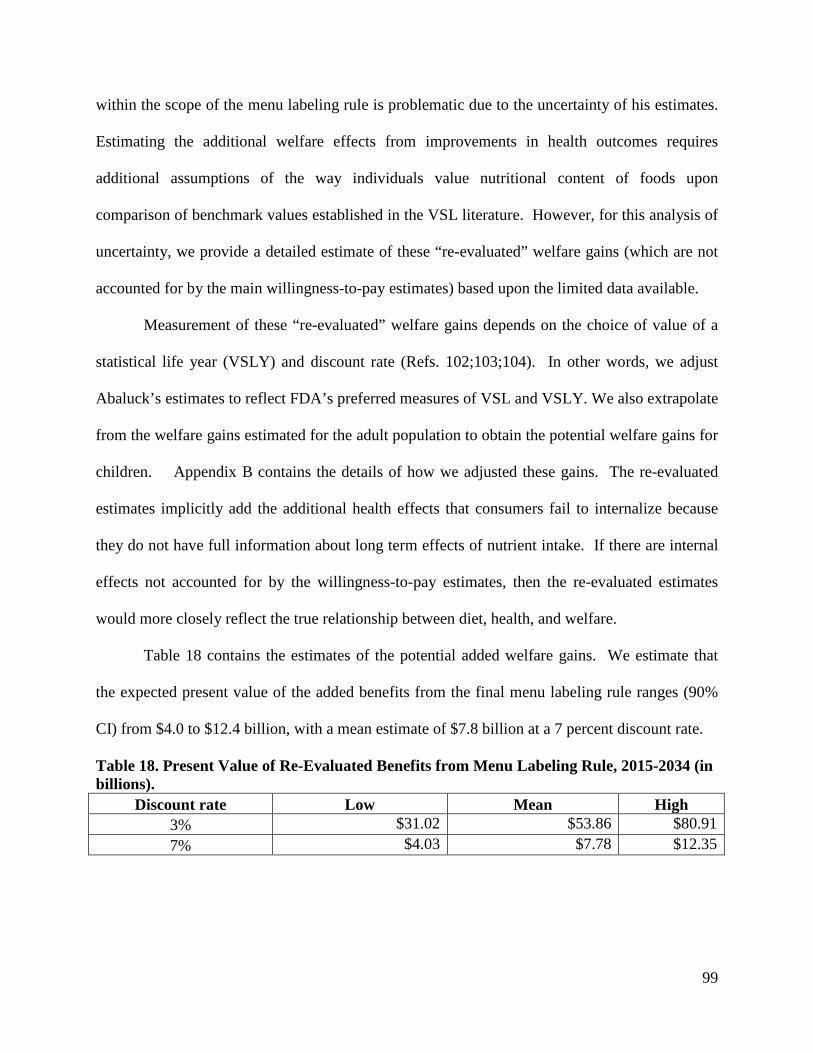
99
within the scope of the menu labeling rule is problematic due to the uncertainty of his estimates.
Estimating the additional welfare effects from improvements in health outcomes requires
additional assumptions of the way individuals value nutritional content of foods upon
comparison of benchmark values established in the VSL literature. However, for this analysis of
uncertainty, we provide a detailed estimate of these “re-evaluated” welfare gains (which are not
accounted for by the main willingness-to-pay estimates) based upon the limited data available.
Measurement of these “re-evaluated” welfare gains depends on the choice of value of a
statistical life year (VSLY) and discount rate (Refs. 102;103;104). In other words, we adjust
Abaluck’s estimates to reflect FDA’s preferred measures of VSL and VSLY. We also extrapolate
from the welfare gains estimated for the adult population to obtain the potential welfare gains for
children. Appendix B contains the details of how we adjusted these gains. The re-evaluated
estimates implicitly add the additional health effects that consumers fail to internalize because
they do not have full information about long term effects of nutrient intake. If there are internal
effects not accounted for by the willingness-to-pay estimates, then the re-evaluated estimates
would more closely reflect the true relationship between diet, health, and welfare.
Table 18 contains the estimates of the potential added welfare gains. We estimate that
the expected present value of the added benefits from the final menu labeling rule ranges (90%
CI) from $4.0 to $12.4 billion, with a mean estimate of $7.8 billion at a 7 percent discount rate.
Table 18. Present Value of Re-Evaluated Benefits from Menu Labeling Rule, 2015-2034 (in billions).
Discount rate Low Mean High 3% $31.02 $53.86 $80.91 7% $4.03 $7.78 $12.35
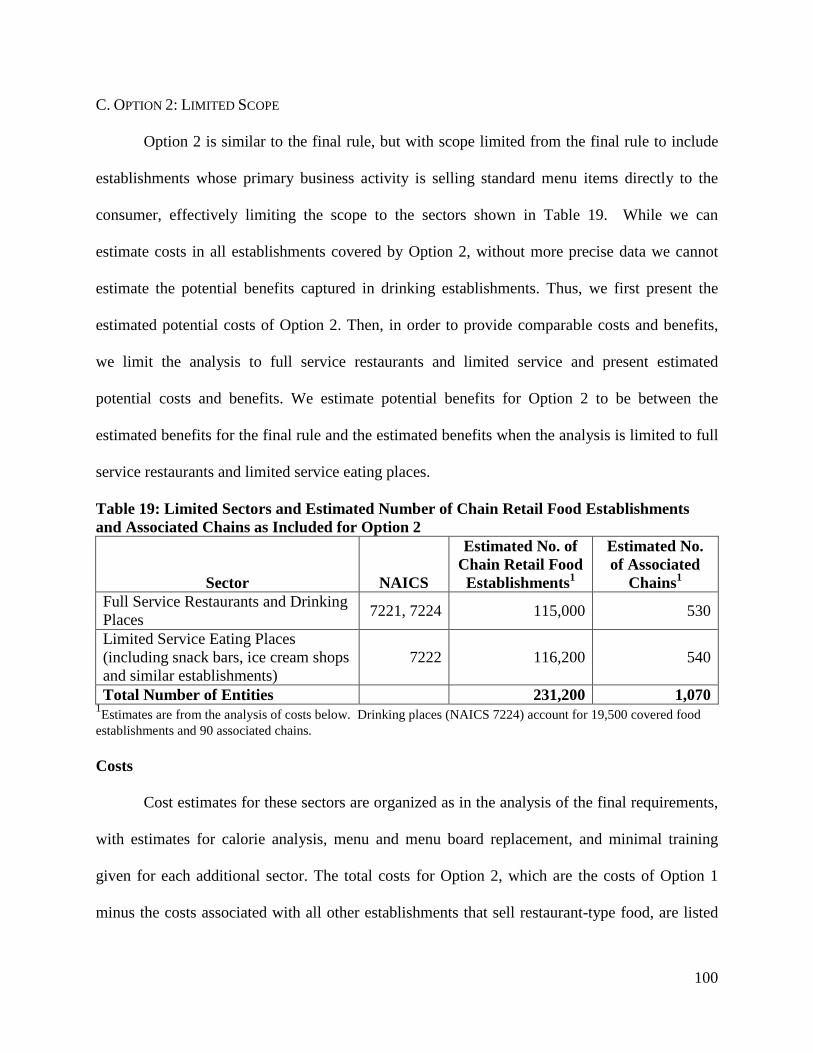
100
C. OPTION 2: LIMITED SCOPE
Option 2 is similar to the final rule, but with scope limited from the final rule to include
establishments whose primary business activity is selling standard menu items directly to the
consumer, effectively limiting the scope to the sectors shown in Table 19. While we can
estimate costs in all establishments covered by Option 2, without more precise data we cannot
estimate the potential benefits captured in drinking establishments. Thus, we first present the
estimated potential costs of Option 2. Then, in order to provide comparable costs and benefits,
we limit the analysis to full service restaurants and limited service and present estimated
potential costs and benefits. We estimate potential benefits for Option 2 to be between the
estimated benefits for the final rule and the estimated benefits when the analysis is limited to full
service restaurants and limited service eating places.
Table 19: Limited Sectors and Estimated Number of Chain Retail Food Establishments and Associated Chains as Included for Option 2
Sector NAICS
Estimated No. of Chain Retail Food Establishments1
Estimated No. of Associated
Chains1 Full Service Restaurants and Drinking Places 7221, 7224 115,000 530
Limited Service Eating Places (including snack bars, ice cream shops and similar establishments)
7222 116,200 540
Total Number of Entities 231,200 1,070 1Estimates are from the analysis of costs below. Drinking places (NAICS 7224) account for 19,500 covered food establishments and 90 associated chains. Costs
Cost estimates for these sectors are organized as in the analysis of the final requirements,
with estimates for calorie analysis, menu and menu board replacement, and minimal training
given for each additional sector. The total costs for Option 2, which are the costs of Option 1
minus the costs associated with all other establishments that sell restaurant-type food, are listed
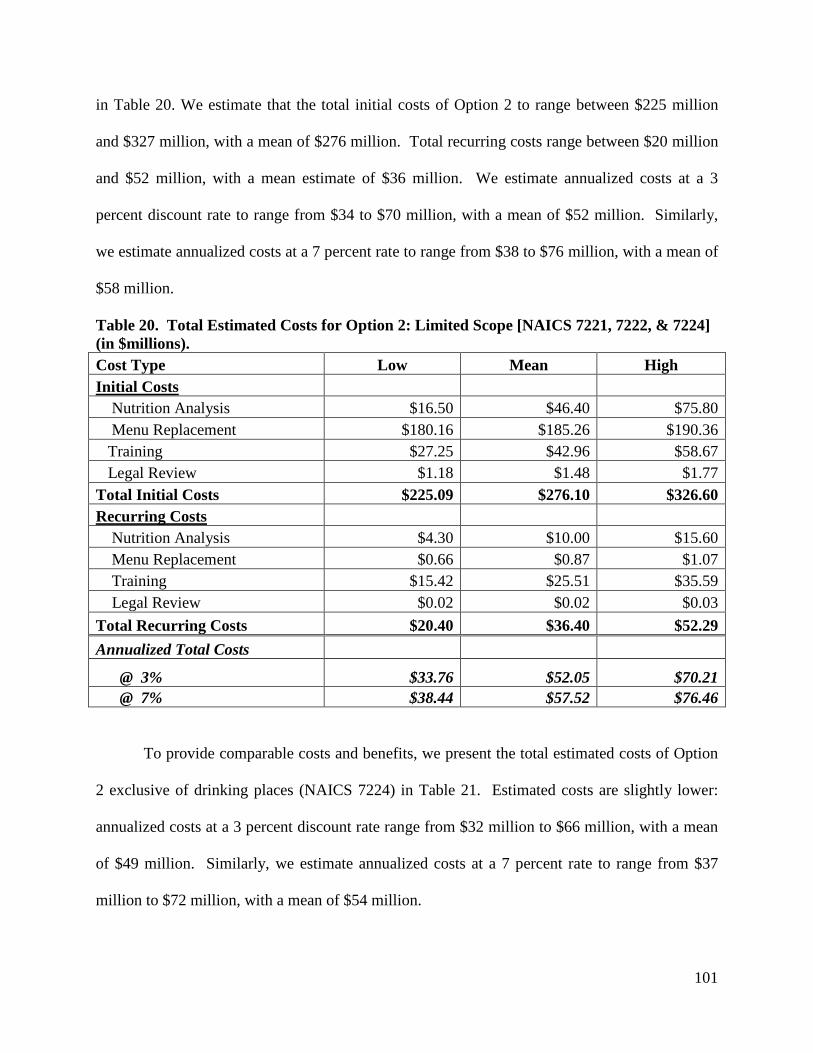
101
in Table 20. We estimate that the total initial costs of Option 2 to range between $225 million
and $327 million, with a mean of $276 million. Total recurring costs range between $20 million
and $52 million, with a mean estimate of $36 million. We estimate annualized costs at a 3
percent discount rate to range from $34 to $70 million, with a mean of $52 million. Similarly,
we estimate annualized costs at a 7 percent rate to range from $38 to $76 million, with a mean of
$58 million.
Table 20. Total Estimated Costs for Option 2: Limited Scope [NAICS 7221, 7222, & 7224] (in $millions). Cost Type Low Mean High Initial Costs Nutrition Analysis $16.50 $46.40 $75.80 Menu Replacement $180.16 $185.26 $190.36 Training $27.25 $42.96 $58.67 Legal Review $1.18 $1.48 $1.77 Total Initial Costs $225.09 $276.10 $326.60 Recurring Costs Nutrition Analysis $4.30 $10.00 $15.60 Menu Replacement $0.66 $0.87 $1.07 Training $15.42 $25.51 $35.59 Legal Review $0.02 $0.02 $0.03 Total Recurring Costs $20.40 $36.40 $52.29 Annualized Total Costs
@ 3% $33.76 $52.05 $70.21 @ 7% $38.44 $57.52 $76.46
To provide comparable costs and benefits, we present the total estimated costs of Option
2 exclusive of drinking places (NAICS 7224) in Table 21. Estimated costs are slightly lower:
annualized costs at a 3 percent discount rate range from $32 million to $66 million, with a mean
of $49 million. Similarly, we estimate annualized costs at a 7 percent rate to range from $37
million to $72 million, with a mean of $54 million.
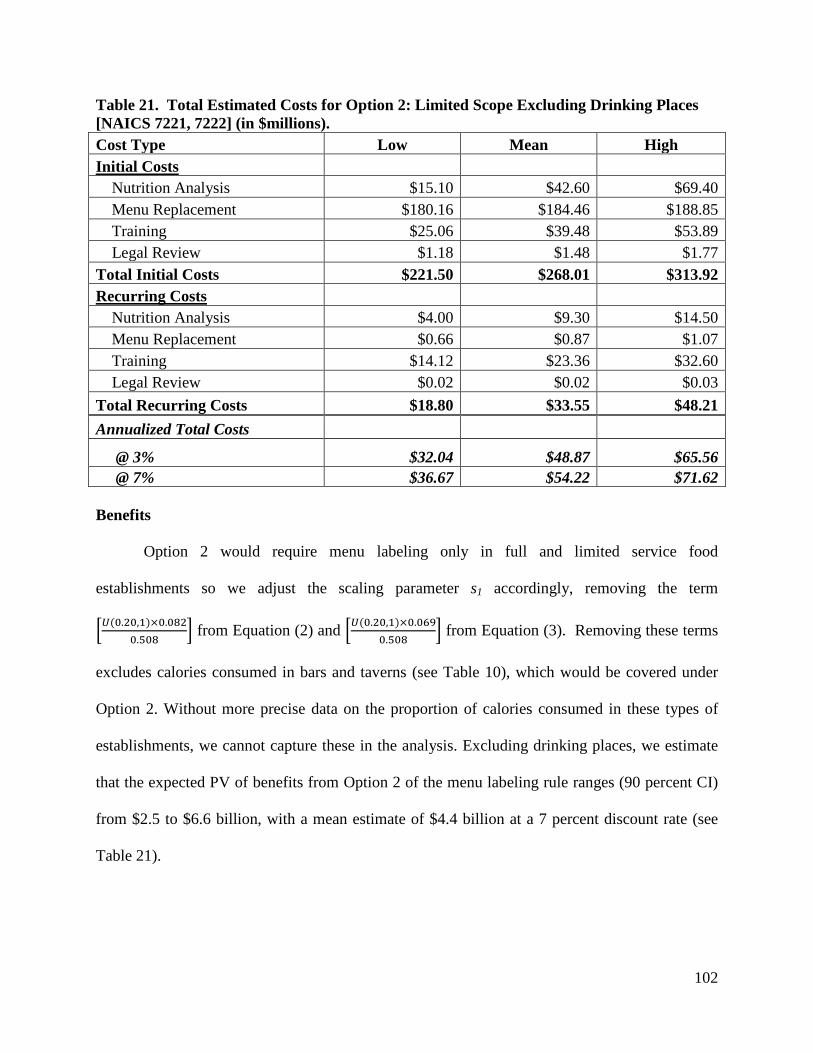
102
Table 21. Total Estimated Costs for Option 2: Limited Scope Excluding Drinking Places [NAICS 7221, 7222] (in $millions). Cost Type Low Mean High Initial Costs Nutrition Analysis $15.10 $42.60 $69.40 Menu Replacement $180.16 $184.46 $188.85 Training $25.06 $39.48 $53.89 Legal Review $1.18 $1.48 $1.77 Total Initial Costs $221.50 $268.01 $313.92 Recurring Costs Nutrition Analysis $4.00 $9.30 $14.50 Menu Replacement $0.66 $0.87 $1.07 Training $14.12 $23.36 $32.60 Legal Review $0.02 $0.02 $0.03 Total Recurring Costs $18.80 $33.55 $48.21 Annualized Total Costs
@ 3% $32.04 $48.87 $65.56 @ 7% $36.67 $54.22 $71.62 Benefits
Option 2 would require menu labeling only in full and limited service food
establishments so we adjust the scaling parameter s1 accordingly, removing the term
�𝑈(0.20,1)×0.0820.508
� from Equation (2) and �𝑈(0.20,1)×0.0690.508
� from Equation (3). Removing these terms
excludes calories consumed in bars and taverns (see Table 10), which would be covered under
Option 2. Without more precise data on the proportion of calories consumed in these types of
establishments, we cannot capture these in the analysis. Excluding drinking places, we estimate
that the expected PV of benefits from Option 2 of the menu labeling rule ranges (90 percent CI)
from $2.5 to $6.6 billion, with a mean estimate of $4.4 billion at a 7 percent discount rate (see
Table 21).
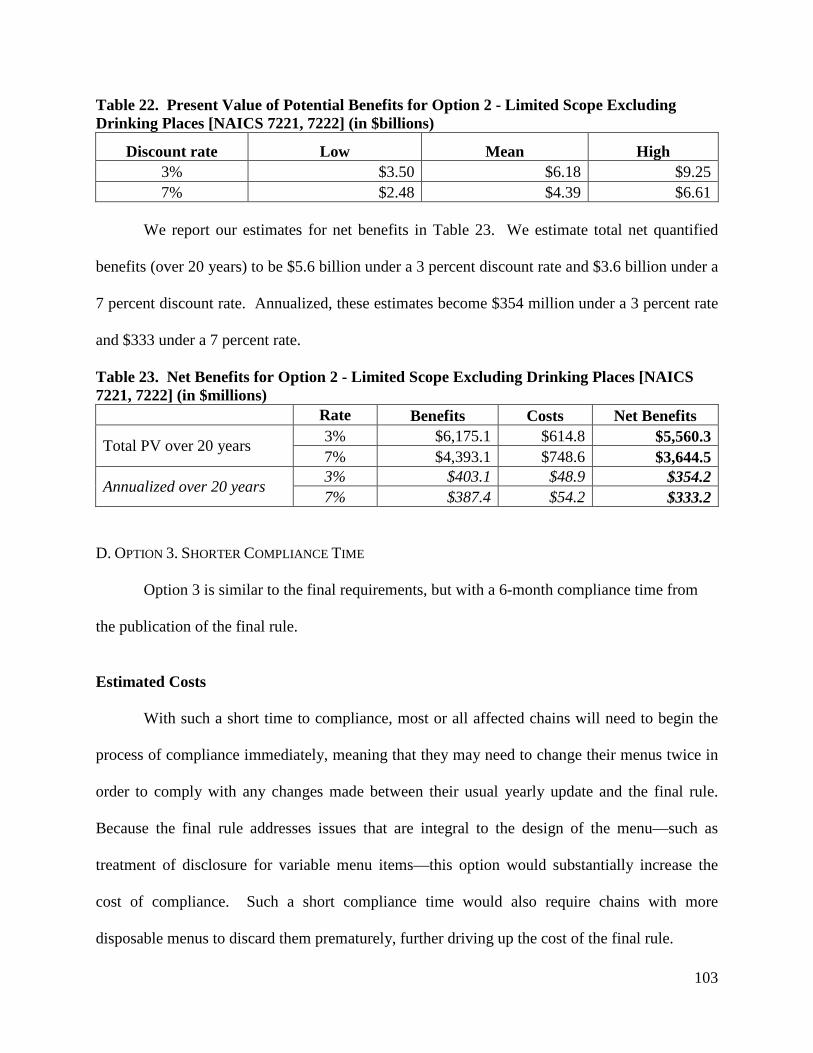
103
Table 22. Present Value of Potential Benefits for Option 2 - Limited Scope Excluding Drinking Places [NAICS 7221, 7222] (in $billions)
Discount rate Low Mean High 3% $3.50 $6.18 $9.25 7% $2.48 $4.39 $6.61
We report our estimates for net benefits in Table 23. We estimate total net quantified
benefits (over 20 years) to be $5.6 billion under a 3 percent discount rate and $3.6 billion under a
7 percent discount rate. Annualized, these estimates become $354 million under a 3 percent rate
and $333 under a 7 percent rate.
Table 23. Net Benefits for Option 2 - Limited Scope Excluding Drinking Places [NAICS 7221, 7222] (in $millions)
Rate Benefits Costs Net Benefits
Total PV over 20 years 3% $6,175.1 $614.8 $5,560.3 7% $4,393.1 $748.6 $3,644.5
Annualized over 20 years 3% $403.1 $48.9 $354.2 7% $387.4 $54.2 $333.2
D. OPTION 3. SHORTER COMPLIANCE TIME
Option 3 is similar to the final requirements, but with a 6-month compliance time from
the publication of the final rule.
Estimated Costs
With such a short time to compliance, most or all affected chains will need to begin the
process of compliance immediately, meaning that they may need to change their menus twice in
order to comply with any changes made between their usual yearly update and the final rule.
Because the final rule addresses issues that are integral to the design of the menu—such as
treatment of disclosure for variable menu items—this option would substantially increase the
cost of compliance. Such a short compliance time would also require chains with more
disposable menus to discard them prematurely, further driving up the cost of the final rule.

104
In addition to the costs estimated for the final requirements, we estimate that the initial
costs of menu and menu board redesign and replacement would increase by approximately 25
percent, based on the ability of covered establishments to design in anticipation of issues subject
to change. Other costs, including recurring costs, would not change. Total and annualized costs
for Option 3 are given in Table 24.
Table 24: Total Costs for Option 3: Six-Month Compliance Time (in $millions)
Cost Type Low Mean High Initial Costs Nutrition Analysis $30.20 $83.30 $135.90 Menu Replacement $312.38 $319.29 $325.91 Training $29.98 $47.66 $65.31 Legal Review $1.64 $2.04 $2.45 Total Initial Costs $374.19 $452.29 $529.58 Recurring Costs Nutrition Analysis $8.03 $18.93 $29.54 Menu Replacement $2.69 $6.99 $11.29 Training $17.67 $29.18 $40.69 Legal Review $0.03 $0.03 $0.04 Total Recurring Costs $28.42 $55.14 $81.56 Annualized Total Costs @ 3% $50.99 $81.08 $110.82 @ 7% $58.90 $90.14 $121.03
Potential Benefits
Under this option, consumers will likely see calorie declarations and other nutrition
information sooner than under the final rule. Decreasing the compliance period by six months
would accelerate the accrual of welfare gains. The increase in benefits of moving the compliance
date forward by six months is equivalent to the difference in the present value of the 20-year
stream of benefits starting one year from the rule’s publication and the present value of the 20-
year stream of benefits starting six months from the rule’s publication. We report the estimated
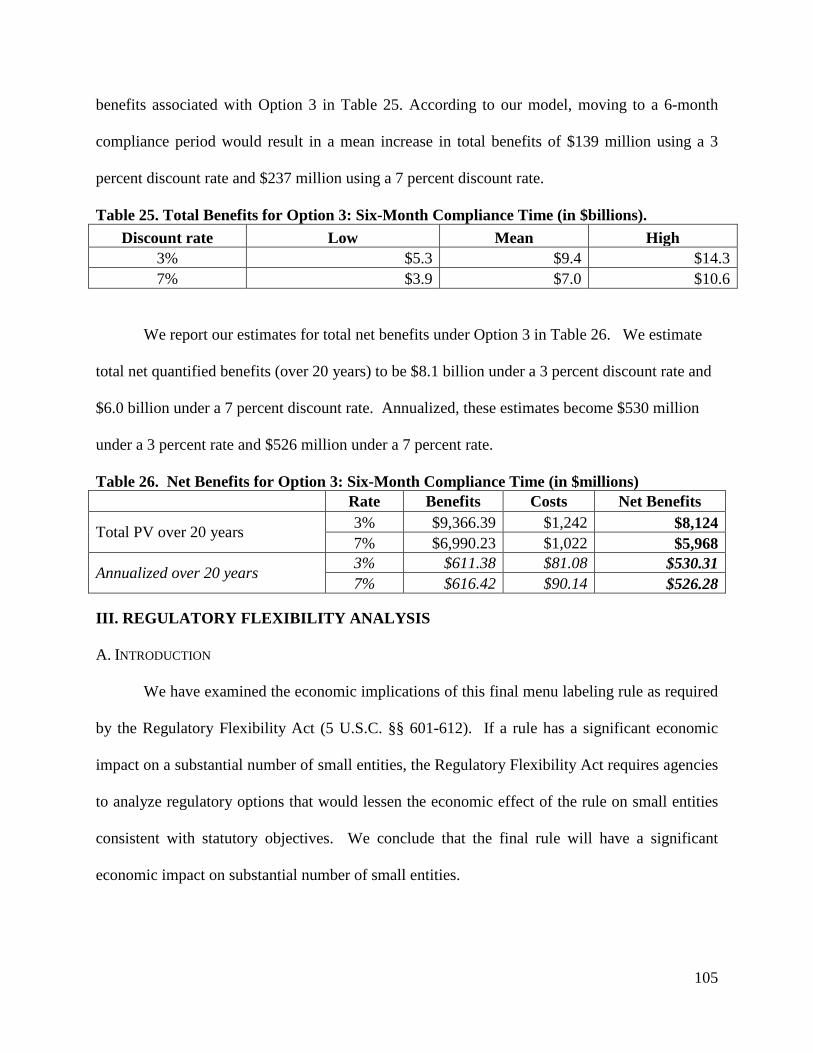
105
benefits associated with Option 3 in Table 25. According to our model, moving to a 6-month
compliance period would result in a mean increase in total benefits of $139 million using a 3
percent discount rate and $237 million using a 7 percent discount rate.
Table 25. Total Benefits for Option 3: Six-Month Compliance Time (in $billions). Discount rate Low Mean High
3% $5.3 $9.4 $14.3 7% $3.9 $7.0 $10.6
We report our estimates for total net benefits under Option 3 in Table 26. We estimate
total net quantified benefits (over 20 years) to be $8.1 billion under a 3 percent discount rate and
$6.0 billion under a 7 percent discount rate. Annualized, these estimates become $530 million
under a 3 percent rate and $526 million under a 7 percent rate.
Table 26. Net Benefits for Option 3: Six-Month Compliance Time (in $millions) Rate Benefits Costs Net Benefits
Total PV over 20 years 3% $9,366.39 $1,242 $8,124 7% $6,990.23 $1,022 $5,968
Annualized over 20 years 3% $611.38 $81.08 $530.31 7% $616.42 $90.14 $526.28
III. REGULATORY FLEXIBILITY ANALYSIS
A. INTRODUCTION
We have examined the economic implications of this final menu labeling rule as required
by the Regulatory Flexibility Act (5 U.S.C. §§ 601-612). If a rule has a significant economic
impact on a substantial number of small entities, the Regulatory Flexibility Act requires agencies
to analyze regulatory options that would lessen the economic effect of the rule on small entities
consistent with statutory objectives. We conclude that the final rule will have a significant
economic impact on substantial number of small entities.
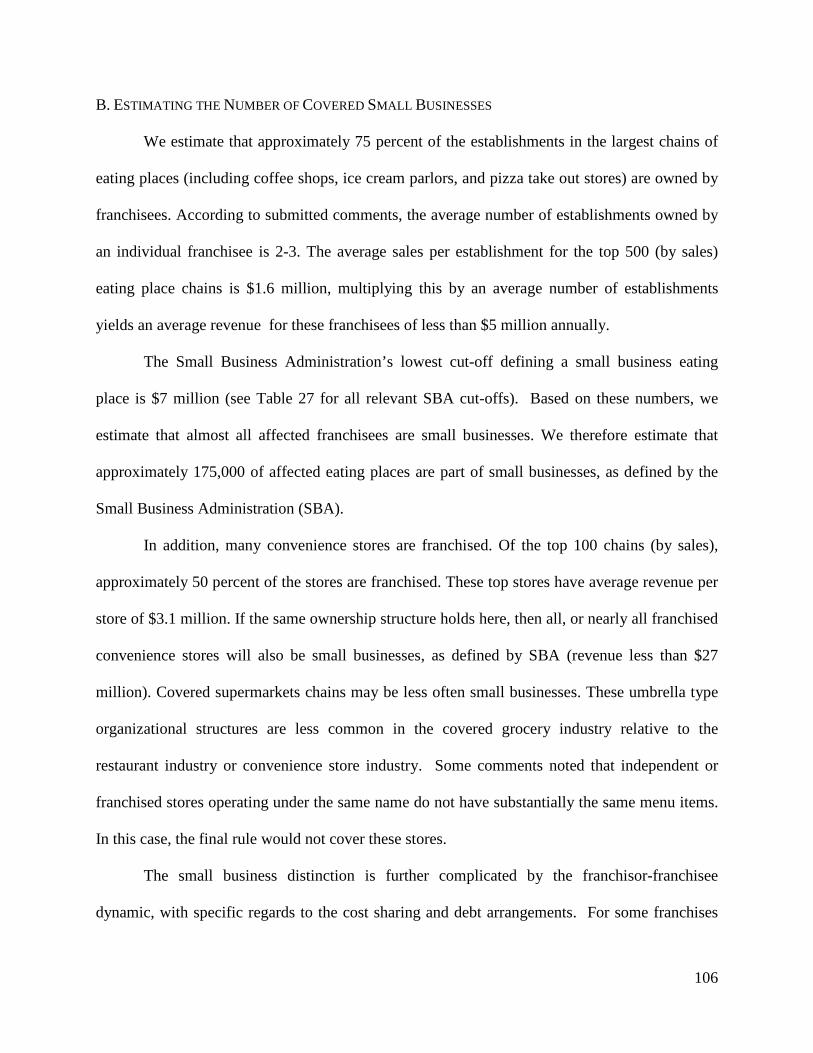
106
B. ESTIMATING THE NUMBER OF COVERED SMALL BUSINESSES
We estimate that approximately 75 percent of the establishments in the largest chains of
eating places (including coffee shops, ice cream parlors, and pizza take out stores) are owned by
franchisees. According to submitted comments, the average number of establishments owned by
an individual franchisee is 2-3. The average sales per establishment for the top 500 (by sales)
eating place chains is $1.6 million, multiplying this by an average number of establishments
yields an average revenue for these franchisees of less than $5 million annually.
The Small Business Administration’s lowest cut-off defining a small business eating
place is $7 million (see Table 27 for all relevant SBA cut-offs). Based on these numbers, we
estimate that almost all affected franchisees are small businesses. We therefore estimate that
approximately 175,000 of affected eating places are part of small businesses, as defined by the
Small Business Administration (SBA).
In addition, many convenience stores are franchised. Of the top 100 chains (by sales),
approximately 50 percent of the stores are franchised. These top stores have average revenue per
store of $3.1 million. If the same ownership structure holds here, then all, or nearly all franchised
convenience stores will also be small businesses, as defined by SBA (revenue less than $27
million). Covered supermarkets chains may be less often small businesses. These umbrella type
organizational structures are less common in the covered grocery industry relative to the
restaurant industry or convenience store industry. Some comments noted that independent or
franchised stores operating under the same name do not have substantially the same menu items.
In this case, the final rule would not cover these stores.
The small business distinction is further complicated by the franchisor-franchisee
dynamic, with specific regards to the cost sharing and debt arrangements. For some franchises
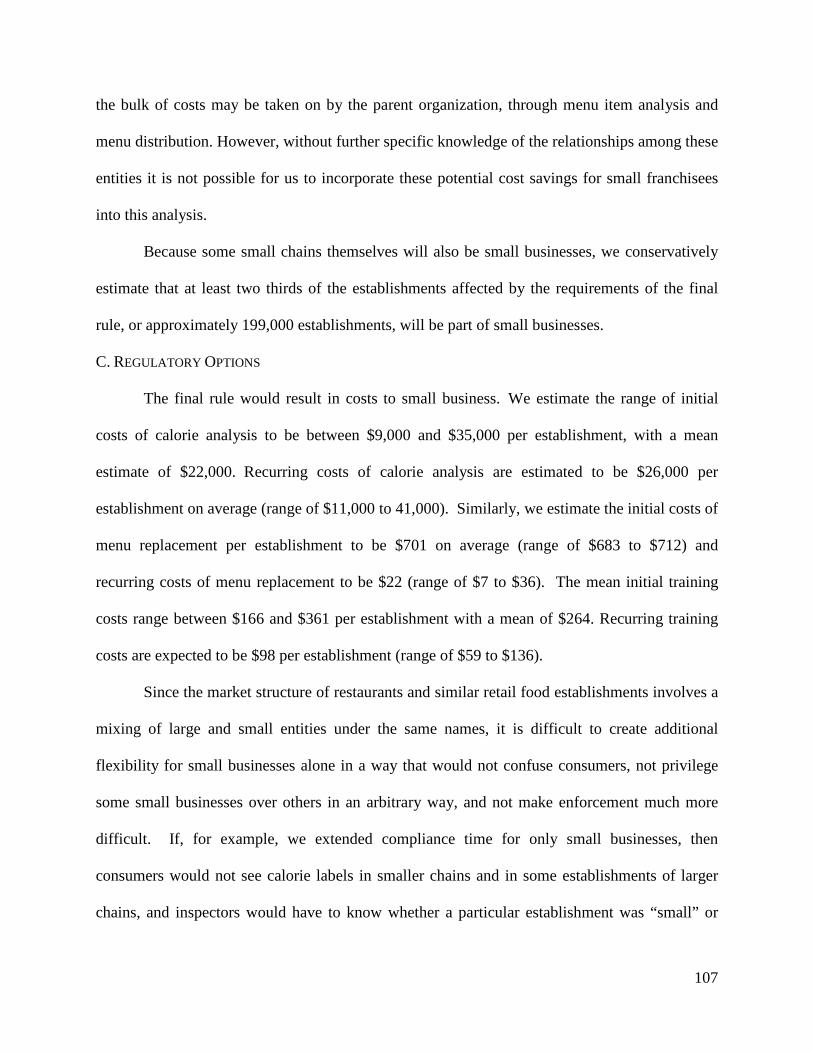
107
the bulk of costs may be taken on by the parent organization, through menu item analysis and
menu distribution. However, without further specific knowledge of the relationships among these
entities it is not possible for us to incorporate these potential cost savings for small franchisees
into this analysis.
Because some small chains themselves will also be small businesses, we conservatively
estimate that at least two thirds of the establishments affected by the requirements of the final
rule, or approximately 199,000 establishments, will be part of small businesses.
C. REGULATORY OPTIONS
The final rule would result in costs to small business. We estimate the range of initial
costs of calorie analysis to be between $9,000 and $35,000 per establishment, with a mean
estimate of $22,000. Recurring costs of calorie analysis are estimated to be $26,000 per
establishment on average (range of $11,000 to 41,000). Similarly, we estimate the initial costs of
menu replacement per establishment to be $701 on average (range of $683 to $712) and
recurring costs of menu replacement to be $22 (range of $7 to $36). The mean initial training
costs range between $166 and $361 per establishment with a mean of $264. Recurring training
costs are expected to be $98 per establishment (range of $59 to $136).
Since the market structure of restaurants and similar retail food establishments involves a
mixing of large and small entities under the same names, it is difficult to create additional
flexibility for small businesses alone in a way that would not confuse consumers, not privilege
some small businesses over others in an arbitrary way, and not make enforcement much more
difficult. If, for example, we extended compliance time for only small businesses, then
consumers would not see calorie labels in smaller chains and in some establishments of larger
chains, and inspectors would have to know whether a particular establishment was “small” or
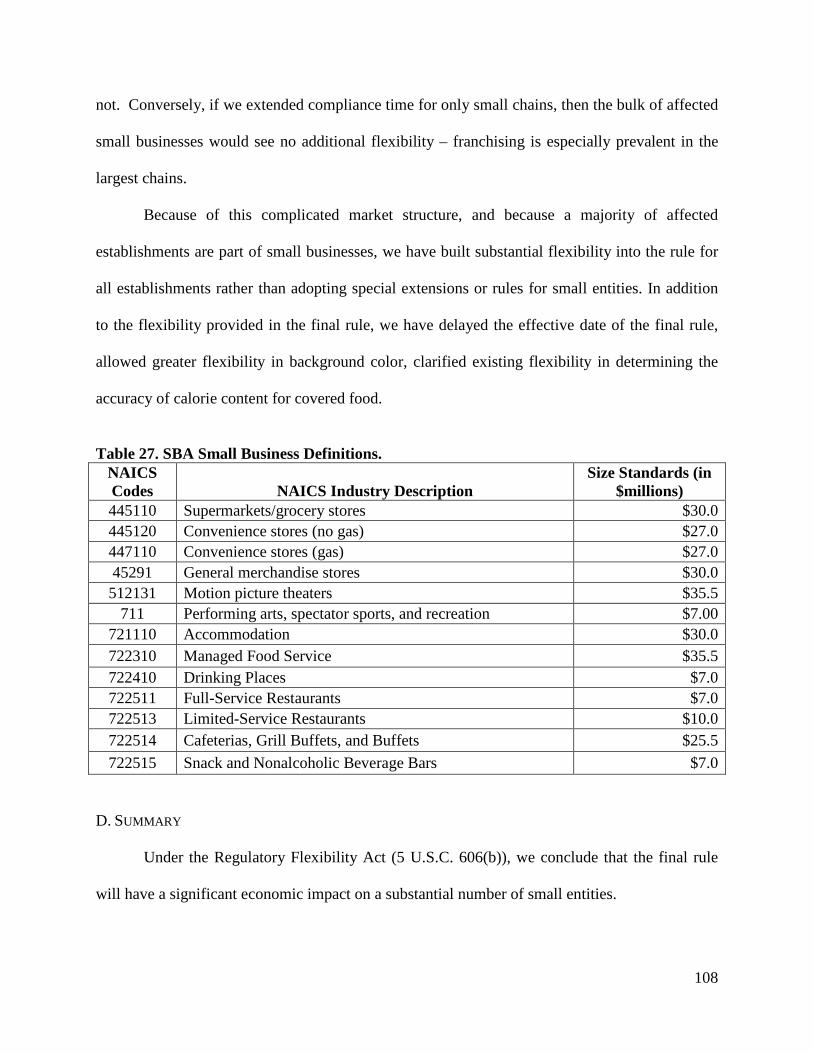
108
not. Conversely, if we extended compliance time for only small chains, then the bulk of affected
small businesses would see no additional flexibility – franchising is especially prevalent in the
largest chains.
Because of this complicated market structure, and because a majority of affected
establishments are part of small businesses, we have built substantial flexibility into the rule for
all establishments rather than adopting special extensions or rules for small entities. In addition
to the flexibility provided in the final rule, we have delayed the effective date of the final rule,
allowed greater flexibility in background color, clarified existing flexibility in determining the
accuracy of calorie content for covered food.
Table 27. SBA Small Business Definitions.
NAICS Codes NAICS Industry Description
Size Standards (in $millions)
445110 Supermarkets/grocery stores $30.0 445120 Convenience stores (no gas) $27.0 447110 Convenience stores (gas) $27.0 45291 General merchandise stores $30.0 512131 Motion picture theaters $35.5
711 Performing arts, spectator sports, and recreation $7.00 721110 Accommodation $30.0 722310 Managed Food Service $35.5 722410 Drinking Places $7.0 722511 Full-Service Restaurants $7.0 722513 Limited-Service Restaurants $10.0 722514 Cafeterias, Grill Buffets, and Buffets $25.5 722515 Snack and Nonalcoholic Beverage Bars $7.0
D. SUMMARY
Under the Regulatory Flexibility Act (5 U.S.C. 606(b)), we conclude that the final rule
will have a significant economic impact on a substantial number of small entities.
109
IV. UNFUNDED MANDATES
Section 202(a) of the Unfunded Mandates Reform Act of 1995 requires that agencies
prepare a written statement, which includes an assessment of anticipated costs and benefits,
before proposing “any rule that includes any Federal mandate that may result in the expenditure
by State, local, and tribal governments, in the aggregate, or by the private sector, of
$100,000,000 or more (adjusted annually for inflation) in any one year.” The current threshold
after adjustment for inflation is $141 million, using the most current (2013) Implicit Price
Deflator for the Gross Domestic Product. We have determined that the final rule has met the
threshold under the Unfunded Mandates Reform Act. We carried out the cost-benefit analysis in
preceding sections of this document. The other requirements under the Unfunded Mandates Act
of 1995 include assessing the final rule’s effects on:
• Future costs;
• Particular regions, communities, or industrial sectors;
• National productivity;
• Economic growth;
• Full employment;
• Job creation; and
• Exports.
The relevant issues listed above are covered in detail in the cost benefit analysis of the
preceding sections. Note that since the requirements in the final rule do not mandate any
changes in products, current export products would not be required to change in any way.
Furthermore, because the costs of the final rule per firm are low relative to the revenue generated

110
by retail food establishments, the final rules would not significantly affect employment,
economic growth or national productivity.
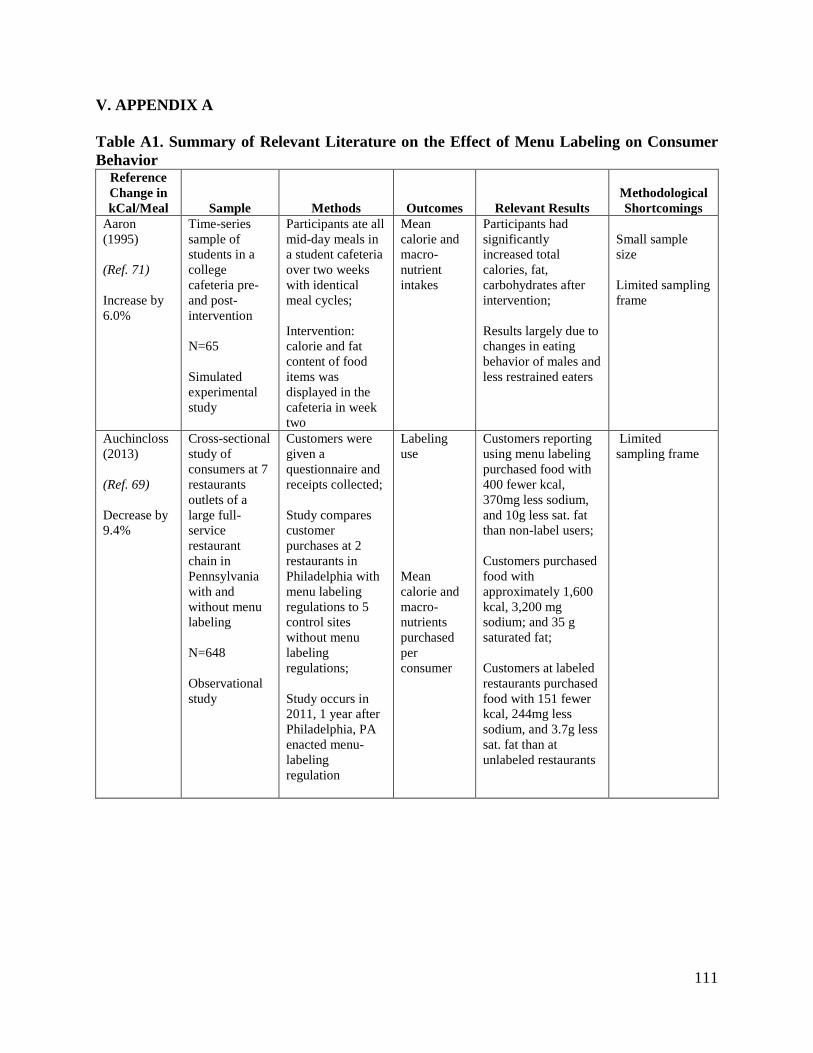
111
V. APPENDIX A
Table A1. Summary of Relevant Literature on the Effect of Menu Labeling on Consumer Behavior
Reference Change in kCal/Meal Sample Methods Outcomes Relevant Results
Methodological Shortcomings
Aaron (1995) (Ref. 71) Increase by 6.0%
Time-series sample of students in a college cafeteria pre- and post- intervention N=65 Simulated experimental study
Participants ate all mid-day meals in a student cafeteria over two weeks with identical meal cycles; Intervention: calorie and fat content of food items was displayed in the cafeteria in week two
Mean calorie and macro-nutrient intakes
Participants had significantly increased total calories, fat, carbohydrates after intervention; Results largely due to changes in eating behavior of males and less restrained eaters
Small sample size Limited sampling frame
Auchincloss (2013) (Ref. 69) Decrease by 9.4%
Cross-sectional study of consumers at 7 restaurants outlets of a large full-service restaurant chain in Pennsylvania with and without menu labeling N=648 Observational study
Customers were given a questionnaire and receipts collected; Study compares customer purchases at 2 restaurants in Philadelphia with menu labeling regulations to 5 control sites without menu labeling regulations; Study occurs in 2011, 1 year after Philadelphia, PA enacted menu-labeling regulation
Labeling use Mean calorie and macro-nutrients purchased per consumer
Customers reporting using menu labeling purchased food with 400 fewer kcal, 370mg less sodium, and 10g less sat. fat than non-label users; Customers purchased food with approximately 1,600 kcal, 3,200 mg sodium; and 35 g saturated fat; Customers at labeled restaurants purchased food with 151 fewer kcal, 244mg less sodium, and 3.7g less sat. fat than at unlabeled restaurants
Limited sampling frame
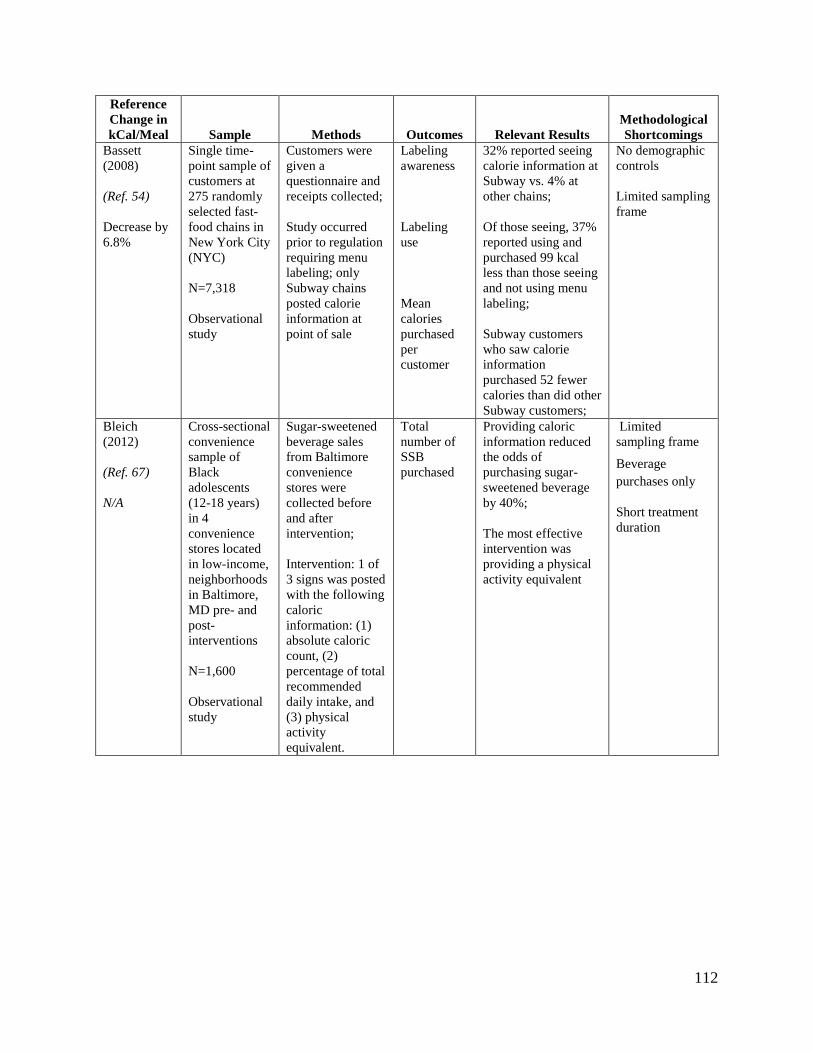
112
Reference Change in kCal/Meal Sample Methods Outcomes Relevant Results
Methodological Shortcomings
Bassett (2008) (Ref. 54) Decrease by 6.8%
Single time-point sample of customers at 275 randomly selected fast-food chains in New York City (NYC) N=7,318 Observational study
Customers were given a questionnaire and receipts collected; Study occurred prior to regulation requiring menu labeling; only Subway chains posted calorie information at point of sale
Labeling awareness Labeling use Mean calories purchased per customer
32% reported seeing calorie information at Subway vs. 4% at other chains; Of those seeing, 37% reported using and purchased 99 kcal less than those seeing and not using menu labeling; Subway customers who saw calorie information purchased 52 fewer calories than did other Subway customers;
No demographic controls Limited sampling frame
Bleich (2012) (Ref. 67) N/A
Cross-sectional convenience sample of Black adolescents (12-18 years) in 4 convenience stores located in low-income, neighborhoods in Baltimore, MD pre- and post-interventions N=1,600 Observational study
Sugar-sweetened beverage sales from Baltimore convenience stores were collected before and after intervention; Intervention: 1 of 3 signs was posted with the following caloric information: (1) absolute caloric count, (2) percentage of total recommended daily intake, and (3) physical activity equivalent.
Total number of SSB purchased
Providing caloric information reduced the odds of purchasing sugar-sweetened beverage by 40%; The most effective intervention was providing a physical activity equivalent
Limited sampling frame
Beverage purchases only
Short treatment duration
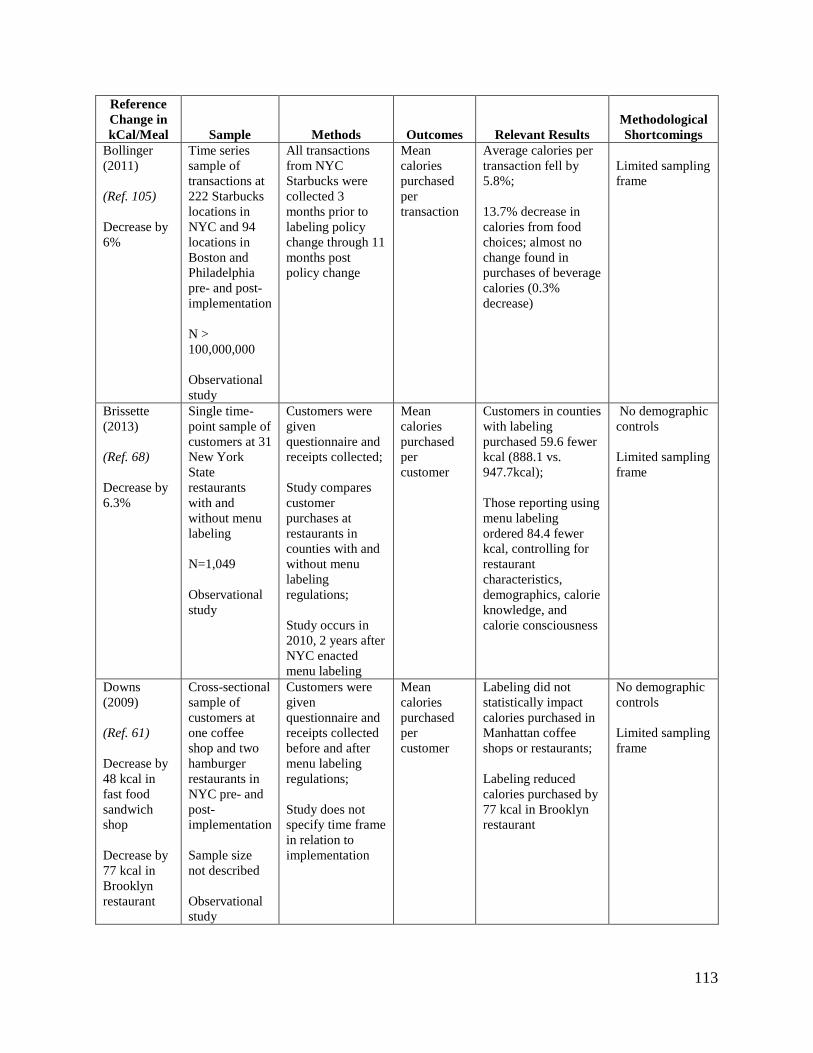
113
Reference Change in kCal/Meal Sample Methods Outcomes Relevant Results
Methodological Shortcomings
Bollinger (2011) (Ref. 105) Decrease by 6%
Time series sample of transactions at 222 Starbucks locations in NYC and 94 locations in Boston and Philadelphia pre- and post-implementation N > 100,000,000 Observational study
All transactions from NYC Starbucks were collected 3 months prior to labeling policy change through 11 months post policy change
Mean calories purchased per transaction
Average calories per transaction fell by 5.8%; 13.7% decrease in calories from food choices; almost no change found in purchases of beverage calories (0.3% decrease)
Limited sampling frame
Brissette (2013) (Ref. 68) Decrease by 6.3%
Single time-point sample of customers at 31 New York State restaurants with and without menu labeling N=1,049 Observational study
Customers were given questionnaire and receipts collected; Study compares customer purchases at restaurants in counties with and without menu labeling regulations; Study occurs in 2010, 2 years after NYC enacted menu labeling
Mean calories purchased per customer
Customers in counties with labeling purchased 59.6 fewer kcal (888.1 vs. 947.7kcal); Those reporting using menu labeling ordered 84.4 fewer kcal, controlling for restaurant characteristics, demographics, calorie knowledge, and calorie consciousness
No demographic controls Limited sampling frame
Downs (2009) (Ref. 61) Decrease by 48 kcal in fast food sandwich shop Decrease by 77 kcal in Brooklyn restaurant
Cross-sectional sample of customers at one coffee shop and two hamburger restaurants in NYC pre- and post- implementation Sample size not described Observational study
Customers were given questionnaire and receipts collected before and after menu labeling regulations; Study does not specify time frame in relation to implementation
Mean calories purchased per customer
Labeling did not statistically impact calories purchased in Manhattan coffee shops or restaurants; Labeling reduced calories purchased by 77 kcal in Brooklyn restaurant
No demographic controls Limited sampling frame
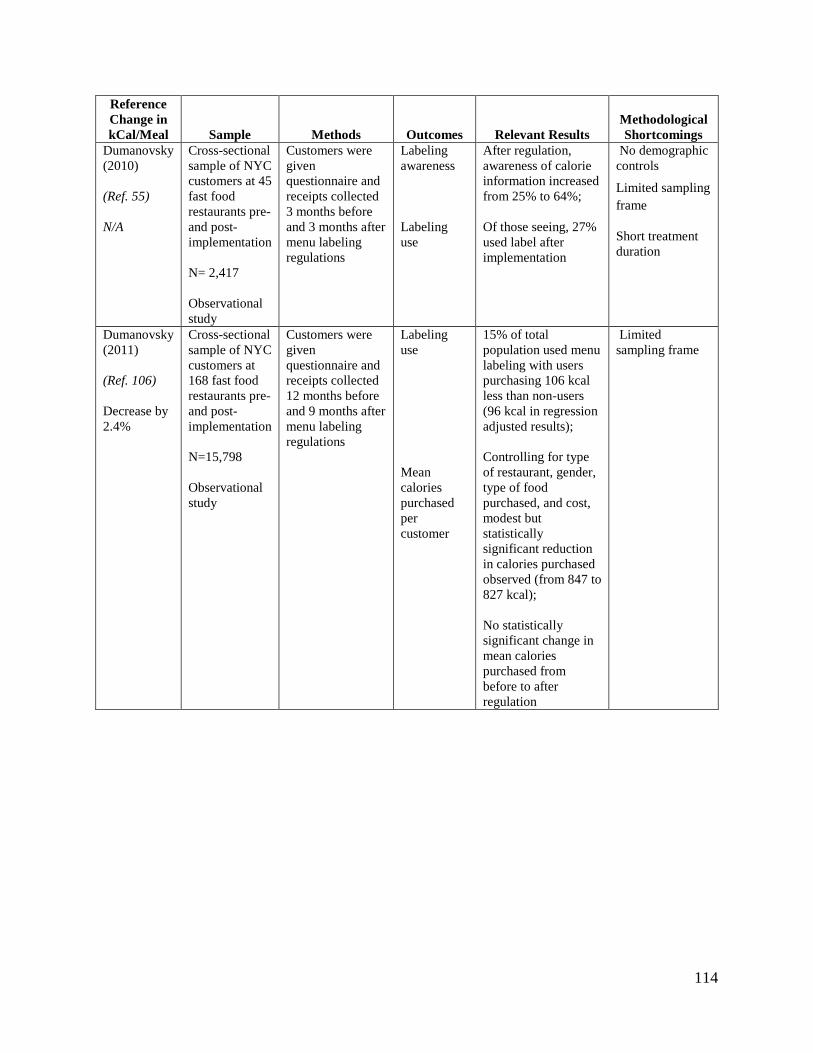
114
Reference Change in kCal/Meal Sample Methods Outcomes Relevant Results
Methodological Shortcomings
Dumanovsky (2010) (Ref. 55) N/A
Cross-sectional sample of NYC customers at 45 fast food restaurants pre- and post-implementation N= 2,417 Observational study
Customers were given questionnaire and receipts collected 3 months before and 3 months after menu labeling regulations
Labeling awareness Labeling use
After regulation, awareness of calorie information increased from 25% to 64%; Of those seeing, 27% used label after implementation
No demographic controls
Limited sampling frame
Short treatment duration
Dumanovsky (2011) (Ref. 106) Decrease by 2.4%
Cross-sectional sample of NYC customers at 168 fast food restaurants pre- and post-implementation N=15,798 Observational study
Customers were given questionnaire and receipts collected 12 months before and 9 months after menu labeling regulations
Labeling use Mean calories purchased per customer
15% of total population used menu labeling with users purchasing 106 kcal less than non-users (96 kcal in regression adjusted results); Controlling for type of restaurant, gender, type of food purchased, and cost, modest but statistically significant reduction in calories purchased observed (from 847 to 827 kcal); No statistically significant change in mean calories purchased from before to after regulation
Limited sampling frame
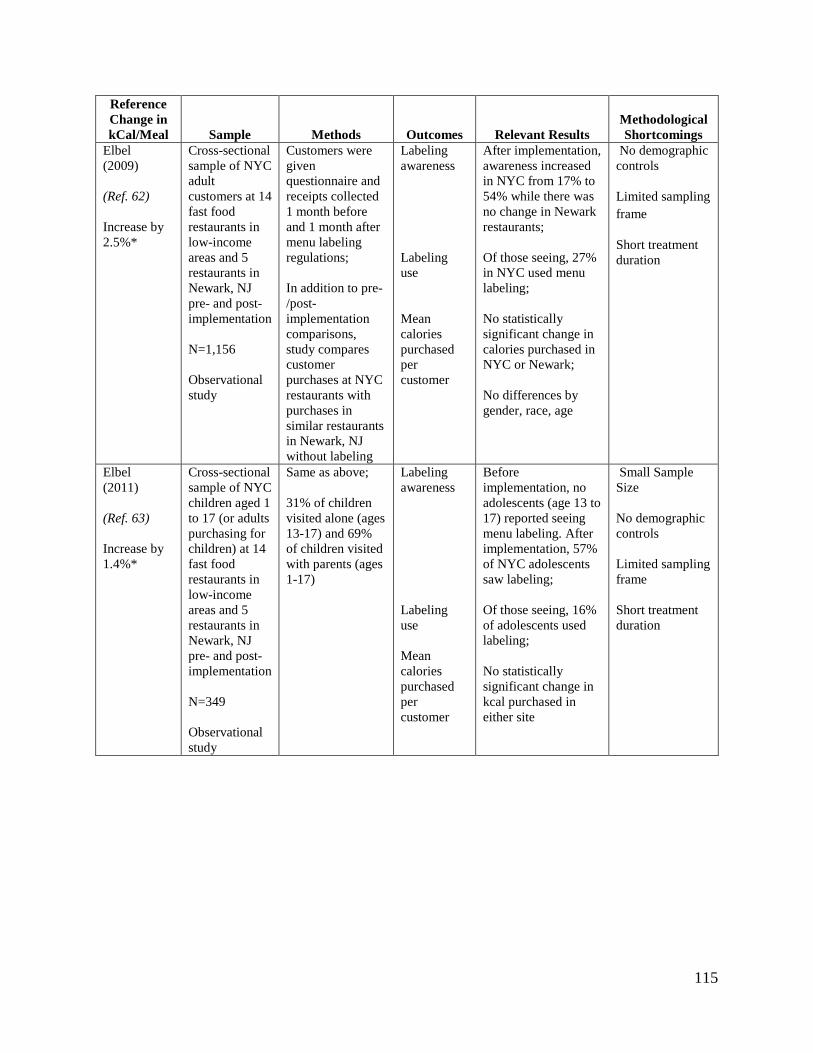
115
Reference Change in kCal/Meal Sample Methods Outcomes Relevant Results
Methodological Shortcomings
Elbel (2009) (Ref. 62) Increase by 2.5%*
Cross-sectional sample of NYC adult customers at 14 fast food restaurants in low-income areas and 5 restaurants in Newark, NJ pre- and post-implementation N=1,156 Observational study
Customers were given questionnaire and receipts collected 1 month before and 1 month after menu labeling regulations; In addition to pre-/post-implementation comparisons, study compares customer purchases at NYC restaurants with purchases in similar restaurants in Newark, NJ without labeling
Labeling awareness Labeling use Mean calories purchased per customer
After implementation, awareness increased in NYC from 17% to 54% while there was no change in Newark restaurants; Of those seeing, 27% in NYC used menu labeling; No statistically significant change in calories purchased in NYC or Newark; No differences by gender, race, age
No demographic controls Limited sampling frame
Short treatment duration
Elbel (2011) (Ref. 63) Increase by 1.4%*
Cross-sectional sample of NYC children aged 1 to 17 (or adults purchasing for children) at 14 fast food restaurants in low-income areas and 5 restaurants in Newark, NJ pre- and post-implementation N=349 Observational study
Same as above; 31% of children visited alone (ages 13-17) and 69% of children visited with parents (ages 1-17)
Labeling awareness Labeling use Mean calories purchased per customer
Before implementation, no adolescents (age 13 to 17) reported seeing menu labeling. After implementation, 57% of NYC adolescents saw labeling;
Of those seeing, 16% of adolescents used labeling; No statistically significant change in kcal purchased in either site
Small Sample Size No demographic controls Limited sampling frame Short treatment duration
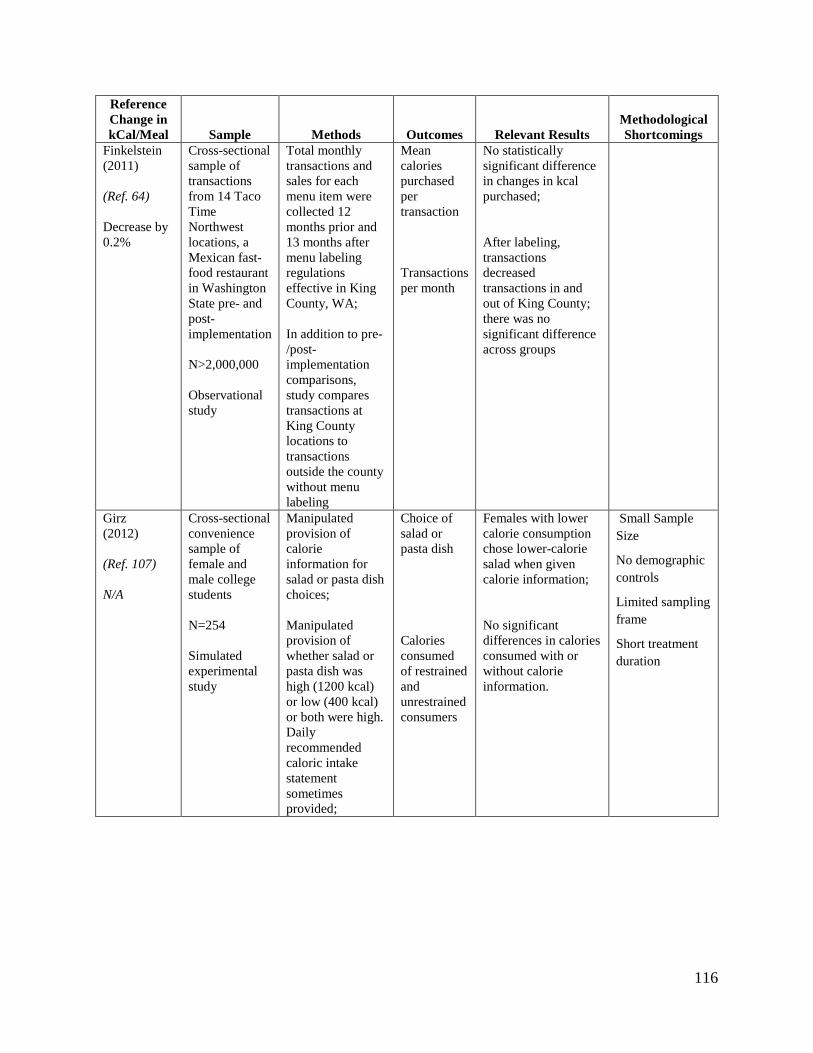
116
Reference Change in kCal/Meal Sample Methods Outcomes Relevant Results
Methodological Shortcomings
Finkelstein (2011) (Ref. 64) Decrease by 0.2%
Cross-sectional sample of transactions from 14 Taco Time Northwest locations, a Mexican fast-food restaurant in Washington State pre- and post-implementation N>2,000,000 Observational study
Total monthly transactions and sales for each menu item were collected 12 months prior and 13 months after menu labeling regulations effective in King County, WA; In addition to pre-/post-implementation comparisons, study compares transactions at King County locations to transactions outside the county without menu labeling
Mean calories purchased per transaction Transactions per month
No statistically significant difference in changes in kcal purchased; After labeling, transactions decreased transactions in and out of King County; there was no significant difference across groups
Girz (2012) (Ref. 107) N/A
Cross-sectional convenience sample of female and male college students N=254 Simulated experimental study
Manipulated provision of calorie information for salad or pasta dish choices; Manipulated provision of whether salad or pasta dish was high (1200 kcal) or low (400 kcal) or both were high. Daily recommended caloric intake statement sometimes provided;
Choice of salad or pasta dish Calories consumed of restrained and unrestrained consumers
Females with lower calorie consumption chose lower-calorie salad when given calorie information; No significant differences in calories consumed with or without calorie information.
Small Sample Size
No demographic controls
Limited sampling frame
Short treatment duration
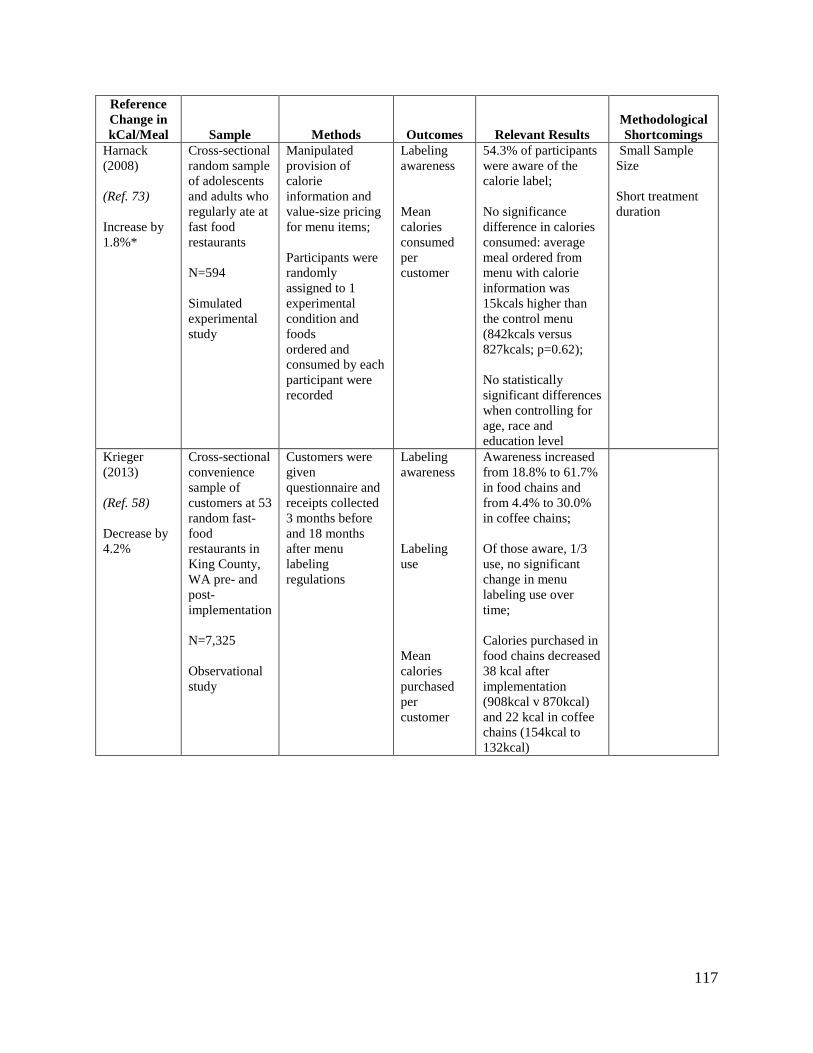
117
Reference Change in kCal/Meal Sample Methods Outcomes Relevant Results
Methodological Shortcomings
Harnack (2008) (Ref. 73) Increase by 1.8%*
Cross-sectional random sample of adolescents and adults who regularly ate at fast food restaurants N=594 Simulated experimental study
Manipulated provision of calorie information and value-size pricing for menu items; Participants were randomly assigned to 1 experimental condition and foods ordered and consumed by each participant were recorded
Labeling awareness Mean calories consumed per customer
54.3% of participants were aware of the calorie label; No significance difference in calories consumed: average meal ordered from menu with calorie information was 15kcals higher than the control menu (842kcals versus 827kcals; p=0.62); No statistically significant differences when controlling for age, race and education level
Small Sample Size Short treatment duration
Krieger (2013) (Ref. 58) Decrease by 4.2%
Cross-sectional convenience sample of customers at 53 random fast-food restaurants in King County, WA pre- and post-implementation N=7,325 Observational study
Customers were given questionnaire and receipts collected 3 months before and 18 months after menu labeling regulations
Labeling awareness Labeling use Mean calories purchased per customer
Awareness increased from 18.8% to 61.7% in food chains and from 4.4% to 30.0% in coffee chains; Of those aware, 1/3 use, no significant change in menu labeling use over time; Calories purchased in food chains decreased 38 kcal after implementation (908kcal v 870kcal) and 22 kcal in coffee chains (154kcal to 132kcal)
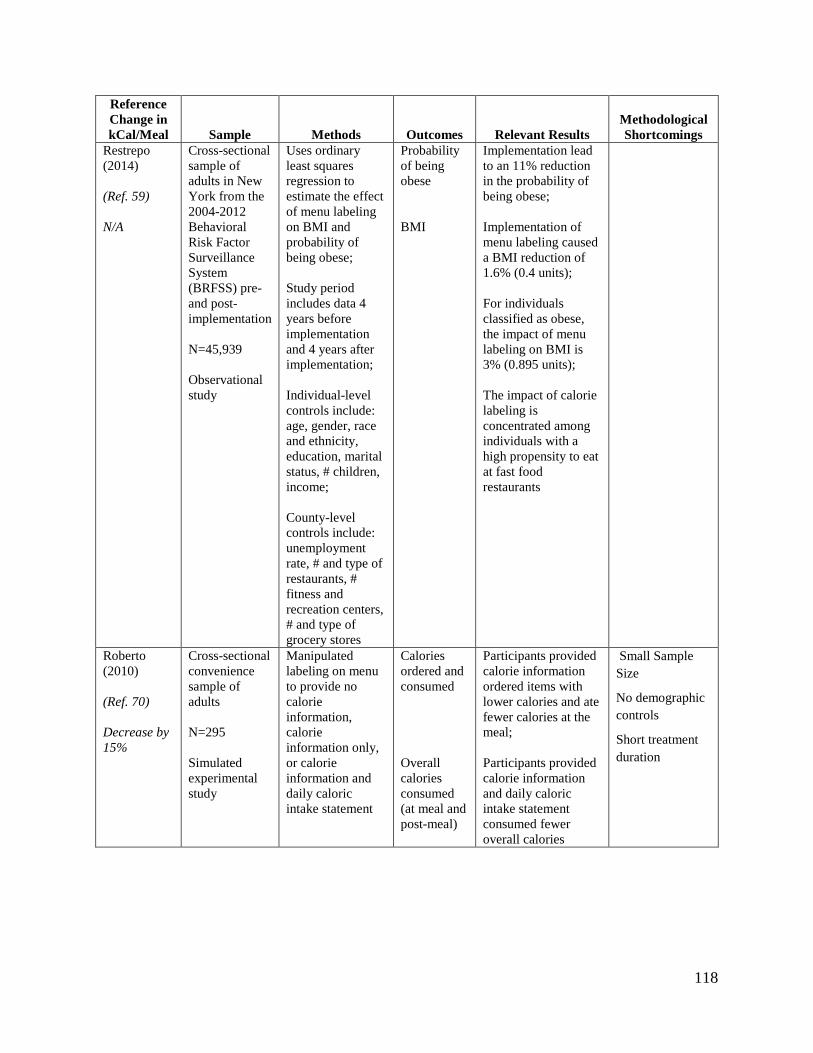
118
Reference Change in kCal/Meal Sample Methods Outcomes Relevant Results
Methodological Shortcomings
Restrepo (2014) (Ref. 59) N/A
Cross-sectional sample of adults in New York from the 2004-2012 Behavioral Risk Factor Surveillance System (BRFSS) pre- and post- implementation N=45,939 Observational study
Uses ordinary least squares regression to estimate the effect of menu labeling on BMI and probability of being obese; Study period includes data 4 years before implementation and 4 years after implementation; Individual-level controls include: age, gender, race and ethnicity, education, marital status, # children, income; County-level controls include: unemployment rate, # and type of restaurants, # fitness and recreation centers, # and type of grocery stores
Probability of being obese BMI
Implementation lead to an 11% reduction in the probability of being obese; Implementation of menu labeling caused a BMI reduction of 1.6% (0.4 units); For individuals classified as obese, the impact of menu labeling on BMI is 3% (0.895 units); The impact of calorie labeling is concentrated among individuals with a high propensity to eat at fast food restaurants
Roberto (2010) (Ref. 70) Decrease by 15%
Cross-sectional convenience sample of adults N=295 Simulated experimental study
Manipulated labeling on menu to provide no calorie information, calorie information only, or calorie information and daily caloric intake statement
Calories ordered and consumed Overall calories consumed (at meal and post-meal)
Participants provided calorie information ordered items with lower calories and ate fewer calories at the meal; Participants provided calorie information and daily caloric intake statement consumed fewer overall calories
Small Sample Size
No demographic controls
Short treatment duration
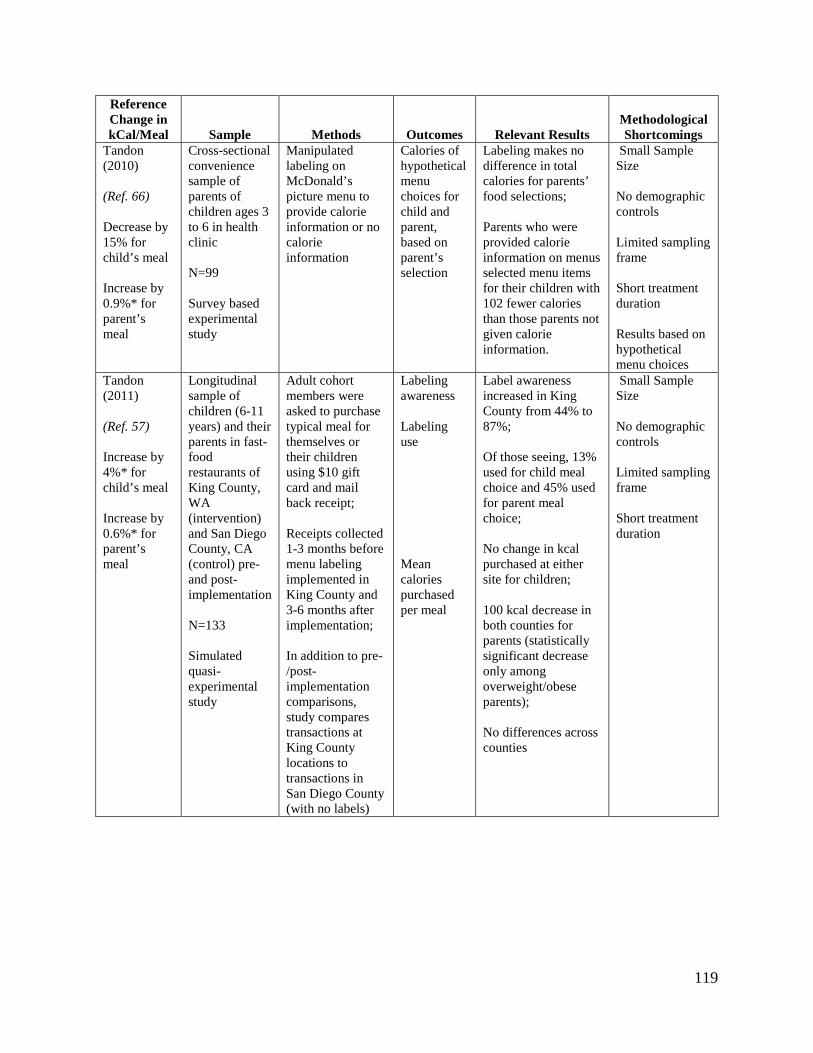
119
Reference Change in kCal/Meal Sample Methods Outcomes Relevant Results
Methodological Shortcomings
Tandon (2010) (Ref. 66) Decrease by 15% for child’s meal Increase by 0.9%* for parent’s meal
Cross-sectional convenience sample of parents of children ages 3 to 6 in health clinic N=99 Survey based experimental study
Manipulated labeling on McDonald’s picture menu to provide calorie information or no calorie information
Calories of hypothetical menu choices for child and parent, based on parent’s selection
Labeling makes no difference in total calories for parents’ food selections; Parents who were provided calorie information on menus selected menu items for their children with 102 fewer calories than those parents not given calorie information.
Small Sample Size No demographic controls Limited sampling frame Short treatment duration Results based on hypothetical menu choices
Tandon (2011) (Ref. 57) Increase by 4%* for child’s meal Increase by 0.6%* for parent’s meal
Longitudinal sample of children (6-11 years) and their parents in fast-food restaurants of King County, WA (intervention) and San Diego County, CA (control) pre- and post-implementation N=133 Simulated quasi-experimental study
Adult cohort members were asked to purchase typical meal for themselves or their children using $10 gift card and mail back receipt; Receipts collected 1-3 months before menu labeling implemented in King County and 3-6 months after implementation; In addition to pre-/post-implementation comparisons, study compares transactions at King County locations to transactions in San Diego County (with no labels)
Labeling awareness Labeling use Mean calories purchased per meal
Label awareness increased in King County from 44% to 87%; Of those seeing, 13% used for child meal choice and 45% used for parent meal choice; No change in kcal purchased at either site for children; 100 kcal decrease in both counties for parents (statistically significant decrease only among overweight/obese parents); No differences across counties
Small Sample Size No demographic controls Limited sampling frame Short treatment duration
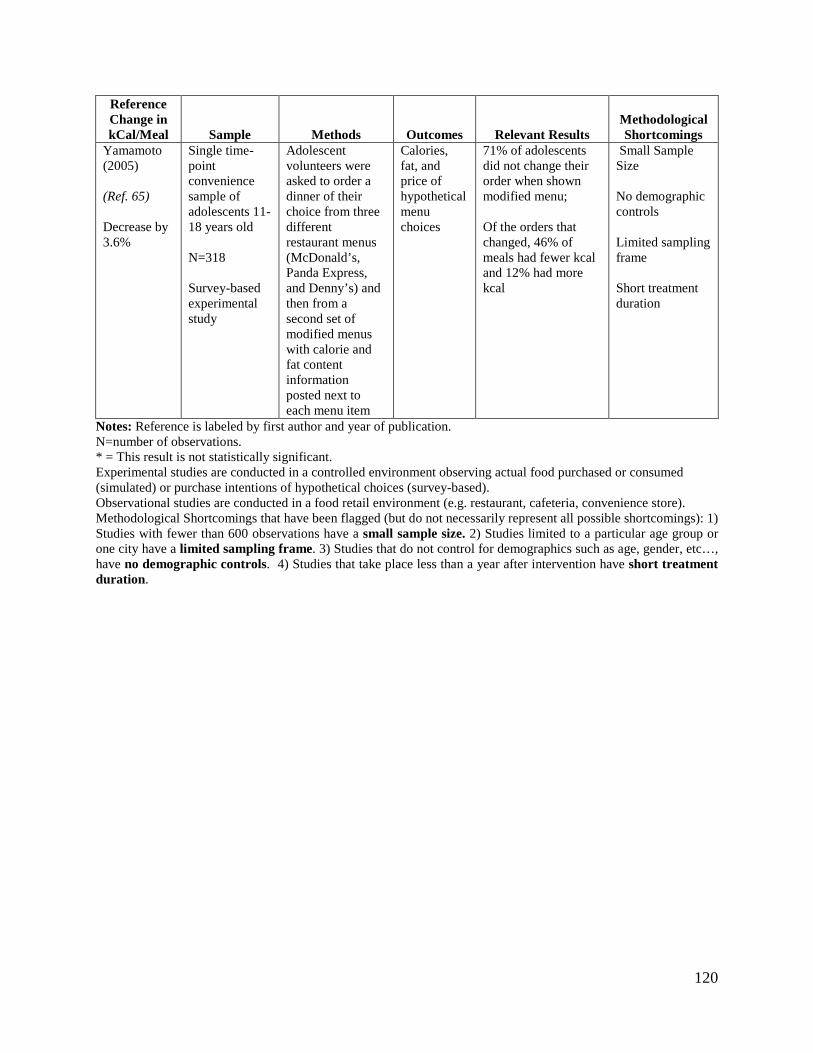
120
Reference Change in kCal/Meal Sample Methods Outcomes Relevant Results
Methodological Shortcomings
Yamamoto (2005) (Ref. 65) Decrease by 3.6%
Single time-point convenience sample of adolescents 11-18 years old N=318 Survey-based experimental study
Adolescent volunteers were asked to order a dinner of their choice from three different restaurant menus (McDonald’s, Panda Express, and Denny’s) and then from a second set of modified menus with calorie and fat content information posted next to each menu item
Calories, fat, and price of hypothetical menu choices
71% of adolescents did not change their order when shown modified menu; Of the orders that changed, 46% of meals had fewer kcal and 12% had more kcal
Small Sample Size No demographic controls Limited sampling frame Short treatment duration
Notes: Reference is labeled by first author and year of publication. N=number of observations. * = This result is not statistically significant. Experimental studies are conducted in a controlled environment observing actual food purchased or consumed (simulated) or purchase intentions of hypothetical choices (survey-based). Observational studies are conducted in a food retail environment (e.g. restaurant, cafeteria, convenience store). Methodological Shortcomings that have been flagged (but do not necessarily represent all possible shortcomings): 1) Studies with fewer than 600 observations have a small sample size. 2) Studies limited to a particular age group or one city have a limited sampling frame. 3) Studies that do not control for demographics such as age, gender, etc…, have no demographic controls. 4) Studies that take place less than a year after intervention have short treatment duration.
121
VI. APPENDIX B
Assuming that eating the optimally healthy diet would result in a gain of 0.04 life years
per year, and a VSL of $6.4 million, Abaluck (2011) estimated (at a 4 percent discount rate) that
the average individual would gain about $3,000 worth of life-years each year if they ate the
healthiest diet possible and if the elasticity of nutrient demand with respect to information were
perfectly inelastic. While the actual value would vary across consumers by age, the weighted
average gain would be comparable to the annual gain for an individual with a life expectancy of
37 remaining years. Using these benchmark parameters, Abaluck (2011) re-calculated the
welfare gains from the 1993 rules that implemented the NLEA and “additional labeling”
resulting in the “re-evaluated” welfare gain estimates that could be realized if the consumer’s
perceived marginal cost of consumption matched benchmark preferences.
Because the benchmark parameters depend on the choice of VSL and discount rate, a
lower VSL and a higher discount rate would result in a lower “re-evaluated” welfare gain.
Abaluck (2011) indicates, however, that the change in the estimated welfare gain would be
approximately proportional to the change in the discounted value of a statistical life year
(VSLY). Therefore, the ratio of an alternate discounted VSLY to the average discounted VSLY
used by Abaluck can be applied as a scaling factor to obtain estimates of the “re-evaluated”
welfare gains under alternate normative benchmark values.
Given that the average welfare gain estimated by Abaluck (2011) is similar to the gain for
an individual with 37 remaining years and assuming a present discounted value of life of $6.4
million (in 2000$), FDA finds that the VSLY is equal to $334,333 at a 4 percent discount rate (in
2000$). Since individuals gain additional life-years at the end of their life, FDA replicates
Abaluck’s method (at least roughly) by discounting this value over 37 years at 4 percent and
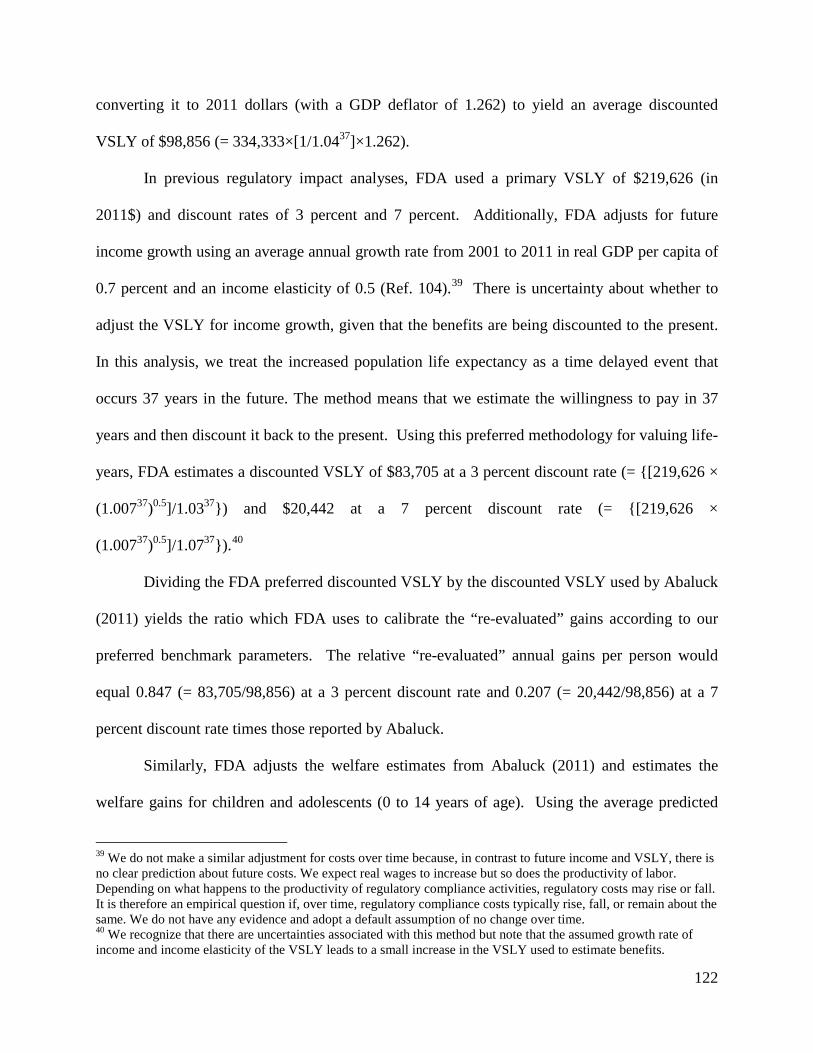
122
converting it to 2011 dollars (with a GDP deflator of 1.262) to yield an average discounted
VSLY of $98,856 (= 334,333×[1/1.0437]×1.262).
In previous regulatory impact analyses, FDA used a primary VSLY of $219,626 (in
2011$) and discount rates of 3 percent and 7 percent. Additionally, FDA adjusts for future
income growth using an average annual growth rate from 2001 to 2011 in real GDP per capita of
0.7 percent and an income elasticity of 0.5 (Ref. 104).39 There is uncertainty about whether to
adjust the VSLY for income growth, given that the benefits are being discounted to the present.
In this analysis, we treat the increased population life expectancy as a time delayed event that
occurs 37 years in the future. The method means that we estimate the willingness to pay in 37
years and then discount it back to the present. Using this preferred methodology for valuing life-
years, FDA estimates a discounted VSLY of $83,705 at a 3 percent discount rate (= {[219,626 ×
(1.00737)0.5]/1.0337}) and $20,442 at a 7 percent discount rate (= {[219,626 ×
(1.00737)0.5]/1.0737}).40
Dividing the FDA preferred discounted VSLY by the discounted VSLY used by Abaluck
(2011) yields the ratio which FDA uses to calibrate the “re-evaluated” gains according to our
preferred benchmark parameters. The relative “re-evaluated” annual gains per person would
equal 0.847 (= 83,705/98,856) at a 3 percent discount rate and 0.207 (= 20,442/98,856) at a 7
percent discount rate times those reported by Abaluck.
Similarly, FDA adjusts the welfare estimates from Abaluck (2011) and estimates the
welfare gains for children and adolescents (0 to 14 years of age). Using the average predicted
39 We do not make a similar adjustment for costs over time because, in contrast to future income and VSLY, there is no clear prediction about future costs. We expect real wages to increase but so does the productivity of labor. Depending on what happens to the productivity of regulatory compliance activities, regulatory costs may rise or fall. It is therefore an empirical question if, over time, regulatory compliance costs typically rise, fall, or remain about the same. We do not have any evidence and adopt a default assumption of no change over time. 40 We recognize that there are uncertainties associated with this method but note that the assumed growth rate of income and income elasticity of the VSLY leads to a small increase in the VSLY used to estimate benefits.
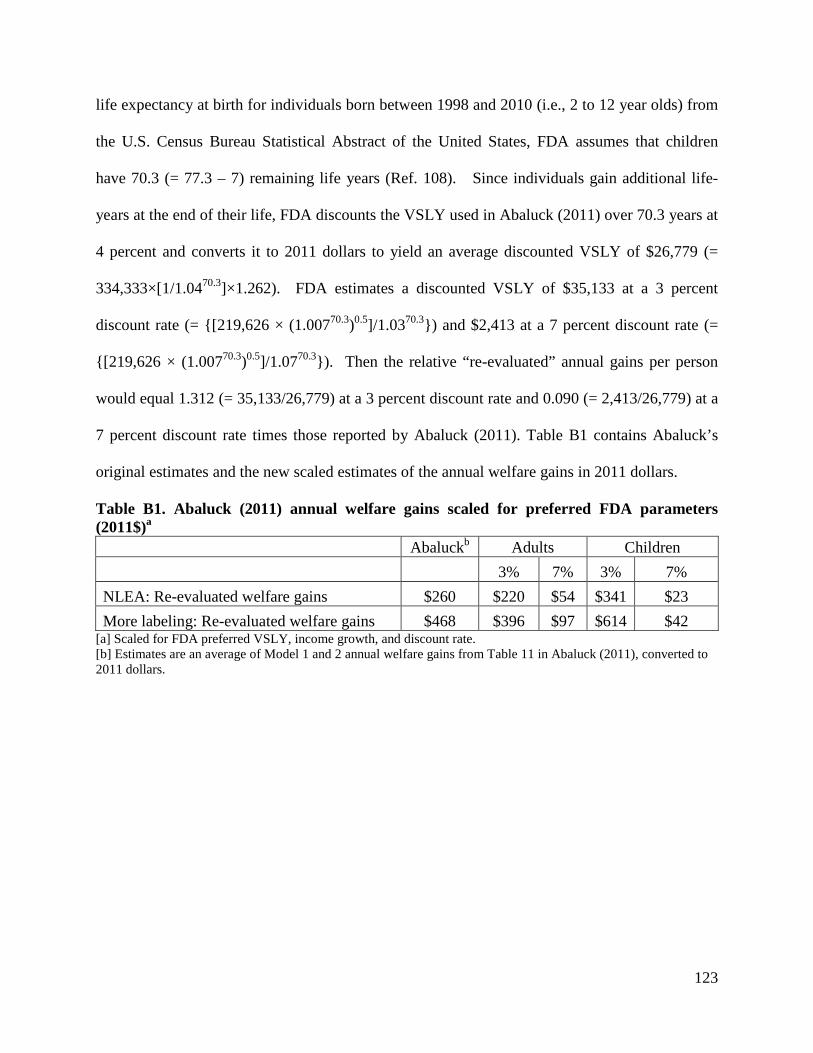
123
life expectancy at birth for individuals born between 1998 and 2010 (i.e., 2 to 12 year olds) from
the U.S. Census Bureau Statistical Abstract of the United States, FDA assumes that children
have 70.3 (= 77.3 – 7) remaining life years (Ref. 108). Since individuals gain additional life-
years at the end of their life, FDA discounts the VSLY used in Abaluck (2011) over 70.3 years at
4 percent and converts it to 2011 dollars to yield an average discounted VSLY of $26,779 (=
334,333×[1/1.0470.3]×1.262). FDA estimates a discounted VSLY of $35,133 at a 3 percent
discount rate (= {[219,626 × (1.00770.3)0.5]/1.0370.3}) and $2,413 at a 7 percent discount rate (=
{[219,626 × (1.00770.3)0.5]/1.0770.3}). Then the relative “re-evaluated” annual gains per person
would equal 1.312 (= 35,133/26,779) at a 3 percent discount rate and 0.090 (= 2,413/26,779) at a
7 percent discount rate times those reported by Abaluck (2011). Table B1 contains Abaluck’s
original estimates and the new scaled estimates of the annual welfare gains in 2011 dollars.
Table B1. Abaluck (2011) annual welfare gains scaled for preferred FDA parameters (2011$)a Abaluckb Adults Children 3% 7% 3% 7% NLEA: Re-evaluated welfare gains $260 $220 $54 $341 $23 More labeling: Re-evaluated welfare gains $468 $396 $97 $614 $42
[a] Scaled for FDA preferred VSLY, income growth, and discount rate. [b] Estimates are an average of Model 1 and 2 annual welfare gains from Table 11 in Abaluck (2011), converted to 2011 dollars.
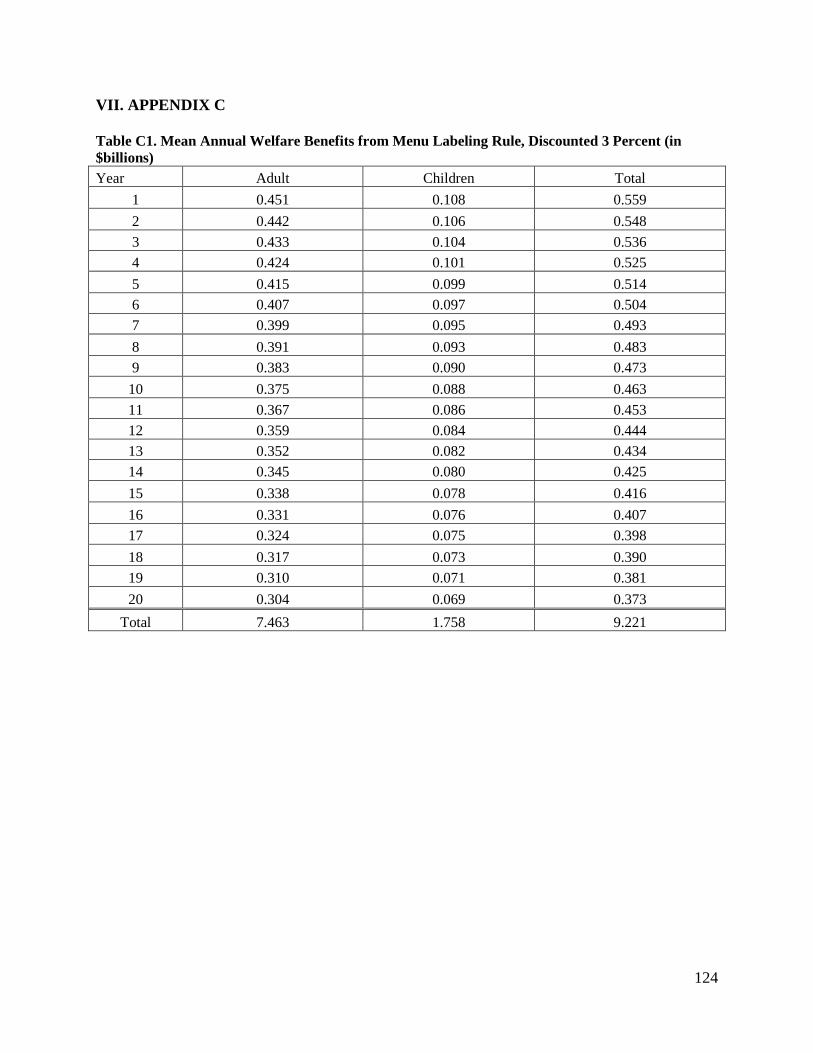
124
VII. APPENDIX C
Table C1. Mean Annual Welfare Benefits from Menu Labeling Rule, Discounted 3 Percent (in $billions) Year Adult Children Total
1 0.451 0.108 0.559 2 0.442 0.106 0.548 3 0.433 0.104 0.536 4 0.424 0.101 0.525 5 0.415 0.099 0.514 6 0.407 0.097 0.504 7 0.399 0.095 0.493 8 0.391 0.093 0.483 9 0.383 0.090 0.473 10 0.375 0.088 0.463 11 0.367 0.086 0.453 12 0.359 0.084 0.444 13 0.352 0.082 0.434 14 0.345 0.080 0.425 15 0.338 0.078 0.416 16 0.331 0.076 0.407 17 0.324 0.075 0.398 18 0.317 0.073 0.390 19 0.310 0.071 0.381 20 0.304 0.069 0.373
Total 7.463 1.758 9.221
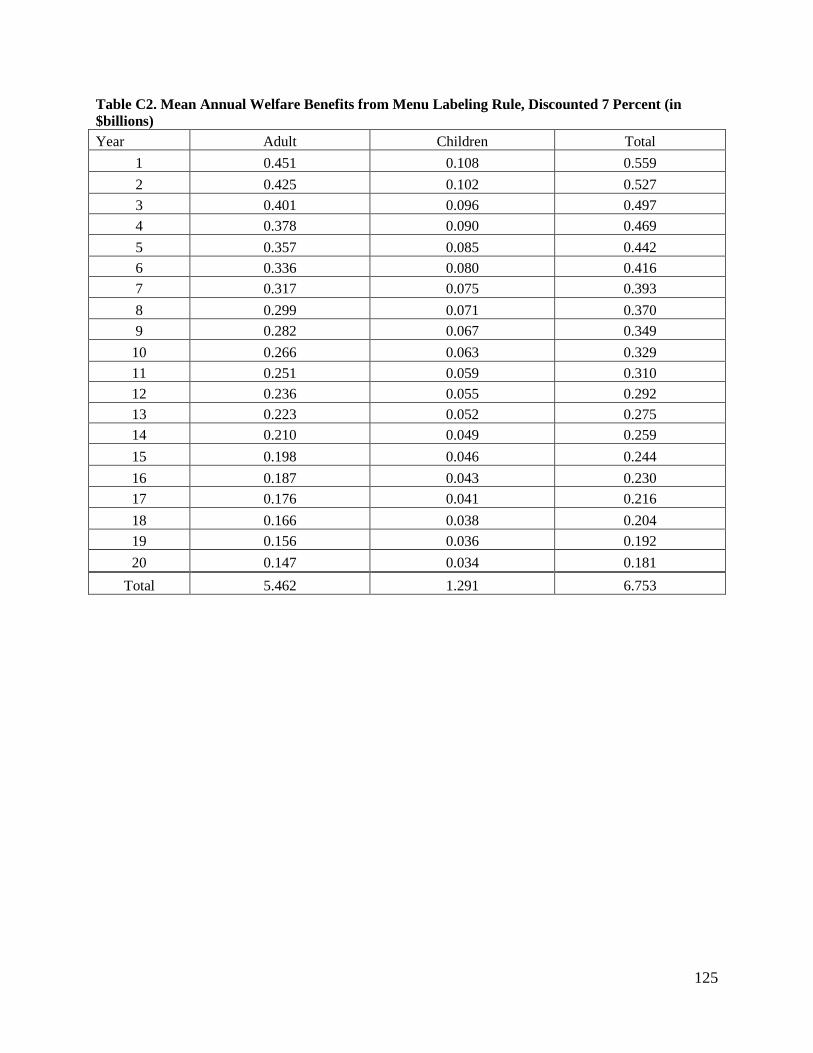
125
Table C2. Mean Annual Welfare Benefits from Menu Labeling Rule, Discounted 7 Percent (in $billions) Year Adult Children Total
1 0.451 0.108 0.559 2 0.425 0.102 0.527 3 0.401 0.096 0.497 4 0.378 0.090 0.469 5 0.357 0.085 0.442 6 0.336 0.080 0.416 7 0.317 0.075 0.393 8 0.299 0.071 0.370 9 0.282 0.067 0.349 10 0.266 0.063 0.329 11 0.251 0.059 0.310 12 0.236 0.055 0.292 13 0.223 0.052 0.275 14 0.210 0.049 0.259 15 0.198 0.046 0.244 16 0.187 0.043 0.230 17 0.176 0.041 0.216 18 0.166 0.038 0.204 19 0.156 0.036 0.192 20 0.147 0.034 0.181
Total 5.462 1.291 6.753
126
VIII. REFERENCES
(1) Ogden CL, Carroll MD. Prevalence of overweight, obesity, and extreme obesity among adults: United States, trends 1960−1962 through 2007−2008. NCHS Health and Stats 2010.
(2) Ogden CL, Carroll MD, Curtin LR, Lamb MM, Flegal KM. Prevalence of high body mass index in US children and adolescents, 2007-2008. JAMA: the journal of the American Medical Association 2010; 303(3):242-249.
(3) Guthrie JF, Lin BH, Frazao E. Role of food prepared away from home in the American diet, 1977-78 versus 1994-96: changes and consequences. Journal of nutrition education and behavior 2002; 34(3):140-150.
(4) Lakdawalla D, Philipson T. The growth of obesity and technological change: a theoretical and empirical examination. 2002. National Bureau of Economic Research.
(5) Philipson TJ, Posner RA. The long-run growth in obesity as a function of technological
change. 1999. National Bureau of Economic Research. (6) Mancino L, Todd J, Lin BH. Separating what we eat from where: Measuring the effect of
food away from home on diet quality. Food Policy 2009; 34(6):557-562.
(7) Larson N, Story M. Menu labeling: does providing nutrition information at the point of purchase affect consumer behavior. A research synthesis Healthy Eating Research national program Robert Wood Johnson Foundation 2009.
(8) Anderson ML, Matsa DA. Are restaurants really supersizing America? American Economic Journal: Applied Economics 2011;152-188.
(9) Ruhm CJ. Understanding overeating and obesity. Journal of Health Economics 2012.
(10) O'Donoghue T, Rabin M. Optimal sin taxes. Journal of Public Economics 2006; 90(10):1825-1849.
(11) Loewenstein G. Out of control: Visceral influences on behavior. Organizational behavior and human decision processes 1996; 65(3):272-292.
(12) O'Donoghue T, Rabin M. Doing it now or later. American Economic Review 1999;103-124.
(13) Akerlof GA. Procrastination and obedience. The American Economic Review 1991; 81(2):1-19.
(14) Wansink B, Painter JE, North J. Bottomless Bowls: Why Visual Cues of Portion Size May Influence Intake**. Obesity Research 2005; 13(1):93-100.
127
(15) Wansink B. Environmental Factors That Increase the Food Intake and Consumption Volume of Unknowing Consumers*. Annu Rev Nutr 2004; 24:455-479.
(16) Conlisk J. Why bounded rationality? Journal of economic literature 1996; 34(2):669-700.
(17) Eastern Research Group I. Evaluation of Recordkeeping Costs for Food Manufacturers, Final Report. Sertkaya A, Berlind A, Erdem S, editors. Contract No. 223-01-2461, Task Order Number 5. 2007.
(18) US Census Bureau. County Business Patterns, United States NAICS 2000-2008. 2014.
10-18-2010. (19) US Census Bureau. North American Industry Classification System. 2007. 10-18-2010. (20) US Census Bureau. FAQS (Ask Dr. NAICS). 2011. 2-16-2011. (21) Wootan MG, Osborn M. Availability of nutrition information from chain restaurants in
the United States. Am J Prev Med 2006; 30(3):266-268.
(22) RTI International. FDA Labeling Cost Model, Final Report. Muth M, Gledhill E, Karns S, editors. RTI 06673.010. 2003.
(23) Silliker Inc. Silliker Information. 9-8-2010. (24) Editors. 2010 North American Food Retailers. Supermarket News 2010; 58(4):6-9.
(25) RL Food Testing Laboratory. Quality Nutrition Analysis. 2014. 9-23-2010. (26) FoodCalc LLC. Menucalc Plans. 2014. 9-23-2010. (27) Bureau of Labor Statistics. Occupational Employment Statistics. 2011. 10-17-2011. (28) NPD Group. FDA Report. ReCount Restaurant Census 2010; Spring.
(29) Technomic Inc. FDA Report. MenuMonitor 2010; Summer.
(30) Zwiebach E. Under the Radar: Top 50 Independents. Supermarket News 2010; 58(5):14-20.
(31) Longo D. Acquisition Pace Quickens in 2010, but Despite Consolidation, Top Chains Still Account for Nearly 40 Percent of Industry's Total Stores. Convenience Store News 2010; 46(10):31-36.
(32) US Census Bureau. Sector 72: Sub: Single Unit & Multiunit Firms for the U.S: 2007. 2007 Economic Census . 2008. 2-16-2011.
(33) National Restaurant Association. 2010 Restaurant Industry Forecast. Washington, DC:
2010.
128
(34) Mintel Menu Insights. New Menu Items at Restaurants. 2010. (35) Display Signs & Design. Order/Get Menu Pricing. 2014. 10-6-2010. (36) Memo to File. McDonald's Meeting. 10-4-2010. (37) US Census Bureau. Sector 72: Sub: Seating Capacity for the U.S. and States: 2007. 2007
Economic Census . 2008. 2-16-2011. (38) Roberto CA, Agnew H, Brownell KD. An observational study of consumers' accessing of
nutrition information in chain restaurants. Am J Public Health 2009; 99(5):820-821.
(39) Bureau of Labor Statistics. Job Openings and Labor Turnover Survey: Accommodation and food services, Total US, Total Separations, Rate, Series Id: JTU72000000TSR (3,9). 2011. 2-16-2011.
(40) Berta D. Paying Attention to Retention. Nation's Restaurant News 2008; 42(4):24.
(41) Ruggles R. KFC's New Computer-Based Training Program Proves a Time Saver and Better Tool for Learning. Nation's Restaurant News 1997; 31(50):40.
(42) Bureau of Labor Statistics. May 2010 National Industry-Specific Occupational Employment and Wage Estimates. 2010. 10-18-2011.
(43) Abaluck J. What Would We Eat if We Knew More: The Implications of a Large-Scale
Change in Nutrition Labeling. Working Paper 2011.
(44) Lin BH, Guthrie J, Frazao E. Nutrient contribution of food away from home. America's eating habits: Changes and consequences 1999; 750.
(45) US Department of Health and Human Services, US Department of Agriculture. 2010 Dietary Guidelines for Americans. 7 ed. Washington, DC: US Government Printing Office; 2010.
(46) O'Donoghue T, Rabin M. The economics of immediate gratification. Journal of Behavioral Decision Making 2000; 13(2):233-250.
(47) Ali MM, Fang H, Rizzo JA. Body weight, self-perception and mental health outcomes among adolescents. The journal of mental health policy and economics 2010; 13(2):53.
(48) Ali MM, Amialchuk A, Renna F. Social network and weight misperception among adolescents. Southern Economic Journal 2011; 77(4):827-842.
(49) NPD Group. U.S. Independent Restaurants Account for 87 Percent of Industry Traffic Losses Since 2008. Press Release [ 2012 Available from: URL:https://www.npd.com/wps/portal/npd/us/news/press-releases/pr_120227/
129
(50) Economic Research Service. Food Consumption and Nutrient Intakes. 7-5-2012. 10-8-2012.
(51) Post R, Budak C, Canavan J, Duncan-Harrington T, Jones BJ, Jenkins R et al. A Guide to
Federal Food Labeling Requirements for Meat, Poultry, and Egg Products. US Department of Agriculture 2007.
(52) Parks J. The Effects of Food Labeling and Dietary Guidance on Nutrition in the United States. AAEA Annual Meeting [ 2013 Available from: URL:http://ageconsearch.umn.edu/bitstream/150583/2/AAEA%20Nut-Label-DRAFT-IV-5-23-13.pdf
(53) @Risk Computer Program [2011].
(54) Bassett MT, Dumanovsky T, Huang C, Silver LD, Young C, Nonas C et al. Purchasing behavior and calorie information at fast-food chains in New York City, 2007. Am J Public Health 2008; 98(8):1457-1459.
(55) Dumanovsky T, Huang CY, Bassett MT, Silver LD. Consumer awareness of fast-food calorie information in New York City after implementation of a menu labeling regulation. Am J Public Health 2010; 100(12):2520-2525.
(56) Krieger J, Saelens BE. Impact of Menu Labeling on Consumer Behavior: A 2008-2012 Update. 2013. Minneapolis, MN, Healthy Eating Research: Robert Wood Johnson Foundation.
(57) Tandon PS, Zhou C, Chan NL, Lozano P, Couch SC, Glanz K et al. The impact of menu
labeling on fast-food purchases for children and parents. Am J Prev Med 2011; 41(4):434-438.
(58) Krieger JW, Chan NL, Saelens BE, Ta ML, Solet D, Fleming DW. Menu labeling regulations and calories purchased at chain restaurants. Am J Prev Med 2013; 44(6):595-604.
(59) Restrepo B. The Effect of Calorie Labeling in Chain Restaurants on Body Mass Index and Obesity: Evidence from New York State. Unpublished Working Paper . 2-7-2014.
(60) Bollinger B, Leslie P, Sorensen A. Calorie posting in chain restaurants. 2010. National
Bureau of Economic Research. (61) Downs JS, Loewenstein G, Wisdom J. Strategies for promoting healthier food choices.
The American Economic Review 2009; 99(2):159-164. (62) Elbel B, Kersh R, Brescoll VL, Dixon LB. Calorie labeling and food choices: a first look
at the effects on low-income people in New York City. Health Aff (Millwood ) 2009; 28(6):w1110-w1121.
130
(63) Elbel B, Gyamfi J, Kersh R. Child and adolescent fast-food choice and the influence of calorie labeling: a natural experiment. International Journal of Obesity 2011; 35(4):493-500.
(64) Finkelstein EA, Strombotne KL, Chan NL, Krieger J. Mandatory menu labeling in one fast-food chain in King County, Washington. Am J Prev Med 2011; 40(2):122-127.
(65) Yamamoto JA, Yamamoto JB, Yamamoto BE, Yamamoto LG. Adolescent fast food and restaurant ordering behavior with and without calorie and fat content menu information. Journal of Adolescent Health 2005; 37(5):397-402.
(66) Tandon PS, Wright J, Zhou C, Rogers CB, Christakis DA. Nutrition menu labeling may lead to lower-calorie restaurant meal choices for children. Pediatrics 2010; 125(2):244-248.
(67) Bleich SN, Herring BJ, Flagg DD, Gary-Webb TL. Reduction in purchases of sugar-sweetened beverages among low-income black adolescents after exposure to caloric information. Am J Public Health 2012; 102(2):329-335.
(68) Brissette I, Lowenfels A, Noble C, Spicer D. Predictors of Total Calories Purchased at Fast-food Restaurants: Restaurant Characteristics, Calorie Awareness, and Use of Calorie Information. Journal of nutrition education and behavior 2013.
(69) Auchincloss AH, Mallya GG, Leonberg BL, Ricchezza A, Glanz K, Schwarz DF. Customer responses to mandatory menu labeling at full-service restaurants. Am J Prev Med 2013; 45(6):710-719.
(70) Roberto CA, Larsen PD, Agnew H, Baik J, Brownell KD. Evaluating the impact of menu labeling on food choices and intake. Am J Public Health 2010; 100(2):312-318.
(71) Aaron JI, Evans RE, Mela DJ. Paradoxical effect of a nutrition labelling scheme in a student cafeteria. Nutrition Research 1995; 15(9):1251-1261.
(72) Girz L, Polivy J, Herman CP, Lee H. The effects of calorie information on food selection and intake. International Journal of Obesity 2011; 36(10):1340-1345.
(73) Harnack L, French S, Oakes JM, Story M, Jeffery R, Rydell S. Effects of calorie labeling and value size pricing on fast food meal choices: results from an experimental trial. International Journal of Behavioral Nutrition and Physical Activity 2008; 5(1):63.
(74) Variyam JN, Cawley J. Nutrition labels and obesity. 2006. National Bureau of Economic Research.
(75) Knopman D, Boland LL, Mosley T, Howard G, Liao D, Szklo M et al. Cardiovascular
risk factors and cognitive decline in middle-aged adults. Neurology 2001; 56(1):42-48.
(76) A healthy body, a healthy mind: long-term impact of diet on mood and cognitive function. Cambridge Univ Press; 2001.
131
(77) Who J, Consultation FE. Diet, nutrition and the prevention of chronic diseases. WHO technical report series 2003; 916.
(78) Hall KD, Jordan PN. Modeling weight-loss maintenance to help prevent body weight regain. The American journal of clinical nutrition 2008; 88(6):1495-1503.
(79) Jia H, Lubetkin EI. Trends in quality-adjusted life-years lost contributed by smoking and obesity. Am J Prev Med 2010; 38(2):138-144.
(80) Jia H, Lubetkin EI. Obesity-related quality-adjusted life years lost in the US from 1993 to 2008. Am J Prev Med 2010; 39(3):220-227.
(81) Cutler DM, Richardson E, Keeler TE, Staiger D. Measuring the health of the US population. Brookings papers on economic activity Microeconomics 1997; 1997:217-282.
(82) Sullivan PW, Ghushchyan V, BenΓÇÉJoseph RH. The effect of obesity and cardiometabolic risk factors on expenditures and productivity in the United States. Obesity 2008; 16(9):2155-2162.
(83) US Census Bureau. State and County QuickFacts. 1-7-2014. 1-28-2014. (84) Masters RK, Reither EN, Powers DA, Yang YC, Burger AE, Link BG. The impact of
obesity on US mortality levels: The importance of age and cohort factors in population estimates. Am J Public Health 2013; 103(10):1895-1901.
(85) Flegal KM, Graubard BI, Williamson DF, Gail MH. Excess deaths associated with underweight, overweight, and obesity. JAMA: the journal of the American Medical Association 2005; 293(15):1861-1867.
(86) FDA. Deeming Tobacco Products To Be Subject to the Federal Food, Drug, and Cosmetic Act, as Amended by the Family Smoking Prevention and Tobacco Control Act (Proposed Rule). 79 FR 23141 -23207 [ 2014 Available from: URL:http://www.fda.gov/AboutFDA/ReportsManualsForms/Reports/EconomicAnalyses/ucm394922.htm
(87) Ashley EM, Nardinelli C, Lavaty RA. Estimating the Benefits of Public Health Policies that Reduce Harmful Consumption. Health Economics 2014;n/a.
(88) Cawley J, Joyner K, Sobal J. Size Matters The Influence of Adolescents Weight and Height on Dating and Sex. Rationality and Society 2006; 18(1):67-94.
(89) Cawley J. The impact of obesity on wages. Journal of Human Resources 2004; 39(2):451-474.
(90) Derby BM, Levy AS. Do food labels work. Handbook of marketing and society 2001;372-393.

132
(91) Bruemmer B, Krieger J, Saelens BE, Chan N. Energy, saturated fat, and sodium were lower in entrees at chain restaurants at 18 months compared with 6 months following the implementation of mandatory menu labeling regulation in King County, Washington. J Acad Nutr Diet 2012; 112(8):1169-1176.
(92) Burton S, Creyer EH. What consumers don't know can hurt them: Consumer evaluations and disease risk perceptions of restaurant menu items. Journal of Consumer Affairs 2004; 38(1):121-145.
(93) Morrison RM, Mancino L, Variyam JN. Will calorie labeling in restaurants make a difference? Amber Waves 2011.
(94) Enkoji MS. California Calorie Law Alters Chains' Fare. Sacramento Bee 2009 Jul 14.
(95) Jargon J. Restaurants begin to count calories. Wall Street Journal 2010; 22.
(96) Quick Service Restaurant. Cosi Launches Lighten Up! Menu. 9-8-2008. (97) Bauer KW, Hearst MO, Earnest AA, French SA, Oakes JM, Harnack LJ. Energy content
of U.S. fast-food restaurant offerings: 14-year trends. Am J Prev Med 2012; 43(5):490-497.
(98) Hearst MO, Harnack LJ, Bauer KW, Earnest AA, French SA, Michael Oakes J. Nutritional Quality at Eight US Fast-Food Chains: 14-Year Trends. Am J Prev Med 2013; 44(6):589-594.
(99) Namba A, Auchincloss A, Leonberg BL, Wootan MG. Exploratory analysis of fast-food chain restaurant menus before and after implementation of local calorie-labeling policies, 2005-2011. Prev Chronic Dis 2013; 10:E101.
(100) Hudson Institute. Lower Calorie Foods: It's Just Good Business. Obesity Solutions Initiative Report . 2013.
(101) Robert Woods Johnson Foundation. Major Food, Beverage Companies Remove 6.4
Trillion Calories from U.S. Marketplace. 1-9-2014. (102) Aldy JE, Viscusi WK. Age differences in the value of statistical life: revealed preference
evidence. Review of Environmental Economics and Policy 2007; 1(2):241-260.
(103) Braithwaite RS, Meltzer DO, King Jr JT, Leslie D, Roberts MS. What does the value of modern medicine say about the $50,000 per quality-adjusted life-year decision rule? Medical care 2008; 46(4):349-356.
(104) Viscusi WK, Aldy JE. The value of a statistical life: a critical review of market estimates throughout the world. Journal of risk and uncertainty 2003; 27(1):5-76.
(105) Bollinger B, Leslie P, Sorensen A. Calorie posting in chain restaurants. American Economic Journal: Economic Policy 2011; 3:91-128.
133
(106) Dumanovsky T, Huang CY, Nonas CA, Matte TD, Bassett MT, Silver LD. Changes in energy content of lunchtime purchases from fast food restaurants after introduction of calorie labelling: cross sectional customer surveys. BMJ: British Medical Journal 2011; 343.
(107) Girz L, Polivy J, Herman CP, Lee H. The effects of calorie information on food selection and intake. International Journal of Obesity 2012; 36(10):1340-1345.
(108) US Census Bureau. International Database. 2012. 10-8-2012.