food for everyone - health...
TRANSCRIPT

Food for Everyone
Challenges for LOW-INCOME SENIORS and HOMELESS INDIVIDUALS in San Jose
FOOD ACCESS:
WINTER 2015/16

Infographics by Cesar Ramirez Design and layout by Design Action Collective
Acknowledgements
Tamara Calise, PhD. and Clancey Bateman of John Snow, Inc. conducted a literature review, data collection, surveys, interviews, and focus group for this report.
Brian Fulfrost & Associates collected data and produced the maps used for GIS analysis in this report.
We would like to thank the following individuals and organizations for participating in interviews, contributing data, and providing input for this report:
Swamini Bajpai, Program Director, MidPen Housing
Marilou Cristina, Interim Executive Director, Alzheimer’s Activity Center
Edita Cruz, Executive Director, Martha’s Kitchen
Susan Fent, Division Director of Community Living Services for Santa Clara County, Institute on Aging
Pinki Fung, Senior Wellness Program Coordinator, Asian Americans for Community Involvement
Lydia Guel, Chief of Staff at Office of Councilmember Raul Peralez, City of San Jose District 3
Tracey Gott, San Jose Senior Nutrition Program, Parks, Recreation, and Neighborhood Services
Poncho Guevara, Executive Director, Sacred Heart Community Service
Linda Jones, Program Manager at HomeFirst
Madeline Martin, Marketing & Development Director, Loaves & Fishes
Lori Mathis, Community Programs Manager, Second Harvest Food Bank
Cindy McCown, Vice President of Programs and Services, Second Harvest Food Bank
Jenny Niklaus, Vice President, Innovation Networks, American Leadership Forum Silicon Valley
Jan Pfiffner, Department of Aging and Adult Services, County of Santa Clara
Steven Schmoll, Executive Director, Sourcewise
Paul Tatsuda, Community Transportation Manager, Outreach Mobility Management
Applied Survey Research
Destination:Home
City of San Jose Housing Department
City of San Jose Planning Department
City of San Jose Police Department
Santa Clara County Social Services Agency
Santa Clara Valley Transportation Authority
A special thanks to the following individuals for providing feedback and informing the recommendations in this report:
Aurelia Bailey, Community Services Supervisor, City of San Jose Housing Department
Ray Bramson, Homelessness Response Manager, City of San Jose Housing Department
Abraham Chacko, Program Manager, City of San Jose Parks, Recreation, and Neighborhood Services
Wayne Chen, Division Manager, City of San Jose Housing Department
Kathryn Kaminski, Development Officer, City of San Jose Housing Department
Mary O’Meara, Recreation Supervisor, City of San Jose Parks, Recreation, and Neighborhood Services
Adam Marcus, Policy Manager, City of San Jose Housing Department
Diana Miller, Program Manager, Seniors’ Agenda, County of Santa Clara Department of Aging and Adult Services
Jacky Morales-Ferrand, Director, City of San Jose Housing Department
Brandon Pham, Analyst, County of Santa Clara Department of Aging and Adult Services
Bruno Pillet, Vice President of Programs and Services, Second Harvest Food Bank
Jim Ramoni, Director, County of Santa Clara Department of Aging and Adult Services
Angel Rios, Director, City of San Jose Parks, Recreation, and Neighborhood Services
James Stagi, Housing Policy and Planning Administrator, City of San Jose Housing Department
Suzanne Wolf, Deputy Director, Recreation & Community Services Division, City of San Jose Parks, Recreation, and Neighborhood Services
AnnMarie Zimmermann, Executive Director, Loaves and Fishes Family Kitchen
We thank the City of San Jose Housing Department and the David and Lucile Packard Foundation for generously joining The Health Trust in funding this report.
The following Health Trust Staff contributed to this report:
Co-author: Rachel Horst, Program AssociateCo-author: Rachel Poplack, Director of StrategyFrederick Ferrer, Chief Executive Officer Todd Hansen, Chief Operating OfficerPaul Hepfer, Vice President of ProgramsJennifer Loving, Executive Director of Destination: HomeCara Sansonia, Director of Healthy Aging
Letter from the CEO
A healthier Silicon Valley for everyone.
That’s our vision; what we strive to accomplish. It’s ensuring that health related policies and services exist so that race, language, income and age aren’t barriers to eating affordable, quality, nutritious food.
Sadly, this doesn’t hold true...yet, especially with the most vulnerable populations of our community, low-income seniors and individuals that are homeless. It’s no secret that food insecurity runs rampant among these populations. But what we didn’t know before, we do now:
• Where food assistance resources are relative to these populations
• Where the gaps lay between the resources and the individuals that need them most
• The financial resources required to fill the gaps
This is exactly what Food for Everyone details. It’s a thorough assessment of healthy food access among low-income seniors and individuals that are homeless in San Jose.
The County of Santa Clara and City of San Jose now have an invaluable resource at their disposal. This report allows them to use data to drive informed decision making, while maximizing resources in their efforts to end homelessness and increase food access to seniors. But Food for Everyone is more than just a resource, it’s a call to action. Its imperative that we curb the food insecurities plaguing the most vulnerable among us.
Resolving this plight doesn’t rest solely on the shoulders of our policy makers. It takes all of us working collectively to impact change; change that is attainable as laid out by the findings in the report. As such, we are moving forward with the formation of a Food Access Implementation Task Force. Consisting of City and County officials, and nonprofit partners, this task force will take the lead on ensuring that the findings of this report result in actionable solutions.
As you will read, the findings and recommendations in Food for Everyone present many challenges. But within every challenge, lies opportunity. Access to and consumption of affordable, quality, nutritious food, for everyone. That’s the challenge. Now, let’s seize the opportunity.
Frederick J. Ferrer
Chief Executive Officer
The Health Trust

Contents
Executive Summary ...................................................................................... 1
I. Introduction .............................................................................................. 7
II. Definitions .............................................................................................. 10
III. Methodology ........................................................................................ 11
IV. Individuals that are Homeless ............................................................... 12
Analysis: Access to Food Assistance ������������������������������������������������������������� 12
Analysis: Transportation and Walksheds ������������������������������������������������������� 22
Analysis: The Retail Food Environment ��������������������������������������������������������� 24
Recommendations: Individuals that are Homeless ��������������������������������������� 28
V. Low-Income Seniors ............................................................................... 30
Analysis: Availability of Food Assistance ������������������������������������������������������� 30
Analysis: Transportation and Walksheds ������������������������������������������������������� 38
Analysis: Retail Food Environment ���������������������������������������������������������������� 42
Analysis: Crime and Safety ���������������������������������������������������������������������������� 50
Analysis: Mobility of Low-Income Seniors ����������������������������������������������������� 52
Recommendations: Low-Income Seniors ������������������������������������������������������ 58
Conclusion ................................................................................................. 59
Appendix A. Detailed Methods: Primary Data Collection .......................... 61
Appendix B. Detailed Methods: GIS Mapping ........................................... 62
Appendix C: List of Maps ........................................................................... 64
Appendix D: Food Assistance Programs in San Jose ................................. 74
Appendix E: Organizations Interviewed .................................................... 75

Executive Summary
To have sufficient food access means having “access, at all times, to enough food for an active, healthy life for all household members.”1 In San Jose, a city of both great wealth and great poverty, 30% of all households are living below the self- sufficiency standard, the income level at which an individual or family can afford to meet their basic needs .2
Two groups disproportionately affected by poverty and food insecurity are individuals that are homeless and low- income seniors. According to the 2015 City of San Jose Homeless Census and Survey, on any given night, there are 4,063 individuals that are homeless in San Jose, and 2,810 of them are unsheltered.3 Of adults over 65 in San Jose, 29,755, or 27%, are low -income, meaning they earn less than 200% of the Federal Poverty Level.4 This report analyzes the gaps in healthy food access among these two populations and identifies opportunities to expand and improve food assistance in San Jose.
Individuals that are HomelessThere are over 4,000 individuals in San Jose that are homeless, with over 2,800 individuals unsheltered. For many, securing a consistent and healthy source of food is a daily burden, costing time and resources that could otherwise be spent taking care of their basic needs.
The City’s approach to homelessness recognizes that in addition to housing, providing the full range of supports and services leads to better outcomes for individuals, and to lower public costs. This approach requires close
1 USDA definition. “USDA ERS Food Security in the U.S.” USDA ERS Food Security in the U.S. September 8, 2015. Accessed December 16, 2015. http://www.ers.usda.gov/topics/food nutrition assistance/food security in the-us.aspx.
2 “Healthy Food within Reach: Helping Bay Area Residents Find, Afford, and Choose Healthy Food.” February 2015. Accessed December 16, 2015. www.spur.org
3 Applied Survey Research. “San Jose 2015 Homeless Point-in-Time Census and Survey.” 2015. Accessed December 16, 2015. https://www.sanjoseca.gov/DocumentCenter/View/44727.
4 U.S. Census Bureau; American Community Survey, 2008 2012 5 Year Esti-mates, Table B19037 <http://fact nder2.census.gov>.
coordination between nonprofits, the City, and the County to ensure that individuals, whether chronically homeless or experiencing a period of housing instability, receive the support they need.
This report underlines the importance of making access to healthy food an integral part of this coordinated response to homelessness. Using a variety of methods, including GIS mapping, interviews with providers, Census data, and local data sets, it identifies significant gaps in healthy food access and opportunities for the City and County agencies, The Health Trust, community-based organizations, and other stakeholders to provide services more cost-effectively.
This assessment is intended to be used as a guide on important questions of resource allocation and coordination in the City’s response to homelessness. Since the analysis portion of this assessment was completed, data from the 2015 Homeless Census have become available, showing that the population of homeless individuals has decreased and spread out to areas beyond downtown San Jose. These developments reinforce the following findings:
FINDINGS: • Providers noted that food safety-net resources
are scarce outside of downtown San Jose, and mapping of these sites confirms this. The location and number of homeless safety net providers does not consistently match with where individuals that are homeless are located. There is the strongest alignment of population and resources within downtown. In several Census tracts outside of downtown San Jose, individuals that are homeless have no access to a food safety-net provider.
• Providers expressed that an overall lack of coordination between providers makes it difficult to align resources with the population in areas outside of downtown.

2THE HEALTH TRUST
• Only 14 of 42 food safety-net providers report serving congregate meals, despite the fact that they are the primary source of food for individuals that are homeless. Providers noted that many congregate meal sites are “overwhelmed” with clients that are homeless or living in poverty. If all individuals that are homeless received 1 meal 5 times a week, it would require 20,315 meals. Congregate meal providers serve approximately 8,598 meals per week, leaving a gap of 11,717 meals.
• Not all recently housed individuals have adequate access to food safety-net providers. This report presents opportunities to integrate food into the necessary supports and services provided to recently housed individuals.
• In many parts of San Jose, individuals that are homeless have very low access to transit to and from service providers, shelters, and healthy food retail. Access to public transit-- measured by the number of transit stops within a half-mile of safety-net providers and shelters-- is very low for all but one site outside of the downtown area.
• Many providers noted the need for a “centralized area” that could make it easier for individuals that are homeless to receive various forms of assistance. The maps show that individuals that are homeless in San Jose most likely do not have access to the full range of services they need within walking distance.
• The retail food environment within walking distance of safety-net providers and shelters provides few healthy food options. Measured with the Modified Retail Food Environment Index (mRFEI), the majority of the 42 safety-net provider sites and 44 shelters have moderately low to no healthy food access within walking distance.
RECOMMENDATIONS 1. Integrate food access into City and County
homeless support services.
2. Develop a food assistance protocol to assist those most affected by, or most at risk of nutrition-related chronic conditions.
3. Create a flexible congregate meal system for individuals that are homeless that can move as the population moves.
4. Formalize partnerships with faith-based communities to meet the needs of individuals that are homeless in areas of the city that lack food resources.
5. Explore opportunities to increase and use Senior Nutrition Program funding to better meet the needs of older adults that are homeless.
6. Explore opportunities to increase CalFresh enrollment of individuals that are homeless.
7. Develop infrastructure that supports an ongoing, coordinated solution to the food access needs of individuals that are homeless.
8. Explore opportunities in the existing safety-net infrastructure for cross-population services (e.g., could kitchens at Senior Nutrition Program sites prepare to-go meals for individuals that are homeless).
9. Form partnerships where possible between food safety-net providers and other service providers.
Low-Income SeniorsBuilding healthy communities is one of the central themes of Envision 2040, the City’s General Plan. The document that sets the tone for future planning and development in San Jose recognizes that equitable access to healthy food is an opportunity to promote social cohesion, spur economic development, and contribute to a safer and healthier built environment. By addressing the food access concerns of one of the City’s most vulnerable populations, the City has the opportunity to invest in building stronger, healthier neighborhoods.
This investment is also a timely one; the percentage of residents over 65 in San Jose is expected to more than double by 2060. Planning for the needs of seniors, then, is planning for the City’s future. Currently, there are approximately 29,755 low-income seniors in San Jose, many of whom experience food insecurity. The forms of food assistance available to them include CalFresh/SNAP, Senior Nutrition Program congregate meals, brown bag and food pantry sites, and Meals On Wheels, a home delivered meal service for homebound seniors.

3FOOD FOR EVERYONE
Using GIS mapping, interviews with providers, and analysis of Census data, this assessment identified a number of missed opportunities for investment in the current food assistance environment in San Jose with potential returns for the City, low-income seniors, and their neighborhoods. The findings presented here are intended to guide the City, County, The Health Trust, and other non-profit partners in future decision making on how to allocate limited resources and where to focus their efforts to support the health and well-being of low-income seniors in San Jose.
FINDINGS • The location and number of senior safety-net
providers does not consistently match with where low-income seniors are located. There is the strongest alignment of population and resources within downtown. In several Census tracts outside of downtown San Jose, seniors-- including many with ambulatory difficulty-- have no access to a safety-net provider.
• Twenty-two percent of seniors in San Jose have ambulatory difficulty. Low-income seniors with limited mobility may not be able to travel to reach Senior Nutrition Program congregate meal sites or brown bag sites, especially outside of downtown San Jose, increasing their risk of food insecurity and social isolation.
• Transit access within walking distance of many Senior Nutrition Program congregate meal sites is limited. The lack of transportation may prevent some low-income seniors from attending congregate meals, depriving them of adequate food and nutrition and the opportunity for social interaction.
• The majority of the City’s planned growth areas, where many low-income seniors reside, contain very few healthy food options and an overabundance of unhealthy food outlets and liquor stores, which can encourage unhealthy food choices and serve as potential centers of crime.
• Many of the City’s affordable housing units, of which 22% are “senior units,” are generally located in areas with low access to healthy foods and an overabundance of unhealthy food options.
• The number of seniors served by Meals On Wheels is small compared to the number of low- income seniors with ambulatory difficulty and living alone in San Jose. Both the number and location of seniors with ambulatory difficulty in San Jose strongly suggest that the population in need of delivered meals is currently underserved.
RECOMMENDATIONS1. Identify senior communities, affordable housing
units, and other residential areas with high concentrations of seniors that would benefit from cost-effective solutions such as food drops or mobile produce units.
2. Develop a Senior Nutrition Program outreach strategy to increase participation in communities with high concentrations of low-income seniors and SNP congregate meal sites with the potential to increase capacity.
3. Increase funding for mobile meal services, i.e., Meals On Wheels, for the lowest-income, most vulnerable older adults in San Jose.
4. Explore innovative solutions to allow low-income seniors to access food resources in the community (e.g., restaurant vouchers, grocery delivery service).
5. Incentivize healthy food retail in the City’s planned growth areas.
6. Explore opportunities in the existing safety-net infrastructure for cross-population services (e.g., could kitchens at Senior Nutrition Program sites prepare to-go meals for individuals that are homeless).
7. Explore opportunities to increase CalFresh enrollment of low-income seniors.
8. Form partnerships where possible between food safety-net providers and other service providers.

4THE HEALTH TRUST

5FOOD FOR EVERYONE

7FOOD FOR EVERYONE
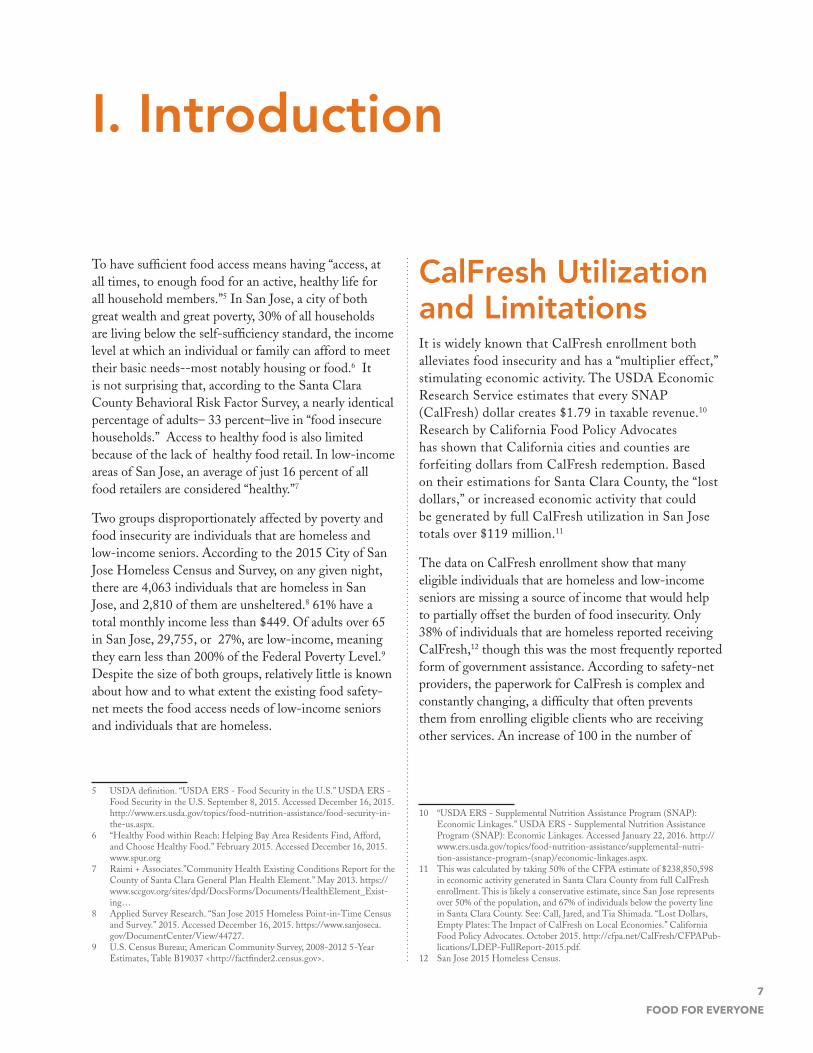
To have sufficient food access means having “access, at all times, to enough food for an active, healthy life for all household members.”5 In San Jose, a city of both great wealth and great poverty, 30% of all households are living below the self-sufficiency standard, the income level at which an individual or family can afford to meet their basic needs--most notably housing or food.6 It is not surprising that, according to the Santa Clara County Behavioral Risk Factor Survey, a nearly identical percentage of adults– 33 percent–live in “food insecure households.” Access to healthy food is also limited because of the lack of healthy food retail. In low-income areas of San Jose, an average of just 16 percent of all food retailers are considered “healthy.”7
Two groups disproportionately affected by poverty and food insecurity are individuals that are homeless and low-income seniors. According to the 2015 City of San Jose Homeless Census and Survey, on any given night, there are 4,063 individuals that are homeless in San Jose, and 2,810 of them are unsheltered.8 61% have a total monthly income less than $449. Of adults over 65 in San Jose, 29,755, or 27%, are low-income, meaning they earn less than 200% of the Federal Poverty Level.9 Despite the size of both groups, relatively little is known about how and to what extent the existing food safety-net meets the food access needs of low-income seniors and individuals that are homeless.
5 USDA definition. “USDA ERS - Food Security in the U.S.” USDA ERS - Food Security in the U.S. September 8, 2015. Accessed December 16, 2015. http://www.ers.usda.gov/topics/food-nutrition-assistance/food-security-in-the-us.aspx.
6 “Healthy Food within Reach: Helping Bay Area Residents Find, Afford, and Choose Healthy Food.” February 2015. Accessed December 16, 2015. www.spur.org
7 Raimi + Associates.”Community Health Existing Conditions Report for the County of Santa Clara General Plan Health Element.” May 2013. https://www.sccgov.org/sites/dpd/DocsForms/Documents/HealthElement_Exist-ing…
8 Applied Survey Research. “San Jose 2015 Homeless Point-in-Time Census and Survey.” 2015. Accessed December 16, 2015. https://www.sanjoseca.gov/DocumentCenter/View/44727.
9 U.S. Census Bureau; American Community Survey, 2008-2012 5-Year Estimates, Table B19037 <http://factfinder2.census.gov>.
CalFresh Utilization and LimitationsIt is widely known that CalFresh enrollment both alleviates food insecurity and has a “multiplier effect,” stimulating economic activity. The USDA Economic Research Service estimates that every SNAP (CalFresh) dollar creates $1.79 in taxable revenue.10 Research by California Food Policy Advocates has shown that California cities and counties are forfeiting dollars from CalFresh redemption. Based on their estimations for Santa Clara County, the “lost dollars,” or increased economic activity that could be generated by full CalFresh utilization in San Jose totals over $119 million.11
The data on CalFresh enrollment show that many eligible individuals that are homeless and low-income seniors are missing a source of income that would help to partially offset the burden of food insecurity. Only 38% of individuals that are homeless reported receiving CalFresh,12 though this was the most frequently reported form of government assistance. According to safety-net providers, the paperwork for CalFresh is complex and constantly changing, a difficulty that often prevents them from enrolling eligible clients who are receiving other services. An increase of 100 in the number of
10 “USDA ERS - Supplemental Nutrition Assistance Program (SNAP): Economic Linkages.” USDA ERS - Supplemental Nutrition Assistance Program (SNAP): Economic Linkages. Accessed January 22, 2016. http://www.ers.usda.gov/topics/food-nutrition-assistance/supplemental-nutri-tion-assistance-program-(snap)/economic-linkages.aspx.
11 This was calculated by taking 50% of the CFPA estimate of $238,850,598 in economic activity generated in Santa Clara County from full CalFresh enrollment. This is likely a conservative estimate, since San Jose represents over 50% of the population, and 67% of individuals below the poverty line in Santa Clara County. See: Call, Jared, and Tia Shimada. “Lost Dollars, Empty Plates: The Impact of CalFresh on Local Economies.” California Food Policy Advocates. October 2015. http://cfpa.net/CalFresh/CFPAPub-lications/LDEP-FullReport-2015.pdf.
12 San Jose 2015 Homeless Census.
I. Introduction

8THE HEALTH TRUST
individuals that are homeless receiving CalFresh would total approximately $228,000 in benefits, leading to $408,120 in additional economic activity in San Jose.13
A major barrier to low-income seniors’ access to CalFresh is an administrative one, as beneficiaries of SSI (Supplemental Security Income) are not eligible for CalFresh benefits. Even with the possibility that some may not qualify for CalFresh, the estimated gap in senior CalFresh enrollment in San Jose is large, at approximately 6,400 individuals. If just 1,000 additional seniors receive CalFresh benefits, totalling approximately $1.87 million in benefits, it could result in an increase of $3.35 million in economic activity in San Jose.14
While CalFresh benefits have a positive effect on the local economy, and its recipients may rely less on the food safety net, the CalFresh benefit on its own is insufficient to eliminate food insecurity. At approximately $190 per month, CalFresh benefits for individuals that are homeless leave recipients cutting corners or relying on safety-net providers to make it through the month. For the small number of seniors who receive CalFresh, the average benefit is $156, an amount that also does not adequately cover expenses for healthy food.15
This may explain in part why the most frequently utilized service by individuals that are homeless is “free meals,” at 66%.16 Likewise, low-income and disabled seniors are driven to rely on community and home-based food assistance services to meet their basic food security needs. As CalFresh is only part of the solution to healthy food access among low-income seniors and individuals that are homeless, the focus in much of this assessment is on City-, County-, and nonprofit-run safety-net providers and the services they provide.
13 This was calculated using the reported $190 per month in CalFresh benefits received by individuals that are homeless and the USDA dollar conversion on page 7. The estimated monthly benefit is from the focus group with individuals that are homeless and “Frequently Asked Questions.” CalFresh. Accessed February 05, 2016. http://www.calfresh.ca.gov/pg846.htm.
14 This calculation is based on estimates found in the Management Audit of the Santa Clara County Senior Nutrition Program. This was done by taking 50% of the estimate (12,800 seniors), since San Jose represents over 50% of the population, as 67% of individuals below the poverty line in Santa Clara County. See: Management Audit Division of the Board of Supervisors. “Management Audit of the Santa Clara County Senior Nutrition Program.” August 29, 2014. Accessed December 16, 2015. https://www.sccgov.org/sites/bos/Management
15 Management Audit Division of the Board of Supervisors. “Management Audit of the Santa Clara County Senior Nutrition Program.” August 29, 2014. Accessed December 16, 2015. https://www.sccgov.org/sites/bos/Man-agement
16 2015 City of San Jose Homeless Census.
Food Access and Health The health implications of food insecurity among individuals that are homeless and low-income seniors deserve particular attention, not the least because of the high costs associated with treating diseases related to nutritional intake. Previous research has found an association between “food insufficiency and increased acute health services utilization”17 among individuals that are homeless. Some of the most common and costliest medical conditions of individuals that are homeless can be traced to diet. A recent study on the cost of homelessness in Santa Clara County found that blood disease--most often anemia — at an average annual cost of $25,924, was the second-costliest medical diagnosis in 2011-2012, with the largest increase in cost ($1,850) over the six-year period under study.18
Similarly, many seniors suffer from multiple chronic conditions that directly relate to food access and often translate into high health costs. Chronic conditions are the leading cause of death among adults over 65, with heart disease, cancer, stroke, and diabetes accounting for almost two-thirds of all deaths in the United States.19 National data from the Department of Health and Human Services show that two-thirds of Medicare recipients have multiple chronic conditions,20 with hospitalizations lasting longer and costing nearly 20% more than for hospitalizations of adults without them. Most (County) Senior Nutrition Program participants have chronic diseases related to diet.21
17 Baggett, Travis P., Daniel E. Singer, Sowmya R. Rao, James J. O’Con-nell, Monica Bharel, and Nancy A. Rigotti. “Food Insufficiency and Health Services Utilization in a National Sample of Homeless Adults.” J GEN INTERN MED Journal of General Internal Medicine, 2011, 627-34. Accessed December 16, 2015. http://www.ncbi.nlm.nih.gov/pubmed/21279455.
18 Flaming, Daniel, Halil Toros, and Patrick Burns. “Home Not Found: The Cost of Homelessness in Silicon Valley.” 2015. Accessed December 16, 2015. http://destinationhomescc.org/wp-content/uploads/2015/05/er_hom-enotfound_report_6.pdf.
19 “Healthy Aging Facts - NCOA.” NCOA. June 3, 2015. Accessed December 16, 2015. https://www.ncoa.org/news/resources-for-reporters/get-the-facts/healthy-aging-facts/.
20 Steiner, Claudia A., M.D., Marguerite L. Barrett, M.S., Audrey J. Weiss, Ph.D., and Roxanne M. Andrews, Ph.D. “Trends and Projections in Hospital Stays for Adults With Multiple Chronic Conditions, 2003–2014.” Healthcare Cost and Utilization Project. November 2014. http://www.hcup-us.ahrq.gov/reports/statbriefs/sb183-Hospitalizations-Multi-ple-Chronic-Conditions-Projections-2014.pdf.
21 Management Audit Division of the Board of Supervisors. “Management Audit of the Santa Clara County Senior Nutrition Program.” August 29, 2014. Accessed December 16, 2015. https://www.sccgov.org/sites/bos/Man-agement Audit/Documents/Senior-Nutrition-Program_FullReport.pdf.

9FOOD FOR EVERYONE
Although individuals that are homeless and low-income seniors in the City are exceptionally vulnerable to food insecurity, and their food insecurity has a significant, costly, negative impact on their health, there is much less known about food access resources and barriers among these groups than other populations. The data in this assessment provide a starting point for determining how, and in what locations, the City can strategically improve access to healthy food with the greatest benefit for individuals that are homeless, low-income seniors, and their neighborhoods.
Why a food access assessment?Commissioned by the City of San Jose Housing Department, the analysis here is intended to provide data-driven guidance to the City in its response to homelessness and to a rapidly growing senior population.
There is an urgency in identifying and responding to the unmet food assistance needs of these two populations. It is imperative that healthy food access be an integral part of the response to homelessness, so that the over 4,000 individuals affected in San Jose are helped, not hindered, in achieving permanent stability. At the same time, San Jose is experiencing a major demographic shift, with the population of adults 65 and over expected to grow from 11% to 12% by 2060. Identifying the gaps in service provision for older adults could lay the foundation for a systematic approach to the nutritional and health needs of an aging population in the decades to come.
Increasing access to healthy food for low-income seniors and individuals that are homeless are smart investments in the future, both for the populations in question and the City’s development. The findings and recommendations here complement the City’s overall strategy to build more vibrant, healthier neighborhoods, as outlined in the landmark general plan, Envision 2040. Acting on the data now is the cost-effective alternative to allowing present trends to continue and neighborhoods to miss opportunities for greater social cohesion, economic opportunity, and an improved built environment.
The publication of this assessment will be followed by a Food Access Implementation Plan to address the food access needs of these two populations as an integrated effort across City and County agencies, The Health Trust, community-based organizations, and other stakeholders.
Layout of reportA list of definitions of frequently used terms in this report is provided in the next section, followed by a discussion of methodology. The main analysis contains a series of maps, analyzed together with qualitative and quantitative data from interviews and research on the determinants of food access. Findings on individuals that are homeless and low-income seniors are discussed separately, and each section concludes with recommendations. Additional maps showing the locations of all food safety-net providers can be found in Appendix C.

10THE HEALTH TRUST
II. Definitions
Food security is a state when all people, at all times, have physical, social and economic access to sufficient, safe and nutritious food that meets their dietary needs and food preferences for an active and healthy life.
Homeless. An unsheltered homeless person resides in a place not meant for human habitation, such as cars, parks, sidewalks, or abandoned buildings (on the street). A sheltered homeless person resides in an emergency shelter, transitional housing, or supportive housing for homeless persons who originally came from the streets or emergency shelters. For the purposes of this assessment, we also refer to “recently housed” individuals that may be considered sheltered.
Low-income seniors. Low-income seniors were defined as those 65 years or over living at 200% or below the Federal Poverty Level.
Safety-net providers. Providers of meals (hot or cold) or grocery programs, free of charge to individuals in need of food. Program types may include: congregate meals, food pantry/grocery/brown bag programs, Meals On Wheels, and informal feeding groups.
The figure below displays the safety-net food environ-ment in San Jose for both groups by program type.
Modified Retail Food Environment Index (mRFEI). The mRFEI analyzes the number of healthy and less healthy food retailers within a given geographic area. the mRFEI examines food stores within a half-mile of each census block and measures the percentage of healthy food stores out of all (healthy and unhealthy) food stores. The mRFEI defines “healthy” food retailers as food co-ops, fruit and vegetable markets, chain grocery stores, ethnic and independent grocery stores (including small stores), and warehouse club stores. These stores are considered healthy because they primarily offer healthy products or a mix of products that could meet the nutritional needs of a family. “Unhealthy” food retailers are defined as fast food restaurants (including pizza and sandwich stores), convenience stores, and liquor stores. These stores are classified as unhealthy because they have very limited or no healthy menu options. The mRFEI score is calculated for a designated geographic area as follows: mRFEI = (healthy retailers)/(healthy retailers+unhealthy retailers)

11FOOD FOR EVERYONE
OVERVIEWMultiple methods were used to assess the food environment in San Jose, including primary data collection, GIS analysis, and a literature review.
DATA COLLECTIONPrimary data collection for this assessment included interviews and surveys with food assistance providers and a focus group with individuals that are homeless. For greater detail on methods and interviews, please see Appendix A.
LITERATURE REVIEW A literature review on food access was conducted and informed the structure of the analysis, which is built around six main factors affecting food access (see figure to the right):
1. Socioeconomic factors: high cost of living, cost of food, location of services, and competing financial priorities.
2. Food assistance: type, location, capacity, and service of safety-net providers.
3. Transportation: availability and accessibility of public transportation, and access within walking distance.
4. Retail food environment: type of food stores, locations, CalFresh/SNAP-eligibility, and healthy versus unhealthy foods (based on mRFEI- Modified Retail Food Index)
5. Crime and safety: gang hot-spots.
6. Health conditions: mental and physical health.
GIS ANALYSISThe spatial analysis of data on the food safety-net and target populations in San Jose was conducted using Geographic Information Systems (GIS). The maps created for this report aim to synthesize data on the location of safety-net providers relative to both populations with detailed information to evaluate their capacity and accessibility. Census data on both populations were used to identify potential areas of high need and disparities in food access. These were combined with network analysis to evaluate transit accessibility to safety-net providers and healthy food retail. Data on gang hot-spots were used as a proxy for neighborhood safety to identify barriers to healthy food or safety-net access. Finally, data on health conditions of homeless individuals and low-income seniors were incorporated to identify potential needs within both populations and evaluate the ability of existing food assistance to address them.
For a detailed discussion of the methods used for GIS analysis, please see Appendix B.
A list of all maps in this assessment is in Appendix C.
III. Methodology

12THE HEALTH TRUST
IV. Individuals that are Homeless
OVERVIEW The maps in this section provide a visual overview of the food assistance landscape for individuals that are homeless in San Jose. The accompanying analysis identifies potential areas of unmet need. Downtown San Jose appears as a service hub, with concentrations of both safety-net providers and individuals that are homeless. In several pockets outside of downtown, on the other hand, there are significant gaps in access to food assistance and other services. Focusing on these gaps in access would enhance the City’s response to homelessness in these areas of San Jose, with potentially more individuals able to achieve stability and lower long-term public costs related to persistent homelessness.
The analysis in this report is based on figures from the 2013 San Jose Homeless Census. Data from the 2015 Homeless Census have recently become available.
Maps with the 2013 data showed that most individuals that are homeless were located in Census tracts immediately in and around downtown San Jose; 2015 data reflect a population spread out over a larger area to the north and south. This new dataset shows that the total population of individuals that are homeless decreased by 15%, from 4,770 in 2013 to 4,063 in 2015.
The 2015 data reinforce the importance of the main finding based on the 2013 Homeless Census: individuals that are homeless in and around downtown San Jose may have adequate access to the necessary safety-net providers and services, but access to food in other parts of the city is very limited.
Analysis: Access to Food Assistance

13FOOD FOR EVERYONE
Source: San Jose 2015 Homeless Point-in-Time Census and Survey.” 2015. https://www.sanjoseca.gov/DocumentCenter/View/44727

IND
IVID
UA
LS T
HAT
ARE
HO
MEL
ESS
14THE HEALTH TRUST
LOCATIONS OF FOOD SAFETY-NET PROVIDERS AND INDIVIDUALS THAT ARE HOMELESSThe adjacent map shows the distribution of homeless food safety-net providers in San Jose and the location of individuals that are homeless. Immediately visible is the concentration of safety-net providers in the downtown area of the city.
The map includes both congregate meal sites and brown bag or food pantry meal sites, in addition to shelter locations and informal feeding sites. These various types of food assistance are provided by community-based organizations, faith-based organizations, or City-, County-, and state-sponsored public programs.
• Congregate meal programs, an alternative that requires no food storage or preparation, are a primary source of food for individuals that are homeless. There are 14 of these sites in San Jose.
• Brown bag and food pantry programs run and supported by Second Harvest Food Bank are located at numerous sites throughout the city.221 There are 29 brown bag/food pantry sites in San Jose.
22 Several of the brown bag and food pantry sites labeled as homeless providers are also featured in the maps on low-income seniors, as these sites serve both populations.
• Other alternatives include informal feeding groups and outreach programs or shelters. There are 44 shelters in San Jose. There are currently 4 informal feeding groups.
The map also shows the number of individuals that are homeless in San Jose by Census tract. There are several Census tracts outside of downtown that have a significant number of individuals that are homeless; there is a notable lack of providers in and around them. For more information on the safety-net providers in this assessment, please see Appendix D.
ARE FOOD SAFETY-NET PROVIDERS LOCATED WHERE INDIVIDUALS THAT ARE HOMELESS ARE LOCATED?
Individuals that are homeless in downtown San Jose are likely to have sufficient access to food
safety-net providers. Many individuals that are homeless outside of the downtown core do not
have access to a food safety-net provider.
The highest concentration of providers is in
downtown San Jose.

IND
IVIDU
ALS TH
AT ARE H
OM
ELESS
15FOOD FOR EVERYONE

IND
IVID
UA
LS T
HAT
ARE
HO
MEL
ESS
16THE HEALTH TRUST
AREAS OF UNMET NEED FOR FOOD ASSISTANCEAreas of unmet need for food assistance are highlighted in the adjacent map (in red), along with the locations of safety-net providers, shelters, and informal feeding group sites.
Not all tracts in red indicate a lack of access. Unmet need is calculated here by the ratio of safety-net providers to individuals that are homeless in each Census tract. If there is a provider in an adjacent tract, individuals may travel the short distance from their Census tract to that provider. Census tracts in red that are not located near a provider are examples of areas with the greatest need for additional resources.
These include Census tracts located in south San Jose, east of Highway 101, and in a cluster between Highway 87 and Highway 101.
The data on barriers to food access among individuals that are homeless, including location, capacity, and hours of operation of food safety-net providers, can help to inform smarter and more strategic investment in new or existing food safety-net sites. Investing in
food assistance in the resource-poor areas identified here means that safety-net providers can reach more individuals experiencing temporary homelessness and food insecurity and reduce the possibility of falling into chronic homelessness. Making healthy food access consistently available can also decrease the risk of hospitalization for nutrition-related diseases, and the costs associated with them.
WHICH AREAS ARE MOST IN NEED OF ADDITIONAL FOOD RESOURCES?
Many Census tracts have significant unmet need for food safety-net providers. Areas in red— most
notably, south of Highway 280 between Highways 87 and 101 and east of Highway 101— have the
highest areas of unmet need.
{ }“There are people that spend their whole week - they know exactly which day food is distributed at different sites and what are the restrictions at each site...They spend a lot of time doing that and not doing anything else to increase their self-sufficiency or stability.”
-Homeless Safety-Net Provider

IND
IVIDU
ALS TH
AT ARE H
OM
ELESS
17FOOD FOR EVERYONE

IND
IVID
UA
LS T
HAT
ARE
HO
MEL
ESS
18THE HEALTH TRUST
CONGREGATE MEAL SITE LOCATION AND CAPACITYCongregate meal sites are the primary source of food for individuals that are homeless. The adjacent map shows these sites, along with the estimated number of individuals served weekly. As the maps show, these sites are primarily concentrated in the downtown area, with two large providers south of Highway 280 and east of Highway 87. Larger-sized dots on the map signify a higher number served weekly.
It is clear from the previous maps that individuals may travel to adjacent tracts to access some type of food assistance, including brown bag and food pantry sites. With so few congregate meal sites (and no providers south of Capitol Expressway), there may be hundreds of individuals that are homeless without access to a congregate meal. This includes individuals over large areas such as south San Jose, east of Highways 87 and 101, which has no congregate meal providers.
If all individuals that are homeless received one meal five times a week, it would require 20,315 meals. Currently, congregate meal providers serve approximately 8,598 meals per week, leaving a gap of 11,717 meals. Expanding capacity is necessary to increasing healthy
food access, but it will not suffice to meet the food access needs of all individuals that are homeless. Additional sites located in areas where there are currently no congregate meal providers are another part of the solution to this gap in congregate meal access.
Expanding the hours of operation of congregate meal sites may be another part of making congregate meals accessible to more individuals that are homeless. Focus group participants noted that most safety-net providers are often only open during regular business hours on weekdays, making it difficult for many individuals to access food in the evenings or on weekends. Currently, only 5 congregate meal sites reported being open 7 days a week.
It should be noted that in addition to the congregate meal sites listed here, seniors that are homeless may attend Senior Nutrition Program congregate meal sites. SNP sites are not featured on this map because there is no evidence that significant numbers of individuals that are homeless are attending SNP congregate meals. Senior Nutrition Program congregate meal sites are nevertheless relevant to this section as an untapped resource and a potential part of the solution to expanding congregate meal services for seniors that are homeless.222324
22 23 24 This calculation assumes one meal per individual. The gap was calculated as
the number of meals required for all individuals that are homeless receiving one meal, five times a week, minus the sum of individuals served by each congregate meal provider on a weekly basis.
ARE THERE SUFFICIENT CONGREGATE MEALS ACCESSIBLE TO INDIVIDUALS THAT ARE HOMELESS?
Congregate meals are a primary source of food for individuals that are homeless, due to lack of storage or equipment to
prepare food. If all individuals that are homeless received one congregate meal per day, five days a week, it would require
20,315 meals—making a current “meal gap” of 11,717.24 Since most congregate meal sites are located in downtown San
Jose, increasing the capacity of existing sites is not enough to close the gap in congregate meal access.
{ }“Homeless individuals rely more on congregate meals because they do not have the equipment or ability to store or transport the food they receive from brown bag programs…food that is not consumed in a day or two is often dumped or sold.”
-Homeless Safety-Net Provider

IND
IVIDU
ALS TH
AT ARE H
OM
ELESS
19FOOD FOR EVERYONE

IND
IVID
UA
LS T
HAT
ARE
HO
MEL
ESS
20THE HEALTH TRUST
RECENTLY HOUSED INDIVIDUALSThe adjacent map shows the location of individuals recently rehoused through the Housing 1000 campaign.25 [These ratios are presented by ZIP code, rather than by Census tract.] Two areas with moderate gaps in access are in west San Jose, surrounding Highways 280 and 85.26 Given the importance of access to supports and services for recently housed individuals, these areas should be examined further for opportunities to guarantee access to food assistance. The estimated cost of providing one congregate meal per day, five days a week to 1,000 recently housed individuals is $520,000.27
25 “Our Work Destination: Home.” Destination Home. 2015. http://destinationhomescc.org/our-work/26 ZIP codes with more than 50 recently housed individuals and no safety-net providers were considered to have a high ratio. ZIP codes with more than 20 recently
housed individuals and no safety-net providers were considered to have a moderate ratio. ZIP codes with either between 20 and 50 recently housed individuals and 1 safety-net provider or between 50 and 100 recently housed individuals and 2 safety-net providers were considered to have a low ratio. ZIP codes with fewer than 20 recently housed individ¬¬uals with no safety-net providers were considered to have a very low ratio for the purposes of this analysis. ZIP codes with no recently individuals were considered to have “sufficient resources.”
27 This calculation contains only the cost per meal ($2), and does not reflect additional costs associated with expanding food assistance.
DO RECENTLY HOUSED INDIVIDUALS HAVE ADEQUATE ACCESS TO FOOD SAFETY-NET PROVIDERS?
{ }“Whether newly housed or still on the streets, food and the lack thereof is a common thread for the thousands of vulnerable men, women, and children who are struggling daily in our community. We owe it to them to make food a robust part of our crisis response system-- and once housed, we should be equally committed to housing and supportive services, including nutritious food, as this allows for recovery, stability and wellness.”
- Jennifer Loving, Executive Director of Destination: Home
There are gaps in access to safety-net providers among recently housed individuals. The areas
shown in orange, surrounding Highways 280 and 85, have the greatest number of recently housed
individuals without adequate access to food safety-net providers.

IND
IVIDU
ALS TH
AT ARE H
OM
ELESS
21FOOD FOR EVERYONE

IND
IVID
UA
LS T
HAT
ARE
HO
MEL
ESS
22THE HEALTH TRUST
Analysis: Transportation and Walksheds
OVERVIEWIn focus group interviews with individuals that are homeless, transportation was cited as a common barrier to food access, with high costs in both money and time. Providers also reported that limited public transportation options contribute to the extensive amount of time people spend traveling for food.
This analysis evaluates the accessibility of food assistance for individuals travelling to safety-net providers and shelters using public transit. Transit accessibility of safety-net providers and shelters varies considerably. The main finding here is that many individuals that are homeless may not have ready access to the full range of services they need because of the difficulty of getting from one point to another.
TRANSIT ACCESSIBILITYTransit accessibility was calculated by the number of transit stops within walking distance, defined in this analysis as a half-mile. In many parts of San Jose, individuals that are homeless have very low access to
transit to and from safety-net providers and shelters.
On the adjacent map showing transit access around safety-net providers, this can be seen in the red-colored points, each representing a safety-net provider with very few transit stops (1-10). As the map shows, public transit around most safety-net providers is plentiful in downtown San Jose, while many providers located in areas north and south of the downtown core have very low access to public transit. Relatively isolated sites, such as those in south San Jose, have the least public transit access. Transit access around shelters follows a similar pattern, with even fewer transit stops for shelters outside of downtown [see Appendix C for the map of transit access around homeless shelters].
It should be noted that transit measured by the number of stops may not fully capture a site’s accessibility. For example, the quantity of stops may have less significance for sites located near important transfer points in the transit network. For the majority of sites, however, transit stops serve as a sufficient proxy, offering a consistent way to compare a site’s relative connectivity to different points in the city.
ARE FOOD SAFETY-NET PROVIDERS ACCESSIBLE VIA PUBLIC TRANSIT?

IND
IVIDU
ALS TH
AT ARE H
OM
ELESS
23FOOD FOR EVERYONE

IND
IVID
UA
LS T
HAT
ARE
HO
MEL
ESS
24THE HEALTH TRUST
Analysis: The Retail Food Environment
OVERVIEWIn addition to access to safety-net providers, this assessment attempts to evaluate the quality of the retail food environment in and around providers and shelters. This is done in two ways: through the Modified Retail Food Environment Index, or mRFEI28 within walking distance of safety-net providers and shelters, and walking access to SNAP/Calfresh retailers from shelters.
Prior research has shown that in low-income areas of San Jose, on average 84% of food retailers are considered “unhealthy” by the mRFEI.29 This goes hand in hand with the presence of retailers accepting SNAP/CalFresh. Retailers accepting SNAP/CalFresh in areas where there is low access to healthy food retail (a low mRFEI score) are likely to be small markets or convenience stores with few healthy food options.
28 The modified Retail Food Environment index (mRFEI) provides a ratio for the number of healthy food retailers (e.g., supermarkets, gardens farmer’s markets, and community-supported agriculture) compared to the number of less healthy food retailers (e.g., fast food restaurants, small grocery stores, and convenience stores).
29 Raimi + Associates. “Community Health Existing Conditions Report for the County of Santa Clara General Plan Health Element.” May 2013. https://www.sccgov.org/sites/dpd/DocsForms/Documents/HealthElement_ Existing_Health_Conditions_FINAL_May_2013.pdf.
RETAIL FOOD ENVIRONMENT AROUND SHELTERSThe retail food environment in the half-mile walkshed around safety-net providers tends to reflect poor access to healthy food, though some shelters are located in comparatively better retail food environments than other safety-net providers. Walksheds around eight of 44 shelters have mRFEI scores higher than 25%, indicating moderately high healthy food access (see page 26 for definition), while those around all but three of 42 homeless safety-net providers have scores of 25% or lower, indicating moderately low to no access to healthy food. [See Appendix C for map of mRFEI around safety-net providers] These findings, combined with the data on SNAP/CalFresh retailers in these half-mile walksheds on the following page, show that individuals that are homeless and receiving CalFresh have greater access to unhealthy foods— where there is any retail food access at all.
IS HEALTHY FOOD AVAILABLE FOR PURCHASE AROUND SHELTERS?

IND
IVIDU
ALS TH
AT ARE H
OM
ELESS
25FOOD FOR EVERYONE

IND
IVID
UA
LS T
HAT
ARE
HO
MEL
ESS
26THE HEALTH TRUST
RETAILERS ACCEPTING SNAP/CALFRESH AROUND SHELTERSThe adjacent map shows that shelters downtown have the most retailers accepting SNAP/CalFresh within walking distance, which reflects the higher number of food retailers in general. Shelters on the City’s periphery appear to have little access to any kind of food retail; these generally have access to 2 or fewer vendors accepting SNAP/CalFresh.
ARE THERE RETAILERS ACCEPTING SNAP/CALFRESH AROUND SHELTERS?
Shelters in the downtown core have the largest concentration of retailers accepting SNAP/
CalFresh. Areas in south San Jose have low access to healthy food, but also lack access to SNAP/
CalFresh retailers.

IND
IVIDU
ALS TH
AT ARE H
OM
ELESS
27FOOD FOR EVERYONE

IND
IVID
UA
LS T
HAT
ARE
HO
MEL
ESS
28THE HEALTH TRUST
RECOMMENDATIONS INDIVIDUALS THAT ARE HOMELESS
1. Integrate food access into City and County homeless support services.
2. Develop a food assistance protocol to assist those most affected by, or most at risk of nutrition-related chronic conditions.
3. Create a flexible and mobile congregate meal system for individuals that are homeless that moves as the population moves.
4. Formalize partnerships with faith-based communities to meet the needs of individuals that are homeless in areas of the city that lack food resources.
5. Explore opportunities to increase and use Senior Nutrition Program funding to better meet the needs of older adults that are homeless.
6. Explore opportunities to increase CalFresh enrollment of individuals that are homeless.
7. Develop infrastructure that supports an ongoing, coordinated solution to the food access needs of individuals that are homeless.
8. Explore opportunities in the existing safety-net infrastructure for cross-population services (e.g., could kitchens at Senior Nutrition Program sites prepare to-go meals for individuals that are homeless).
9. Form partnerships where possible between food safety-net providers and other service providers.
{ }“Individuals that are homeless and low-income seniors are some of the City’s lowest-income residents, and those most struggling with food insecurity. As a community, we need to work smarter together to target the areas of high need and to find creative ways to overcome the barriers that many face on a daily basis.”
- Kathy Jackson, CEO of Second Harvest Food Bank


LOW
-INCO
ME
SEN
IORS
30THE HEALTH TRUST
V. Low-Income Seniors
OVERVIEWThere are 29,755 seniors in San Jose that are low-income, earning less than 200% of the federal poverty threshold. At 27% of the senior population, this is a large group but a likely under-estimate of the number of seniors who may experience food insecurity. Unlike the Elder Index,30 which measures poverty based on the costs of living at the county level, the U.S. Census sets the poverty threshold at the same level for the 48 contiguous states. It can be assumed that a significant portion of seniors in San Jose have incomes that are far lower than what is needed to consistently afford healthy food.
30 See “Hidden Poor by Age.” UCLA Center for Health Policy Research. August 2015. http://healthpolicy.ucla.edu/programs/health-disparities/elder-health/Pages/hidden-poor-by-age.aspx.
In addition to struggling to afford sufficient food, seniors are also more likely to have health problems that impact their ability to shop for and prepare food. For example, 22% of seniors in San Jose have ambulatory difficulty, a disability defined as “serious difficulty walking or climbing stairs,” and 19% have independent living difficulty, a disability defined as “difficulty doing errands alone.” Lower incomes are also associated with having a disability. While it is unknown exactly what percentage of seniors with a disability are low-income, Census data show that 5,000 seniors in San Jose have a disability and are living in poverty [less than 100% FPL].31
31 U.S. Census Bureau; American Community Survey, 2008-2012 5-Year Estimates, Tables B18105, B18107 and C18130 <http://factfinder2.census.gov>.
Analysis: Availability of Food Assistance

LOW
-INCO
ME SEN
IORS
31FOOD FOR EVERYONE
The Senior Nutrition Program, consisting of congregate meals and a home-delivered meal service, is intended to fill the gaps in healthy food access exacerbated by low incomes or disability. As a community resource, the Senior Nutrition Program has the potential to generate benefits beyond the food itself. For many seniors, attending a meal at one of the City or County Senior Nutrition Program sites is both a source of healthy food and a chance for vital social interaction. Senior meal programs are a helpful tool to get seniors to leave their homes and access secondary support services they may otherwise avoid. The Senior Nutrition Program also promotes community cohesion, a building block of strong neighborhoods. Yet for many low-income seniors, in particular in neighborhoods on the east and west sides of the City, access to Senior Nutrition Program congregate meal sites appears limited.
Particularly underserved areas for congregate meals include:
• East San Jose, south of Story Road and east of Highway 101 to Yerba Buena Road. A single provider (Evergreen Community Center), a Senior Nutrition Program site budgeted to serve 415 meals per week (83/day), is located in the entire area.There is one provider south of Curtner Avenue serving 135 meals weekly; the area contains over 2,000 low-income seniors.
• West San Jose, west of Highway 87 and on both sides of Highway 85. There is no congregate meal site from Curtner Avenue in the north to Camden Avenue in the south. The Almaden Community Center is located on Camden Avenue and is budgeted to serve just 245 meals weekly (49/day). This area includes over 1,000 low-income seniors on either side of Almaden Expressway and along Highway 85.
Many seniors also rely on brown bag or food pantry programs as sources of food. Access to brown bag sites also appears insufficient in these same areas, as most sites are located near or in addition to congregate meal sites.
Particularly underserved areas areas for brown bag-food pantry programs include:
• West San Jose, west of Highway 17 surrounding Valley Medical Center, and south of Curtner Avenue west of Highway 87. The area north of Curtner Avenue has no brown bag or food pantry providers. The two closest providers serve 235 and 149 seniors weekly (47 and 30/day), respectively; the area contains over 2,000 low-income seniors. South of Curtner Avenue is one provider serving 135 seniors weekly; the area contains over 2,000 low-income seniors.
• South San Jose, between Highway 87 and Highway 101 and south of Branham Lane. The closest provider serves 262 seniors weekly (52/day); the area contains over 1,500 low-income seniors.
• East San Jose, south of Story Road and east of Highway 101. There are over 3,000 low-income seniors in this area. The two closest providers serve 483 and 262 low-income seniors weekly (97 and 52/day), respectively.
In addition to these gaps in access, the number of seniors with ambulatory difficulty in San Jose strongly indicates unmet need among low-income seniors who may be best served by home-delivered meals.

LOW
-INCO
ME
SEN
IORS
32THE HEALTH TRUST
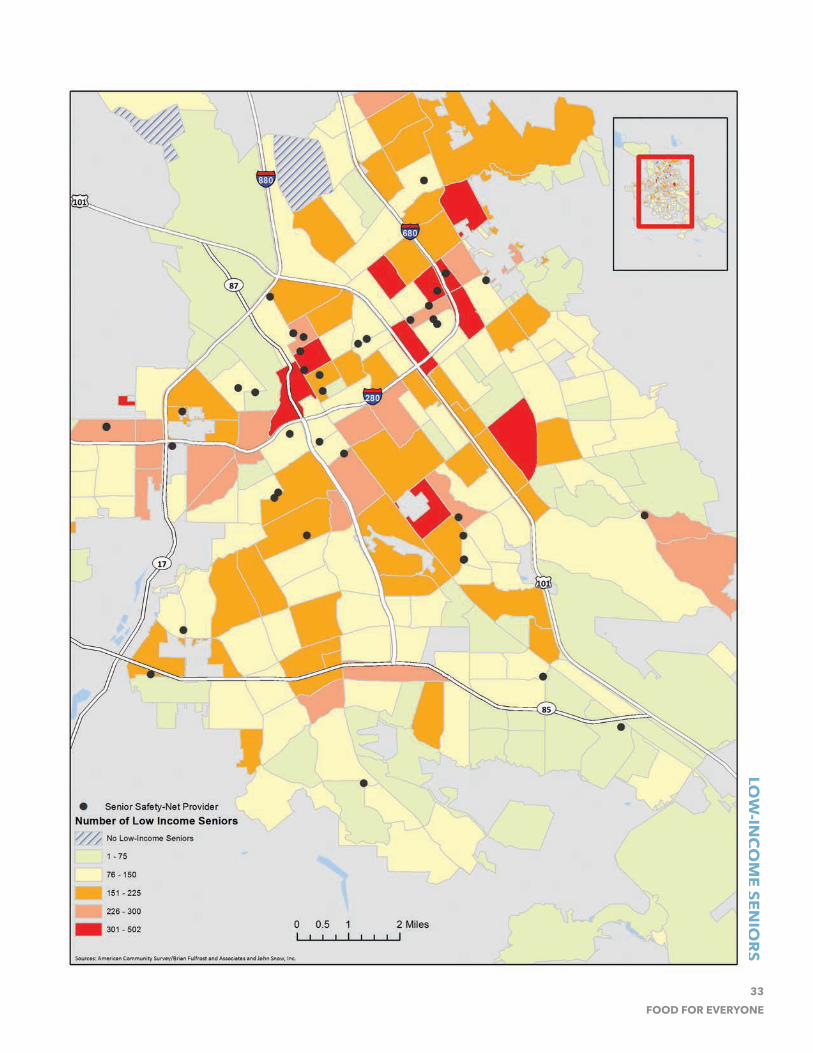
LOCATIONS OF SENIOR FOOD SAFETY-NET PROVIDERS AND LOW-INCOME SENIORSThe adjacent map shows that safety- net provider sites, in particular, Senior Nutrition Program congregate meal sites, are concentrated in downtown San Jose and along Highway 280, where there are corresponding high concentrations of low-income seniors. More isolated sites are located in other parts of the city; the map shows these single sites surrounded by several Census tracts with moderate numbers of seniors. Some areas with high numbers of low-income seniors have no food safety-net providers; notably, east of Highway 101 and south of Highway 280, and the area north of Highway 85 and west of Highway 87.
Utilization of food assistance has risen among seniors in recent years, reflecting the increase in the senior population. The number of CalFresh recipients aged 60 and over has more than doubled since 2009;32 the Senior Nutrition Program congregate meals program has experienced a rise in participation as well. The SNP congregate meal program for adults aged 60 and older maintains sites throughout Santa Clara County, with 26 sites in San Jose. San Jose residents account for approximately 54% of SNP participation.33
32 Management Audit Division of the Board of Supervisors. “Management Audit of the Santa Clara County Senior Nutrition Program.” August 29, 2014. Accessed December 16, 2015. https://www.sccgov.org/sites/bos/Man-agement Audit/Documents/Senior-Nutrition-Program_FullReport.pdf.
33 “Senior Nutrition Program FY 2014-2015 Mobility Management Program Progress Report.” Meeting Portal - The County of Santa Clara, California. 2015. Accessed December 18, 2015. http://sccgov.iqm2.com/.
Given the number of low-income seniors and levels of food insecurity in San Jose, there is significant potential for SNP participation to grow. Previous research has suggested lack of awareness, varying quality and type of food served at congregate meal sites, or even a perceived “social stigma of getting support” as reasons why SNP participation is not higher among this growing age group. The following analysis attempts to evaluate low-income seniors’ access to SNP sites and how factors such as the location, capacity, or transit accessibility of sites may encourage or limit participation in SNP congregate meals.
In addition to congregate meals, 22 distribution sites in San Jose provide groceries and other non -prepared foods through the Senior Brown Bag program, run by Second Harvest Food Bank. These sites were mapped to assess whether they are located in areas with high numbers of low-income seniors. Since many brown bag programs are located in the same facility or near to Senior Nutrition Program congregate meal sites, the gaps in access are similar to those of the congregate meal sites. This is evident on the map, where several sites appear to be clustered, while large areas in south and east San Jose with high numbers of low-income seniors do not have a single provider. While brown bag sites are a primary source of food for many low-income seniors and may have more ability to expand capacity, they do not offer the same level of support as Senior Nutrition Program congregate meal sites— and they require that seniors or a caretaker prepare meals at home.
ARE SENIOR FOOD SAFETY-NET PROVIDERS LOCATED WHERE
LOW-INCOME SENIORS ARE LOCATED?
In downtown San Jose, Senior Nutrition Program congregate meal and brown bag/food pantry
sites are located where there are high numbers of low-income seniors. In other areas, most notably
east of Highway 101 and in the area surrounding the intersection of Highways 85 and 87, many
low-income seniors have no access to a provider.
LOW
-INCO
ME SEN
IORS
33FOOD FOR EVERYONE

LOW
-INCO
ME
SEN
IORS
34THE HEALTH TRUST
UNMET NEED FOR SENIOR NUTRITION PROGRAM CONGREGATE MEALSThe map34 shows the areas where unmet need for Senior Nutrition Program congregate meals may be highest [Census tracts in dark red]. This was calculated by the ratio of low -income seniors to Senior Nutrition Program congregate meal sites. Not surprisingly, this ratio is highest in tracts with the most low -income seniors. In some cases, however, they are adjacent to tracts with a Senior Nutrition Program congregate meal site. Seniors may travel from their Census tract to a congregate meal site in a neighboring tract.
Other Census tracts are largely isolated from any Senior Nutrition Program congregate meal sites. This includes the areas east of Highway 101 and south of Highway 280, and west of Highway 87 and north of Highway 85, where large numbers of low-income seniors clearly have no access to a congregate meal site.
The number of seniors served by the Senior Nutrition Program congregate meal program in San Jose increased to approximately 8,184 individuals from FY 2013- 14 to
34 Census tracts were ranked according to the ratio of low-income seniors to Senior Nutrition Program congregate meal sites. The ratio was calculated for Census tracts with a population of more than 50 low-income seniors for each SNP site. Census tracts were grouped into five population classes using natural breaks. Census tracts with between 288 and 502 low-income seniors and three or fewer safety-net providers, or 190-287 low-income seniors and two or fewer safety-net providers were considered to have a high ratio. Census tracts with between 129 and 189 low-income seniors and one or fewer safety-net providers or between 73 and 128 low-income seniors and 1 or fewer safety-net providers were considered to have a medium ratio. Census tracts with between nine and 71 low-income seniors and no safety-net providers were considered to have a low ratio. Census tracts with zero low-income seniors were included in the “low” ratio grouping for the purposes of this analysis.
2014 -15.35 Given the number of low -income seniors and levels of food insecurity in San Jose, there is significant potential for SNP participation to grow further. Previous research has suggested lack of awareness, varying quality and type of food served at congregate meal sites, or even a perceived “social stigma of getting support” as reasons why SNP participation is not higher among this growing age group. This map suggests that location of sites is an important factor in seniors’ participation in SNP congregate meals. With these current locations, it appears that some low-income seniors are less able to benefit from congregate meals than others. 36
35 Santa Clara County Department of Aging and Adult Services, Senior Nutrition Program Annual Report for FY 2014-15 https://www.sccgov.org/sites/ssa/daas/snp/Documents/SNP%20FY14-15%20Annual%20Re-port%20Final.pdf
36 U.S. Census Bureau; American Community Survey, 2008-2012 5-Year Estimates, Table B17024 <http://factfinder2.census.gov>
The areas in dark red show where there is unmet need for Senior Nutrition Program congregate
meal sites. Areas east of Highway 101 and south of Highway 280, or west of Highway 87 and
north of Highway 85, show where the need for additional resources is greatest.
WHERE IS THE GREATEST UNMET NEED FOR SENIOR
NUTRITION PROGRAM CONGREGATE MEALS?
36

LOW
-INCO
ME SEN
IORS
35FOOD FOR EVERYONE

LOW
-INCO
ME
SEN
IORS
36THE HEALTH TRUST
CAPACITY AND LOCATION OF SENIOR NUTRITION PROGRAM CONGREGATE MEAL SITESThe map illustrates the number of meals budgeted to serve weekly at each Senior Nutrition Program congregate meal site. Green points indicate budgets to serve the highest number of meals on a weekly basis; red the lowest. The sites budgeted to serve the most meals, between 390 and 858 meals per week (78 and 172/day), are located in downtown and east San Jose [roughly corresponding with the Mayfair and Alum Rock neighborhoods], where there are corresponding high concentrations of low-income seniors.
Outside of these areas, however, the budgeted capacity of congregate meal sites does not match consistently with where low-income seniors are located. In particular, the capacity of moderately-sized Senior Nutrition Program congregate meal sites (ranging from 100 to 350 meals per week) in south San Jose may be insufficient to serve seniors from surrounding areas, given the number of low-income seniors in those Census tracts.
One limitation to the data in this map is that they show the budgeted, not actual, volume of meals served at Senior Nutrition Program congregate meal sites. Senior Nutrition Program congregate meal sites may increase the volume budgeted to serve each year in response to higher demand, if they are able to expand capacity and match the necessary funding increase from the County.37
The overall costs to the City to provide Senior Nutrition Program meals are low, as it contributes approximately one- third of the total cost of each meal, about $6.47.38
37 Information obtained from Santa Clara County Department of Aging and Adult Services.
38 Management Audit Division of the Board of Supervisors. “Management Audit of the Santa Clara County Senior Nutrition Program.” August 29, 2014. Accessed December 16, 2015. https://www.sccgov.org/sites/bos/Man-agement
Expanding the City’s capacity to provide meals through the Senior Nutrition Program is an opportunity to leverage additional County and federal matching funds. The County, with a larger share of the cost, will match funding for City- run sites that increase the number of meals served, to the extent that capacity allows.39
A comparison with recently released County statistics on the Senior Nutrition Program congregate meal program for FY 2014-15 shows that for these moderately-sized sites in south San Jose [Seven Trees, Southside, Almaden, Camden, Willow Glen], the estimated total number of meals served based on the budget is similar to or lower than the actual volume served.40 This is coupled with the fact that a number of Senior Nutrition Program sites have already reached full capacity.41 The growing population of seniors and recent increases in Senior Nutrition Program participation also support the assumption that existing site capacity soon will not suffice to serve the population in many parts of the city.
Furthermore, many seniors who want to participate in congregate meals or receive brown bag or food pantry items may not be able to travel to these sites. Approximately 22 percent of seniors in San Jose have ambulatory difficulty, defined by the U.S. Census as “difficulty walking or climbing stairs.” In particular, seniors with ambulatory difficulty living alone and at higher risk of social isolation may require food assistance through other means.
39 Information obtained from Santa Clara County Department of Aging and Adult Services.
40 New data is from the Santa Clara County Department of Aging and Adult Services, Senior Nutrition Program Annual Report for FY 2014-15.
41 Information from Santa Clara County Department of Aging and Adult Services.
Senior Nutrition Program congregate meal sites can increase capacity, but this capacity is not
unlimited, and it will not address the fact that some areas of San Jose lack providers of any kind.
ARE THE CURRENT CAPACITY AND LOCATION OF SENIOR NUTRITION PROGRAM CONGREGATE MEAL SITES SUFFICIENT TO MEET THE
FOOD ACCESS NEEDS OF LOW-INCOME SENIORS?

LOW
-INCO
ME SEN
IORS
37FOOD FOR EVERYONE

LOW
-INCO
ME
SEN
IORS
38THE HEALTH TRUST
Analysis: Transportation and Walksheds
OVERVIEWFor low-income seniors able to travel, the availability of public transit can be critical to accessing food. Safety-net providers located even within short walking distances are otherwise inaccessible to seniors with limited mobility. In addition, some providers reported that senior clients feel unsafe walking due to common hazards such as uneven sidewalks, heavy traffic, or lack of crosswalks on the way to Senior Nutrition Program or brown bag sites.
As the previous maps demonstrate, many low-income seniors do not live in the immediate vicinity of a Senior Nutrition Program site or a brown bag site. Many may rely on friends and family for rides to access food. Others rely on public transportation and assistance from Outreach, the subsidized transportation service provider in Santa Clara County.
RECENT CHANGES TO SENIOR TRANSPORTATION ACCESS Prior to June 2013, Santa Clara County contracted with Outreach to provide subsidized transportation to Senior Nutrition Program sites. These subsidies were allocated to individual Senior Nutrition Program sites.42 With its adoption of Mobility Management in 2014,43 the County began allocating transportation subsidies to individuals, and expanded the program to include bus passses, gas cards, van and volunteer driver services, mileage reimbursement and taxis. Additional funding
42 Note that the City has its own contract with Outreach. According to the Santa Clara County Board of Supervisors Nutrition Program Audit, “The City of San Jose provides additional transportation services to SNP partici-pants through a separate agreement with Outreach totaling $240,000 in FY 2013-14.”
43 Mobility Management is “a coordinated effort between the Senior Nu-trition program (SNP) and Outreach & Escort, Inc. (OUTREACH) to help seniors gain access to congregate meal sites.” FY 2014-2015 Mobility Management Program Progress Report.

LOW
-INCO
ME SEN
IORS
39FOOD FOR EVERYONE
for transportation to Senior Nutrition Program sites is provided through the Measure A–Senior Transportation Mobility Management Program.44
According to the latest estimates, over 2,400 unduplicated seniors in the County benefited from Mobility Management (and Measure A) in FY 2014-15; the average number of seniors utilizing these services monthly has increased by 64%.45 The most frequently used feature was bus passes [followed by gas cards and ADA rides]. San Jose residents constitute approximately 59% of Mobility Management utilization in the
44 Measure A reported serving 1,790 unduplicated seniors in the first quarter of 2015.These funds are temporary, however, running through 2017.
45 571 seniors were served monthly on average in FY 2013-14. In FY 2014-15, an average of 1,598 seniors were served monthly from Mobility Management and Measure A combined.
County-- about 1,416 unduplicated seniors.46
The chart below includes data from Outreach on the total number of trips to Senior Nutrition Program sites using the various modes of transit through the Mobility Management Program. The chart shows the breakdown of SNP sites with the estimated percentage of Senior Nutrition Program meals accessed using Outreach services. For some sites, including Catholic Charities of Santa Clara County and Southside Community and Senior Center, nearly half of Senior Nutrition Program congregate meals are accessed through some form of Outreach service. Please note that at the time of this assessment, data for all sites were not available.
46 Ibid.
It is important to note that these data represent only Senior Nutrition Program trips. Seniors access Senior Nutrition Program sites through other Outreach services. As a result, this may underestimate the attendance at Senior Nutrition Program sites.
SENIOR NUTRITION PROGRAM CONGREGATE MEAL SITES ACCESSED BY OUTREACH
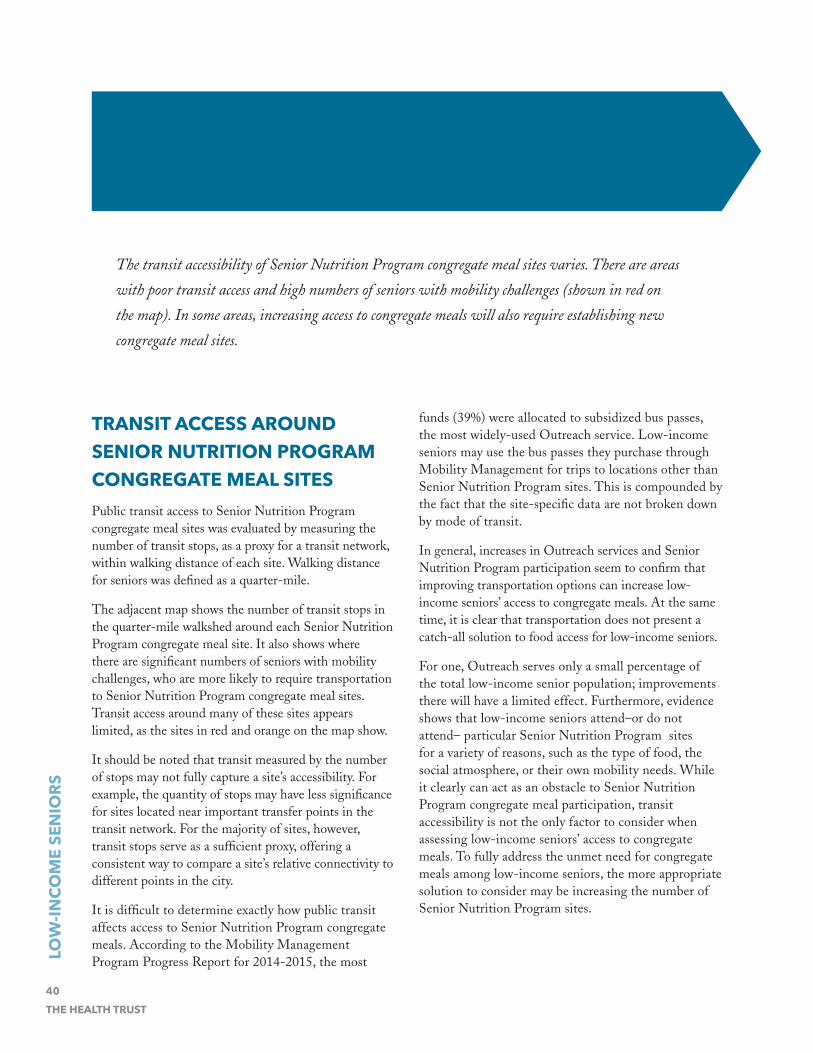
LOW
-INCO
ME
SEN
IORS
40THE HEALTH TRUST
TRANSIT ACCESS AROUND SENIOR NUTRITION PROGRAM CONGREGATE MEAL SITESPublic transit access to Senior Nutrition Program congregate meal sites was evaluated by measuring the number of transit stops, as a proxy for a transit network, within walking distance of each site. Walking distance for seniors was defined as a quarter-mile.
The adjacent map shows the number of transit stops in the quarter- mile walkshed around each Senior Nutrition Program congregate meal site. It also shows where there are significant numbers of seniors with mobility challenges, who are more likely to require transportation to Senior Nutrition Program congregate meal sites. Transit access around many of these sites appears limited, as the sites in red and orange on the map show.
It should be noted that transit measured by the number of stops may not fully capture a site’s accessibility. For example, the quantity of stops may have less significance for sites located near important transfer points in the transit network. For the majority of sites, however, transit stops serve as a sufficient proxy, offering a consistent way to compare a site’s relative connectivity to different points in the city.
It is difficult to determine exactly how public transit affects access to Senior Nutrition Program congregate meals. According to the Mobility Management Program Progress Report for 2014-2015, the most
funds (39%) were allocated to subsidized bus passes, the most widely-used Outreach service. Low-income seniors may use the bus passes they purchase through Mobility Management for trips to locations other than Senior Nutrition Program sites. This is compounded by the fact that the site-specific data are not broken down by mode of transit.
In general, increases in Outreach services and Senior Nutrition Program participation seem to confirm that improving transportation options can increase low-income seniors’ access to congregate meals. At the same time, it is clear that transportation does not present a catch-all solution to food access for low-income seniors.
For one, Outreach serves only a small percentage of the total low-income senior population; improvements there will have a limited effect. Furthermore, evidence shows that low-income seniors attend–or do not attend– particular Senior Nutrition Program sites for a variety of reasons, such as the type of food, the social atmosphere, or their own mobility needs. While it clearly can act as an obstacle to Senior Nutrition Program congregate meal participation, transit accessibility is not the only factor to consider when assessing low-income seniors’ access to congregate meals. To fully address the unmet need for congregate meals among low-income seniors, the more appropriate solution to consider may be increasing the number of Senior Nutrition Program sites.
ARE SENIOR NUTRITION PROGRAM CONGREGATE MEAL SITES
ACCESSIBLE VIA PUBLIC TRANSIT?
The transit accessibility of Senior Nutrition Program congregate meal sites varies. There are areas
with poor transit access and high numbers of seniors with mobility challenges (shown in red on
the map). In some areas, increasing access to congregate meals will also require establishing new
congregate meal sites.

LOW
-INCO
ME SEN
IORS
41FOOD FOR EVERYONE

LOW
-INCO
ME
SEN
IORS
42THE HEALTH TRUST
Analysis: Retail Food Environment
OVERVIEWThe quality of the retail food environment for low-income seniors was evaluated using the Modified Retail Food Environment Index, or mRFEI (see Glossary for details)47 measuring access to healthy retail and SNAP vendors within walking distance.
This assessment evaluated the retail food environment of the City’s planned growth areas, specific areas that have been selected for focused growth in jobs and housing over the next 25 years, as outlined in San Jose’s Envision 2040 General Plan. These planned growth areas are intended to be mixed-use and transit-oriented, and they present an opportunity to incorporate food access goals into the planning and development process.
47 The modified Retail Food Environment index (mRFEI) provides a ratio for the number of healthy food retailers (e.g., supermarkets, gardens, farmer’s markets, and community-supported agriculture) compared to the number of less healthy food retailers (e.g., fast food restaurants, small grocery stores, and convenience stores).
Walking distance to SNAP/CalFresh vendors and healthy food retail was also measured from affordable housing units, as a significant number of low-income seniors live in affordable housing. Nearly 22%, or 3,894 deed-restricted affordable apartments in 34 complexes in San Jose are designated “senior units.” This is in addition to the many seniors living in affordable housing units that are not exclusively for seniors.
PLANNED GROWTH AREAS The adjacent map shows the number of low- income seniors in Census tracts within the City’s planned growth areas, parts of San Jose where there is expected to be the greatest population growth. The shapes outlined in black indicate the areas designated by the City for planned growth.
HOW MANY LOW-INCOME SENIORS ARE IN AREAS OF THE CITY WHERE
THERE WILL BE THE GREATEST POPULATION GROWTH?

LOW
-INCO
ME SEN
IORS
43FOOD FOR EVERYONE

LOW
-INCO
ME
SEN
IORS
44THE HEALTH TRUST
RETAIL FOOD ENVIRONMENT IN PLANNED GROWTH AREAS Planned Growth Areas are “specific areas of San José which are planned to accommodate the majority of the City’s job and housing growth. Focusing new growth into the Growth Areas helps to protect the quality of existing neighborhoods. It also enables development of new Urban Village areas with a compact and dense form that are attractive to the City’s projected population demographics, that support walking, provide opportunities to incorporate retail and other services in a mixed-use format, and support transit use.”
- Envision 2040, Chapter 1, Context and Key Issues48
48 “Envision San Jose 2040.” City of San Jose Planning Department. Novem-ber 2011. https://www.sanjoseca.gov/DocumentCenter/Home/View/474.
IS THERE HEALTHY FOOD AVAILABLE FOR PURCHASE IN AREAS OF THE
CITY WHERE THERE WILL BE THE GREATEST POPULATION GROWTH?
Planned Growth Areas, selected for focused growth in jobs and housing over the next 25 years,
contain high numbers of low-income seniors. 60% of these areas have no access to healthy food
(mRFEI = 0).
{ }“Most of our neighborhoods are not food deserts but are junk food swamps…So they only have access to corner markets that don’t have healthy options.”
- Senior Safety-Net Provider
49, 50
The map shows that 60 percent of planned growth areas have no access to healthy food, based on their mRFEI scores. Many planned growth areas do not have a safety-net provider that serves low-income seniors. This includes some of the areas described in the Overview lacking Senior Nutrition Program congregate meal sites or brown bag/food pantry providers. 49 50\\
49 Raimi + Associates. “Community Health Existing Conditions Report for the County of Santa Clara General Plan Health Element.” May 2013. https://www.sccgov.org/sites/dpd/DocsForms/Documents/HealthElement_Exist-ing_Health_Conditions_FINAL_May_2013.pdf.
50 Steiner, Claudia A., M.D., Marguerite L. Barrett, M.S., Audrey J. Weiss, Ph.D., and Roxanne M. Andrews, Ph.D. “Trends and Projections in Hospital Stays for Adults With Multiple Chronic Conditions, 2003–2014.” Healthcare Cost and Utilization Project. November 2014. http://www.hcup-us.ahrq.gov/reports/statbriefs/sb183-Hospitalizations-Multiple-Chronic-Conditions-Pro-jections-2014.pdf.

LOW
-INCO
ME SEN
IORS
45FOOD FOR EVERYONE
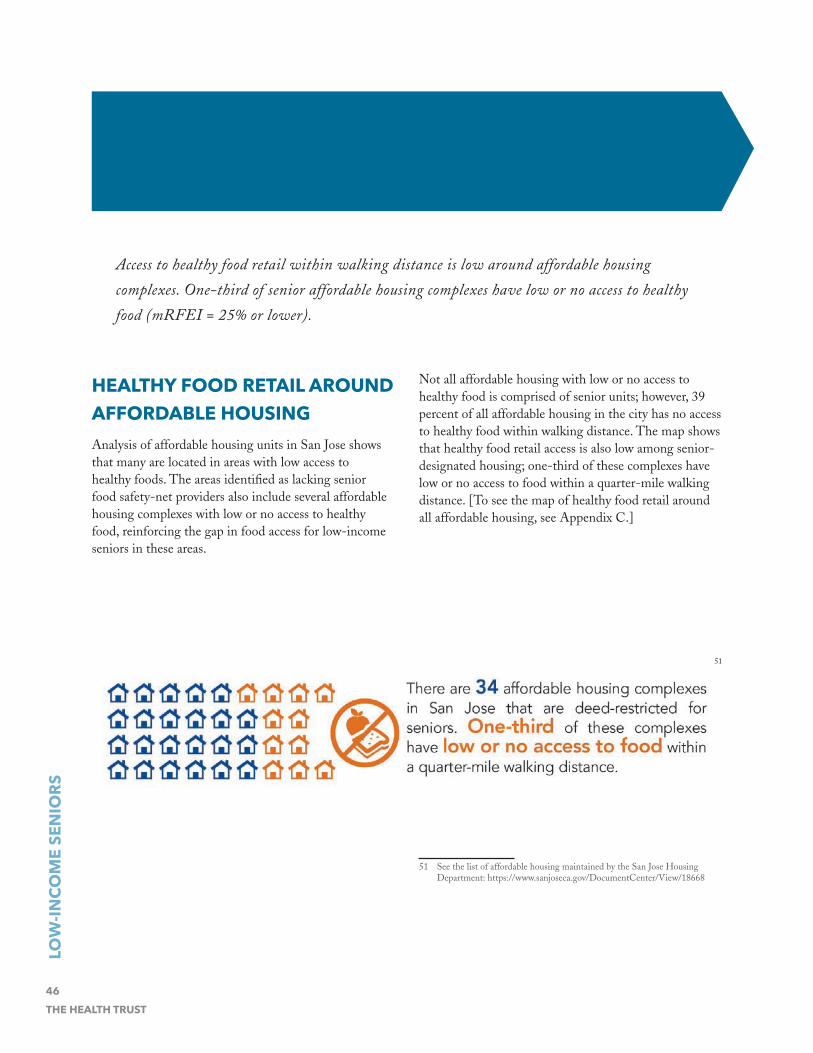
LOW
-INCO
ME
SEN
IORS
46THE HEALTH TRUST
HEALTHY FOOD RETAIL AROUND AFFORDABLE HOUSINGAnalysis of affordable housing units in San Jose shows that many are located in areas with low access to healthy foods. The areas identified as lacking senior food safety-net providers also include several affordable housing complexes with low or no access to healthy food, reinforcing the gap in food access for low- income seniors in these areas.
Not all affordable housing with low or no access to healthy food is comprised of senior units; however, 39 percent of all affordable housing in the city has no access to healthy food within walking distance. The map shows that healthy food retail access is also low among senior-designated housing; one-third of these complexes have low or no access to food within a quarter-mile walking distance. [To see the map of healthy food retail around all affordable housing, see Appendix C.]
51
51 See the list of affordable housing maintained by the San Jose Housing Department: https://www.sanjoseca.gov/DocumentCenter/View/18668
IS HEALTHY FOOD AVAILABLE FOR PURCHASE AROUND
AFFORDABLE HOUSING COMPLEXES?
Access to healthy food retail within walking distance is low around affordable housing
complexes. One-third of senior affordable housing complexes have low or no access to healthy
food (mRFEI = 25% or lower).

LOW
-INCO
ME SEN
IORS
47FOOD FOR EVERYONE

LOW
-INCO
ME
SEN
IORS
48THE HEALTH TRUST
RETAILERS ACCEPTING SNAP/CALFRESH AROUND AFFORDABLE HOUSINGThe adjacent map shows that many affordable housing complexes have access to at least one SNAP/CalFresh retailer within a quarter- mile walkshed. Taken together with the data in the previous map on mRFEI scores in the walksheds around affordable housing, this map indicates that in many areas, the only retail food options for senior CalFresh recipients are small markets or convenience stores selling unhealthy foods.
These findings reveal significant gaps in access to healthy food retail, but they also present an opportunity to incorporate healthy food access into the City’s planned growth areas. The Urban Village concept, with its emphasis on creating vibrant neighborhoods through jobs, housing, and innovative urban design, is a logical starting point for improving healthy food access. With significant numbers of low-seniors in many of the neighborhoods slated for economic growth, the benefits of a healthier food retail environment would be far-reaching.
ARE THERE FOOD RETAILERS ACCEPTING SNAP/CALFRESH AROUND
AFFORDABLE HOUSING COMPLEXES?
There are many SNAP/CalFresh retailers within walking distance of affordable housing
complexes; however, they are not healthy food retailers. With so many low-income seniors in these
areas, investing in healthy food access around affordable housing would have significant returns for
low-income seniors and their neighborhoods.

LOW
-INCO
ME SEN
IORS
49FOOD FOR EVERYONE

LOW
-INCO
ME
SEN
IORS
50THE HEALTH TRUST
Analysis: Crime and Safety
OVERVIEWLevels of crime and perceptions of safety can affect neighborhood walkabilty and, in turn, the neighborhood food environment. Seniors living in neighborhoods with higher crime levels may avoid walking to grocery stores or safety-net providers because of concerns for their safety. Providers in the Senior Nutrition Program reported that some congregate meal sites are located in “unsafe” neighborhoods, which likely prevents some seniors from attending. This assessment mapped the City’s gang hot-spots as a proxy for high-crime areas to analyze how crime levels might be affecting seniors’ ability to access healthy foods.
ACCESS TO FOOD SAFETY-NET PROVIDERS IN AREAS WITH HIGH LEVELS OF VIOLENCEThe map shows three areas where there is a high concentration of low-income seniors and no safety-net providers in the area. Low-income seniors in these areas may be deterred from attending Senior Nutrition Program meals or traveling to brown bag providers because of a perceived lack of safety. Downtown San Jose includes multiple hot-spots with moderate or high numbers of seniors, some of whom may not be accessing the safety-net providers in the area despite their proximity.
This map provides some context for the level of safety in areas where low-income seniors and safety-net providers are located, but additional research on these areas is needed to draw any conclusions about the role of crime in determining low-income seniors’ access to healthy food.
DO SENIORS FEEL SAFE ACCESSING FOOD RESOURCES
IN THEIR NEIGHBORHOODS?

LOW
-INCO
ME SEN
IORS
51FOOD FOR EVERYONE

LOW
-INCO
ME
SEN
IORS
52THE HEALTH TRUST
OVERVIEWCongregate meals and brown bag sites are a convenient and effective safety-net food service for many seniors, but there remains unmet need among a significant subset of the population. Census estimates of seniors with ambulatory difficulty52 were used to identify possible gaps in access to food assistance.
For many low-income seniors with ambulatory difficulty, walking distance may entail a very small radius around the home, and public transit may not be an option. They may not be able to attend SNP congregate meals or pick up unprepared foods from a brown bag site, and may instead rely on caregivers for grocery shopping
52 Ambulatory difficulty is defined by the US Census as “difficulty walking or climbing stairs.”
and food preparation, or rely on processed foods that require minimal preparation. The nutritional demands of chronic disease management are often more challenging for seniors reliant on food assistance.
Low-income seniors with such a profile are less likely to benefit from congregate meal programs than from meal delivery programs such as Meals On Wheels. The number and location of seniors with ambulatory difficulty in San Jose strongly indicate gaps in access to delivered meals and the need for expansion of the Meals On Wheels program.
Analysis: Mobility of Low-Income Seniors

LOW
-INCO
ME SEN
IORS
53FOOD FOR EVERYONE
Zip Code Tabulation
Area
Council District
Total Seniors (65 and over)
Total Low-Income Seniors
(< 200% FPL)
Percent Low-
Income Seniors
Total Ambulatory
Difficulty Seniors
Percent Ambulatory
Difficulty Seniors
95002 4 166 10 6 47 28
95013 2 0 0 0 0 0
95032 9,10 4268 714 17 605 14
95037 2, 10 4549 1076 24 950 21
95110 3,6,7 1073 468 44 260 24
95111 2,7 4438 1766 40 1182 27
95112 3,7 4165 2141 51 1174 28
95113 3 241 209 87 101 42
95116 3,5 4531 2504 55 1034 23
95117 1 2542 734 29 580 23
95118 9, 10 3826 1117 29 927 24
95119 2 917 85 9 173 19
95120 10 5752 600 10 879 15
95121 2,8 3501 955 27 800 23
95122 5,7,8 4628 1804 39 1601 35
95123 2,9,10 6005 1324 22 1020 17
95124 6,9 5809 984 17 1286 22
95125 6,7,9 6773 1673 25 1407 21
95126 3 2589 1013 39 701 27
95127 5 6608 2077 31 1917 29
95128 1,6 3334 1237 37 1041 31
95129 1 4363 778 18 729 17
95130 1 1490 225 15 263 18
95131 3,4 2219 429 19 464 21
95132 4 4733 1270 27 1062 22
95133 3,4,5 3088 1097 36 801 26
95134 4 561 162 29 73 13
95135 8 4586 729 16 810 18
95136 2,7,9,10 4403 848 19 903 21
95138 2,8 1420 245 17 193 14
95139 2 781 166 21 166 21
95148 8 4545 954 21 1155 25
Total 107904 29394 27 24304 22.5
Zip Code Tabulation Areas are used by the US Census for data-gathering purposes. They do not correspond in all cases to postal ZIP codes. Totals will be slightly different from those given in the analysis, as Census tract boundaries and Zip Code Tabulation Areas are not perfectly aligned. Source: US Census Bureau; American Community Survey, 2008-12 5-Year Estimates, Tables B17024 and B18105 http://factfinder2.census.gov
SENIOR DEMOGRAPHICS BY ZIP CODE TABULATION AREA
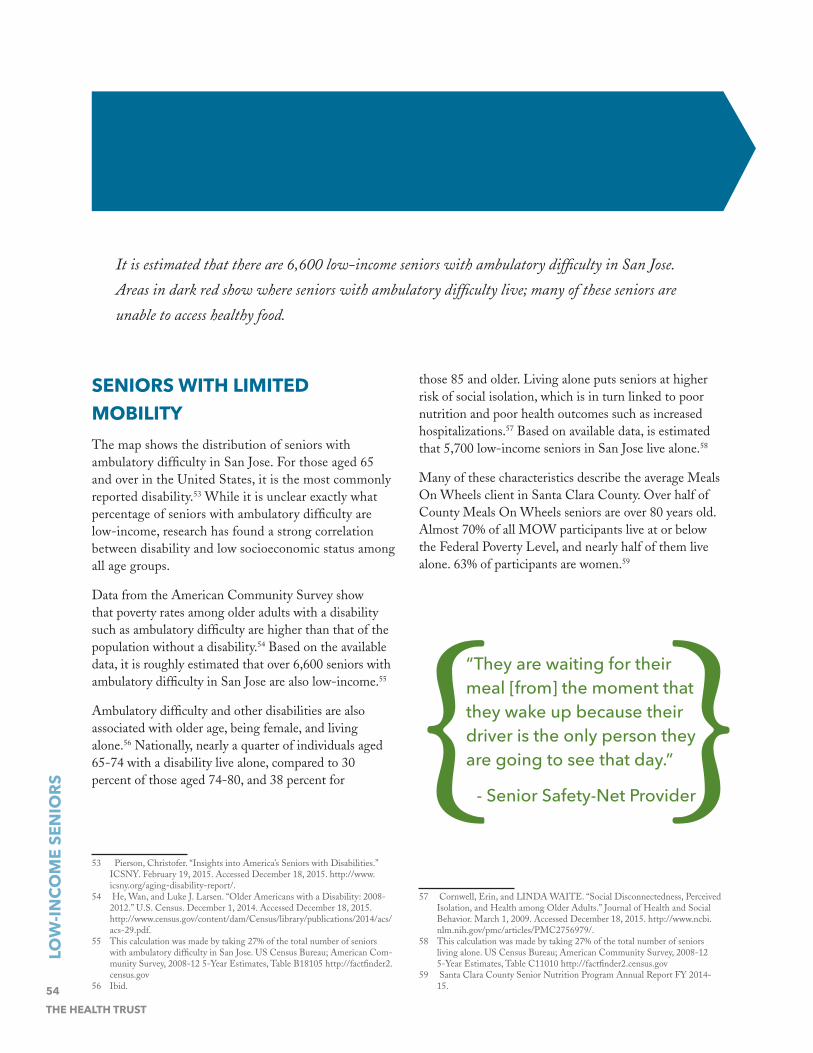
LOW
-INCO
ME
SEN
IORS
54THE HEALTH TRUST
SENIORS WITH LIMITED MOBILITYThe map shows the distribution of seniors with ambulatory difficulty in San Jose. For those aged 65 and over in the United States, it is the most commonly reported disability.53 While it is unclear exactly what percentage of seniors with ambulatory difficulty are low-income, research has found a strong correlation between disability and low socioeconomic status among all age groups.
Data from the American Community Survey show that poverty rates among older adults with a disability such as ambulatory difficulty are higher than that of the population without a disability.54 Based on the available data, it is roughly estimated that over 6,600 seniors with ambulatory difficulty in San Jose are also low-income.55
Ambulatory difficulty and other disabilities are also associated with older age, being female, and living alone.56 Nationally, nearly a quarter of individuals aged 65-74 with a disability live alone, compared to 30 percent of those aged 74-80, and 38 percent for
53 Pierson, Christofer. “Insights into America’s Seniors with Disabilities.” ICSNY. February 19, 2015. Accessed December 18, 2015. http://www.icsny.org/aging-disability-report/.
54 He, Wan, and Luke J. Larsen. “Older Americans with a Disability: 2008-2012.” U.S. Census. December 1, 2014. Accessed December 18, 2015. http://www.census.gov/content/dam/Census/library/publications/2014/acs/acs-29.pdf.
55 This calculation was made by taking 27% of the total number of seniors with ambulatory difficulty in San Jose. US Census Bureau; American Com-munity Survey, 2008-12 5-Year Estimates, Table B18105 http://factfinder2.census.gov
56 Ibid.
those 85 and older. Living alone puts seniors at higher risk of social isolation, which is in turn linked to poor nutrition and poor health outcomes such as increased hospitalizations.57 Based on available data, is estimated that 5,700 low-income seniors in San Jose live alone.58
Many of these characteristics describe the average Meals On Wheels client in Santa Clara County. Over half of County Meals On Wheels seniors are over 80 years old. Almost 70% of all MOW participants live at or below the Federal Poverty Level, and nearly half of them live alone. 63% of participants are women.59
57 Cornwell, Erin, and LINDA WAITE. “Social Disconnectedness, Perceived Isolation, and Health among Older Adults.” Journal of Health and Social Behavior. March 1, 2009. Accessed December 18, 2015. http://www.ncbi.nlm.nih.gov/pmc/articles/PMC2756979/.
58 This calculation was made by taking 27% of the total number of seniors living alone. US Census Bureau; American Community Survey, 2008-12 5-Year Estimates, Table C11010 http://factfinder2.census.gov
59 Santa Clara County Senior Nutrition Program Annual Report FY 2014-15.
WHERE ARE THERE LARGE NUMBERS OF SENIORS WITH
LIMITED MOBILITY IN SAN JOSE?
“They are waiting for their meal [from] the moment that they wake up because their driver is the only person they are going to see that day.”
- Senior Safety-Net Provider{ }
It is estimated that there are 6,600 low-income seniors with ambulatory difficulty in San Jose.
Areas in dark red show where seniors with ambulatory difficulty live; many of these seniors are
unable to access healthy food.

LOW
-INCO
ME SEN
IORS
55FOOD FOR EVERYONE
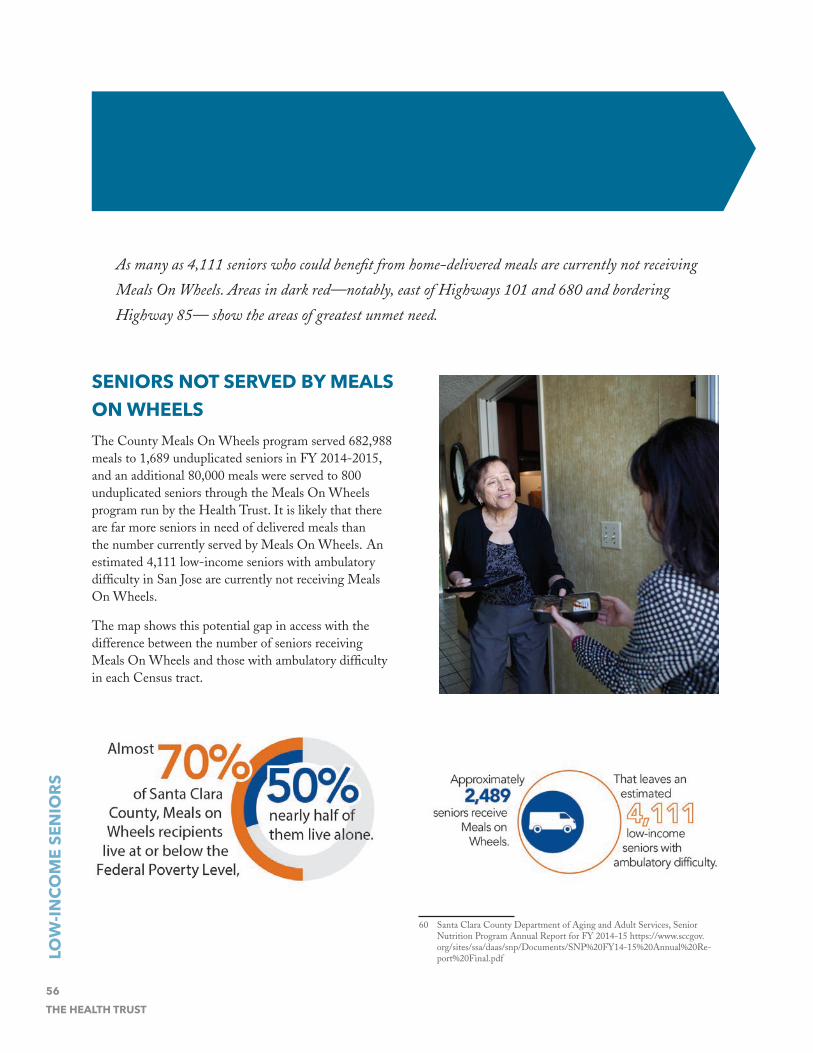
56THE HEALTH TRUST
LOW
-INCO
ME
SEN
IORS
SENIORS NOT SERVED BY MEALS ON WHEELS The County Meals On Wheels program served 682,988 meals to 1,689 unduplicated seniors in FY 2014-2015, and an additional 80,000 meals were served to 800 unduplicated seniors through the Meals On Wheels program run by the Health Trust. It is likely that there are far more seniors in need of delivered meals than the number currently served by Meals On Wheels. An estimated 4,111 low-income seniors with ambulatory difficulty in San Jose are currently not receiving Meals On Wheels.
The map shows this potential gap in access with the difference between the number of seniors receiving Meals On Wheels and those with ambulatory difficulty in each Census tract.
60
60 Santa Clara County Department of Aging and Adult Services, Senior Nutrition Program Annual Report for FY 2014-15 https://www.sccgov.org/sites/ssa/daas/snp/Documents/SNP%20FY14-15%20Annual%20Re-port%20Final.pdf
HOW MANY SENIORS WITH LIMITED MOBILITY ARE NOT
GETTING THE FOOD ASSISTANCE THEY NEED?
As many as 4,111 seniors who could benefit from home-delivered meals are currently not receiving
Meals On Wheels. Areas in dark red—notably, east of Highways 101 and 680 and bordering
Highway 85— show the areas of greatest unmet need.

LOW
-INCO
ME SEN
IORS
57FOOD FOR EVERYONE

58THE HEALTH TRUST
1. Identify senior communities, affordable housing units, and other residential areas with high concentrations of seniors that would benefit from cost-effective solutions such as food drops or mobile produce units.
2. Develop a Senior Nutrition Program outreach strategy to increase participation in communities with high concentrations of low-income seniors and SNP congregate meal sites with the potential to increase capacity.
3. Increase funding for mobile meal services, i.e., Meals On Wheels, for the lowest-income, most vulnerable older adults in San Jose.
4. Explore innovative solutions to allow low-income seniors to access food resources in the community (e.g., restaurant vouchers, grocery delivery service).
5. Incentivize healthy food retail in the City’s planned growth areas.
6. Explore opportunities in the existing safety-net infrastructure for cross-population services (e.g., could kitchens at Senior Nutrition Program sites prepare to-go meals for individuals that are homeless).
7. Explore opportunities to increase CalFresh enrollment of low-income seniors.
8. Form partnerships where possible between food safety-net providers and other service providers.
RECOMMENDATIONS LOW-INCOME SENIORS
LOW
-INCO
ME
SEN
IORS
59FOOD FOR EVERYONE
Conclusion
This assessment used stakeholder interviews, constituent focus groups, GIS mapping and extensive data collection to identify gaps in healthy food access and opportunities to make smarter investments in food assistance for the nearly 30,000 low-income seniors and over 4,000 individuals that are homeless in our city. Analyses for both low-income seniors and individuals that are homeless revealed a concentration of food assistance resources downtown and a mismatch of resources to the population in many other parts of the city. At the same time, this report identified several opportunities to improve healthy food access among individuals that are homeless and low-income seniors-- solutions that are within the reach of partners in City and County government, safety-net providers and other non-profits working to serve these populations, and other key stakeholders. With a commitment to partnership and a vision for a San Jose where no one lives outside and no senior goes hungry, we can fundamentally improve food access for those who need it most.
Individuals that are HomelessThese findings, based on data from the US Census and from interviews with safety-net providers and individuals that are homeless, show that there are numerous reasons why access to healthy food is so variable.
In some parts of San Jose, healthy food access is limited by the lack of a safety-net provider nearby; this is compounded by low public transit accessibility near providers outside of downtown. In other cases, the accessibility of healthy food may depend on providers’ capacity, or the days and times that food is available: several congregate meal providers appear overburdened, and only a small number of brown bag and congregate meal sites are open 7 days a week. The retail food
environment around safety-net providers and shelters also reflects poor access to healthy food, according to the mRFEI scores in the half-mile walkshed around them
These findings argue for making food access a priority in the response to homelessness. Evidence from Santa Clara County shows that access to the full range of supports and services, in addition to housing, leads to better outcomes for individuals that are homeless. As one of these services, access to healthy food can mean fewer diseases related to nutrition and more resources that can be directed towards finding housing and achieving stability. Focusing on the gaps in food access—with evidence of why and where they are occurring—can make the City’s response to homelessness more effective for individuals, and ultimately less costly to health, social service, and justice systems.61
There are numerous opportunities to make small but significant changes in the approach to food assistance for individuals that are homeless. The recommendations here emphasize communication between providers and developing the mobility to provide food where necessary. These steps are important to elevating food access as one of the essential components of the City’s response to homelessness and meeting the specific needs of individuals that are homeless.
Low-Income SeniorsFindings on low-income seniors’ access to food, based on data from the US Census and Santa Clara County and from interviews with safety-net providers, show that some low-income seniors are less able to benefit from the senior food safety-net than others.
61 Flaming, Daniel, Halil Toros, and Patrick Burns. “Home Not Found: The Cost of Homelessness in Silicon Valley.” 2015. Accessed December 16, 2015. http://destinationhomescc.org/wp-content/uploads/2015/05/er_hom-enotfound_report_6.pdf.

60THE HEALTH TRUST
Healthy food access for low-income seniors outside of downtown San Jose is more limited in part because of the lack of Senior Nutrition Program congregate meal and brown bag sites, particularly in the east and south of the City. Public transit access to many of these sites is low. Some seniors can reach them using Outreach, the subsidized transportation service supported by the City and County, though the data suggest several other reasons keeping seniors from SNP congregate meal sites, including the type of food, the social atmosphere, and seniors’ mobility needs. Increases in SNP congregate meal participation (along with the number of low-income seniors in recent years) also raise the concern that existing sites may be reaching or exceeding capacity.
Senior Nutrition Program congregate meal sites are a main focus of this assessment because they increase seniors’ access to healthy food, and because they are a valuable community asset. The expansion of SNP congregate meal sites could enable more seniors to benefit from congregate meals in their neighborhoods, at the same time contributing to neighborhood cohesion.
The same may be said for improving the overall retail food environment in Urban Villages and other planned growth areas. At present, the mRFEI scores of quarter-mile walksheds around affordable housing units and planned growth areas— where many low-income seniors reside—indicate a poor retail food environment. The benefits of a healthier food retail environment, as described in Envision 2040 as part of the City’s vision for healthier and more vibrant neighborhoods, are multidimensional. From small business opportunity to increased public safety, making a concerted effort to improve food retail goes beyond a strategy that serves only seniors.
Low -income seniors’ access to healthy food is made more challenging because many seniors experience some degree of mobility problems; 22% of seniors in San Jose report having ambulatory difficulty. The high number of seniors with forms of limited mobility and low-incomestrongly suggests that there are many seniors in need of a delivered meal service, though fewer than 2,500 currently receive Meals On Wheels. As the senior population grows, expanding food assistance to seniors in need through Meals On Wheels should be at the forefront of the conversation on access to healthy food in San Jose.
NEXT STEPS The next step is to develop a Food Access Implementation Plan, a multi-stakeholder effort that incorporates the findings here into a detailed action plan. With a deeper understanding of gaps in food access and various opportunities to improve food assistance for individuals that are homeless and low-income seniors in San Jose, it is now time to address the food needs of two of the most vulnerable groups in our city.

61FOOD FOR EVERYONE
PHONE & EMAIL SURVEY OF FOOD ASSISTANCE PROVIDERSIn order to collect information on the availability and accessibility of safety-net food resources for the target populations, we identified and surveyed 125 providers regarding hours and days of operation, meal services/programs offered, clients served, and information about enrollment services for public food assistance (SNAP, WIC).
We identified 72 providers that met the following criteria: 1) provide food assistance in the form of a brown bag/grocery program, meal program, or other program (e.g. Senior Nutrition Program); and 2) are located within the City of San Jose. Sites were initially included (n=192) if they were listed as a Second Harvest Food Bank distribution site or were listed on a public resource directory as organizations that provide food assistance to one of the target populations (homeless individuals or low-income seniors).
A member of the research team recorded as much information as available from online resources (including information about hours, program offerings, and location) prior to calling identified sites. Sites were called to confirm their address, request basic information about the food assistance provided (e.g., program type, days/hours, eligibility requirements, and number of people served per day), and obtain contact information for a staff member that could answer in-depth questions via email. Sites were removed from the final list if: 1) they no longer existed or no longer provided food assistance of any kind, or 2) if they did not serve meals and/or distribute food on-site (e.g., were an administrative office).
KEY INFORMANT INTERVIEWSWe conducted key informant interviews with food assistance providers serving homeless and senior clients that could provide insight on the target populations as well as those who have the potential to address food access but are currently experiencing barriers. Interviews discussed assets and challenges at the organizational, political, and systems-levels as well as potential opportunities to address food access within their respective organizations. Organizations were identified for interviews by The Health Trust staff and the City of San Jose public agencies. These sites had a reputation of or were known to provide a large number of meals or serving a large number of homeless or low-income seniors clients in San Jose. Additional food assistance sites were identified for interviews during the course of data collection. In addition, we conducted a group interview with five homeless providers at a meeting organized by the City of San Jose.
FOCUS GROUPJSI conducted a focus group with homeless individuals at a large homeless shelter (HomeFirst) in San Jose to gather information about how they were accessing food and food assistance resources. This information helped to assess how available safety-net resources are meeting the food needs of the homeless population. Two facilitators asked questions about individuals’ habits and preferences for accessing food or food assistance resources as well as challenges and needs to accessing food.
Appendix A. Detailed Methods: Primary Data Collection

62THE HEALTH TRUST
Appendix B. Detailed Methods: GIS Mapping
All mapping and related spatial analyses were completed in ArcGIS 10.2.2. All analyses were calculated within the City of San Jose. Demographic data for low-income seniors was obtained from the 2008-2015 American Community Survey 5-Year Estimates at the Census tract level. Tracts were clipped to the boundary of the City of San Jose. For tracts that overlapped the city boundary, weighted averages for demographic values were calculated based on the proportion of the area of the tract within the city and by reviewing urban land use patterns in these locations using high resolution aerial photos.
• Low-income seniors were defined as those 65 years or older with incomes under 200% of the Federal Poverty Level.
• The population of individuals that are homeless was obtained at the Census tract level; however, weighted averages were not applied to the population of sheltered homeless individuals.
• The locations of retail food, shelters, SNAP vendors, and safety-net providers were geocoded using ArcGIS online world geocoding service.
• The modified Retail Food Environment Index (mRFEI) was calculated using geocoded locations of healthy and unhealthy food retailers downloaded from the California Nutrition Network (September 2014).
• Housing 1000 participants were reported as the number of individuals by zip code. Only participants for zip codes that are mostly within the City of San Jose were included in the analysis.
FOOD ASSISTANCE AVAILABILITY & ACCESSIBILITYAccessibility and availability were mapped as both concentrations and/or walking distances. Concentrations were calculated as frequency of safety-net providers in relationship to the number of individuals that are homeless or low-income seniors within a given tract to identify possible unmet need. These are intended to highlight potential gaps in availability and/or accessibility.
TRANSIT ACCESSIBILITYThe number of transit stops within walksheds was used as proxy for transit accessibility. The number of transit stops within a half mile (quarter mile for low-income seniors) were grouped into accessibility categories (e.g., low to high access). Walking distances were calculated by tracing along the street centerline network obtained from the City of San Jose up to ¼ or ½ mile from a given point (e.g., a safety-net provider). Walksheds (both ¼ and ½ mile) are the areas that encompass these streets. Half-mile walksheds were calculated for food safety-net providers and/or shelters serving individuals that are homeless. Quarter-mile walksheds were calculated around safety-net providers primarily serving seniors.

63FOOD FOR EVERYONE
UNMET NEED (RATIO SAFETY-NET PROVIDERS TO INDIVIDUALS THAT ARE HOMELESS)Census tracts were ranked according to the ratio of safety-net providers to the number of individuals that are homeless. Census tracts with no safety-net providers and more than 20 individuals that are homeless were considered to have high unmet need. Census tracts with one safety-net provider and more than 50 individuals that are homeless were considered to have medium unmet need. Census tracts with one safety-net provider and up to 50 individuals that are homeless were considered to have a low unmet need. Census tracts with more than one safety-net provider or fewer than 10 individuals that are homeless were also included in the “low” unmet need grouping.
RATIO OF RECENTLY HOUSED INDIVIDUALS TO SAFETY-NET PROVIDERSZIP codes with more than 50 recently housed individuals and no safety-net providers were considered to have a high ratio. ZIP codes with more than 20 recently housed individuals and no safety-net providers were considered to have a moderate ratio. ZIP codes with either between 20 and 50 recently housed individuals and 1 safety-net provider or between 50 and 100 recently housed individuals and 2 safety-net providers were considered to have a low ratio. ZIP codes with fewer than 20 recently housed individuals with no safety-net providers were considered to have a very low ratio for the purposes of this analysis. ZIP codes with no recently individuals were considered to have “sufficient resources.”
RATIO OF LOW-INCOME SENIORS TO SENIOR NUTRITION PROGRAM CONGREGATE MEAL SITESCensus tracts were ranked according to the ratio of low-income seniors to Senior Nutrition Program congregate meal sites. Census tracts were grouped into five population classes using natural breaks. Census tracts with between 288 and 502 low-income seniors and three or fewer safety-net providers or 190-287 low-income seniors and two or fewer safety-net providers were considered to have a high ratio. Census tracts with between 129 and 189 low-income seniors and one or fewer safety-net providers or between 73 and 128 low-income seniors and 1 or fewer safety-net providers were considered to have a medium ratio. Census tracts with between nine and 71 low-income seniors and no safety-net providers were considered to have a low ratio. Census tracts with zero low-income seniors were included in the “low” ratio grouping.
LOW-INCOME SENIORS AND MEALS ON WHEELSUtilization of the county Meals On Wheels (MOW) program was determined by subtracting the number of MOW participants (FY 13-14) from the number of seniors with ambulatory difficulty.

64THE HEALTH TRUST
Appendix C
List of Maps
Locations of Food Safety-Net Providers and Individuals that are Homeless
Areas of Unmet Need for Food Assistance
Location and Capacity of Congregate Meal Providers
Recently Housed Individuals
Transit Accessibility of Food Safety-Net Providers
mRFEI within Walking Distance of Shelters
Food Retailers Accepting SNAP/CalFresh around Shelters
Locations of Food Safety-Net Providers and Low-Income Seniors
Unmet Need for Senior Nutrition Program Congregate Meals
Transit Access Around Senior Nutrition Program Congregate Meal Sites
Location and Capacity of Senior Nutrition Program Congregate Meal Sites
Transit Access Around Senior Nutrition Program Congregate Meal Sites
Low-Income Seniors in Planned Growth Areas
mRFEI in Planned Growth Areas
mRFEI within Walking Distance of Affordable Housing (Senior Complexes Only)
Food Retailers Accepting SNAP/CalFresh around Affordable Housing
Low-Income Seniors in Gang Hot-Spots
Seniors with Ambulatory Difficulty
Seniors with Ambulatory Difficulty not Served by Meals On Wheels
In Appendix only:
2015 San Jose Homeless Census data
Transit Access around Homeless Shelters
mRFEI within Walking Distance of Safety-Net Providers
mRFEI within Walking Distance of Affordable Housing (all)

65FOOD FOR EVERYONE
MAP LAYER SOURCE YEAR
Number of Low-incomeSeniors (by tract)American Community Survey (2008-2012 5-Year estimates)
2008-12
Number of Unsheltered Homeless Individuals (by tract)Applied Survey Research (City of San Jose Homeless Census)
2013, 2015
Recently Housed – Housing1000 (by zip) Destination Home 2015
Safety Net Providers (homeless) – all sites BFA/JSI 2015
Safety Net Providers (homeless) – congregate meal sites BFA/JSI 2015
Safety Net Providers (homeless) – brown bag sites BFA/JSI 2015
Safety Net Providers (homeless) – food pantry sites BFA/JSI 2015
Safety Net Providers (seniors) – all sites BFA/JSI 2015
Safety Net Providers (seniors) – Senior Nutrition Program (SNP) congregate meal sites
BFA/JSI 2015
Safety Net Providers (seniors) – brown bag sites BFA/JSI 2015
Unmet Need (Ratio Food Safety-Net Providers to Homeless Individuals)
BFA/JSI [American Community Survey (2008-2012 5 Year estimates)]
2012/2015
Ratio of Low-Income Seniors to Senior Nutrition program Congregate Meal Sites
BFA/JSI [American Community Survey (2008-2012 5 Year estimates)]
2012/2016
Transit Stops Santa Clara Valley Transportation Authority 2015
Transit Routes Santa Clara Valley Transportation Authority 2015
Walksheds (½ mile) of Safety Net Providers (homeless) BFA/JSI 2015
Walksheds (¼ mile) of Safety Net Providers (seniors) BFA/JSI 2015
Walksheds (½ mile) of Shelters BFA/JSI 2015
Transit Accessibility (# of transit stops w/i walksheds) of Safety Net Providers (homeless)
BFA/JSI 2015
Transit Accessibility (# of transit stops w/i walksheds) of Safety Net Providers (seniors)
BFA/JSI 2015
Transit Accessibility (# of transit stops w/i walking distance) of Shelters
BFA/JSI 2015
mRFEI within Shelter WalkshedsBFA/JSI (California Nutrition Network; Destination Home)
2015
mRFEI within Safety-Net Provider WalkshedsBFA/JSI (California Nutrition Network; City of San Jose Housing Dept.)
2015
mRFEI within Affordable Housing WalkshedsBFA/JSI (California Nutrition Network; City of San Jose Housing Dept.)
2015
mRFEI within Planned Growth AreasBFA/JSI (California Nutrition Network; City of San Jose Planning Dept)
2015
Number of SNAP vendors within walking distance to Shelters
BFA/JSI (USDA; City of San Jose Housing Dept.) 2015
Number of SNAP vendors within walking distance to Affordable Housing
BFA/JSI (California Nutrition Network; City of San Jose Housing Dept.)
2015
Number of Low-Income Seniors within Crime Hot SpotsAmerican Community Survey (2008-2012 5 Year estimates); City of San Jose Police Dept.
2008-12, 2015
Number of Seniors with Ambulatory Difficulty not served by MOW (County)
American Community Survey (2008-2012 5 Year estimates); Santa Clara County Social Services Agency (FY 13-14)
2008-12, 2013-14

66THE HEALTH TRUST

67FOOD FOR EVERYONE

68THE HEALTH TRUST

69FOOD FOR EVERYONE

70THE HEALTH TRUST

71FOOD FOR EVERYONE
Map Key: Individuals that are HomelessNumber Location of Informal Feeding Site
1 River Park Drive
2 St. James Park
3 Martin Luther King Library
4 Tully and Galveston
Number Name of Provider Address Type
1 Cathedral Basilica of St. Joseph 80 S Market St, San Jose, California, 95113 Food Pantry
2 Crossroads Bible Church - Downtown Outreach 150 E San Fernando St, San Jose, California, 95112 Food Pantry
3 Gloria Dei Lord’s Pantry 121 S White Rd, San Jose, California, 95127 Brown Bags
4 Goodwill of Silicon Valley 1080 N 7th St, San Jose, California, 95112 Congregate Meals
5 Holy Redeemer Lutheran Church 1948 The Alameda, San Jose, California, 95126 Congregate Meals
6 Martha’s Kitchen 311 Willow St, San Jose, California, 95110 Congregate Meals
7 Most Holy Trinity Church Pantry 2040 Nassau Dr, San Jose, California, 95122 Brown Bags
8 Our Lady of Guadalupe Catholic Church 2020 E San Antonio St, San Jose, California, 95116 Brown Bags
9 Family supportive housing (San Jose Family Shelter) 692 N King Rd, San Jose, California, 95133 Brown Bags
10 Santa Maria Urban Ministry 778 S Almaden Ave, San Jose, California, 95110 Food Pantry
11 Westgate Church/South Hills Community Church 6601 Camden Ave, San Jose, California, 95120 Brown Bags
12 Antioch Baptist Church 268 E Julian St, San Jose, California, 95112 Food Pantry
13 Archer Studios (Catholic Charities of SCC) 98 Archer St, San Jose, California, 95112 Brown Bags
14 Bethel Church 1201 S Winchester Blvd, San Jose, California, 95128 Food Pantry
15 Bible Way Christian Center 2090 Oakland Rd, San Jose, California, 95131 Brown Bags
16 Bill Wilson Center- Drop in Center. 693 N 2nd St, San Jose, California, 95112 Congregate Meals
17 Boxer’s Mayfair 44 N Jackson Ave, San Jose, California, 95116 Brown Bags
18 Cathedral of Faith Reaching Out 2315 Canoas Garden Ave, San Jose, California, 95125 Brown Bags
19 Church of Christ Feeding Program 81 N 8th St, San Jose, California, 95112 Congregate Meals
20 City Team International, Rescue Mission (Soup Kitchen) 1174 Old Bayshore Hwy, San Jose, California, 95112 Congregate Meals
21 CityTeam Ministries 1297 N 13th St, San Jose, California, 95112 Food Pantry
22 Community Outreach Ministry Endeavor (COME), First Immanuel Church 121 E San Salvador St, San Jose, California, 95112 Food Pantry
23 East Valley Pentecostal Church 2715 S White Rd, San Jose, California, 95148 Food Pantry
24 Eastside Church of God in Christ 2490 Story Rd, San Jose, California, 95122 Brown Bags
25 First Christian Church: “Recovery Cafe” program 80 S 5th St, San Jose, California, 95112 Congregate Meals
26 First Presbyterian Church 49 N 4th St, San Jose, California, 95112 Food Pantry
27 Food Not Bombs San Jose 95112, San Jose, California Congregate Meals
28 Girasol Apartments 1710 Alum Rock Ave, San Jose, California, 95116 Brown Bags
29 Grace Baptist Church/Grace Community Center 484 E San Fernando St, San Jose, California, 95112 Congregate Meals
30 HomeFirst ( Formerly EHC LifeBuilders) Boccardo Reception Center 2011 Little Orchard St, San Jose, California, 95125 Congregate Meals (and Food Pantry)
31 Kings Crossing (Catholic Charities of SCC) 678 N King Rd, San Jose, California, 95133 Brown Bags
32 Loaves and Fishes Family Kitchen at Eastside Neighborhood Center 2150 Alum Rock Ave, San Jose, California, 95116 Congregate Meals
33 Loaves and Fishes Family Kitchen Saint Maria Goretti Kitchen 2980 Senter Rd, San Jose, California, 95111 Congregate Meals
34 Maranatha Outreach Center - Mission Possible 1811 S 7th St, San Jose, California, 95112 Brown Bags
35 Mission Possible Re-Entry Program 151 W Mission St, San Jose, California, 95110 Brown Bags
36 Ohlone Chynoweth Commons 5300 Terner Way, San Jose, California, 95136 Food Pantry
37 Paseo Senter at Coyote Creek 1898 Senter Rd, San Jose, California, 95112 Food Pantry
38 Penzione Esparanza (Catholic Charities of SCC) 598 Columbia Ave, San Jose, California, 95126 Brown Bags
39 Sacred Heart Community Service/ Louise’s Pantry 1381 S 1st St, San Jose, California, 95110 Brown Bags (and Food Pantry)
40 Salvation Army/Emmanuel House 405 N 4th St, San Jose, California, 95112 Congregate Meals
41 St. Isabel Kitchen 1375 E Santa Clara St, San Jose, California, 95116 Congregate Meals
42 St. Julie Billiart Parish 366 St Julie Dr, San Jose, California, 95119 Brown Bags

72THE HEALTH TRUST

73FOOD FOR EVERYONE
Map Key: Low-Income SeniorsNumber Name of Provider Address Type
0 Alma Senior Center 1 136 W Alma Ave, San Jose, CA 95110 Brown Bag
1 Alma Senior Center 2 137 W Alma Ave, San Jose, CA 95110 SNP Congregate meal
2 Almaden Community Center 6455 Camden Ave, San Jose, CA 95120 SNP Congregate meal
3 Asian Americans for Community Involvement 2400 Moorpark Ave, San Jose, CA 95128 SNP Congregate meal
4 Berryessa Community Center 3050 Berryessa Rd, San Jose, CA 95132 SNP Congregate meal
5 Boxer’s Mayfair Village Senior Apartments 44 N Jackson Ave, San Jose, CA 95116 Brown Bag
6 Cambrian Center 2360 Samaritan Pl, San Jose, CA 95124 Brown Bag
7 Camden Community Center 3369 Union Ave, San Jose, CA 95124 SNP Congregate meal
8 Cryyout Christian Fellowship 3167 Senter Rd, San Jose, CA 95111 Brown Bag
9 Cypress Senior Center 1 403 Cypress Ave, San Jose, CA 95117 SNP Congregate meal
10 Eastside Neighborhood Center (Catholic Charities of SCC) 1 2150 Alum Rock Ave, San Jose, CA 95116 SNP Congregate meal
11 Eastside Neighborhood Center (Catholic Charities of SCC) 2 2150 Alum Rock Ave, San Jose, CA 95116 Brown Bag
12 Evergreen Community Center 4860 San Felipe Rd, San Jose, CA 95135 SNP Congregate meal
13 First Immanuel Lutheran Church 374 S 3rd St, San Jose, CA 95112 Brown Bag
14 Gardner Community Center 520 W Virginia St, San Jose, CA 95125 SNP Congregate Meal
15 Girasol Apartments 1710 Alum Rock Ave, San Jose, CA 95116 Brown Bag
16 Gloria Dei Lutheran Church 121 S White Rd, San Jose, CA 95127 Brown Bag
17 Hope Senior Center 30 Las Colinas Ln, San Jose, CA 95119 SNP Congregate meal
18 John XXIII Multi-Service Center (Catholic Charities of SCC) 1 195 E San Fernando St, San Jose, CA 95112 SNP Congregate meal
19 John XXIII Multi-Service Center (Catholic Charities of SCC) 2 195 E San Fernando St, San Jose, CA 95112 Brown Bag
20 Live Oak Adult Day Services (Willow Glen location) 1147 Minnesota Ave, San Jose, CA 95125 SNP Congregate Meal
21 Mayfair Community Center 1 2039 Kammerer Ave, San Jose, CA 95116 SNP Congregate meal
22 Mayfair Community Center 2 2039 Kammerer Ave, San Jose, CA 95116 Brown Bag
23 Mayfair Golden Manor – 1 2627 Madden Ave, San Jose, CA 95116 Brown Bag
24 Our Lady Of Guadalupe Church 2020 E San Antonio St, San Jose, CA 95116 Brown Bag
25 Portuguese Organization for Social Services and Opportunities (POSSO) – 1 1115 E Santa Clara St, San Jose, CA 95116 Brown Bag
26 Roosevelt Community Center 901 E Santa Clara St, San Jose, CA 95116 SNP Congregate Meal
27 Sacred Heart Church 325 Willow St, San Jose, CA 95110 Brown Bag
28 Santa Clara Valley Blind Center 101 N Bascom Ave, San Jose, CA 95128 SNP Congregate Meal
29 Seven Trees Community Center 1 3590 Cas Dr, San Jose, CA 95111 SNP Congregate meal
30 Southside Community and Senior Center 1 5585 Cottle Rd, San Jose, CA 95123 SNP Congregate meal
31 St. Maria Goretti Catholic Church 2980 Senter Rd, San Jose, CA 95111 Brown Bag
32 The Salvation Army Silicon Valley 359 N 4th St, San Jose, CA 95112 SNP Congregate meal
33 Trinity Episcopal Cathedral 81 N 2nd St, San Jose, CA 95113 Brown Bag
34 Westminster Presbyterian Church 1100 Shasta Ave, San Jose, CA 95126 Brown Bag
35 Willow Glen Community/Senior Center 2175 Lincoln Ave, San Jose, CA 95125 SNP Congregate meal
36 Willow Glen United Methodist Church 1420 Newport Ave, San Jose, CA 95125 Brown Bag
37 Yu Ai Kai ( Japanese American Community Services) 1 588 N 4th St, San Jose, CA 95112 SNP Congregate meal
38 Northside Community Center 488 N 6th St, San Jose, CA 95112 SNP Congregate meal
39 Alviso Senior Center 5050 N 1st St, San Jose, CA 95134 SNP Congregate meal
40 Billy De Frank LGBT Community Center 938 The Alameda, San Jose, CA 95126 SNP Congregate meal
41 Cypress Senior Center 2 403 Cypress Ave, San Jose, CA 95117 Brown Bag
43 Korean American Community Services 1099 N 4th St, San Jose, CA 95112 SNP Congregate meal
44 Mayfair Golden Manor – 2 2627 Madden Ave, San Jose, CA 95116 SNP Congregate meal
45 Portuguese Organization for Social Services and Opportunities (POSSO) – 2 1115 E Santa Clara St, San Jose, CA 95116 SNP Congregate meal
46 Seven Trees Community Center 2 3590 Cas Dr, San Jose, CA 95111 Brown Bag
47 Southside Community and Senior Center 2 5585 Cottle Rd, San Jose, CA 95123 Brown Bag
48 Yu Ai Kai ( Japanese American Community Services) 2 588 N 4th St, San Jose, CA 95112 Brown Bag

74THE HEALTH TRUST
Appendix D: Food Assistance Programs in San Jose

75FOOD FOR EVERYONE
Appendix E: Organizations Interviewed
SAFETY-NET PROVIDERS FOR INDIVIDUALS THAT ARE HOMELESS:
• HomeFirst
• Loaves & Fishes
• Martha’s Kitchen
• Sacred Heart Community Service
• Second Harvest Food Bank
SAFETY-NET PROVIDERS FOR LOW-INCOME SENIORS:
• Alzheimer’s Activity Center
• Asian Americans for Community Involvement
• City of San Jose, Senior Nutrition Program
• Institute on Aging
• MidPen Housing
• Outreach Mobility Management
• Santa Clara County Senior Nutrition Program
• Sourcewise
• The Health Trust

76THE HEALTH TRUST
The Health Trust Board of Trustees
Charles Bullock, Ph.D., Board Chair
Roberta L. Robins, J.D., Board Vice Chair
Cindy Ruby, Board Secretary
Craig Capurso
Darren A. Cde Baca, C.I.M.A., C.F.P.
Michael Celio, J.D.
Frederick J. Ferrer, M.S.
Jim Heerwagen, B.S.C.
Marianne Jackson, M.A.
David Katz, M.A., M.B.A.
Emily Lam, M.P.P
David Neighbors, C.P.A.

