food & beverage industry update 1/24/2013
TRANSCRIPT
www.harriswilliams.com
Member FINRA/SIPC
Food & Beverage Industry Update
1/24/2013

Food & Beverage
Industry Update
1/24/2013
Boston
Phone: +1 (617) 482-7501
Fax: +1 (617) 482-7503
Cleveland
Phone: +1 (216) 689-2400
Fax: +1 (216) 689-2401
London
Phone: +44 20 7518 8900
Fax: +44 20 7526 2187
Minneapolis
Phone: +1 (612) 359-2700
Fax: +1 (612) 359-2701
Philadelphia
Phone: +1 (267) 675-5900
Fax: +1 (267) 675-5901
Richmond
Phone: +1 (804) 648-0072
Fax: +1 (804) 648-0073
San Francisco
Phone: +1 (415) 288-4260
Fax: +1 (415) 288-4269
Announced Target Buyer1/0/1900 0 JAB Holdings B.V.
1/11/2013 Certain Hostess Bread Brands Flowers Foods, Inc. (NYSE:FLO)
1/11/2013 Phelps Industries, LLC Wafra Partners LLC
1/11/2013 Goldco, LLC PNC Riverarch Capital
1/10/2013 Attune Foods, Inc. Post Foods, LLC
1/9/2013 Old Dominion Peanut Company Hammond's Candies
1/8/2013 Cooper Spirits International Bacardi Limited
1/7/2013 Organic Avenue, LLC Kohlberg Kravis Roberts & Co.
1/4/2013 Carmela's Pizzeria Greenfield Farms Food, Inc.
1/3/2013 TC Global, Inc. Baristas Coffee Company Inc.
1/3/2013 Agricon Global Corporation Africa Farmlands, Inc.
Net Debt /
Industry Segment 3 Month 1 Year 3 Month 1 Year Fwd PE LTM PE EV/EBITDA EBITDA
Food and Beverage
Branded Processed Foods 3.8% 15.2% (6.5%) (14.9%) 17.1x 19.4x 11.3x 2.0x
Private Label Foods 1.7% 13.3% 3.4% 15.7% 22.5x 24.0x 11.9x 2.3x
Natural / Organic Foods (9.4%) 23.8% 10.3% (0.4%) 21.6x 26.3x 14.2x 1.8x
Baked Goods / Snack Foods 9.9% 19.0% 1.8% 4.2% 21.1x 21.2x 9.4x 2.0x
Dairy 7.3% 17.5% 6.8% 1.2% 16.9x 22.7x 11.6x 1.4x
Non-Alcholic Beverages 4.0% 11.8% 2.5% 9.1% 16.8x 19.5x 9.8x 1.8x
Alcoholic Beverages 6.5% 28.9% 8.7% 17.4% 18.0x 20.2x 15.5x 3.6x
Inputs
Protein Processing 10.5% 7.4% 14.5% 31.7% 11.1x 14.8x 7.5x 1.7x
Fruit and Vegetable (1.5%) 6.9% (0.9%) 1.8% 13.0x 12.2x 8.8x 4.5x
Ingredients / Flavors 3.3% 22.6% 6.0% 17.0% 15.2x 20.7x 11.7x 1.5x
Agribusiness 3.5% 20.4% 3.5% 42.5% 12.1x 14.5x 8.0x 3.3x
Consumer
Food Retail 1.1% 3.6% 1.1% (5.7%) 10.6x 13.2x 5.8x 2.4x
Foodservice / Distribution (1.5%) 14.3% 0.4% (0.6%) 14.7x 20.3x 8.1x 0.8x
Fast Food 7.8% 20.2% 6.4% 10.1% 19.0x 19.2x 9.8x 2.5x
Casual Dining (2.6%) 10.1% (1.5%) (4.1%) 16.1x 21.8x 8.1x 1.7x
Overall Median* 3.4% 13.5% 2.6% 6.6% 16.4x 19.9x 9.9x 2.0x
*Fast Food and Casual Dining excluded from overall median calculation.
Stock Price % Change EV/EBITDA % Change Current Valuation Stats
Quarterly M&A Activity Last 10 Deals Announced
LTM Deal Statistics
Key Trading
Statistics1
Announced
Food and
Beverage
M&A1
Contacts
For more information regarding our food and beverage experience, please contact Glenn Gurtcheff, Tim Alexander,
Ryan Budlong, Brant Cash, or Jeff Cleveland at +1 (612) 359-2700.
46 47 47 48 47
35
25
36
22
3436
46 47
25
33
49
34
42
53 52
48
42
15
8 73 6
5
5
2
3
4
7
5
7
13
6
7
7
5
4 7
9
4
0
10
20
30
40
50
60
70
Q3
07
Q4
07
Q1
08
Q2
08
Q3
08
Q4
08
Q1
09
Q2
09
Q3
09
Q4
09
Q1
10
Q2
10
Q3
10
Q4
10
Q1
11
Q2
11
Q3
11
Q4
11
Q1
12
Q2
12
Q3
12
Q4
12
Nu
mb
er o
f T
ra
nsa
cti
on
s__
PEG Acquirer Strategic AcquirerNote: Transaction statistics based on publically available information.
2 of 13
Aggregate Number Transaction Multiples
Value ($bn) of Deals EV / Revenue EV / EBITDA
$348.8 214 1.00x 9.8x

Food & Beverage
Industry Update
1/24/2013
According to the Bureau of Labor Statistics, the CPI index for food products rose 1.8% in
2012, a deceleration from its 4.7% increase in 2011. Link
Hormel Foods has announced the purchase of the Skippy peanut butter line from Unilever.
The transaction is valued at approximately $700 million. Link
According to PEHub, Dave’s Killer Bread has gone through a growth equity refinancing led
by Goode Partners. Link
Pacific Island Restaurants, a portfolio company of Brentwood Associates, was sold to
Nimes Capital in an HW&Co. led transaction. Link
Microstar Logistics, a leading provider of keg management services to the U.S. craft beer
industry, has been acquired by Freeman Spogli & Co., the Pohlad Family, and Management
in an HW&Co. led transaction. Link
Industry
Recent Equity
Offerings2 Close Date Filing Date Issuer Ticker
Transaction
Type
Gross Proceeds
($mm) Use of Funds
01/10/13 11/29/12 Xylitol Canada Inc XYL Follow-On $2.0 Working Capital
General Corp. Purp.
NA 12/19/12 Pinnacle Foods Inc N/A IPO $100.0 General Corp. Purp.
12/19/12 12/19/12 Feronia Inc FRN Follow-On $100.0 Working Capital
General Corp. Purp.
11/09/12 11/9/2012 Crumbs Bake Shop Inc CRMB Follow-On $13.6 General Corp. Purp.
10/29/12 10/29/12 Brick Brewing Co Ltd BRB Follow-On $0.6 General Corp. Purp.
10/26/12 10/26/12 Vanity Events Holding Inc VAEV Convertible $0.2 General Corp. Purp.
10/25/12 08/07/12 The WhiteWave Foods Co WWAV IPO $391.0 General Purp., Working
Cap., Debt Repayment
10/02/12 08/13/10 B&G Foods Inc BGS Follow-On $109.8 General Corp. Purp. &
Acqusition Fin.
09/27/12 09/27/12 Post Holdings Inc POST Follow-On $206.7 General Corp. Purp.
08/07/12 8/7/2012 Bloomin' Brands BLMN IPO $176.0 General Corp. Purp.
07/26/12 7/26/2012 Del Frisco's Restaurant Group DFRG IPO $75.4 General Corp. Purp.
07/24/12 7/24/2012 Feronia Inc FRN.V Follow-On $4.7 Working Capital
General Corp. Purp.
02/15/12 2/15/2012 AgriMarine Holdings Inc FSH.V Follow-On $10.0 Working Capital
General Corp. Purp.
3 of 13

Food & Beverage
Industry Update
1/24/2013
Quarterly Loan Volume Average Spread on Food and Beverage Loans
Credit Statistics Average Secondary Spreads
L + 0
L + 100
L + 200
L + 300
L + 400
L + 500
L + 600
2006 2007 2008 2009 2010 2011 2012
Av
era
ge S
prea
d O
ver L
IBO
R
Revolving Credit / Term Loan A Weighted-Average Institutional
Food and
Beverage Loan
Activity3
Recent Debt
Offerings4
Borrower Name Description Tranche Amount Type Rating Spread
12/31/12 Bama Companies Food service products $25,000,000 Term Loan NR / NR 325
12/31/12 Bama Companies Food service products $12,000,000 Revolver/Line >= 1 Yr. NR / NR 325
12/28/12 Dave's Killer Bread Bread, cake, and related products $27,000,000 Term Loan NR / NR 525
12/28/12 Dave's Killer Bread Bread, cake, and related products $5,000,000 Revolver/Line >= 1 Yr. NR / NR 525
12/28/12 Southern Eagle Distributing Malt beverages $165,000,000 Revolver/Line >= 1 Yr. NR / NR 200
12/21/12 ConAgra Foods Consumer Commercial Foods $4,500,000,000 Bridge Loan BBB- / Baa2 175
12/21/12 ConAgra Foods Consumer Commercial Foods $1,500,000,000 Term Loan A BBB- / Baa2 175
12/21/12 Sugar Creek Packing Co Food preparations $45,000,000 Revolver/Line >= 1 Yr. NR / NR 200
12/21/12 Sugar Creek Packing Co Food preparations $50,000,000 Delay Draw Term Loan NR / NR 122.5
12/20/12 Mercon Coffee Corp Roasted coffee $275,000,000 Revolver/Line >= 1 Yr. NR / NR N/A
12/20/12 Salm Partners LLC Sausages and other prepared meats $10,000,000 Revolver/Line >= 1 Yr. NR / NR 350
12/20/12 Salm Partners LLC Sausages and other prepared meats $19,000,000 Delay Draw Term Loan NR / NR 350
12/20/12 Salm Partners LLC Sausages and other prepared meats $24,000,000 Term Loan A NR / NR 350
12/20/12 Sunny Delight Beverages Co Provider of juice products $115,000,000 Term Loan A NR / WR 275
12/20/12 Sunny Delight Beverages Co Provider of juice products $40,000,000 Revolver/Line >= 1 Yr. NR / WR 275
12/19/12 CP Pokphand Co Ltd Prepared feeds $410,000,000 Term Loan N/A / NA N/A
4 of 13
$0
$2
$4
$6
$8
$10
$12
4Q06 2Q07 4Q07 2Q08 4Q08 2Q09 4Q09 2Q10 4Q10 2Q11 4Q11 2Q12 4Q12
Lo
an
Vo
lum
e b
y Q
ua
rte
r (
$ i
n b
illi
on
s)
Pro Rata Institutional
0.0x
2.0x
4.0x
6.0x
Debt/EBITDA Senior
Debt/EBITDA
EBITDA/Cash
Interest
EBITDA -
Capex/Cash
Interest
EB
ITD
A M
ult
iple
2007 2008 2009 2010 2011 2012
L + 0
L + 200
L + 400
L + 600
L + 800
L + 1000A
vera
ge S
prea
d O
ver L
IBO
R

Food & Beverage
Industry Update
1/24/2013
Price at As a % of Market Cash & Enterprise P/E
($ in millions, except per share data) Ticker 1/18/13 52-wk High Cap Debt Equiv. Value (EV) Revenue EBITDA 1 Year 3 Years Gross EBITDA Multiple Revenue EBITDA Revenue EBITDA
Food and Beverage
Branded Processed Foods
Campbell Soup Co. CPB $36.29 97.7% $11,410 $4,523 $370 $15,563 $7,882 $1,573 2.3% 1.5% 38.4% 20.0% 15.3x 1.97x 9.9x 1.81x 9.6x
ConAgra Foods, Inc. CAG 31.70 100.0% 13,119 3,777 477 16,420 13,773 1,484 6.9% 4.4% 23.5% 10.8% 20.0x 1.19x 11.1x 1.11x 8.4x
General Mills, Inc. GIS 41.37 98.8% 26,750 8,333 735 34,348 17,119 3,510 8.7% 5.2% 37.3% 20.5% 15.3x 2.01x 9.8x 1.89x 9.6x
The Hershey Company HSY 78.28 100.0% 17,472 1,991 466 18,997 6,460 1,380 7.7% 7.0% 43.3% 21.4% 27.5x 2.94x 13.8x 2.76x 12.5x
H. J. Heinz Company HNZ 60.03 100.0% 19,249 5,044 1,013 23,279 11,621 2,017 3.2% 5.2% 35.7% 17.4% 18.9x 2.00x 11.5x 1.94x 11.1x
Hormel Foods Corporation HRL 34.69 99.4% 9,145 250 760 8,635 8,231 845 4.3% 8.0% 16.2% 10.3% 18.7x 1.05x 10.2x 0.99x 9.5x
Kellogg Company K 58.21 100.0% 20,864 7,937 305 28,496 13,649 2,370 4.6% 2.7% 40.1% 17.4% 17.6x 2.09x 12.0x 1.89x 11.4x
Mondelez International, Inc. MDLZ 28.08 66.0% 49,901 30,001 3,964 75,938 53,976 8,999 1.0% 11.6% 35.5% 16.7% 15.0x 1.41x 8.4x 2.07x 12.7x
McCormick & Company, Incorporated MKC 66.65 100.0% 8,829 1,258 89 9,998 3,979 683 11.6% 7.8% 40.6% 17.2% 22.9x 2.51x 14.6x 2.37x 13.5x
Nestlé S.A. NESN 67.83 99.1% 210,050 26,204 10,363 225,891 91,652 17,056 (2.8%) (2.2%) 47.1% 18.6% 20.4x 2.46x 13.2x NA NA
The Hain Celestial Group, Inc. HAIN 55.06 74.7% 2,548 360 36 2,872 1,451 185 27.6% 10.8% 27.4% 12.7% 25.2x 1.98x 15.6x 1.54x 11.8x
The J. M. Smucker Company SJM 89.56 99.2% 9,714 2,069 204 11,580 5,821 1,167 11.9% 8.3% 33.6% 20.0% 20.7x 1.99x 9.9x 1.92x 9.3x
Mean 7.2% 5.9% 34.9% 16.9% 19.8x 1.97x 11.7x 1.84x 10.8x
Median 5.8% 6.1% 36.5% 17.4% 19.4x 2.00x 11.3x 1.89x 11.1x
Private Label Foods
Flowers Foods, Inc. FLO $27.06 99.3% $3,739 $122 $9 $3,852 $2,754 $295 2.3% 1.3% 48.0% 10.7% 30.7x 1.40x 13.1x 1.16x 10.2x
Snyder's-Lance, Inc. LNCE 25.65 94.7% 1,762 198 9 1,951 1,611 164 6.8% 21.3% 33.7% 10.2% 24.0x 1.21x 11.9x 1.10x 9.7x
Seneca Foods Corp. SENE.B 30.05 97.4% 354 319 19 655 1,270 91 2.4% (0.8%) 10.7% 7.2% NA 0.52x 7.2x NA NA
Treehouse Foods, Inc. THS 52.97 83.2% 1,917 955 84 2,788 2,125 282 5.0% 12.2% 21.4% 13.3% 21.1x 1.31x 9.9x 1.24x 9.1x
Mean 13.0% 10.4% 32.9% 10.2% 25.3x 1.12x 10.8x 1.14x 10.3x
Median 5.0% 12.2% 33.7% 10.2% 24.0x 1.21x 11.9x 1.13x 9.9x
Natural / Organic Foods
Amira Nature Foods Ltd. ANFI $7.13 69.6% $254 $163 $4 $413 $360 $43 77.5% NA 20.5% 12.1% 5.8x 1.15x 9.5x 0.95x 7.5x
Annie's, Inc. BNNY 36.39 74.5% 623 0 15 608 155 21 20.3% NA 39.7% 13.5% NM 3.93x 29.2x 3.25x 21.1x
Monster Beverage Corporation MNST 47.82 57.0% 8,195 0 591 7,604 1,999 556 24.0% 21.8% 51.8% 27.8% 26.3x 3.80x 13.7x 3.27x 11.5x
SunOpta Inc. TSX:SOY 6.63 99.7% 438 165 4 599 1,126 64 11.6% 9.2% 12.6% 5.7% 33.5x 0.53x 9.3x 0.52x 7.1x
The Hain Celestial Group, Inc. HAIN 55.06 74.7% 2,548 360 36 2,872 1,451 185 27.6% 10.8% 27.4% 12.7% 25.2x 1.98x 15.6x 1.54x 11.8x
United Natural Foods, Inc. UNFI 51.81 84.6% 2,553 150 9 2,695 5,429 207 15.6% 16.0% 17.2% 3.8% 26.2x 0.50x 13.0x 0.44x 11.2x
Whole Foods Market, Inc. WFM 90.54 88.9% 16,797 24 1,220 15,601 11,699 1,066 15.7% 13.4% 35.5% 9.1% 35.9x 1.33x 14.6x 1.19x 12.7x
Mean 19.1% 14.2% 30.7% 12.1% 29.4x 2.01x 15.9x 1.70x 12.6x
Median 18.0% 13.4% 31.5% 10.9% 26.3x 1.66x 14.2x 1.36x 11.6x
Baked Goods / Snack Foods
ARYZTA AG YZA $53.67 97.2% $3,845 $1,963 $674 $5,134 $5,180 $665 (7.1%) 4.2% 28.1% 12.8% NA 0.99x 7.7x NA NA
Associated British Foods plc ABF 25.95 97.6% 20,469 2,360 652 22,177 19,911 2,391 13.9% 8.8% 24.2% 12.0% 23.3x 1.11x 9.3x NA NA
Diamond Foods, Inc. DMND 13.99 35.6% 309 613 10 912 952 33 (4.9%) 19.7% 18.6% 3.5% NM 0.96x NA 0.99x 9.3x
Flowers Foods, Inc. FLO 27.06 99.3% 3,739 122 9 3,852 2,754 295 2.3% 1.3% 48.0% 10.7% 30.7x 1.40x 13.1x 1.16x 10.2x
George Weston Limited WN 71.70 99.8% 9,194 8,363 3,558 13,999 33,437 2,184 7.4% 2.5% 24.6% 6.5% 18.9x 0.42x 6.4x 0.42x 5.6x
Golden Enterprises Inc. GLDC 3.51 94.8% 41 7 1 47 138 7 2.2% 2.7% 48.5% 5.4% 19.0x 0.34x 6.3x NA NA
Grupo Bimbo, S.A.B. de C.V. BIMBO A 2.60 96.2% 12,235 3,321 337 15,219 13,162 1,275 48.3% 17.8% 50.7% 9.7% NM 1.16x 11.9x 1.06x 12.3x
J&J Snack Foods Corp. JJSF 66.11 99.7% 1,241 1 155 1,086 831 116 11.7% 8.4% 30.1% 14.0% 23.1x 1.31x 9.4x 1.24x 8.0x
John B Sanfilippo & Son Inc. JBSS 19.96 98.3% 215 87 2 300 721 58 5.4% 9.7% 16.1% 8.0% 9.8x 0.42x 5.2x NA NA
Lancaster Colony Corporation LANC 71.54 91.3% 1,953 0 193 1,760 1,148 172 4.4% 3.3% 21.8% 14.9% 19.3x 1.53x 10.3x 1.47x 9.5x
Penford Corporation PENX 8.09 81.4% 100 89 0 189 365 24 9.4% 11.6% 12.4% 6.5% NM 0.52x 8.0x 0.49x 4.8x
Ralcorp Holdings Inc. RAH 89.91 100.0% 5,006 2,022 352 6,675 4,322 565 14.1% 15.3% 20.2% 13.1% NM 1.54x 11.8x 1.50x 10.4x
Inventure Foods, Inc. SNAK 6.98 90.2% 133 23 1 156 186 15 22.9% 15.5% 19.2% 7.9% 23.4x 0.84x 10.5x 0.79x 8.8x
Mean 11.4% 9.7% 27.9% 9.4% 20.9x 0.96x 9.3x 1.01x 8.7x
Median 8.4% 9.3% 23.0% 8.9% 21.2x 1.04x 9.4x 1.06x 9.3x
Last Twelve Months (LTM) EV / LTM EV / 2013ERevenue Growth LTM Margins
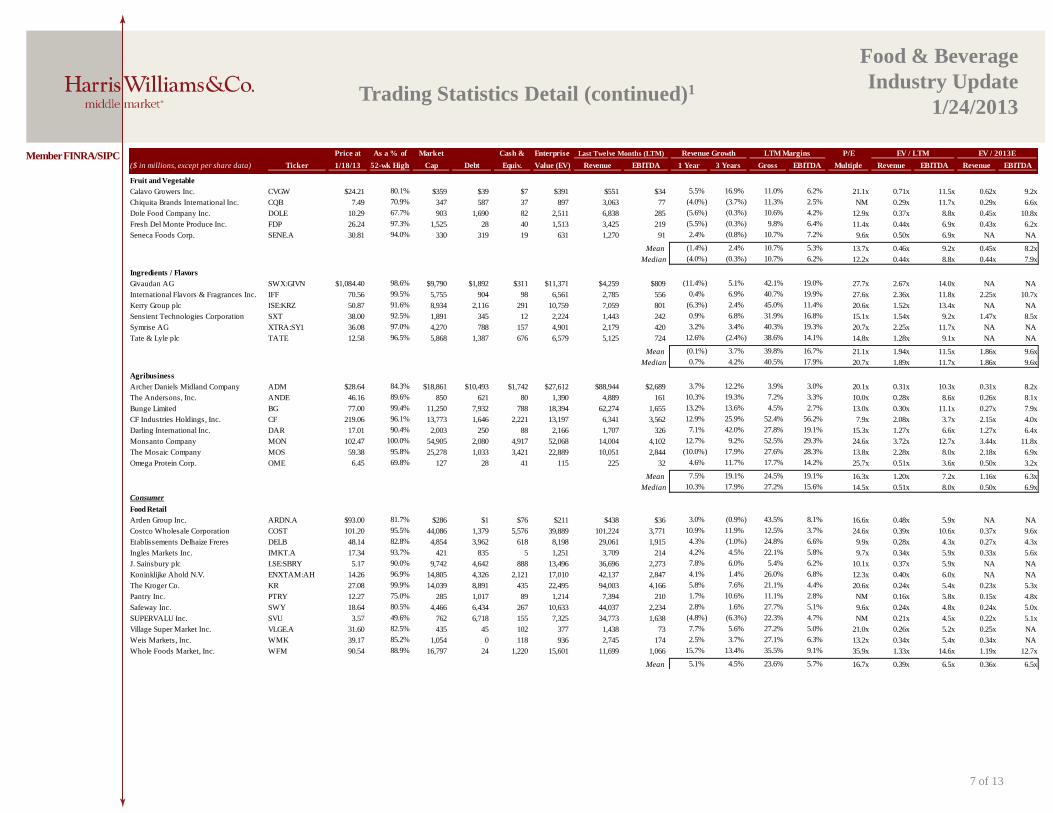
Trading Statistics Detail1
5 of 13
Member FINRA/SIPC

Food & Beverage
Industry Update
1/24/2013
Member FINRA/SIPC
Trading Statistics Detail (continued)1
6 of 13
Price at As a % of Market Cash & Enterprise P/E
($ in millions, except per share data) Ticker 1/18/13 52-wk High Cap Debt Equiv. Value (EV) Revenue EBITDA 1 Year 3 Years Gross EBITDA Multiple Revenue EBITDA Revenue EBITDA
Dairy
Dean Foods Company DF $18.37 95.8% $3,403 $3,556 $70 $6,889 $12,779 $855 (1.0%) 4.5% 24.6% 6.7% 28.0x 0.54x 8.1x 0.52x 8.2x
Fromageries Bel ENXTPA:FBEL $243.30 94.9% 1,665 391 151 1,905 3,296 353 (8.2%) 1.7% 28.8% 10.7% 12.0x 0.58x 5.4x NA NA
Glanbia plc GL9 11.16 98.8% 3,289 920 208 4,001 3,485 311 (2.9%) 6.3% 16.8% 8.9% 19.0x 1.15x 12.9x NA NA
Danone BN 66.22 90.6% 40,233 12,423 3,533 49,123 25,436 4,397 (4.7%) 6.4% 50.3% 17.3% 17.8x 1.93x 11.2x NA NA
Lifeway Foods Inc. LWAY 9.33 84.1% 153 6 5 153 77 10 13.8% 12.6% 35.3% 12.5% 36.6x 1.98x 15.8x 1.58x 13.0x
Saputo, Inc. TSX:SAP 50.20 96.8% 9,898 465 145 10,219 7,049 845 13.6% 8.6% 12.0% 12.0% 26.5x 1.45x 12.1x 1.22x 10.1x
Mean 1.8% 6.7% 28.0% 11.4% 23.3x 1.27x 10.9x 1.11x 10.4x
Median (2.0%) 6.4% 26.7% 11.4% 22.7x 1.30x 11.6x 1.22x 10.1x
Non-Alcholic Beverages
A.G.Barr p.l.c. LSE:BAG $8.25 97.3% $952 $18 $0 $970 $382 $63 2.2% 6.1% 50.1% 16.5% 22.0x 2.54x 15.4x NA NA
Cott Corporation BCB 8.75 99.3% 834 604 88 1,350 2,283 201 (1.4%) 13.0% 12.3% 8.8% 24.8x 0.59x 6.7x 0.58x 5.4x
Dr Pepper Snapple Group, Inc. DPS 45.30 98.3% 9,427 2,766 395 11,798 5,972 1,311 2.0% 2.5% 58.2% 22.0% 15.5x 1.98x 9.0x 1.93x 8.4x
Green Mountain Coffee Roasters Inc. GMCR 40.60 57.1% 6,027 541 58 6,509 3,859 751 45.6% 70.0% 32.9% 19.4% 17.8x 1.69x 8.7x 1.44x 7.4x
Monster Beverage Corporation MNST 47.82 57.0% 8,195 0 591 7,604 1,999 556 24.0% 21.8% 51.8% 27.8% 26.3x 3.80x 13.7x 3.27x 11.5x
Jones Soda Co. JSDA 0.30 41.7% 12 0 1 10 17 (4) (2.4%) (15.7%) 26.7% NM NM 0.60x NM NA NA
Lassonde Industries Inc. LAS.A 79.50 95.8% 556 313 9 859 1,030 122 69.5% 29.3% 26.7% 11.9% 13.9x 0.83x 7.0x NA NA
National Beverage Corp. FIZZ 13.95 78.6% 646 0 49 597 651 81 6.6% 3.3% 32.4% 12.4% 14.1x 0.92x 7.4x NA NA
Pepsico, Inc. PEP 72.48 98.4% 112,116 27,943 5,711 134,348 65,696 12,586 1.9% 15.5% 52.3% 19.2% 19.3x 2.04x 10.7x 2.00x 10.5x
Starbucks Corporation SBUX 54.81 88.4% 40,757 550 2,037 39,269 13,300 2,382 13.7% 10.8% 56.3% 17.9% 30.6x 2.95x 16.5x 2.62x 12.9x
The Coca-Cola Company KO 37.70 92.7% 169,091 32,741 18,084 183,748 47,602 13,012 3.5% 15.9% 60.4% 27.3% 19.7x 3.86x 14.1x 3.69x 12.8x
Mean 15.0% 15.7% 41.8% 18.3% 20.4x 1.98x 10.9x 2.22x 9.8x
Median 3.5% 13.0% 50.1% 18.5% 19.5x 1.98x 9.8x 2.00x 10.5x
Alcoholic Beverages
Anheuser-Busch InBev SA/NV ENXTBR:ABI $89.33 94.6% $142,964 $39,843 $3,793 $179,014 $39,345 $15,281 1.8% 4.6% 58.4% 38.8% 19.0x 4.55x 11.7x 3.94x 10.2x
Brown-Forman Corporation BF.B 64.62 91.0% 13,805 512 369 13,948 2,747 889 0.3% 4.6% 67.8% 32.4% 24.9x 5.08x 15.7x 3.54x 14.1x
Constellation Brands Inc. STZ 38.74 99.4% 7,114 4,051 204 10,961 2,728 667 (0.5%) (7.0%) 40.3% 24.4% 17.4x 4.02x 16.4x 2.21x 10.2x
Corby Distilleries Limited CDL.A 18.87 97.7% 537 0 115 423 141 40 (10.0%) (2.8%) 59.9% 28.1% 12.2x 3.01x 10.7x 3.01x 9.4x
Diageo plc DGE 29.25 97.5% 73,362 13,895 1,688 85,569 16,880 5,534 6.1% 3.8% 60.7% 32.8% 23.7x 5.07x 15.5x 4.71x 13.8x
Kirin Holdings Company, Limited TSE:2503 11.91 98.6% 11,458 11,334 1,253 21,538 23,680 3,040 (14.0%) (2.2%) 41.5% 12.8% NM 0.91x 7.1x NA NA
Pernod-Ricard SA RI 122.30 99.7% 32,226 12,900 1,018 44,108 10,414 2,748 (6.2%) 1.0% 61.4% 26.4% 21.3x 4.24x 16.0x NA NA
SABMiller plc LSE:SAB 47.36 99.5% 75,608 18,621 781 93,448 17,120 5,432 7.5% 9.7% 69.0% 31.7% 17.5x 5.46x 17.2x NA NA
Sapporo Holdings Ltd. TSE:2501 3.27 92.5% 1,285 2,640 111 3,814 5,389 450 (3.3%) 7.4% 36.6% 8.4% 36.1x 0.71x 8.5x NA NA
Mean (2.0%) 2.1% 55.1% 26.2% 21.5x 3.67x 13.2x 3.48x 11.5x
Median (0.5%) 3.8% 59.9% 28.1% 20.2x 4.24x 15.5x 3.54x 10.2x
Inputs
Protein Processing
Cal-Maine Foods, Inc. CALM $41.61 87.3% $1,000 $70 $163 $908 $1,181 $113 12.3% 9.5% 17.0% 9.6% 11.4x 0.77x 8.0x 0.70x 5.4x
Sanderson Farms, Inc. SAFM 49.27 88.2% 1,135 161 28 1,268 2,386 156 20.6% 10.1% 7.3% 6.6% 21.0x 0.53x 8.1x 0.51x 9.5x
Seaboard Corp. SEB 2,532.01 92.5% 3,038 218 469 2,788 5,865 401 5.7% 15.7% 9.5% 6.8% 10.7x 0.48x 7.0x 0.44x NA
Smithfield Foods, Inc. SFD 23.37 96.5% 3,241 2,351 124 5,468 13,005 873 2.3% 3.9% 11.1% 6.7% 15.9x 0.42x 6.3x 0.41x 6.0x
Tyson Foods Inc. TSN 21.85 98.9% 7,833 2,432 1,071 9,194 33,278 1,747 3.1% 7.6% 6.5% 5.2% 13.8x 0.28x 5.3x 0.27x 5.4x
Mean 8.9% 11.0% 10.5% 6.8% 17.2x 0.50x 7.2x 0.47x 6.6x
Median 7.4% 9.8% 10.3% 6.6% 14.8x 0.49x 7.5x 0.44x 5.7x
Last Twelve Months (LTM) EV / LTMRevenue Growth LTM Margins EV / 2013E
Food & Beverage
Industry Update
1/24/2013
Member FINRA/SIPC
7 of 13
Trading Statistics Detail (continued)1
Price at As a % of Market Cash & Enterprise P/E
($ in millions, except per share data) Ticker 1/18/13 52-wk High Cap Debt Equiv. Value (EV) Revenue EBITDA 1 Year 3 Years Gross EBITDA Multiple Revenue EBITDA Revenue EBITDA
Fruit and Vegetable
Calavo Growers Inc. CVGW $24.21 80.1% $359 $39 $7 $391 $551 $34 5.5% 16.9% 11.0% 6.2% 21.1x 0.71x 11.5x 0.62x 9.2x
Chiquita Brands International Inc. CQB 7.49 70.9% 347 587 37 897 3,063 77 (4.0%) (3.7%) 11.3% 2.5% NM 0.29x 11.7x 0.29x 6.6x
Dole Food Company Inc. DOLE 10.29 67.7% 903 1,690 82 2,511 6,838 285 (5.6%) (0.3%) 10.6% 4.2% 12.9x 0.37x 8.8x 0.45x 10.8x
Fresh Del Monte Produce Inc. FDP 26.24 97.3% 1,525 28 40 1,513 3,425 219 (5.5%) (0.3%) 9.8% 6.4% 11.4x 0.44x 6.9x 0.43x 6.2x
Seneca Foods Corp. SENE.A 30.81 94.0% 330 319 19 631 1,270 91 2.4% (0.8%) 10.7% 7.2% 9.6x 0.50x 6.9x NA NA
Mean (1.4%) 2.4% 10.7% 5.3% 13.7x 0.46x 9.2x 0.45x 8.2x
Median (4.0%) (0.3%) 10.7% 6.2% 12.2x 0.44x 8.8x 0.44x 7.9x
Ingredients / Flavors
Givaudan AG SWX:GIVN $1,084.40 98.6% $9,790 $1,892 $311 $11,371 $4,259 $809 (11.4%) 5.1% 42.1% 19.0% 27.7x 2.67x 14.0x NA NA
International Flavors & Fragrances Inc. IFF 70.56 99.5% 5,755 904 98 6,561 2,785 556 0.4% 6.9% 40.7% 19.9% 27.6x 2.36x 11.8x 2.25x 10.7x
Kerry Group plc ISE:KRZ 50.87 91.6% 8,934 2,116 291 10,759 7,059 801 (6.3%) 2.4% 45.0% 11.4% 20.6x 1.52x 13.4x NA NA
Sensient Technologies Corporation SXT 38.00 92.5% 1,891 345 12 2,224 1,443 242 0.9% 6.8% 31.9% 16.8% 15.1x 1.54x 9.2x 1.47x 8.5x
Symrise AG XTRA:SY1 36.08 97.0% 4,270 788 157 4,901 2,179 420 3.2% 3.4% 40.3% 19.3% 20.7x 2.25x 11.7x NA NA
Tate & Lyle plc TATE 12.58 96.5% 5,868 1,387 676 6,579 5,125 724 12.6% (2.4%) 38.6% 14.1% 14.8x 1.28x 9.1x NA NA
Mean (0.1%) 3.7% 39.8% 16.7% 21.1x 1.94x 11.5x 1.86x 9.6x
Median 0.7% 4.2% 40.5% 17.9% 20.7x 1.89x 11.7x 1.86x 9.6x
Agribusiness
Archer Daniels Midland Company ADM $28.64 84.3% $18,861 $10,493 $1,742 $27,612 $88,944 $2,689 3.7% 12.2% 3.9% 3.0% 20.1x 0.31x 10.3x 0.31x 8.2x
The Andersons, Inc. ANDE 46.16 89.6% 850 621 80 1,390 4,889 161 10.3% 19.3% 7.2% 3.3% 10.0x 0.28x 8.6x 0.26x 8.1x
Bunge Limited BG 77.00 99.4% 11,250 7,932 788 18,394 62,274 1,655 13.2% 13.6% 4.5% 2.7% 13.0x 0.30x 11.1x 0.27x 7.9x
CF Industries Holdings, Inc. CF 219.06 96.1% 13,773 1,646 2,221 13,197 6,341 3,562 12.9% 25.9% 52.4% 56.2% 7.9x 2.08x 3.7x 2.15x 4.0x
Darling International Inc. DAR 17.01 90.4% 2,003 250 88 2,166 1,707 326 7.1% 42.0% 27.8% 19.1% 15.3x 1.27x 6.6x 1.27x 6.4x
Monsanto Company MON 102.47 100.0% 54,905 2,080 4,917 52,068 14,004 4,102 12.7% 9.2% 52.5% 29.3% 24.6x 3.72x 12.7x 3.44x 11.8x
The Mosaic Company MOS 59.38 95.8% 25,278 1,033 3,421 22,889 10,051 2,844 (10.0%) 17.9% 27.6% 28.3% 13.8x 2.28x 8.0x 2.18x 6.9x
Omega Protein Corp. OME 6.45 69.8% 127 28 41 115 225 32 4.6% 11.7% 17.7% 14.2% 25.7x 0.51x 3.6x 0.50x 3.2x
Mean 7.5% 19.1% 24.5% 19.1% 16.3x 1.20x 7.2x 1.16x 6.3x
Median 10.3% 17.9% 27.2% 15.6% 14.5x 0.51x 8.0x 0.50x 6.9x
Consumer
Food Retail
Arden Group Inc. ARDN.A $93.00 81.7% $286 $1 $76 $211 $438 $36 3.0% (0.9%) 43.5% 8.1% 16.6x 0.48x 5.9x NA NA
Costco Wholesale Corporation COST 101.20 95.5% 44,086 1,379 5,576 39,889 101,224 3,771 10.9% 11.9% 12.5% 3.7% 24.6x 0.39x 10.6x 0.37x 9.6x
Etablissements Delhaize Freres DELB 48.14 82.8% 4,854 3,962 618 8,198 29,061 1,915 4.3% (1.0%) 24.8% 6.6% 9.9x 0.28x 4.3x 0.27x 4.3x
Ingles Markets Inc. IMKT.A 17.34 93.7% 421 835 5 1,251 3,709 214 4.2% 4.5% 22.1% 5.8% 9.7x 0.34x 5.9x 0.33x 5.6x
J. Sainsbury plc LSE:SBRY 5.17 90.0% 9,742 4,642 888 13,496 36,696 2,273 7.8% 6.0% 5.4% 6.2% 10.1x 0.37x 5.9x NA NA
Koninklijke Ahold N.V. ENXTAM:AH 14.26 96.9% 14,805 4,326 2,121 17,010 42,137 2,847 4.1% 1.4% 26.0% 6.8% 12.3x 0.40x 6.0x NA NA
The Kroger Co. KR 27.08 99.9% 14,039 8,891 435 22,495 94,003 4,166 5.8% 7.6% 21.1% 4.4% 20.6x 0.24x 5.4x 0.23x 5.3x
Pantry Inc. PTRY 12.27 75.0% 285 1,017 89 1,214 7,394 210 1.7% 10.6% 11.1% 2.8% NM 0.16x 5.8x 0.15x 4.8x
Safeway Inc. SWY 18.64 80.5% 4,466 6,434 267 10,633 44,037 2,234 2.8% 1.6% 27.7% 5.1% 9.6x 0.24x 4.8x 0.24x 5.0x
SUPERVALU Inc. SVU 3.57 49.6% 762 6,718 155 7,325 34,773 1,638 (4.8%) (6.3%) 22.3% 4.7% NM 0.21x 4.5x 0.22x 5.1x
Village Super Market Inc. VLGE.A 31.60 82.5% 435 45 102 377 1,438 73 7.7% 5.6% 27.2% 5.0% 21.0x 0.26x 5.2x 0.25x NA
Weis Markets, Inc. WMK 39.17 85.2% 1,054 0 118 936 2,745 174 2.5% 3.7% 27.1% 6.3% 13.2x 0.34x 5.4x 0.34x NA
Whole Foods Market, Inc. WFM 90.54 88.9% 16,797 24 1,220 15,601 11,699 1,066 15.7% 13.4% 35.5% 9.1% 35.9x 1.33x 14.6x 1.19x 12.7x
Mean 5.1% 4.5% 23.6% 5.7% 16.7x 0.39x 6.5x 0.36x 6.5x
LTM Margins EV / LTM EV / 2013ELast Twelve Months (LTM) Revenue Growth

Food & Beverage
Industry Update
1/24/2013
Member FINRA/SIPC
8 of 13
Trading Statistics Detail (continued)1
Price at As a % of Market Cash & Enterprise P/E
($ in millions, except per share data) Ticker 1/18/13 52-wk High Cap Debt Equiv. Value (EV) Revenue EBITDA 1 Year 3 Years Gross EBITDA Multiple Revenue EBITDA Revenue EBITDA
Foodservice / Distribution
Core-Mark Holding Company, Inc. CORE $51.32 99.0% $591 $22 $13 $600 $6,832 $76 15.4% 11.9% 6.8% 1.1% 20.3x 0.09x 7.9x 0.06x 5.8x
Nash Finch Co. NAFC 19.82 65.1% 243 389 1 631 4,784 125 (0.7%) (2.6%) 8.1% 2.6% NM 0.13x 5.0x 0.13x 5.4x
Sysco Corporation SYY 31.47 97.1% 18,498 3,019 550 20,967 42,881 2,503 6.8% 5.9% 18.0% 5.8% 16.7x 0.49x 8.4x 0.46x 8.5x
United Natural Foods, Inc. UNFI 51.81 84.6% 2,553 150 9 2,695 5,429 207 15.6% 16.0% 17.2% 3.8% 26.2x 0.50x 13.0x 0.44x 11.2x
Mean 9.3% 7.8% 12.5% 3.3% 21.1x 0.30x 8.6x 0.27x 7.7x
Median 11.1% 8.9% 12.6% 3.2% 20.3x 0.31x 8.1x 0.28x 7.2x
Fast Food
Domino's Pizza, Inc. DPZ $46.05 99.5% $2,614 $1,567 $35 $4,147 $1,641 $310 0.6% 6.2% 29.6% 18.9% 25.8x 2.53x 13.4x 2.38x 13.2x
Jack in the Box Inc. JACK 29.48 99.4% 1,274 421 8 1,687 1,545 206 (7.1%) (14.5%) 22.2% 13.3% 21.1x 1.09x 8.2x 1.07x 7.5x
McDonald's Corp. MCD 92.26 90.5% 92,627 13,264 2,188 103,703 27,438 9,780 3.9% 7.1% 39.4% 35.6% 17.4x 3.78x 10.6x 3.64x 10.0x
Sonic Corp. SONC 11.45 99.7% 637 509 43 1,103 541 132 (0.7%) (6.3%) 52.8% 24.4% 18.4x 2.04x 8.3x 2.01x 8.2x
The Wendy's Company WEN 5.10 95.7% 1,995 1,457 454 2,998 2,505 332 3.0% 0.9% 24.9% 13.3% NM 1.20x 9.0x 1.15x 8.4x
Yum! Brands, Inc. YUM 65.15 87.2% 29,435 3,021 942 31,514 13,591 2,839 12.5% 7.8% 26.8% 20.9% 19.2x 2.32x 11.1x 2.26x 10.4x
Mean 2.1% 0.2% 32.6% 21.1% 20.4x 2.16x 10.1x 2.09x 9.6x
Median 1.8% 3.6% 28.2% 19.9% 19.2x 2.18x 9.8x 2.14x 9.2x
Casual Dining
Biglari Holdings Inc. BH $399.46 92.5% $573 $248 $330 $491 $740 $71 4.4% 5.6% 26.4% 9.6% 24.7x 0.66x 6.9x NA NA
Bob Evans Farms, Inc. BOBE 44.15 99.5% 1,241 198 5 1,434 1,662 199 0.2% (1.3%) 37.5% 11.9% 18.8x 0.86x 7.2x 0.84x 6.5x
Brinker International, Inc. EAT 33.37 92.1% 2,441 698 64 3,075 2,836 371 2.2% (1.7%) 18.4% 13.1% 17.0x 1.08x 8.3x 1.05x 7.4x
Buffalo Wild Wings Inc. BWLD 76.32 80.5% 1,419 0 84 1,336 957 143 31.5% 22.9% 24.8% 14.9% 26.3x 1.40x 9.3x 1.11x 7.4x
Chipotle Mexican Grill, Inc. CMG 295.02 66.7% 9,292 4 574 8,722 2,629 534 22.0% 21.2% 38.0% 20.3% 34.3x 3.32x 16.3x 2.88x 14.6x
Darden Restaurants, Inc. DRI 45.38 78.3% 5,870 2,933 61 8,742 8,220 1,103 6.2% 4.8% 23.2% 13.4% 12.9x 1.06x 7.9x 0.98x 7.5x
Panera Bread Co. PNRA 163.51 93.3% 4,863 0 290 4,574 2,054 350 17.1% 15.2% 35.4% 17.1% 30.0x 2.23x 13.1x 1.96x 11.0x
The Cheesecake Factory Incorporated CAKE 33.40 92.2% 1,755 56 56 1,755 1,822 225 7.4% 4.4% 42.9% 12.4% 17.4x 0.96x 7.8x 0.92x 7.2x
Mean 11.4% 8.9% 30.8% 14.1% 22.7x 1.45x 9.6x 1.39x 8.8x
Median 6.8% 5.2% 30.9% 13.3% 21.8x 1.07x 8.1x 1.05x 7.4x
Last Twelve Months (LTM) Revenue Growth LTM Margins EV / LTM EV / 2013E
Food & Beverage
Industry Update
1/24/2013
Food and
Beverage
Industry Stock
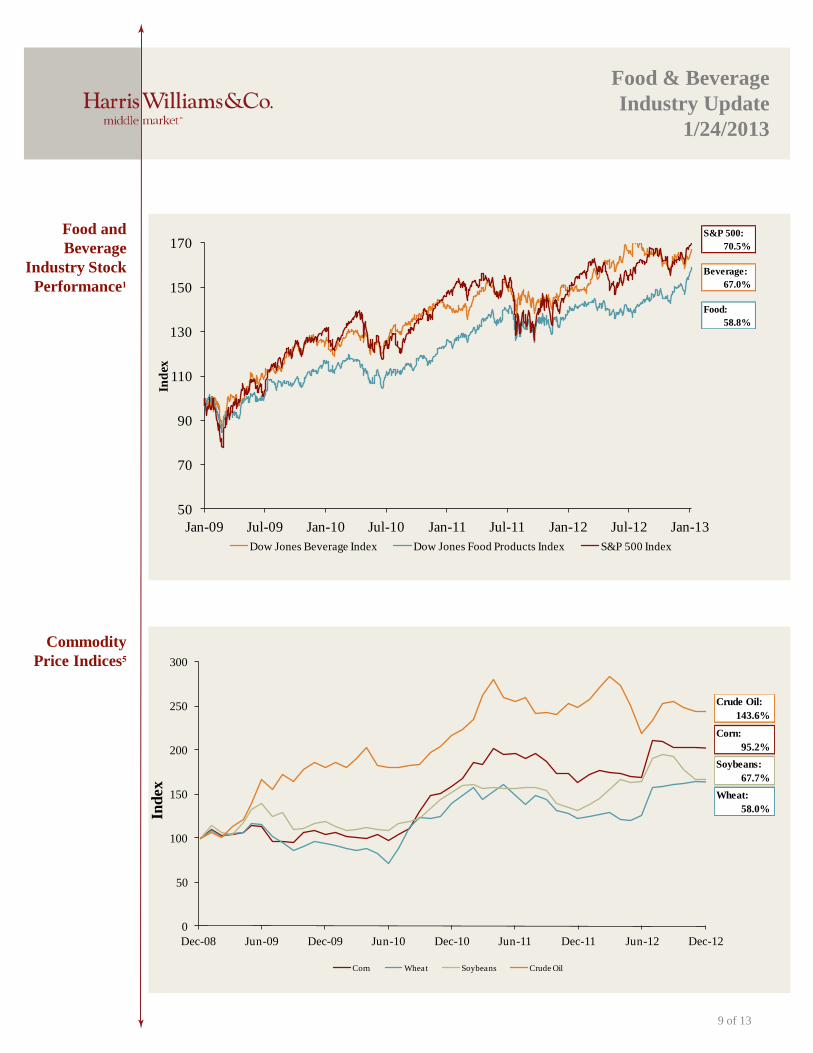
Performance1
Commodity
Price Indices5
0
50
100
150
200
250
300
Dec-08 Jun-09 Dec-09 Jun-10 Dec-10 Jun-11 Dec-11 Jun-12 Dec-12
Ind
ex
Corn Wheat Soybeans Crude Oil
Corn:
95.7%
Crude Oil:
87.2%
Soybeans:
61.9%
Wheat:
59.1%
9 of 13
50
70
90
110
130
150
170
Jan-09 Jul-09 Jan-10 Jul-10 Jan-11 Jul-11 Jan-12 Jul-12 Jan-13
Ind
ex
Dow Jones Beverage Index Dow Jones Food Products Index S&P 500 Index
Crude Oil:
143.6%
Corn:
95.2%
Soybeans:
67.7%
Wheat:
58.0%
S&P 500:
70.5%
Beverage:
67.0%
Food:
58.8%
Food & Beverage
Industry Update
1/24/2013
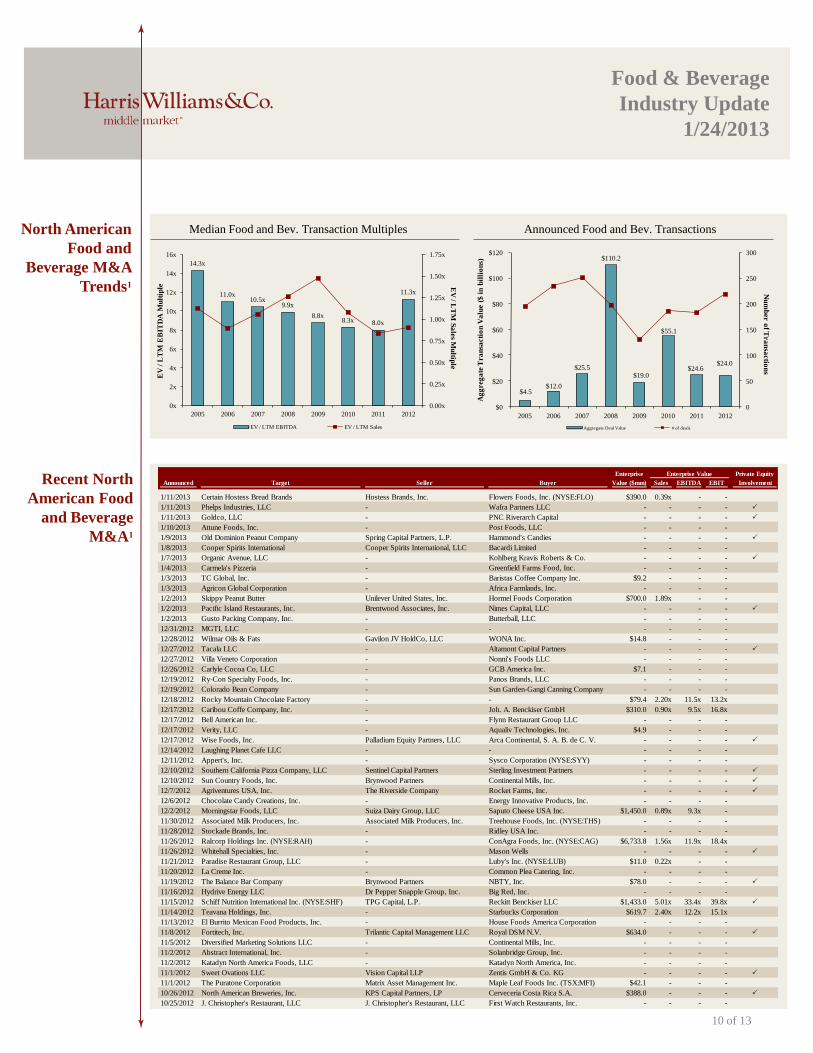
Median Food and Bev. Transaction Multiples Announced Food and Bev. Transactions North American
Food and
Beverage M&A
Trends1
Recent North
American Food
and Beverage
M&A1
14.3x
11.0x 10.5x
9.9x
8.8x 8.3x 8.0x
11.3x
0.00x
0.25x
0.50x
0.75x
1.00x
1.25x
1.50x
1.75x
0x
2x
4x
6x
8x
10x
12x
14x
16x
2005 2006 2007 2008 2009 2010 2011 2012
EV
/ LT
M S
ale
s Mu
ltiple
__
EV
/ L
TM
EB
ITD
A M
ult
iple
__
EV / LTM EBITDA EV / LTM Sales
Enterprise Enterprise Value Private Equity
Announced Target Seller Buyer Value ($mm) Sales EBITDA EBIT Involvement
1/11/2013 Certain Hostess Bread Brands Hostess Brands, Inc. Flowers Foods, Inc. (NYSE:FLO) $390.0 0.39x - -
1/11/2013 Phelps Industries, LLC - Wafra Partners LLC - - - - P
1/11/2013 Goldco, LLC - PNC Riverarch Capital - - - - P
1/10/2013 Attune Foods, Inc. - Post Foods, LLC - - - -
1/9/2013 Old Dominion Peanut Company Spring Capital Partners, L.P. Hammond's Candies - - - - P
1/8/2013 Cooper Spirits International Cooper Spirits International, LLC Bacardi Limited - - - -
1/7/2013 Organic Avenue, LLC - Kohlberg Kravis Roberts & Co. - - - - P
1/4/2013 Carmela's Pizzeria - Greenfield Farms Food, Inc. - - - -
1/3/2013 TC Global, Inc. - Baristas Coffee Company Inc. $9.2 - - -
1/3/2013 Agricon Global Corporation - Africa Farmlands, Inc. - - - -
1/2/2013 Skippy Peanut Butter Unilever United States, Inc. Hormel Foods Corporation $700.0 1.89x - -
1/2/2013 Pacific Island Restaurants, Inc. Brentwood Associates, Inc. Nimes Capital, LLC - - - - P
1/2/2013 Gusto Packing Company, Inc. - Butterball, LLC - - - -
12/31/2012 MGTI, LLC - - - - - -
12/28/2012 Wilmar Oils & Fats Gavilon JV HoldCo, LLC WONA Inc. $14.8 - - -
12/27/2012 Tacala LLC - Altamont Capital Partners - - - - P
12/27/2012 Villa Veneto Corporation - Nonni's Foods LLC - - - -
12/26/2012 Carlyle Cocoa Co, LLC - GCB America Inc. $7.1 - - -
12/19/2012 Ry-Con Specialty Foods, Inc. - Panos Brands, LLC - - - -
12/19/2012 Colorado Bean Company - Sun Garden-Gangi Canning Company - - - -
12/18/2012 Rocky Mountain Chocolate Factory - - $79.4 2.20x 11.5x 13.2x
12/17/2012 Caribou Coffe Company, Inc. - Joh. A. Benckiser GmbH $310.0 0.90x 9.5x 16.8x
12/17/2012 Bell American Inc. - Flynn Restaurant Group LLC - - - -
12/17/2012 Verity, LLC - Aqualiv Technologies, Inc. $4.9 - - -
12/17/2012 Wise Foods, Inc. Palladium Equity Partners, LLC Arca Continental, S. A. B. de C. V. - - - - P
12/14/2012 Laughing Planet Cafe LLC - - - - - -
12/11/2012 Appert's, Inc. - Sysco Corporation (NYSE:SYY) - - - -
12/10/2012 Southern California Pizza Company, LLC Sentinel Capital Partners Sterling Investment Partners - - - - P
12/10/2012 Sun Country Foods, Inc. Brynwood Partners Continental Mills, Inc. - - - - P
12/7/2012 Agriventures USA, Inc. The Riverside Company Rocket Farms, Inc. - - - - P
12/6/2012 Chocolate Candy Creations, Inc. - Energy Innovative Products, Inc. - - - -
12/2/2012 Morningstar Foods, LLC Suiza Dairy Group, LLC Saputo Cheese USA Inc. $1,450.0 0.89x 9.3x -
11/30/2012 Associated Milk Producers, Inc. Associated Milk Producers, Inc. Treehouse Foods, Inc. (NYSE:THS) - - - -
11/28/2012 Stockade Brands, Inc. - Ridley USA Inc. - - - -
11/26/2012 Ralcorp Holdings Inc. (NYSE:RAH) - ConAgra Foods, Inc. (NYSE:CAG) $6,733.8 1.56x 11.9x 18.4x
11/26/2012 Whitehall Specialties, Inc. - Mason Wells - - - - P
11/21/2012 Paradise Restaurant Group, LLC - Luby's Inc. (NYSE:LUB) $11.0 0.22x - -
11/20/2012 La Creme Inc. - Common Plea Catering, Inc. - - - -
11/19/2012 The Balance Bar Company Brynwood Partners NBTY, Inc. $78.0 - - - P
11/16/2012 Hydrive Energy LLC Dr Pepper Snapple Group, Inc. Big Red, Inc. - - - -
11/15/2012 Schiff Nutrition International Inc. (NYSE:SHF) TPG Capital, L.P. Reckitt Benckiser LLC $1,433.0 5.01x 33.4x 39.8x P
11/14/2012 Teavana Holdings, Inc. - Starbucks Corporation $619.7 2.40x 12.2x 15.1x
11/13/2012 El Burrito Mexican Food Products, Inc. - House Foods America Corporation - - - -
11/8/2012 Fortitech, Inc. Trilantic Capital Management LLC Royal DSM N.V. $634.0 - - - P
11/5/2012 Diversified Marketing Solutions LLC - Continental Mills, Inc. - - - -
11/2/2012 Abstract International, Inc. - Solanbridge Group, Inc. - - - -
11/2/2012 Katadyn North America Foods, LLC - Katadyn North America, Inc. - - - -
11/1/2012 Sweet Ovations LLC Vision Capital LLP Zentis GmbH & Co. KG - - - - P
11/1/2012 The Puratone Corporation Matrix Asset Management Inc. Maple Leaf Foods Inc. (TSX:MFI) $42.1 - - -
10/26/2012 North American Breweries, Inc. KPS Capital Partners, LP Cerveceria Costa Rica S.A. $388.0 - - - P
10/25/2012 J. Christopher's Restaurant, LLC J. Christopher's Restaurant, LLC First Watch Restaurants, Inc. - - - -
10 of 13
$4.5 $12.0
$25.5
$110.2
$19.0
$55.1
$24.6 $24.0
0
50
100
150
200
250
300
$0
$20
$40
$60
$80
$100
$120
2005 2006 2007 2008 2009 2010 2011 2012
Nu
mb
er o
f Tra
nsa
ctio
ns_
_
Ag
greg
ate
Tra
nsa
cti
on
Va
lue (
$ i
n b
illi
on
s)
Aggregate Deal Value # of deals

Food & Beverage
Industry Update
1/24/2013
Recent North
American Food
and Beverage
M&A1
(continued)
Enterprise Enterprise Value Private Equity
Announced Target Seller Buyer Value ($mm) Sales EBITDA EBIT Involvement
10/23/2012 Vermont Hard Cider Company, LLC - C&C Group plc (ISE:GCC) $305.0 - - -
10/23/2012 Take and Bake, Inc. Fresh Harvest Products, Inc. Better For You Foods LLC - - - -
10/18/2012 Feed-Rite Inc. Ridley Inc. (TSX:RCL) Masterfeeds Inc. - - - -
10/18/2012 Columbus Manufacturing, Inc. Endeavour Capital, Inc. Arbor Private Investment Company - - - - P
10/3/2012 Feihe International, Inc. Sequoia Capital Morgan Stanley PE Asia Ltd $260.8 0.90x 11.7x 17.1x P
10/2/2012 Mamaki of Hawaii, Inc. - UMED Holdings, Inc. - - - -
10/2/2012 Nealanders International Inc. Birch Hill Equity Partners Management Caldic B.V. - - - - P
9/28/2012 Century Concepts, Inc. - TriMark South - - - -
9/28/2012 To Go Brands, Inc. - MedPodium Health Products, Inc. $2.0 - - -
9/25/2012 Texas Steakhouses & Saloons Boddie-Noell Enterprises Inc. Charlie Brown's Steakhouse - - - -
9/25/2012 Centerplate, Inc. Kohlberg & Company, L.L.C. Olympus Partners - - - - P
9/24/2012 No Limits, LLC - K-MAC Enterprises, Inc. - - - -
9/20/2012 Watson's Baby Bar - Carson Wrapped Hershey's Chocolates - - - -
9/19/2012 Chipita America, Inc. Chipita America, Inc. B&G Foods North America, Inc. $62.5 - - -
9/18/2012 Decas Botanical Synergies Inc. Decas Cranberry Products, Inc. Naturex, Inc. - - - -
9/14/2012 Tyson Refrigerated Processed Meats, Inc. Tyson Refrigerated Processed Meats Pita Pal Industries, Inc. - - - -
9/12/2012 Snows Lake Vineyard LLC - E. &. J. Gallo Winery, Inc. - - - -
9/11/2012 Brasserie Montmartre - Not Disclosed - - - -
9/11/2012 Big O Wine Company - Ste. Michelle Wine Estates Ltd. - - - -
9/7/2012 The Sands Regent Affinity Gaming, LLC. Not Disclosed $19.2 - - -
9/6/2012 Hoopeston Foods, Inc. - Sun Garden-Gangi Canning Company - - - -
9/6/2012 Hinsdale Farms, Ltd. - Monogram Food Solutions, LLC - - - -
9/6/2012 Chicory Cafe - Not Disclosed - - - -
9/4/2012 GPB International, LLC GPB International, LLC Claridge Ventures, Inc $1.3 - - - P
9/4/2012 Garden of the Gods Gourmet Inc. - Pinery Enterprises, LLC - - - -
9/3/2012 Snack Factory, LLC VMG Tax-Exempt, L.P. Snyder's-Lance, Inc. $340.0 - - - P
8/31/2012 Fazoli's Restaurant at 1398 Conant - SBW Capital Partners LLC - - - - P
8/27/2012 T. J. Harkins Basic Commodity Brokers Co. - Bay State Milling Company - - - -
8/27/2012 Shearer's Foods, Inc. Mistral Equity Wind Point Partners; Mistral Equity $500.0 - - - P
8/27/2012 El Loco Taco, Inc. - Not Disclosed - - - -
8/27/2012 RCM Smith, Inc. - American Food Styles, LLC - - - -
8/25/2012 Green Hills Inn Inc. - Dans Restaurant, Inc. - - - -
8/25/2012 The Bachman Company - UTZ Quality Foods, Inc. - - - -
8/22/2012 Kingston Tobacco Co., LLC - Kolstad Enterprises, LLC - - - -
8/22/2012 The Red Cap Garage and Aura - Project Ecological Development - - - -
8/21/2012 Back to Nature Foods Company Kraft Foods Inc. Brynwood Partners - - - - P
8/14/2012 Kettle Creations, LLC - BEF Foods, Inc. $50.0 - - -
8/13/2012 Michael's Finer Meats & Seafoods, Inc. Sorenson Capital The Chefs' Warehouse $54.3 0.68x - - P
8/10/2012 Courtside Cellars, LLC - E. &. J. Gallo Winery, Inc. - - - -
8/8/2012 Seapak QCI Processing Limited - Haida Enterprise Corporation - - - -
8/7/2012 Crushpad, Inc. Foley Family Wines, Inc. Castlegate Capital Advisors, LLC $0.7 - - - P
8/7/2012 Bagel Factory, Inc. - Cremonini S.p.A. $3.1 - - -
8/2/2012 Pastorino Dairy - Maracay Homes, LLC $2.3 - - -
7/30/2012 P.F. Chang's Frozen Menu Business Unit Unilever United States, Inc. ConAgra Foods, Inc. (NYSE:CAG) $267.0 0.89x - -
7/30/2012 Streamline Foods, Inc. - Tate & Lyle Canada Ltd. - - - -
7/26/2012 Mr. Souvlaki Limited - MTY Tiki Ming Enterprises, Inc. $1.0 0.23x - -
7/25/2012 Ray's Station Weibel, Inc. Vintage Wine Estates, Inc. - - - -
7/24/2012 Los Diablos International, Inc. - Trinchero Family Estates - - - -
7/24/2012 Healds Valley Farms, Inc. Healds Valley Farms Holdings AG Paramount Citrus, Inc. - - - -
7/21/2012 Peet's Coffee & Tea, Inc. Franklin Advisers, Inc. JAB Holdings B.V. $956.1 2.53x 21.0x 34.4x P
7/18/2012 Pilgrim's Corp., Commercial Egg Operations Pilgrim's Corp. Cal-Maine Foods, Inc. - - - -
7/12/2012 Yard House USA, Inc. TSG Consumer Partners Darden Restaurants, Inc. $585.0 2.23x 20.2x - P
7/12/2012 AFA Foods, TX Beef Processing Plant AFA Foods, Inc. Cargill, Incorporated $14.1 - - -
7/12/2012 AFA Foods, PN Beef Processing Plant AFA Foods, Inc. CTI Foods, Inc. $18.8 - - -
7/11/2012 Arby's Restaurant Group, 51 Locations Arby's Restaurant Group, Inc. Sun Holdings, LLC - - - - P
7/11/2012 Serex Vending Services, Inc. - AVI Foodsystems, Inc. - - - -
6/25/2012 The Brass Tap Inc. - Family Sports Concepts, Inc. - - - -
6/22/2012 J. Alexander's Corp. Dimensional Fund Advisors LP American Blue Ribbon Holdings $80.9 0.51x 7.4x 16.3x P
6/20/2012 Pacific Pure-Aid Company Givaudan AG DIANA Group SA - - - -
6/12/2012 Ramal West Vineyard - Jackson Family Wines, Inc. - - - -
6/11/2012 Trimcare Holdings, LLC - Cannabis Science, Inc. - - - -
6/7/2012 GT Beverage Company, Inc. MKM Capital Advisors, LLC Bazi International, Inc. - - - - P
6/5/2012 30 Wendy's Restaurants in Austin, Texas Pisces Foods, L.P. Wendy's International, Inc. $19.9 - - -
6/4/2012 Kona Blue Water Farms, LLC - Blue Ocean Mariculture - - - -
6/4/2012 Flavors From Florida, Inc. Agrana Fruit US, Inc. SensoryEffects Flavor Company - - - -
6/4/2012 51 Front Wine Bar & Bistro - Not Disclosed - - - -
6/3/2012 Aunt Sam's Uptown Eatery, Inc. - Not Disclosed - - - -
5/31/2012 Lepage Bakeries, Inc. - Flowers Foods, Inc. $320.0 1.93x - -
5/31/2012 Udi's Healthy Foods, LLC Hubson Acquisition, LLC Smart Balance, Inc $125.0 2.05x - -
5/25/2012 Oasis Foods Company - AarhusKarlshamn AB - - - -
5/24/2012 Purity Life Health Products Limited SunOpta Inc. Banyan Capital Partners $14.3 0.25x - - P
5/23/2012 Petri Baking Products, Inc. - Ralcorp Holdings, Inc. - - - -
5/23/2012 The Golden West Fruit Company, Inc. - Sweet Ovations LLC - - - -
5/23/2012 Ferrara Pan Candy Company, Inc. - Farley's & Sathers Candy Co. - - - -
5/22/2012 Kangaroo Brands, Inc., Pita Chips Business Kangaroo Brands, Inc. ConAgra Foods, Inc. - - - -
5/22/2012 Lactalis American Group, Inc. Groupe Lactalis S.A. Parmalat SpA $904.0 0.92x 10.8x -
5/18/2012 Ocean Nutrition Canada Limited Clearwater Fine Foods Incorporated Royal DSM N.V. $529.9 2.84x - - P
11 of 13
Food & Beverage
Industry Update
1/24/2013
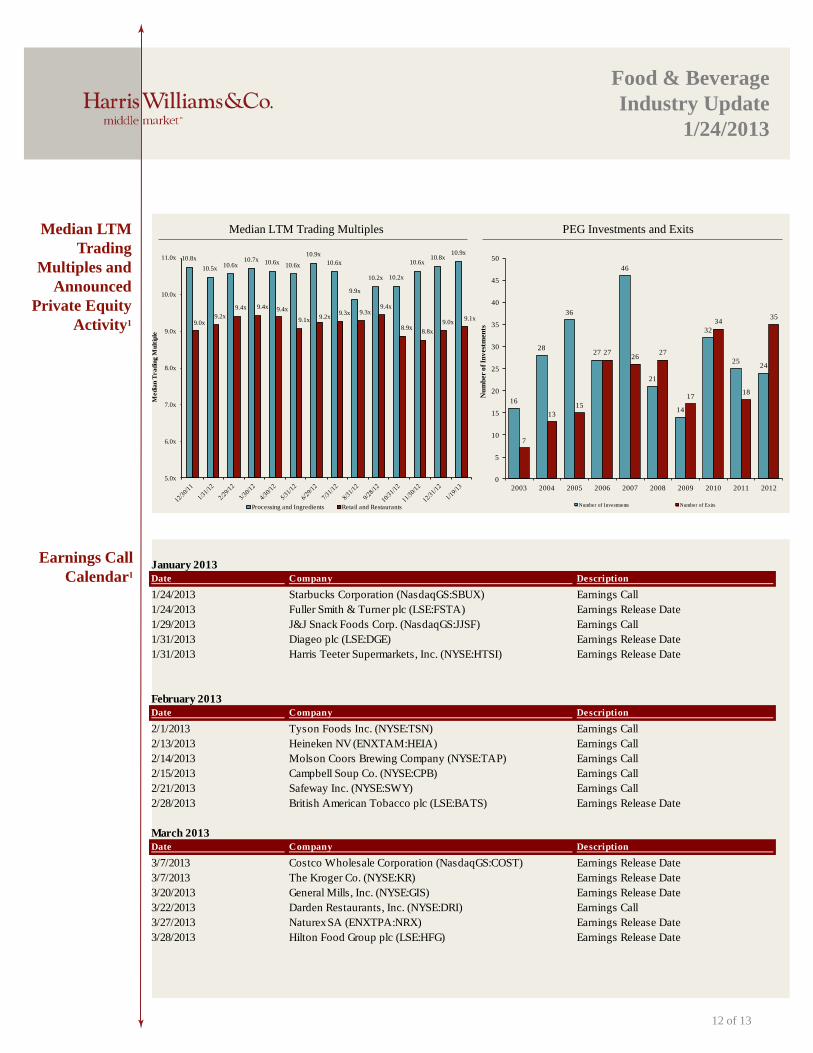
Median LTM Trading Multiples PEG Investments and Exits Median LTM
Trading
Multiples and
Announced
Private Equity
Activity1
Earnings Call
Calendar1
16
28
36
27
46
21
14
32
2524
7
13
15
2726
27
17
34
18
35
0
5
10
15
20
25
30
35
40
45
50
2003 2004 2005 2006 2007 2008 2009 2010 2011 2012N
um
ber o
f In
vest
men
ts'
Number of Investments Number of Exits
12 of 13
10.8x
10.5x10.6x
10.7x 10.6x10.6x
10.9x
10.6x
9.9x
10.2x 10.2x
10.6x10.8x
10.9x
9.0x9.2x
9.4x 9.4x 9.4x
9.1x9.2x
9.3x 9.3x9.4x
8.9x8.8x
9.0x9.1x
5.0x
6.0x
7.0x
8.0x
9.0x
10.0x
11.0x
Med
ian
Tra
din
g M
ult
iple
Processing and Ingredients Retail and Restaurants
January 2013
Date Company Description
1/24/2013 Starbucks Corporation (NasdaqGS:SBUX) Earnings Call
1/24/2013 Fuller Smith & Turner plc (LSE:FSTA) Earnings Release Date
1/29/2013 J&J Snack Foods Corp. (NasdaqGS:JJSF) Earnings Call
1/31/2013 Diageo plc (LSE:DGE) Earnings Release Date
1/31/2013 Harris Teeter Supermarkets, Inc. (NYSE:HTSI) Earnings Release Date
February 2013
Date Company Description
2/1/2013 Tyson Foods Inc. (NYSE:TSN) Earnings Call
2/13/2013 Heineken NV (ENXTAM:HEIA) Earnings Call
2/14/2013 Molson Coors Brewing Company (NYSE:TAP) Earnings Call
2/15/2013 Campbell Soup Co. (NYSE:CPB) Earnings Call
2/21/2013 Safeway Inc. (NYSE:SWY) Earnings Call
2/28/2013 British American Tobacco plc (LSE:BATS) Earnings Release Date
March 2013
Date Company Description
3/7/2013 Costco Wholesale Corporation (NasdaqGS:COST) Earnings Release Date
3/7/2013 The Kroger Co. (NYSE:KR) Earnings Release Date
3/20/2013 General Mills, Inc. (NYSE:GIS) Earnings Release Date
3/22/2013 Darden Restaurants, Inc. (NYSE:DRI) Earnings Call
3/27/2013 Naturex SA (ENXTPA:NRX) Earnings Release Date
3/28/2013 Hilton Food Group plc (LSE:HFG) Earnings Release Date
Food & Beverage
Industry Update
1/24/2013
Sources:
1. Capital IQ
2. Thomson Financial
3. S&P
4. Reuters
5. IMF
Harris Williams & Co. (www.harriswilliams.com) is a preeminent middle market investment bank focused on the
advisory needs of clients worldwide. The firm has deep industry knowledge, global transaction expertise, and an
unwavering commitment to excellence. Harris Williams & Co. provides sell-side and acquisition advisory, restructuring
advisory, board advisory, private placements, and capital markets advisory services.
Investment banking services are provided by Harris Williams LLC, a registered broker-dealer and member of FINRA
and SIPC, and Harris Williams & Co. Ltd, which is authorised and regulated by the Financial Services Authority (FRN
#540892). Harris Williams & Co. is a trade name under which Harris Williams LLC and Harris Williams & Co. Ltd
conduct business.
THIS REPORT MAY CONTAIN REFERENCES TO REGISTERED TRADEMARKS, SERVICE MARKS
AND COPYRIGHTS OWNED BY THIRD-PARTY INFORMATION PROVIDERS. NONE OF THE THIRD-
PARTY INFORMATION PROVIDERS IS ENDORSING THE OFFERING OF, AND SHALL NOT IN ANY
WAY BE DEEMED AN ISSUER OR UNDERWRITER OF, THE SECURITIES, FINANCIAL
INSTRUMENTS OR OTHER INVESTMENTS DISCUSSED IN THIS REPORT, AND SHALL NOT HAVE
ANY LIABILITY OR RESPONSIBILITY FOR ANY STATEMENTS MADE IN THE REPORT OR FOR ANY
FINANCIAL STATEMENTS, FINANCIAL PROJECTIONS OR OTHER FINANCIAL INFORMATION
CONTAINED OR ATTACHED AS AN EXHIBIT TO THE REPORT. FOR MORE INFORMATION ABOUT
THE MATERIALS PROVIDED BY SUCH THIRD PARTIES, PLEASE CONTACT US AT +1 (804) 648-0072.
The information and views contained in this report were prepared by Harris Williams & Co. (“Harris Williams”). It is
not a research report, as such term is defined by applicable law and regulations, and is provided for informational
purposes only. It is not to be construed as an offer to buy or sell or a solicitation of an offer to buy or sell any financial
instruments or to participate in any particular trading strategy. The information contained herein is believed by Harris
Williams to be reliable, but Harris Williams makes no representation as to the accuracy or completeness of such
information. Harris Williams and/or its affiliates may be market makers or specialists in, act as advisers or lenders to,
have positions in and effect transactions in securities of companies mentioned herein and also may provide, may have
provided, or may seek to provide investment banking services for those companies. In addition, Harris Williams and/or
its affiliates or their respective officers, directors and employees may hold long or short positions in the securities,
options thereon or other related financial products of companies discussed herein. Opinions, estimates and projections
in this report constitute Harris Williams’ judgment and are subject to change without notice. The financial instruments
discussed in this report may not be suitable for all investors, and investors must make their own investment decisions
using their own independent advisors as they believe necessary and based upon their specific financial situations and
investment objectives. Also, past performance is not necessarily indicative of future results. No part of this material may
be copied or duplicated in any form or by any means, or redistributed, without Harris Williams’ prior written consent.
Copyright© 2013 Harris Williams & Co., all rights reserved.
13 of 13