fomc 20071211 material
TRANSCRIPT

Appendix 1: Materials used by Mr. Dudley
December 11, 2007 127 of 138Authorized for Public Release

Class II FOMC – Restricted FR Page 1 of 8
0
4
8
12
16
20
24
5 6 7 8 9 10 11 12 13 14 15 16 17 18 19 20 21 22 23 24 25 26 27 28Loan Age in Month
Percent of Total
0
4
8
12
16
20
24Percent of Total
ABX 07.01
ABX 07.02
Average 2000-2005 ARMs
ABX 06.02
ABX 06.01
(2) Subprime 60 Day+ Delinquency Rate by Vintage
Source: Merrill Lynch, Intex
0.01.02.03.04.05.06.07.08.09.0
1998 1999 2000 2001 2002 2003 2004 2005 2006 2007
Percent of Total Loans
0.01.02.03.04.05.06.07.08.09.0
Percent of Total Loans
60+ Days Delinquent
Entered Foreclosure
(1) Subprime Mortgage Performance Continues to WorsenJanuary 1998 – September 2007
Source: Mortgage Bankers Association and Economy.com
0.0
0.2
0.4
0.6
0.8
1.0
1.2
1998 1999 2000 2001 2002 2003 2004 2005 2006 2007
Percent of Total Loans
0.0
0.2
0.4
0.6
0.8
1.0
1.2Percent of Total Loans
60+ Days Delinquent
Entered Foreclosure
(3) Prime Mortgage Performance Also WorsensJanuary 1998 – September 2007
Source: Mortgage Bankers Association and Economy.com
December 11, 2007 128 of 138Authorized for Public Release
0
20
40
60
80
100
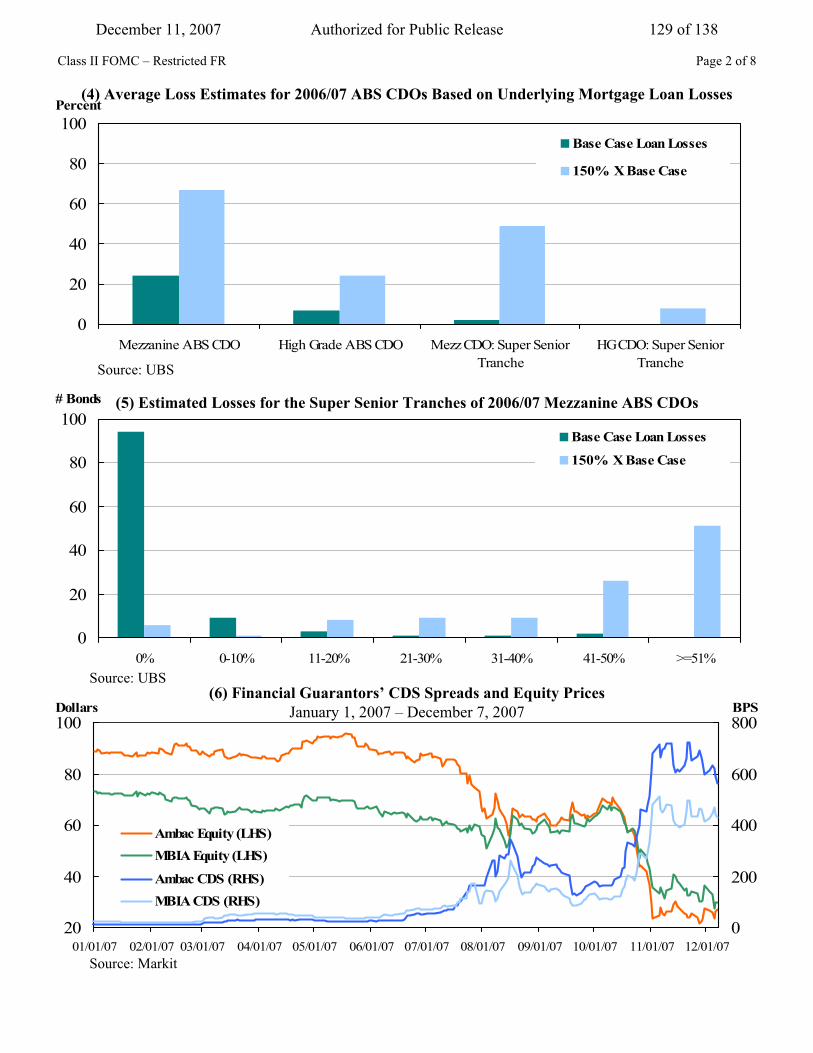
0% 0-10% 11-20% 21-30% 31-40% 41-50% >=51%
# Bonds
Base Case Loan Losses
150% X Base Case
(5) Estimated Losses for the Super Senior Tranches of 2006/07 Mezzanine ABS CDOs
Source: UBS
Class II FOMC – Restricted FR Page 2 of 8
20
40
60
80
01/01/07 02/01/07 03/01/07 04/01/07 05/01/07 06/01/07 07/01/07 08/01/07 09/01/07 10/01/07 11/01/07 12/01/070
200
400
600
100Dollars
800BPS
Ambac Equity (LHS)MBIA Equity (LHS)
Ambac CDS (RHS)MBIA CDS (RHS)
Source: Markit
(6) Financial Guarantors’ CDS Spreads and Equity PricesJanuary 1, 2007 – December 7, 2007
0
20
40
60
80
100
Mezzanine ABS CDO High Grade ABS CDO Mezz CDO: Super Senior HG CDO: Super Senior
Percent
Tranche Tranche
Base Case Loan Losses
150% X Base Case
(4) Average Loss Estimates for 2006/07 ABS CDOs Based on Underlying Mortgage Loan Losses
Source: UBS
December 11, 2007 129 of 138Authorized for Public Release
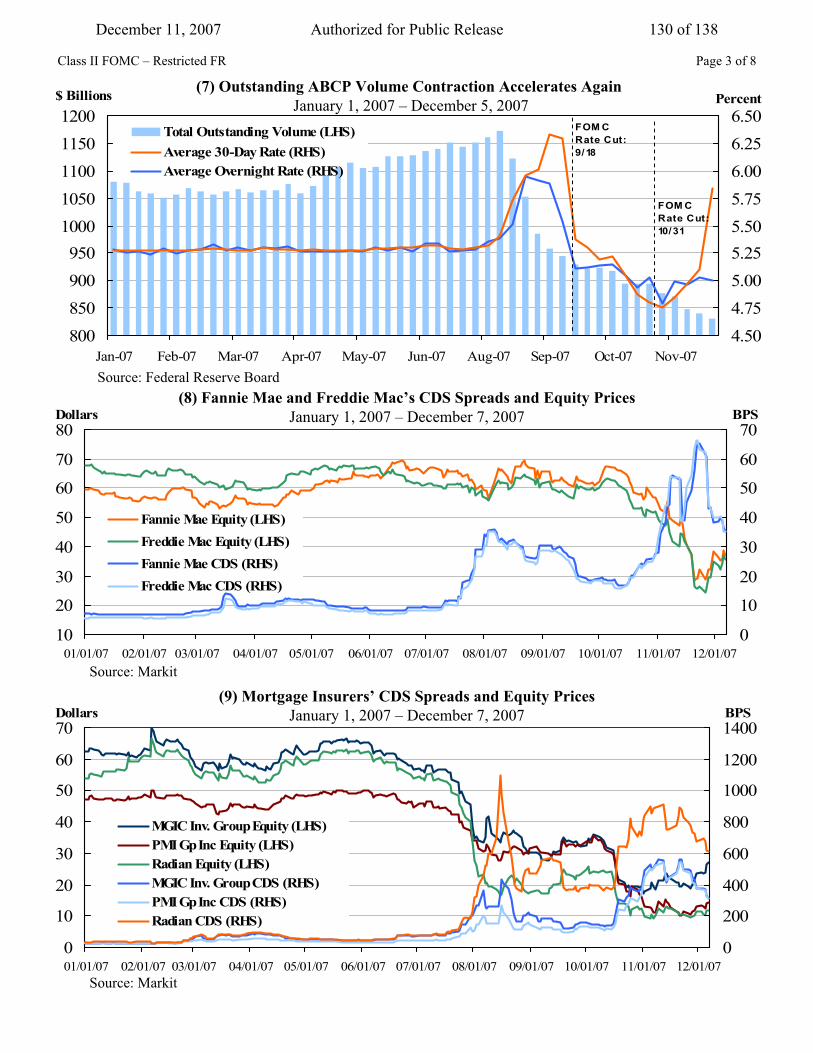
800850900950
10001050110011501200
Jan-07 Feb-07 Mar-07 Apr-07 May-07 Jun-07 Aug-07 Sep-07 Oct-07 Nov-07
$ Billions
4.504.755.005.255.505.756.006.256.50
Percent
Total Outstanding Volume (LHS)Average 30-Day Rate (RHS)Average Overnight Rate (RHS)
FOM C Rate Cut: 9/18
FOM C Rate Cut: 10/31
Source: Federal Reserve Board
(7) Outstanding ABCP Volume Contraction Accelerates Again January 1, 2007 – December 5, 2007
Class II FOMC – Restricted FR Page 3 of 8
0
10
20
30
40
50
60
70
01/01/07 02/01/07 03/01/07 04/01/07 05/01/07 06/01/07 07/01/07 08/01/07 09/01/07 10/01/07 11/01/07 12/01/07
Dollars
0
200
400
600
800
1000
1200
1400BPS
MGIC Inv. Group Equity (LHS)PMI Gp Inc Equity (LHS)Radian Equity (LHS)MGIC Inv. Group CDS (RHS)PMI Gp Inc CDS (RHS)Radian CDS (RHS)
(9) Mortgage Insurers’ CDS Spreads and Equity PricesJanuary 1, 2007 – December 7, 2007
Source: Markit
10
20
30
40
50
60
70
80
01/01/07 02/01/07 03/01/07 04/01/07 05/01/07 06/01/07 07/01/07 08/01/07 09/01/07 10/01/07 11/01/07 12/01/07
Dollars
0
10
20
30
40
50
60
70BPS
Fannie Mae Equity (LHS)Freddie Mac Equity (LHS)Fannie Mae CDS (RHS)Freddie Mac CDS (RHS)
(8) Fannie Mae and Freddie Mac’s CDS Spreads and Equity PricesJanuary 1, 2007 – December 7, 2007
Source: Markit
December 11, 2007 130 of 138Authorized for Public Release
Class II FOMC – Restricted FR Page 4 of 8
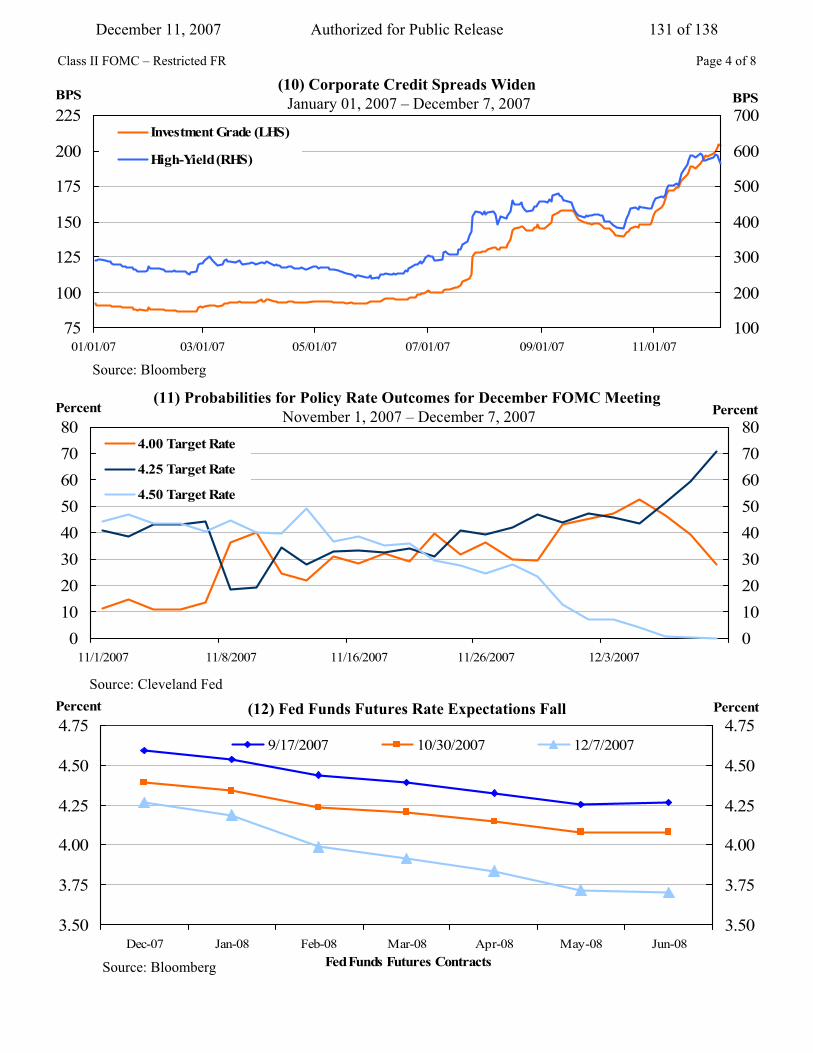
3.50
3.75
4.00
4.25
4.50
4.75
Dec-07 Jan-08 Feb-08 Mar-08 Apr-08 May-08 Jun-08Fed Funds Futures Contracts
Percent
3.50
3.75
4.00
4.25
4.50
4.75 Percent
9/17/2007 10/30/2007 12/7/2007
Source: Bloomberg
(12) Fed Funds Futures Rate Expectations Fall
75
100
125
150
175
200
225
01/01/07 03/01/07 05/01/07 07/01/07 09/01/07 11/01/07
BPS
100
200
300
400
500
600
700BPS
Investment Grade (LHS)
High-Yield (RHS)
(10) Corporate Credit Spreads Widen January 01, 2007 – December 7, 2007
Source: Bloomberg
01020304050607080
11/1/2007 11/8/2007 11/16/2007 11/26/2007 12/3/2007
Percent
01020304050607080
Percent
4.00 Target Rate
4.25 Target Rate
4.50 Target Rate
(11) Probabilities for Policy Rate Outcomes for December FOMC MeetingNovember 1, 2007 – December 7, 2007
Source: Cleveland Fed
December 11, 2007 131 of 138Authorized for Public Release

Class II FOMC – Restricted FR Page 5 of 8
3.25
3.50
3.75
4.00
4.25
4.50
4.75
5.00
Dec-07 Mar-08 Jun-08 Sep-08 Dec-08Eurodollar Futures Contracts
Percent
3.25
3.50
3.75
4.00
4.25
4.50
4.75
5.00 Percent
9/17/2007 10/30/2007 12/7/2007
Source: Bloomberg
(13) Eurodollar Futures Curve Shifts Lower
2.02.5
3.03.54.0
4.55.0
5.56.0Percent
Survey Response -size indicates freq
October Average Forecast
Market Rates as of 10/23
(15) Distribution of Expected Policy Target Among Primary Dealers Prior to October 31 FOMC Meeting
Source: Dealer Policy Survey
Q4 2007 Q1 2008 Q2 2008 Q3 2008 Q4 2008
2.02.5
3.03.54.0
4.55.0
5.56.0Percent
Survey Response -size indicates freq
December Average Forecast
Market Rates as of 12/3
(14) Distribution of Expected Policy Target Among Primary Dealers Prior to December 11 FOMC Meeting
Source: Dealer Policy Survey Q4 2007 Q1 2008 Q2 2008 Q3 2008 Q4 2008
December 11, 2007 132 of 138Authorized for Public Release
Class II FOMC – Restricted FR Page 6 of 8
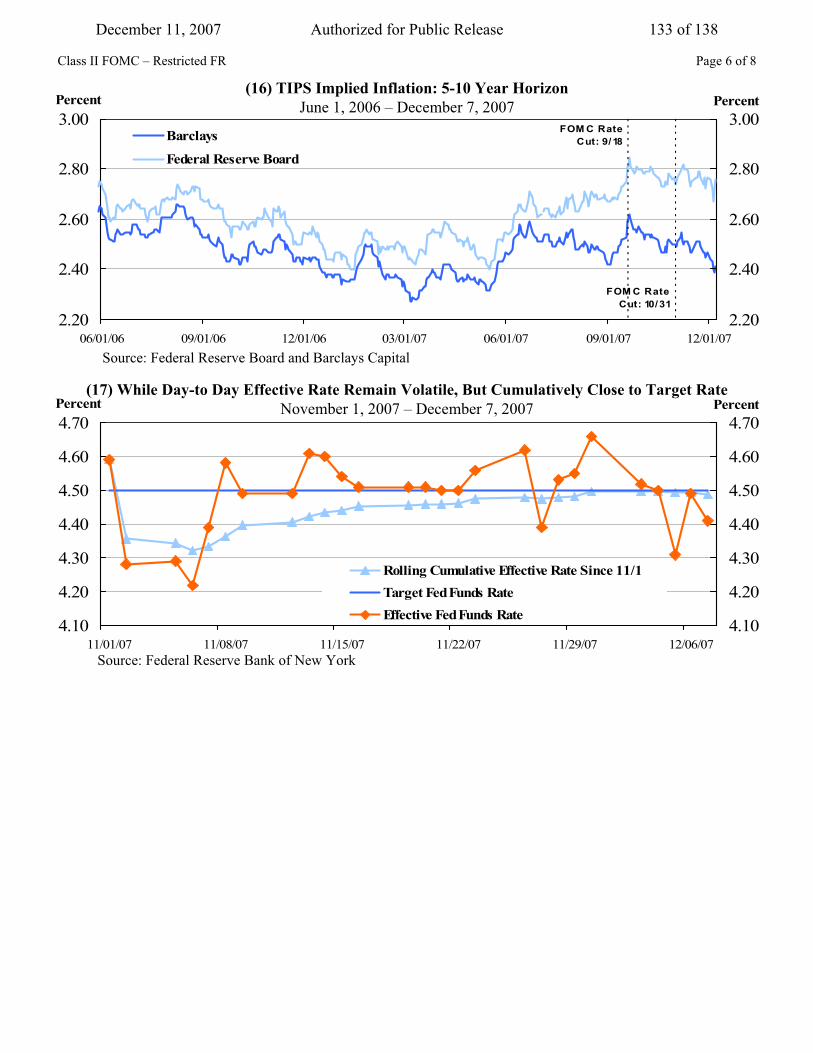
2.20
2.40
2.60
2.80
3.00
06/01/06 09/01/06 12/01/06 03/01/07 06/01/07 09/01/07 12/01/07
Percent
2.20
2.40
2.60
2.80
3.00 Percent
Barclays
Federal Reserve Board
FOM C Rate Cut: 9/18
FOM C Rate Cut: 10/31
(16) TIPS Implied Inflation: 5-10 Year HorizonJune 1, 2006 – December 7, 2007
Source: Federal Reserve Board and Barclays Capital
4.10
4.20
4.30
4.40
4.50
4.60
4.70
11/01/07 11/08/07 11/15/07 11/22/07 11/29/07 12/06/07
Percent
4.10
4.20
4.30
4.40
4.50
4.60
4.70 Percent
Rolling Cumulative Effective Rate Since 11/1Target Fed Funds RateEffective Fed Funds Rate
(17) While Day-to Day Effective Rate Remain Volatile, But Cumulatively Close to Target RateNovember 1, 2007 – December 7, 2007
Source: Federal Reserve Bank of New York
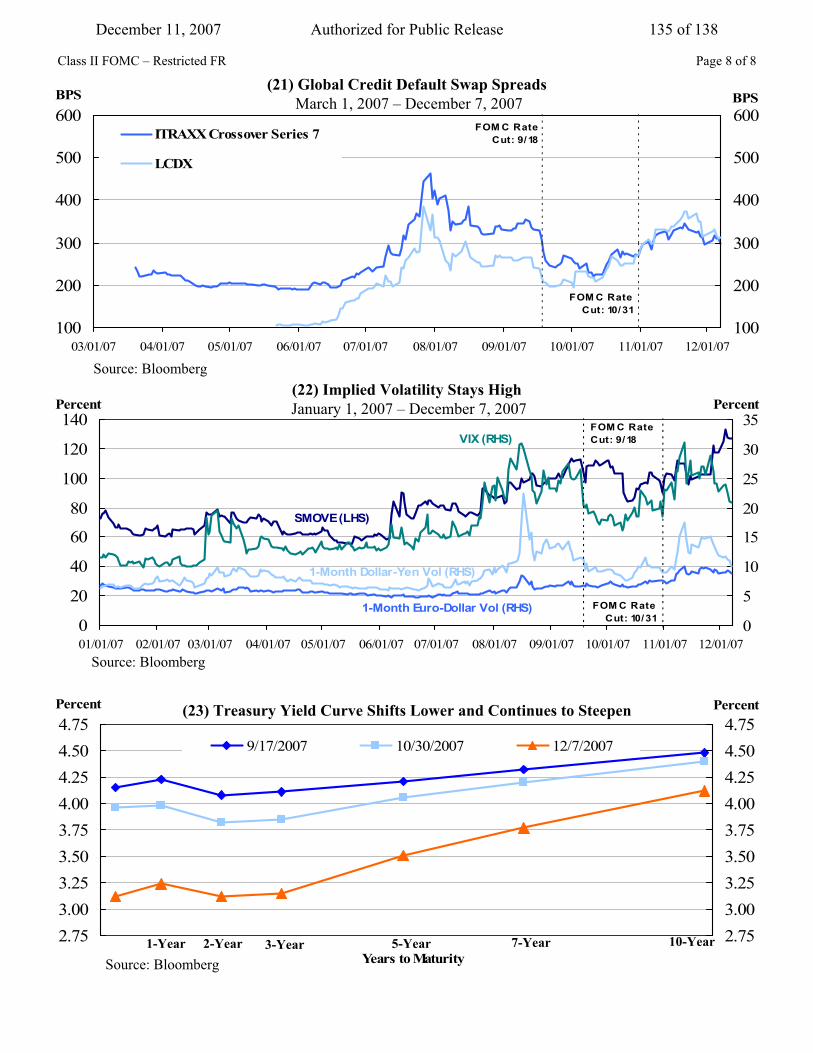
December 11, 2007 133 of 138Authorized for Public Release
90
95
100
105
110
115
120
01/01/07 02/01/07 03/01/07 04/01/07 05/01/07 06/01/07 07/01/07 08/01/07 09/01/07 10/01/07 11/01/07 12/01/07
Index to 100 on 1/1
90
95
100
105
110
115
120 Index to 100 on 1/1
S&P 500NasdaqRussell 2000
FOM C Rate Cut: 9/18
FOM C Rate Cut: 10/31
(19) U.S. Equity Indices Partially Reverse Sharp Decline January 1, 2007 – December 7, 2007
Source: Bloomberg
Class II FOMC – Restricted FR
02468
101214
01/01/07 02/01/07 03/01/07 04/01/07 05/01/07 06/01/07 07/01/07 08/01/07 09/01/07 10/01/07 11/01/0702468101214
S&P 500: Bottom-Up Equity Analyst Forecasts for 2007
S&P 500: Bottom-U16
Percent16
Percent
pEquity Analyst Forecasts for 2008
(20) Equity Earnings ExpectationsJanuary 1, 2007 – November 30, 2007
Source: Thompson Financial
Page 7 of 8
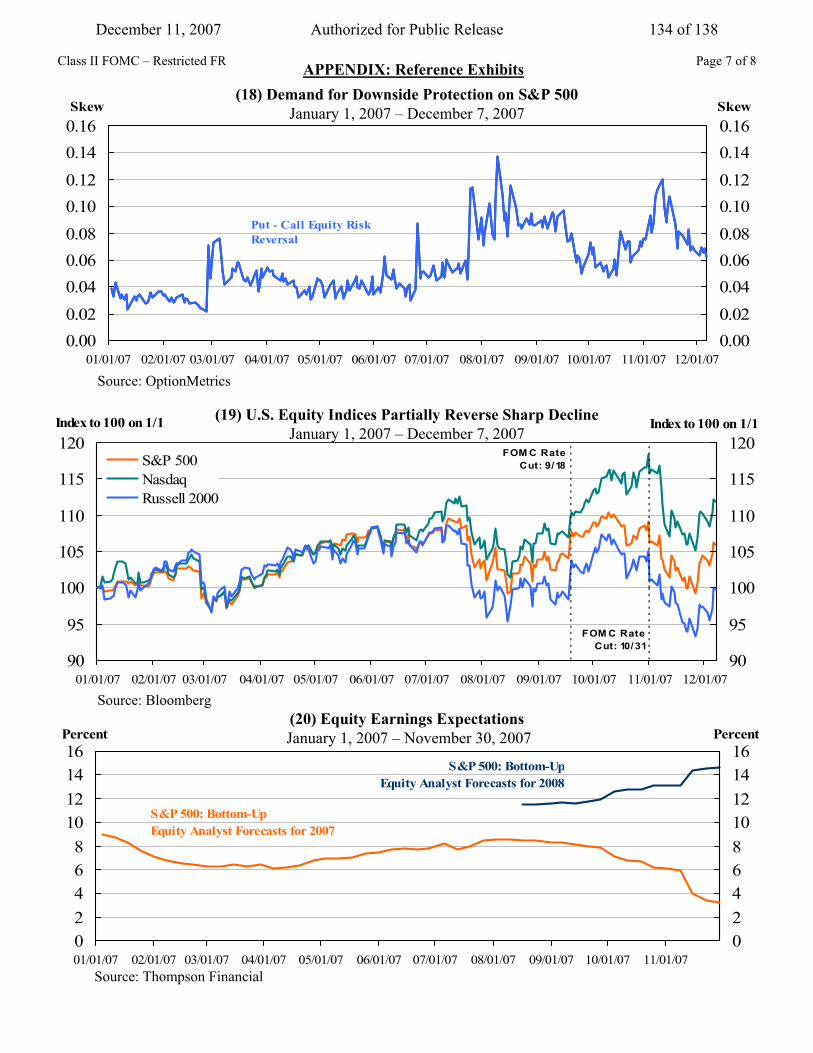
0.000.020.040.060.080.100.120.140.16
01/01/07 02/01/07 03/01/07 04/01/07 05/01/07 06/01/07 07/01/07 08/01/07 09/01/07 10/01/07 11/01/07 12/01/07
Skew
0.000.020.040.060.080.100.120.140.16Skew
Put - Call Equity Risk Reversal
(18) Demand for Downside Protection on S&P 500 January 1, 2007 – December 7, 2007
Source: OptionMetrics
APPENDIX: Reference Exhibits
December 11, 2007 134 of 138Authorized for Public Release
0
20
40
60
80
100
120
140
01/01/07 02/01/07 03/01/07 04/01/07 05/01/07 06/01/07 07/01/07 08/01/07 09/01/07 10/01/07 11/01/07 12/01/07
Percent
0
5
10
15
20
25
30
35 Percent
VIX (RHS)
1-Month Dollar-Yen Vol (RHS)
1-Month Euro-Dollar Vol (RHS)
SMOVE (LHS)
FOM C Rate Cut: 9/18
FOM C Rate Cut: 10/31
Source: Bloomberg
(22) Implied Volatility Stays High January 1, 2007 – December 7, 2007
Page 8 of 8Class II FOMC – Restricted FR
2.753.003.253.503.754.004.254.504.75
Years to Maturity
Percent
2.753.003.253.503.754.004.254.504.75
Percent
9/17/2007 10/30/2007 12/7/2007
(23) Treasury Yield Curve Shifts Lower and Continues to Steepen
Source: Bloomberg1-Year 2-Year 3-Year 5-Year 7-Year 10-Year
100
200
300
400
500
600
03/01/07 04/01/07 05/01/07 06/01/07 07/01/07 08/01/07 09/01/07 10/01/07 11/01/07 12/01/07
BPS
100
200
300
400
500
600BPS
ITRAXX Crossover Series 7
LCDX
FOM C Rate Cut: 9/18
FOM C Rate Cut: 10/31
(21) Global Credit Default Swap SpreadsMarch 1, 2007 – December 7, 2007
Source: Bloomberg
December 11, 2007 135 of 138Authorized for Public Release

Appendix 2: Materials used by Mr. Madigan
December 11, 2007 136 of 138Authorized for Public Release
Class I FOMC – Restricted Controlled (FR)
Material for FOMC Briefing on Monetary Policy Alternatives Brian Madigan December 11, 2007
December 11, 2007 137 of 138Authorized for Public Release
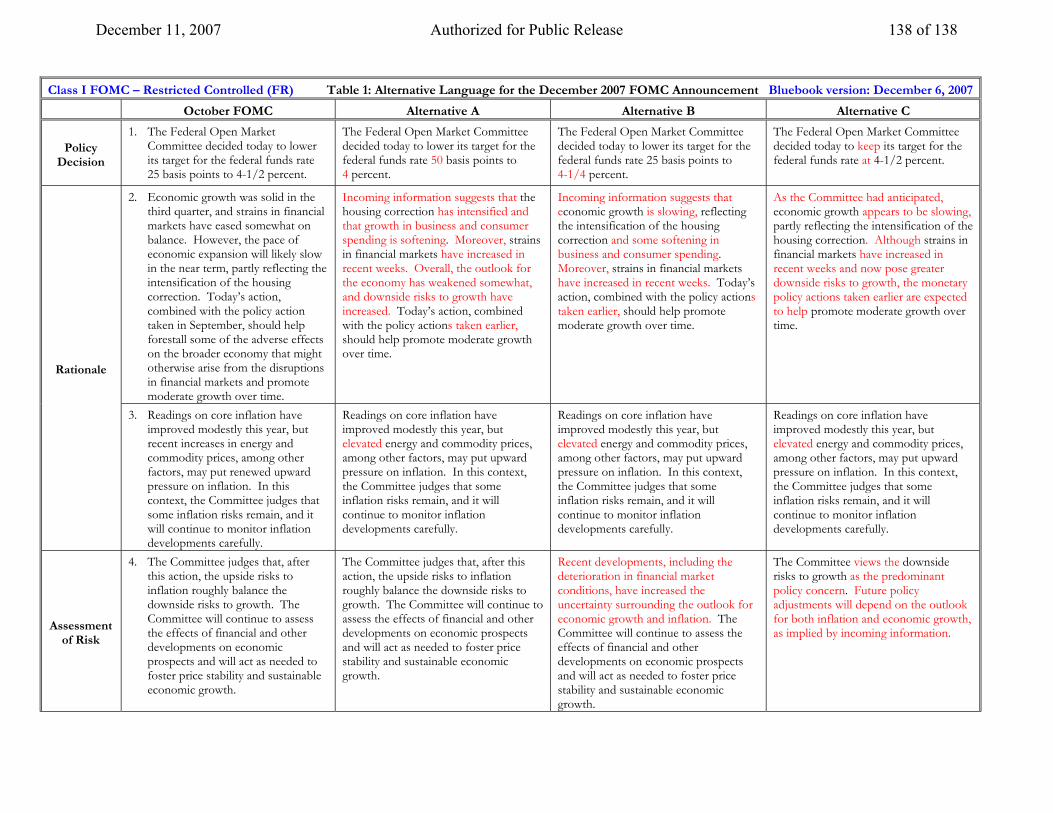
Class I FOMC – Restricted Controlled (FR) Table 1: Alternative Language for the December 2007 FOMC Announcement Bluebook version: December 6, 2007
October FOMC Alternative A Alternative B Alternative C
Policy Decision
1. The Federal Open Market Committee decided today to lower its target for the federal funds rate 25 basis points to 4-1/2 percent.
The Federal Open Market Committee decided today to lower its target for the federal funds rate 50 basis points to 4 percent.
The Federal Open Market Committee decided today to lower its target for the federal funds rate 25 basis points to 4-1/4 percent.
The Federal Open Market Committee decided today to keep its target for the federal funds rate at 4-1/2 percent.
2. Economic growth was solid in the third quarter, and strains in financial markets have eased somewhat on balance. However, the pace of economic expansion will likely slow in the near term, partly reflecting the intensification of the housing correction. Today’s action, combined with the policy action taken in September, should help forestall some of the adverse effects on the broader economy that might otherwise arise from the disruptions in financial markets and promote moderate growth over time.
Incoming information suggests that the housing correction has intensified and that growth in business and consumer spending is softening. Moreover, strains in financial markets have increased in recent weeks. Overall, the outlook for the economy has weakened somewhat, and downside risks to growth have increased. Today’s action, combined with the policy actions taken earlier, should help promote moderate growth over time.
Incoming information suggests that economic growth is slowing, reflecting the intensification of the housing correction and some softening in business and consumer spending. Moreover, strains in financial markets have increased in recent weeks. Today’s action, combined with the policy actions taken earlier, should help promote moderate growth over time.
As the Committee had anticipated, economic growth appears to be slowing, partly reflecting the intensification of the housing correction. Although strains in financial markets have increased in recent weeks and now pose greater downside risks to growth, the monetary policy actions taken earlier are expected to help promote moderate growth over time.
Rationale
3. Readings on core inflation have improved modestly this year, but recent increases in energy and commodity prices, among other factors, may put renewed upward pressure on inflation. In this context, the Committee judges that some inflation risks remain, and it will continue to monitor inflation developments carefully.
Readings on core inflation have improved modestly this year, but elevated energy and commodity prices, among other factors, may put upward pressure on inflation. In this context, the Committee judges that some inflation risks remain, and it will continue to monitor inflation developments carefully.
Readings on core inflation have improved modestly this year, but elevated energy and commodity prices, among other factors, may put upward pressure on inflation. In this context, the Committee judges that some inflation risks remain, and it will continue to monitor inflation developments carefully.
Readings on core inflation have improved modestly this year, but elevated energy and commodity prices, among other factors, may put upward pressure on inflation. In this context, the Committee judges that some inflation risks remain, and it will continue to monitor inflation developments carefully.
Assessment of Risk
4. The Committee judges that, after this action, the upside risks to inflation roughly balance the downside risks to growth. The Committee will continue to assess the effects of financial and other developments on economic prospects and will act as needed to foster price stability and sustainable economic growth.
The Committee judges that, after this action, the upside risks to inflation roughly balance the downside risks to growth. The Committee will continue to assess the effects of financial and other developments on economic prospects and will act as needed to foster price stability and sustainable economic growth.
Recent developments, including the deterioration in financial market conditions, have increased the uncertainty surrounding the outlook for economic growth and inflation. The Committee will continue to assess the effects of financial and other developments on economic prospects and will act as needed to foster price stability and sustainable economic growth.
The Committee views the downside risks to growth as the predominant policy concern. Future policy adjustments will depend on the outlook for both inflation and economic growth, as implied by incoming information.
December 11, 2007 138 of 138Authorized for Public Release