fomc 19810707 material
TRANSCRIPT

APPENDIX
FOMC MEETINGJULY 6-7, 1981
Reporting on open market operations, Mr. Meek
made the following statement:
Open market operations since the last meeting
fell into two distinct phases. In the first four weeks,
the Desk pursued a nonborrowed reserve path that was
adjusted downward to accommodate the weakening of M1B
below expectations and the extraordinary bulge in bor-
rowing over the Memorial Day weekend. The discount
window borrowing associated with the path remained at
$1.9 to $2.1 billion throughout this period. In its
June 17 telephone consultation, the Committee accepted
the shortfall in M1B that had developed to that point,
and reduced discount window borrowing to be used in
building the path in the next 3 weeks to $1.8 billion.
For the second subperiod, the staff redrew
the path on the basis of the M1B growth of 3 1/2 percent
then expected from March to June, a growth that compared
with the growth of 5 1/2 percent, or somewhat lower, set
as an objective at the March 31 meeting. As M1B continued
to weaken, the borrowing associated with the new non-
borrowed reserve path fell to $1.6 billion in the first
two weeks of the subperiod. A second borrowing over-
shoot in the first week was also accommodated. In the
most recent week further weakness in money and the demand

for total reserves suggest that borrowing at the window
consistent with the path should be $1.4 billion.
The Desk kept nonborrowed reserves close to the
adjusted path during the first subperiod and we have been
a bit above path during the current three-week interval.
Total reserves were also close to path in the first in-
terval, when path itself was lowered by $180 million to
accommodate the weakness in M1B. In the second interval,
total reserves appear likely to fall short by $165 mil-
lion, as the demand for reserves has continued to decline
without any further downward adjustment in the total
reserve path.
Achievement of the nonborrowed reserve objec-
tive in the past three weeks would normally have produced
some decline in the Federal funds rate, but this did not
really happen. The Federal funds rate remained close to
the 19 percent level prevailing since early May. During
June banks evidently anticipated that the Federal funds
rate would come down automatically with M1B weakness.
In the week ended June 17 in particular, they were
willing to accumulate large reserve deficiences through
Tuesday hoping that the Federal funds rate would come
down from the 18 1/2 percent level prevailing before
the weekend. On Wednesday, of course, they had to face
up to the gap between their expectations and the
reality of nonborrowed reserves being provided by the
Desk. Federal funds traded as high as 30 percent and

borrowing mushroomed to $6.4 billion. The cold shock
of disappointment caused banks to be cautious thereafter,
a caution exemplified in the past two weeks by unexpect-
edly strong demands for reserves around the statement
publishing date and the 4th of July weekend. A reserve
shortfall of $2.2 billion last Thursday contributed to
keeping the Federal funds rate this week well above the
level of 18 percent one would expect from reserve avail-
ability near present levels.
The securities markets have been rather mysti-
fied by the stickiness of the Federal funds rate. A
grudging appreciation has gradually developed that the
Federal Reserve is trying to rein in excessive growth
in the broader aggregates and help reduce inflationary
expectations. But market participants were slow to
reach that conclusion, in part because the Committee's
March 31 directive, the latest published, indicated
that M2 growth of 10 1/2 percent was acceptable in the
second quarter.
As M1B turned weaker in late May and June,
participants bet repeatedly on a near-term decline in
short-term interest rates. A stream of reports on
economic activity and price behavior confirmed that the
economy was slowing and that speculative enthusiasms
were wilting under the relentless pressure of high in-
terest rates. By mid-June dealers and their customers
had pushed rates on the key Treasury bill issues from

180 to 280 basis points below the near-peak levels
prevailing just before the last meeting, while long-term
bonds had rallied enough to reduce yields by 90 to 110
basis points. Dealers expected the reinvestment of the
proceeds of a $13 billion runoff in Treasury cash manage-
ment bills a week or so later to reduce repo rates
sharply and ease the financing of dealer positions.
The rise in the Federal funds rate above 20
percent on June 17 without Desk intervention to supply
reserves dashed the market's near-term hopes. Prices
of Treasury notes and bonds dropped sharply as dealers
scrambled to prepare for the Treasury's sale of over
$12 billion of new issues in the last two weeks. The
two-year note sold on June 18 at a yield of 14.72 per-
cent, down a percentage point from the record levels of
the month before. But the yields of 14.07 percent
established on 7-year notes and of 13.45 percent on the
20-year bond were records, while the 14.02 percent yield
on the 4-year note, was not far from the peak for such
an issue.
Price fluctuations have been substantial during
the entire period. Market hopes of lower short-term
rates are again on the rise, as signs of a slowing
economy accumulate. By last night Treasury bills had
retraced a part of their earlier declines, with the 3-
and 6-month auction rates down 165 and 100 basis points
since May 18. Intermediate Treasury coupon issues
-5-
were generally 25 to 75 basis points lower in yield over
the interval, while the 30-year bond was down 40 basis
points to 13.15 percent. Rates on 3-month CDs ranged
widely over the period, closing 135 basis points lower
at 17.45 percent. The prime rate moved in a range of
19 1/2 to 20 1/2 percent, with nearly all banks currently
at 20 percent.
In other sectors of the securities markets,
tax-exempt securities remained the wallflowers of the
industry with yields little changed over the interval.
Interest remained lackluster from banks and insurance
companies, while improving prospects for the Adminis-
tration's tax-cut proposals raised concerns about their
future attractiveness to high-bracket individuals.
There was also market talk that Federal spending
reductions might affect the creditworthiness of the
states and localities. Corporate bond offerings
picked up considerably with $4 billion issued during
June. A substantial volume remains waiting in the
wings, as corporate willingness to finance near
current rate levels has grown significantly.
One area that deserves special mention is the
market for Federally sponsored agency securities.
Critical analyses of the Federal National Mortgage
Association have led many trust accounts and other
investors to take the agency off their approved list

or scale back their holdings of its issues. FNMA wisely
cut back its monthly offerings in May and June by $850
million, but its recent $600 million four-year issue
required a yield about 110 basis points over a comparable
Treasury issue, compared with spreads of 30 to 40 basis
points about the time of the last meeting. The issue
sold well at that spread. There appears to be a good
appetite from money market funds and others for the 30-
to 60-day discount notes being sold at an even wider
spread, but there is a certain vulnerability in having
so much short paper to roll over. The Federal Home Loan
Banks were able to raise about $1.8 billion in the
interval, but the spreads of their issues against
governments has also widened to 80 basis points or so.
The Farm Credit agencies are generally trading at a
spread of about 60 basis points.
Treasury financing in the third quarter appears
likely to be a bit higher than the $9 to $12 billion the
Treasury thought likely a few weeks ago. The current
Board and New York estimates are at $16 and $18 billion,
respectively, while some market estimates run as high
as $20 to $21 billion. This would still be a consider-
able reduction from the $28 billion sold in last year's
third quarter.

Notes for FOMC MeetingJuly 6-7, 1981Scott E. Pardee
Since once again we had no operations for the account of U.S. authorities, andsince previous tendencies continued, I can be brief The dollar again advanced across theboard, by a net of 6 to 7 percent against the German mark and the other Europeancurrencies tied directly or indirectly to the mark. The dollar also rose by 8-1/2 percentagainst the pound sterling. The dollar advanced somewhat less against the yen andmarginally against the Canadian dollar.
The factors in the dollar's rise are:--the continued apparent strength of our current account relative to mostother industrial countries;
--favorable interest rate differentials, with yet another unexpected run-upin our rates recently;
--positive sentiment toward the Reagan Administration;
--better numbers here on inflation; and
--what the Europeans are calling "Euro-pessimism."
This last perhaps needs some explanation. It focuses on political divisions withincountries, the broader uncertainties generated by the new socialist government in France--which for the first time included communists in the cabinet--and outside concerns suchas with Poland. It focuses on the economic dilemmas those countries face, with stagnanteconomies, unemployment, current account deficits, and declining currencies. There aredangerous elements to this mood, and Europeans are prone to vent their frustrations bycriticizing us. The criticism is mainly directed at our high interest rates and the dollarpolicy. Administration officials as well as many of us from the Federal Reserve have alltried to dispel this criticism. Our central bank counterparts at least understand what weare saying, and may even sympathize with us, but the feeling runs deep.
Right now, the market expects the dollar to remain strong for some time to come,but many participants believe that the dollar is unsustainably high. Our counterpartsabroad are smarting from the lack of cooperation from the United States on exchangemarket matters. Should the dollar come under heavy selling pressure for whateverreason, it will have to fall a long way before other central banks would lift a finger tomoderate the decline.
James L. KichlineJuly 6, 1981
FOMC CHART SHOW -- INTRODUCTION
In our presentations this afternoon we will be refer-
ring to the package of chart materials distributed to you. The
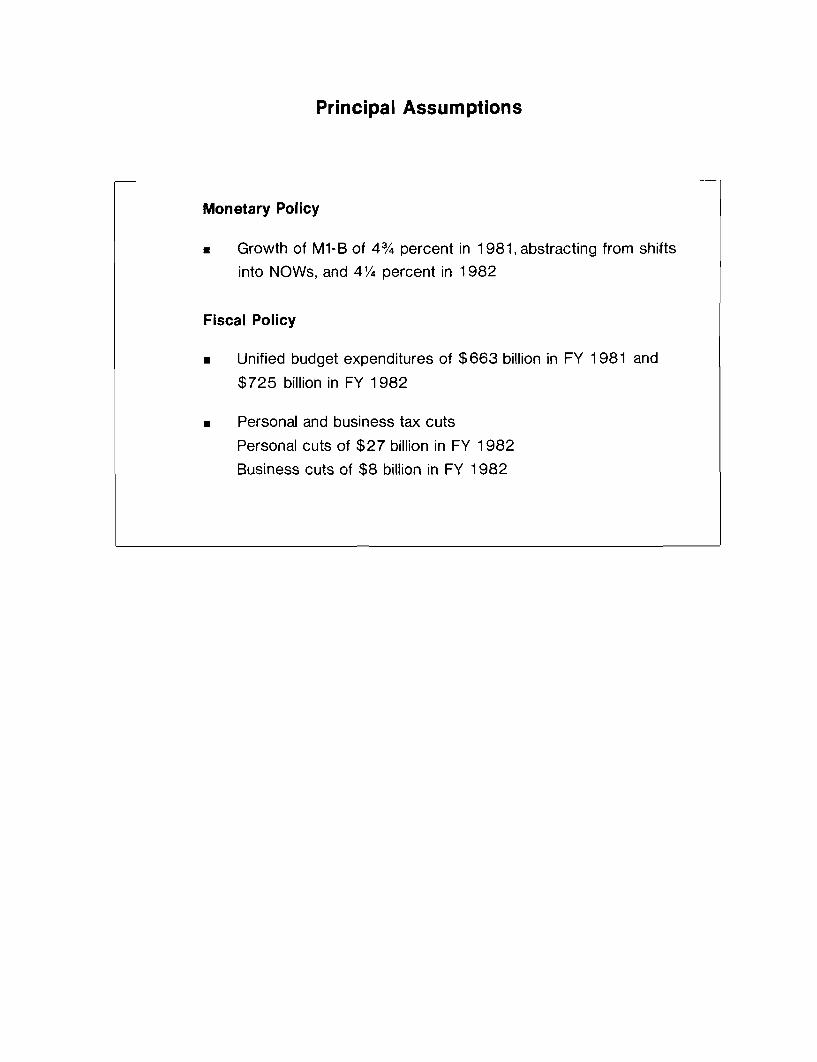
first chart in the package displays the principal policy assump-
tions that underlie the staff forecast. For monetary policy we
continue to assume growth of M-1B of 4-3/4 percent this year,
adjusted for shifts into NOW accounts, and 4¼ percent next year.
This assumption is embodied in long-run Strategy I in the Bluebook.
The fiscal policy assumptions include restraint on growth of
outlays and tax cuts, both revised somewhat since the last FOMC
meeting to reflect our assessment of legislative developments.
We now assume the administration will obtain about 4/5 of the
expenditure reductions they are seeking in fiscal 1982, a little
more than we had been assuming earlier. The personal tax cut has
been scaled back to a 5 percent across-the-board reduction on
October 1, with an additional 2 percent for selected cuts. A
second-stage cut of 10 percent has been included beginning July
1982, a new element in the staff forecast assumptions. Together
these personal tax cuts total about $27 billion in fiscal 1982,
while depreciation changes are expected to result in about $8
billion of tax reductions to businesses.
The next chart provides further information on the
federal budget. The fiscal assumptions along with the staff's
economic forecast are projected to result in an appreciable
increase in the budget deficit next fiscal year, to nearly $80

-2-
billion. We do not yet have the administration's budget figures
to be presented to Congress in the midyear review, but compared
to their March program the staff deficit figures are about $5
billion higher in fiscal 1981 and nearly $35 billion higher for
next fiscal year.
Both outlays and revenues are projected to remain quite
high relative to GNP in the forecast period. The black line in
the bottom left panel indicates that total outlays as a percent
of GNP are expected to only level out in fiscal 1982 even with
the sizable program reductions assumed. The underlying economic
situation--including rising unemployment and high interest rate
levels--acts to hold up outlays relative to GNP; as the red
line shows, outlays excluding interest on the debt are projected
to decline. Federal receipts as a percent of GNP, the right-hand
panel, also are expected to decline somewhat, reflecting the
assumed tax cuts. Historically, however, receipts still remain
very high relative to GNP--a function largely of the impact of
inflation.
Mr. Zeisel will continue the presentation with a dis-
cussion of recent and prospective developments in the domestic
nonfinancial economy.
* * * * *
Joseph S. ZeiselJuly 6, 1981
FOMC CHART SHOW
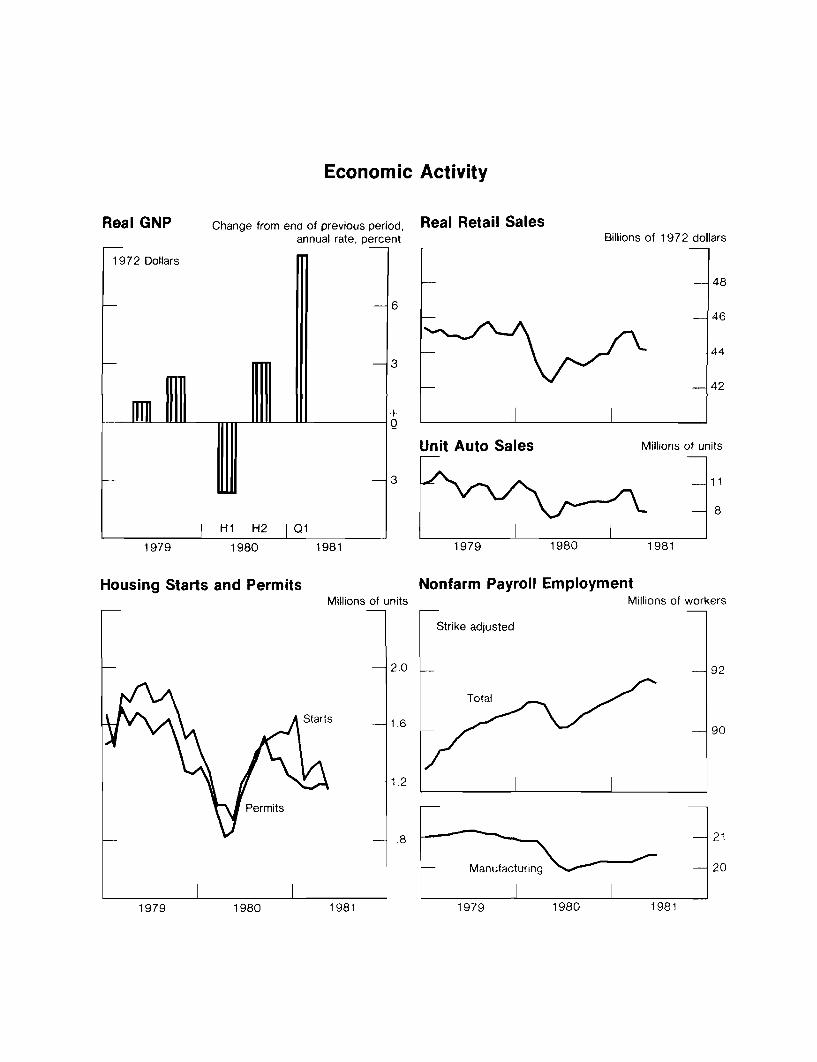
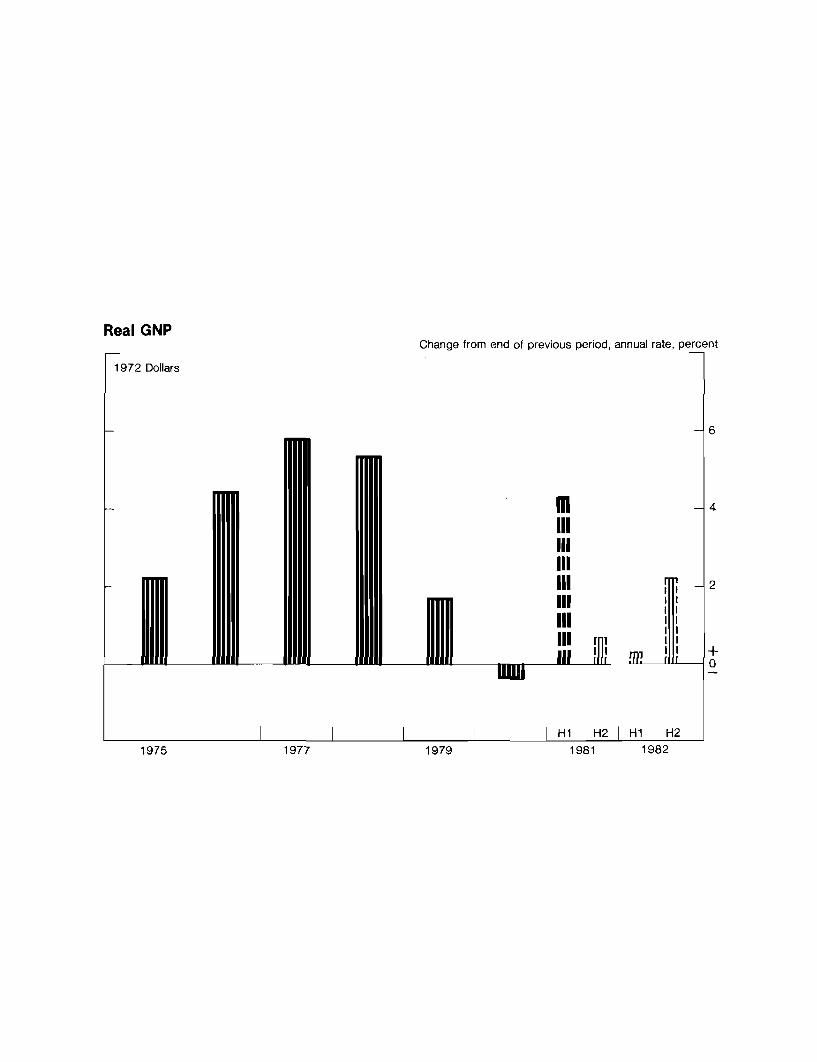
The 8 percent annual rate of GNP growth in the first
quarter--shown in the top left-hand panel of the next chart--came
as quite a surprise. It was probably in part a continuation of
recovery from the collapse in the spring of 1980, in confluence
with a number of otherwise disparate factors. In any event, most
of the first quarter vigor derived from a surge in December and
January; the economy actually began to lose momentum shortly after
the turn of the year, and there is convincing evidence now of a
slowdown in a wide range of sectors. It is likely that the
economy experienced little or no growth in real GNP in the second
quarter.
The bottom left panel shows the substantial decline in
homebuilding beginning in February which has now carried starts to
a 1.15 million annual rate--25 percent below the fourth quarter
1980 level.
As the upper right-hand panel shows, real retail sales
turned downward in April, led by a drop in autos. Since then,
auto sales have remained below their pre-rebate pace; domestic
car sales in June were at a 5.4 million rate, down from 5.7 in
April and May. Excluding autos, retail sales declined further
in real terms in May.
The generalized weakness of economic activity in recent
months apparently is now also being reflected in the employment

-2-
figures. Payroll employment adjusted for strikes fell in June
by 150,000, with declines quite pervasive.
The next chart shows our view of the outlook for real
GNP growth for the balance of 1981 and for 1982. The tax cuts
late this year and in mid-1982 should provide some boost to
activity. But the weakness of housing will stunt overall growth
in the near term and generally, the rise in GNP over the entire
projection period remains constrained by monetary policy and curbs
on government spending. On balance, real GNP growth is projected
to average only about one-half percent over the next four quarters
and pick up to about a two percent rate in the last half of 1982.
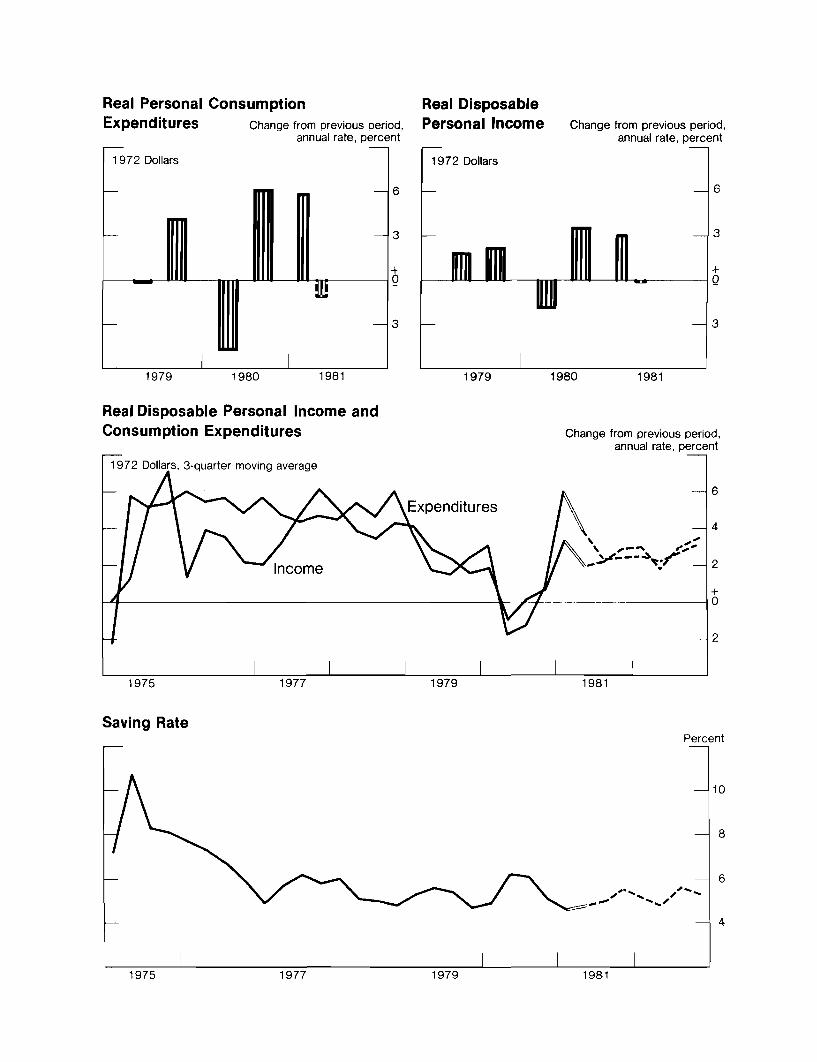
The top left panel of the next chart indicates the key
role played by consumer demand in both the rebound of the economy
through the first quarter and the sudden loss of momentum in the
spring. Some of this reflected the rebate-associated shifting of
auto sales from the second quarter into the first. Probably more
important, however, is the cessation of real income growth--the
right-hand panel--which accompanied the slackening of employment
gains.
As the middle panel shows, we assume that consumer out-
lays will in general continue to track disposable income. Responding
to the tax cuts late this year, and again in mid-1982, we anticipate
real consumer spending will increase over the next six quarters at
about a 2-3/4 percent annual rate--as compared to the half percent
rise in 1980.

-3-
The saving rate--the bottom panel--is projected to
remain relatively low by historical standards. But the tax
reductions should permit some improvement in savings as well as
in consumption; we are projecting the rate to edge up slightly
into the 5 percent range in the latter half of next year from
its recent extremely low level--the lowest since the Korean War
buying splurge.
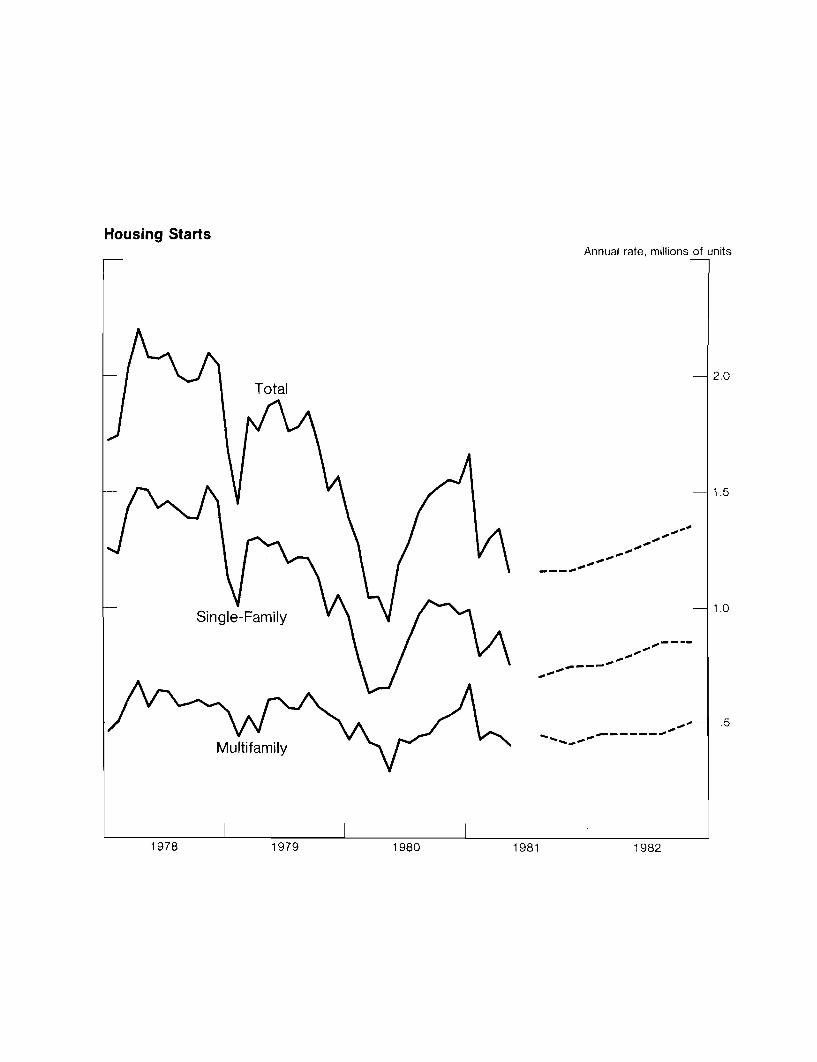
The top panel of the next chart indicates the recent
decline in housing starts in response to higher interest rates
and tighter financial conditions. This drop in activity dictates
a deterioration in real residential construction expenditures over
the balance of the year.
Moreover, there is evidence of a generalized weakening
of demand in real estate markets. Sales of new homes--shown in
the middle panel--in May, were a fifth below their average level
last summer; purchases of existing homes have also declined. As
the bottom panel shows, average prices of new homes have continued
to rise, but at a substantially slower pace than in the past few
years. These figures may in fact understate the price decelera-
tion, since home prices recently have increasingly incorporated
payments for improved financing arrangements.
But, as the next chart indicates, it is our view that
housing starts may now well be at, or close to, their bottom.
Underlying demand pressures associated with population and migra-
tion trends remain strong and we are looking for an upturn as S&L
deposit flows improve a bit--partly because of recent DIDC actions--
-4-
and new mortgage instruments increasingly gain a place in the
market. By the end of 1982 we are projecting a 1-1/3 million unit
rate of starts, some 200,000 at an annual rate above the current
pace--but this would still be anemic by historical standards.
The next chart addresses the outlook for business capital
spending. Real fixed investment outlays appear to have fallen in
the second quarter following a first-quarter surge and commitments
data suggest a stagnant situation for the balance of the year. As
the top panel indicates, growth of real new orders for nondefense
capital goods has stalled this year; orders for defense equipment,
after rising strongly from mid-1979, have been on a plateau since
about last fall; and new contracts for commercial and industrial
construction similarly have shown no strength recently. These
data appear to be generally consistent with results of the most
recent Commerce capital spending survey, which suggested little
or no growth of real investment outlays this year.
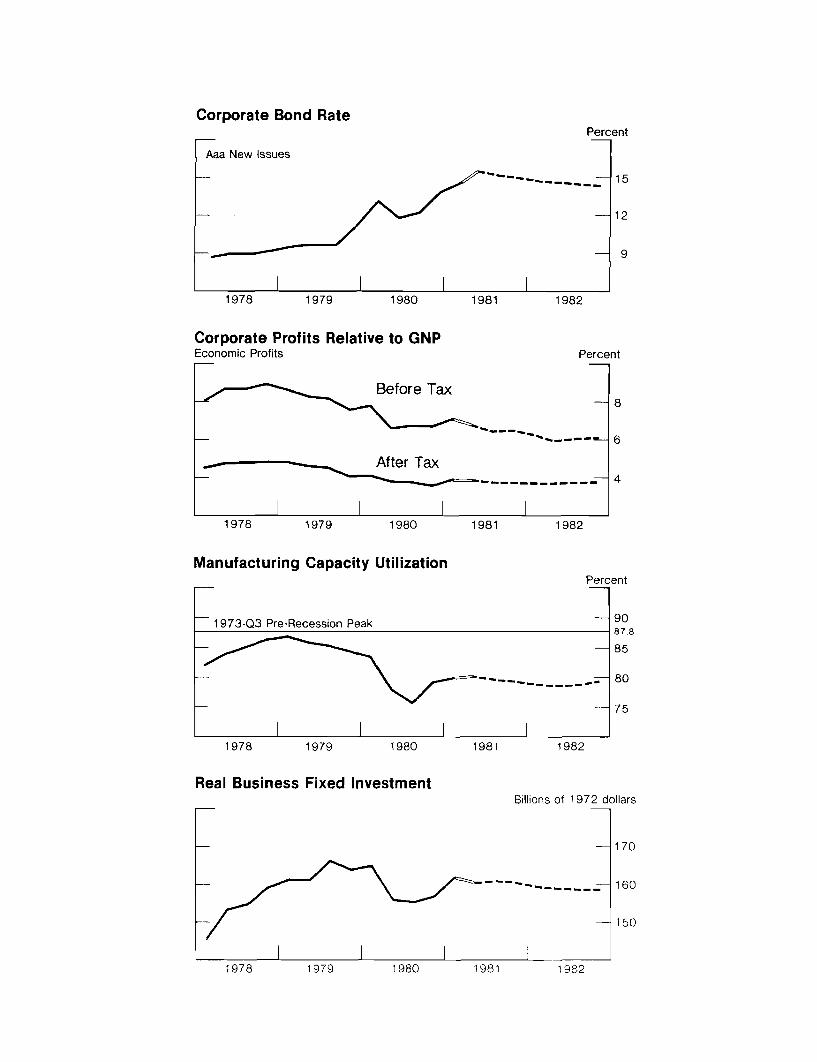
The investment outlook for 1982 is obviously more
speculative. Liberalized tax incentives and the expanding
defense program should stimulate increased capital spending as
time goes on. But a number of fundamental factors appear likely
to continue to damp investment outlays. As the next chart shows,
the cost of debt capital is expected to remain high; after-tax
profit positions relative to GNP are not projected to improve;
and with capacity utilization remaining low, we expect little
demand for expansion of capital stock, except in such fast growing
sectors as defense and the energy-related areas. On balance, we
-5-
are projecting a small decline in capital outlays over the pro-
jection period.
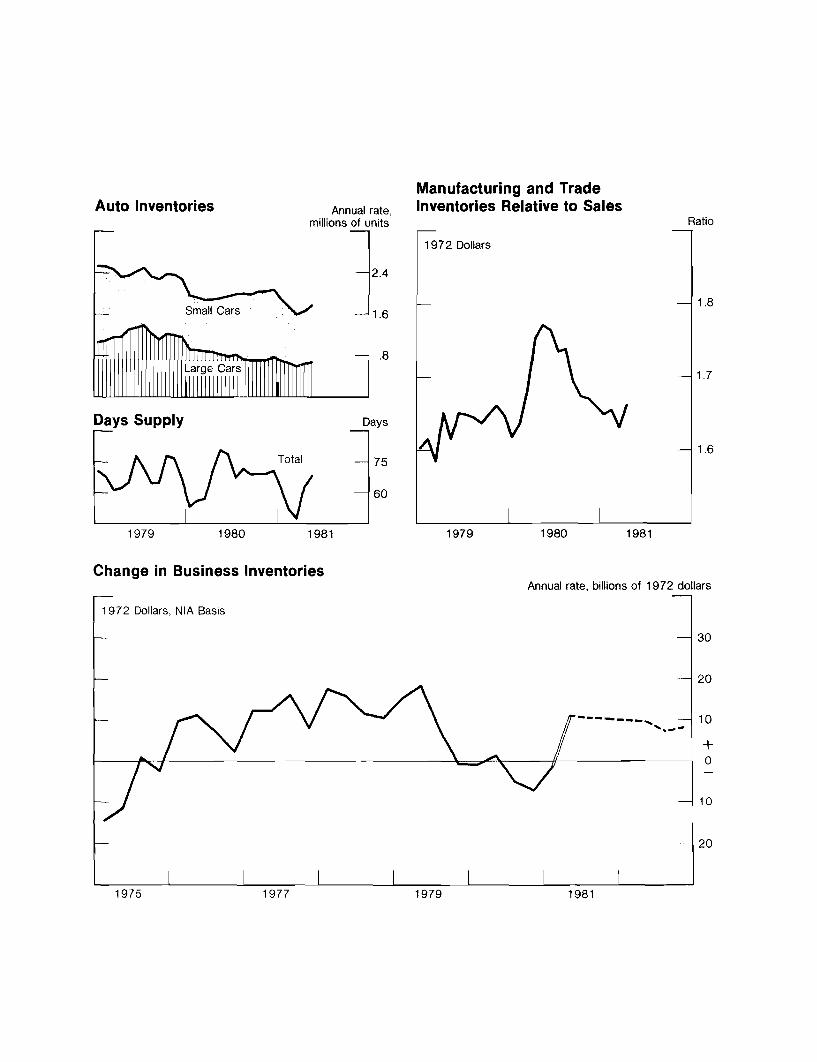
As the next chart shows, the inventory situation does
not suggest any serious problem at the moment. As is evident in
the top panels, there was some backup in dealers' car stocks as a
result of the weakness in auto sales in the past few months. But
business stocks overall appear to be in reasonable balance with
sales--the right panel. The distortions of last spring were
largely eliminated by inventory liquidation in the latter half of
1980 and early this year. We are not projecting any collapse in
sales, and we assume that businesses generally will succeed in
avoiding significant stock imbalances. As the bottom panel indi-
cates, we expect a moderate rate of increase in real inventory
investment through the projection period--raising stocks somewhat
relative to sales as growth picks up and reflecting the projected
defense buildup.
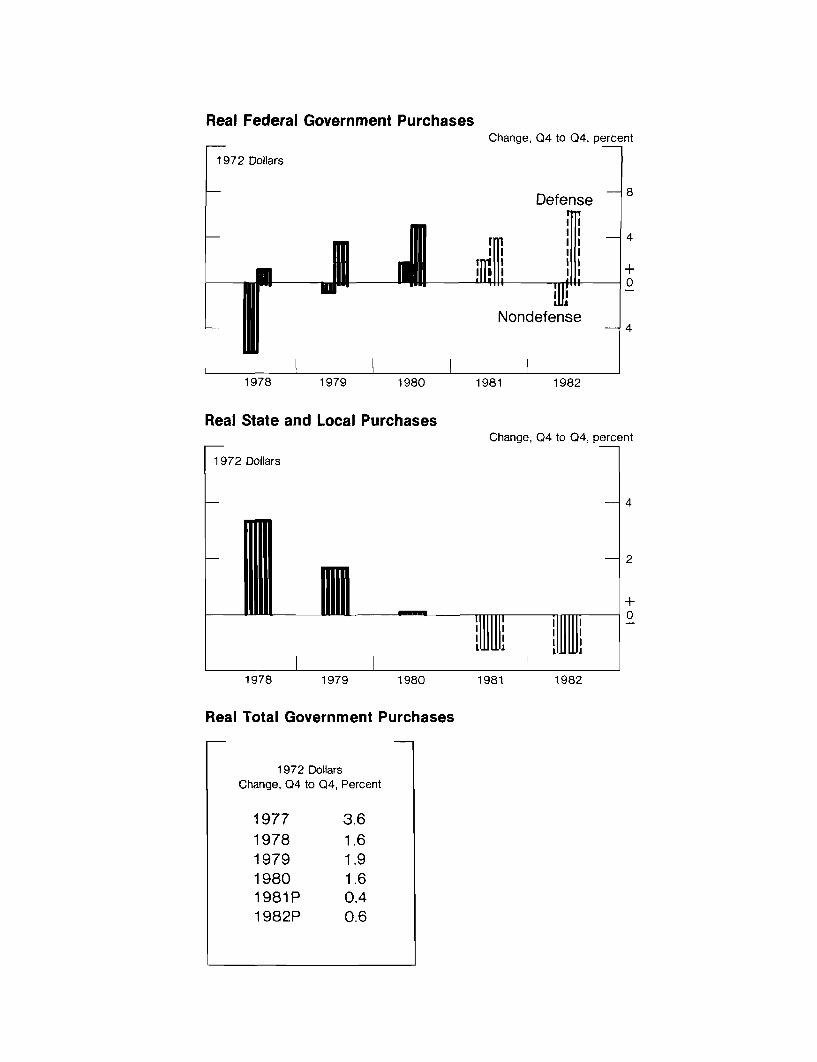
The next chart addresses the government component of
spending. Federal defense purchases are projected to continue
rising strongly this year, but not quite at last year's pace;
however, they are expected to accelerate again in 1982, moving up
in real terms by about 7 percent. Excluding compensation, the
real increase in 1982 would be about 9-3/4 percent. But given
the curbs on nondefense spending, total real federal government
purchases are projected to rise at slightly less than the 1980
pace.

-6-
In addition, we are anticipating substantial reductions
in federal grants to states and localities. The curtailed spending
by state and local governments projected for calendar years 1981
and 1982--shown in the middle panel--reflects this reduction in aid
as well as budgetary pressure from continued high interest costs
and depressed receipts. As shown in the bottom table, we are now
expecting only a fractional rate of increase in real total govern-
ment purchases through 1982.
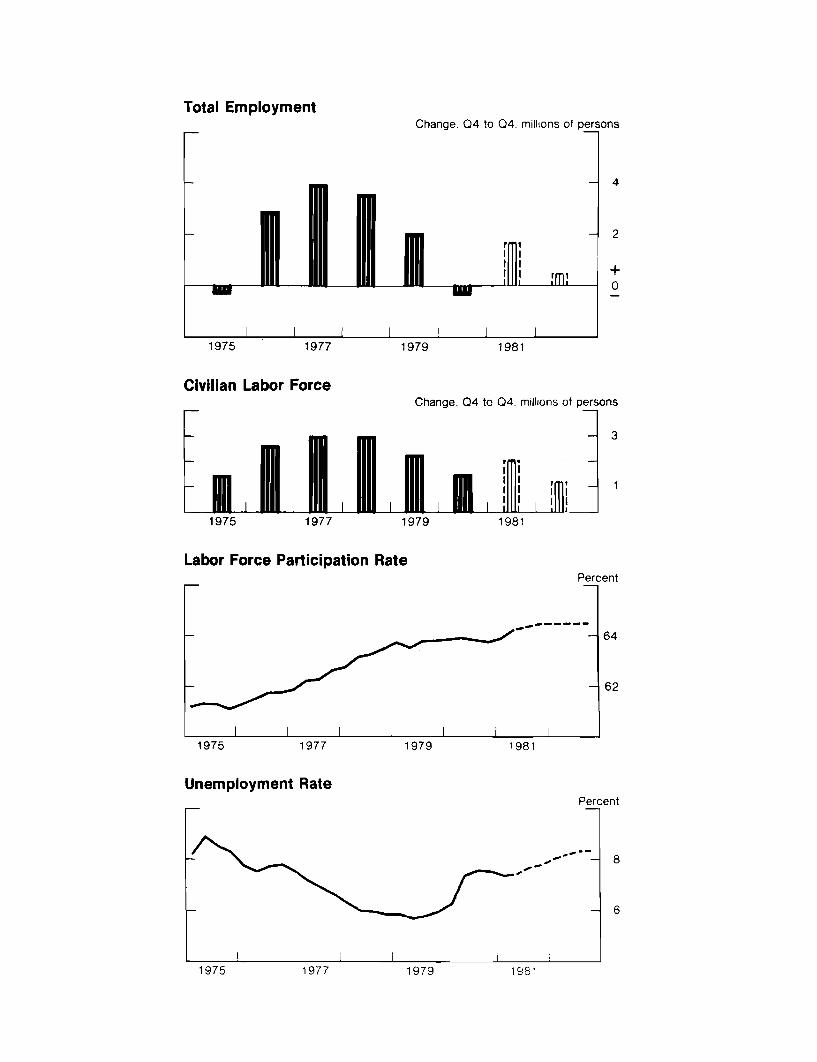
The next chart portrays the outlook for the labor market.
The relatively strong gain in total employment shown for 1981
reflects largely increases that have already occurred, in part a
rebound from the cutbacks early last year. In line with projected
output, however, we expect little employment growth over the
remainder of this year and in 1982. As indicated in the second
panel, limited job opportunities should depress labor force growth.
Consistent with the experience in other recent periods of sluggish
demand, we anticipate no increase in the rate of labor force
participation. Nevertheless, the expansion of labor supply is
likely to outpace job creation, and unemployment--shown in the
bottom panel--is projected to rise from the current 7¼ percent
rate to about 8¼ percent by the end of 1982.
The prolonged period of slack labor markets should soon
pay dividends in some easing of wage inflation. Although compen-
sation is still rising rapidly--the top panel of the next chart--
some signs of moderation in wages have recently emerged and we
expect this trend to continue, given the environment of sustained

-7-
high unemployment anticipated through the projection period.
Reduced consumer price pressures should also contribute to
improved wage performance.
As the middle panel shows, we also expect some gains in
productivity. Given the modest rise in output, and in the light
of its recent poor performance, we are forecasting less than a one
percent rate of rise in productivity for 1982. Nevertheless, such
an improvement, when combined with the expected reduction in wage
pressures, would result in a distinct deceleration of unit labor
costs, which are expected to be rising at only about a 7 percent
rate in the latter half of 1982.
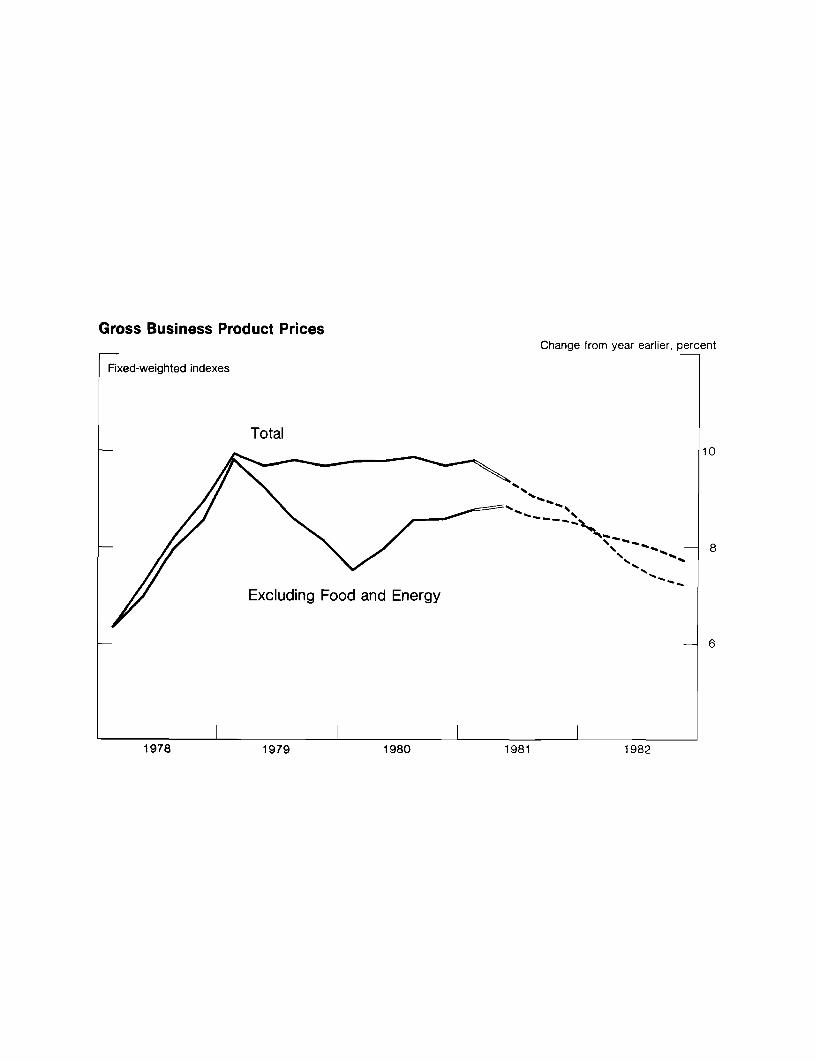
The outlook for prices is indicated in the next chart.
The moderation of price increases recently has reflected mainly
developments in the energy and food sectors. While the improved
price performance in food, in particular, is likely to be
temporary--in fact there are already indications of a rebound in
meat prices--longer-term benefits should be evident in some feed-
back effects on wages, and possibly, a salutory impact on attitudes.
More fundamentally, prices excluding food and energy, should also
be showing measurable improvement soon, reflecting reduced pressure
from labor costs as well as continued slack in product markets.
The stronger position of the dollar in international markets should
also help. Overall, we are now forecasting that prices will be
rising at about a 7¼ percent rate by the end of 1982, off from
the 9 percent rate recently.
Mr. Truman will now continue with a discussion of the
international outlook.
E.M. TrumanJuly 6, 1981
FOMC Chart Show Presentation
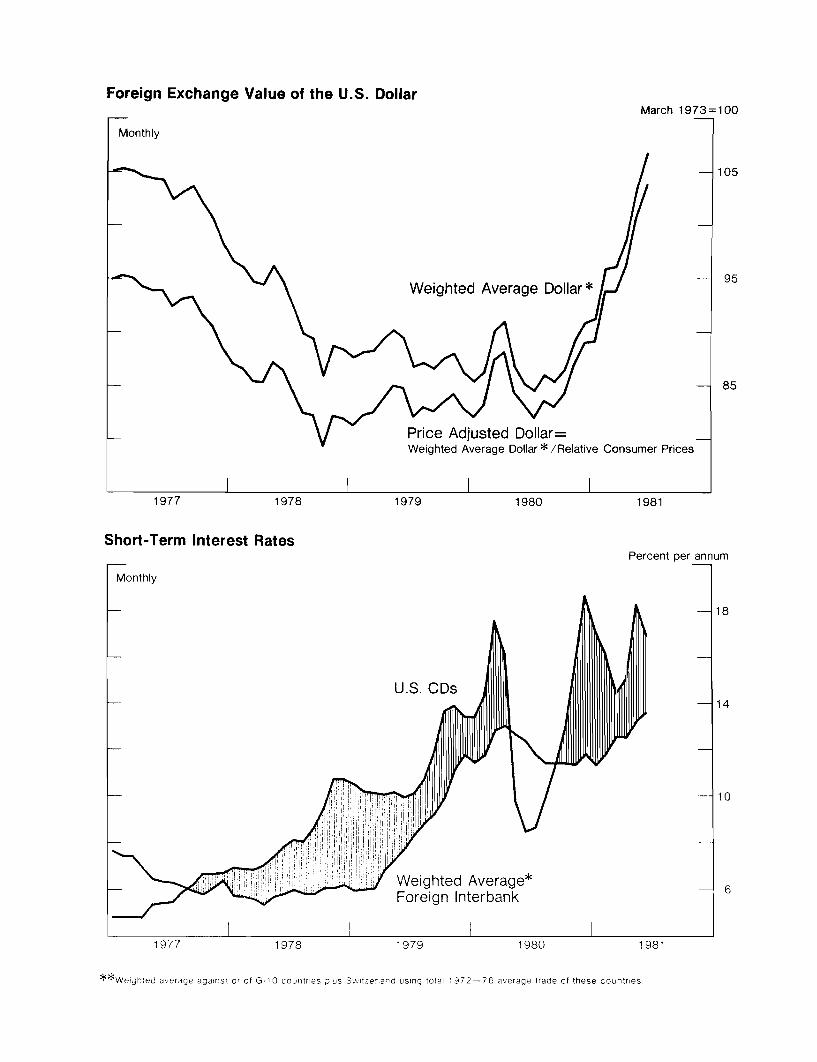
The red line in the top panel of the first international chart
shows that, since July 1980, the dollar has appreciated steadily on a
weighted-average basis. In June, the dollar's value averaged 25 percent
more than a year ago and reached its highest level since 1976. As shown by
the black line, the dollar's appreciation on a price-adjusted basis has been
about the same, reflecting the fact that over the past year the pace of in-
flation in the United States has been about equal to the rate on average abroad.
The substantial appreciation of the dollar is the principal
factor generating the staff's forecast swing of the U.S. current account into
deficit in the second half of this year and in 1982. This movement, if
realized, is expected eventually to contribute to some decline in the
dollar's value. Meanwhile, as Mr. Zeisel mentioned, the appreciation of
the dollar since last year should contribute importantly to the expected
reduction in the rate of price inflation in the United States.
As is shown in the lower panel, although the initial phase of the
dollar's appreciation was associated with a widening of the differential
between U.S. and foreign interest rates in the latter part of 1980, the
dollar's strength so far this year has not been associated with a further
widening. Indeed, the differential recently has been smaller than it was
at the turn of the year. Several factors appear to have contributed to the
dollar's strength. Among them are the unsettled economic and political
conditions in Eastern and Western Europe and the continued U.S. current-
account surplus through the first quarter. But an important factor also
-2-
appears to have been a decline during the past six months in the rate of
inflation expected for the United States combined with a rise in the average
rate of inflation expected abroad. In the staff's forecast, for example, the
net revision in expected consumer price levels is about 5½ percent by the end
of the forecast period. This changed outlook has increased the differential
between real interest rates.
The top panel of the next chart depicts the staff's outlook for
consumer prices here and abroad. As can be seen, the gap between U.S. and
average foreign inflation is projected to narrow sharply this year and
essentially to disappear in 1982.
Meanwhile, as is shown in the lower panel, we expect for this
year somewhat faster real growth in this country than on average abroad --
largely because of the first-quarter results. Next year the pattern is
expected to be reversed. Thus, on balance during 1981 and 1982, real economic
growth is expected to be generally similar here and abroad.
The next chart summarizes our outlook for the international oil
market. The apparent glut that has emerged in this market in recent months
has caused us to adopt a more optimistic assumption about the outlook for oil
prices, which, in turn, has contributed to the staff's somewhat more
optimistic outlook for inflation generally.
As is shown in the top panel, we expect the unit value of U.S.
oil imports to decline very slightly during the rest of 1981, reflecting
lower prices on the spot market and a unification of the OPEC price around
the current Saudi price of $32 per barrel. In 1982, we are assuming that
the real oil price will rise slightly. This scenario implies a
price about 12½ percent lower throughout the projection period than we
were assuming six months ago.
The principal factor contributing to this improved outlook is
the reduction in the global demand for oil, reflecting slow real growth and
the response of demand to high oil prices. One result, depicted in the
middle panel, is that OPEC oil production has declined from almost 31 million
barrels per day in 1979 to less than 25 million barrels per day this year
and is expected to edge off further next year. Moreover, non-OPEC production
has increased somewhat absolutely and, more importantly, relative to OPEC
production. With the major exception of Saudi Arabia, many producers need
the export revenues generated by their current rates of production and, thus,
the scope to scale back output, for an extended period of time, to sustain
rising prices is more limited than was the case several years ago.
As is illustrated in the bottom panel, U.S. oil imports are now
running about 2 million barrels per day less than the rate two years ago,
and they are expected to decline further over the forecast period. We now
expect that the U.S. oil-import bill in 1982 will be essentially unchanged
from the roughly $80 billion projected for 1981.
Turning now to the "bad news," as is shown by the red line in the
upper panel of the next chart the volume of U.S. non-oil imports is expected
to expand rapidly during the forecast period largely as a consequence of
the dollar's appreciation. Similarly, as is shown in the lower panel, the
volume of U.S. non-agricultural exports is projected to decline quite rapidly
in the second half of this year and for the rest of the forecast period.
The implications of these shifts for U.S. aggregate demand are
shown in the top panel of the next chart. As a consequence of rising real
receipts on exports of services, the decline in U.S. exports of goods and

services, on a constant-dollar GNP basis, is projected to be moderate and
not to start until early 1982. Nevertheless, the contribution of exports
to U.S. aggregate demand this year will be substantially less than in 1978,
1979 and early 1980. Next year the contribution is expected to be negative.
Returning to current-dollar magnitudes, as is shown in the middle
panel, the U.S. trade deficit is projected to increase sharply in the second
half of 1981 and in 1982, reaching almost $60 billion at an annual rate in the
second half. Meanwhile, in contrast to the pattern in the late 1970s, the
net surplus on non-trade transactions will show little change. Consequently,
the U.S. current account is expected to swing into deficit, reaching
a rate of about $30 billion at an annual rate in the second half of next
year.
Mr. Kichline will now complete our presentation.

James L. KichlineJuly 6, 1981
FOMC CHART SHOW -- CONCLUSION
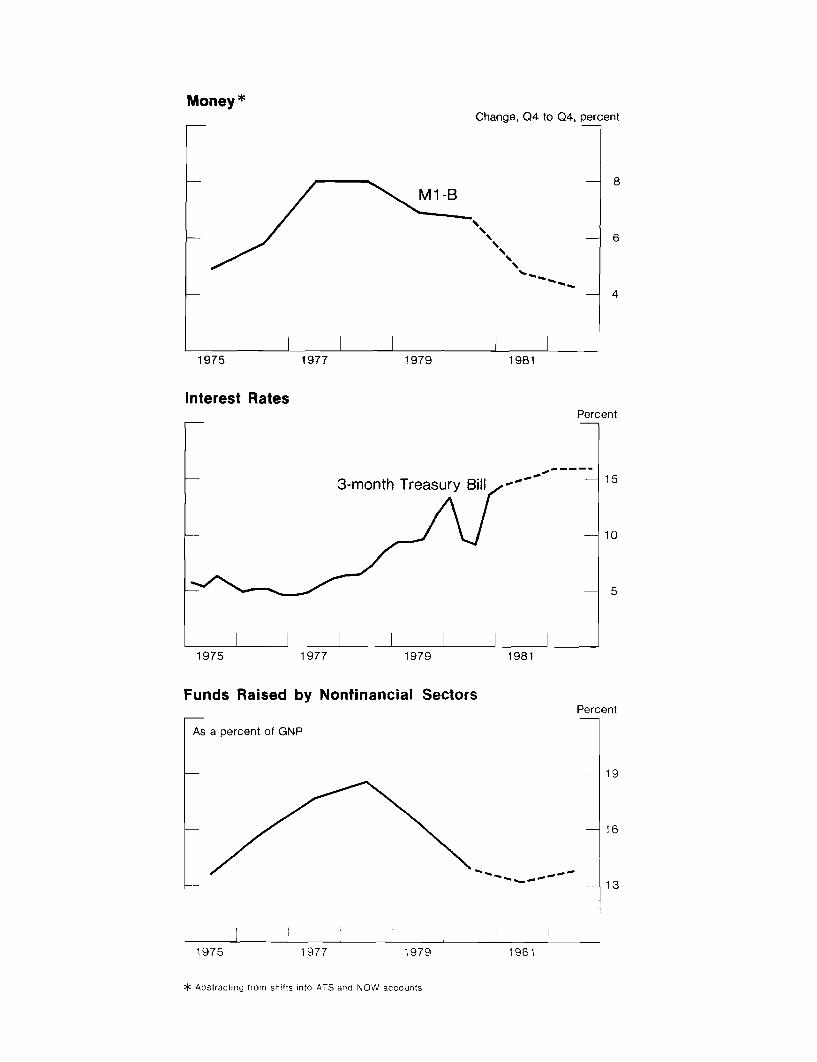
The staff's economic forecast is associated with an
environment of considerable restraint on financial markets.
The top panel of the next chart indicates an assumed growth of
M-1B this year and next substantially slower than that experienced
in the preceding several years and, to achieve the projected
nominal GNP, will require sizable increases in velocity. There
clearly are many pitfalls in linking a given rate of growth of
money to expected GNP and interest rates, but our general view
is that high interest rate levels--shown in the middle panel--
will be required on average to restrain strong underlying demands
for goods and services in the economy and related demands for
money. Such restraint on financial markets likely would be con-
sistent with a moderate volume of funds raised by nonfinancial
sectors relative to GNP, as displayed in the bottom panel.
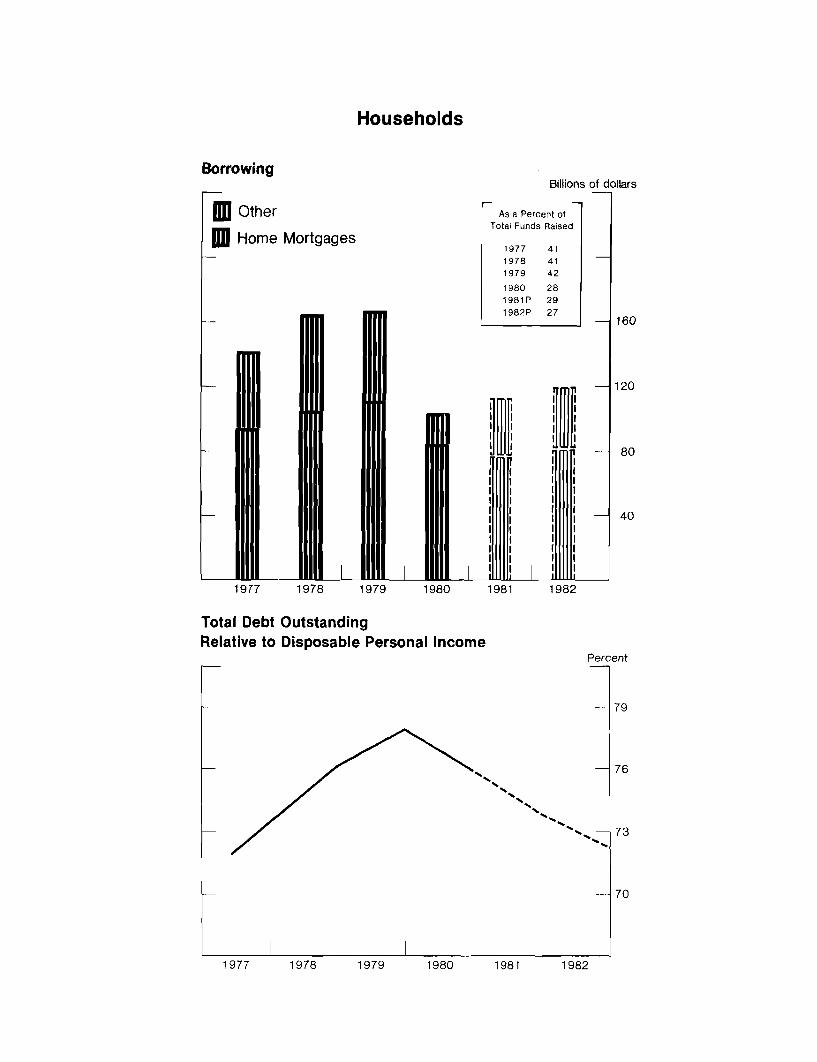
The household sector, the next chart, is the main area
in which total borrowing demands are expected to be appreciably
constrained. So far this year, household borrowing has remained
close to the sharply reduced volume in 1980. We expect little
growth of consumer borrowing next year, consistent with the
generally sluggish activity projected for the credit-sensitive
housing and durable goods markets. The reduction in borrowing
from the rapid pace in the late 1970s has led to some decline
in total debt outstanding relative to disposable income, as

-2-
shown in the bottom panel, and further declines are projected.
This measure does not take account of the terms of debt taken
on or the distribution of debt among households, so one can draw
only a small degree of comfort when looking at this aspect of
the financial status of households.
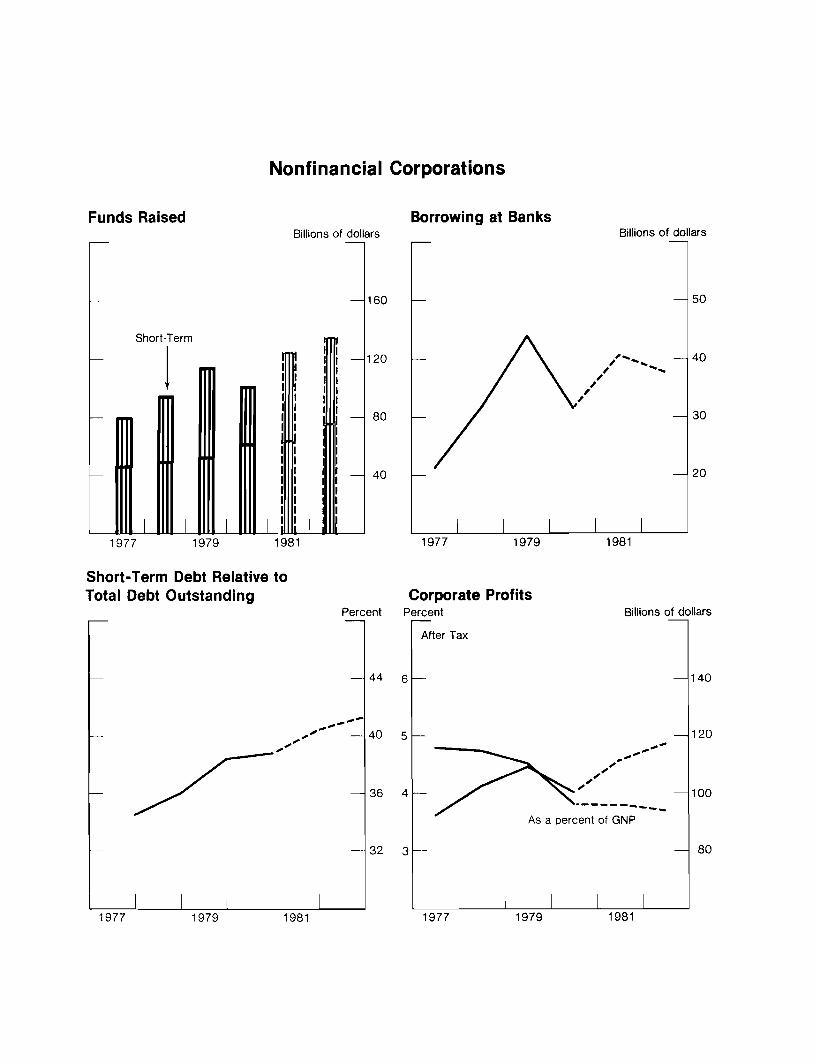
In the corporate sector, the next chart, financing
requirements are likely to continue rising this year and next,
as indicated in the top left panel. Businesses generally appear
to be under appreciable financial strain and there is reportedly
a strong desire to fund some of their short-term debts. While
we anticipate a little rise of long-term financing over the
course of the projection, the markets seem unlikely to be
receptive to much more than is forecasted and firms may perceive
rates to be unattractive. Thus, business borrowing at banks
probably will be sizable--the top right-hand panel--and short-
term debt will continue to rise as a proportion of total debt--
the bottom left-hand panel. Pressures on balance sheets arise
partly from the sluggish performance of profits, the bottom
right-hand panel, and although profits after tax are projected
to grow further next year they are weak relative to corporate
outlays. Profits as a percent of GNP, a proxy for profit margins,
are expected to remain depressed, which is not unusual for a
period of slow economic growth and deceleration of inflation.
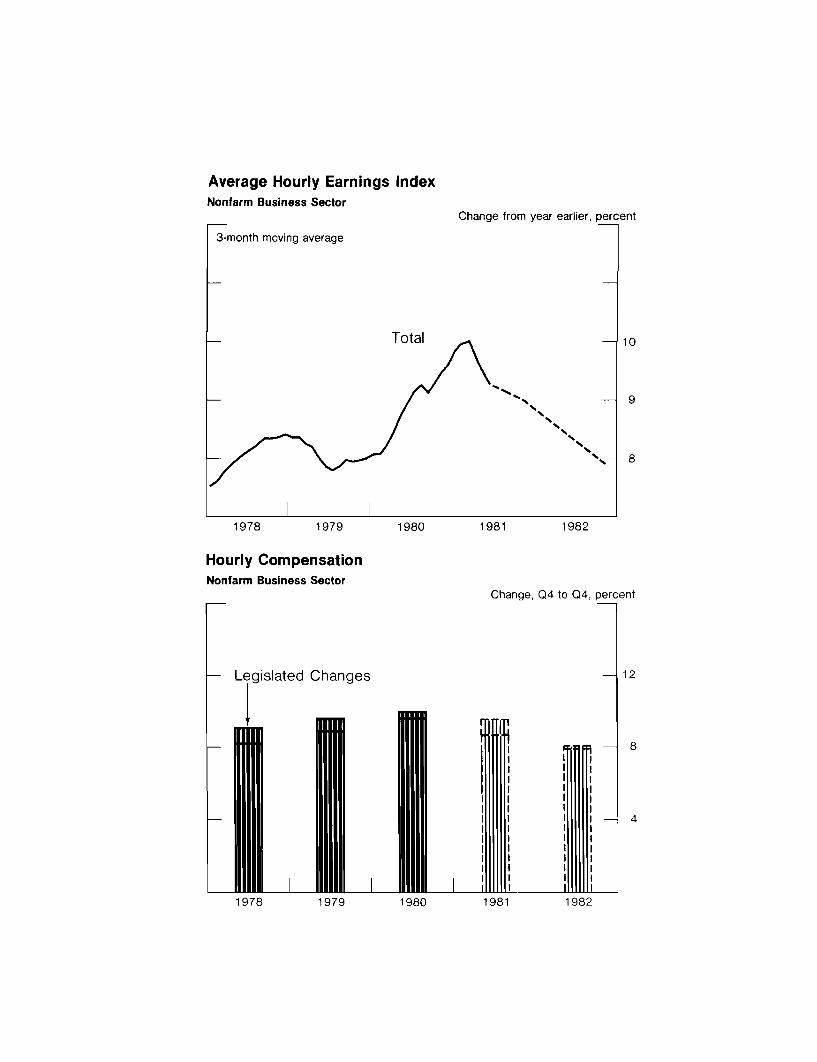
A key element in the outlook for inflation is the
behavior of wages, shown on the next chart. The top panel
indicates average hourly earnings this year have been diverted
from the steep uptrend in 1980. The evidence on slower growth

-3-
of wages is still tentative since it hasn't persisted very long
and it is not yet pervasive. But it is encouraging and should
be assisted by the recent better price performance through
somewhat smaller cost-of-living adjustments and through lower
nominal wage demands. We anticipate persistent slack in labor
and product markets will contribute to a further moderation of
wage growth next year which will help slow increases in hourly
compensation--the bottom panel. Moreover, legislated changes
which add to compensation costs will be small in 1982 with no
minimum wage increase scheduled nor a huge boost in social
security payroll taxes as occurred this past January.
The top panel of the next chart indicates that unit
labor cost increases have slowed recently, as discussed by
Mr. Zeisel, and the projected slowing of compensation growth
should be showing up in reduced unit labor cost increases over
time. And as noted by Mr. Truman, the energy outlook and the
behavior of the foreign exchange value of the dollar both will
have favorable domestic price implications. Overall, we believe
there are now in train a number of forces operating to put the
economy on a path of reduced inflation and this continues to be
reflected in the staff's forecast.
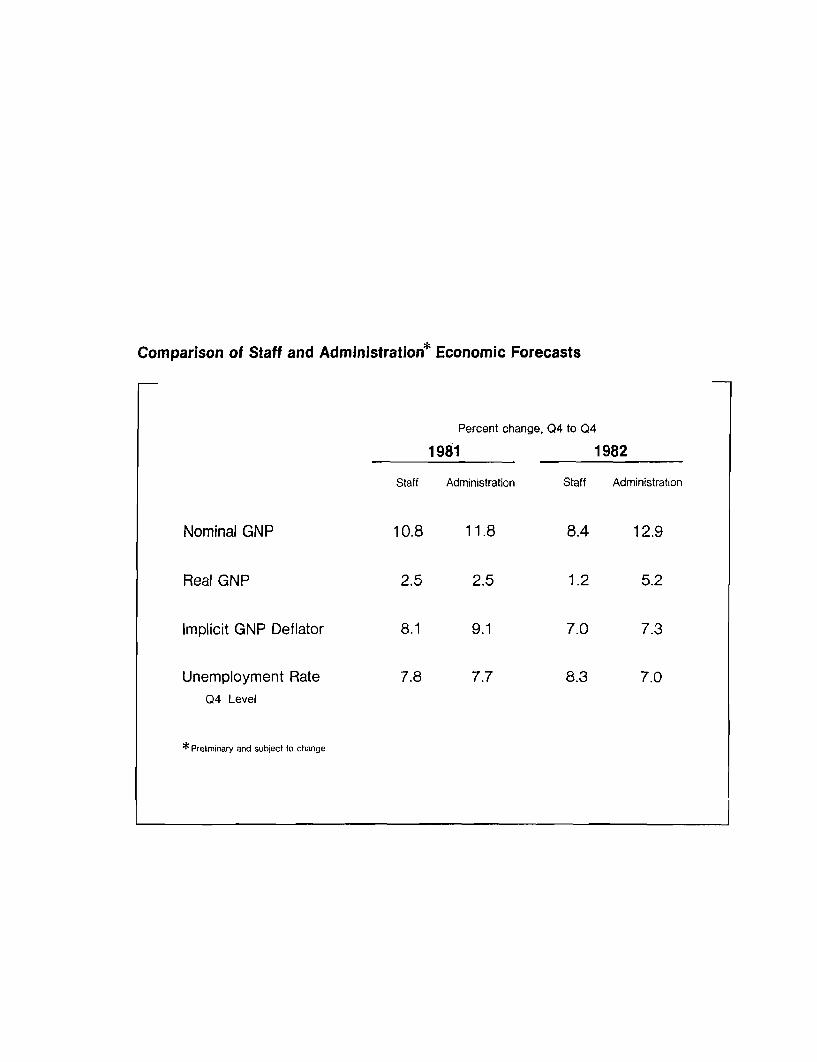
The last chart compares the preliminary administra-
tion revised forecast for 1981 and 1982 with the staff forecast.
The main difference between the forecasts in 1981 is the pro-
jection of the implicit GNP deflator, although both point to
-4-
a considerable improvement over the 10 percent increase last
year. In 1982 the price forecasts are similar, but they occur
in the context of much different prospects for real growth. As
a result the administration projection of nominal GNP expansion
remains high historically, having been exceeded only once in the
past 30 years.
* * * * *

CONFIDENTIAL (FR) CLASS II-FOMC
Material for
Staff Presentationto theFederal Open Market Committee
July 6, 1981
Principal Assumptions
Monetary Policy
* Growth of M1-B of 4¾ percent in 1981, abstracting from shiftsinto NOWs, and 4¼ percent in 1982
Fiscal Policy
* Unified budget expenditures of $663 billion in FY 1981 and
$725 billion in FY 1982
* Personal and business tax cuts
Personal cuts of $27 billion in FY 1982
Business cuts of $8 billion in FY 1982

Federal Budget
Fiscal Years, Unified Budget Basis
1980 1981 1982
Billions Percent Billions Percent Billions Percentof Change of Change of Change
Dollars Dollars Dollars
Outlays $580 17% $663 14% $725 9%
Receipts $520 12 $603 16 $646 7
Deficit $60 $60 $79
Outlays as a Percent of GNP Receipts as a Percent of GNPPercent Percent
Fiscal years Fiscal years
Total 222
!
20
20
19
ExcludingInterest - 18
18
197 1973 1976I 1979I 1982I 197 1973I 1976 1979I I 19821970 1973 1976 1979 1982 1970 1973 1976 1979 1982
Economic Activity
Change from end of previous period,annual rate, percent
1979 1980
Housing Starts and Permits
1981
Millions of units
- 2.0
ts - 1.6
S1.2
- .8
Real Retail Sales
Unit Auto Sales
Billions of 1972 dollars
-48
-46
v - 44
-42
Millions of units
8
1979 1980
Nonfarm Payroll EmploymentM
1981
lillions of workers
Strike adjusted
Total
-- 92
-- 90
1981 1979
Real GNP
1972 Dollars
SManufacturing
1980 19811979 1980
Real GNP
1972 Dollars
Change from end of previous period, annual rate, percent
6
m -4111111IIIIIIIIII m I
III
I'll"
1977 19791975 1981 1982
Real Personal ConsumptionExpenditures Change from previous period,
annual rate, percent
Real DisposablePersonal Income Change from previous period,
annual rate, percent
6
-3+0
3
Real Disposable Personal Income andConsumption Expenditures Change from previous period,
annual rate, percent
1972 Dollars, 3-quarter moving average
Saving Rate
1977 19791975

Housing Starts and Home Mortgage RateAnnual rate, millions of units
Mortgage Rate2.2
1.8
1.4
Starts1.0 -
Percent
1978 1979 1980 1981
New Home SalesAnnual rate, millions of units
1978 1979
New Home Prices
Adjusted for changes in quality
-. 8
.6
-. 4
1980 1981
Change from year earlier, percent
-15
12
- 9
1979 19801978 1981
Housing StartsAnnual rate, millions of units
Total
Single-Family 1.0
A - .5
Multifamily
1980 19811978 1979 1982

Real New Orders forNondefense Capital Goods
Billions of 1972 dollars
3-month moving average
13Total
- 11
Machinery
7
1979 1980 1981
Real New Orders for Defense Capital GoodsBillions of 1972 dollars
3-month moving average
1979 1980
Business Construction Contracts
1979 1980
Millions of square feet
-100
- 90
- 80
- 70
19811979 1980
Corporate Bond RatePercent
Aaa New Issues
- 12
9
1978 1979 1980 1981 1982
Corporate Profits Relative to GNPEconomic Profits Percent
--.---- 6
-- ---- After Tax
1978 1979 1980 1981 1982
Manufacturing Capacity UtilizationPercent
1973-Q3 Pre-Recession Peak 9087.8
- 85
--- - 80
75
1978 1979 1980 1981 1982
Real Business Fixed InvestmentBillions of 1972 dollars
-170
S- ..... - 160
150
1978 1979 1980 1981 1982
Annual rate,millions of units
Days Supply Days
Total - 75
60
1979 1980 1981
Change in Business Inventories
1972 Dollars, NIA Basis
Manufacturing and TradeInventories Relative to Sales
1972 Dollars
Ratio
1979 1980 1981
Annual rate, billions of 1972 d(
.
15 1 1
ollars
30
20
10
+
0
10
20
Auto Inventories
1979 19811975 1977
Real Federal Government Purchases
Dollars
Change, Q4 to Q4, I
Defense
1978 1979 1980 1981 1982
Real State and Local PurchasesChange, Q4 to Q4, percent
4
2
+TTT -- Im -I
1978 1979 1980 1981 1982
Real Total Government Purchases
1972 DollarsChange, Q4 to Q4, Percent
19771978197919801981P1982P
3.6
1.61.91.60.40.6
Total Employment
1975 1977 19
Change. Q4 to Q4, millions of persons
4
2
I I+
79 1981
79 1981
Civilian Labor ForceChange, Q4 to Q4. millions of persons
S- _ 3
I I r
1975 1977 1979 1981
Labor Force Participation RatePercent
I I I i1975 1977 1979
Unemployment RatePercent
1977 19791975 1981

Unit Cost IndicatorsNonfarm Business Sector
Change from year earlier, percent
Compensation per Hour
1975 1977 1979 1981
Output per Hour
1975 1977 1979
Unit Labor Costs
Change from year earlier, percent
8
- 4
+
-4
1981
Change from year earlier, percent
-12
-- 8
4
1975 1977 1979
Gross Business Product Prices
Fixed-weighted indexes
Total
Excluding Food and Energy
Change from year earlier, percent
10
4.
46
1980 19811979 1982
Foreign Exchange Value of the U.S. Dollar
Weighted Average Dollar *
March 1973=100
/ 105
-95
-85
1977 1978 1979 1980 1981
Short-Term Interest RatesPercent per annum
18
14
-10
- 6
U.S. CDs
Weighted Average*Foreign Interbank
1977 1978 1979 1980
**Weighted average against or of G-10 countries p!us Switzerlard using total 1972-76 average trade of these countries

Consumer Prices
* United States* Weighted
Average Foreign*
Change, Q4 to Q4,
i ii i I II II I i ii II II I I ii II II I I ti II II I I ii II II I I ii II II I I ii II II I I ii II Ii I ii II II I i II II II I I II II II I I ii I: ::
I I II II I it I
I II II I
1978 1979 1980 1981
Real GNP
percent
-12
8
4
+- 0
1982
Change, Q4 to Q4. percent
-1 4
-- 1 2
.-p ,h* *I I*|*- * * 'i l l l
19821978 1979 1980 1981
Weighted average of G 10 counites plus S.vtzerland us C !otal 1972-76 a.eriag trade cf Ihsc coD.ntfrlS
I I I I

International Oil Market Developments
Unit Value of U.S. Oil ImportsDollars per barrel
I40
-32
-24
16
1978 1979
World Crude Oil Production*
_ OPEC
D Non OPEC
U.S. Oil Imports
r
1979
1980
I 6tU
1981 1982
1981
-- -
Millions of barrels per day
-50
11 -3010
1982
Millions of barrels per day
8
S- 610
1978
*Excluding the USSR and China
1979 1980 1981 1982

Non-Oil ImportsBillions of 1972 dollars, ratio scale
FBillions of dollars, ratio scale
I240
Value
80-
/60-
.. --
Volume
1975 1977 1979
Nonagricultural ExportsBillions of 1972 dollars, ratio scale
Value
200
160
120
1981
Billions of dollars, ratio scale- 240
-- 200
160
1 20
80
6 Volume60
1977 19791975 1981

GNP Exports and Imports ofGoods and Services
Billions of 1972 dollars
- 170-------------
150
S130
110
Current Account Transactions
fl[ Non-Trade Current Account Transactions
- Trade Balance
1978 1979 1980
Current Account Balance
Billions of dollars
H1 H2 Hi H2
1981 1982
Billions of dollars
--- n
Hi H2 H1 H2
1978 1979 1980 1981 1982
Change, Q4 to Q4, percent
SM1-B
1975
Interest Rates
1977 1979 1981
3-month Treasury
Percent
,---, - 15
- 10
5
1975 1977 1979
Funds Raised by Nonfinancial Sectors
As a percent of GNP
1981
Percent
-- 16
1975 1977 1979
* Abstracting from shifts into ATS and NOW accounts
Money
r
Households
Borrowing
Other
Home Mortgages
Billions
As a Percent ofTotal Funds Raised
1977 411978 411979 42
1980 281981P 291982P 27
1977 1978 1979 1980 1981 1982
Total DebtRelative to
OutstandingDisposable Personal Income
Percent
- 79
- 76
- 73
- 70
1979 19801977 1978 1981 1982
Nonfinancial Corporations
Funds Raised Borrowing at BanksBillions of dollars Billions of dollars
50
-40
30
- 20
1977 1979
Short-Term Debt Relative toTotal Debt Outstanding
Percent
-- 44
- - - - - -
- 36
- 32
1981 1977
Corporate ProfitsPercent
After Tax
Billions of dollars
As - percen- - -N--
As a percent of GNP
3 -
1979 1981
-140
- 120
-- 00
I I I I I
( I I1977 1979
Average Hourly Earnings IndexNonfarm Business Sector
moving average
Total
Change from year earlier, percent
0 10
9
8
1978 1979 1980 1981 1982
Hourly CompensationNonfarm Business Sector
- Legislated Changes
I .mm
1980 19811978 1979 1982

Unit Labor Costs
t Nonfarm Business Sector
Change from year earlier, percent
1975 1977 1979 1981
Price of Imported OilDollars pcer barrel
1975 1977 1979
Foreign Exchange Value of the Dollar
1975 1977
Gross Business Product Prices
SFixed-weighted index
30
20
10
1981
Index, March 1973=100
-100
90
1979 1981
Change from year earlier, percent
9
6
1977 19791975 1981
Comparison of Staff and Administration* Economic Forecasts
Nominal GNP
Real GNP
Implicit GNP Deflator
Unemployment RateQ4 Level
*Preliminary and subject to change.
Percent change, Q4 to Q4
1981 1982
Staff Administration Staff Administration
10.8 11.8 8.4 12.9
2.5 2.5 1.2 5.2
8.1 9.1 7.0 7.3
7.8 7.7 8.3 7.0

FOMC Briefing
S. H. Axilrod
July 7, 1981
Clearly, the process of setting longer-run money targets is not
getting any easier. Assessing the impact of changes in financial regula-
tions and technology is a continuing problem. As a minor point, the
recent DIDC decisions, for instance, complicate estimates of M2. Of more
basic relevance at this time, the public's response to NOW accounts, and
also to the sustained high level of short-term rates, has been in many
ways unexpected, and leaves considerable uncertainty in its wake. There
is uncertainty about when the shift to NOW accounts will be essentially
completed. There will also be uncertainty about how to evaluate future
behavior of the M1-B aggregate; its composition and presumably in some
degree its behavior will differ from previous narrow money measures because
it has a sizable component that pays explicit interest, that possibly may
behave more like savings accounts, and that gives increased weight in the
total to household's demands for transactions balances and liquidity.
Then there is some uncertainty about what to make of the sharp rise in
velocity of M1-B, particularly shift-adjusted, on average in the first
half of this year. Does it indicate that a sustained period of downward
shift in public preference for cash is in process? Or should it more be
taken as evidence that the short-run relationship between narrow money
and GNP is loosening further, given the wide variety of near substitutes
for narrow money that has developed.
Judgments about these and similar issues affect the Committee's
targets for 1981 and 1982. With regard to the shift-adjusted range for
M1-B for 1981, the principal argument for lowering it would be a view that

-2-
a sustained downward shift in demand for narrow money relative to GNP is in
process and one which would produce for this year a shift noticeably larger
than the 2½ percentage points assumed in staff GNP projections at the time
this year's target was set in February, and which is also embodied in the
staff's current projections. If there were such a larger shift, attempts
to achieve the present 3 to 6 percent target range would be more expansionary
than the Committee originally bargained for.
The absence of a further downward shift of money demand in the
staff's projection along with fairly strong continued growth in nominal
GNP are why our interest rate projections for the balance of the year call
for rather sustained high levels of rates. Unless GNP is considerably
weaker than projected, we would expect a rebound in money demand, on the
thought that the public has economized on cash this year by about as much
as it can, or is willing, given existing financial technology, interest
rates, and the learning curves of depositors and institutions. An expecta-
tion of such a rebound in money demand would argue for leaving the present
shift adjusted M1-B range unchanged for 1981--and would suggest rather
strong actual M-1B growth at some point over the next few months.
Keeping the present range unchanged does have certain problems.
If the midpoint of the current range is attained by year-end, shift-
adjusted M1-B will have grown by around a 10 percent annual rate over the
next six months--though on a quarterly average basis this would work out
as growth at about a 7¼ percent annual rate from the second quarter to
the fourth quarter of this year. Such a rapid growth might have an
adverse impact on inflationary psychology, of course. On the other hand,
aiming at much more moderate growth could place substantial further pressure
on interest rates and the fabric of the financial system if staff estimates

of money to GNP relationships are correct. One solution is for the Committee
to accept or aim at a more moderate growth in M1-B over the next several
months that brings growth for the year near the low end of the present
target range, especially should that develop in an environment of stable
or declining interest rates. If the Committee were to lean toward such
an approach, and were at the same time to resist money growth in the 10
percent or higher area, this would not be inconsistent with some little
lowering of this year's M1-B target range--or aiming in the low part of
the present range.
As explained in the blue book, we still anticipate that the
broader aggregates for 1981 will come in high relative to the announced
ranges for them, particularly so if the midpoint for the M1-B growth
range for the year is attained. Thus, the Committee may wish to consider
whether or not to raise these ranges for the broader aggregates. However,
the credibility of the Committee's will to continue monetary restraint
might be called into question if the broader ranges were raised, especially
in light of the increased attention given to broader aggregates because
of uncertainties surrounding the interpretation of M1-B.
With regard to 1982, Mr. Chairman, perhaps just a few words are
in order. There seems to be no need for the Committee at this time to
declare whether the shift into NOW accounts will or will not be over by
next year. If the Committee wishes to continue on the course of gradually
reducing its growth ranges, it is probably simplest to consider taking
at least another point off the shift-adjusted M1-B range (the staff
boldly suggests dropping M1-A). But because of uncertainties surrounding
the behavior of M1-B, alluded to earlier, there is good reason to broaden
the M1-B range from a 2½ percentage points width to a 3 percentage point
width (an even wider range probably lacks credibility). Two logical
alternatives if that approach were taken are ranges of 2½ to 5½ percent
and 3 to 6 percent--advantages and disadvantages of which were noted in
the blue book.
A lower range for M1-B next year does imply some further downward
shift in narrow money demand as measured by our quarterly model money demand
equation, given the 8½ percent increase in nominal GNP that we have pro-
jected for the year. In light of this year's experience, and our projection
of continued historically high interest rates, which would provide somewhat
more incentive than usual to economize on cash, that does not seem implausible.
But if nominal GNP were projected, or targeted, to grow much more than 8
percent in 1982, its consistency with a reduced target range for narrow
money next year might well be called into question. (I might add--
parenthetically--that if nominal GNP growth were unexpectedly weak next
year, including with it a considerable deceleration of price increases and
a sharp drop of interest rates, there is likely to be a substantial and
probably one-time increase in the demand for narrow money as presently
measured that the Committee would need to consider accommodating).
Ranges for the broader aggregates next year pose a problem similar
to this year in that their projected growth, given M1-B, may be relatively
high. But the problems would appear to be less pronounced than this year.
The lower nominal GNP growth projected for next year will tend to hold
down growth in the broader aggregates; moreover, we are not at this point
projecting a substantial drop in market rates that would divert savings
flows from market instruments to time deposits. Thus, there seem to be
greater adds next year that broader money aggregates will fall within the

-5-
ranges currently in place, though in the upper part. Indeed, on the basis
of the projections presented in the blue book, it would not seem
implausible to lower the 1982 range at least for M3 by point from this
year's range.
Finally, Mr. Chairman, I have not mentioned the problem of the
ranges for actual N1-A and M1-B growth in 1981. You will recall that the
M1-B range for 1981 thought consistent with the 3½ to 6 percent shift
adjusted range was 6 to 8½ percent. The question arises whether that
should be changed in view of unexpectedly rapid growth in OCDs over the
first half of this year. Given the recent slowdown in OCD growth, it
would not seem that much more than a point increase in the range for
actual M1-B is needed, as explained in the blue book. Indeed, the range
could well be left unchanged in the thought that it is wide enough to
encompass the likely result for the year, given the increase of only 6¾
percent at an annual rate in actual M1-B experienced over the first half
of the year. It would appear more necessary technically to lower the range
previously published actual range for M1-A. But all this becomes so com-
plicated that the Committee may wish to consider simply abandoning the
actual ranges and stick to the shift-adjusted ranges only.