fomc 19970205 blue book 19970131
TRANSCRIPT

Prefatory Note
The attached document represents the most complete and accurate version available based on original copies culled from the files of the FOMC Secretariat at the Board of Governors of the Federal Reserve System. This electronic document was created through a comprehensive digitization process which included identifying the best-preserved paper copies, scanning those copies,1 and then making the scanned versions text-searchable.2 Though a stringent quality assurance process was employed, some imperfections may remain.
Please note that this document may contain occasional gaps in the text. These gaps are the result of a redaction process that removed information obtained on a confidential basis. All redacted passages are exempt from disclosure under applicable provisions of the Freedom of Information Act.
1 In some cases, original copies needed to be photocopied before being scanned into electronic format. All scanned images were deskewed (to remove the effects of printer- and scanner-introduced tilting) and lightly cleaned (to remove dark spots caused by staple holes, hole punches, and other blemishes caused after initial printing). 2 A two-step process was used. An advanced optimal character recognition computer program (OCR) first created electronic text from the document image. Where the OCR results were inconclusive, staff checked and corrected the text as necessary. Please note that the numbers and text in charts and tables were not reliably recognized by the OCR process and were not checked or corrected by staff.

Strictly Confidential (FR) Class I FOMC
MONETARY POLICY ALTERNATIVES
Prepared for the Federal Open Market Committee
By the staff Board of Governors of the Federal Reserve System

Strictly Confidential (F.R.) January 31, 1997Class I -- FOMC
MONETARY POLICY ALTERNATIVES
Recent Developments
(1) Since the Committee meeting on December 17, the federal funds rate has
averaged close to its intended level of 5-1/4 percent. Pressures in the money market built
with the approach of the turn of the year; in the event, the ample provision of reserves
through temporary transactions held the effective federal funds rate to 6-1/4 percent on New
Year's Eve. In the maintenance period ending January 29, operating balances of depository
institutions at Reserve Banks fell to an average of $17-3/4 billion, well below their lowest
level in the turbulent period of early 1991, owing to the effects of sweep activity on required
reserves amplified by seasonal declines in reserve demands. Nonetheless, the reserve market
generally has remained tranquil in recent weeks, with day-to-day and intraday variations in
the federal funds rate not discernibly affected.
(2) Other interest rates rose 5 to 15 basis points over the intermeeting period (Chart
1). Data on economic activity came in on the firm side of market expectations, leading many
analysts to boost their forecasts of near-term growth. But prices and overall labor
compensation generally continued to behave better than many market participants had
expected, limiting the uptick in rates. On balance, the configuration of futures rates suggests
that market participants have built in little likelihood that the System will tighten policy over
the first half of 1997 (chart). Survey measures of long-term inflation expectations have not
moved much of late, implying that most of the runup in nominal rates since November has
probably reflected an increase in real terms (chart). Still, real long-term rates remain below

Chart 1
Selected Interest Rates
30-Year Treasury Bond 10-Year Treasury Note
..
." ... 3-Year Treasury Note .
3-Month Treasury Bill
m l I n a a m , m I I
J F M A M J J A S O
Weekly. Daily begining December 16. 1996
Federal Funds Futures Percent
12/16/96.......... 01/31/97
Jan Feb Mar Apr MayContract Months
Eurodollar Futures
12/16/96.......... 01/31/97
3/97 6/97 9/97 12/97Contract Months
Real Interest Rates Percent Exchange Rates
Dec
Mark*
Yen*
Trade-WeightedDollar Index(3/73=100)
Index
~.6
I I I I I -- I I I 1-11 1J F M A M J J A S O N D
*Index, Jan 1996=100 1996Weekly. Daily beginning December 16.
Dec. 16
Percent
I
I I
J F1997
Percent
3/98
1987 1989 1991 1993 1995 1997SInflation expectations are measured by the Blue Chip survey untilApnl 1991 and the Philadelphia Fed survey thereafter.
SThe real federal funds rate is deflated by the change in the coreCPI over the previous twelve months.
VRR:kmd
J F1997
a
I

-2-
the peak posted four months ago.1 Despite the apparent rise in real yields over the
intermeeting period, major equity indexes gained almost 10 percent. The majority of earnings
reports for the fourth quarter have proven favorable, and earnings growth prospects looking
one year ahead were mostly revised even further into double-digit territory by stock analysts.
(3) The uptick in intermediate- and longer-term rates in the United States was in
sharp contrast with declines in interest rates in many foreign markets, contributing to a 4-3/4
percent surge in the foreign exchange value of the dollar on a weighted-average basis over the
intermeeting period. In Europe, weaker-than-expected economic data fostered yield declines
of 5 to 25 basis points; in Japan, the announcement of greater-than-expected fiscal restraint
led to a 5 basis point decline in yields. The degree of dollar appreciation--6-1/4 percent
against the yen and 5-1/2 percent against the DM and other ERM currencies--seems larger
than can be explained by relative interest rate movements alone, perhaps reflecting increased
risk premiums in response to the growing pessimism about European and Japanese economies.
In Japan, renewed concerns about the financial system and the economy sparked a sharp
decline in the stock market, particularly bank stocks. In Canada, by contrast, readings on
economic activity came in on the strong side; yields there rose 10 basis points, and the U.S.
dollar depreciated 1-1/4 percent. In mid-January, Mexico repaid ahead of schedule its
remaining $3-1/2 billion outstanding debt to the Treasury's Exchange Stabilization Fund.
1 The real yield on the Treasury's new issue of ten-year indexed debt, which elicitedconsiderable interest at its auction earlier this week, is currently 3.35 percent. Relating thatmeasure to either survey-based or ex post calculations of real returns, however, will proveproblematic until additional evidence on the behavior of real yields on indexed securitiesaccumulates.

-3-
The Desk did
not intervene.
(4) Recent data suggest that the monetary aggregates ended the old year and opened
the new on a faster growth track than the staff had anticipated at the last Committee meeting,
likely owing in part to the unexpected strength in nominal spending late last year. The
decline in interest rates since September, on net, also may have contributed to the strength of
M2 demand by reducing its opportunity cost, a notion supported by continuing anemic
noncompetitive tenders at Treasury auctions. December's expansion of M2, at a 7-1/2 percent
rate, pulled that aggregate's growth for 1996 to 4-1/2 percent, in the upper portion of its 1-to-
5 percent range. 2 In January, the growth of M2 slowed, but only to a 5-1/2 percent rate.3
This strength in M2 apparently did not come at the expense of capital market mutual funds,
which still seem to be attracting healthy inflows. The increase of M3 in the last month of
1996, at an 11-1/4 percent rate, put its growth for the year at 7 percent, well above its 2-to-6
percent annual range. The expansion of the broader aggregate slowed in January to a 6-3/4
2 The data on the monetary aggregates in this bluebook incorporate revisions from theannual benchmark and seasonal review. Over the four quarters of 1996, these revisions leftthe annual growth of M2 unchanged and raised that of M3 by 0.3 percentage point. Thesedata are scheduled to be published in early February and until that time are strictlyconfidential.
3 M1 expanded at a rate of 1 percent in December but then contracted at a rate of 3-3/4 percent in January. Adjusting for the initial effects of sweep activity, which has beenrelatively steady in recent months, Ml increased at rates of 9-1/4 percent and 2-1/4 percent inDecember and January, respectively. The monetary base rose at a rate of 9-1/4 percent inDecember, but it dropped at a 5-3/4 percent rate in January. (The comparable figuresadjusting for sweeps are 11 percent and -4 percent.)

-4-
percent rate. With bank credit growth remaining robust over the past few months, bank
funding needs were sizable. Branches and agencies of foreign banks have been particularly
active lenders, and these depositories have increasingly relied on domestic rather than foreign
financing to meet those needs, issuing large time deposits in volume.
(5) The growth of the debt of nonfederal sectors edged higher in the closing months
of 1996. Both open markets and financial intermediaries have continued to be quite
accommodative to most borrowers. Market risk spreads have remained narrow, and banks are
said to be quite aggressive in the pursuit of even highly leveraged business borrowers. In the
recent survey of senior loan officers, banks noted a slight easing of standards and a more
significant easing of terms for business loans. In contrast, most loan officers reported that
they had tightened standards on credit card accounts and other consumer loans. However,
while consumer lending by banks slowed in the fourth quarter, incoming data suggest a
rebound in recent weeks, and both banks and finance companies have increasingly marketed
home equity loans as a ready substitute for consumer credit, at least to some households.
Credit demands by the federal government have remained subdued, reflecting the continuing
low budget deficit. On net, total borrowing by nonfinancial sectors was well maintained in
the final months of 1996, with debt expanding over the four quarters of 1996 at 5-1/4 percent,
a touch above the midpoint of its 3-to-7 percent annual range.

-5-
MONEY, CREDIT, AND RESERVE AGGREGATES(Seasonally adjusted annual rates of growth)
95:Q4 96:Q4to to
Dec. Jan. 96:Q4 Jan.
Money and Credit Aggregates
Adjusted for sweeps
M2
M3
Domestic nonfinancial debtFederalNonfederal
Bank CreditAdjusted'
Reserve Measures
Nonborrowed Reserves2
Total ReservesAdjusted for sweeps
Monetary BaseAdjusted for sweeps
Memo: (millions of dollars)
Adjustment plus seasonalborrowing
Excess reserves
11.57.6
7.021.0
9.211.1
155
1424
-17.6
-20.1-4.8
-5.7-4.0
-11.4
-11.48.3
3.86.4
48
1205
1. Adjusted to remove effects of mark-to-market accounting rules2. Includes "other extended credit" from the Federal Reserve.
(FIN 39 and FASB 115).
NOTE: Monthly reserve measures, including excess reserves and borrowing, are calculated by proratingaverages for two-week reserve maintenance periods that overlap months. Reserve data incorporate adjustmentsfor discontinuities associated with changes in reserve requirements. These data incorporate revisionsassociated with the annual benchmark and seasonal review and are strictly confidential until released in earlyFebruary.

-6-
Long-Run Scenarios
(6) To provide a longer-run perspective on the strategic issues confronting the
Committee, this section presents econometric model simulations designed to examine
alternative monetary policies as well as the effects of certain shocks to the economy. The
three policy scenarios considered first are built around the Greenbook forecast, using the
staffs new macroeconometric model to extend that forecast and to derive differences resulting
from alternative policies. These scenarios incorporate the same assumptions regarding
underlying macroeconomic factors; notably, the full-employment budget for the federal
government is on path to balance by early in the next century and the NAIRU is 5.6 percent.
Other sets of scenarios consider: (1) a favorable shock to productivity growth, (2) an increase
in the NAIRU, and (3) a significant decline in the stock market. The model's dynamic
properties are importantly affected by the level and changes in the public's expectations about
key economic variables--such as the rate of inflation likely to prevail in the long run.
Because these expectations adapt slowly and nominal wages adjust sluggishly, the sacrifice
ratio over a period of five years is about 2--in line with the historical average for the U.S.
economy. That is, reducing inflation by 1 percentage point requires unemployment to exceed
the NAIRU by the equivalent of 1 percentage point for two years.
(7) The baseline strategy, shown by the solid lines in Chart 2, is an extension of the
Greenbook forecast. By the end of the Greenbook forecast, the disequilibrium in policy and
the economy has become quite evident--the economy is producing beyond its sustainable
potential and the stance of policy is too easy to correct the situation and forestall a continuous

Chart 2
Alternative Strategies for Monetary Policy
Nominal Federal Funds Rate
Percent
Real Federal Funds Rate 1
Percent
1996 1997 1998 1999 2000 2001 2002 2003 2004 2005 2006 1996 1997 1998 1999 2000 2001 2002 2003 2004 2005 2006
PCE Inflation (ex. food and energy)(Four-quarter percent change)
Percent
3.0 * Baseline....... Stable Inflation
2.5 . .- ... - Price Stability
.............. ............ ...... .............................
1.0 . .......................
1996 1997 1998 1999 2000 2001 2002 2003 2004 2005 20061996 1997 1998 1999 2000 2001 2002 2003 2004 2005 2006
Civilian Unemployment Rate(Quarterly average)
Percent
.......................... . ..*° * *°* . .......... .......
.* - Baseline....... Stable Inflation
.---* Price Stability
j . -I a I I , I1996 1997 1998 1999 2000 2001 2002 2003 2004 2005 2006
1. The real federal funds rate is calculated as the quarterly nominal funds rate minusthe four-quarter percent change in the PCE chain-weight price index excluding food and energy.
Note: Data points are plotted at the midpoint of each period.
Percent Percent
Percent3.5 r-
Percent6.5 -
6.0 -
' ' ' " ' ~ '

-7-
rise in core inflation.4 Under the baseline strategy, the Committee caps the rise in inflation
by tightening policy after 1998 by enough to bring the unemployment rate quickly up to the
NAIRU. This requires the federal funds rate to be raised by around 1-1/2 percentage points,
so that the real funds rate overshoots its equilibrium for a time.5 With this strategy, the
Committee would accept whatever rate of inflation that developed while the economy was
operating beyond its potential, and, as a consequence, core PCE inflation would ratchet up
from an average of 2 to 2-1/2 percent in recent years to a little over 3 percent.
(8) Some pickup in core inflation appears to be unavoidable in the near term given
the staff's assessment of the cyclical position of the economy, but the stable inflation strategy
limits that rise and ultimately brings inflation back down to around its recently prevailing
rate. This entails a near-term tightening, with the nominal funds rate rising to 6-1/2 percent
by the end of 1998. The effects of the unemployment rate remaining below the NAIRU until
early 1999 are tempered in the near term by the sharp slowing in real growth, which keeps
inflation expectations damped in the model (similar in result to a "speed effect" in the
4 In the charts, inflation is measured by the core PCE chain-weight price index, andpast movements in this index are used to proxy for inflation expectations in calculations ofthe real funds rate. This index has a steeper upward trajectory over the next few years thando many other broad measures of prices, because it: (1) excludes food and energy prices,which are moderating; (2) is unaffected by the changes in BLS calculations of the CPI; and(3) unlike a broad GDP price measure, includes import prices, which are damped at first andboosted later by the actual and assumed gyrations of the dollar. We think it gives a clearerview of the underlying inflation tendencies in the various scenarios, but its application incalculating the real interest rate may exaggerate the projected drop in real rates in 1997 and1998, especially if the public forms its expectations based on a broader set of prices than inthis core measure. The real funds rates shown in the charts are higher than those calculatedusing the CPI, but would be higher through history as well because inflation as measured bythe PCE index on average has run 1/2 percentage point below the CPI.
5 That equilibrium itself is lower toward the end of the simulation than at presentowing primarily to additional fiscal consolidation.

-8-
Phillips curve), and by the rise in the dollar associated with higher interest rates. These
effects dissipate, however, and ultimately the real interest rate and the unemployment rate
must be kept above their natural levels for some time to offset the underlying inflationary
pressures built up as the economy operated above potential from 1996 through 1998.
(9) A strategy involving a sharper tightening of policy over the next two years, with
the nominal funds rate rising soon and reaching 7 percent in late 1998, would achieve price
stability in seven years or so. In this scenario, a higher real funds rate is sustained for longer
than under the stable inflation strategy to produce enough slack in the economy to keep
downward pressures on wages and prices. The sizable output loss reflects the slow adaptation
of expectations noted above. In the absence of empirical evidence that the cost of disinflation
from moderate levels is reduced by an aggressive anti-inflation program or by announced
inflation targets, we have included no special "credibility" effects from the Committee
embarking on a deliberate strategy to achieve price stability. Credibility for price stability
does develop--but "in the old fashioned way," by earning it through achieving stable prices.
This simulation also makes no allowance for enhanced productivity as price stability is
approached.
(10) Chart 3 considers the effects of higher productivity on inflation, in circumstances
in which the unemployment rate is held to its baseline--at least initially.6 In scenario 1,
productivity growth is permanently 1/2 percentage point higher. Ultimately, the higher
productivity growth will feed through to faster growth in real wages, which takes place
through some combination of lower inflation and more rapid increases in nominal wages. In
6 This set of simulations responds to a request from President Jordan, who asked at theDecember FOMC meeting about what type of shock to productivity growth would be neededto attain price stability without opening an output gap.

Chart 3
Shocks to Productivity Growth
Nominal Federal Funds Rate Real Federal Funds Rate 1
Percent Percent
1996 1997 1998 1999 2000 2001 2002 2003 2004 2005 2006
Percent5.5 -
PercentS Baseline
....* . Scenario 1-- *- Scenario 2
5 - * \ 4.5
3 , 4.0
5 - 3.5
o0 9 17 3.0
5 2.5
1996 1997 199 1999 2000 2001 2002 2003 2004 200 2.01996 1997 1998 1999 2000 2001 2002 2003 2004 205 2006
PCE Inflation (ex. food and energy)(Four-quarter percent change)
Percent
S.Baseline. -......- Scenario 1
S- cenario 2S . . . . . . . . . . . . . .. ,. .. . . . . . . . . .
1996 1997 1998 1999 2000 2001 2002 2003 2004 2005 2006
Civilian Unemployment Rate(Quarterly average)
BaselineScenario 1
Percent
... ..-
* . . .
. s l . . . . I I I I .l I . . .r - al A1996 1997 1998 1999 2000 2001 2002 2003 2004 2005 2006
1. The real federal funds rate is calculated as the quarterly nominal funds rate minusthe four-quarter percent change in the PCE chain-weight price index excluding food and energy.
Note: Data points are plotted at the midpoint of each period.
Percent3.5 r-
3.0
2.5
Percent6.0 r-
5.8 1
Scenario
5.4
5.2
A A I • A A m i

-9-
the model, prices react faster than wages to changes in supply and demand, so the boost to
real wage growth occurs mainly through lower price inflation. In effect, the higher
productivity initially boosts profit margins, firms respond by trying to sell more, and their
competition for market share results in lower prices. As shown by the dotted line in the
middle panel, price inflation ends lower than it started by about 1/3 percentage point. 7
Nominal wage inflation ends higher by 1/6 percentage point, bringing the increase in real
wage growth to 1/2 percentage point, matching the increase in productivity growth. Note that
to achieve this inflation outcome, the Federal Reserve must tighten monetary policy. The
productivity shock stimulates aggregate demand by raising the marginal product of capital--
thereby boosting investment demand. In the long run, real interest rates rise by about the 1/2
percentage point increase in productivity growth (top right panel). But in the short run a
pronounced investment boom occurs, and the Committee must lean against this strength in
demand to keep the unemployment rate along the baseline path, by raising the federal funds
rate to over 7 percent.
(11) If the shock to productivity growth instead is temporary--so that the growth of
productivity returns to its old rate, though the level of productivity remains permanently
higher--inflation would revert to its previous rate if monetary policy continues to hold the
unemployment rate along the baseline. In scenario 2, the productivity growth shock ceases at
the beginning of 2001. As productivity growth slows, firms attempt to maintain profit
margins by raising prices more rapidly in the face of nominal wages that continue to climb at
7 Consequently, with the unemployment rate following the baseline path, productivitygrowth would need to be permanently 3 percentage points higher than is embedded in theGreenbook to reduce long-run inflation by 2 percentage points to 1 percent--the definition of"price stability" used in the first set of simulations.

- 10-
the previous rate. But the Committee in this scenario maintains the reduced rate of inflation
by keeping the real federal funds rate above its lower equilibrium level for longer than in
scenario 1, causing unemployment to exceed the NAIRU for some years.
(12) The Committee also faces a risk that the favorable performance of compensation
and inflation over recent years is due in part to temporary factors, such as one-time savings in
benefit costs from the shift toward managed health care, or to depressed compensation growth
caused by transitory worker insecurity. The simulations in Chart 4 posit that this favorable
performance dissipates over 1997, so that the NAIRU reverts to the neighborhood of 6
percent by the end of the year. If the Committee were not to recognize the increase in
NAIRU, and kept the nominal federal funds rate along its baseline path, inflation would not
be capped at about 3 percent but would continue to accelerate--gradually at first, but more
rapidly over time--reaching 3-1/2 percent at the end of 1999 and 4 percent during 2000. If
instead the Committee adjusted the nominal funds rate in response to observed inflation to
keep the real funds rate along the baseline path, inflation would have a milder upward tilt--
rising to 3-1/2 percent in 2000. But a strategy to keep inflation on the baseline path (not
shown) would need to bring the real funds rate about 1/2 percentage point above the baseline
to constrain demand to the lower level of output now consistent with the higher NAIRU.
(13) On the demand side of the economy, an important potential risk might be
thought to be a break in the stock market. In the immediate scenario of Chart 5, the stock
market falls 25 percent in the current quarter. Aggregate demand is damped (by about 3/4
percent by the end of 1997) as lower wealth holds down consumption and higher costs of
equity financing weaken investment. (We made no special allowance for possible
extraordinary financial-market disruptions.) To mitigate the effects on output and

Chart 4
Increase in the NAIRU
Nominal Federal Funds Rate
Percent
Real Federal Funds Rate'
Percent
...... Maintaining Baseline Nominal Rate- Maintaining Baseline Real Rate ,...---
/..
............/'. . . . . . . 9 .0 .
1996 1997 1998 1999 2000
4.01-...... Maintaining Baseline Nominal Rate
- Maintaining Baseline Real Rate
2.0 -
1996 1997 1998 1999 2000
PCE Inflation (ex. food and energy)(Four-quarter percent change)
Percent
- Baseline (No change in NAIRU)
....... Maintanling Baseline Nominal Rate---- Maintaining Baseline Real Rate ..****, ..- ***-. "" *
..* - . .... '....-.- o.. . . . .• . .. . • . . • ... .
1996 1997 1998 1999 2000
Civilian Unemployment Rate(Quarterly average)
1996 1997 1998 1999 2000
Percent7.5 r
Percent
7.01
5.5 1
Percent4.5 r-
4.0 t- .. 4.0_* o.
o o
3.5
Percent6.0 r-
Percent
5.8 - - Baseline (No change in NAIRU)....... Maintaining Baseline Nominal Rate---. Maintaining Baseline Real Rate
5.2 1
1. The real federal funds rate is calculated as the quarterly nominal funds rate minusthe four-quarter percent change in the PCE chain-weight price index excluding food and energy.
Note: Data points are plotted at the midpoint of each period.
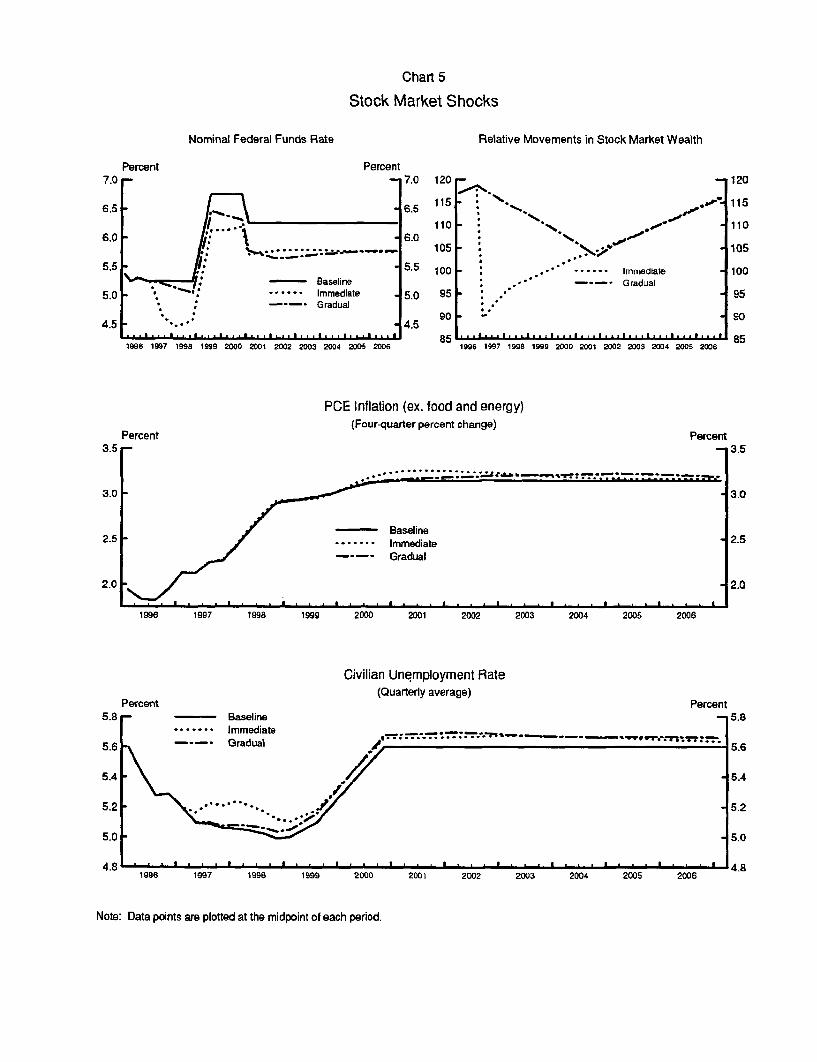
Chart 5
Stock Market Shocks
Nominal Federal Funds Rate Relative Movements in Stock Market Wealth
Percent- 7.0
h.*.*-- -----*.----=-*-*
!' Baseline- .: ...... Immediate
Gradual
1996 1997 1998 1999 2000 2001 2002 2003 2004 2005 2006
PCE Inflation (ex. food and energy)(Four-quarter percent change)
Percent
- BaselineImmediateGradual
1996 1997 1998 1999 2000 2001 2002 2003 2004 2005 2006
Civilian Unemployment Rate(Quarterly average)
Percent
Note: Data points are plotted at the midpoint of each period.
Percent7.0 r-
6.5
6.0
1996 1997 1998 1999 2000 2001 2002 2003 2004 2005 2006
Percent3.5 r-
3.0
2.5
Percent
77:

- 11 -
employment while maintaining inflation along the baseline, the nominal federal funds rate
falls in 1997 by 75 basis points relative to the baseline.8 The funds rate later rises to a level
50 basis points below the baseline, the amount needed to offset the depressing long-run effect
on aggregate demand of the lower level of wealth. In the gradual scenario, the fall in the
stock market is spread out over five years. The policy response is also spread out, paralleling
the gradual decline in the equilibrium real funds rate.9
8 To return the unemployment rate to the baseline level by the end of 1998, the fundsrate would have to fall by another 1/2 percentage point. However, the further decline in thefunds rate would bring inflation above its baseline path owing to price effects of dollardepreciation.
9 A stock market increase, rather than a decrease, of a similar absolute magnituderelative to the Greenbook baseline would require a policy tightening of comparable size inorder to maintain inflation around the baseline path.

- 12 -
Long-Run Ranges for 1997
(14) As background for the Committee's discussion of the annual ranges for 1997, the
table below presents projections for the growth of money and credit based on the Greenbook
forecast. In addition, the table shows as alternative I the provisional ranges adopted by the
FOMC last July as well as an alternative involving higher ranges for the monetary
aggregates. 10
Growth of Money and Debt and Alternative Ranges(percent)
1996 1997 Alt. I Alt. II(actual) (projected) (provisional)
M2 4.6 4-1/2 1 to 5 2 to 6
M3 6.9 6-1/4 2 to 6 3 to 7
Debt 5.3 5 3 to 7 3 to 7
Memo: Nominal GDP 5.2 4-1/2
(15) The staff projects that M2 will expand 4-1/2 percent over the four quarters of
1997, in line with forecasted growth in nominal income. During the early 1990s, M2 demand
had diverged significantly from its historical relationship with nominal GDP and short-run
opportunity costs, with its velocity rising well above its previous long-run average level, as
shown in Chart 6.11 Recently, however, evidence has suggested that a stable demand for M2
may have re-emerged, although the period of more normal velocity behavior has been brief.
In contrast to the early 1990s, changes in the velocity of M2 over the past 2-1/2 years or so
10 Appendix A shows the Committee's announced annual ranges for money and creditsince 1979.
11 Short-term opportunity costs are defined as the yield on three-month Treasury billsminus the weighted average return on the components of M2.

Chart 6
Velocity of M2 and Its Opportunity Cost2.1 V2(ratio scale)
Fit from 1994:Q3 - 19
1.9
92(
1.7
0.5 1 2Opportunity Cost(ratio scale)
Note: In both regressions, the slope and intercept were unconstrained.
4 6

- 13-
can be explained primarily by variations in its short-run opportunity cost, and the apparent
sensitivity of V2 to opportunity costs has been quite similar to that prevailing previously.
The staff's forecast for M2 growth during 1997 is consistent with the putative new
relationship depicted in the chart: With short-term market interest rates assumed to be about
unchanged and banks apparently comfortable with current relationships between market rates
and deposit rates, short-term opportunity costs should remain about flat during the year,
leaving M2 velocity little changed. In addition, capital gains on equity investments are
expected by the staff to be considerably smaller than the extraordinary increases of recent
years and bond rates are projected to change little on balance over the four quarters of 1997,
so that flows into capital market mutual funds should moderate and not depress M2 growth
relative to that of nominal income, as they apparently did to a small extent last year. Within
M2, patterns of growth are expected to be similar to those during 1996; in particular, M1 is
projected to continue to decline substantially, reflecting the further spread of retail sweep
accounts. 12
(16) The staff expects M3 to continue to outpace both M2 and nominal income in
1997, expanding at a 6-1/4 percent annual rate, down somewhat from last year's 7 percent
jump. (The projected decline in M3 velocity is shown on Chart 7.) In an environment of
moderate overall credit growth and of little net change in interest rates or lending conditions
that would prompt shifts in borrowing patterns, bank and thrift credit growth, adjusted for
mark-to-market accounting effects, should remain near last year's temperate pace. In funding
12 Depository institutions appear to have considerable scope to continue to implementretail sweep arrangements, and, as a result, required reserves are likely to contract further in1997. With foreign currency shipments assumed to remain near last year's pace, currency isprojected again to expand a little more rapidly than nominal income. The monetary base isprojected to increase 3-1/2 percent, or 5-1/2 percent adjusted for the initial effects of sweeps.

Chart 7
Actual and Projected Velocity of M3 and Debt*
Ratio Scale-- 1 2.5
M3 Velocity
- 2.0
-1 1.5
I 199 19 19 19 191 19 19 19 19 19 19 19 11959 1962 1965 1968 1971 1974 1977 1980 1983 1986 1989 1992 1995
Ratio Scale- 1.25
Total Domestic Nonfinancial Debt Velocity
I I I ! I I I I I I I I I I I I I I I I I I I I I I I I I I I I I I I I I I I
1959 1962 1965 1968 1971 1974 1977 1980 1983 1986 1989 1992 1995
'Projections are based on staff forecasts of GDP, money, and debt,

- 14-
their asset growth, banks are expected to increase their large time deposits somewhat less
rapidly than they did in 1996, when they were responding to the reduction in deposit
insurance premiums beginning in late 1995. M3 likely will be buoyed again by gains in
money market mutual funds, which should continue to capture wholesale investments as
managers find it increasingly convenient to invest cash with money funds rather than place it
directly in the open market instruments, some of which are outside of M3.
(17) The staff is projecting domestic nonfinancial sector debt to rise 5 percent during
1997, slightly slower than in 1996 and a little above nominal income growth. With the
federal deficit remaining relatively modest, Treasury debt will continue its recent pattern of
deceleration, rising about 3-1/4 percent. Expansion of the debt of nonfederal sectors also is
projected to edge lower. That slowing owes entirely to the household sector, where debt
growth is projected to hold at around the reduced rates of recent months. Banks may tighten
further terms and standards for consumer loans, but the increased willingness of
intermediaries to extend home equity loans would moderate the effects on overall credit
availability to households. Even so, total residential mortgage formation is expected to slow
in association with the slackening in housing activity. Despite the downshift in household
debt growth, it is projected to continue to exceed the increase in income. In the nonfinancial
business sector, borrowing picks up; the financing gap widens as internal funds fail to keep
pace with capital spending, and the volume of net equity retirements remains large owing to
sustained merger and acquisition activity and to repurchases of outstanding equity.
(18) Under the baseline projection, M2 and M3 would finish 1997 a little below and
just above the upper ends of their respective provisional annual ranges given as alternative I
in paragraph (14), while domestic nonfinancial sector debt would be in the middle of its

- 15-
provisional range. Given these point estimates and the significant uncertainties in forecasting
money demand relationships, either or both monetary aggregates could run significantly above
their ranges under the interest rates and income growth of the baseline Greenbook projection.
Nonetheless, as in recent years when faced with similar circumstances, the Committee might
wish to retain the provisional ranges, rather than increase them. The Committee's rationale
has been that, in the context of uncertainty about money demand relationships, it has
preferred not to highlight its expectations for money growth in the upcoming period but rather
to maintain ranges that, if velocity behavior were normal, would be consistent over time with
the Committee's goal of sustained non-inflationary growth.13 The expectations for the year
ahead relative to those ranges could again be made clear in the Humphrey-Hawkins report
and testimony. If the Committee were not ready to place any heightened emphasis on M2
because it still saw considerable risk that policy could be misled by money growth, it might
be concerned that any change in the annual ranges after four years could be misinterpreted by
the public as a signal of an upgrading of the aggregates, despite Committee explanations to
the contrary. As an additional reason for preferring alternative I, the Committee might not
see as large a risk of overshooting the provisional ranges of alternative I as under the staff
forecast if it thought that monetary policy would need to tighten during 1997 to further its
objectives. For example, the staff estimates that the higher interest rates and slightly slower
nominal GDP growth of the "stable inflation strategy" in the previous section would be
associated with M2 growth on the order of 3-3/4 percent over this year.
13 Under this rationale, however, the Committee might consider reducing the range fordomestic nonfinancial sector debt, as the existing 3 to 7 percent range is unlikely to squarelyencompass the rate of debt growth consistent with price stability.

- 16-
(19) If, on the other hand, the Committee did not see interest rates as likely to rise
much over the course of 1997 and saw nominal income as coming in close to the Greenbook
projection, and it wanted the ranges to encompass more comfortably the associated rates of
money growth, it probably would prefer alternative II, which would raise the ranges for both
M2 and M3 by 1 percentage point.14 (Alternative II would retain the provisional range for
debt.) Although money growth is forecast to be in the upper halves of the Alternative II
ranges rather than in the middle, the Committee might find this to be an attractive feature,
consistent with an opportunistic approach to disinflation and the Committee's current
asymmetric directive. Both imply the Committee has a stronger predilection to tighten
aggressively in response to overshoots in nominal spending than to ease in response to
unexpected undershoots. Hence, money growth is more likely to be well below than well
above the staff projection, consistent with the staff forecast lying in the upper halves of the
alternative II ranges. Furthermore, the higher upper limits of the ranges in this alternative as
compared with those of the provisional ranges imply greater scope for the possibility of
strong money growth associated with money demand shifts that are not related to disturbances
to spending, which would automatically be accommodated under current operating procedures,
and appropriately so.
14 The central tendency of Committee members' nominal GDP projectionsencompasses the Greenbook projection.

- 17-
Short-run Policy Alternatives
(20) Presented below are two short-run monetary policy alternatives. Under
alternative B, the federal funds rate would kept at 5-1/4 percent. Under alternative C, the
federal funds rate would be raised by 1/2 percentage point to 5-3/4 percent, either through a
less generous provision of nonborrowed reserves or a hike in the discount rate.
(21) In the staff economic forecast, which is based on no change in the federal funds
rate, growth in output slows in early 1997 to just below the rate of increase in potential,
before picking up some. As a consequence, pressures on resources hold steady in the near
term but then intensify further. With the economy seen already to be operating somewhat
beyond its long-run potential, underlying increases in labor compensation and prices move
higher through the end of the forecast period, and would be expected to escalate at an
increasingly rapid pace thereafter, absent a policy adjustment. Over the near-term, however,
the sharp appreciation of the dollar and back-up in bond yields should help to restrain demand
and price pressures. Consequently, although the inflationary tendencies in the staff's forecast
may not be acceptable to the Committee, the extent of the pickup is gradual enough over
coming quarters that, should it occur, it probably could be reversed by policy tightening later
this year without severe economic dislocations. In these circumstances, the costs of
continuing the "wait and see" stance for a while longer may not be large even if the staff is
right about the underlying pressures in the economy, and the Committee would have more
information to assess whether additional price pressures are, indeed, likely to develop.
(22) Financial markets currently are not anticipating a change in policy at the
February meeting, and thus the choice of alternative B should initially have little impact on
interest rates or the foreign exchange value of the dollar. Over the course of the intermeeting

- 18-
period, the downshifting of growth in early 1997 in the staff forecast probably is greater than
expected by market participants and the news on inflation is a little better, and rates could
edge lower. Moreover, signs of a political deal to balance the budget, which the staff
assumes will be struck at some point, could put some additional downward pressure on long-
term rates, especially if it involved entitlements and hence trimmed deficits beyond 2002.
The course of equity prices is particularly uncertain in view of their lofty valuations. While a
correction cannot be ruled out, earnings reports, especially those still coming in for the strong
fourth quarter, should remain favorable in the period just ahead, and with little change in
interest rates, equity prices could well hold around recent levels.
(23) Although the real federal funds rate is not low by historic standards, the run-up
in share prices along with the generous provision of credit to most borrowers are seen as
contributing to unsustainably accommodative financial conditions in the staff forecast. While
inflation does not deteriorate appreciably in the near term, given the lags in the effect of
policy, the sooner the Committee begins to tighten--as under alternative C--the lower the odds
that higher inflation will become embedded in price and wage setting. The discussion in the
long-run strategies section suggested that a rise in the funds rate of 125 basis points by late
1998 would be needed to keep inflation from moving permanently higher.
(24) The tightening of policy under alternative C would surprise market participants,
and short-term interest rates, including the prime rate, would rise by the half-point hike in the
federal funds rate. In view of the shift in policy direction represented by such an action,
intermediate- and long-term rates could rise appreciably, especially if market participants
thought the Federal Reserve now saw significantly greater inflation risks than they had
inferred from recent statements by FOMC members. In this case, participants are more likely

- 19-
to extrapolate some further tightening measures. Stock prices likely would come under
selling pressure, as monetary tightenings frequently have been associated with bear markets.
Nonetheless, even a significant backup in bond yields is unlikely to push them substantially
above the trading range of late spring and summer, which in turn has seemed to be
compatible with healthy economic growth. Moreover, the extraordinary rise in equity prices
over the last several months probably would not be wholly erased given recent strong
earnings news. The extent of the backup in nominal coupon yields might be contained were
the tightening to affect inflation expectations favorably by underscoring the Federal Reserve's
determination to forestall a pickup in inflation. The dollar would tend to rise on foreign
exchange markets from its elevated level of late, as the contrast between the cyclical positions
of the United States and many of its major trading partners was sharpened even further. Of
course, such declines in bond and stock prices and rise in the dollar would be important
channels through which the Committee would achieve its desired restraint on aggregate
demand growth.
(25) Growth of the broad monetary aggregates is expected to slow under alternative B
from the very rapid pace of late 1996. Still, both M2 and M3 are projected to outpace
nominal income in the first few months of the year and to remain above the upper ends of
their provisional ranges for 1997 through March. M1, by contrast, is projected to run off in
the current quarter, owing to heavy sweep activity, but to expand moderately after adjusting
for sweeps. Growth of debt of domestic nonfinancial sectors is expected to run a little faster
in early 1997 than in late 1996, reflecting in part stronger business borrowing. Still, by
March this aggregate would be around the middle of its provisional range.

Alternative Levels and Growth Rates for Key Monetary Aggregates
M2 M3 M1
Alt. B Alt. C Alt. B Alt. C Alt. B Alt. C
Levels in BillionsDec-96 3832.8 3832.8 4935.9 4935.9 1081.0 1081.0Jan-97 3850.6 3850.6 4964.0 4964.0 1077.6 1077.6Feb-97 3872.3 3871.4 4991.9 4991.2 1073.2 1072.8Mar-97 3885.1 3881.9 5016.4 5014.3 1068.2 1067.0Apr-97 3900.4 3894.6 5040.1 5036.3 1063.7 1061.5May-97 3909.6 3901.4 5060.4 5055.2 1057.5 1054.0Jun-97 3920.4 3910.4 5081.5 5075.3 1052.6 1047.7
Monthly Growth RatesDec-96 7.4 7.4 11.3 11.3 1.1 1.1Jan-97 5.6 5.6 6.8 6.8 -3.8 -3.8Feb-97 6.8 6.5 6.7 6.6 -4.9 -5.3Mar-97 4.0 3.3 5.9 5.5 -5.6 -6.6Apr-97 4.7 3.9 5.7 5.3 -5.0 -6.2May-97 2.8 2.1 4.8 4.5 -7.0 -8.5Jun-97 3.3 2.8 5.0 4.8 -5.6 -7.1
Quarterly Averages o96 Q2 4.5 4.5 6.3 6.3 -1.4 -1.496 Q3 3.4 3.4 5.4 5.4 -6.5 -6.596 Q4 5.0 5.0 8.5 8.5 -7.3 -7.397 Q1 6.2 6.1 7.8 7.7 -2.7 -2.997 Q2 4.2 3.5 5.6 5.3 -5.6 -6.8
Growth RateFrom ToJan-97 Jun-97 4.4 3.7 5.7 5.4 -5.6 -6.7
96 Q4 Jan-97 6.4 6.4 8.4 8.4 -1.6 -1.696 Q4 Jun-97 5.0 4.5 6.5 6.3 -4.4 -5.2
93 Q4 94 Q4 0.6 0.6 1.7 1.7 2.5 2.594 Q4 95 Q4 4.0 4.0 6.1 6.1 -1.6 -1.695 Q4 96 Q4 4.6 4.6 6.9 6.9 -4.6 -4.696 Q4 97 02 5.3 4.8 6.8 6.6 -4.2 -4.8
1.0 to 5.0 2.0 to 6.01996 Target Ranges:
-21 -
Directive Language
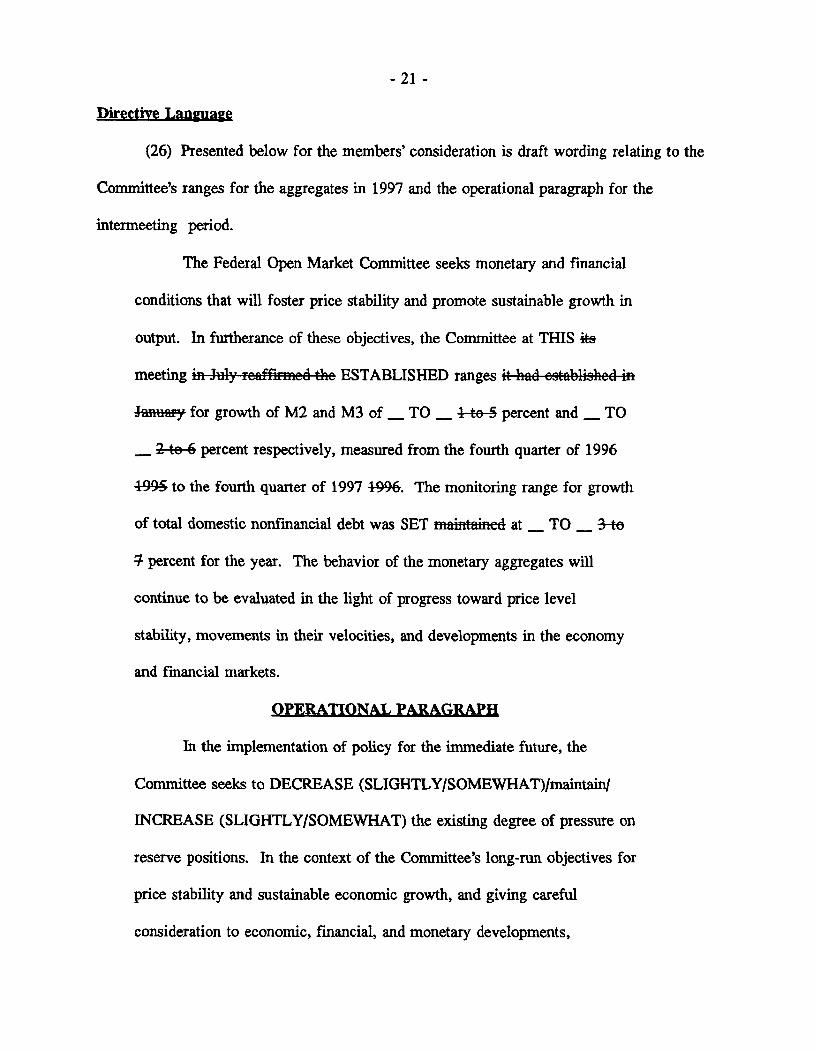
(26) Presented below for the members' consideration is draft wording relating to the
Committee's ranges for the aggregates in 1997 and the operational paragraph for the
intermeeting period.
The Federal Open Market Committee seeks monetary and financial
conditions that will foster price stability and promote sustainable growth in
output. In furtherance of these objectives, the Committee at THIS its
meeting [DEL: in July reaffirmed the] ESTABLISHED ranges [DEL: it had established in
January] for growth of M2 and M3 of ____ TO ____ [DEL: 1 to 5] percent and ____ TO
____ {DEL: 2 to 6] percent respectively, measured from the fourth quarter of 1996
1995 to the fourth quarter of 1997 [DEL: 1996]. The monitoring range for growth
of total domestic nonfinancial debt was SET [DEL: maintained] at ____ TO ____ [DEL: 3 to
7] percent for the year. The behavior of the monetary aggregates will
continue to be evaluated in the light of progress toward price level
stability, movements in their velocities, and developments in the economy
and financial markets.
OPERATIONAL PARAGRAPH
In the implementation of policy for the immediate future, the
Committee seeks to DECREASE (SLIGHTLY/SOMEWHAT)/maintain/
INCREASE (SLIGHTLY/SOMEWHAT) the existing degree of pressure on
reserve positions. In the context of the Committee's long-run objectives for
price stability and sustainable economic growth, and giving careful
consideration to economic, financial, and monetary developments,

-22-
somewhat (SLIGHTLY) greater reserve restraint would (MIGHT) or
(SOMEWHAT) slightly lesser reserve restraint (WOULD) might be
acceptable in the intermeeting period. The contemplated reserve conditions
are expected to be consistent with SOME MODERATION IN THE
[DEL: relatively strong] expansion in OF M2 AND M3 over coming months.

Appendix A
ADOPTED LONGER-RUN RANGES FOR THE MONETARY AND CREDIT AGGREGATES
(percent annual rates)
Domestic Non-
M1 M2 M3 financial Debt1
QIV 1979 - QIV 1980 4 - 6.5 (7.3) 2,3 6- 9 (9.8) 6.5 - 9.5 (9.9) 6 - 9 (7.9)
QIV 1980 - QIV 1981 3.5 - 6 (2.3) 2.4 6 - 9 (9.4) 6.5 - 9.5 (11.4) 6 - 9 (8.8) 5
QIV 1981 - QIV 1982 2.5 - 5.5 (8.5) 2 6 - 9 (9.2) 6.5 - 9.5 (10.1) 6 - 96 (7.1) 5
QIV 1982 - QIV 1983 5 - 97 (7.2) 7- 10 (8.3) 6.5 -9.5 (9.7) 8.5 -11.5 (10.5)
QIV 1983 - QIV 1984 4- 89 (5.2) 6 - 9 (7.7) 6 - 9 (10.5) 8 -11 (13.4)
QIV 1984 - QIV 1985 3 - 8 (12.7) 6 - 9 (8.6) 6 - 9.5 (7.4) 9 -12 (13.5)
QIV 1985 - QIV 1986 3 - 8 (15.2) 6-9 (8.9) 6-9 (8.8) 8 - 11 (12.9)
QIV 1986 - QIV 1987 n.s.'1 (6.2) 5.5- 8.5 (4.0) 5.5 - 8.5 (5.4) 8 - 11 (9.6)
QIV 1987 - QIV 1988 n.s. (4.3) 4 - 8 (5.3) 4 - 8 (6.2) 7 -11 (8.7)
QIV 1988 - QIV 1989 n.s. (0.6) 3 - 7 (4.6) 3.5 - 7.5 (3.3) 6.5 - 10.5 (8.1)
QIV 1989 - QIV 1990 n.s. (4.2) 3 - 7 (3.9) 1 - 5" (1.8) 5 - 9 (6.9)
QIV 1990 - QIV 1991 n.s. (8.0) 2.5 - 6.5 (3.1) 1 - 5 (1.3) 4.5 - 8.5 (4.5)
QIV 1991 - QIV 1992 n.s. (14.3) 2.5 - 6.5 (1.9) 1 - 5 (0.5) 4.5 - 8.5 (4.6)
QIV 1992 - QIV 1993 n.s. (10.5) 1 - 512 (1.4) 0 - 412 (0.6) 4 - 812 (4.9)
QIV 1993 - QIV 1994 n.s. (2.3) 1 -5 (1.0) 0 - 4 (1.4) 4 - 8 (5.3)
QIV 1994 - QIV 1995 n.s. (-1.8) 1 - 5 (4.2) 2 - 6" (6.1) 3 - 7 (5.3)
QIV 1995 - QIV 1996 n.s. (-4.6) 1 - 5 (4.6) 2 - 6 (6.9) 3 - 7 (53)
NOTE: Numbers in parentheses are actual growth rates as reported at the end of policy period in the FebruaryMonetary Policy Report to Congress. Subsequent revisions to historical data (not reflected above) have altered growthrates by up to a few tenths of a percent.
n.s. -- not specified.Footnotes on following page
1. Targets are for bank credit until 1983; from 1983 onward targets are for domestic nonfinancial sector debt.
2. The figures shown reflect target and actual growth of M1-B in 1980 and shift-adjusted M1-B in 1981. M1-B wasrelabelled M1 in January 1982. The targeted growth for M1-A was 3-1/2 to 6 percent in 1980 (actual growth was5.0 percent); in 1981 targeted growth for shift-adjusted M1-A was 3 to 5-1/2 percent (actual growth was 1.3 percent).
3. When these ranges were set, shifts into other checkable deposits in 1980 were expected to have only a limitedeffect on growth of M1-A and M1-B. As the year progressed, however, banks offered other checkable deposits moreactively, and more funds than expected were directed to these accounts. Such shifts are estimated to have decreasedM1-A growth and increased M1-B growth each by at least 1/2 percentage point more than had been anticipated.
4. Adjusted for the effects of shifts out of demand deposits and savings deposits. At the February FOMC meeting,the target ranges for observed M1-A and M1-B in 1981 on an unadjusted basis, expected to be consistent with theadjusted ranges, were -(4-1/2) to -2 and 6 to 8-1/2 percent, respectively. Actual M1-B growth (not shift adjusted)was 5.0 percent.
5. Adjusted for shifts of assets from domestic banking offices to International Banking Facilities.
6. Range for bank credit is annualized growth from the December 1981 - January 1982 average level through thefourth quarter of 1982.
7. Base period, adopted at the July 1983 FOMC meeting, is 1983 QII. At the February 1983 meeting, the FOMChad adopted a 1982 QIV to 1983 QIV target range for M1 of 4 to 8 percent.
8. Base period is the February-March 1983 average.
9. Base period, adopted at the July 1985 FOMC meeting, is 1985 QII. At the February 1983 meeting, the FOMChad adopted a 1984 QIV to 1985 QIV target range for M1 of 4 to 7 percent.
10. No range for M1 has been specified since the February 1987 FOMC meeting because of uncertainties about itsunderlying relationship to the behavior of the economy and its sensitivity to economic and financial circumstances.
11. At the February 1990 meeting, the FOMC specified a range of 2-1/2 to 6-1/2 percent. This range was loweredto 1 to 5 percent at the July 1990 meeting.
12. At the February 1993 meeting, the FOMC specified a range of 2 to 6 percent for M2, 1/2 to 4-1/2 percent forM3, and 4-1/2 to 8-1/2 percent for domestic nonfinancial debt. These ranges were lowered to 1 to 5 percent for M2,0 to 4 percent for M3, and 4 to 8 percent for domestic nonfinancial debt at the July 1993 meeting.
13. At the February 1995 meeting, the FOMC specified a range of 0 to 4 percent This range was raised to 2 to 6percent at the July 1995 meeting.
1/31/97 (MARP)

February 3, 1997
SELECTED INTEREST RATES(percent)
Short-Term Long-TermCDs money corporate conventional home mortgages
federal Treasury bills secondary comm. market bank U.S. government constant A-utility municipal secondary primaryfunds secondary market market paper mutual prime maturity yields recently Bond market market
3-month 6-month 1-year 3-month 1-month fund loan 3-year 1-year I 30-year offered Buyer Ifixed-ratefixed-rata ARM_1 2 3 4 5 6 7 8 9 10 11 12 13 14 15 16
95 -High- Low
96 - High- Low
MonthlyJan 96Feb 96Mar 96Apr 96
ay 96Jun 96Jul 96Aug 96Sep 96Oct 96Nov 96Dec 96
WeeklyOct 16 96Oct 23 96Oct 30 96
Nov 6 96Nov 13 96Nov 20 96Nov 27 96
Dec 4 96Dec 11 96Dec 18 96Dec 25 96
Jan 1 97Jan 8 97Jan 15 97Jan 22 97Jan 29 97
DailyJan 24 97Jan 30 97Jan 31 97
6.21 5.81 6.31 6.75 6.39 6.10 5.61 9.005.40 4.89 5.05 4.98 5.55 5.73 5.16 8.50
5.61 5.18 5.37 5.61 5.57 5.83 5.15 8.505.08 4.79 4.71 4.57 5.13 5.28 4.73 8.25
5.56 5.00 4.92 4.82 5.39 5.56 5.05 8.505.22 4.83 4.77 4.69 5.15 5.29 4.85 8.255.31 4.96 4.96 5.06 5.29 5.39 4.76 8.255.22 4.95 5.06 5.23 5.36 5.40 4.75 8.255.24 5.02 5.12 5.33 5.36 5.38 4.74 8.255.27 5.09 5.25 5.48 5.46 5.45 4.76 8.255.40 5.15 5.30 5.52 5.53 5.44 4.81 8.255.22 5.05 5.13 5.35 5.40 5.39 4.82 8.255.30 5.09 5.24 5.50 5.51 5.45 4.82 8.255.24 4.99 5.11 5.25 5.41 5.37 4.82 8.255.31 5.03 5.07 5.14 5.38 5.39 4.83 8.255.29 4.91 5.04 5.18 5.44 5.70 4.85 8.25
5.22 5.01 5.12 5.29 5.41 5.35 4.82 8.255.22 4.99 5.12 5.25 5.40 5.35 4.80 8.255.27 5.01 5.11 5.22 5.40 5.37 4.82 8.25
5.32 5.03 5.09 5.16 5.39 5.38 4.85 8.255.21 5.03 5.08 5.15 5.38 5.37 4.86 8.255.41 5.03 5.06 5.12 5.38 5.40 4.82 8.255.30 5.03 5.07 5.14 5.38 5.40 4.82 8.25
5.52 4.94 5.03 5.11 5.40 5.51 4.88 8.255.22 4.87 5.01 5.17 5.41 5.54 4.82 8.255.38 4.85 5.04 5.21 5.42 5.65 4.83 8.255.18 4.93 5.07 5.21 5.48 5.83 4.90 8.25
5.37 5.02 5.09 5.19 5.48 5.94 4.89 8.255.28 5.04 5.12 5.30 5.42 5.45 4.82 8.255.19 5.03 5.09 5.31 5.44 5.43 4.82 8.255.19 5.03 5.09 5.29 5.42 5.43 4.82 8.255.18 5.04 5.12 5.31 5.42 5.43 4.82 8.25
5.13 5.03 5.13 5.31 5.42 5.425.30 5.04 5.10 5.28 5.42 5.445.30p 5.02 5.08 5.29 5.42 5.45
8.258.258.25
7.80 7.85 7.89 8.81 6.94 9.57 9.22 6.875.36 5.68 6.06 6.98 5.65 7.40 7.11 5.53
6.59 7.02 7.16 8.23 6.34 8.72 8.42 6.014.95 5.59 5.97 7.00 5.63 7.35 6.94 5.19
5.20 5.65 6.05 7.09 5.72 7.45 7.03 5.445.14 5.81 6.24 7.31 5.73 7.51 7.08 5.315.79 6.27 6.60 7.75 6.07 8.07 7.62 5.516.11 6.51 6.79 7.90 6.20 8.32 7.93 5.736.27 6.74 6.93 8,02 6.22 8.46 8.07 5.776.49 6.91 7.06 8.13 6.25 8.59 8.32 5.926.45 6.87 7.03 8.07 6.15 8.56 8.25 5.986.21 6.64 6.84 7.87 6.00 8.33 8.00 5.846.41 6.83 7.03 8.06 6.11 8.48 8.23 5.856.08 6.53 6.81 7.83 5.97 8.22 7.92 5.645.82 6.20 6.48 7.54 5.85 7.91 7.62 5.535.91 6.30 6.55 7.63 5.91 8.01 7.60 5.52
6.12 6.57 6.86 7.82 5.97 8.17 7.88 5.626.08 6.53 6.82 7.86 6.01 8.25 7.86 5.576.03 6.49 6.78 7.73 5.94 8.00 7.78 5.60
5.91 6.34 6.64 7.59 5.92 7.96 7.67 5.565.86 6.24 6.47 7.52 5.86 7.87 7.59 5.525.78 6.17 6.44 7.48 5.83 7.87 7.53 5.485.78 6.14 6.43 7.42 5.80 7.87 7.52 5.50
5.72 6.08 6.37 7.62 5.83 7.97 7.44 5.475.85 6.26 6.52 7.67 5.93 8.06 7.57 5.525.97 6.40 6.64 7.69 5.95 8.00 7.74 5.535.97 6.35 6.59 7.64 5.92 8.00 7.64 5.57
5.98 6.35 6.58 7.83 5.96 8.16 7.67 5.566.13 6.55 6.78 7.95 5.96 8.25 7.85 5.546.15 6.57 6.81 7.93 6.01 8.20 7.87 5.576.14 6.55 6.82 8.00 6.00 8.28 7.85 5.576.21 6.64 6.90 7.92 6.02 8.15 7.88 5.55
6.21 6.64 6.89 --6.16 6.61 6.88 -- -6.08 6.53 6.80 -- -
NOTE: Weekly data for columns t through 11 are statement week averages. Data in column 7 are taken from Donoghue's Money Fund Report. Columns 12,13 and 14 are 1-day quotes for Friday, Thursday or Friday, respectively,following the end of the statement week. Column 13 Is the Bond Buyer revenue Index. Column 14 Is the FNMA purchase yield, plus loan servicing fee, on 30-day mandatory delivery commitments. Column 15 is the averagecontract rate on newcommitments for fixed-rate mortgages (FRMs) with 80 percent loan-to-value ratios at major institutional lenders, Column 16 is the average initial contract rate on new commitments for 1 -year, adjustable-rate mortgages (ARMs) at major institutional lenders offering both FRMs and ARMs with the same number of discount points.
p - preliminary data

Strictly Confidential (FR)-Class II FOMC
Money and Credit Aggregate MeasuresFEBRUARY 3, 1997
Seasonally adjusted
Money stock measures and liquid assets_____ Bank credit Domestic nonfinancal debt
nontransactions componentsPeriod total loans
Period M1 M2 M3 L and U. S. other' total'In M2 h M3 only investments' government'
____ 1 2 3 4 5 8 7 8 9 10Annual arowth rates(1:
Annually (Q4 to Q4)1994 2.5 0.6 -0.3 6.6 1.7 2.7 6.8 5.7 5.1 5.21995 -1.6 4.0 6.7 15.3 6.1 7.4 8.8 4.4 5.9 5.51996 -4.6 4.6 8.8 15.5 6.9 4.0
Quarterly(average)1996-01 -3.5 5.3 9.3 11.5 6.6 4.6 5.1 3.0 5.8 5.11996-Q2 -1.4 4.5 7.0 13.5 6.3 6.3 3.3 4.7 5.9 5.61996-Q3 -6.5 3.4 7.7 12.9 5.4 5.7 1.0 3.8 5.6 5.11996-04 -7.3 5.0 10.1 21.0 8.5 6.5
Monthly1996-JAN. -7.2 4.9 10.3 16.0 7.2 3.8 10.0 0.3 6.0 4.5
PEB. -2.6 4.9 8.2 22.2 8.5 3.2 3.3 6.1 6.5 6.4MAR. 6.9 9.4 10.6 9.4 9.4 11.2 -2.5 8.9 5.5 6.4APR. -2.9 3.4 6.1 7.2 4.2 7.3 8.8 4.2 6.0 5.5MAY -6.8 0.4 3.5 25.5 5.6 1.3 1.5 2.0 5.6 4.7JUNE -1.7 5.3 8.2 6.3 5.5 6.4 2.2 2.1 5.9 4.9JULY -7.2 2.6 6,8 11.5 4.5 4.6 1.5 6.0 6.1 6.1AUG. -9.7 4.1 9.9 9.8 5.3 6.9 -3.2 4.5 4.9 4.8SEP. -7.2 4.0 8.7 22.5 8.0 9.0 4.7 1.0 4.9 3.8OCT. -14.4 3.9 11.4 28.7 9.3 4.6 9.1 3.8 5.5 5.1NOV. -0.1 6.8 9.6 10.2 7.5 8.8 9.0 4.2 6.3 5.8DEC. 1.1 7.4 9.9 24.8 11.3 7.1
1997-JAN. pe -4 6 9 11 7
Levels (Sbillions)tMonthly
1996-AUG. 1099.8 3762.8 2663.0 1027.4 4790.2 5920.0 3675,5 3743.4 10631.3 14374.6SEP. 1093.2 3775.4 2682.2 1046.7 4822.1 5964.5 3690.0 3746.4 10674.3 14420.7OCT. 1080.1 3787.8 2707.6 1071.7 4859.5 5987.4 3717.9 3758.2 10723.5 14481.7NOV. 1080.0 3809.2 2729.2 1080.8 4890.0 6031.1 3745.7 3771.4 10779.8 14551.2DEC. 1081.0 3832.8 2751.8 1103.1 4935.9 3768.0
Weekly1996-DEC. 2 1089.5 3823.3 2733.8 1087.3 4910.6
9 1076.5 3829.6 2753.1 1097.7 4927.316 1076.5 3829.4 2752.9 1106.0 4935.423 1080.0 3834.8 2754.8 1104.4 4939.230 1084.8 3835.6 2750.8 1107.9 4943.5
1997-JAN. 6 1082.1 3847.5 2765.4 1109.6 4957.113 p 1075.1 3839.8 2764.7 1117.5 4957.220 p 1080.4 3856.1 2775.7 1113.1 4969.2
1. Adjusted for breaks caused by reclassifications.2. Debt data are on a monthly average basis, derived by averaging end-of-month levels of adjacent months, and have been adjusted to remove discontinuities.
p preliminarype preliminary estimate
Note: Data incorporate revisions from the annual benchmark and seasonal review. These data are scheduled to be publishedin early February and until that time are strictly confidential.

Strictly Confidential (FR)-Class II FOMC
FEBRUARY 3, 1997Components of Money Stock and Related Measures
Seasonally adjusted
Money market
urrency Demand Other Small mutuLarge Short-termPeriod urrency
D ema nd checkable Savings denomination denomination RP's' Eurodollars" Savings CTury ommercial Bankersdeposits depos time deposits' Retail' Institution- time deposits bonds securities paper acceptances
only
1 2 3 4 5 6 7 8 9 10 11 12 13 14Levels (Sbi.Llionls)-
Annual (Q4)1994 352.4 384.9 404.8 1164.0 806.5 379.8 197.4 358.7 176.6 81.9 179.8 380.9 401.5 13.81995 371.4 390.3 362.1 1127.3 930.4 451.0 244.7 416.3 186.7 91.6 184.5 468.5 438.2 12.71996 392.6 401.0 278.2 1258.5 943.0 528.1 293.1 489.8 195.3 107.0
Monthly1995-DBC. 372.6 391.1 356.5 1137.1 933.7 455.2 246.9 419.8 182.1 90.8 184.8 475.5 437.1 12.0
1996-JAN. 373.0 394.4 345.9 1153.8 934.3 459.6 250.1 420.9 187.1 94.0 185.0 466.0 437.2 11.8FEB. 373.4 397.3 340.3 1165.1 934.1 466.0 259.7 426.3 188.6 95.2 185.0 445.0 442.3 10.3MAR. 375.4 404.5 337.3 1180.2 930.8 476.8 263.7 432.5 187.3 93.8 185.2 459.6 445.1 9.8
APR. 376.4 404.5 333.9 1190.1 929.5 481.4 263.4 435.4 188.0 96.3 185.6 461.4 461.0 10.3MAY 377.7 407.1 323.5 1195.6 928.4 484.5 263.6 442.5 201.3 96.8 186.0 432.6 473.4 10.8JUNE 379.9 410.6 316.4 1204.1 928.8 493.6 269.7 448.9 193.3 97.6 186.4 443.4 470.9 11.4
JULY 382.8 408.7 308.7 1211.0 930.5 499.6 274.0 455.2 192.3 97.6 186.8 445.6 473.1 11.4AUG. 385.2 405.8 300.4 1222.7 934.2 506.1 278.8 459.3 191.2 98.1 187.2 452.7 478.6 11.3SEP. 387.6 404.9 292.2 1231.5 937.5 513.2 285.2 466.8 193.7 100.9 187.3 461.1 482.4 11.5
OCT. 390.2 398.2 283.1 1246.2 940.9 520.5 288.1 481.6 195.8 106.2 187.3 449.6 479.5 11.6NOV. 392.4 402.1 276.8 1258.7 943.4 527.1 292.0 487.8 195.6 105.4 187.1 460.3 481.9 11.9DEC. 395.1 402.6 274.8 1270.6 944.6 536.6 299.3 499.9 194.5 109.4
1. Includes money market deposit accounts.2. Includes retail repurchase agreements. All IRA and Keogh accounts at commercial banks and thrift institutions are subtracted from small time deposits.3. Excludes IRA and Keogh accounts.4. Net of large denomination time deposits held by money market mutual funds, depository institutions, U.S. government, and foreign banks and official institutions.5. Net of money market mutual fund holdings of these items.6. Includes both overnight and term.
p preliminary
Note: Data incorporate revisions from the annual benchmark and seasonal review. These data are scheduled to be publishedin early February and until that time are strictly confidential
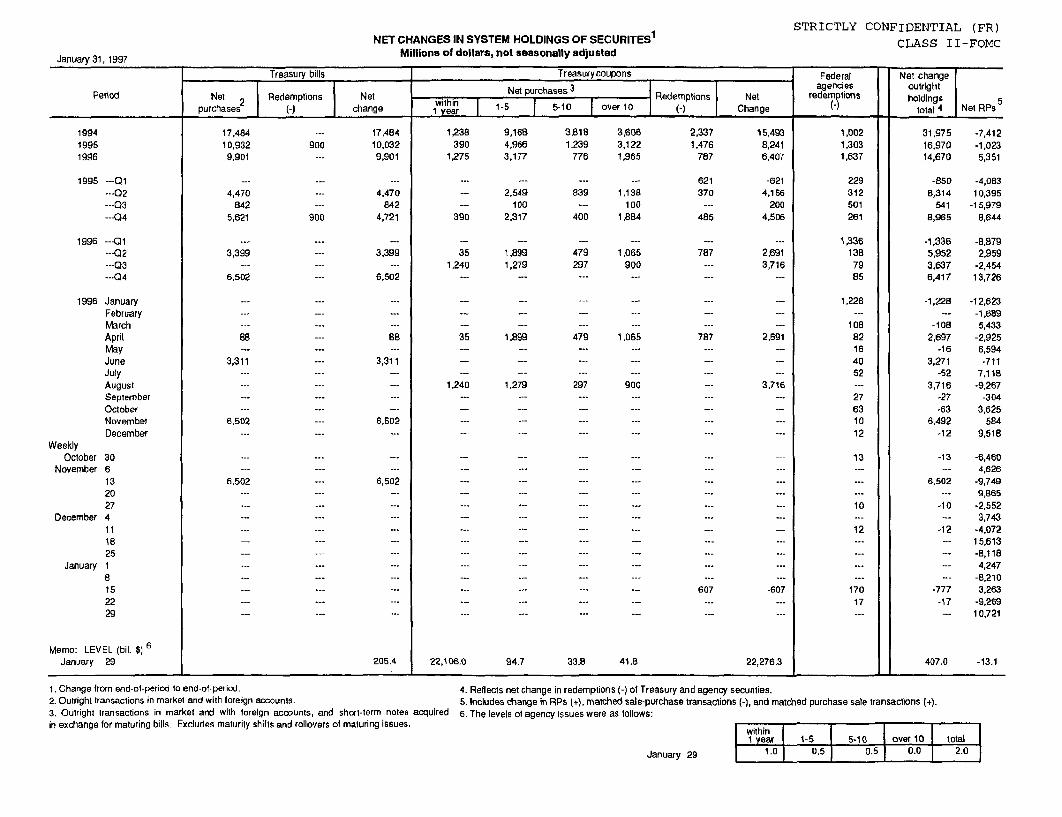
NET CHANGES IN SYSTEM HOLDINGS OF SECURITES 1Millions of dollars, not seasonally adjusted
STRICTLY CONFIDENTIAL (FR)
CLASS II-FOMC
Treasury bills Treasurycoupons Federal Net changeSpurhas 3 Nagencies outright
Period Net 2 Redemptions Net pu Redemptions Net redemptns holdings 5__purchases (-) change 1 year 1-5 5-10 over 10 (-) Change total 4 Net RPs
199419951996
1995 ---01---02---Q3--Q4
1996 ---Q1---02---Q3---04
1996 JanuaryFebruaryMarchAprilMayJuneJulyAugustSeptemberOctoberNovemberDecember
WeeklyOctober 30
November 6132027
December 4111825
January 18152229
Memo: LEVEL (bil. $) 6January 29
17,48410,9329,901
4,470842
5,621
3,399
6,502
88
3,311
6,502
6,502
---
-.
17,48410,0329,901
4,470842
4,721
3,399
6,502
88
3,311
6,502
6,502
.-.
==
.-°
---_
205.4
9,1684,9663,177
2,549100
2,317
3,818 3,6061,239 3,122
776 1,965
35 1,8991,240 1,279
2,3371,476
787
621370
485
787
35 1,899 479
!40 1,279 297
22,106.0 94.7 33.8 41.8
15,4938,2416,407
-6214,156
2004,506
-.-
2,6913,716
2,691
3,716
-607
22,276.3
1,0021,3031,637
229312501261
1,336138
7985
1,228
10882164052
27631012
13
10
12
17017
31,97516,97014,670
-8508,314
5418,965
-1,3365,9523,6376,417
-1,228--
-1082,697
-163,271
-523,716
-27-63
6,492-12
-13
6,502
-10
-12
-777-17
-7,412-1,0235,351
-4,08310,395
-15,9798,644
-8,8792,959
-2,45413,726
-12,623-1,6895,433
-2,9256,594-711
7,118-9,267
-3043,625
5849,518
-6,4604,626
-9,7499,865
-2.5523,743
-4,07215,613-8,1184,247
-8,2103,263
-9,26910,721
407.0 -13.1
1. Change from end-of-period to end-of-period. 4. Reflects net change in redemptions (-) of Tre2. Outright transactions in market and with foreign accounts. 5. Includes change in RPs (+), matched sale-pu3. Outright transactions in market and with foreign accounts, and short-term notes acquired 6. The levels of agency issues were as follows:in exchange for maturing bills Excludes maturity shifts and rollovers of maturing issues.
asury and agency securities.rchase transactions (-), and matched purchase sale transactions (+).
within1 year 1-5 5-10 over 10 to talS1.0 0.5 0.5 0.0
January 31, 1997
'
2.0January 29