fomc 19780919 blue book 19780915
TRANSCRIPT

Prefatory Note
The attached document represents the most complete and accurate version available based on original copies culled from the files of the FOMC Secretariat at the Board of Governors of the Federal Reserve System. This electronic document was created through a comprehensive digitization process which included identifying the best-preserved paper copies, scanning those copies,1 and then making the scanned versions text-searchable.2 Though a stringent quality assurance process was employed, some imperfections may remain.
Please note that this document may contain occasional gaps in the text. These gaps are the result of a redaction process that removed information obtained on a confidential basis. All redacted passages are exempt from disclosure under applicable provisions of the Freedom of Information Act.
1 In some cases, original copies needed to be photocopied before being scanned into electronic format. All scanned images were deskewed (to remove the effects of printer- and scanner-introduced tilting) and lightly cleaned (to remove dark spots caused by staple holes, hole punches, and other blemishes caused after initial printing). 2 A two-step process was used. An advanced optimal character recognition computer program (OCR) first created electronic text from the document image. Where the OCR results were inconclusive, staff checked and corrected the text as necessary. Please note that the numbers and text in charts and tables were not reliably recognized by the OCR process and were not checked or corrected by staff.

September 15, 1978
Strictly Confidential (FR) Class I FOMC
MONETARY AGGREGATES ANDMONEY MARKET CONDITIONS
Prepared for the Federal Open Market Committee
By the staff Board of Governors of the Federal Reserve System

STRICTLY CONFIDENTIAL (FR)CLASS I - FOMC
September 15, 1978
MONETARY AGGREGATES ANDMONEY MARKET CONDITIONS
Recent developments
(1) Growth in M-1 picked up to about a 7¾ per cent annual
rate in August and appears to be accelerating further in September.
For August and September, M-1 is projected to expand at about a 9 per
cent annual rate, one percentage point above the upper end of the FOMC's
short-run range. M-2 is projected to increase at about an 11¼ per cent
annual rate over August and September, more than one percentage point
above the upper end of the Committee's range.1/ M-2 growth has been
bolstered by a continued sharp rise in the large denomination time
deposits included in this measure. Savings deposits at banks also
increased markedly in August following two months of decline.
Growth in Monetary Aggregatesover August-September Period
Ranges Latest Estimates
M-1 4 to 8 9.0
M-2 6 to 10 11.3
Memo: Federal funds rate Avg. for statement(per cent per annum) 7.75 to 8.50 week ending
Aug. 16 7.8723 8.1430 8.28
Sept. 6 8.3013 8.33
1/ These figures do not incorporate revisions based on recently availableMarch 1978 Call Report benchmark data for nonmember banks and technicaladjustments related to a recently discovered cash items bias. Therevised aggregates will be published on September 21. As shown inAppendix Table III, the benchmark revisions increase growth rates forM-1 by 0.5 percentage point for the year-to-date and reduce the growthrate for M-2 over the same period by 0.3 of a point. All tables onsubsequent pages of this report (with the exception of Appendix V andthe first table following the appendices) are based on the revisedseries.

Growth in total deposits at thrift institutions was sustained in August
and early September at about July's rapid pace, although survey results--
available for S&L's--indicate that sales of the 6-month certificate in
August dropped to roughly half the rate of June and July.
(2) Following the August FOMC meeting, incoming data
suggested that growth in the key aggregates over August and September
would likely be around the upper ends of the ranges specified by the
Committee. Accordingly, by late August the Account Management had raised
the funds rate objective to the 8¼ per cent area, the upper end of the
range specified by the FOMC at its August meeting. On September 8, with
M-1 and M-2 both projected to grow at rates significantly above the
upper ends of their respective ranges, the FOMC, in a telephone meeting,
voted to raise the higher end of the funds rate range to 8 ½ per cent
and instructed the Desk to aim promptly for a Federal funds rate of
8-3/8 per cent. On August 18, for international as well as domestic
reasons, the discount rate was raised 1/2 of a percentage point to 7-3/4
per cent. However, until the most recent week, member bank borrowing
remained relatively large, reflecting the further rise in the Federal
funds and other money market rates. On September 15, major banks initiated
an increase in the prime rate from 9-1/4 to 9-1/2 per cent.
(3) Yields on short-dated market instruments generally have
advanced around ½ to ¾ percentage point since the August FOMC meeting.
Bond market yields, on the other hand, have continued to move down
somewhat, apparently in part because participants still hold the view
that, with economic activity slowing, interest rates are near their
peak levels for the current expansion period.

(4) As can be seen in the table below, since reaching their
highest levels of the current expansion in the week before the July
FOMC meeting, long-term corporate yields have declined about ½ percentage
point. This decline reflects not only the shift in interest rate
expectations that occurred in July, but also the relatively light
corporate financing calendar. Declines in yields on municipal bonds
have been more moderate, as a heavy volume of refunding activity
pushed the total volume of offerings in this sector to a record level
in August. While the proceeds from these refundings were channeled
into nonmarketable Treasury debt, the Treasury also has sold a sub-
stantial volume of marketable debt in the period. In contrast to bond
yields, short-term interest rates have advanced on balance since mid-
July along with the rise in the Federal funds rate; upward pressures on
bill rates were reinforced by foreign central banks sales of about
$1.7 billion of these instruments since the August FOMC meeting.
Interest Rates on Selected Dates(in per cent)
Change WeekWeek Ending Of July 12
July 12 Current to Current
Short-term 1/ 2/Federal Funds Rate 7.72- 8.33- +.61
Treasury Bill, 3-month 7.15 7.77 +.62Commercial Paper, 90-119 day 7.84 8.43 +.59New Issue CD's, 90-day (Highest
quoted) 8.04 8.50 +.46Long-term
U.S. Treasury, 20-year 8.72 8.37 p -.35
Corporate AAA, Recently Offered 9.22 8.72 p -.50
Municipal, Bond Buyer 6.32 6.02 -.30
1/ Average for statement week ending July 12.2/ Average for statement week ending September 13.

(5) Real estate and consumer loans at banks are estimated
to have posted further large gains in August. Growth in business
loans also picked up but remained well below rates established in the
first half of the year. In addition to funds obtained from growth in
M-2 type deposits, banks financed the expansion in their loan port-
folios by increasing their nondeposit liabilities and reducing their
security holdings. Given improved deposits flows, outstanding mortgage
commitments at S&L's did not fall further, following a number of months
of decline, and their mortgage lending probably picked up in August.
Yields on new conventional mortgages have edged a bit lower in recent
weeks.
(6) The table on the next page shows percentage annual
rates of change in related monetary and financial flows over various
time periods.

Past Past PastTwelve Six Three Past
Months Months Months Months1976 & Aug. '78 Aug. '78 Aug. '78 Aug. '71
1977 over over over overAverage Aug. '77 Feb. '78 May '78 July '7
Nonborrowed reserves 2.5 6.8 1.4 8.1 3.0
Total reserves 3.2 6.8 5.4 7.0 8.5
Monetary Base 7.7 9.0 7.9 8.0 4.4
Concepts of Money
M-1 (Currency plus demanddeposits ) 1/ 6.9 8.0 8.8 7.1 8.8
M-2 (M-1 plus time depositsat commercial banksother than large CD's) 10.4 8.1 8.4 8.8 10.4
M-3 (M-2 plus deposits atthrift institutions) 12.3 9.3 8.9 9.9 11.7
M-4 (M-2 plus CD's) 8.6 10.3 9.2 7.6 8.0
M-5 (M-3 plus CD's) 11.1 10.5 9.3 9.1 10.1
Bank Credit
Loans and investments ofall commercial banks 2/
Month-end basis 9.8 11.0 11.8 9.4 5.2
Monthly average 9.5 10.9 10.4 9.8 7.3
Short-term Market Paper(Monthly average changein billions)
Large CD's -0.4 1.9 1.2 -0.3 -1.1
Nonbank commercial paper 0.2 0.2 0.5 0.5 -0.1
1/ Other than interbank and U.S. Government.2/ Includes loans sold to affiliates and branches.NOTE: All items are based on averages of daily figures, except for data on total loaand investments of commercial banks, commercial paper, and thrift institutions--whichare derived from either end-of-month or Wednesday statement date figures. Growth ratfor reserve measures in this and subsequent tables are adjusted to remove the effectdiscontinuities from breaks in the series when reserve requirements are changed.

Prospective developments
(7) The table below presents for Committee consideration
two alternative specifications for the Federal funds rate and the
monetary aggregates for the September-October period. (More detailed
and longer-term data are contained in the tables on pp. 7 and 8).
Alt. A Alt. B
Ranges for Sept.-Oct.
M-1 6½ to 10½ 6 to 10
M-2 8 to 12 7½ to 11½
Federal funds rate(Intermeeting period) 8 to 8¾ 8¼ to 9
(8) Alternative A contemplates a Federal funds rate between
now and the next meeting centered on the prevailing 8-3/8 per cent
level. Growth in M-1 over the September-October period is expected
to be in a 6½ to 10½ per cent annual rate range, largely in reflection
of the stronger growth of this aggregate that appears in train for
September. If M-1 expands at the mid-point of the expected range,
its October level will be above that implied by the upper
end of the FOMC's current longer-run range, as indicated in the upper
panel of Chart 1 on the following page.
(9) For the third quarter, the annual rate of M-1 growth
is expected to be around 7-1/4 per cent. This represents a considerable
slowing from the rate of the second quarter, and reflects the decelera-
tion of economic activity from the extraordinary spring pace and the
lagged response to rising short-term interest rates.

CHART 1
Recently Established M-1 Growth Ranges and Actual M-1
Billions of dollars
6%%
- Projection 0 - 370
- Q2 '78-02 '79 -
-c
S350
- 360S 1 '78-01'79_y / / "--<
Q 4 ' 7 7 - Q 4 '7 8
320 _ 350
330 360
320 - % - 350-r
330 s Q3'77-Q3 '78
320 0..
320 320
1977 1978 1979
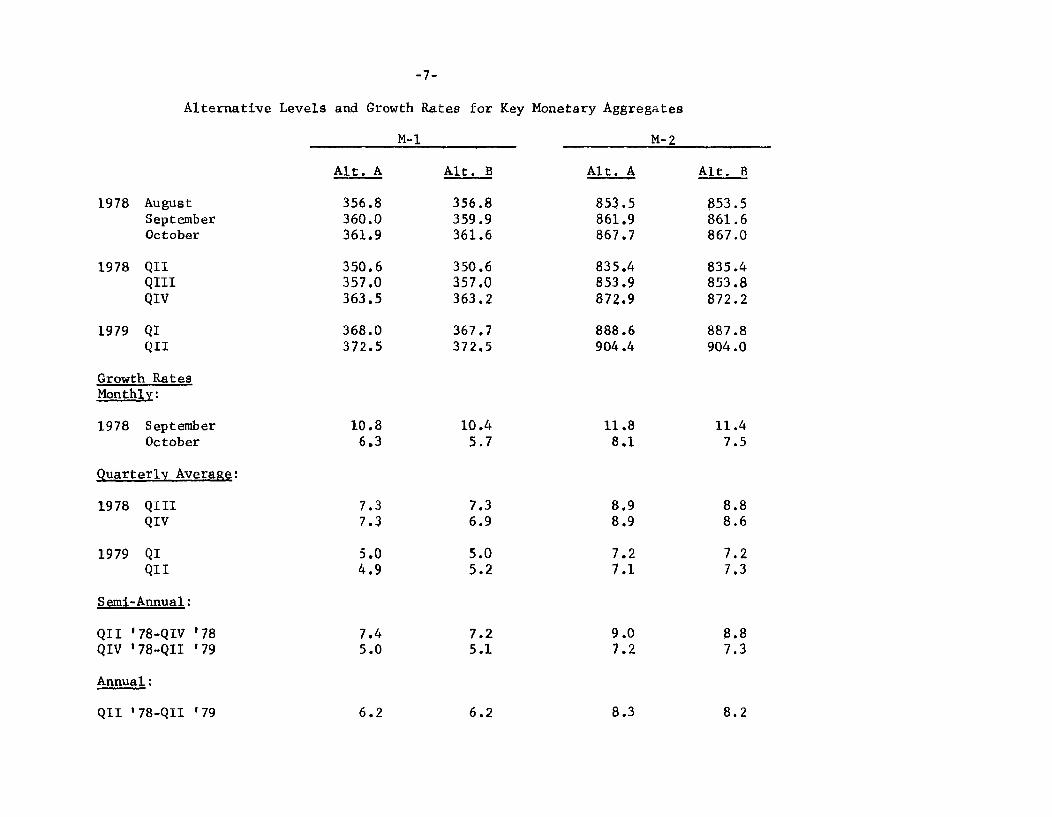
Alternative Levels and Growth Rates for Key Monetary Aggregates
M-1 M-2
Alt. A Alt. B Alt. A Alt. B
1978 August 356.8 356.8 853.5 853.5September 360.0 359.9 861.9 861.6October 361.9 361.6 867.7 867.0
1978 QII 350.6 350.6 835.4 835.4QIII 357.0 357.0 853.9 853.8QIV 363.5 363.2 872.9 872.2
1979 QI 368.0 367.7 888.6 887.8QII 372.5 372.5 904.4 904.0
Growth RatesMonthly:
1978 September 10.8 10.4 11.8 11.4October 6.3 5.7 8.1 7.5
Quarterly Average:
1978 QIII 7.3 7.3 8,9 8.8QIV 7.3 6.9 8.9 8.6
1979 QI 5.0 5.0 7.2 7.2QII 4.9 5.2 7.1 7.3
Semi-Annual:
QII '78-QIV '78 7.4 7.2 9.0 8.8QIV '78-QII '79 5.0 5.1 7.2 7.3
Annual:
6.2 6.2QII '78-QII '79 8.3 8.2

Alternative Levels and Growth Rates for Key Monetary Aggregates (cont'd)
M-3 Bank Credit
Alt. A Alt. B Alt. A Alt. B
1978 August 1454.9 1454.9 939.1 939.1September 1470.5 1470.2 949.0 949.0October 1483.1 1482.3 958.3 957.9
1978 QII 1420.4 1420.4 916.5 916.5QIII 1455.4 1455.3 940.5 940.5QIV 1494.1 1493.2 968.5 967.5
1979 QI 1525.0 1523.9 996.0 993.5QII 1554.9 1554.0 1023.6 1020.1
Growth RatesMonthly
1978 September 12.9 12.6 12.7 12.7October 10.3 9.9 11.8 11.3
Quarterly Average:
1978 QIII 9.9 9.8 10.5 10.5QIV 10.6 10.4 11.9 11.5
1979 QI 8.3 8.2 11.4 10.7QII 7.8 7.9 11.1 10.7
Semi-Annual:
QII '78-QIV '78 10.4 10.3 11.3 11.1QIV '78-QII '79 8.1 8.1 11.4 10.9
Annual:
9.5 9.4 11.7 11.3QII '78-QII '79

(10) Expansion in M-2 under alternative A is likely to be in
an 8 to 12 per cent annual rate range over the September-October period,
raising this aggregate by October to the level implied by the top of
its current longer-run range, as shown in the top panel of Chart 2.
The interest-bearing component of M-2 is expected to slow markedly from
its recent pace as the year progresses. However, given the strength of
time and savings deposits thus far in September, growth over the September-
October period in the time deposit component of M-2 may be at around an
11 per cent annual rate--considerably above the average pace of the
first half of the year. Savings deposit growth is not likely to be sus-
tained at the August pace, but issuance of 6-month certificates should
support growth of small time deposits and banks are expected to con-
tinue to sell sizable amounts of large-denomination time deposits to
meet loan demands.
(11) The staff continues to expect inflows of deposits to
thrift institutions to slow from their extraordinarily rapid recent rate,
which has been affected by continued shifts from existing financial
assets to the new money market certificates. Nevertheless, because
deposit growth at S&L's and MSB's has been larger than expected in recent
weeks, our projection of total thrift deposit flows has been raised from
the last month. Indeed, with growth in the other monetary aggregates
also strong, it is likely, as shown in the upper panel of Chart 3, that
M-3 in October will be somewhat above the level implied by the upper end
of the FOMC's current longer-run range.
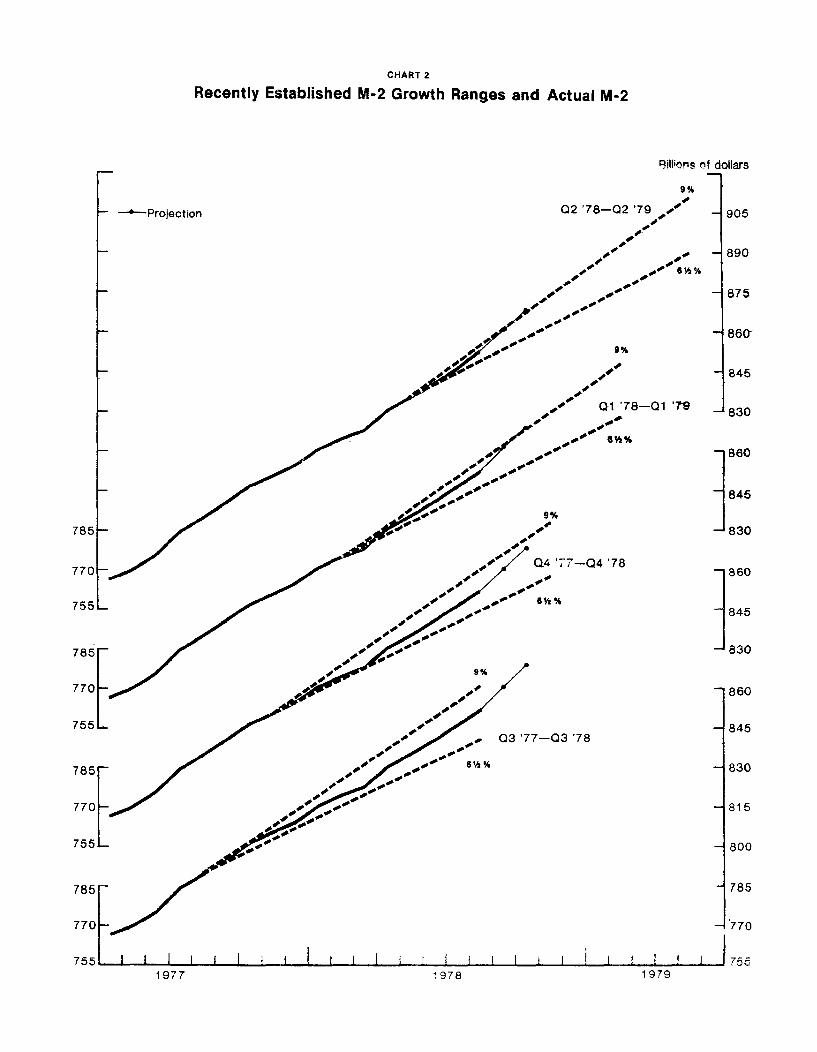
CHART 2
Recently Established M-2 Growth Ranges and Actual M-2
--- Projection Q2 '78-02 '79
01 '78-C
SH%
6%%
illions of dollars
9%
0 - 905
- 8906%%
- 875
-860-
-845
1 ' - 830
845
-830
- 860
845
- 830
Q3 '77-03 '78
6%%
1978
860
845
830
815
800
785
770
7551977 1979

Chart 3
Recently Established M-3 Growth Ranges And Actual M-3
- Projection
/ Q3'77-Q3'78
7%%
Billions of dollars1590
io%
S- 1560
S- 15308%
9 --
% 1500Q2'78-Q2'79
- 1470
10%O - 1440
)t'78-Q1'79
,, - 15007% %
1470
S1440
1500
'8S1470
-1440
" 1500
1470
-1440
-1410
-1380
S1350
-1320
1978
1350
1320
1290
1260
1320
1290
1260
1320
1290
1260
1320
1290
12601977 1979

-10-
(12) If the Federal funds rate remains around 8-3/8 per cent
over the intermeeting period, as envisioned under alternative A, short-
term market interest rates would be expected to remain near current
levels. The recent increases in short-term rates appear to have kept
them in alignment with the funds rate. Although short-term credit
demands of both financial and nonfinancial businesses may pick up in
September and October, following a weakening in August, they are likely
to remain more moderate than over the first half of the year. Demands
for short-term funds from sponsored agencies should moderate somewhat
in the weeks ahead from their strong summer pace,in view of the recent
strength in thrift deposit flows, and the Treasury will probably not
tap the bill market for new money until the latter part of the fourth
quarter.
(13) Longer-term yields also may change little under alterna-
tive A, and could even edge down a little further, unless incoming data
come to suggest a more rapid rate of inflation or stronger expansion in
real activity than the market is currently expecting. Municipal bond
issuance has dropped off substantially in September and will likely con-
tinue at a reduced pace in October. Corporate bond offerings are likely
to pick up only seasonally from the recent relatively light pace. The
Treasury is expected to rise only about $3.0 billion of new money in
late September in auctions of 2-year and 5-year notes, and will then
not be back in the market until late October. Moreover, institutional
investors apparently still have a considerable volume of liquid funds

-11-
available for investment, and dealer positions are light. The recent
rapid growth of thrift deposits suggests that mortgage market rates
will likely fluctuate around current levels in coming weeks.
(14) Alternative B calls for an increase in the Federal
funds rate by mid-October to around the midpoint of an 8-1/4 to 9 per
cent range. M-1 growth would likely be in a 6 to 10 per cent annual
rate range over September-October and M-2 growth in a 7-1/2 to 11-1/2
per cent range. The further increase in short-term rates would be
expected to slow the inflows of interest-bearing deposits subject to
regulatory ceilings at banks and thrifts, but recent evidence suggests
that the new 6-month certificates will probably blunt some of the
impact of rising rates on deposit growth, especially at thrifts.
(15) The modest increase in the funds rate contemplated
under alternative B is, of course, likely to have some upward impact
on short-term market rates of interest. However, such rates may rise
by less than the funds rate--and long-term rates by quite small amounts--
if market participants act on the assumption that the peak in interest
rates is even closer at hand. A further increase in the funds rate
would reinforce market expectations of another adjustment in the dis-
count rate. Barring such an adjustment, member bank borrowing would
be likely to increase noticeably.
(16) Under either alternative A or B, short-term interest
rates are expected to come under further upward pressure before year-
end. With nominal GNP projected to rise at an annual rate of more than

-12-
11 per cent over the balance of the longer-run policy period, the Federal
funds rate might have to rise to 9 to 9-1/4 per cent during the fourth
quarter if growth in M-1 is to be constrained to around the upper limit
1/2/of its range over the current longer-run policy period. The rise in
market interest rates and the anticipated completion of the stock adjust-
ment to the new 6-month certificates is expected to slow the pace of
inflows into interest-bearing deposits subject to regulatory ceilings,
and growth in both M-2 and M-3 over the QII '78 to QII '79 policy period
is projected to be in the upper half of their longer-run ranges.
1/ The staff's projections for the Federal funds rate through mid-1979are shown in appendix I and for velocity growth rates in appendix II.
2/ Growth in measured M-1 is expected to slow in the fourth and subsequentquarters if the Board regulation with regard to automatic transfers fromsavings to demand deposits becomes effective November 1. No allowance hasbeen made for such a slowing in the estimates presented in this blue book.Banks are just beginning to publish their pricing schedules for the automa-tic transfer service. Even after most are published, competitive pressureswill undoubtedly tend to change them and in any event it will be very difficultto project the probable public response and the extent to which M-1 willbecome distorted. These uncertainties about the size of the resulting dis-tortion in M-1 suggest the desirability of supplementing M-1 and M-2 withanother measure that would be less affected than M-1 and would still be areasonable indicator of transactions demands for money. Such a measure--termed M-1+ and defined as M-1 plus savings deposits at commercial banksand transactions balances at thrift institutions--is presented in appendix V.

-13-
Directive language
(17) Given below are suggested operational paragraphs for
the directive. Alternative language consistent with the short-run
specifications of the alternatives discussed in the preceding section
is shown for the Committee's objective for the Federal funds rate early
in the period. At a later point, alternative language is also provided
for placing main emphasis either on monetary aggregates or on money
market conditions. The specifications adopted at the August meeting
as modified at the telephone meeting on September 8 are shown in strike-
through form.
In the short run, the Committee seeks to achieve bank
reserve and money market conditions that are broadly consistent
with the longer-run ranges for monetary aggregates cited above,
while giving due regard to developing conditions in domestic
and international financial markets more generally. Early in
the period until the next regular meeting, System open market
operations shall be directed at attaining a weekly-average
Federal funds rate
(A) AT ABOUT THE CURRENT LEVEL(B) slightly (OR SOMEWHAT) above the current level.
Subsequently, operations shall be directed at maintaining the
weekly-average Federal funds rate within the range of [DEL: 7-3/4 to
8-1/2] ____ TO ____ per cent. In deciding on the specific
objective for the Federal funds rate the Manager shall be guided

-14-
mainly by the relationship between the latest estimates of
annual rates of growth in the [DEL: August-September] SEPTEMBER-
OCTOBER period of M-1 and M-2 and the following ranges of
tolerance: [DEL: 4-to-8] ____ TO ____ per cent for M-1 and
[DEL: 6-to-10] ____ TO ____ per cent for M-2. If, giving
approximately equal weight to M-1 and M-2, their rates of
growth appear to be
Monetary aggregates emphasis
significantly above or below the midpoints
Money market emphasis
close to or beyond the upper or lower limits
of the indicated ranges, the objective for the funds rate shall
be raised or lowered in an orderly fashion within its range.
If the rates of growth in the aggregates appear to be above
the upper limit or below the lower limit of the indicated ranges
at a time when the objective for the funds rate has already been
moved to the corresponding limit of its range, the Manager is
promptly to notify the Chairman who will then decide whether the
situation calls for supplementary instructions from the Committee.

Chart 4
Recently Established Bank Credit Growth Ranges and Actual Bank Credit
Billions of dollars%% 10 30
Q2 '78-Q2 '79 /-- Projection 2 '78-2 791010
- - 990
- ' 970
-- 950
- 930, 10%
-o- 0Q1 '78-Q0 '79 - 910
/ 0 7%-" "7 950
870 - 930
850- 910
850 10%
830- - 950S 04 '77-Q4 '78
810 9 3 0
- 910850
830 - / do - o950
810- 10 % - 930
Q3 '77-Q3 '78850 - - 910
830- . ^ - 890
8 1
910
850
830 -.
810 " 9717 I I I8_I I I II I I97 J 9810
1977 1978 1979

Appendix I
Projected Federal Funds Rate
1978--QIII
QIV
1979--QI
QII
Alt. A
8 to 8-1/8
8% to 9k
8% to 91
8% to 94
Alt. B
8-1/8 to 8k
9 to 9
8% to 9
8% to 9

Appendix II
Implied Velocity Growth Rates
V-1 (GNP/M-1) Alt. A Alt. B
1978 II 8.2 8.2
III 2.4 2.4
IV 3.0 3.3
1979 I 6.7 6.7
II 5.2 4.8
V-2 (GNP/M-2)
1978 II 10.2 10.2
III 0.8 0.8
IV 1.4 1.8
1979 I 4.5 4.5
II 3.0 2.8

Appendix III
Revisions in the Monetary Aggregates
Benchmark adjustments for domestic nonmember banks and
data associated with a recently discovered cash items bias problem
have been incorporated into the money stock series and related data.
The benchmark adjustments are based on the March 1978 call report and
affect deposit levels from January 1978 to date. The cash items bias
adjustment gradually raises the level of the series from mid-1975 to
date. Both M-1 and M-2 grew at an 8.0 per cent annual rate over the
first three quarters of 1978, on the revised basis, compared with
rates of 7.5 and 8.3 per cent, respectively, for the old series.
The impact of benchmark and cash items bias adjustments on annual,
quarterly and monthly M-1 and M-2 growth rates are shown in Tables
III-1 and III-2.
The benchmark adjustments raised the level of M-1 about
$500 million in March 1978 and about $1 billion in August. The level
of M-2 was reduced about $700 million in March and $2 billion in August.
As shown in column 4 of Tables III-1 and III-2, over the first three
quarters of 1978 the benchmark adjustment added 0.3 percentage points
to M-1 growth and reduced M-2 growth by a like amount.
The cash items adjustment corrects for a recently discovered
bias associated with transfers of funds by some agencies and branches
of foreign banks in New York City on behalf of directly-related insti-
tutions. Foreign related banking institutions in New York City have
begun to transfer funds for directly-related institutions (parent and

III-2
subsidiaries) by drawing checks on accounts held by the related institu-
tion at the New York City office; some of these transfers apparently
began as early as mid-1975. In effect the New York office was acting
as agent for the directly related institution. Since funds due to a
directly-related institution are not recorded as deposits, but rather
as other liabilities, the cash items generated by these checks are not
matched by a demand deposit account, and their deduction in the
calculation of money stock measures is therefore inappropriate. Also,
since these checks are not officers checks of the New York City
agency or branch, they are not included in officers checks data
collected to adjust for cash items bias generated by transfers of funds
for regular customers by these institutions. In order to correct for
this relatively small but growing bias, data were collected from foreign
agencies and branches in New York City to provide an estimate of the
amount of cash items bias such transfers generated from mid-1975 to
April 1978. Since May 1978 daily data are available and will be available
on a continuing basis. In the most recent period, this bias adjustment
amounts to about $1 billion.
As can be seen in columns 4 of Tables III- and III-2 the
impact of the cash items adjustment on annual and quarterly growth rates
was minor. Because of the volatility of the series, however, individual
monthly M-1 growth rates were raised or lowered as much as 1¼ percentage
points. Impacts on monthly M-2 growth rates were smaller.

Table III-1
Effect of Benchmark and Cash Items BiasAdjustment on M-1 Growth
(Seasonally adjusted, per cent annual rates)
Differences due to1/
Old Revised Difference Cash ItemSeries Series (1) - (2) Benchmark Bias
(1) (2) (3) (4) (5)
Annual 2/
1975 4.4 4.6 0.2 - 0.2
1976 5.7 5.8 0.1 - 0.1
1977 7.9 7.9 0.0 - 0.0
1977 QIV to1978 011I (proj) 7.5 8.0 0.5 0.3 0.2
3/Quarterly-
1978 QI 5.6 6.2 0.4 0.1 0.3
QII 9.5 9.9 0.4 0.4 0.0
QIII (proj.) 6.9 7.3 0.4 0.3 0.1
Monthly
1978 Jan. 10.3 11.3 1.0 0.3 0.7
Feb. -0.7 0.3 1.0 0.6 0.4
Mar. 3.5 3.9 0.4 0.7 -0.3
Apr. 19.0 19.6 0.6 0.3 0.3
May 8.0 7.2 -0.8 0.1 -0.9
June 5.9 7.5 1.6 0.3 1.3
July 5.5 4.8 -0.7 -0.3 -0.4
Aug. 7.8 8.8 1.0 0.7 0.3
Sept. (proj.) 10.2 10.8 0.6 0.3 0.3
i/ In percentage points.
2/ AJerage of QI to average of QIV.
3/ Quarterly average.

Table III-2
Effect of Benchmark and Cash Items BiasAdjustment on M-2 Growth
(Seasonally adjusted, per cent annual rates)
Differences due to lOld Revised Difference Cash Item.
Series Series (1) - (2) Benchmark Bias
(1) (2) (3) (4) (5)
Annual 2/
1975 8.3 8.4 0.1 - 0.1
1976 10.9 10.9 0.0 - 0.0
1977 9.8 9.8 0.0 - 0.0
1977 QIV to1978 QIII (proj) 8.3 8.0 -0.3 -0.3 0.0
3/Quarterly- /
1978 QI 6.9 6.9 0.0 -0.1 0.1
QII 8.3 7.9 -0.4 -0.4 0.0
QIII (proj.) 9.2 8.9 -0.3 -0.3 0.0
Monthly
1978 Jan. 9.5 9.5 0.0 -0.2 0.2
Feb. 4.7 4.7 0.0 -0.1 0.1
Mar. 5.6 5.1 -0.5 -0.4 -0.1
Apr. 11.5 11.2 -0.3 -0.4 0.1
May 7.8 7.1 -0.7 -0.4 -0.3
June 7.8 7.8 0.0 -0.4 0.4
July 8.6 8.0 -0.6 -0.5 -0.1
Aug. 10.6 10.4 -0.2 -0.3 0.1
Sept. (proj.) 11.8 11.8 0.0 -0.1 0.1
1/ In percentage points.
2/ From average of QIV to
3/ Quarterly average.
average of QIV.

74IV 751 7511 751
Appendix Table IV-1
MONEY STOCK--M-1(Annual rates of growth, compounded quarterly)-
Base Period
II 75IV 761 7611 76111 76IV 771 77Il 77111 771V 781 7811
1975 I
II
III
IV
1976 I
II
III
IV
1977 I
II
III
IV
1978 I
II
1979 IIAlt.Alt.
2.1
4.3
5.2
4.6
4.6
5.0
4.9
5.2
5.4
5.7
6.0
6.1
6.1
6.4
* *
6.5
6.7
5.4
5.3
5.6
5.3
5.7
5.8
6.1
6.4
6.5
6.5
6.8** *
6.4 6.66.4 6.6
7.0
4.9
4.8
5.4
5.1
5.5
5.8
6.1
6.3
6.5
6.5
6.8
J* *
2.9
3.8
4.9
4.6
5.2
5.6
6.0
6.3
6.4
6.4
6.8
****
6.6 6.66.6 6.6
4.7
5.9
5.2
5.8
6.1
6.5
6.8
6.9
6.8
7.2
7.0
5.4
6.2
6.4
6.9
7.1
7.2
7.1
7.4
3.9
5.8
6.2
6.8
7.1
7.2
7.1
7.5
7.2
7.9
8.0
7.9
7.6
8.1
6.9 7.1 7.1 7.46.9 7.1 7.1 7.4
8.6
8.4
8.2
7.7
8.2
8.3
8,0
7.4
8.1
7.3 7.3 7.27.3 7.2 7.2
7.7
7.0
8.1 10.3
7.0 6.9 7.0 6.27.0 6.9 7.0 6.2
EndingPeriod

Appendix Table IV-2
MONEY STOCK--M-2(Annual rates of growth, compounded quarterly)1/
Base Period
74IV 751 7511 75II 75IV 761 7611 7611 761V 771 7711 77III 77IV 781 7811
1975 I
II
III
IV
1976 I
II
III
IV
1977 I
II
III
IV
1978 I
II
1979 IIAlt.Alt.
6.4
8.3
8.9
8.4
8.9
9.2
9.2
9.7
9.8
9.8
9.9
9.7
9.5
9.4
**
9. 29.1
10.2
10.2
9.1
9.6
9.7
9.6
10.2
10.2
10.2
10.2
10.0
9.8
9.7
* * w*
10.3
8.6 6.9
9.4 9.0
9.6 9.4
9.5 9.3
10.1 10.1
10.3 10.3
10.2 10.2
10.2 10.2
10.0 10.0
9,7 9.7
9.6 9.5
* *** * * *
9.3 9.39.3 9.3
9.29.2
11.1
10.7
10.2
10.9
11.0
10.8
10.7
10.4
10.0
9.8
10,3
9.7
10.9
11.0
10.7
10.6
10.3
9.9
9,7
9.0
11.2
11.2
10.8
10.7
10.3
9.8
9.6
13.3
12.3
11.4
11.1
10.5
9.9
9.7
11.2
10.4
10.3
9.8
9.3
9.1
9,5
9.9
9.4
8.8
8.6
10.2
9.3
8.5
8.4
8.3
7.7
7.8
7.0
7.6
9.4 9,2 9.1 9,2 8.7 8.5 8.3 8.1 8.0 8.2 8.39.4 9.2 9.1 9.1 8.7 8.4 8.3 8.0 8.0 8.2 8.2
1/ Based on quarterly average data.
EndingPeriod
8.2

EndingPeriod
1975 I
II
III
IV
1976 I
II
III
IV
1977 I
II
III
IV
1978 I
II
1979 IIAlt.Alt.
Appendix Table IV-3
MONEY STOCK--M-3 1/(Annual rates of growth, compounded quarterly)-
Base Period
74IV 751 7511 75111
8.3
10.6
11.6
11.1
11.4
11.6
11.5
12.0
12.1
11.9
12.0
11.9
11.6
11.3
* **
13.0
13.2
12.1
12.2
12.2
12.1
12.5
12.5
12.3
12.3
12,2
11.9
11.6
* * *
13.5
11.6
12.0
12.0
11.9
12.4
12.5
12.2
12.3
12.1
11.8
11.4
** *
9.8
11.2
11.6
11.5
12.2
12.3
12.1
12.1
12.0
11.6
11.3
S **
A 10.9 11,1 10.9 10.8B 10.9 11.0 10.9 10.8
75IV 761 7611 76111 76IV
12.7
12.5
12.1
12.8
12.8
12.4
12.4
12.3
11.8
11.4
12.3
11.8
12.9
12.8
12.4
12.4
12.2
11.7
11.3
11.3
13.2
13.0
12.4
12.4
12.2
11.6
11,1
15.0
13.9
12.8
12.7
12.4
11.6
11.1
12.8
11.7
12.0
11.7
11.0
10.5
771 7711 77111 77IV 781 7811
10.7
11.6
11.4
10.5
10.0
12.5
11.8
10.5
9.9
11.1
9.5
9.0
7.9
8.0 8.0
10.8 10.7 10.6 10.5 10.1 9.8 9.7 9.3 9.0 9.210.8 10.7 10.6 10.5 10.0 9.7 9.6 9.2 8.9 9.1
9 .59,4

APPENDIX V
Automatic Transfers and a Supplemental Monetary Aggregate
When automatic transfers become available November 1 new uncer-
tainties will arise regarding both projected growth in demand deposits
and the interpretation of M-1 growth.1/ This new service will permit con-
sumers to substitute savings balances, earning explicit interest, for
demand deposits, earning no explicit yield. Thus, automatic transfers
can be expected to weaken the demand deposit component of M-1--of which
consumer deposits are approximately one-third of the total-and simulta-
neously increase savings balances at commercial banks. While commercial
banks may also attract funds from thrift institutions and from other
sources, it is the Board staff's judgment that the volume of any such
inflows will probably be small and that the bulk of funds attracted to
savings accounts subject to automatic transfers will likely come from
household demand accounts.
The extent of the shift from demand to savings accounts will de-
pend heavily on the promotional activity and pricing of this service by
commercial banks. A recent informal and confidential System-wide survey of
1/ The impact of automatic transfers on M-1 and M-2 growth was discussedin Appendix IV of the July 1978 Bluebook.
NOTE: Data contained in this appendix, including accompanying tables andcharts, do not reflect the recent benchmark to the March 1978 Callreport.

commercial banks indicates that a very high proportion of banks are
planning to offer this service beginning in November. Many of these
banks indicated that they intend to promote automatic transfers actively.
Less clear at this time are the typical pricing features of
automatic transfer programs. Many banks have not yet finalized their pricing
schedules, and others are very reluctant to divulge such sensitive com-
petitive information, but the survey suggests that pricing plans are
likely to vary widely among banks, at least initially.1/ In general,
though, respondent banks indicated that they expect their rivals to
actively promote this new service and they are willing to meet this com-
petition in order to protect their market shares. In view of this evidence,
the staff believes that the amount by which automatic transfers will de-
press M-1 growth in the first three quarters they are offered may be in the
middle or perhaps the upper portion of the 1 to 3-1/2 annual percentage
2/point range estimated previously.- Nevertheless, it should be emphasized
that these estimates remain crude and there continues to be a great deal
of uncertainty regarding the impact of automatic transfers on deposit con-
versions and M-1 growth.
1/ Many banks offering information on their pricing plans mentioned terms-frequently involving monthly maintenance charges and per transfer fees-that would appeal mainly to their large household depositors, generallythose with average balances in excess of $1,000. Fragmentary informationon the distribution of household checking balances by size of accountindicates that such large accounts contain over one-half of total house-hold balances.
2/ The lower end of this range is based on 6 per cent of consumer demanddeposits converting to savings in the first year, while the upper endis based on conversions of 18 per cent. The 1 to 3 percentage pointrange for the impact on M-1 growth reported in the July Bluebook was forthe QII '78 to QII '79 period and the 1 to 3-1/2 percentage point rangegiven above is for the QIII '78 to QII '79 period.

V-3
Since most of the conversions to savings balances are likely
to come from demand deposits, a somewhat broader aggregate than M-1-
which includes both kinds of accounts-will be less vulnerable to distor-
tions caused by automatic transfers. Board staff has, for some time, been
conducting research on a variety of alternative definitions of money
which reflect recent innovations in the payments mechanism and the changing
character of depository institution liabilities. A full scale study
is expected to be completed in several months. But in view of the impend-
ing problems for interpreting M-1 posed by automatic transfers. Board
staff has constructed a supplemental aggregate that may be useful, at least
during the transition period in which significant conversions are expected
to occur. Table V-1 shows the composition of this aggregate, which is
tentatively being called M-+. Besides M-1, it includes savings deposits
at commercial banks, NOW accounts at thrifts, credit union share drafts
and demand deposits at MSBs. Alternatively, more emphasis could be placed
on M-2, as currently defined, although M-1+ is likely to be more closely
related to transactions and not as sensitive to shifts among time deposits
and other financial assets.
M-1+ equaled $581 billion in August, as compared with M-1 of
$354 billion. The largest single component of M-1+, as with the current
M-1, is demand deposits at commercial banks, followed by commercial bank
savings, and then by currency; total NOW balances and other transactions
balances at thrifts make up a very small portion of the total. Chart V-1
shows how the composition of this aggregate has changed over time. Some
of the increase in the share of savings balances included in M-1+ and the
concurrent fall in the share of demand deposits during 1975 and 1976

V-4
TABLE V-1
Level and Composition of M1+(August 1978)
1. Currency
2. Demand deposits at commercial banks
3. M1 (1.+2.)
Amount(in billions of dollars)
94.0
260.1
354.2
Per cent oftotal
16.2
44.7
60.9
1/Commercial bank savings-
2/NOW balances-
Demand deposits at MSBs
Credit union share drafts
M1+
Excludes NOW accounts at commercial banks.NOWs at both commercial banks and thrifts.
222.5
3.3
.9
.6
38.2
.6
.2
.1
581.5 100

V-5
CHART V-1
COMPONENTS OF M-1+-
(Quarterly average seasonally adjusted)
Demand deposits
Per Cent of M-
-- 60
50
- 40
2/Savings deposits
-U . - - - -
- 30
Currency
3/ -Other transactions balances
I I I L Jm1970 1972 1974 1976 1978
Last observation charted is second quarter 1978.Excluding NOW accounts at commercial banks.Other transactions balances include NOWs, demand deposits at MSBs andcredit union share drafts.
f. --
op
1966 1968

resulted from shifts from demand deposits to savings associated with
regulatory changes. However, the bulk of the decline in the demand
deposit share is believed to have stemmed from the widespread applica-
tion of cash management techniques while the rise in the savings share
reflected relatively low market rates of interest during this period.
Quarterly growth rates of M-1+--along with current M-1--are
shown in Chart V-2. Since savings-which tend to be sensitive to change-
ing market yields-are an important component of M-1+, growth of M-1+
has been more responsive than M-1 to the difference between market yields
and regulatory ceilings, shown in the lower panel of the chart. When
market rates were low relative to regulatory ceilings, such as in 1971 and
1972 and again in 1975 and 1976, savings growth tended to be substantial
and M-1+ expanded more rapidly than M-1. Conversely, during those times
when market rates rose appreciably above ceilings, such as in 1969, again
in 1973, and more recently since late 1977, growth of M-1+ tended to fall
below that of M-1. Table V-2 compares growth rates of M-1 and M-1+ over four-
quarter policy periods, beginning in early 1975. During all but the two
most recent policy periods, growth of M-1+ outpaced that of M-1, in some
cases by about 6 percentage points-when market rates were relatively low.
In the two most recent policy periods, however, growth in M-1+ dropped be-
low that of M-1, reflecting the impact on savings deposits of increases in
market yields during these periods. The lower portion of Table V-3 contains
growth rates of M-1 and M-1+ for recent months.
The public's demands for these alternative measures of money
relative to GNP move inversely with their velocities, which are shown in
Chart V-3. Velocities of both M-1 and M-1+ have trended upward over this

V-7CHART V-2
RATES OF GROWTH OF M-1 AND M-1+ AND SPREAD BETWEEN THE TREASURYBILL RATE AND PASSBOOK CEILING RATE
(Quarterly average, seasonally adjusted at annual per cent rates)
II
I1 I M-1+
I I I
I II II I1 I
S/vB
'V'/-1" II
I .I%
I 1 I I I I 1 I I I I I
Treasury Bill Rate Less CeilingAccounts
Rate on Passbook
K-I I I I I I I I I I I
196 196 197 197 197 197 1978I
-4 0
r-
1976 19781970 1972 19741966 1968

TABLE V-2
Comparison of Growth Rates Over Four QuarterPolicy Periods of M-1 and M-1+
(Seasonally adjusted at annual per cent rates)
Period
QII'75 - QII'76
QIII'75 - QIII'76
QIV'75 - QIV'76
QI76 - QI'77
QII'76 - QII'77
QIII'76 - QIII'77
QIV'76 - QIV'77
QI'77 - QI'78
QII'77 - QII'78
M1
5.2
4.6
5.7
6.3
6.6
7.8
7.9
7.5
7.9
M1+
11.3
10.5
12.6
12.3
11.1
11.2
9.3
7.1
6.6
Memo:M+ less M1
6.1
5.9
6.9
6.0
4.5
3.4
1.4
-.4
-1.3

TABLE V-3
Rates of Growth of M-1 and M-1+(Seasonally adjusted at annual per cent rates)
Memo:
M1 M1+ 1+ less M
Annual
1976 5.7 12.6 6.91977 7.9 9.3 1.4
QuarterlyAverage
1977 I 6.9 12.5 5.6II 8.1 8.5 .4III 8.1 8.0 -.1IV 7.5 6.8 -. 7
1978 I 5.6 4.5 -1.1II 9.5 6.6 -2.9
Monthly
1978 January 10.3 8.8 -1.5February -0.7 0.2 .9March 3.5 2.3 -1.2April 19.0 13.4 -5.6May 8.0 5.5 -2.5June 5.9 3.1 -2.8July 5.5 1.7 -3.8August 7.8 8.1 .3

V-10
CHART V-3
VELOCITIES OF ALTERNATIVE MEASURES OF MONEY(Quarterly)
Velocity of M1
_ Velocity of M
I 1 I I I I I I I I I I1966 1968 1970 1972 1974 1976 1978
_ 6.5
-- 6.0
-- 5.5
-- 5.0
-4 4.5
-J 4.0
-4 3.5
-4 3.0
2.5
S0
mmm m
Velocity of Mj+
1972 1974 1976 19781966 1968 1970

V-ll
period, as the public has tended to economize on its holdings of these
balances relative to GNP. In addition, both velocities have displayed
movement around their respective trends, in part related to the interest
rate cycle. However, during the years 1975 and 1976 M-1 velocity rose at
an unusually fast pace-at a time when the spread of cash management
techniques along with changes in regulatory policy depressed M-1 growth.
In contrast, movements in M-1+ velocity appear to have been dominated by
relatively low rates of interest in these years.
Econometric evidence on the demand for M-1+ indicates a rea-
sonably close relationship between the demand for this aggregate and
income and interest rates. While automatic transfers are likely to alter
the demand relationships for both M-1 and M-1+, it is believed that the
overall demand for M-1+ will be much less affected during the transition
period, as the principal changes in the behavior of this aggregate are
likely to be compositional. During this transition period, M-1+ is likely
to be more predictable, based on historical relationships, than M-1
Data on M-1+ are available weekly and involve about the same
amount of estimation as for M-1. While Board staff has had no experience
in projecting this new aggregate, no special problems are anticipated
over and above those that would be encountered in projecting M-1 and M-2.

Chart I
Money Market Conditions and Interest Rates
MONEY MARKET CONDITIONS Per cent INTEREST RATES Short-term Per centWeekly Averages Weekly Averages
10
8
9
FEDERAL FUNDS RATE 7
8
EURO-D LLARS
F.R. DISCOUNT RATE 6 3-Month
- 7
9/15/78
INTEREST RATES Long-term Per cent--_-.. I - 11i
1977 19781977 1978 1977 1978
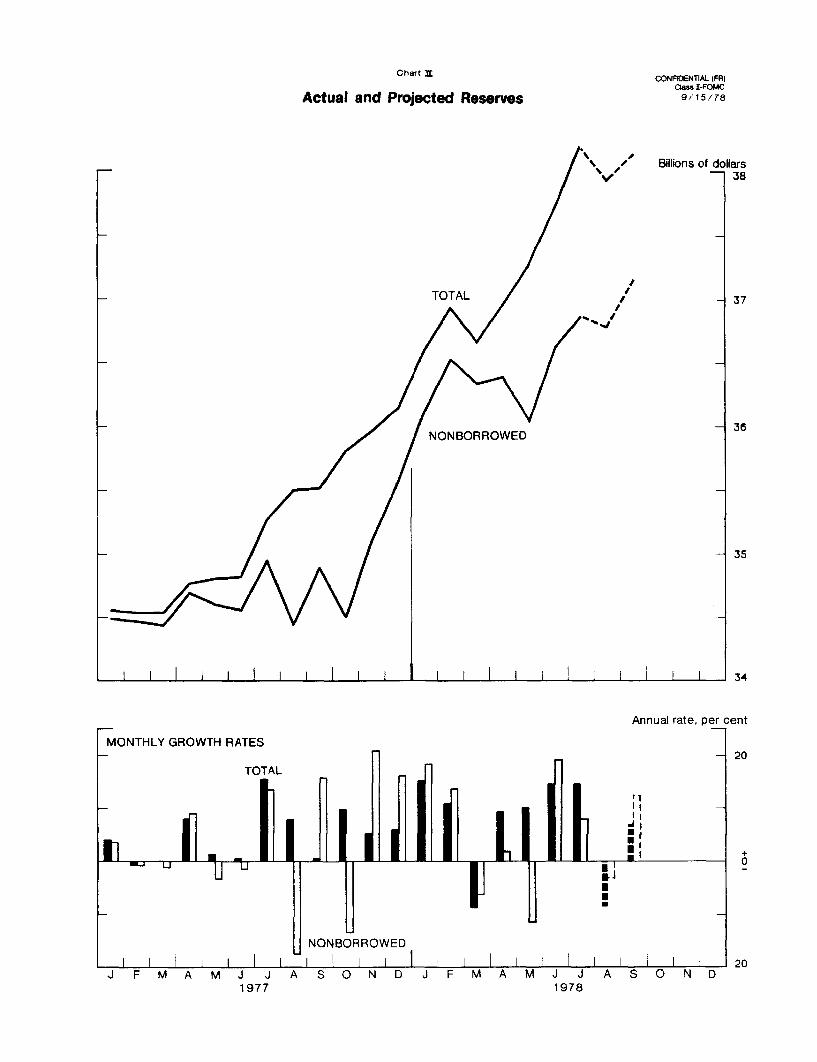
Chart IICONFIDENTIAL (FR)
Class II-FOMC9/15/78Actual and Projected Reserves
TOTAL
NONBORROWED
Billions of dollars38
-37
-36
I I I I i I I i
MONTHLY GROV
1 J t
I I i I I I
Annual rate, per cent
WTH RATES- 20
TOTAL
IIII
U 0
I
NONBORROWED
II I I I I I I I I I I I I I I 1 2 0J F MA M J J A S ON D J F MA M J J A S ON D
1977 1978
11111111111 (IIIIII IIII

Table 1
MONETARY AGGREGATESACTUAL AND CURRENT PROJECTIONS, SEASONALLY ADJUSTED
CONFIDENTIAL (FR)CLASS II-FOMC
SEPT. 15, 1978
Money Stppi Total Time & Savings Depeslts NondepositPeriod Narrow Broad US. Govt. T thr than CD's Sources of
(M1 I (M2) I Deposits 1/ Totl avins Other C's Funds 2/-_ud - _
MONTHLY LEVELS-$BIL
1978--JUNEJULYAUG.SEPT.
I ANNUAL GROWTH
QUARTERLY
1978--15T QTR.2ND OTR.3RD QTR.
QUARTERLY-AV
1978--1ST QTR.2ND QTR.3RD QTR.
MONTHLY
1978--JUNEJULYAUG.SEPT.
AUG.-SEPT.
WEEKLY LEVELS-$OIL
1978-AUG. 29
1623 P30 P
SEPT.- 6 P
350.3351.9354.2(357.2)
4.411.0
, 7.91
5.69.56.9
5.95.57.8
10.21
9.0)
353.2354.0355.0354.7352.6
357.3
840.5846.5853.9(862.5)
6.69.1
( 10.51
6.98.3
t 9.21
7.88.610.512.1)
11.3)
849.9852.1854.2855.2854.5
860.4
11.314.214.9
1 13.7)
14.213.814.415.716.0
14.5
576.8582.0586.1(593.1)
13.09.9
S11.31
13.411.0
( 10.3)
6.710.88.514.3)
11.4)
583.6584.5585.3586.7588.5
590.7
490.1494.6499.8
(505.31
8.27.7
( 12.41
7.97.4
( 10.8)
8.911.012.613.21
13.01
496.8498.2499.3500.5501.9
503.1
221.7220.9222.5(224.4)
2.61.34.9)
2.61.6
1 1.4)
-1.6-4.38.7
10.2)
9.5)
221.0221.4222.2222,9223.2
223.7
268.4273.8277.3
(281.0)
13.213.1
( 18.8)
12.712.3
L 18.9)
17.724.115.316.0)
15.8)
275.8276.7277.1277.6278.7
279.4
86.787.486.3
( 87.8)
43.222.9
1 5.1)
50.0
32.87.0)
-5.59.7
-15.1
20.9)
2.7)
86.886.386.086.186.6
87.5
69.269.271.5
69.872.069.471.372.9
NOTE: DATA SHOWN IN PARENTHESES ARE CURRENT PROJECTIONS. P - PRELIMINARY1/ INCLUDES TREASURY DEPOSITS AT MEMBER BANKS AND FEDERAL RESERVE BANKS.2/ INCLUDES BORROWINGS FROM OTHER THAN COMMERCIAL BANKS IN THE FORM OF FEDERAL FUNDS PURCHASED, SECURITIES SOLO UNDER AGREE-
MENTS TO REPURCHASE, AND OTHER LIABILITIES FOR BORROMED MONEY. PLUS GROSS LIABILITIES TO oWN FOREIGN BRANCHES
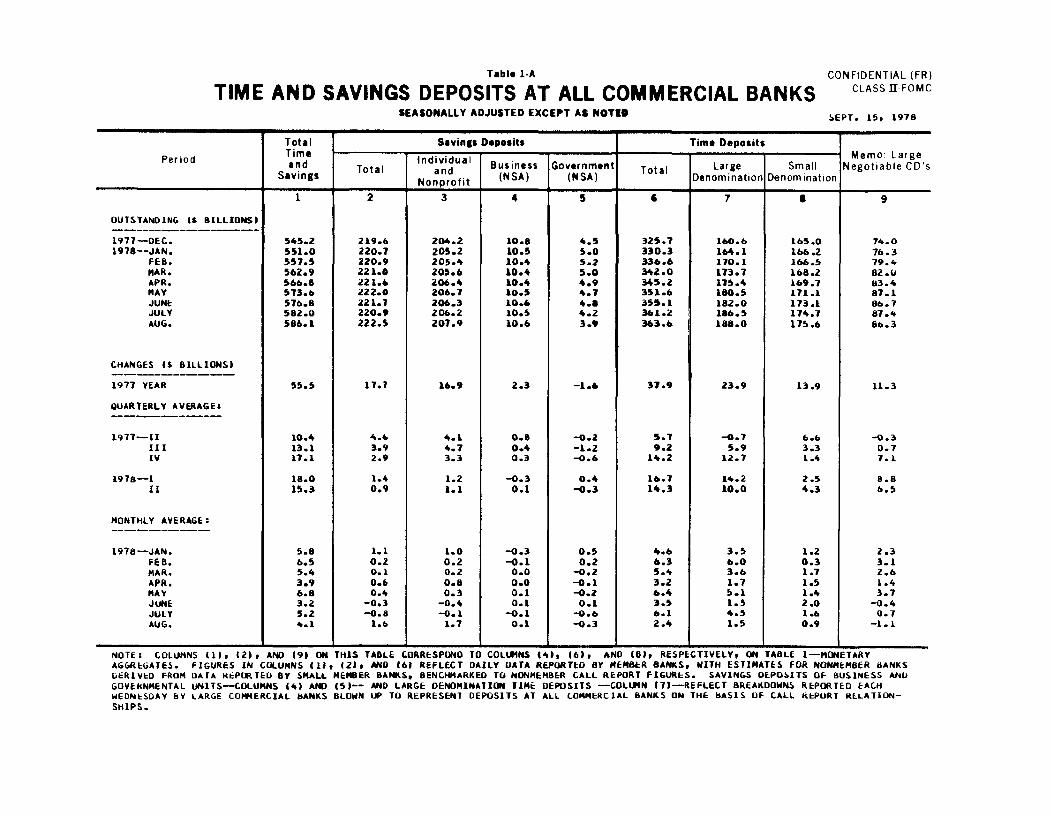
Table 1-A
TIME AND SAVINGS DEPOSITS AT ALL COMMERCIAL BANKSSEASONALLY ADJUSTED EXCEPT AS NOTED
CONFIDENTIAL (FR)CLASS II-FOMC
SEPT. 15, 1978
Total Savings Deposits Time Deposits
Period Individual r Memo Largeerod an Total Invidual Business Government Total Large Small Negotiable CD'sSavings Nonprofit (NSA) (NSA) Denomination Denomination
I Nonprofit SA) (NSA) IDenomination Denomination
OUTSTANDING ($ BILLIONS)
1977-DEC.1978--JAN.
FEB.MAR.APR.MAYJUNEJULYAUG.
CHANGES I$ BILLIONS)
1977 YEAR
QUARTERLY AVERAGEs
1977-11IIIIV
1978--1II
MONTHLY AVERAGE:
1978--JAN.FEB.MAR.APR.MAYJUNEJULYAUG.
545.2551.0557.5562.9566.8573.6576.8582.0586.1
10.413.117.1
18.015.3
5.86.55.43.96.83.25.24.1
219.6220.7220.9221.0221.6222.0221.7220.9222.5
17.7
4.63.92.9
1.40.9
1.10.20.10.60.4
-0.3-0.8
1.6
204.2205.2205.4205.6206.4206.7206.3206.2207.9
16.9
4.14.73.3
1.21.1
1.00.20.20.80.3
-0.4-0.1
1.7
10.810.510.410.410.410.510.610.510.6
2.3
0.60.40.3
-0.30.1
-0.3-0.1
0.00.00.10.1
-0.10.1
4.55.05.25.04.94.74.84.23.9
-1.6
-0.2-1.2-0.6
0.4-0.3
0.50.2
-0.2-0.1
-0.20.1
-0.6-0.3
325.7330.3336.6342.0345.2351.6355.1361.2363.6
37.9
5.79.2
14.2
16.714.3
4.66.35.43.26.43.56.12.4
160.6164.1170.1173.7175.4180.5182.0186.5188.0
23.9
-0.75.9
12.7
14.2
10.0
3.56.03.61.75.11.54.51.5
165.0166.2166.5168.2169.7171.1173.1174.7175.6
13.9
6.63.31.4
2.54.3
1.20.31.71.51.42.01.60.9
74.076.379.482.083.487.186.787.486.3
11.3
-0.30.77.1
8.86.5
2.33.12.61.43.7
-0.40.7
-1.1
A~ I . _ _ _ _
NOTE: COLUMNS (1)l (2) AND (9) ONAGGREGATES. FIGURES IN COLUMNS (11DERIVED FROM DATA REPORTED BY SMALLGOVERNMENTAL UNITS-COLUMNS (4) ANDWEDNESDAY BY LARGE COMMERCIAL BANKSSHIPS.
THIS TABLE CORRESPOND TO COLUMNS (4), (6), AND (8), RESPECTIVELY, ON TABLE 1-MONETARY, (21, AND (61 REFLECT DAILY DATA REPORTED BY MEMBER BANKS, WITH ESTIMATES FOR NONMEMBER BANKSMEMBER BANKS BENCHMARKED TO NONMEMBER CALL REPORT FIGURES. SAVINGS DEPOSITS OF BUSINESS AND(5)-- AND LARGE DENOMINATION TIME DEPOSITS -COLUMN (7)-REFLECT BREAKDOWNS REPORTED EACHBLOWN UP TO REPRESENT DEPOSITS AT ALL COMMERCIAL BANKS ON THE BASIS OF CALL REPORT RELATION-

TABLE 2
BANK RESERVESACTUAL AND CURRENT PROJECTIONS, SEASONALLY ADJUSTED
CONFIDENTIAL (F.R.)CLASS II-FOMC
SEPT. 15, 1978
SANK RESERVES _REQUIRED RESERVES
Period Total Nonborrowed Monetary Total Private Total Time Gov't. andReserves Reserves Base Required Demand Deposits Interbank
1 2 3 4 5 6 7
MONIHLY LEVELS-SMILLIONS
1978-JUNEJULYAUG.SEPT.
PERCENT ANNUAL GROWTH
QUARTERLY
1978-1ST QTR.2ND QTR.3RD QTR.
QUARTERLY-AY
1978-1ST QTR.2ND QTR.3RD QTR.
MONTHLY
1978-JUNEJULYAUG.
SEPT.
AUG.-SEPT.
WEEKLY LEVELS-MNILLIONS
1978-AU. 29
162330
SEPT. 613
37,72638,19037,921(38, 35)
5.811.6
( 4.3)
8.56.3
( 8.2)
14.714.8-8.5
( 6.8)
( -0.9)
37,99537,73538,12737,60938,136
38,31338,079
36,63236,87336,782(37,160)
8.63.2
( 5.8)
14.5
0.4( 6.31
19.27.9
-3.0( 12.3)
( 4.71
36,55736 85737,16436 00337 116
37,14937,569
133,873134,831135,324
(136,561)
7.910.4
I 8.0
9.68.0
S 8.9)
11.08.64.4
( 11.0)
( 7.71
134,991134,628135,364135,187136,051
136,467136,483
37,54837,99337,744(37,889)
5.711.8
( 3.6)
8.37.08.0)
16.214.2-7.9
4.6)
-1.61
37164237,72037,80437,61837,832
37,95837,815
22,15122,21722.333(22,424)
-1.113.7
I 4.9)
3.65.0
1 8.21
14.73.66.3
1 4.91
( 5.6)
22,15322,30822,37122,26522,430
22,40322,228
a i & 5 h &
13,575
13,61313,625(13,724)
12.910.1
4 4.4)
12.8
11.5( 6.6)
13.13.41.18.7)
4.9)
13,67213,65113,64113,60613,589
13,62013,696
1,8232.1641,786
( 1,741)
1t8171,7621,7921,7471,813
1,9341,891
NOTE: RESERVE SERIES HAVE BEEN ADJUSTED TO REMOVE DISCONTINUITIES ASSOCIATED WITH
DATA SHOWN IN PARENTHESES ARE CURAFNT PROJIETlfTNS.
CHANGES IN RESERVE REQUIREMENT RATIO.

TABLE 3NET CHANGES IN SYSTEM HOLDINGS OF SECURITIES 1/
($ million, not seasonally adjusted)
STRICTLY CONFIDENTIAL (FR)CLASS II - FOMC
SEPTEMBER 15, 1978
Treasury Treasury Coupons Federal Agencies Net Change NetBills Net Net Purchases 3/ Net Purchases 4/ Outright RPs
Wih
in 1 5 5ver 10 To within Holdings RChange 2/ t - 5 5 - 10 Over 10 Total I1hi - 5 5 - 10 ver 10 Total olg6/C1 year Total 5/ -
1977--Qtr. IIQtr. II;Qtr. IV
1978--Qtr. IQtr. II
1978--Mar.
-4907,2321,280
-468863
4,361
2,126886186
789579797
3,2843,0252,833
526681628
539500434
1,5101,048
758
17196
166
167129196
1,070642553
152128108
1,582
1,415
1,747
6,202
5,187
4,660
9591,021
1,001
-2,655 345 1,123 459 247 2,1755,444 288 1,156 468 334 2,246
668 288 813 370 147 1,618
1,670-6204,395
592400
1,665824469792
1,059864
3,0821,613
8911,433
726
707
1,631
9,2736,303
7,2676,227
10,035
3,666
4,273
-643
---- -- -- -- -555
46 127 104 24 301 7,930
S - - - 2,233
671519
1,057
235 -- -- -- - - -- -- - - -
283 171 424 238 113 947 -92 -81 -- -- -173
1978--July 5121926
Aug, 29162330
2,341-135
5,724
2311,043
-- -- -- -- -- -- -- -- -- -- 1,263-- -- -- -- -- -- -- -- -- -- -196
- -- -- - - - - - - - 532-- -- -- -- -- -- -- -- -- -- 165
-6-863461
1,241209
-1,358-46
-1541,2723,607
-2,892
4,175-2,331
34
-1,1331,224
1,874
-1,026-699
2,950
-2,5361,701
-10,1197,0803,024
-9,587
6,760-4,641
3,4453,056-373
Sept. 6132027
---- -- -- -- -- ----- 6 -7,473
-- -- -- -- -- -- -- -- -22 2,869
LEVEL--Sept. 13 46.2 10.5 31.0 13.5 9.7 64.7 1.9 3.6 1.6 .9 8.0 118.9 -1.9(in billions)1/ Change from end-of-period to end-of-period.
/ Outright transactions in market and with foreign accounts, and redemptions (-) in bill auctions.
3/ Outright transactions in market and with foreign accounts, and short-term notes acquired in exchange for maturing bills. Excludes redemptions, maturityshifts, rollovers of maturing coupon issues, and direct Treasury borrowing from the System.
4/ Outright transactions in market and with foreign accounts only. Excludes redemptions and maturity shifts.
/ In addition to net purchases of securities, also reflects changes in System holdings of bankers' acceptances, direct Treasury borrowings from the
System, and redemptions (-) of Agency and Treasury coupon issues.6/ Includes changes in both RP's (+) and matched sale-purchase transactions (-).

TABLE 4SECURITY DEALER POSITIONS AND BANK POSITIONS
(millions of dollars)
STRICTLY CONFIDENTIAL (FR)CLASS II - FOMCSEPTEMBER 15, 1978
U.S. Govt. Security Underwriting Member Bank Reserve PositionsDealer Positions Syndicate Positions Excess** Borrowing at FRB** Basic Reserve Deficit**
Bills ssou ondate Munipal Reserves Total Seasonal 8 New York 38 OthersIssues Bonds Bonds
295 487 5130 116 -111
215 349 7190 123 -227
1,86120
1,716172
71 199 200 1,084128 230 209 626
1977--High
Low
1978--High
Low
1977--Aug.Sept.
Oct.
Nov.Dec.
1978--Jan.
Feb.Mar.
Apr.MayJune
JulyAug.
1978--July 5121926
Aug. 29162330
Sept. 6132027
7,2341,729
5,625278
2,5334,812
4,1423,6174,257
4,1273,4182,713
3,1831,2032,847
1,196*1,994
7301,038626
2,084
1,5951,9281,956*1,941*2,087
*2,338*3,086
3,017-1,445
2,043-1,076
-933-313
-360610804
3271,492
740
-183578
-626*423
-96-661
-1,076-432
-3011,382400
*-305*462
*352*455
1,305
863570
484406328
5571,212
1,094
1,3171,139p
1,193903
1,5891,462
1,438878963
1,606
1,020p
1,164p
510p
131 -9,1518 -4,234
196 -8,22425 -2,839
102 -5,581112 -7,333
112 -6,48083 -6,97155 -7,403
32 -6,04749 -4,98047 -6,778
44 -6,19692 -4,038
120 -4,514
143 -3,651189p -4,788p
140 -3,659130 -4,707134 -3,693152 -2,839
166 -3,242175 -5,145184 -5,946196 -4,56720
8p -3,969
186p -4,5
41p
174p -5,753p
NOTE: Government security dealer trading positions are on a commitment basis. Trading positions, which exclude Treasury securitiesfinanced by repurchase agreements maturing in 16 days or more, are indicators of dealer holdings available for sale over the near-term.Underwriting syndicate positions consist of issues still in syndicate, excluding trading positions. The basic reserve deficit is excessreserves less borrowing at Federal Reserve less.net Federal funds purchases. Weekly data are daily averages for statement weeks, exceptfor corporate and municipal issues in syndicate which are Friday figures.
* Strictly confidential.** Monthly averages for excess reserves and borrowings are weighted averages of statement week figures.
51 159 19734 176 176p
23p 135
p75p 56p
719-227372-37
35315
323-9304p
305p212p
-13,975- 8,206
-14,602- 8,273
-11,452-11,120
-11,511-11,825-11,350
-12,299-12,603-11,060
-12,998-11,653-12,202
-10,204-11,060p
- 8,273-11,699-10,261-10,110
-10,095-11,433-10,999-11,768-10,364
-10,735p-13,235p

TABLE 5SELECTED INTEREST RATES
(per cent)
1977--HighLow
1978--HighLow
1977--Aug.Sept.
Oct.Nov.Dec.
1978--Jan.Feb.Mar.
Apr.MayJune
JulyAug.
1978--July 5121926
Aug. 29162330
Sept. 6132027
Daily--Sept. 714
FederalFunds
(1)
6.654.47
8.336.58
5.906.14
6.476.516.56
6.706.786.79
6.89
7.367.60
7.818.04
7.727.727.94
7.88
7.897.83
7.878.148.28
8.308.33
Short-Term
8.27 7.59 7.858 .3 6 p 7.77 7.95
Bank U.S. Govt.-Constant CorpPrime Maturity Yields Uti
S 3 7 NewRate 3-yr 7-yr 20-yr ,sue
Issue
CD's New Corm.Treasury Bills CDs uNew CommIssue- Paper
Market Auction NYC 90-1193-mo 1-yr 6-mo 90-Day Day(2) (3) (4) (5) (6)
6.27 6.62 6.51 6.70 6.664.41 4.67 4.56 4.50 4.63
7.70 7.91 7.79 8.34 8.306.16 6.55 6.42 6.65 6.68
5.49 5.97 5.81 5.78 5.755.81 6.13 5.99 6.01 6.09
6.16 6.52 6.41 6.53 6.516.10 6.52 6.43 6.56 6.546.07 6.52 6.38 6.65 6.61
6.44 6.80 6.68 6.82 6.756.45 6.86 6.74 6.77 6.766.29 6.82 6.64 6.73 6.75
6.29 6.96 6.70 6.84 6.826.41 7.28 7.02 7.20 7.066.73 7.53 7.20 7.66 7.59
7.01 7.79 7.47 8.00 7.857.08 7.73 7.36 7.86 7.83
6.99 7.74 7.45 8.00 7.787.15 7.79 7.52 8.00 7.847.08 7.80 7.50 8.00 7.886.95 7.84 7.43 8.00 7.88
6.78 7.71 7.36 7.88 7.816.76 7.56 7.17 7.85 7.786.96 7.68 7.26 7.85 7.767.25 7.83 7.47 7.80 7.857.35 7.82 7.55 7.90 7.93
7.60 7.86 7.74 8.00 8.077.70 7.91 7.79 8.34 8.30
(7)
7.756.25
9.25
7.75
6.83
7.13
7.52
7.757.75
7.938.008.00
8.008.278.63
9.00
9.01
8.969.009.009.00
9.009.009.009.009.00
9.259.25
(8)
7.395.83
8.56
7.40
6.796.84
7.197.227.30
7.617.677.70
7.858.078.30
8.54
8.33
8.518.56
8.558.55
8.368.218.378.358.37
8.358.34p
(9)
7.706.59
8.577.72
7.24
7.21
7.447.467.59
7.86
7.947.95
8.068.25
8.40
8.558.38
8.52
8.57
8.568.55
8.408.328.438.368.39
8.358.32p
STRICTLY CONFIDENTIAL (FR)CLASS II - FOMCSEPTEMBER 15, 1978
Long-Term.-AaalityRecentlyOffered
(12)
8.487.95
9.228.48
8.058.07
8.228.258.38
8.608.678.67
8.858.989.07
9.18
8.91
9.209.229.199.10
8.918.899.008.878.85
8.798.7
2p
Municipal Home MortgagesBond rimarySecondary Market
on -y FNMA GNMABuyer Cony. FNMA NAAuc. Sec.
(13) (14) (15) (16)
5.93 9.00 8.98 8.395.45 8.65 8.46 7.56
6.32 9.80 10.02 9.205.58 8.98 9.13 8.43
5.62 8.94 8.76 8.035.51 8.90 8.74 8.02
5.64 8.92 8.82 8.165.49 8.92 8.86 8.195.57 8.96 8.94 8.27
5.71 9.02 9.17 8.565.62 9.15 9.31 8.645.61 9.20 9.35 8.60
5.80 9.36 9.44 8.716.03 9.57 9.66 8.906.22 9.70 9.91 9.05
6.28 9.74 10.01 9.156.12 9.79 9.81 8.96
6.31 9.73 -- 9.16
6.32 9.73 10.02 9.146.26 9.75 -- 9.14
6.24 9.75 10.00 9.20
6.12 9.78 -- 9.106.03 9.78 9.82 8.896.19 9.78 -- 9.00
6.11 9.80 9.80 9.016.16 9.75 -- 8.92
6.13 9.75 9.78 8.926.02 n.a. -- 8.89
- - 8.19 9.25 8.34 8.35 8.39S 8.43 9.25
8.34p 8.33p 8.
37p
NOTE: Weekly data for columns 1, 2, 3, 6, and 7 are statement week averages of daily data. Weekly data in column 4 are average rates set in the auctions of 6-month bills that will be issued on the Thursday following the end of the statement week. Data in column 5 are 1-day Wednesday quotes. For columns 8 through 11,the weekly date is the mid-point of the calendar week over which data are averaged. Columns 12 and 13 are 1-day quotes for Friday and Thursday, respectively,following the end of the statement week. Column 14 is an average of contract interest rates on commitments for conventional first mortgages with 80 per centloan-to-value ratios made by a sample of insured savings and loan associations on the Friday following the end of the statement week. Column 15 gives FNMAauction data for Monday preceding the end of the statement week. Column 16 is a 1-day quote for Monday preceding the end of the statement week. The FNMA
auction yield is the average yield in bi-weekly auction for short-term forward commitments for Government underwritten mortgages. GNMA yields are averagenet yields to investors on mortgage-backed securities for immediate delivery, assuming prepayment in 12 years on pools of 30-year FHA/VA mortgages carryingthe coupon rate 50 basis points below the current FHA/VA ceiling.
(10)
7.997.26
8.728.01
7.64
7.57
7.717.767.87
8.14
8.228.21
8.328.448.53
8.698.45
8.688.728.698.67
8.498.418.528.428.43
8.398.36p
(11)
8.367.90
9.188.61
8.048.07
8.238.288.34
8.688.698.71
8.90
8.959.09
9.148.82
9.189.179.129.08
8.908.81
8.808.80
8.778.74p

SEPT. 15, 1978
Appendix Table 1-AMONEY AND CREDIT AGGREGATE MEASURES
Sak Reserves reit Moey Stock Measures
TotalPeriod Loans
Total Non. Monetary and MI M M3 M4 M5 M6 M7borrowed Base Invest-ments
ANNUALLY:
19751976j177
2/SEMI-ANNUALLY:
15T hALF 19772ND HALF 1977
1ST hALF 197b
QUARTEKLY:
3RD UTR. 1977TnH QTR. 1977
1ST 1ik. 19762NO JTR. 1978
UUARTERLY-AV:
3RD QOl. 197747H o-x. 1977
1ST UTK. 19762NO TR. 1V76
MONTHLY:
1977--AU(G.SEPT.UCT.NOV.UEL.
1978--JAN.FEB.MAR.APR.MAYJUNEJULYAUG. P
1 2
3.21.22.7
2.92.6
7.4
3.97.8
8.63.2
1.73.4
14.50.3
-17.615.9
-13.420.9
16.1
1.8
-11.419.4
8.0-3.1
5.97.08.3
7.39.0
8.9
9.39.6
7.910.4
8.89.1
9.78.0
8.38.1
10.08.0
10.4
13.66.93.07.0
12.011.18.64.4
3.98.0
11.3
11.310.7
11.4
10.39.5
9.513.5
11.1
9.6
13.0
10.57.2
12.99.26.3
13.67.96.9
18.515.66.0
16.75.2
5 6 7ER CENT ANNUAL RATES OF GROWTH)
I I
10.99.6
10.19.1
7.4
10.17.2
-0.31.05.2
3.5o.8
7.5
8.17.0
5.811.6
7.36.1
b.56.3
7.70.79.85.25.9
15.410.6-0.0
9.310.015.014.9-8.6
8 9
6.67.1
10.1
9.410.3
10.3
9.611.5
9.610.0
9.510.8
10.310.1
7.79.2
12.411.a
9.9
11.68.5
B.311.911.2
6.68.28.0
10.59.9
11.5
10.212.2
9.5
12 .611.9
9.19.3
12.6
10.08.9
12.412 .413.712.09.7
11.58.07.59.L9.98.78.0
10.4
10.110.012.1
10.712.7
10.4
12.613.2
10.29.3
11.813.3
11.39.3
12.412.114.413.511.2
12.79.38.69.69.78.57.8
10.2
1/ bAStLd ON UATA ADJUSTED FOR CHANGES IN RESERVE REQUIREMENTS.2/ BASbD ON QUARTERLY AVERAGE DATA.P - PRELIMINARY
9.98.1
6.97.9
7.79.09.56.0
6.1
9.54.75.1
11.27.17.81.0
10.4

Appendix Table 1-B
MONEY AND CREDIT AGGREGATE MEASURESSEASONALLY ADJUSTED, BILLIONS OF DOLLARS
SEPT. 15, 1978
BoLk Roserves 1 ek Credft Maey <to"ik I**ureo
Period Totaleiod Non Monetary Loans
Total borrowed ase and M M2 M3 M4 M5 M6 M7Invest-ments
ANNUALLY:
19761977
MONiHLY*
1977--AUb.SEPT.
OCT.NOV.bjfC.
1978--JAN.FEd.MAk.
APR.MAYJUNE
JULYAUb. P
WEEKLY:
1978-JULY 121920
AUb. 29
162130P
SEPT. b P
33,96934,44136,143
35,50035,520
35,90935,96536, 143
36,0083o,93136,667
36,951
37,2037,726
38,19437,920
37,19839,24437, 60
37,99337,72338,122z37,11838,140
38,309
33,63934,3b835.574
34,43934,894
34,50335,10335,574
j6, 12436,52536,339
36,3946,04836,632
3,1677369781
36,295
36,398
36,55536,84537,15936,01237,120
37,145
110,345118,0631i7,972
124,154124,987
126,06126,871127,972
129,417130,156130,484
131,334132,647133,873
134,835135,324
133,761135,848134,673
134,989134,616135,360135,196136,055
136,465
126.2788.9875.5
850.0855.1
864.3870.9875.5
885.4891.2896.7
910.5922.3926.9
939.b943.9
295.2313.5338.5
330.5333.0
335.9336.2338.5
341.7341.8342.9
348.5350.6352.6
354.2356.8
354.6351.9354.6
355.2356.7357.5357.4355.5
361.3
664.7740.5809.5
789.2795.1
601.4805.4809.5
815.9819.1822.6
830.3635.2840.6
846.2853.5
845.6843.7847.6
849.2852.0853.8654.9854.3
861.2
1092.51236.51376.1
1331.31344.9
1357.91367.11376.1
1386.61393.11400.3
1411.41419.91429.8
1440.91454.9
746.1803.2883.5
852.4858.9
867.8d76.3883.5
892.2898.5904.7
913.7922.2927.3
933.6939.8
933.3931.5934.9
936.0938.3939.941.0940.8
948.7
1173.81299.21450.1
1394.51408.7
1424.31438.01450.1
1462.91472.51482.3
1494.91506.91516.5
1528.31541.2
1308.01437.61603.4
1541.21557.1
1574.91590.61603.4
1618.71629.51639.7
1652.31665.91678.0
1689.21703.9
1351.01485.01666.6
1597.51613.6
1633.01651.41666.8
1664.41697.41709.5
1723.21737.11749.4
1760.81775.7
.. . - A - __
NOTES: wEEKLY DATA AKE UAILY AVERA6ES FOR STATEMENT WEEKS. MONTHLY DA1A ArE DAILY AVERAGES. WEEKLY DATA ARE NOT AVAILABLE FORMS, M5, Mb, M7, TOTAL LOANS AND INVESTMtNTS AND THRIFI INSTITUTIUN DEPOSITS.
I/ BAS1U UN DATA ADJUSTED FUR CHANGES IN RESERVE REQUIREMENTS. DATA SrHUWN IN MILLIONS OF DOLLARS.P - PRELIMINARY

APPENDIX TABLE 2-A SEPT. 15, 1978
COMPONENTS OF MONEY STOCK AND RELATED MEASURES
Time and Savings Deposits Mutual OtherDemand Oh- Savings Credit s Short Term Private
Period Currency Demand TOther Than CD's Bank & Union S'ings U.S.Gov't Short-termDeposits Total r CD' S&L Shares Bonds Securities AssetsTotal Savings Othr Shares- / 1 /
1 2 3 4 5 6 7 8 9 10 11 122/ (Cr ca am mea reates f gre tb)
ANNUALLY:
1975 8.9 3.3 7.9 11.7 17.5 7.8 -6.4 15.3 19.5 6.2 33.8 -0.7976 9.6 4.b 8.0 15.0 25.0 7.4 -23.4 15.5 18.8 6.9 5.5 13.91977 9. 7.4 11.4 11.2 11.1 11.4 12.8 14.2 19.4 6.b 12.3 27.5
SEMI-ANNUALLY:
IT1 HALF 1977 8.7 7.4 10.4 11.9 15.3 8.9 0.6 12.9 16.6 6.4 2.7 25.6
2NL hALF 1971 9.8 7.1 11.8 10.0 6.4 13.3 24.9 14.5 20.6 6.5 21.6 26.1
ISI nALF 1y97b 9.o 7.7 11.7 6.9 2.1 11.1 43.5 7.5 17.4 6.3 12.4 34.6
uUAklkLYV:
Rb wTH. 1977 10.0 8.6 9.9 10.8 10.9 10.6 3.2 16.2 21.7 6.5 30.0 12.44In l. 1977 10.7 5.4 14.5 7.7 1.5 13.5 64.0 11.6 18.8 6.4 20.3 48.1
1ST wlh. 1978 9.5 3.8 12.3 7.4 2.6 11.5 43.2 6.9 17.9 6.3 15.1 40.4NL, JTr<. 197t 9.3 12.0 9.1 6.8 1.3 11.4 22.9 7.3 14.7 5.7 15.1 9.2
wUATTkLY-AV:
AK UK. 1977 9.1 7.7 10.3 11.2 7.3 14.6 4.5 14.6 20.1 7.0 15.7 18.6
41h UK. 1977 10.3 6.4 13.0 t.5 5.4 11.b 44.9 13.9 20.0 5.9 26.4 32.0
lST wTR. 197a) 10.5 5.0 12.8 7.3 2.6 11.4 50.0 8.1 18.2 6.3 17.9 46.82ND wlk. 197b 6.4 10.3 10.1 6.4 1.6 10.5 32.8 6.8 15.8 6.2 6.5 20.1
MONHlLY:
1977--AUG. 5.6 6.9 8.3 8.4 16.3 1.5 7.6 17.1 19.5 6.4 38.0 10.8SEPT. 11.2 7.8 9.2 8.9 10.0 7.9 11.4 16.6 24.7 4.8 23.5 6.4
L.T. 11.1 10.2 13.7 8.0 4.4 13.3 40.9 14.0 21.5 6.4 31.2 29.7NUV. o.3 -1.0 18.5 9.5 -1.1 18.0 81.3 11.0 15.8 6.3 24.0 57.9
fL.L. 12.3 6.8 10.9 4.6 1.1 8.7 52.5 9.5 18.2 6.3 4.7 51.3
197--JAN. 10.8 11.0 12.3 b.4 6.0 10.0 37.3 7.8 17.9 6.3 32.9 43.5
FEb. 9.4 -2.4 13.3 7.6 1.1 13.2 48.8 6.2 15.2 6.2 13.7 40.2MAR. 8.0 2.9 10.8 6.0 0.5 10.6 39.3 6.6 20.0 6.2 -1.5 33.6AP . 6. 23.8 1.5 5.3 3.3 6.5 20.5 6.6 14.7 6.2 -6.0 18.9MAY 11.6 5.6 13.6 6.7 2.2 11.5 53.2 6.8 12.1 6.1 18.2 5.1JUNk 9.1 6.5 6.1 8.2 -1.6 16.0 -5.5 8.3 16.8 4.6 32.8 3.4
JULY o .5 4.6 10.2 10.3 -4.3 22.5 9.7 11.4 11.8 6.1 -14.5 3.4AUG. P 9.0 8.7 7.5 11.5 8.1 14.2 -15.1 13.7 11. 77.6 20.6 3.4
1/ UKLTTh RATES ARE BASED UN ESTIMATED MONTHLY AVERAGE LEVELS DERIVED BY AVERAGING EtND OF CURRENT MONTH AND END OFPkrvlflUS MUNTH REPORTED DATA.

APPENDIX TABLE 2-B
COMPONENTS OF MONEY STOCK AND RELATED MEASURESSEPT. 15, 1978
Time and Savings Deposits Mutual Short- OtherSevinls Credit Term Private Non- Total
Period Currency Demand Bank Union Svings U.S. Short- Deposit Gov'tDeposits otal Other Than CD's & S&L Shares Bonds Gov't term Funds Demand
iTotl s S, c i Assets DepositTotal ISavingsl Other Shares 1/ Sec _Ast 1 Dposits
ANNUALLY:
197519761977
MONThLY:
1977--AUG.
SEPT.
OCT.NUV.DEC.
197d--JAN.
FEb.MAR.
APK.MAYJUNE
JULYAUG. P
WEEKLY:
1978-JULY 1219
2o
AUb. 29
16
23
30P
SEPT. 6P
1 2 3 4 S 6 7 8 9 10 11
221.523 .8249.9
245.0
246.6
248.7248.5249.9
252.2251.7252.3
257.3258.5259.9
260.9262.8
261.6258.7261.2
261.6262.8263.5263.2261.1
266.3
450.9489.7545.0
521.9525.9
531.9540.1545.0
550.6556.7561.7
565.2571.6574.5
579.4583.0
578.5579.6
560.3
580.8561.6582.3583.6565.3
587.4
369.6427.0471.0
458.7462.1
465.5469.2471.0
474.3477.3479.7
481.8484.5487.b
492.0496.7
490.8491.8493.0
494.0495.3496.3497.5498.8
499.9
160.5
201.9219.6
217.0218.8
219.6219.4219.6
220.7
220.9221.0
221.6222.0221.7
220.9222.4
221.2220.8220.8
221.0221.4222.2222.9223.2
223.7
209.1225.1e51.5
241.7243.3
240.0249.7251.5
253.6256.4258.7
260.1262.6266.1
271.1274.3
269.6271.0272.2
273.0273.8274.1274.6275.5
276.2
81.362.774.0
63.263.8
66.470.974.0
76.379.482.0
83.487.186.7
o7.466.3
87.887.887.3
86.886.386.086.166.6
87.5
394.8456.9519.8
498.2505.1
511.0
515.7519.8
523.2
525.9528.8
531.7534.7538.4
543.5549.7
33.039.146.8
43.844.7
45.546.146.8
47.548.148.9
49.550.050.7
51.251.7
67.211.976.6
75.175.4
75.876.276.6
77.077.477.8
78.278.678.9
79.379.8
73.7
60.788.6
85.586.3
87.167.788.6
89.4
90.190.7
91.292.192.8
93.394.0
93.k93.2
93.4
93.693.893.994.2
94.4
95.1
66.9
66.676.7
71.673.0
74.9
76.476.7
78.8
79.779.6
79.280.482.6
81.683.0
43.0
47.363.4
56.3
56.6
58.060.863.4
65.7
67.969.8
70.971.271.4
71.671.8
13 14
34.451.062.0
55.757.5
58.160.162.0
65.3
66.667.0
66.1
69.2
69.2
69.271.5
64.873.171.5
69.872.0
69.471.372.9
8.311.211.4
10.210.7
10.36.7
11.4
9.77.57.9
8.37.3
11.3
14.214.9
13.615.115.6
14.413.814.415.7
16.0
14.o
1/ ESTIMAIED MONTHLY AVERAGE LEVELS DERIVED BY AVERAGING END OF CURRENT MONTH AND END OF PREVIOUS MONTH REPORTED DATA.i/ INCLUDES PRIVATE DOESTIC NONFINANCIAL INVESTORS* HOLDINGS OF COMMERCIAL PAPER, BANKERS ACCEPTANCES, SECURITY KP'S AND
MONEY MARKET MUTUAL FUND SHARES.3/ BORROWINGS BY BANKS FROM OTHER THAN COMMERCIAL BANKS IN THE FORM OF FEDERAL FUNDS PURCHASED, SECURITIES SOLD UNDER
AGREEMENTS TO REPURCHASE, AND OTHER LIABILITIES FOR BORROMED MONEY, PLUS GROSS LIABILITIES TO OWN FOREIGN BRANCHES(EURUUULLAR BORROWING6S) LOANS WULD TO AFFILIATES, LOAN KPS, AND OTHER MINOR ITEM3.
4/ INCLUDES TREASURY DEPOSITS AT MEMBER BANKS AND FEDERAL RESERVE BANKS.P - PRELIMINARY

STRICTLY CONFIDENTIAL (FR)CLASS I - FOMC
Attached is a corrected chart to replace the one following
page 6 of the September Bluebook.

CHART 1
Recently Established M-1 Growth Ranges and Actual M-1
Billions of dollars
1/2% %
-370
I-Q2 '79
_ ac
- - Projection
K
6 %
Q1 '78-Q1'79
" 4%
6%%
.,0
- Q3 '77-Q3 '78
c-
1 350
360
350
S360
350
- 360
-350
340
330
320320 I I I I I I I I I I I I I I I I
- - - - - - - 'iv-/v-
1977 1978 1979