follow-up on eacea applicant and beneficiary satisfaction analysis · 2018-11-14 · follow-up on...
TRANSCRIPT

EACEA
Follow-up on EACEA applicant and beneficiary satisfaction analysis Final report
December 2010

EACEA
Follow-up on EACEA applicant and beneficiary satisfaction analysis Final report
December 2010
COWI A/S
Parallelvej 2 DK-2800 Kongens Lyngby Denmark Tel +45 45 97 22 11 Fax +45 45 97 22 12 www.cowi.com
Document no. a
Version a
Date of issue November 2010
Prepared ROKR/NVBE
Checked IL
Approved THHO
Follow-up on EACEA customer satisfaction analysis
C:\Documents and Settings\Bermimy\My Documents\COWI\Final report\EACEA_Final 221210responseratesupdated.docx
1
.
Table of Contents
Abbreviations and Acronyms 2
1 Introduction and brief summary 4
2 Background 8
3 About the survey 10
3.1 Response rates 12
3.2 Introduction to presentation of data and results 14
3.3 Description of the response sample 17
4 Analysis of client satisfaction and organisational performance 22
4.1 Overall satisfaction of beneficiaries 22
4.2 Transparency 26
4.3 Accuracy 29
4.4 Timeliness 30
4.5 Quality of information 33
4.6 The E-form 34
4.7 Development of the Agency since 2007 36
4.8 Differences between the programme 38
4.9 Rejected proposal/selections 42
4.10 Free text assessments 44

Follow-up on EACEA customer satisfaction analysis
C:\Documents and Settings\Bermimy\My Documents\COWI\Final report\EACEA_Final 221210responseratesupdated.docx
2
.
Abbreviations and Acronyms EACEA The Education, Audiovisual and Culture Executive Agency
TOR Terms of Reference
LLP Lifelong Learning programme

Follow-up on EACEA customer satisfaction analysis
C:\Documents and Settings\Bermimy\My Documents\COWI\Final report\EACEA_Final 221210responseratesupdated.docx
3
.

Follow-up on EACEA customer satisfaction analysis
C:\Documents and Settings\Bermimy\My Documents\COWI\Final report\EACEA_Final 221210responseratesupdated.docx
4
.
1 Introduction and brief summary Background of the survey At the beginning of 2010 EACEA launched a public procurement procedure to obtain tender offers for the agency's own follow-up survey on applicant and beneficiary satisfaction. The 2010 survey is a follow-up on the 2008 survey and the outcome should be comparable with the outcome of the previous interim evaluation report, with a few adjustments only. The 2010 survey covers devel-opment in applicant and beneficiary satisfaction responses for the period 2007 - 2010. The 2010 survey forms a basis for assessing the quality of services pro-vided by the Agency. It is an important contribution to the continuous evalua-tion of procedures in order to respond to the needs of EACEA clients.
Method of data collection The survey data were collected via an internet based questionnaire, which was managed by the agency. The questionnaire was distributed to all applicants for project funding received by the EACEA from 2007 to 2010. Respondents were sent an e-mail with an invitation to participate in the survey. After a week non-respondents were reminded to participate.
Response rates More than 25.000 persons received an invitation to participate. The survey re-sponse rate was acceptable with an overall response rate of 13,5%.
Results of the survey The following section concerns the results of the statistical analysis. The results are presented mainly as a mean score on a scale from 1 to 9. The scale is con-structed so that responses at the lower end of the scale always present a positive estimate of the statements in the questionnaire. This means that low scores are good and the high scores mean that there is a lot of room for improvement.
Overall satisfaction
A central part of the evaluation is the measure of overall satisfaction with ser-vices provided by the agency to the beneficiaries. The overall picture is that beneficiaries are satisfied to a high degree with the services delivered. The mean score for related questions is 2,65 on the evaluation scale.
When looking closer at the overall satisfaction there are observable differences among various groups in the data material.

Follow-up on EACEA customer satisfaction analysis
C:\Documents and Settings\Bermimy\My Documents\COWI\Final report\EACEA_Final 221210responseratesupdated.docx
5
.
The 'Media' and 'Tempus' programmes show a significantly higher level of sat-isfaction, and the 'Erasmus Mundus' and 'Youth' programmes a lower level of satisfaction, compared to the overall mean level.
Another significant difference in the data is the development of overall satisfac-tion over time. The data shows that there has been a significant positive trend since 2007. The overall mean score has improved from 2,7 in 2007 to 2,5 in 2010, thus continues a trend seen in the previous satisfaction survey (with an overall satisfaction score of 2,8), of an improved satisfaction among EACEA applicants and beneficiaries. However, under this overall trend is a very diverse picture covering many different programmes each with its own structural de-velopment in many different pace. The descriptive results of this report should be seen in this light.
An interesting point is that applicants and beneficiaries, who have previous ex-perience with one or more EACEA projects, tend to be slightly more satisfied with the service from EACEA, than those who are implementing an EACEA-funded project for the first time. A plausible explanation is that respondents with more experience with the system feel more confident and knowledgeable when managing their projects.
Questions for programme management
In the survey, some specific characteristics of the service delivered in terms of transparency, accuracy and timeliness are described for both the applica-tion/selection phase and the implementation phase (please find definitions of these three concepts in the relevant sections). Most of the question scores are relatively low, reflecting the positive score on overall satisfaction. However, there are variations. The most notable are described below.
In relation to transparency, the main result is that there is a significant differ-ence in the degree of transparency that accepted and rejected project experi-ence. Rejected applicants see application process as significantly less transpar-ent in all questions relating to transparency in the proposal/selection phase.
With regard to accuracy, the figures show a generally low score across the rele-vant questions on the clarity and quality of application information provided during different stages. In the implementation phase scores are particularly positive. The only exception relates to whether the administrative burden is rea-sonable compared to the size of grant and scale of project, where the respon-dents seem to score higher – indicating less agreement. It seems that many beneficiaries see room for improvement in the balance between the administra-tive burden on beneficiaries and the size of the grant they receive.
A very reassuring result for timeliness in the proposal/selection phase is that the main share of respondents agrees that the deadline for submission of proposals is sufficiently long for them to prepare their applications. Equally, during the implementation phase, projects tend to be very satisfied with the Agency's overall ability to respond to queries and to execute payment within a reasonable time.

Follow-up on EACEA customer satisfaction analysis
C:\Documents and Settings\Bermimy\My Documents\COWI\Final report\EACEA_Final 221210responseratesupdated.docx
6
.
Use of e-form
In the survey the respondents were asked if they have used the e-form and 68% responded that they have. A relatively large share disagrees that the e-form was clear and easy to complete. This indicates that there still seems be room for some improvement in the current e-form formats. The e-forms have been launched at different times for different programmes and some of the causes of dissatisfaction might be explained by this.
Improvements since 2007
Many of the beneficiaries have previous experience with EACEA projects and the majority of these indicate that they have seen an improvement in the devel-opment of the agency since 2007. Keeping this in mind, a share of 16% indi-cates disagreement with this. A partial explanation for this response pattern is that there is a significant difference in how respondents in different pro-grammes respond to the question. Improvements were perceived mainly in the 'Culture' programme and to a lesser degree in the 'Youth' programme.
If we look at the analysis of the themes of timeliness, transparency and accu-racy, only the accuracy score in the implementation phase has seen significant improvement since 2007. On the other themes, EACEA performs on par with the 2008 survey.
Explanation of rejections of applications
The mean score for the question about whether rejected applicants were satis-fied that they received a clear explanation as to why their application was re-jected is 5. This is the highest (worst) score in the entire survey and indicates that the reasons for rejection need to be better explained. This is substantiated by the fact that this question correlates strongly with the question on whether the respondent 'understood the principles of the selection procedure (different steps, award criteria, selection decisions)'. The focus might be to improve awareness on the principles for selection etc. However, the results should be taken with some caution, since the perception of the rejection might also be in-fluenced by the mere fact that they were rejected – and that the answers may accordingly be emotionally biased.
Qualitative comments
In addition to the quantitative questions, the survey also offered the possibility of submitting comments. In total, more than 2.800 comments were given. From this massive amount of comments, some general themes have been deducted which, to a degree, reflect the findings in the quantitative material.
We found in the comments from many, a general positive indication of satisfac-tion with the programme. In addition, we have also found examples that many experienced improvements in the services over time.

Follow-up on EACEA customer satisfaction analysis
C:\Documents and Settings\Bermimy\My Documents\COWI\Final report\EACEA_Final 221210responseratesupdated.docx
7
.
The more negative comments reflect the survey findings as well. Many con-sider that the administration of the projects is heavy and bureaucratic. However, the comments often reflect an understanding of the fact that EACEA is part of a larger system, which has to pay attention to documentation and unambiguous case handling.
Other comments from the survey show that in the view of the respondents, the explanation for rejections are too scarce, and that contacting the agency for clarification and questions is not always easy.

Follow-up on EACEA customer satisfaction analysis
C:\Documents and Settings\Bermimy\My Documents\COWI\Final report\EACEA_Final 221210responseratesupdated.docx
8
.
2 Background In 2008, the European Commission awarded COWI a contract to conduct an external, interim evaluation of EACEA activities during the period 2006 - 2008.
One requirement of the TOR was to ascertain "To what extent has the estab-lishment of the Agency led to better managed and improved services to the beneficiaries and the Commission, in terms of overall quality, timeliness, accu-racy, and transparency, compared to the situation before the Agency took over the responsibility of delivery? Are any unexpected benefits or negative issues to be distinguished?1" In order to provide an answer to this question, an internet-based Client Satisfac-tion Measurement Survey was designed and implemented by COWI. The sur-vey thus became an integral part of the interim evaluation. Although the questions for the Client Satisfaction Measurement Survey were formulated in close cooperation with EACEA, since they have the expertise and knowledge of the management of programmes covered by the survey, the ex-ternal nature of the evaluation was respected. The survey was designed to be reused/repeated at a later stage should EACEA again wish to analyse the satis-faction of its clients.
The survey covered approximately 23.000 applicants and beneficiaries of the various programmes covered the agency’s programme management system. Essentially, the survey addressed the degree of client satisfaction during the period 2003 - 2007.
The outcome of the survey was reported on in the EACEA interim evaluation report submitted to the European Commission2 in 2009.
Early in 2010, EACEA issued a public procurement notice for tenders to carry out a follow-up customers' satisfaction survey. This initiative was in accordance with the EACEA Action Plan on the recommendations made in the interim evaluation report.
1 European Commission DG EAC: Terms of reference: Interim Evaluation of the EACEA. 2007 2 COWI: Interim Evaluation of EACEA. Final Report. February 2009

Follow-up on EACEA customer satisfaction analysis
C:\Documents and Settings\Bermimy\My Documents\COWI\Final report\EACEA_Final 221210responseratesupdated.docx
9
.
The 2010 survey forms the basis for assessing the quality of services provided by the Agency. It constitutes a vital part of the on-going evaluation process necessary to meet the needs and requirements of applicants.
In most respects, the 2010 survey is a follow-up on the 2008 survey and the results should be comparable, with some minor adjustments, to those of the aforementioned interim evaluation report. The 2010 survey covers development in customers' satisfaction for the period 2007 - 2010.
In May 2010, COWI was contracted to evaluate and analyse the results of the questionnaire prepared and launched by the Agency.

Follow-up on EACEA customer satisfaction analysis
C:\Documents and Settings\Bermimy\My Documents\COWI\Final report\EACEA_Final 221210responseratesupdated.docx
10
.
3 About the survey The survey is, in many respects, a repetition of the client satisfaction survey conducted in the spring of 2008.
In comparing this survey to the first, one sees that some questions have been slightly altered; some have been excluded and replaced by new, thereby main-taining the same number of questions as the previous survey.
The bulk of the new questionnaire consists of 35 closed-form questions. These questions are interspersed with a few open-ended questions allowing for quali-tative comments.
The questions are grouped thematically under a number of themes. In the analysis, these categories will be used to structure discussions and conclusions in a manner which provides a clearer overview. The categories relate to the pro-jects themselves, timeliness, accuracy and transparency, both in selection and implementation phases (six categories in all), as well as to the e-form and qual-ity of information. The table on the next page shows how the different ques-tions are grouped and to which theme they point.

Follow-up on EACEA customer satisfaction analysis
C:\Documents and Settings\Bermimy\My Documents\COWI\Final report\EACEA_Final 221210responseratesupdated.docx
11
.
Overview of general questions, themes Overall satisfaction • We are satisfied with the overall quality of the programme
management services provided during the whole project pe-riod.
Clear explanation of rejection
• We received a clear explanation on why the application was rejected.
Improvement since 2007
• Since 2007, we have noticed an improvement in the way our projects have been handled by the EU organisation.
Transparency in se-lection phase
• We understood the principles of the selection procedure (dif-ferent steps, award criteria, selection decisions).
• We understood easily under which programme (or action) our organisation could apply for EU funding.
Transparency in im-plementation phase – clarity of information material
• The process of monitoring our project by the EU was clear to us.
• The instructions given on reporting procedures were clear. • The contract was easy to understand.
Transparency in im-plementation phase – clarity in communica-tion
• The answers received to questions were clear. • We knew/know who to contact if we had/have a question
about implementing our project (contact person, mailbox, phone number, hotline...) .
Accuracy in selection phase
• We received clear information about deadlines for submitting the application.
• The information offered enabled us to understand the applica-tion procedures.
• The priorities and objectives of the Call for Proposals or Pro-gramme Guide were clear to us throughout the application process.
Accuracy in imple-mentation phase
• During the implementation of the project, we understood the decisions made by the programme management organisation and their justifications (for example, amendments in contracts, feedback on the analysis of reports...).
• The administrative burden was reasonable compared to the size of the grant and the scale of the project.
Timeliness in selec-tion phase
• We received a reply on the selection results within the dead-lines announced in the Call for Proposals or Programme Guide.
• The deadline for submission was sufficiently long for us to prepare our application
• We received our contract within two months of being in-formed that our project was selected.
Timeliness in imple-mentation phase
• We are satisfied with the programme management's overall ability to respond within a reasonable time.
• The awarded grant was paid in due time (after signing the con-tract or after approval of the final report).
E-form • The e-form was clear and easy to complete. Quality of informa-tion
• In the start-up phase, we were satisfied with the quality of in-formation
• During the implementation phase, we were satisfied with the quality of information and advice provided.
Finally, applicants who were rejected are given the opportunity to comment and assess the explanation given for rejection of their application.

Follow-up on EACEA customer satisfaction analysis
C:\Documents and Settings\Bermimy\My Documents\COWI\Final report\EACEA_Final 221210responseratesupdated.docx
12
.
Method of distribution The survey data was collected through an internet based questionnaire. The questionnaire was distributed to all applicants for project funding received by the EACEA from 2007 until 2010. All applicants with a currently valid e-mail address received an invitation to participate in the survey. After a week, non-respondents were sent a reminder.
The questionnaire was distributed in two waves. The first wave distributed to 23.800 applicants and in a second wave to 1.800 who were not initially in-cluded.
3.1 Response rates A total of 25,344 applicants were invited to respond to the client satisfaction survey. Of these, 3457 responded, resulting in a response rate of 14 %.
Response sample as % of total number invited to participate in survey
Total invited to participate
Programme as % of in-
vited
Number of responses
Responses as % of invited
Citizenship 3881 15% 737 19% Culture 2623 10% 448 17% Education 11069 44% 1306 12% Era Mundus 1552 6% 262 17% Media 2391 9% 259 11% Tempus 1162 5% 144 12% Youth 2666 11% 301 11% Total 25, 344 100% 3457 14%
The total amount of applications to EACEA in the period from 2007 until now was 49,694 – i.e. somewhat more than were invited. This is due to that fact that applicants, who submitted several applications, were only sent one email. How-ever, the population that we can compare to our sample to is not the limited sample of 25,600, but the full number of applications, almost 50,000.
The table below compares the response sample to the full, potential population of almost 50,000.

Follow-up on EACEA customer satisfaction analysis
C:\Documents and Settings\Bermimy\My Documents\COWI\Final report\EACEA_Final 221210responseratesupdated.docx
13
.
Response sample as % of full sam-ple of applica-tions from 2007-2010, by pro-gramme
Number of appli-cations 2007-
2010
Programme as % of full sam-
ple
Number of responses
Responses as % of total
sample of ap-plications
Citizenship 4750 10% 737 16% Culture 3337 7% 448 13% Education 19390 39% 1306 7% Era Mundus 2503 5% 262 10% Media 12572 25% 259 2% Tempus 1588 3% 144 9% Youth 5554 11% 301 5% Total 49694 100% 3457 7%
Response sample as % of full sample of ap-plications from 2007-2010
% of all pro-jects
% of all re-jected pro-
jects
% of all accepted projects
All applications 2007-2010 7% 5% 11% Applications - 2007 3% 1% 5% Applications - 2008 4% 2% 8% Applications - 2009 8% 5% 14% Applications - 2010 12% 10% 16%
The table above is interpreted in the way that our response sample represents 7% of the total number of applications in the entire period 2007-2010 – shown in the upper-left corner of the table. The sample accounts for 5% of the re-jected applications and 11% of the accepted applications. The table also gives data for separate years, meaning that we only have responses from 1% of those applications that were rejected in 2007. That group is the least represented in the sample. The most well represented group is the accepted projects from 2010. We have a response sample of 16% for this group.
This same information can be obtained for each programme, as is seen in the next table.
Response sample as % of full sample of applications from 2007-2010, by pro-
Response sample as % of all appli-
cations in pro-
Rejections in re-sponse sample as % of all rejected
Beneficiaries in response sample as % of all bene-

Follow-up on EACEA customer satisfaction analysis
C:\Documents and Settings\Bermimy\My Documents\COWI\Final report\EACEA_Final 221210responseratesupdated.docx
14
.
gramme gramme applications in programme
ficiaries in pro-gramme
Citizenship 16% 10% 26%
Culture 13% 8% 26%
LLP 7% 4% 11%
Erasmus Mundus 10% 8% 14%
Media 2% 1% 3%
Tempus 9% 6% 28%
Youth 5% 3% 11%
The table shows that only 2% of all Media applicants are included in the re-sponse sample. This is less than half of the 5% of applicants that have re-sponded from the Youth programme. The Citizenship programme has the high-est degree of representation in the sample with 16% of the total number of ap-plicants having replied.
3.2 Introduction to presentation of data and results In this and the following chapter, data and results will be presented in three ways. The following tables are used only as illustrative examples in this con-text. The content of these tables is addresses elsewhere in the report.
1. Display of frequency distribution
The most informative way of presenting data is simply to provide the full dis-tribution of answers received, as in the following example.
Example of frequency distribution table
We received a clear explanation on why the applica-tion was rejected (example)
# %
1 = Agree strongly 157 11% 2 186 13% 3 190 14% 4 116 8% 5 125 9% 6 97 7% 7 122 9% 8 100 7% 9 = Totally disagree 265 19% Don't know/not relevant 33 2% Total 1391 100%
The table presents the question and distributes answers to evaluation categories in terms of absolute numbers and percentages. Please note, that responses at the lower end of the scale are always positive seen from EACEA's (and the respon-

Follow-up on EACEA customer satisfaction analysis
C:\Documents and Settings\Bermimy\My Documents\COWI\Final report\EACEA_Final 221210responseratesupdated.docx
15
.
dent’s) viewpoint. Thus a lowering of a score when comparing, e.g. over time, implies an improvement of the service in question.
This type of table is also found in smaller versions depending on the question as seen in this example:
Example of condensed table
Did you submit your application using an elec-tronic application form?
# %
No 459 24% Yes 1488 76% Total 1947 100%
2. Mean scores and high/low-end ratings
Often, data is better summarized using simple mean scores.
Mean scores are, generally, a good indicator of the direction in which a respon-dents' overall assessment leans. As such, the mean score will often be used to provide a general 'summary' of the full answer distribution. However, it can conceal important information, as a mean score sample may not show actual distribution.
All reported mean scores are constructed in such a manner that the lower the score, the more positive the result.
Therefore, we will use 'high-end' and 'low-end ratings' as a way to gauge l addi-tional information when using simple mean scores. A high-end rating is the percentage of sample answers in strong agreement with a given statement. In practice, this covers respondents who choose comments 1 or 2 on the 1-9 ques-tions used in the questionnaire.3
Low-end ratings are those that indicate a low-level of agreement or, more cor-rectly, a high-level of disagreement. Low-end ratings are the percentage of an-swers in categories 5-9, implying anything from mild to total disagreement with the questions. The reason for that this category is somewhat broad is mainly due to the fact that respondents seldom choose the more negative part of the scale.
An example is given below:
In much of the questionnaire, recipients are asked to state their level of agree-ment with a given statement on a scale from 1-9, where 1 = Agree strongly and
3 Somewhat contrary to expectations, high-end, thus, describes the number of answers at a numerically low level, i.e. 1 or 2 on the scale from 1 to 9. These answers, however, indicate a high degree of agreement from which comes the wording 'high-end'.

Follow-up on EACEA customer satisfaction analysis
C:\Documents and Settings\Bermimy\My Documents\COWI\Final report\EACEA_Final 221210responseratesupdated.docx
16
.
9 = totally disagree. A random statement from the questionnaire is shown in the text box:
The deadline for submission was sufficiently long in order for us to prepare our proposal/selection The mean score for all responses to this question is 1.9 meaning that there is a strong tendency to agree with the statement in question.
The high-end rating is 82 % providing further evidence of agreement with this statement. This high-end rating is a positive one.
The low-end rating is low, with under 9% of respondents disagreeing with the statement.
3. Factor scores (from principal components analysis)
The final type of data presentation is an aggregation of the scores on several questions into one single measure. This is done in order to highlight a common theme from related questions, thus enabling a simplified means of communica-tion focusing on a theme and not individual questions. The content of each of the factor scores is the combination of the questions that is used to make the score.
An example:
The theme 'accuracy in the proposal/selection phase' is described in the survey by the three following questions:
We received clear information about deadlines for submitting the application. The information offered enabled us to understand the application procedures. The priorities and objectives of the Call for Proposals or Programme Guide were clear to us throughout the application process. The three questions are indexed via a principal component analysis into one single score. In the analysis, the principal components will also be presented using means on a 1-9 point scale.
Reliability of the data and interpretation
The results have been statistically tested where relevant, such as when compar-ing means (mean scores) of groups within the sample e.g. between different programmes.
During the analysis the consultant has made direct comments and suggestions interpreting the data instead of just describing it. These are italicized in order to set them out from the rest of the text.

Follow-up on EACEA customer satisfaction analysis
C:\Documents and Settings\Bermimy\My Documents\COWI\Final report\EACEA_Final 221210responseratesupdated.docx
17
.
3.3 Description of the response sample The respondents were asked numerous questions which help describe the pro-jects that they were/are part of and which give a clear picture of what the final response sample looks like based on these descriptive parameters.
In the following section all relevant questions describing the response sample are presented and commented on.
Year of project proposal/selection or implementation The table below shows the distribution of submitted project proposals from 2007 to 2010, as stated by the respondents to the questionnaire.
In what year did you make your application? # % 2007 387 11% 2008 474 14% 2009 1119 32% 2010 1477 43% Total 3457 100%
The table shows that the majority of respondents come from projects that have applied within the last two years. This corresponds well with the fact that re-spondents were asked to evaluate their most recent project, which in turn means that some organisations, who may have applied for projects on several occa-sions, will not be represented in the earlier years. Information pertaining to older, already completed projects was harder to come by, e-mail addresses were at times outdated and in many cases the parties involved were no longer avail-able.
Programme of recipients/grants The following table shows how the grants are distributed across the pro-grammes of the projects in our sample. In which domain did you apply for a grant?
# % # (total population)
% (total population)
Citizenship 737 21% 4.750 16% Culture 448 13% 3.337 13% Lifelong learning 1.306 38% 19.390 7% Erasmus Mundus 262 8% 2.503 10% Media 259 7% 12.572 2% Tempus 144 4% 1.588 9% Youth 301 9% 5.554 5% Total 3.457 100% 49.694 14%
The largest group by far, are respondents with projects within Lifelong learn-ing, accounting for 38 %.With regard to later analysis, the applicants within the various programmes are structurally different and, as a consequence, differ-

Follow-up on EACEA customer satisfaction analysis
C:\Documents and Settings\Bermimy\My Documents\COWI\Final report\EACEA_Final 221210responseratesupdated.docx
18
.
ences are to be expected in how the respondents evaluate the service they re-ceived from the unit administrating the programme.
Types of organisations which apply The table below shows how the recipients of the questionnaire have categorised themselves in terms of what type of organisation they work for.
Please identify from the list, the label that most closely describes your organisation
# %
Governmental organisation 99 3% Trade union 11 0% Research institution 139 4% Other (please specify) 174 5% Local or regional public body 376 11% Non-governmental organisation (NGO) 613 18% Organisation in the field of culture, citizenship, youth or education
512 15%
Private person or group of persons 47 1% Enterprise 276 8% Educational institution 1.087 31% Consortium of educational institutions 103 3% Think-tanks 20 1% Total 3.457 100%
The largest group of project holders are the educational institutions. These ac-count for almost a third of the respondents. NGOs, organisations working in the fields of culture, citizenship, youth or education, and local or regional bodies are next, in terms of representation in the sample, with 18, 15 and 11 % respec-tively. The remainder of the groups comprised in the sample are rather small and represent think tanks, private persons and trade unions.
However, there are big differences between the most numerous types of appli-cants within each programme. The table below shows the 3 most common types of applicant organisations from each programme.

Follow-up on EACEA customer satisfaction analysis
C:\Documents and Settings\Bermimy\My Documents\COWI\Final report\EACEA_Final 221210responseratesupdated.docx
19
.
Programme Most frequent type of applicant
Second most frequent type of applicant
Third most frequent type of applicant
Citizenship Local or regional public body (34 %)
Organisation in the field of culture, citi-zenship, youth or education (24 %)
Non-governmental organisation (NGO) (24 %)
Culture Organisation in the field of culture, citi-zenship, youth or education (38 %)
Non-governmental organisation (NGO) (17 %)
Enterprise (13 %)
LLP Educational institu-tion (56 %)
Non-governmental organisation (NGO) (10 %)
Research institution (7 %)
Erasmus Mundus
Educational institu-tion (71 %)
Consortium of educa-tional institutions (16 %)
Media Enterprise (56 %) Organisation in the field of culture, citi-zenship, youth or education (15 %)
Other (13 %)
Tempus Educational institu-tion (79 %)
Consortium of educa-tional institutions (9 %)
Youth Non-governmental organisation (NGO) (71 %)
Organisation in the field of culture, citi-zenship, youth or education (14 %)
Local or re-gional public body (8 %)
Educational institutions are very common in Tempus, Erasmus Mundus and LLP programmes, which could be expected, since these programmes relate to education. The other programmes are also dominated by organisations with a focus corresponding to the content of the programme.
Rejected and accepted applications From all the responses gathered, 40% were from persons whose applications were rejected. This is seen in the table below.
Was your application rejected or accepted? # % Accepted 2066 60% Rejected 1391 40% Total 3457 100%
Inversely, the percentage of accepted projects is 60%. The 'real' distribution based on how the rates are for the programmes varies across programmes, but there is an overall acceptance rate of 40% for all proposals. Thus, accepted pro-posals are overrepresented by 50% in the sample.

Follow-up on EACEA customer satisfaction analysis
C:\Documents and Settings\Bermimy\My Documents\COWI\Final report\EACEA_Final 221210responseratesupdated.docx
20
.
The rate of acceptance varies greatly between the different programmes. This is shown in the table below, where the acceptance rate is given for each of the programmes.
Proportion of accepted projects in response sample
Acceptance rates by programme
Total popu-lation
Response sample
Citizenship 46.4% 57% Culture 29.8% 61% LLP 23.4% 64% Erasmus Mundus 8.4% 48% Media 40.6 69% Tempus 17.5% 41% Youth 31.1% 57%
Media is the programmes with far the highest acceptance rate. At the other end of the scale is the Tempus programme with an acceptance rate of 13%. Again as in the previous overall table the accepted projects are overrepresented in the response sample.
Multi-year grants It is possible to receive multi-annual grants and one year grants. The table be-low shows the distribution of respondents in terms of single-year and multi-year projects.
Did the grant cover activities for more than one year? # % No 935 45% Yes 1130 55% Total 2065 100%
A small majority of respondents were / are involved in projects that receive grants for more than one year. This mainly concerns projects within the educa-tion/LLP field where multi-annual grants are is typical.
Completion of projects More experienced project holders who have completed the whole implementa-tion of a project might have another view of the service provided by EACEA. This is investigated in the following. Among the respondents, 34% indicated that their projects were completed while 66% still had ongoing projects.
As expected, the largest proportion of completed projects arises from the 2007 applications, with the number declining year by year.

Follow-up on EACEA customer satisfaction analysis
C:\Documents and Settings\Bermimy\My Documents\COWI\Final report\EACEA_Final 221210responseratesupdated.docx
21
.
Application Year Completed Yes/No # % (by year) No 135 44% 2007 Yes 174 56% No 220 63% 2008 Yes 127 37% No 479 67% 2009 Yes 240 33% No 543 79% 2010 Yes 147 21% No 1377 67% Overall Yes 688 33%
The explanation for this tendency is that many projects last more than a year and simply have not as yet reached completion.
The following table shows whether or not beneficiaries have previously applied for funding. Two-thirds of all selected projects had submitted applications pre-viously.
Has your organisation submitted more than one pro-posal in the period 2007 - 2010?
# %
No 680 33% Yes 1385 67% Total 2065 100%
Between the programmes we again find big differences in the percentage of repeat applicants. The rates for the different programmes are shown in the table below.
Repeat applicants by programme
No Yes % repeat applicants
Citizenship 161 260 62 % Culture 125 148 54 % LLP 252 584 70 % Erasmus Mundus 33 93 74 % Media 66 113 63 % Tempus 13 46 78 % Youth 30 141 82 %
As is seen in the table, the Youth and Tempus programmes are where most ap-plicants apply more than once. More than 4/5 of the respondents within the youth programme are repeat applicants. The lowest rates is found in the Culture programmes, where only 54% reapply, followed by Citizenship and Media, where only 62/63% reapply.

Follow-up on EACEA customer satisfaction analysis
C:\Documents and Settings\Bermimy\My Documents\COWI\Final report\EACEA_Final 221210responseratesupdated.docx
22
.
4 Analysis of client satisfaction and organisational performance
This chapter has the following structure: A section detailing overall satisfaction with EACEA and providing information on sub-groups in the sample. Three sections are dedicated to exploring the themes of transparency, accuracy and timeliness in the selection/proposal and implementation phases. This is fol-lowed by two brief sections on quality of information and the new e-form. Next, a chapter on a) the development of the agency since 2007, b) an overview of the programmes in terms of performance on transparency, accuracy and timeliness and, lastly, c) a focus on rejected applications and their response dif-ferences as compared to accepted applications. Finally, the free text assess-ments from the survey are illustrated in terms of some overall trends noticed in the material.
It should be noted that the survey reflects the views and assessments of the re-spondents. Respondents often do not have total insight into the actual function-ing of the programme. Thus the responses are to be understood as the respon-dents’ views alone and not as an objective description of the programme.
4.1 Overall satisfaction of beneficiaries 1985 respondents answered the question on overall satisfaction with the pro-gramme management services provided during the entire project period. This question was only put to beneficiaries of the programme who are implementing or have implemented a project. The mean score on this question (scale 1-9) is 2.65, which compares favourably to 2.84 in the last client satisfaction survey implying a) that overall satisfaction is quite high and b) that satisfaction is slightly higher now than was previously the case. However, the difference in mean score, compared to the previous sur-vey, is not markedly significant. Due to sample variation, the mean score varies slightly. This is expressed by a 95% confidence interval, i.e. with a likelihood of 95 out of a 100, the score is within the interval. The 95 % confidence interval of the current mean score of 2.65 tells us that the mean score for satisfaction for all accepted projects lies somewhere between 2.52 and 2.78.

Follow-up on EACEA customer satisfaction analysis
C:\Documents and Settings\Bermimy\My Documents\COWI\Final report\EACEA_Final 221210responseratesupdated.docx
23
.
The distribution of answers to the question is shown in then next table.4
We are satisfied with the overall quality of the pro-gramme management services provided during the whole project period
# %
1 = Agree strongly 467 23% 2 567 27% 3 345 17% 4 134 6% 5 112 5% 6 41 2% 7 30 1% 8 24 1% 9 = Totally disagree 21 1% Don't know/not relevant 324 16% Total 2065 100%
As the low mean score indicates, answers are concentrated on options 1, 2 and 3. The high-end rating is 50%, which is quite common in the questionnaire. The low-end rating is 10 % indicating that 1 in 10 respondents disagreed to some degree with the statement. However, about half of these are in category 5, which indicates only a very mild disagreement.
The rather large proportion of "Don't know/not relevant can be explained by the fact that many beneficiaries have not yet gained enough experience with the agency's services because their project has just begun.
Differences can be found between completed projects with different time spans, as seen in the following graph:
4 Please note that the scale for this question has changed since last survey. Previously the scale endpoints were defined as '1 = Agree' and '9 = Disagree'. It is easy to compare ques-tions which use different scales but it is generally not recommended. A further note of cau-tion in regard to this specific case: The wording on the end-points is not symmetric (the word strongly in 'Strongly agree' not being as extreme as the word totally in 'Totally dis-agree'). This might sway respondents towards agreement more readily than if the scale had been totally symmetric. If this is the case, there may also be some challenges in comparing scores from this survey with those from the last survey.

Follow-up on EACEA customer satisfaction analysis
C:\Documents and Settings\Bermimy\My Documents\COWI\Final report\EACEA_Final 221210responseratesupdated.docx
24
.
2,8
2,5
1 2 3 4 5 6 7 8 9
Overall satisfaction for completed projects with different project durations
Completed projects lasting up to one year Completed projects lasting more than one year
There is a tendency for projects lasting under one year to be more satisfied after completion. This could be explained by the fact that projects running over sev-eral years have more administrative and reporting obligations and would have a greater knowledge and understanding of the programme itself and, in turn, more suggestions for improvement than projects of shorter duration. This is the theme covered in the next section.
4.1.1 Satisfaction of beneficiaries by programme By splitting the answers to the question on satisfaction according to pro-gramme, we obtain the following information. The table shows the mean score of overall satisfaction for each of the programmes for both this and the previous survey from 2008:
Programme: # Mean score of satisfac-tion (2007 -
2010)
# previ-ous sur-
vey
Mean score of satisfac-
tion in previ-ous survey
Citizenship 357 2,5 331 2,9 Culture 236 2,6 112 2,9 LLP 678 2,6 481 3,0 Erasmus Mundus 101 3,0 59 2,8 Media 163 2,2 193 2,4 Tempus 45 2,2 - - Youth 161 3,0 133 2,7
There are marked differences in the mean scores. Programmes such as 'Media' and 'Tempus' achieve the highest satisfaction levels (lowest means), and the Erasmus Mundus and Youth projects receive the lowest assessment in terms of satisfaction. It is only these four programmes which deviate significantly from the common mean score of 2.7 (2.65).
Compared to the satisfaction score obtained in the previous survey all pro-grammes have an improved score with the exception of the Erasmus Mundus and Youth programme. Both had a better score in the previous survey.

Follow-up on EACEA customer satisfaction analysis
C:\Documents and Settings\Bermimy\My Documents\COWI\Final report\EACEA_Final 221210responseratesupdated.docx
25
.
However, there are interesting differences when comparing the scores over the years. The mean score for each programme for each year is shown in the table below.
2007 2008 2009 2010 Citizenship Too few cases 2,42 2,56 2,54 Culture 2,78 2,88 2,56 2,49 LLP 2,73 2,63 2,68 2,58 Erasmus Mundus Too few cases Too few cases 3,49 2,46 Media 2,70 1,76 2,14 2,09 Tempus Too few cases Too few cases 2,35 1,80 Youth Too few cases 3,54 3,04 2,78
All programmes seem to have stayed the same or improved slightly since 2007. However, the Youth and Erasmus Mundus programmes, which have the lowest satisfaction (highest score), have seen significant improvement since 2007 compared to other programmes. This is an important finding.
4.1.2 Development of overall satisfaction In the report, we have looked at the development over the years on an overall level. The mean score is shown in the graph below. As can be seen, there is a positive development in overall satisfaction since 2007.
2,5
2,7
2,6
2,7
1 2 3 4 5 6 7 8 9
Overall satisfaction with the service provided to beneficiaries - year-by-year comparison
2007 2008 2009 2010
The development shown in the graph has tested significant, meaning that that it is a real change and not simply random variation
If we take a look at the previous customer survey from 2008, we can see that the increase in the proportion of persons who agree to the statement is a con-tinuous trend. The next table also includes the results from the previous survey.

Follow-up on EACEA customer satisfaction analysis
C:\Documents and Settings\Bermimy\My Documents\COWI\Final report\EACEA_Final 221210responseratesupdated.docx
26
.
The overall mean score in the previous survey was 2,84 compared to 2,65 in the new survey. The overall score reveals a trend of respondents agreeing more to the statement than in previous years.
Year 2003- 2005
2006 2007-2008 First EACEA satisfaction survey Score 3,1 2,9 2,8
Year 2007 2008 2009 2010 Second EACEA satis-faction survey
Score 2,7 2,6 2,7 2,5
Even though the timelines are not directly comparable, the trend is clear and shows a decline in the score over time, implying that the overall satisfaction with programme management during the implementation phase has increased.
4.1.3 Satisfaction and knowledge of the programme The following graph shows that respondents who have had more than one pro-posal accepted between 2007 and 2010 are slightly more satisfied than those who have only submitted one application.
2,8
2,6
1 2 3 4 5 6 7 8 9
Overall satisfaction by number of applications in the years 2007-2010
More than one proposal submitted in the years 2007-2010 Just one proposal submitted in the years 2007-2010
The 'relatively' high number of applicants who have had more than one pro-posal accepted seems to positively influence programme evaluation. This could however be because, having applied previously, they have a better understand-ing of the processes and procedures than a first-time applicant.
4.2 Transparency The first of the evaluation's three main themes is transparency. Transparency is, in this context, defined as: how clearly applicants understand the programme, how well they understand the principles and processes of the programme and how clearly this is communicated from the agency. This theme addresses both the proposal/selection phase and the implementation phase.

Follow-up on EACEA customer satisfaction analysis
C:\Documents and Settings\Bermimy\My Documents\COWI\Final report\EACEA_Final 221210responseratesupdated.docx
27
.
4.2.1 Transparency in the proposal/selection phase A high degree of transparency, starting with the proposal phase, is important for the reputation of the programme as this is where first impressions are made, both for those who are successful in their application for funding and those who are not.
2,4
3,3
1 2 3 4 5 6 7 8 9
Transparency in selection phase
We understood the principles of the selection procedure (different steps, award criteria , selection decisions). We understood easily under which programme (or action) our organisation could apply for EU funding.
The lower of the two bars relates to a question about selecting which pro-gramme to apply under - a key factor in a successful application procedure. The mean score here is quite low, implying a high level of understanding. The level of the uppermost bar indicates a higher mean score and consequently greater disagreement with the statement in question, even though they still lean to-wards agreement with the statement. This statement asks whether or not appli-cants understood the selection principles. The mean score is one of the highest in the entire survey. This is explained by the fact that rejected projects respond negatively to this statement, as can be seen in the next graph.
2,4
3,5
1 2 3 4 5 6 7 8 9
Transparency during the proposal/selection phase - comparison of rejected and accepted proposals
Average for rejected proposals Average for accepted proposals
For projects which were accepted, respondents express a greater degree of agreement with the question, than those who were rejected. The depicted dif-ference in the mean score is statistically significant.

Follow-up on EACEA customer satisfaction analysis
C:\Documents and Settings\Bermimy\My Documents\COWI\Final report\EACEA_Final 221210responseratesupdated.docx
28
.
A plausible explanation could be that a good understanding of the application process facilitates submitting a project proposal of good quality which in turn increases the likelihood of receiving EU funding.
Supporting this interpretation, is the fact that subsequent analysis shows that recurrent applicants have better mean score on the question of principles for selection, which indicates that there might well be a learning curve in under-standing the principles.
4.2.2 Transparency in the implementation phase In terms of transparency during the implementation phase, clarity in relation to formalities and procedures is an important aspect. The scores for questions re-lating to this theme are illustrated in the next graph. Please note that the re-sponses, on which the graphs are based, are all are from approved projects.
3,0
2,9
3,1
1 2 3 4 5 6 7 8 9
Transparency during the implementation phase - clarity of information material
The process of monitoring our project by the EU was clear to us.
The instructions given on reporting procedures were clear.
The contract was easy to understand.
There are no differences of note and the mean scores are relatively positive, but could potentially be lower and resemble those in the next graph.
2,6
2,5
1 2 3 4 5 6 7 8 9
Transparency during the implementation phase - clarity of communication
The answers received to questions were clear.
We knew/know who to contact if we had/have a question about implementing our project (contact person, mailbox, phone number, hotline...) .

Follow-up on EACEA customer satisfaction analysis
C:\Documents and Settings\Bermimy\My Documents\COWI\Final report\EACEA_Final 221210responseratesupdated.docx
29
.
Clarity in communication exhibits some of the highest agreement levels of all questions posed regarding the implementation phase, with scores of 2.5 and 2.6. Respondents express high agreement to the statement about receiving clear an-swers and (statistically speaking) equally high agreement on knowledge about who to contact for additional information.
4.3 Accuracy The second theme is accuracy. Accuracy is, in this context, defined as, how clearly the 'message' on principles and processes of the programme is commu-nicated to the applicants and project holders. As with the previous theme of transparency, accuracy is measured in both the proposal/selection phase and the implementation phase.
4.3.1 Accuracy in the proposal/selection phase Accuracy in the proposal/selection phase is addressed by three questions. As can be seen in the following graph, each of the three questions have approxi-mately the same low mean score, indicating that the agency performs rather well, in terms of accuracy, in the proposal phase.
2,9
2,9
3,0
1 2 3 4 5 6 7 8 9
Accuracy during the proposal/selection phase
We received clear information about deadlines for submitting the application.
The information offered enabled us to understand the application procedures.
The priorities and objectives of the Call for Proposals or Programme Guide were clear to us throughout the application process.
Most applicants agree that they have received clear information on submission deadlines and that they were informed about and understood application proce-dure.
4.3.2 Accuracy in the implementation phase In terms of accuracy in the implementation phase, the project holders are much more divided on the two questions relating to service. On one level, most agree that they are satisfied with the quality of the information and advice provided during this phase. The mean score for this statement reflects a similar opinion in many of the other questions.

Follow-up on EACEA customer satisfaction analysis
C:\Documents and Settings\Bermimy\My Documents\COWI\Final report\EACEA_Final 221210responseratesupdated.docx
30
.
3,8
3,0
1 2 3 4 5 6 7 8 9
Accuracy during the implementation phase
During the implementation phase, we were satisfied with the quality of information and advice provided.
The administrative burden was reasonable compared to the size of the grant and the scale of the project.
However, with regard to the assessment of the administrative burden in com-parison to the size of the grant and scale of the project, results are less positive. With a score of 3,8 this is one of the questions with least agreement to the statement. The low-end rating (5-9) for this question is 28 % with almost 10 % of responses in total or almost total disagreement. Whether or not this is a rea-sonable assessment by respondents, the survey cannot clarify. The Agency has the obligation to monitor the efficient and sound financial management of fund-ing awarded. The challenge is to find the right balance.
4.4 Timeliness The third theme is timeliness. Timeliness is defined as the agency's ability to respond within deadlines and timing of service delivery. The timeliness theme is also measured in both the proposal/selection and implementation phases.
4.4.1 Timeliness in the proposal/selection phase Timeliness in the proposal/selection phase is addressed by two questions: Whether or not the announced deadlines were kept and whether or not the sub-mission deadline was realistic. Looking at the second question first, the graph below shows a very low score of 1,9. This indicates almost all respondents agree that the deadlines are adequate.
1,9
3,0
1 2 3 4 5 6 7 8 9
Timeliness during the proposal/selection phase
We received a reply on the selection results within the deadlines announced in the Call for Proposals or Programme Guide. The deadline for submission was sufficiently long for us to prepare our application

Follow-up on EACEA customer satisfaction analysis
C:\Documents and Settings\Bermimy\My Documents\COWI\Final report\EACEA_Final 221210responseratesupdated.docx
31
.
The second question has a mean score of 3,0, indicating that respondents gen-erally agree that selection results were received within the announced dead-lines. While most responses fall within the higher level, the low-end rating is 21%, indicating that up to 1 in 5 may not have received their reply on time.
It has been tested whether this tendency have changed over the year and if there is a trend to be found in the data, it is that there has been a small decrease in the respondents' agreement with the statement between 2008 till 2010. It is, however, minimal and statistically insignificant.
A new question, with a slightly different angle on the timeliness factor during the selection phase has been introduced since the last satisfaction survey. The question is shown in the table below. 19% did not know the answer or did not deem the question relevant.
We received our contract within two months of being informed that our project was selected.
# % (all) % (only appli-cable)
Don't know/not relevant 392 19% - No 267 13% 16% Yes 1406 68% 84% Total 2065 100% 100%
Of responses, where the question was deemed relevant (or where the answer was known), 84% of respondents said that they received the contract within two months of signature.
Based on the questions in the survey a timeliness factor score has been devel-oped. In the figure below the score is used to show the relative differences be-tween the programmes.
3,1
3,1
2,5
2,9
3,0
2,9
3,1
1 2 3 4 5 6 7 8 9
Timeliness in selection phase - by programme
Citizenship Culture LLP Erasmus Mundus Media Tempus Youth

Follow-up on EACEA customer satisfaction analysis
C:\Documents and Settings\Bermimy\My Documents\COWI\Final report\EACEA_Final 221210responseratesupdated.docx
32
.
As can be seen in the figure, the Media programme has a much lower score in terms of timeliness in the delivery of services in the selection phase. The differ-ences between the rest of the scores are not statistically significant.
4.4.2 Timeliness in the implementation phase Timeliness in the implementation phase is addressed by two questions: One relating to deadlines and one relating to payment of grants in accordance with agreed timeframe. Results are shown in the following graph. In comparing ability to respond in due time between the two phases, more respondents agree with the statement in the implementation phase than in the proposal/selection phase.
2,0
2,4
1 2 3 4 5 6 7 8 9
Timeliness during the implementation phase
We are satisfied with the programme management's overall ability to respond within a reasonable time.
The awarded grant was paid in due time (after signing the contract or after approval of the final report).
With a low score of 2,0 there is high agreement that the grant was paid in due time.
An indicator score for the timeliness in the implementation phase has also been developed. The score for each programme is shown in the figure below.
2,4
2,3
2,1
2,6
2,2
2,3
2,1
1 2 3 4 5 6 7 8 9
Timeliness in implementation phase - by programme
Citizenship Culture LLP Erasmus Mundus Media Tempus Youth

Follow-up on EACEA customer satisfaction analysis
C:\Documents and Settings\Bermimy\My Documents\COWI\Final report\EACEA_Final 221210responseratesupdated.docx
33
.
The score of the Erasmus Mundus programme is higher than for the other pro-grammes with a score of 2,6, meaning that this programme lags behind the oth-ers in performance on this one factor. The best score is for the Citizenship and Media programmes with a score of 2,1.
4.5 Quality of information The quality of information theme consists of two questions which relate to the implementation phase. The mean scores for the statement are shown in the graph below.
3,0
2,9
1 2 3 4 5 6 7 8 9
Quality of information
In the start-up phase, we were satisfied with the quality of information and advice provided.
During the implementation phase, we were satisfied with the quality of information and advice provided.
There is no significant difference between the two. The mean score is also on a par with the general average in the survey, indicating a generally high level of information quality.
When comparing the average scores across domains the Erasmus Mundus and Youth programmes stand out as having much higher scores than the rest indi-cating that there is room for improvement in the quality of information that the two programmes provide to their beneficiaries. The numbers are shown in the figure below.
3,4
2,7
2,3
3,6
2,9
3,1
2,9
1 2 3 4 5 6 7 8 9
Quality of information in implementation phase - by programme
Citizenship Culture LLP Erasmus Mundus Media Tempus Youth

Follow-up on EACEA customer satisfaction analysis
C:\Documents and Settings\Bermimy\My Documents\COWI\Final report\EACEA_Final 221210responseratesupdated.docx
34
.
4.6 The E-form The electronic application form (e-form) is intended as an easy interface for composing and submitting applications. At present, 76% of all applicants say that they submit their application using the e-form. This is a real step towards minimising the amount of time spent on administering and handling paper ap-plications. The table below shows the number of applicants who have used the e-form when submitting their application.
Did you submit your application using an elec-tronic application form?
# %
No 459 24% Yes 1488 76% Total 1947 100%
The numbers in the table include only those who had the opportunity to use the e-form for application during the period from 2007 to 2010.
The e-form has been introduced by the different programmes at different times and in different stages making it difficult to compare the use of e-form for the programmes for each year. The table below shows the percent of applicants who used the e-form in the 2010 application round.
Programme % of applications using e-form in 2010
Citizenship 97 % Culture 65 % LLP 83 % Erasmus Mundus 79 % Media 28 % Tempus 96 % Youth 0%
The Citizenship and Tempus programmes are the programmes for which the e-form was used most extensively. Applicants to the media programme used it least, which is probably to be expected since application by e-form was only introduced in March 2010 for media.
An important factor is whether or not applicants find the e-form clear and easy to complete. The distribution of responses to this question is given in the fol-lowing table that shows the replies from 2010 applications only.
Follow-up on EACEA customer satisfaction analysis
C:\Documents and Settings\Bermimy\My Documents\COWI\Final report\EACEA_Final 221210responseratesupdated.docx
35
.
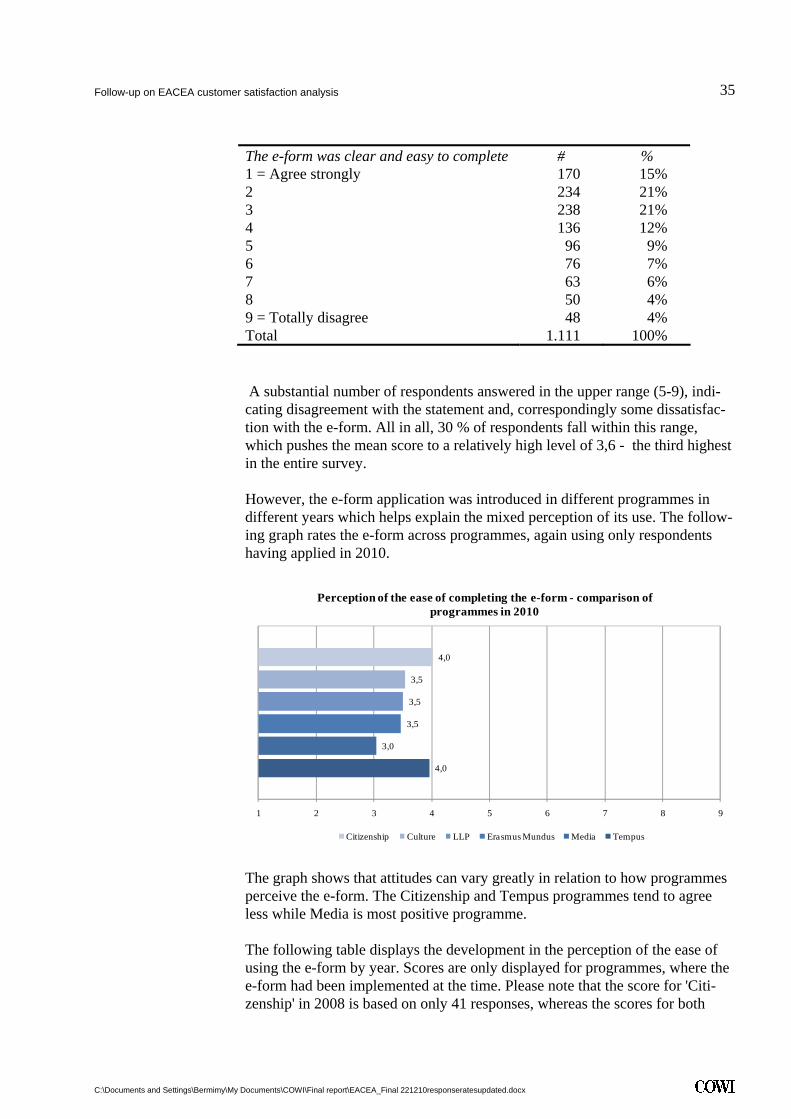
The e-form was clear and easy to complete # % 1 = Agree strongly 170 15% 2 234 21% 3 238 21% 4 136 12% 5 96 9% 6 76 7% 7 63 6% 8 50 4% 9 = Totally disagree 48 4% Total 1.111 100%
A substantial number of respondents answered in the upper range (5-9), indi-cating disagreement with the statement and, correspondingly some dissatisfac-tion with the e-form. All in all, 30 % of respondents fall within this range, which pushes the mean score to a relatively high level of 3,6 - the third highest in the entire survey.
However, the e-form application was introduced in different programmes in different years which helps explain the mixed perception of its use. The follow-ing graph rates the e-form across programmes, again using only respondents having applied in 2010.
4,0
3,0
3,5
3,5
3,5
4,0
1 2 3 4 5 6 7 8 9
Perception of the ease of completing the e-form - comparison of programmes in 2010
Citizenship Culture LLP Erasmus Mundus Media Tempus
The graph shows that attitudes can vary greatly in relation to how programmes perceive the e-form. The Citizenship and Tempus programmes tend to agree less while Media is most positive programme.
The following table displays the development in the perception of the ease of using the e-form by year. Scores are only displayed for programmes, where the e-form had been implemented at the time. Please note that the score for 'Citi-zenship' in 2008 is based on only 41 responses, whereas the scores for both

Follow-up on EACEA customer satisfaction analysis
C:\Documents and Settings\Bermimy\My Documents\COWI\Final report\EACEA_Final 221210responseratesupdated.docx
36
.
2009 and 2010 are based on approximately 200 responses each year, giving much greater reliability for the scores from those two years. There is no notable trend across the years.
Development in perception of the ease of completing e-form from 2007-2010 (only where relevant)
2007 2008 2009 2010
Citizenship Too few 3,33 4,0 3,8 Culture No e-
form No e-form
3,5 3,7
LLP No e-form
No e-form
3,5 3,5
4.7 Development of the Agency since 2007 Instead of simply comparing previous and current performance to evaluate pro-gress, respondents were asked whether or not they have noticed an improve-ment in the way projects are handled. See the following graph.
3,0
1 2 3 4 5 6 7 8 9
Perceived improvement since 2007
Since 2007, we have noticed an improvement in the way our projects have been handled by the EU organisation.
The mean score in perceived improvement since 2007 is 3. This is a good score given that one might not have expected that a large proportion would have ex-perienced improvement, since the 2008 evaluation was also quite positive.
Keeping this favourable mean score in mind, it is worth noting that the low-end rating (scores 5-9) is 16%. This could be interpreted as a small group of re-spondents have experienced no improvement (or a worsening) in the manner in which projects are handled, hence their disagreement. If 'don't know' answers are excluded, the low-end rating increases to 20%.
We have also split the sample according to programme, as done in other sec-tions, which reveals some interesting detail. This is shown in the following graph.

Follow-up on EACEA customer satisfaction analysis
C:\Documents and Settings\Bermimy\My Documents\COWI\Final report\EACEA_Final 221210responseratesupdated.docx
37
.
3,5
2,5
2,8
3,1
3,2
2,3
2,9
1 2 3 4 5 6 7 8 9
Comparing perceived improvement since 2007 by programme
Citizenship Culture LLP Erasmus Mundus Media Tempus Youth
Most noteworthy is the fact that Culture and Tempus programmes have many applicants who have experienced improvement and therefore score significantly better than the other areas. By looking at what has been done within these two programmes, in terms of project handling, since 2007, there may be some "best practices" to learn from.
Of special note is one programme which scores higher than all others, namely the 'Youth' programme. Here responses tend to disagree more with the state-ment. The difference - compared to the common mean score - is statistically significant. The high score here is slightly puzzling, since Youth is, at the same time, the area where there has been the most improvement in terms of overall satisfaction (see relevant page 25).
4.7.1 Overview of the development in accuracy, timeliness and transparency
An indicator has been developed that helps to illustrate development in the per-ceived delivery of services from the agency over the years. This consists of a factor score which sums up the questions under each theme. The development in proposal/selection and implementation phases has been calculated for all in-dicators across the years.
The differences in indicator score between the years have been tested to deter-mine whether the development is significant in statistical terms. The testing shows that the only score which shows a clear statistical significant change is that for accuracy in the implementation phase.
Accuracy, in relation to delivery of services, has seen a consistent improvement since 2007, and 2010 is the best year so far.

Follow-up on EACEA customer satisfaction analysis
C:\Documents and Settings\Bermimy\My Documents\COWI\Final report\EACEA_Final 221210responseratesupdated.docx
38
.
2,8
3,1
3,2
3,3
1 2 3 4 5 6 7 8 9
Accuracy in implementation phase - year-by-year comparison
2007 2008 2009 2010
4.8 Differences between the programme In the following section, the relative differences in delivery of service between the programmes are highlighted in terms of their mean factor score. Again, the mean scores are used to illustrate the differences between the service pro-grammes. The mean score is shown for each programme in following matrixes. In the matrixes, the columns next to that showing the mean score show the dif-ference in scores in relation to other programmes. Only statistically significant differences are included in the table matrix.
4.8.1 Timeliness In relation to timeliness in selection phase, the Media programme distinguishes itself from the others by having a low mean score of 2,5. The highest score is 3,1 for the Tempus, Youth and Citizenship programme, and - with the excep-tion of the Media domain - all other domains lie close to this level.
Timeliness in pro-posal/ selection phase
Mean Cit Cult LLP Era Med Temp Youth
Citizenship 3,1 -
Culture 2,9 - LLP 3,0 - Erasmus Mundus 2,9 - Media 2,5 -0,6 -0,4 -0,5 -0,3 - Tempus 3,1 0,5 - Youth 3,1 0,6
The same trend can be found in the timeliness score for the implementation phase, where Media again has the lowest score – along with Citizenship the highest scores are found in the Erasmus Mundus and Youth programmes, which were also among the highest scores for the proposal phase. Citizenship

Follow-up on EACEA customer satisfaction analysis
C:\Documents and Settings\Bermimy\My Documents\COWI\Final report\EACEA_Final 221210responseratesupdated.docx
39
.
scores in the good end on this indicator, whereas the score was much higher for the selection phase.
Timeliness in implementation phase
Mean Cit Cult LLP Era Med Temp Youth
Citizenship 2,1 - Culture 2,3 - LLP 2,2 - Erasmus Mun-dus
2,6 0,5 0,4 -
Media 2,1 -0,5 - Tempus 2,3 - Youth 2,4 -
4.8.2 Transparency The domains with the best transparency in the proposal/selection phase are LLP and Erasmus Mundus. However, the numerical difference between these and the other domains is small.
The only two exceptions which show significantly higher scores are the Citi-zenship and Youth domains. This mirrors the situation we saw for timeliness in the selection phase with these two domains being those with the highest scores again.
Transparency in proposal/selection phase
Mean Cit Cult LLP Era Med Temp Youth
Citizenship 3,1 - Culture 2,8 -0,3 - LLP 2,7 -0,5 - Erasmus Mundus 2,7 -0,4 - Media 2,7 -0,4 - Tempus 2,8 -0,3 - Youth 3,1 0,3 0,4 0,4 0,4 -
The scores above also reflect to some degree the different application process and criteria in each programme. Transparency is a particularly important aspect when making applications for the programmes since it is a prerequisite for un-derstanding how the applications should be made since. This is due to the fact that the level of detail given to non-selected project differs from one pro-gramme to another. It depends on a number of factors including the number of applications and the scale of the projectThis is reflected in the following table which shows the transparency indicator score for each programme.

Follow-up on EACEA customer satisfaction analysis
C:\Documents and Settings\Bermimy\My Documents\COWI\Final report\EACEA_Final 221210responseratesupdated.docx
40
.
Transparency in selection phase compared for rejected and accepted projects across programmes
Mean - Rejected
Mean - Accepted Difference
Citizenship 4,0 2,4 -1,6 Culture 3,8 2,2 -1,6 LLP 3,1 2,4 -0,7 Erasmus Mundus 3,1 2,3 -0,8 Media 3,8 2,2 -1.6 Tempus 3,1 2,4 -0,7 Youth 3,7 2,6 -0,9
The table shows that the mean score is higher for the rejected applicants, mean-ing that they don't see the selection process as transparent. An interesting point is that while the accepted projects are fairly similar in score the rejected appli-cants vary to a great extent. In the views of the rejected applicant the Citizen-ship, Media, Culture and Youth programmes seems to be the least transparent and LLP, Erasmus and Tempus to be the most transparent.
During the implementation phase, this picture differs slightly from that seen for the proposal/selection phase.
Transparency in implementation phase - clarity
Mean Cit Cult LLP Era Med Temp Youth
Citizenship 2,9 - Culture 3,1 - LLP 2,9 - Erasmus Mun-dus
3,1 -
Media 2,9 - Tempus 2,7 -0,4 - Youth 3,3 0,4 0,5 -
The best performing domain in relation to transparency are Tempus and Media, but the score is not significantly different from the Citizenship and LLP do-mains. The Youth programme has a higher absolute score than the other do-mains, but the score is only significantly higher when comparing with Media and LLP.
In terms of transparency - clarity of communication in the implementation phase, Media and Tempus score well below the other domains. In contrast, we have the Youth and Erasmus Mundus domains which score higher than the other domains.

Follow-up on EACEA customer satisfaction analysis
C:\Documents and Settings\Bermimy\My Documents\COWI\Final report\EACEA_Final 221210responseratesupdated.docx
41
.
Transparency in implementation phase - clarity in communication
Mean Cit Cult LLP Era Med Temp Youth
Citizenship 2,4 - Culture 2,4 - LLP 2,4 - Erasmus Mun-dus
2,7 -
Media 1,9 -0,5 -0,5 -0,5 -0,8 - Tempus 2,1 -0,6 - Youth 2,8 0,4 0,4 0,4 0,9 0,6 -
A closer look at the data reveals three groups: A low group (Media and Tem-pus), a high group (Erasmus and Youth) and the remainder.
4.8.3 Accuracy Scores for accuracy in the proposal/selection phase is where we find the biggest variation in scores. The score for Citizenship is significantly higher than that for all other domains. It is followed by Culture.
Accuracy in pro-posal/selection phase
Mean Cit Cult LLP Era Med Temp Youth
Citizenship 3,0 - Culture 2,7 -0,3 - LLP 2,4 -0,6 -0,4 - Erasmus Mundus 2,6 -0,4 0,3 - Media 2,4 -0,6 -0,3 -0,2 - Tempus 2,2 -0,8 -0,5 - Youth 2,6 -0,4 0,2 0,4 -
Tempus has the overall lowest score for this indicator, with a difference of 0,8 points between it and the highest (Citizenship).
In terms of accuracy during the implementation phase, there are minor differ-ences between the various domains. Citizenship shows the lowest score and Erasmus Mundus and Youth the highest. As we have seen before, Citizenship moves from the highest to the lowest scores, when we compare the selection and the implementation phase. It should, however, be noted that the relative differences between programmes, such as, programme funding structure, some more complex than others, might be reflected in the scores.

Follow-up on EACEA customer satisfaction analysis
C:\Documents and Settings\Bermimy\My Documents\COWI\Final report\EACEA_Final 221210responseratesupdated.docx
42
.
Accuracy in im-plementation phase
Mean Cit Cult LLP Era Med Temp Youth
Citizenship 2,8 - Culture 3,1 - LLP 3,2 0,4 - Erasmus Mun-dus
3,3 0,4 -
Media 2,8 -0,4 -0,5 - Tempus 3,0 - Youth 3,4 0,5 0,6 - The only statistically significant difference is between the lowest and second highest score.
4.9 Rejected proposal/selections Ensuring that rejected applicants are well treated and are left with a positive impression is an important objective for the EACEA. It is vital that applicants who are rejected receive a clear explanation for the rejection. The degree to which this occurs was measured in the survey and the results are shown in the following table.
We received a clear explanation on why the ap-plication was rejected
# %
1 = Agree strongly 157 11% 2 186 13% 3 190 14% 4 116 8% 5 125 9% 6 97 7% 7 122 9% 8 100 7% 9 = Totally disagree 265 19% Don't know/not relevant 33 2% Total 1391 100%
Agreement with this question is quite low. The high-end rating is the lowest in the entire survey at just 24 % and more than half disagree. 19% of respondents express total disagreement, which is a startlingly high figure given the distribu-tion of responses for most other questions. In the previous (2008) survey 40% disagreed, so there has been a marked improvement.5
5 However, this improvement might be largely influenced by that fact that the option for most extreme disagreement is labelled 'Totally disagree' in this survey, whereas in the pre-vious survey it was 'Disagree'.

Follow-up on EACEA customer satisfaction analysis
C:\Documents and Settings\Bermimy\My Documents\COWI\Final report\EACEA_Final 221210responseratesupdated.docx
43
.
5,0
1 2 3 4 5 6 7 8 9
Perceived clarity of explanation for rejection of proposal
We received a clear explanation on why the application was rejected.
The mean score for this question is 5, which is by far the highest mean score in the entire survey. This score indicates that it is necessary to work on how rejec-tions are explained. If we look at the other variables which could affect, and which may in part explain the result on clarity regarding the explanation for rejection, we see a marked correlation to responses to the question on whether or not respondents '…. understood the principles of the selection procedure (different steps, award criteria, selection decisions)'. A solution could be greater focus on increasing awareness about selection principles and criteria, also mentioned in the discussion on transparency in the proposal/selection phase. Clarity of the explanation given to rejected applicants is a particularly impor-tant aspect of making applications for the programmes since it is a prerequisite for understanding how the applications should be made. The level of detail given varies from programme to programme as it depends on a number of prac-tical factors, including the number of applicants and the level of funding. Gen-erally speaking applicants for large mulitannual projects can expect a more de-tailed explanation than applications for smaller projects, in part because the number of applications received for smaller levels of funding is so much greater.. The differences between the programmes are shown in following fig-ure.
4,8
6,2
6,0
4,6
4,5
4,6
5,7
1 2 3 4 5 6 7 8 9
Perceived clarity of explanation for rejection of proposal - comparison of programmes
Citizenship Culture LLP Erasmus Mundus Media Tempus Youth
The figure shows that the Citizenship, Media and Tempus programmes have the lowest clarity in explaining reasons for rejection according to the respon-

Follow-up on EACEA customer satisfaction analysis
C:\Documents and Settings\Bermimy\My Documents\COWI\Final report\EACEA_Final 221210responseratesupdated.docx
44
.
dents. This indicates that possible improvements in this should be addressed by these programmes.
In the following table, we take a closer look at the variations between mean scores for the questions generating the transparency indicator for applications that were accepted and those that were rejected.
Comparable questions for accepted and rejected projects
Mean - Rejected
Mean - Accepted
Difference
We understood easily under which programme (or action) our organisa-tion could apply for EU funding
2,8 2,2 -0,7
The priorities and objectives of the Call for Proposals or Programme Guide were clear to us throughout the application process
3,5 2,5 -1,0
The information offered enabled us to understand the application procedures
3,4 2,6 -0,8
The e-form was clear and easy to com-plete
3,9 3,3 -0,6
The deadline for submission was suffi-ciently long for us to prepare our ap-plication
2,2 1,7 -0,5
We received clear information about deadlines for submitting the applica-tion
3,4 2,7 -0,7
We received a reply on the selection results within the deadlines announced in the Call for Proposals or Programme Guide
3,5 2,6 -0,8
We understood the principles of the selection procedure (different steps, award criteria, selection decisions)
4,3 2,7 -1,6
In all cases, rejected applicants voice more disagreement than applicants who were accepted. This is particularly the case for the aforementioned question about understanding the principles of the selection procedure.
It is risky to present the differences cited in the table as a true reflection of the opinion of rejected and accepted applicants, if what we are trying to gauge is their actual perception of the application procedure, at the time of application. The fact they are answering after rejection may negatively influence their reply.
4.10 Free text assessments In the questionnaire, it was possible for the respondent to elaborate on their re-plies using open text fields for comment. There were more than 935 comments on the e-form, 650 relating to the selection phase and almost 1.300 had com-

Follow-up on EACEA customer satisfaction analysis
C:\Documents and Settings\Bermimy\My Documents\COWI\Final report\EACEA_Final 221210responseratesupdated.docx
45
.
ments in the general field at the end of the questionnaire. As it is impossible to include all comments in this report they have been condensed into several gen-eral themes. It should be noted that many of the comments are probably from the more dissatisfied respondents, since this group has a higher tendency to comment, (comments below should this be seen in this light).
4.10.1 Positive comments There are a number of positive comments in the qualitative material. These stem from both rejected and selected projects. The dominant features of the positive comments are:
1 That the personal contact has been good, also in regard to national contact points (see specific sub-section)
2 That EACEA support plays an important role in stimulating European in-tegration. A good example is the following statement: (the) Youth In Ac-tion Program is a great way for youth to connect from parts of Europe and exchange culture and traditions, experiences, creative minds, things you don't study in school , we hope that this program will go on after 2013.
3 That EACEA handles things professionally. However, it is not always clear from the comments received whether or not respondent are aware of the different parts of the agency and who exactly they have had contact with. There are many generally positive responses. However, there are also negative comments, many of which are directed at particular groups of persons e.g. at the external evaluators who are used to assess project pro-posals (see specific sub-section).
4.10.2 Improvement of service over time Many of the comments mention that improvements have been made over time. It is not clear from the comments when this improvement took place, but only that it has occurred or that it is 'in process'. One respondent, after some points of critique, optimistically writes: "Though it is much better than it used to be - so just keep going in this direction". Another comment is more direct: "I was coordinator for a project between 2005-7 and there is a clear, massive im-provement about the whole Agency! Good job!" Some ascribe the improvement to the e-form system; others still see room for improvement (see specific sub-theme on the e-form).
4.10.3 Heavy administration of projects and bureaucracy A common topic in the qualitative comments relate to bureaucracy, which is described as rather heavy. Some commentators acknowledge that EACEA is a part of a larger system, which has to pay specific attention to documentation and unambiguous case handling. Project coordinators need to report back to the Agency on the use of funds for their intended purposes. Depending on the size and the duration of the project, reporting obligations included intermediate

Follow-up on EACEA customer satisfaction analysis
C:\Documents and Settings\Bermimy\My Documents\COWI\Final report\EACEA_Final 221210responseratesupdated.docx
46
.
and/or final reporting on the use of funds and on the effective content and im-plementation of the project. The precise aspects are not revealed in the com-ments. The comments often just mention that project management is burden-some in relation to the documentation requirements from EU. Others feel that the agency has problems related to bureaucratic procedures. Problems that are often mentioned are:
1 Time consuming procedures and slow response times to inquiries. Many
complain that response time from the agency is very slow. This is both in relation to general inquiries and in meeting deadlines, e.g. responses about whether an application has been accepted or not.
2 Lack of transparency in procedures, particular in relation to the applica-tion/selection phase (see relevant sub-section)
3 Small partners are particularly sensitive to bureaucratic problems, as they don't have the same 'muscles' as the larger institutions which apply for EACEA funding. As one respondent mentions there is a structural bias in the programming itself, which might hinder smaller civil society groups or organisations applying. One respondent puts it like this: NGO's based on volunteer work do not have the capacity to do all the required paper-work. It is a pity that we seem to get forced out of the possibility to build Euro-pean projects.
4.10.4 Perception of evaluation criteria for application A very common issue in the qualitative material is the evaluation criteria for project applications. It seems that the criteria are unclear to many respondents. The comments are directed both towards the scoring of the applications as well as the written comments to rejected applications. One respondent describes it in the following manner: We would have appreciated, and indeed would still ap-preciate, more specific information about the way the criteria are applied to applications and what sort of twinning activities and projects would be consid-ered valid. We have twice been rejected for having insufficient European con-tent in our bids but do not know what would meet these criteria.
Some of respondents reported having approached the agency for clarification, but receiving a satisfactory response. There seems to be a need for clearer pro-cedures.
Some of the comments also suggest that there has been a change in priorities over the years. Suggestions for improvement made by the evaluators led to lower scores in the following application round. Whether or not this is due to a change in priorities, communicated via the call for proposals, is not clear from the comments.
The quantitative analysis shows that respondents with rejected applications tend to express greater disagreement when judging the transparency of the selection

Follow-up on EACEA customer satisfaction analysis
C:\Documents and Settings\Bermimy\My Documents\COWI\Final report\EACEA_Final 221210responseratesupdated.docx
47
.
phase. Much of the qualitative negative responses are probably reflected in statements given under comments. It is, however, not possible to know whether or not the application failed because the respondent did not understand the procedure, the quality of the proposal was poor or the respondents see the pro-cedure as less transparent as a result of the rejection.
4.10.5 Lack of or too little response to rejection of projects A great deal of comments relate to the fact that the respondents feel a need to be able to respond to the evaluators who select the projects for support. As evaluations of project proposals are conducted solely based on the information in the application, and the process does not involve any negotiation phase, some applicants consider that evaluators have not understood the content of the application correctly. A more thorough feedback mechanism is wanted by many. It should be noted that this is not related to the general handling of cases in the selection phase. As one respondent put it: It was handled well. But we did not agree with all the critic statements of the evaluation, but did not have pos-sibility to give an answer to the critics. In many of the comments it is also stressed that the need for response is not only to improve understanding of why an application was rejected, but rather to learn how to improve later applica-tions.
4.10.6 Lack of direct/easy contact As mentioned earlier, some of the more positive comments relate to the fact that respondents have experienced a good personal contact with the agency or the national contact. Conversely a lack of direct contact is an issue in many of the more negative comments. The more negative comments describe difficul-ties in contacting the persons responsible for the project in the EACEA admini-stration. They find it hard to contact the agency and often have to make do with e-mails. It is not clear from the comments what the specific inquiries relate to and whether these could have easily been solved by phone. One respondent de-scribe the problem like this: (we) would appreciate more clarity and contact with the project manager for our file, before there is a problem. There is a sense of disconnection between the administrative and content aspects of the work.
4.10.7 New evaluators, contradicting comments for improvement One common, recurring theme is that some respondents have experienced poor or contradictory commenting across different applications. Many ascribe this to new evaluators, who appear to use other judgement criteria than the previous group of evaluators. One respondent describes the problem in the following comment: ...if one team of experts rejects the project application in one year and gives suggestions for improvement, and if the application in the following year took all these recommendations into account, then the "new" evaluation experts should take this into consideration, because nowadays it happens that these "new" evaluators recommend to delete things that the first evaluators suggested to include - this is frustrating for the applicant
Follow-up on EACEA customer satisfaction analysis
C:\Documents and Settings\Bermimy\My Documents\COWI\Final report\EACEA_Final 221210responseratesupdated.docx
48
.
4.10.8 Out of sync A frequent point raised in the comments is that the process cycle is somewhat out of sync with the contexts many applicants work in. The comment below illustrates this well: we saw a problem regarding with the dates when the list of successful proposals was published on the EACEA web site, and the time you gave to send all the information requested (MANDATE LETTER, FINANCIAL CAPACITY FORM, etc.). The list was published the last week of July and you gave 10 days to send all these documents and most of the organization were closed or on holidays. (To) Manage this was a problem. The other things, we must congratulate in the way you gave the info, and the way the contact person you gave us supports us in our doubts. These points are particularly relevant for educational organisations that are closed during the summer or have capac-ity problems due to the start of a new academic year.
4.10.9 Comments on E-forms The questions about the e-form have shown that this is an area of particular im-portance. Almost two-thirds of survey respondents used the e-form for their last application. While many respondents agree that the e-form was clear and easy to complete, almost one-third indicate some form of disagreement with the statement in the questionnaire. This distribution is also illustrated in the com-ments to the form. One the positive side is that many see the e-form as a very useful tool, which is easy to use, but most of the comments are in fact some-what negative. It is clear that a lot of of these comments clearly refer to techni-cal issues encountered in the first generation of e-form, which have subse-quently been resolved and do not apply to the current generation.
Some common themes are described below.
Fields for typing are too small For many of the respondents the limited space for text in the content fields is a problem. This is presumably a more serious problem for larger projects which need to describe several years of work in a limited space.
Technical Issues Many had also experienced problems with the Adobe version made available. Some have described general issues, while others are more particular. A few of the particular comments are:
4 There seems to be trouble when applicants with older versions of Adobe Acrobat Reader try to fill out the forms.
5 The files which need to be uploaded are heavy, implying that with a fully completed form the uploading procedure is slow and uncertain, the system may crash and all the data may be lost.
6 The system is also slow when several people work on it at the same time. This issue is particularly relevant when the deadline for submissions of ap-plications are is near.

Follow-up on EACEA customer satisfaction analysis
C:\Documents and Settings\Bermimy\My Documents\COWI\Final report\EACEA_Final 221210responseratesupdated.docx
49
.
The following comment sums up the impression very well: The software for the e-form in .pdf was really hard to manage. We had to have a newer version of .pdf installed and it did not work properly making it very hard to write on.
Good support A very positive statement which is found in many of the comments is that the support for technical problems worked very well.
Double work Many of the applicants complain that they have to do a lot of double work when working with the forms. These comments are mainly in two areas. The first is that they have to fill in online and then later submit the same work by paper. The second is that many of the questions posed in the form seem to be quite similar, meaning that the users face being asked about the same things again and again.
Functionality Some applicants called for a Copy/paste function in the forms, making it easier to fill in texts. As this functionality exists in the current generation of e-forms, this serves as an example of the type of technical issues which have been re-solved since the first generation of e-fom.

Follow-up on EACEA customer satisfaction analysis
C:\Documents and Settings\Bermimy\My Documents\COWI\Final report\EACEA_Final 221210responseratesupdated.docx
1
.
Annex - Questionnaire Welcome to the EACEA Customer Satisfaction Survey 2010.
Thank you for taking the time to complete this survey6. It should only take 10 minutes.
In order to ensure that your full reply is properly saved, please use only the navigation buttons in the survey, and not those in the browser.
Section 1 (all applications) General information about your application First of all, we would like to ask you for information about the programme un-der which you applied. 1 In what year did you make your application?
2 In which domain did you apply for a grant?
3 Please identify from the list, the label that most closely describes your or-ganisation.7
Section 2 (all applications) Application process The following questions relate to your experience with the application process 2.1 Information on funding opportunities
Please indicate on a scale of 1 to 9 (1 = Agree strongly, 9 = totally disagree)
to what extent you agree with the following 2 statements:
4 We understood easily under which programme (or action) our organisation could apply for EU funding
1 2 3 4 5 6 7 8 9 (Don't know/not relevant)
5 The priorities and objectives of the Call for proposals or programme guide were clear to us throughout the application process
1 2 3 4 5 6 7 8 9 (Don't know/not relevant) 6 All questions are compulsory unless otherwise indicated 7 Select from list: Governmental organisation; Local or regional public body; Non-governmental organisation
(NGO); Organisation in the field of culture, citizenship, youth or education; Private person or group of persons;
Enterprise; Educational institution; Consortium of educational institutions; Think-tanks; Trade union; Research
institution; Other (please specify).

Follow-up on EACEA customer satisfaction analysis
C:\Documents and Settings\Bermimy\My Documents\COWI\Final report\EACEA_Final 221210responseratesupdated.docx
2
.
6 Where did you find out about the programme you applied for funding from? 8
2.2 Information on application procedures Please indicate on a scale of 1 to 9, (1 = Agree strongly, 9 = totally disagree),
to what extent you agree with the following statement:
7 The information offered enabled us to understand the application proce-dures
1 2 3 4 5 6 7 8 9 (Don't know/not relevant)
2.3 Information on the e-form (electronic application form with on-line submission)
8 Did you submit your application using an electronic application form?
Yes/no
9 If yes, please indicate on a scale of 1 to 9, (1 = Agree strongly, 9 = totally disagree),
To what extent you agree with the following statement:
10 The e-form was clear and easy to complete
1 2 3 4 5 6 7 8 9 (Don't know/not relevant)
11 If you have any comments on the e-form, please specify them below optional
2. 4 Information on deadlines Please indicate on a scale of 1 to 9, (1 = Agree strongly, 9 = totally disagree),
to what extent you agree with the following statement:
8 Select from list: Website EACEA / EC / EUROPA; National agency / contact point responsible for the pro-
gramme in my country; Events (EU / other please specify); Other organisations in my field (Please specify); Spe-
cialised press; Other Media (please specify); Other (please specify)
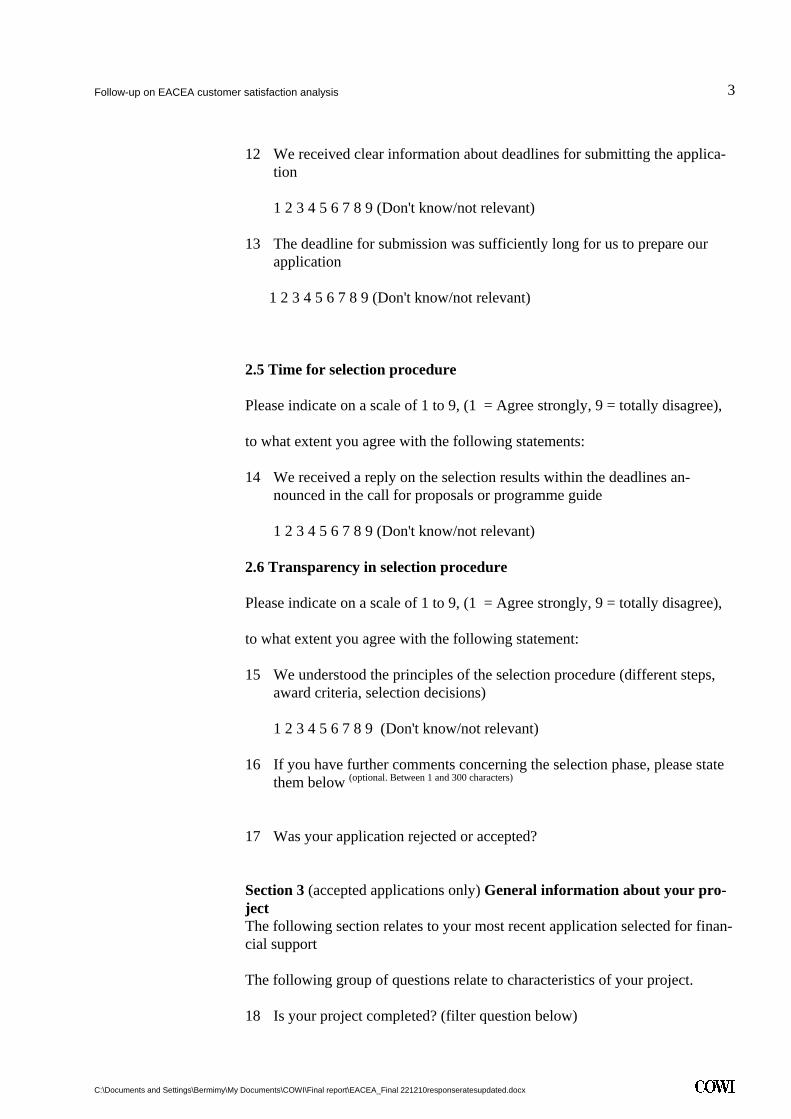
Follow-up on EACEA customer satisfaction analysis
C:\Documents and Settings\Bermimy\My Documents\COWI\Final report\EACEA_Final 221210responseratesupdated.docx
3
.
12 We received clear information about deadlines for submitting the applica-tion
1 2 3 4 5 6 7 8 9 (Don't know/not relevant)
13 The deadline for submission was sufficiently long for us to prepare our application
1 2 3 4 5 6 7 8 9 (Don't know/not relevant)
2.5 Time for selection procedure
Please indicate on a scale of 1 to 9, (1 = Agree strongly, 9 = totally disagree),
to what extent you agree with the following statements:
14 We received a reply on the selection results within the deadlines an-nounced in the call for proposals or programme guide
1 2 3 4 5 6 7 8 9 (Don't know/not relevant)
2.6 Transparency in selection procedure
Please indicate on a scale of 1 to 9, (1 = Agree strongly, 9 = totally disagree),
to what extent you agree with the following statement:
15 We understood the principles of the selection procedure (different steps, award criteria, selection decisions)
1 2 3 4 5 6 7 8 9 (Don't know/not relevant)
16 If you have further comments concerning the selection phase, please state them below (optional. Between 1 and 300 characters)
17 Was your application rejected or accepted?
Section 3 (accepted applications only) General information about your pro-ject The following section relates to your most recent application selected for finan-cial support The following group of questions relate to characteristics of your project. 18 Is your project completed? (filter question below)

Follow-up on EACEA customer satisfaction analysis
C:\Documents and Settings\Bermimy\My Documents\COWI\Final report\EACEA_Final 221210responseratesupdated.docx
4
.
Yes/no 19 What is the total amount of EU funding awarded?
Between 1 and 20 characters 20 Did the grant cover activities for more than one year?
Yes/no
Section 4 (accepted applications only) The contracting phase 4.1 Time between selection and receipt of contract Please indicate if you agree with the following statement:
21 We received our contract within two months of being informed that our project was selected:
Yes / No / Don't know or not relevant
4.2 Understanding of contract
Please indicate on a scale of 1 to 9, (1 = Agree strongly, 9 = I totally disagree), to what extent you agree with the following statement:
22 The contract was easy to understand:
1 2 3 4 5 6 7 8 9 (Don't know/not relevant)
Section 5 (accepted applications only) The implementation phase 5.1 During the project implementation Please indicate on a scale of 1 to 9, (1 = Agree strongly, 9 = totally disagree),
to what extent you agree with the following statements:
23 In the start up phase, we were satisfied with the quality of information and advice provided

Follow-up on EACEA customer satisfaction analysis
C:\Documents and Settings\Bermimy\My Documents\COWI\Final report\EACEA_Final 221210responseratesupdated.docx
5
.
1 2 3 4 5 6 7 8 9, (Don't know/not relevant)
During the implementation phase, we were satisfied with the quality of in-formation and advice provided
1 2 3 4 5 6 7 8 9, (Don't know/not relevant)
5.2 Administrative burden, reporting on progress, and monitoring Please indicate on a scale of 1 to 9, (1 = Agree strongly, 9 = totally disagree),
to what extent you agree with the following statements
24 The instructions given on reporting procedures were clear
1 2 3 4 5 6 7 8 9, (Don't know/not relevant)
25 The administrative burden was reasonable compared to the size of the grant and the scale of the project
1 2 3 4 5 6 7 8 9, (Don't know/not relevant)
26 The process of monitoring our project by the EU was clear to us?
1 2 3 4 5 6 7 8 9, (Don't know/not relevant)
5.3 Payment arrangements - timing Please indicate on a scale of 1 to 9, (1 = Agree strongly, 9 = totally disagree), to what extent you agree with the following statement
27 The awarded grant was paid in due time (after signing the contract or after approval of the final report)
1 2 3 4 5 6 7 8 9, (Don't know/not relevant)
Section 6. (accepted applications only) Overall assessment of the quality of the programme management
Please indicate on a scale of 1 to 9, (1 = Agree strongly, 9 = totally disagree), to what extent you agree with the following statement

Follow-up on EACEA customer satisfaction analysis
C:\Documents and Settings\Bermimy\My Documents\COWI\Final report\EACEA_Final 221210responseratesupdated.docx
6
.
28 We are satisfied with the overall quality of the programme management services provided during the whole project period
1 2 3 4 5 6 7 8 9, (Don't know/not relevant)
6.1 Contact, communication and timeliness Please indicate on a scale of 1 to 9, (1 = Agree strongly, 9 = totally disagree), to what extent you agree with the following statements
29 We knew/know who to contact in case we have a question about imple-menting our project (contact person, mailbox, phone number, hotline…).
1 2 3 4 5 6 7 8 9 (Don't know/not relevant)
30 The answers received to questions were clear
1 2 3 4 5 6 7 8 9 (Don't know/not relevant)
31 We are satisfied with the programme management's overall ability to re-spond within a reasonable time.
1 2 3 4 5 6 7 8 9 (Don't know/not relevant)
6.2 Transparency
Please indicate on a scale of 1 to 9, (1 = Agree strongly, 9 = totally dis-agree), to what extent you agree with the following statement
32 During the implementation of the project, we understood the decisions made by the programme management organisation and their justifications (for example, amendments in contracts, feedback on the analysis of re-ports…)
1 2 3 4 5 6 7 8 9 (Don't know/not relevant)
33 Has your organisation submitted more than one proposal in the period 2007 - 2010?
Yes/No
Section 7 (rejected applications only)
If your application was rejected, please answer this question:

Follow-up on EACEA customer satisfaction analysis
C:\Documents and Settings\Bermimy\My Documents\COWI\Final report\EACEA_Final 221210responseratesupdated.docx
7
.
Please indicate on a scale of 1 to 9, (1 = Agree strongly, 9 = totally disagree), to what extent you agree with the following statement
34 We received a clear explanation on why the application was rejected
1 2 3 4 5 6 7 8 9, (Don't know/not relevant)
Section 8 Evolution of processes for stakeholders (accepted applications who received more than one grant only)
Please indicate on a scale of 1 to 9, (1 = Agree strongly, 9 = totally disagree), to what extent you agree with the following statement
35 Since 2007, we have noticed an improvement in the way our projects have been handled by the EU organisation.
1 2 3 4 5 6 7 8 9 (Don't know/not relevant)
Section 9 Final section (all applications)
36 If you have any feedback on the way your project was handled, or on how you think it should be handled, please type them below. optional
(open field for typing)
You have now completed the questionnaire. If you want to review your answers before submitting, please press the "back" button. If not, please submit your answers by pressing the "submit" button. We thank you very much for taking the time to participate in the survey.