folfdo ordgv - radar.brookes.ac.uk
TRANSCRIPT

1
Properties of tube and fitting scaffold connections under cyclical loads
M. Abdel-Jabera,M.S. Abdel-Jaberb, R.G. Bealec*, R. Allouzib, N.K. Shataratb
aDepartment of Civil Engineering, Applied Science University, Amman, Jordan bDepartment of Civil Engineering, The University of Jordan, Amman, Jordan cFaculty of Design, Technology and Environment, Oxford Brookes University, Oxford, UK *Corresponding author: Faculty of Design, Technology and Environment, Oxford Brookes University, Oxford, OX3 0BP, UK; email: [email protected]
Abstract: The standard design procedure for tube and fitting connections assumes that the connections are only subjected to non-cyclical loads. This paper presents the results of experimental tests and theoretical calculations of the moment-rotation capacities of three common connections – sleeve couplers, swivel couplers and right-angled couplers. The results show that under a cyclic side load, such as that occurring by wind loading, looseness affects the capacity of the connections. For all three types of coupler looseness is shown to be relatively high which will reduce the stiffness of the connection under side loads. For sleeve couplers the effects of axial load in the tubes also affects the coupler stiffness and the maximum bending capacity of the joint. This implies that the common European code BS EN 74-1 for the connection should be changed to consider the loss in stiffness and maximum side load capacity under axial loads and looseness which are ignored in the standard. The standard assumption for right-angled and swivel couplers is that the connection can be assumed to be rigid about an axis normal to the plane containing the two tubes being joined. This is shown to be incorrect as the connections are shown to have stiffnesses about this axis which is of a similar order to the stiffnesses about the other axes. Keywords: tubular scaffolding; couplers; looseness; structural analysis, cyclic behaviour 1. Introduction 1.1 Cyclic and side loading
The objective of this paper is to investigate the moment-rotation characteristics of the common connections used in tube and fitting scaffolds and falsework structures. The design of these structures often ignores the effect of side loads such as those caused by wind, earthquakes and impact by vehicles. The connections are not welded together but joined by connectors fastened with bolts. Traditional analyses ignore the fact that contact between the connections and the tubing used in the structures admits looseness and assume that the connection has a simple moment-rotation curve. The structure is normally analysed under monotonic loading. However, side loads are not constant and change direction. Wind loads have been shown to cause a structural failure which may cause loss of life [1]. The normal way of determining the looseness in a connection is by cyclic loading as will be shown in Section 2. The method is defined in the European code BS EN 12811 [2]. Note that the use of ‘BS’ in ‘BS EN 12811’ shows that the code is the English Language version of the Eurocode. As will be shown the looseness can be up to + 0.04 radians which, when added to the moment-rotation stiffness determined by experiments, significantly reduces the overall moment-rotation capacity.
Reference [1] shows that poor site control of the erection of a temporary works structure can lead to standards not being erected perpendicular to the ground. This means that the eccentricity in vertical loading such as the dead weight of the structure can lead to the reduced stiffnesses shown below. Even small side loads lead to reductions in the stiffness. It is notable that the standard test for sleeve couplers BS EN 74-1 [3] requires a four-point bending test with no axial load considered. This is shown in

2
Section 2 to yield values of rotational stiffness higher than those undertaken when the effects of axial load are included.
1.2 Historical introduction
Tubular scaffolds are the commonest form of temporary works structure in the UK and are most often used for access scaffolds. The traditional analysis procedure was to use effective lengths of the vertical members (called standards) assuming that the effective lengths were the distances between the horizontal members (called ledgers along the façade and transoms when connecting the front face with the rear face). The standard code of practice was BS 5975 [4] which first appeared in 1982 following the Bragg report [5] which analysed several failures which had occurred to temporary works structures prior to 1975. BS 5975 has received many updates, the most recent being in 2016 [6]. It still uses permissible stress design rather than limit analysis as required in the European codes but has survived as it is the only code in the UK controlling procedures for the erection and dismantling of these structures.
Researchers at Oxford University were commissioned by the UK Science Research Council to develop new procedures for the analysis of scaffold structures [7,8]. A program based on stability functions was developed and applied to model scaffold structures which were tested in a laboratory. The results of the numerical models were between 10% and 15% higher than the experiments. This was attributed to the simplified models of joint behaviour and the inability to model eccentricities available to the capacities of computers in the 1970s.
The traditional assumption made for connections joining standards together to extend their lengths was that the connection was rigid. However, tests conducted at Oxford Polytechnic (now called Oxford Brookes University) and Stuttgart University in 1990 [9] on spigot connections for system scaffolds (alternatively called proprietary scaffolds) funded by the European Union as part of the development process for Eurocode BS EN 12811 [2] showed that the connections had significant looseness and were not rigid. Beale and Godley [10] analysed a prototype proprietary scaffold (see Fig. 1) subjected to vertical and horizontal loads and showed that both 2D and 3D analyses of the structure predicted horizontal deflections that were approximately 50% of the measured deflection.
Ledgers
Transoms
Standards
Splices
Stiff Loading BeamTies
Fig. 1. Prototype scaffold tested at Stuttgart
Incorporating looseness in the spigot connection using a rotational contact element produced good correspondence as shown in Fig. 2. Note that 2D and 3D analyses predicted approximately the same displacements showing that in many scaffold structures only 2D analyses are required as long as correct models of joint properties are given [11].

3
Fig. 2. Comparison between different models analysing the deflection of
a prototype system scaffold
The 2D analysis procedures were used to generate load tables for the UK National Access and Scaffolding Association (NASC) design procedure in 2008 [12]. This would have been impractical to do with 3D Finite Element analyses as hundreds of different load cases and structural models were required. At the time of producing the load tables each 3D analysis took over 1 day to run and a similar amount of time to analyse each result. Reference [10] showed that the results of the simplified 2D procedures and those of the 3D analyses corresponded to within 10%.
Between 2012 and 2018 researchers at Oxford Brookes University undertook a series of tests on the splice connections and rotational joints of the Cuplock® system scaffold. The results showed that the rotational stiffness of the spigot connections for joining standards varied according to the axial load in the connection [13-16]. In 2018 the research was extended into the corresponding connections used in tube and fitting scaffolds to determine their moment-rotation stiffnesses.
It is notable that much of the research into scaffold structures has concentrated on the analysis of the frames supported by experimental tests with limited testing on the joint behaviour; only performing monotonic tests to failure of the scaffolds and the joints. For example, the works by Chu et al [17], Peng et al [18, 19], Chen et al [20,21], Jia et al [22] and Blazik-Borowa [23]. The most recent research into system scaffolds involving cyclic behaviour is by Chandrangsu moment-rotation stiffnesses and Rasmussen [24, 25] Further history of research into scaffold structures can be found in the review paper by Beale [26] and the book by Beale and André [1].
1.3 Paper objectives
This paper extends the work on system scaffolds [13-15] into the connections for tube and coupler scaffolds. Three types of connection were experimentally tested and the results compared with finite element analyses. They are the sleeve connector joining two standards, the right-angled coupler joining standards to ledgers and transoms, and the swivel coupler enabling diagonal braces to be attached between standards and ledgers so as to provide extra rigidity. Fig. 3 shows the three connections. A fourth connection is commonly also used, called a putlog connection. This is only used between two ledgers to enable boards to be placed on scaffold structures between pairs of transoms. It was not tested in this research as it is a weak connection which should never be used to increase the strength of a scaffold. The testing process also investigated the effects that cyclic loading such caused by, for
0 10 20 30 40mm
2D analysis assumingrigid splice
Test results
3D analysis
ledger levels
2 D analysis usingrotational contact

4
example, wind or earthquakes would have on the connectors’ performance. The only results on cyclic loading known to the authors of tube and fitting scaffold structures is given by Blazik-Borowa et al [23] where 6 specimens were subjected to cyclic loading. The differences between each specimen was purely the torque applied to the fastening bolts which showed that the moment-rotation stiffnesses reduced on each cycle. Looseness was shown but not calculated.
(a) sleeve coupler
(b) right-angled coupler (c) swivel coupler
Fig. 3. The three connections analysed in this paper

5
The traditional properties of the three connections are assumed to be:
(a) Sleeve coupler – no looseness and the rotational stiffness due to side loads is
independent of the axial load in the standard. (b) Right-angled coupler – looseness is ignored and the rotational stiffness only needs to be
determined about the axis containing the two tubes at right-angles to each other (Z axis in Fig.4) and the connection is deemed to be rigid about axes perpendicular to the plane of the two connected tubes (axes X and Y in Fig. 4).
(c) Swivel coupler – looseness is ignored, coupler is pinned about the axis at right-angles to the two tubes (Z axis) and connection deemed to be rigid about the other axes (X and Y axes).
Fig. 4. A schematic showing the orientation of the axes for the right-angled and swivel couplers Tests were conducted on the three types of connection followed by finite element analyses to get a
full understanding of the couplers’ properties. The results show that the standard assumptions are incorrect and could lead to the structures failing, particularly when subjected to side loads such as wind or earthquakes.
2. Experimental investigation
2.1 Material properties
Following the tests described below the material properties of the tubes and couplers were
determined. The components were purchased from a supplier of scaffold materials so as to get representative specimens and not ones specially supplied by the manufacturer. The material used was a mild steel grade 42C. Tension tests were undertaken on three sections of the tubes and Vickers Hardness Tests on the three couplers and their fastening bolts undertaken to determine the ultimate strengths. In all experiments the bolts were tightened to 50Nm by a torque wrench in accordance with BS EN 74-1 [3]. The results of material tests are:
6
Tubes - 48.3 mm diameter, mean thickness 4.0 mm, Young’s modulus 206 GPa, Yield Strength 385 GPa, Ultimate Limit Strength (ULS) 457 MPa. The ULS of the sleeve, swivel and right-angled couplers and the bolts was 553 MPa. For analysis purposes the yield strength of the couplers and bolts was taken to be 442 MPa.
The exact dimensions of the couplers were determined by laser scanning the components and were used in the finite element analyses.
2.2 Sleeve couplers
Two different tests were undertaken to determine the rotational stiffness of sleeve couplers under
side loads. Initially a test under BS EN 74-1 [3] was undertaken to obtain the rotational stiffness of the coupler when there is no axial load within the standards. Secondly, a series of tests was undertaken where axial loads of approximately 25%, 50% and 75% of the maximum load that a single tube of the same length as that of the two standards joined together by the sleeve coupler could carry followed by cyclic axial loads.
2.2.1 Four-point bending test
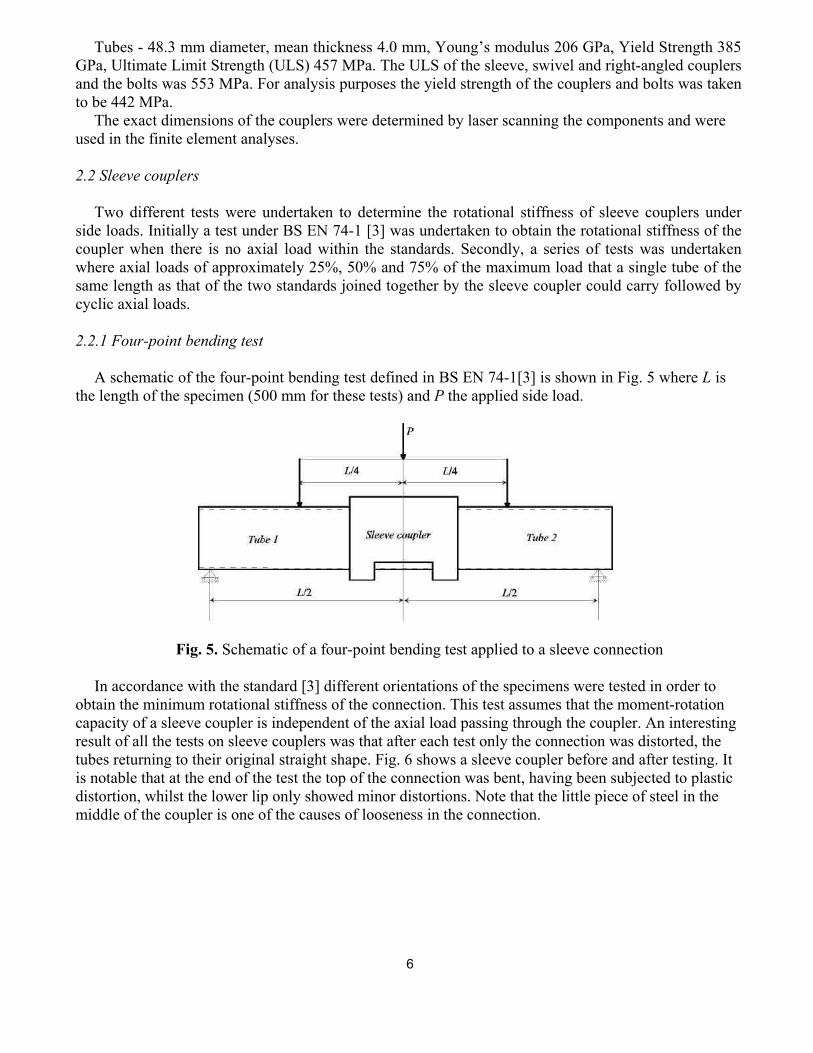
A schematic of the four-point bending test defined in BS EN 74-1[3] is shown in Fig. 5 where L is
the length of the specimen (500 mm for these tests) and P the applied side load.
Fig. 5. Schematic of a four-point bending test applied to a sleeve connection
In accordance with the standard [3] different orientations of the specimens were tested in order to obtain the minimum rotational stiffness of the connection. This test assumes that the moment-rotation capacity of a sleeve coupler is independent of the axial load passing through the coupler. An interesting result of all the tests on sleeve couplers was that after each test only the connection was distorted, the tubes returning to their original straight shape. Fig. 6 shows a sleeve coupler before and after testing. It is notable that at the end of the test the top of the connection was bent, having been subjected to plastic distortion, whilst the lower lip only showed minor distortions. Note that the little piece of steel in the middle of the coupler is one of the causes of looseness in the connection.

7
Fig. 6. Sleeve coupler before and after testing
The maximum bending moment applied to the first three specimens was 3 kNm in agreement with
BS EN 74-1 [3]. A sample curve is given in Fig. 7(a). The results of the initial three tests under four-point bending are presented in Table 1 where the ascending curve is approximated by two regression lines to get an initial and a secondary stiffness of the joint. As BS EN 74-1[3] only required a minimum stiffness and the ability to carry the 3kNm applied moment three further tests were undertaken with the bolts at the top to obtain estimates of the looseness and the ultimate moment-rotation capacity of the joint which is not required by the code. The results of the first three tests showed that there was little difference in strength if the bolts were above or below the connection.
The configuration with bolts at the top was used for tests to determine the ultimate capacity of the connection as cyclic tests could only be conducted with bolts in either the top or bottom configurations. This can be seen below in Fig. 9. The objective was to compare BS EN 74-1 with the cyclic test procedure. A sample curve of this set of tests is presented in Fig. 7(b) with a composite of all tests in Fig. 7(c). The full results are shown in Table 1 where the curve is approximated by 3 regression lines and looseness is estimated. The looseness was estimated by extrapolating the first curve in the positive direction to zero moment and determining the rotation at that moment. Note that regression lines were not accepted unless the r2 value was bigger than 0.97.

8
(a) Test 2 – bolts on top
(b) Test 5 – bolts on top maximum capacity
9
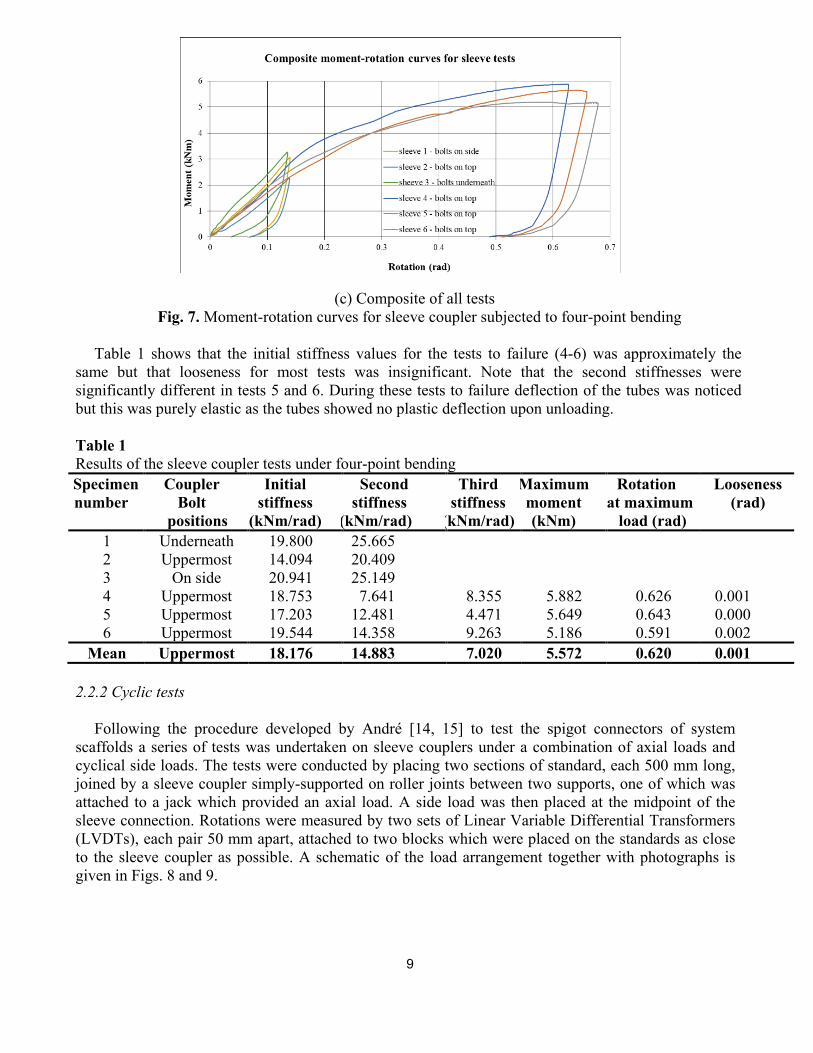
(c) Composite of all tests Fig. 7. Moment-rotation curves for sleeve coupler subjected to four-point bending
Table 1 shows that the initial stiffness values for the tests to failure (4-6) was approximately the
same but that looseness for most tests was insignificant. Note that the second stiffnesses were significantly different in tests 5 and 6. During these tests to failure deflection of the tubes was noticed but this was purely elastic as the tubes showed no plastic deflection upon unloading.
Table 1 Results of the sleeve coupler tests under four-point bending Specimen number
Coupler Bolt
positions
Initial stiffness
(kNm/rad)
Second stiffness
(kNm/rad)
Third stiffness
(kNm/rad)
Maximum moment (kNm)
Rotation at maximum
load (rad)
Looseness (rad)
1 Underneath 19.800 25.665 2 Uppermost 14.094 20.409 3 On side 20.941 25.149 4 Uppermost 18.753 7.641 8.355 5.882 0.626 0.001 5 Uppermost 17.203 12.481 4.471 5.649 0.643 0.000 6 Uppermost 19.544 14.358 9.263 5.186 0.591 0.002
Mean Uppermost 18.176 14.883 7.020 5.572 0.620 0.001
2.2.2 Cyclic tests
Following the procedure developed by André [14, 15] to test the spigot connectors of system scaffolds a series of tests was undertaken on sleeve couplers under a combination of axial loads and cyclical side loads. The tests were conducted by placing two sections of standard, each 500 mm long, joined by a sleeve coupler simply-supported on roller joints between two supports, one of which was attached to a jack which provided an axial load. A side load was then placed at the midpoint of the sleeve connection. Rotations were measured by two sets of Linear Variable Differential Transformers (LVDTs), each pair 50 mm apart, attached to two blocks which were placed on the standards as close to the sleeve coupler as possible. A schematic of the load arrangement together with photographs is given in Figs. 8 and 9.

10
left standard sleeve coupler axial jack
side jack
right standard
left LVDTs right LVDTs
Fig. 8. Schematic of the test arrangement for cyclic tests
(a) complete test arrangement (b) example of coupler with bolts uppermost
(c) specimen under test
Fig. 9. Test arrangement
A test was first conducted with no side load to get the maximum capacity of the connection under
axial load in the standards. The maximum axial load was 104 kN. In order to obtain the moment-rotation capacity of the sleeve connection under axial loads fixed
axial loads of 25 kN, 50 kN and 75 kN were applied. The sleeve connection then had a side load applied under displacement control which was increased until a load of 5 kN was applied. It was then reduced until a tensile load of -2 kN was applied. The side load was cycled three times in accordance with BS EN12811-1 [2] to get an estimate of the looseness in the connection. After the three cycles
11
had been completed the side load was increased to failure. In the cyclic loading cases stiffnesses were determined from the third cycle before loading to failure. The negative stiffnesses were determined from the slope of the unloading curves before increasing to failure in accordance with BS EN 12811-1 [2]. The reduced negative load was because the Linear Variable Differential Transducer (LVDT) used to control the loading was at its maximum extension. The loading rates were 1 mm per second for the first four tests and then 2 mm per second for subsequent tests as it was found that loading rates of 1 mm per second and 2 mm per second had similar results. Using increased loading rates would be likely to cause different results. After the third cycle the load was increased monotonically until failure.
The rotation of the connection under test (θt) was determined by Eq. (1) ,2 ,1 ,3 ,4t t t t
tD D
d d d dL L
θ− −
= + (1)
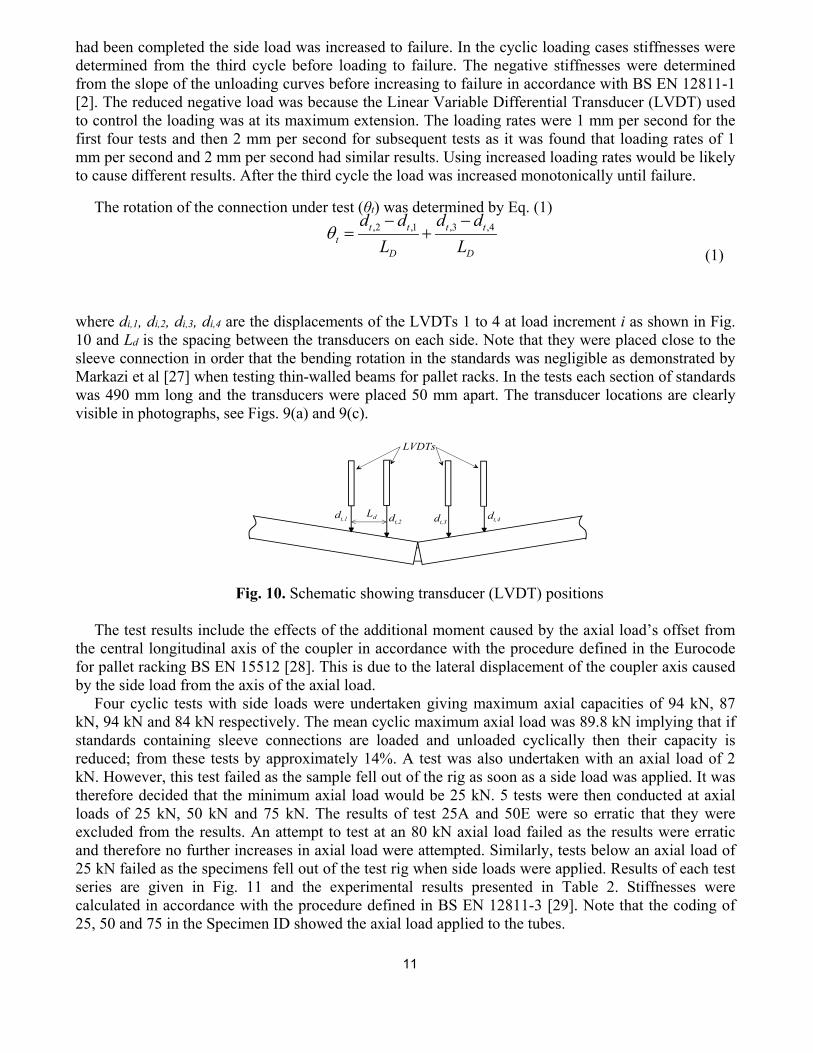
where di,1, di,2, di,3, di,4 are the displacements of the LVDTs 1 to 4 at load increment i as shown in Fig. 10 and Ld is the spacing between the transducers on each side. Note that they were placed close to the sleeve connection in order that the bending rotation in the standards was negligible as demonstrated by Markazi et al [27] when testing thin-walled beams for pallet racks. In the tests each section of standards was 490 mm long and the transducers were placed 50 mm apart. The transducer locations are clearly visible in photographs, see Figs. 9(a) and 9(c).
Ld dt,2dt,4dt,3
dt,1
LVDTs
Fig. 10. Schematic showing transducer (LVDT) positions
The test results include the effects of the additional moment caused by the axial load’s offset from the central longitudinal axis of the coupler in accordance with the procedure defined in the Eurocode for pallet racking BS EN 15512 [28]. This is due to the lateral displacement of the coupler axis caused by the side load from the axis of the axial load.
Four cyclic tests with side loads were undertaken giving maximum axial capacities of 94 kN, 87 kN, 94 kN and 84 kN respectively. The mean cyclic maximum axial load was 89.8 kN implying that if standards containing sleeve connections are loaded and unloaded cyclically then their capacity is reduced; from these tests by approximately 14%. A test was also undertaken with an axial load of 2 kN. However, this test failed as the sample fell out of the rig as soon as a side load was applied. It was therefore decided that the minimum axial load would be 25 kN. 5 tests were then conducted at axial loads of 25 kN, 50 kN and 75 kN. The results of test 25A and 50E were so erratic that they were excluded from the results. An attempt to test at an 80 kN axial load failed as the results were erratic and therefore no further increases in axial load were attempted. Similarly, tests below an axial load of 25 kN failed as the specimens fell out of the test rig when side loads were applied. Results of each test series are given in Fig. 11 and the experimental results presented in Table 2. Stiffnesses were calculated in accordance with the procedure defined in BS EN 12811-3 [29]. Note that the coding of 25, 50 and 75 in the Specimen ID showed the axial load applied to the tubes.

12
The average looseness when added to the rotation caused by the mean initial stiffness reduces the initial stiffness. In the case of, for example, specimen 50D, the reduced stiffness was 24.95 kNm/rad, a reduction of 28%.

13

14
15

16

17
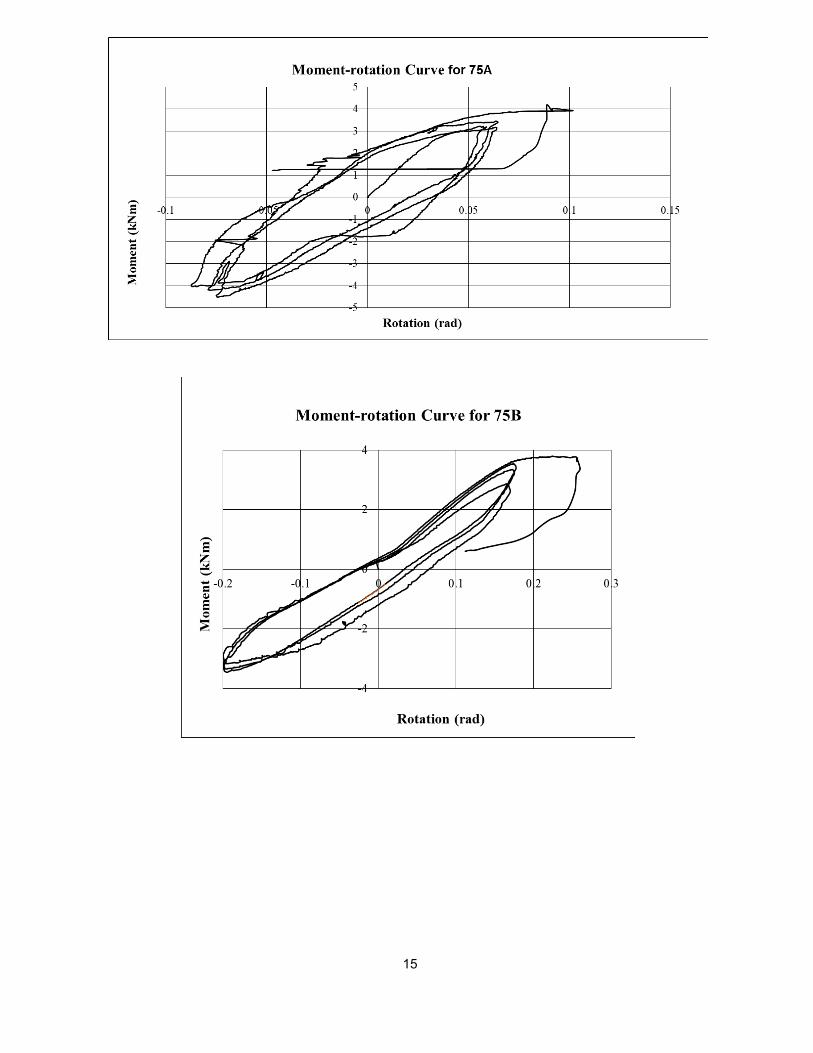
Fig. 11. Moment-rotation curves for sleeve connections under a combined fixed axial load and a cyclic side-load
Table 2 Results of the sleeve coupler tests under cyclic axial load
Specimen ID
Coupler bolts
position
Initial stiffness
(kNm/rad)
Second Stiffness
(kNm/rad)
Third stiffness
(kNm/rad)
Maximum moment (kNm)
Rotation at maximum load (rad)
Looseness (rad)
Side Load (kN)
25B Uppermost 104.990 41.826 83.742 4.070 0.045 0.050 6.698 25C Uppermost 43.578 196.098 144.890 4.351 0.052 0.019 6.796 25D Underneath 36.481 78.091 58.702 3.968 0.143 0.058 5.785 25E Underneath 35.106 133.684 8.352 4.270 0.059 0.021 5.090
Means 38.212 55.674 104.373 4.196 0.085 0.033 5.890 50A Uppermost 21.247 53.057 38.950 3.728 0.158 0.015 4.595 50B Uppermost 5.715 5.053 3.068 2.533 0.450 0.063 5.680 50C Underneath 11.640 9.972 2.072 3.679 0.057 0.058 5.075 50D Underneath 35.038 43.369 44.153 4.034 0.178 0.014 5.258
Means 13.259 18.430 14.967 3.416 0.228 0.045 5.000 75A Uppermost 97.129 31.440 24.955 4.196 0.089 0.033 5.613 75B Uppermost 13.779 21.300 16.050 3.800 0.223 0.032 5.680 75C Underneath 75.602 84.438 3.308 0.090 0.011 4.087 75D Underneath 81.301 77.763 51.967 3.854 0.068 0.006 4.983 75E Uppermost 94.422 77.591 42.953 3.445 0.071 0.010 5.211
Means 86.649 63.667 30.749 3.721 0.072 0.018 5.115 The mean values presented in Table 2 are logarithmic means for stiffness and averages for
looseness, maximum moment and maximum rotation. The maximum moment given in Table 2 occurred during the cyclic rotations for this test. Tests 25B, 50A and 75B were ignored as it was felt that the results were not compatible with the remaining items. Note also that in Test 75C the third stiffness could not be determined due to the erratic nature of the final readings before the maximum was achieved. In all cases where stiffness was accepted the linear regression curve had an r2 value in excess of 0.97. Looseness was determined in a similar manner to that used in the four-point bending tests by extrapolating the first positive stiffness to zero moment and determining the rotation at that point and also determining the descending regression line of the last cycle before loading to failure and halving the difference between the two rotations to get a mean looseness. In all the results the average looseness was 0.030 radians which is significant and should be taken into account in analysing scaffold behaviour as required in BD EN 12811- 3 [29]. The looseness must be added to the rotation relating to
18
the initial stiffness. This produces a reduced stiffness which means that the displacements caused by a given load are larger than those that would occur if there was no looseness. These increased deflections increase the additional moment caused by the axial load’s eccentricity and therefore reduce the coupler’s capacity. It is also to be noted that increasing the axial load reduces the side load that the coupler can bear which would affect scaffold structures abilities to handle large side loads caused by wind.
The results of test specimen 25A are not included as the sample failed immediately on testing with the results so erratic that they could not be processed.
From Table 2 it can be seen that in general the stiffnesses for sleeve couplers placed with the bolts uppermost or underneath the connection had little difference. This was also observed in the bending tests. The tests loaded with axial loads of 50 kN (approximately 56% of the average maximum capacity) had significantly different initial stiffnesses between tests but their ultimate moment capacity was approximately the same as the other two sequences and their maximum rotations varied dramatically. This is thought to be due to the manner in which the sleeve connection is attached between two standards. Experimentally, the looseness meant that one could not ensure that each connection was joined in exactly the same way. This, of course, would apply in practice as well. The stiffnesses of the connections with axial loads of 25 kN and 75 kN had initial stiffnesses higher than any configuration of those loaded under pure bending only.
It is also important to note that the maximum side moment that the connection under an axial load of 75kN was approximately 25% of the moment connection with an axial load of 25 kN. These tests show that the stiffness of a sleeve connection depends upon the axial load in the connection as well as the applied side load, contrary to the assumption in BS EN 74.1 [3] that axial loads do not affect connection capacity and hence the code should be modified. 2.3 Right-angle couplers
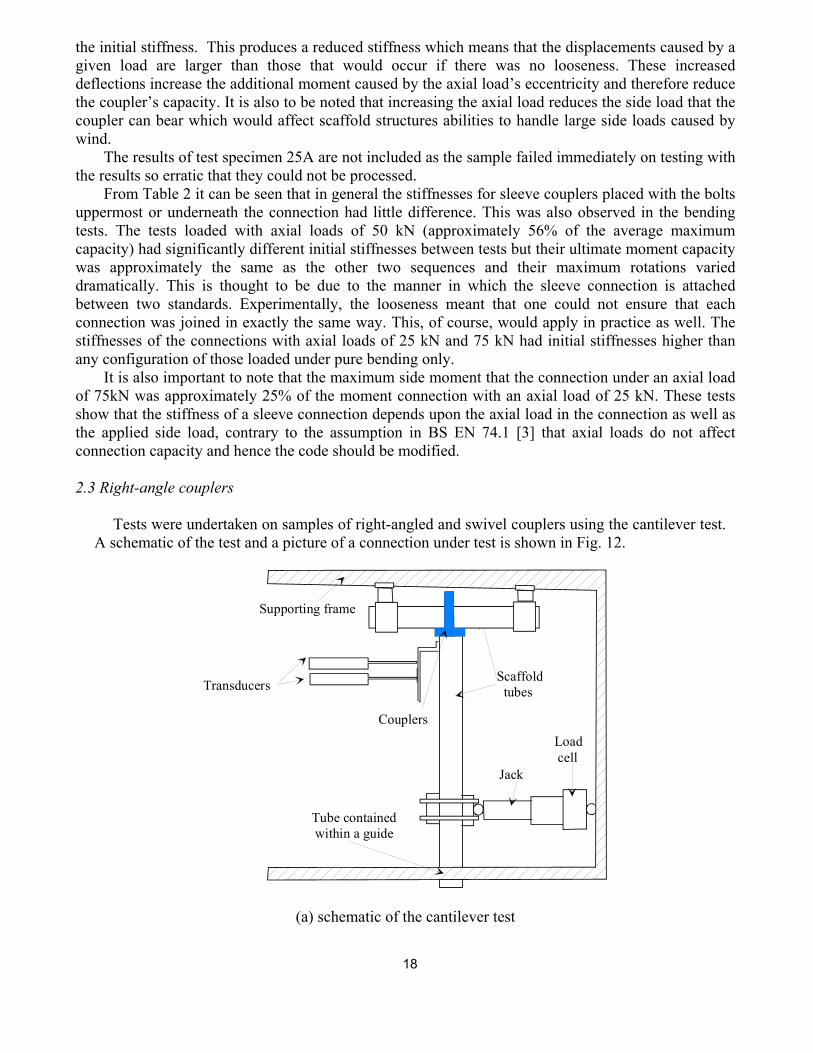
Tests were undertaken on samples of right-angled and swivel couplers using the cantilever test. A schematic of the test and a picture of a connection under test is shown in Fig. 12.
Scaffold tubesTransducers
Supporting frame
CouplersLoad cell
Jack
Tube contained within a guide
(a) schematic of the cantilever test

19
(b) Sample under test.
Fig. 12. Cantilever test for tube and fitting scaffold right-angled and swivel couplers
Two transducers were used to obtain the rotation of the connection. They were placed 50 mm apart
and only 50 mm from the nearest connection. The transducers were close to the connection to avoid having to apply corrections due to the tube bending under the applied moment and sheer in the tube. The jack was placed 350 mm from the centre of the second tube. Tests were conducted with different orientations of the connections as the research on the sleeve connections showed that the position of the bolts affected the moment-rotation stiffness.
For each orientation four tests were undertaken. Firstly, a monotonic pilot test straight to failure (denoted by the ending LF in all the test sequences) to determine the maximum capacity of the connection in that orientation. This was followed by a sequence of three tests (denoted by the ending C1, C2 and C3) in which the applied load was cycled three times between approximately 60% of the maximum load positively and negatively before going to failure. The cyclic loading was to determine the looseness in the connection.
The right-angled coupler was tested under four orientations: with the bolt head above the tube (RCBA, Fig. 13(a)), bolt head below the tube (RCBB, Fig 13(b)), bolt head on the same side as the jack (RCHBJ, Fig 13(c)) and bolt head on the opposite side to the jack (RCHBB, Fig 13(d)). In all the arrangements shown in Fig. 12 the jack was to the left of the connection and hence rotational corrections were not needed. The orientations were to determine the moment-rotation capacity about an axis at right angles to the plane of the connection (Fig. 4, axis X or Y)) and about a rotational axis about the plane of the connection (Fig. 4, axis Z). The plane of the connection is the plane containing the two lines which are the centre lines of the two tubes being joined. As can be seen in Fig. 13 the LVDTs were placed on a plate attached adjacent to the connection. This is shown in the schematic and specimen under test in Fig. 12.

20
(a) bolt head above jack
(b) bolt head below jack
(c) bolt on same side as the jack

21
(d) bolt on the side away from the jack
Fig. 13. Orientations of the connection under test showing bolt positions
The rotation (θt) of the connection under test is given by Eq. (2) where di,1, and di,2 are the
displacements of the two LVDTs shown in Fig. 13(a) at load increment i and Ld is the spacing between the transducers. The moment-rotation curves are presented for each of the four series of tests in Fig. 14 including the initial monotonic tests to failure.
,2 ,1t tt
D
d dL
θ−
= (2)

22

23

24
Fig. 14. Moment-rotation curves for the right-angled coupler tests
The moment-rotation curves show that the maximum capacity of the connection occurs when the connection is subjected to moments about an axis normal to the plane of the two scaffold tubes. This is the normal configuration assumed for moment-rotation capacity. The tests show that the position of the bolt does not make any significant difference to the results, as can be seen in Table 3. However, looseness is high and this will reduce the logarithmic mean stiffness. For example, the mean initial stiffness for the series RCBA is reduced to 2.683 kNm/rad and for series RCBB is reduced to 2.360 kNm/rad. When designing scaffold structures the looseness must be added into the calculation of the initial positive stiffness as it reduces the stiffness that can be used. Details are found in BS EN 12811-3 [29].
Note that the mean values quoted in the table ignore the initial load to failure curve in each test series. In the other two cases the moment is applied in a direction which causes the joint to slip as the test rotates one tube about the other. The stiffness is much lower the first two cases, primarily due to the joint slipping. Note that this rotation about this axis is often assumed to be rigid. Interestingly enough, in these two cases looseness can be ignored as it is approximately only 0.001 radians. Again, bolt configuration makes little difference to the results. Table 3 Results of the right-angled coupler tests under monotonic and cyclic loading
SpecimenID Minimum rotation
(rad)
Minimum moment (kNm)
Rotation at
maximum load (rad)
Maximum moment (kNm)
Initial positive stiffness
(kNm/rad)
Second positive stiffness
(kNm/rad)
Descending stiffness
(kNm/rad)
Looseness (rad)
RCBALTF 0.429 0.769 15.259 3.186 RCBAC1 -0.063 -0.527 0.463 0.877 7.820 0.730 39.860 0.046 RCBAC2 -0.063 -0.512 0.464 0.903 6.939 0.569 22.652 0.037 RCBAC3 -0.068 -0.536 0.464 0.873 7.073 0.601 21.149 0.010
Means 0.455 0.855 7.267 0.704 26.729 0.031 RCBBLTF 0.451 0.910 4.887 1.850 RCBBC1 -0.052 -0.454 0.470 0.887 7.057 0.620 16.632 0.037 RCBBC2 -0.046 -0.459 0.464 0.865 8.206 0.569 26.782 0.031 RCBBC3 -0.045 -0.456 0.466 0.861 5.185 0.615 22.604 0.032
Means 0.463 0.881 6.696 0.601 21.594 +0.033
25
RCHBJLTF 0.428 0.214 19.484 7.502 RCHBJC1 0.000 -0.061 0.372 0.153 15.575 0.007 18.728 0.001 RCHBJC2 0.000 -0.066 0.376 0.150 18.930 23.590 0.001 RCHBJC3 0.000 -0.064 0.371 0.191 8.110 0.192 18.966 0.003
Means 0.387 0.177 13.922 0.036 20.311 0.002 RCHBRLTF 0.372 0.131 13.912 0.294 RCHBRC1 -0.135 -0.129 0.316 0.160 30.986 0.194 35.665 0.000 RCHBRC2 -0.006 -0.118 0.364 0.159 30.401 30.801 0.001 RCHBRC3 -0.004 -0.106 0.386 0.303 22.917 0.225 24.298 0.000
Means 0.359 0.188 27.844 0.257 29.885 0.000 The experimental results show that the assumption of stiffness of a right-angled coupler at the
plane at right angles to the plane of the two tubes being joined is not rigid as commonly assumed. Tests must be made to get the stiffnesses in both orientations.
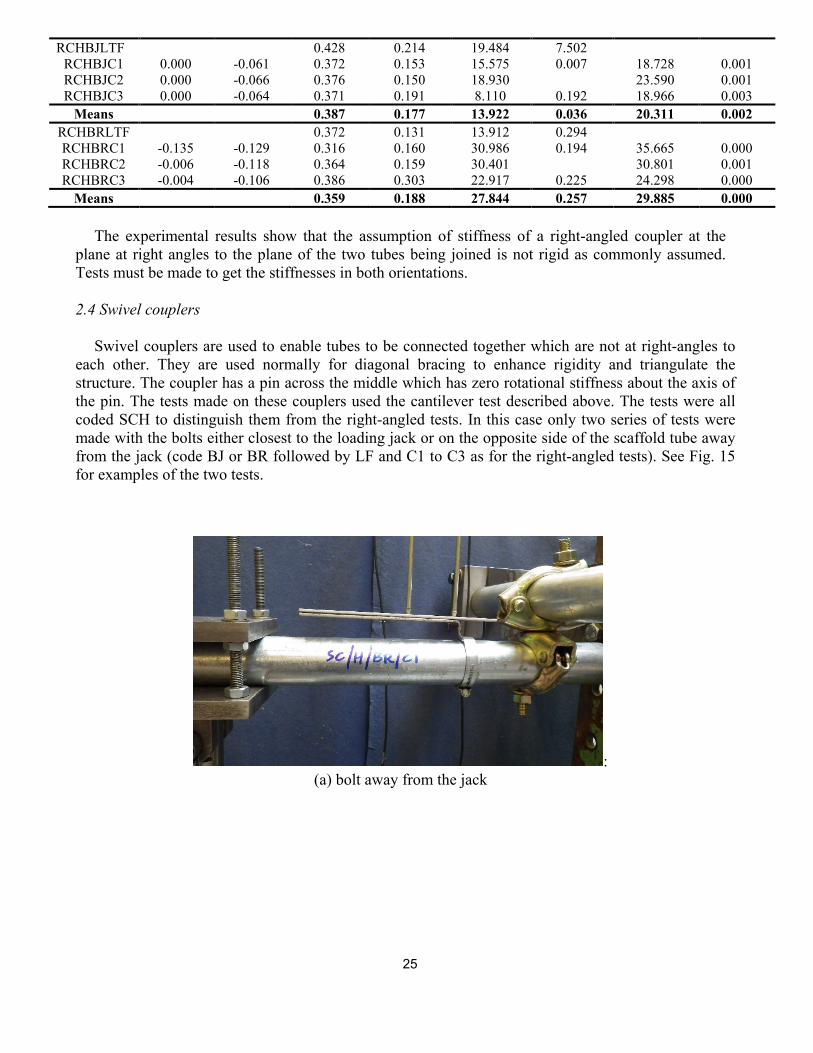
2.4 Swivel couplers
Swivel couplers are used to enable tubes to be connected together which are not at right-angles to each other. They are used normally for diagonal bracing to enhance rigidity and triangulate the structure. The coupler has a pin across the middle which has zero rotational stiffness about the axis of the pin. The tests made on these couplers used the cantilever test described above. The tests were all coded SCH to distinguish them from the right-angled tests. In this case only two series of tests were made with the bolts either closest to the loading jack or on the opposite side of the scaffold tube away from the jack (code BJ or BR followed by LF and C1 to C3 as for the right-angled tests). See Fig. 15 for examples of the two tests.
: (a) bolt away from the jack
26
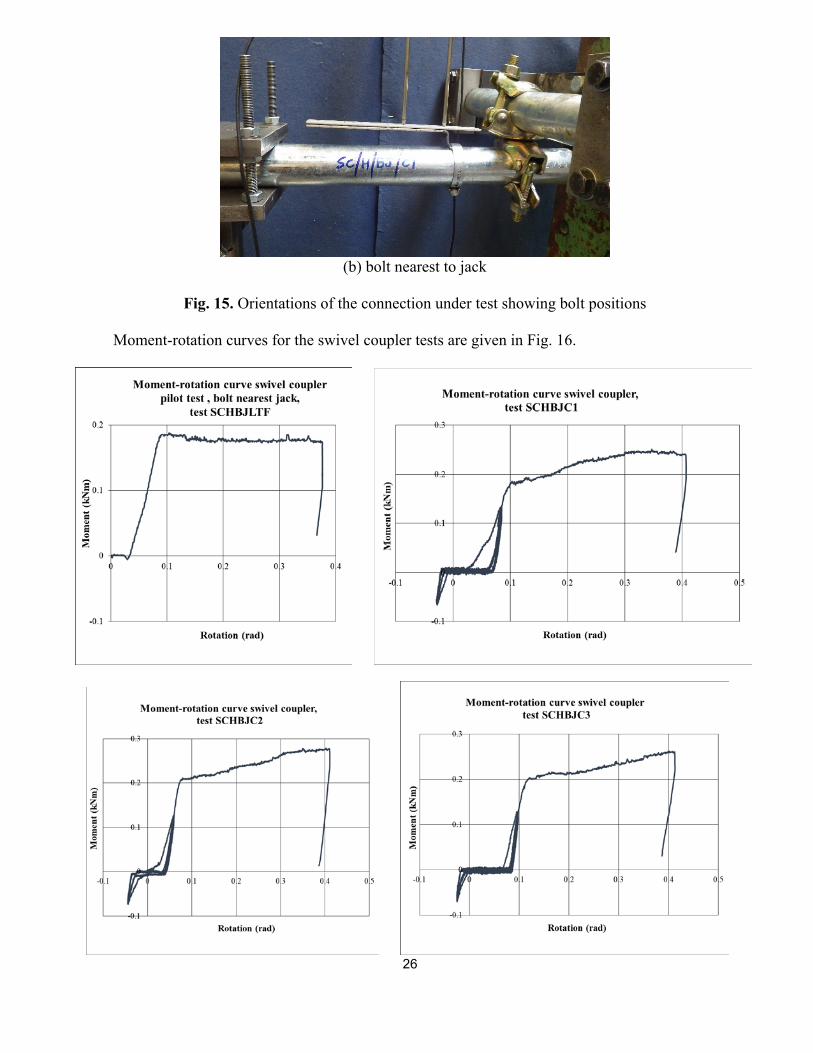
(b) bolt nearest to jack
Fig. 15. Orientations of the connection under test showing bolt positions
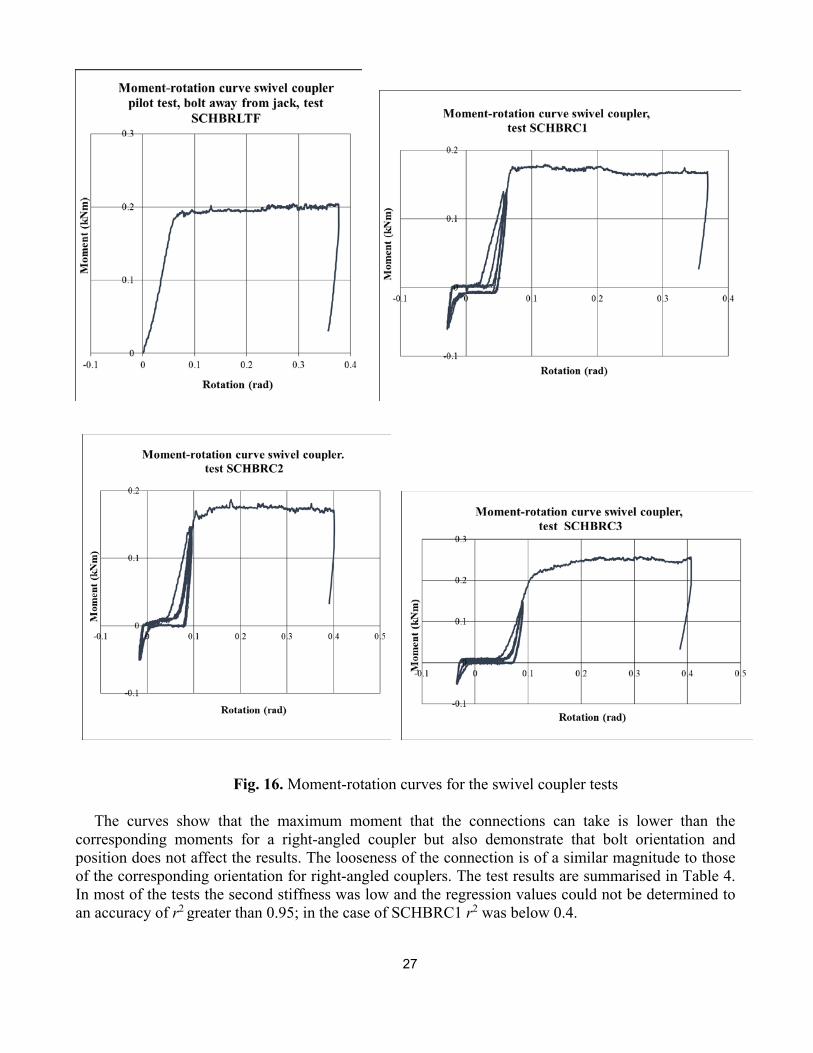
Moment-rotation curves for the swivel coupler tests are given in Fig. 16.
27
Fig. 16. Moment-rotation curves for the swivel coupler tests
The curves show that the maximum moment that the connections can take is lower than the
corresponding moments for a right-angled coupler but also demonstrate that bolt orientation and position does not affect the results. The looseness of the connection is of a similar magnitude to those of the corresponding orientation for right-angled couplers. The test results are summarised in Table 4. In most of the tests the second stiffness was low and the regression values could not be determined to an accuracy of r2 greater than 0.95; in the case of SCHBRC1 r2 was below 0.4.

28
Table 4 Results of the swivel coupler tests under monotonic and cyclic loading
Similar to the results from right-angled coupler tests, the experimental results show that the
assumption of rigidity in the connection at right angles to the plane of the two tubes being joined by a swivel coupler is not rigid as is commonly assumed but tests must be made to get the stiffnesses in both directions. 3 Finite element modelling 3.1 Introduction
The three types of connection were analysed using finite elements and the program ABAQUS [30]. Each component of the connection (i.e. the coupler, washers, bolts and tube) was modelled using continuum linear solid 8-node hexahedral elements with reduced integration and hourglass control (C3D8R) for couplers, tubes, spacer, and washers, and continuum 10-node modified tetrahedron elements with hourglass control(C3D10M) for nuts and bolts. See Fig. 17. Reduced integration elements were used as they have lower-order integration algorithms to create the element stiffness which reduced the running time. The hourglass control was used to minimise severe mesh distortion with no excessive constraints presented on the element.
The Dynamic/Explicit analysis available in ABAQUS [30] was adopted in this study. This procedure solves the dynamic equilibrium equations that apply to any mechanical system and under any geometrical, materials, and contact nonlinearities. As this study was a static analysis, the term in these equations related to the inertial or dynamic force was enforced to be small enough by increasing the step time. This reduced the equations to the static form of equilibrium.
General interaction contact between components was enforced as hard normal contact be from the axis of the axial load ween all components. Tangential contact had a coefficient of friction of 0.1 and was applied to the nuts and bolts after tightening.
Specimen ID
Minimum rotation
(rad)
Minimum moment (kNm)
Rotation at
maximum load (rad)
Maximum moment (kNm)
Initial positive stiffness
(kNm/rad)
Second positive stiffness
(kNm/rad)
Descending stiffness
(kNm/rad)
Loose- ness (rad)
SCHBRLTF 0.377 0.204 3.307 3.308 SCHBRC1 -0.029 -0.061 0.369 0.180 8.649 11.208 0.034 SCHBRC2 -0.018 -0.051 0.402 0.187 5.184 7.127 0.004 SSCHBRC3 -0.035 -0.052 0.407 0.258 6.176 8.337 0.048 Means 0.392 0.208 6.518 8.733 0.040 SCHBJLTF 0.377 0.187 3.468 SCHBJC1 -0.001 -0.066 0.407 0.251 7.336 0.293 9.314 0.045 SCHBJC2 -0.044 -0.073 0.411 0.279 7.612 0.238 7.115 0.103 SCHBJC3 -0.025 -0.070 0.413 0.263 7.384 0.204 4.769 0.002 Means 0.410 0.264 7.443 0.243 6.811 0.050

29
(a) sleeve coupler (b) right-angled coupler (c) swivel coupler
(d) tube
Fig. 17. Discretisation of the three coupler types and the scaffold tube
An elasto-plastic material model was used in the finite element analyses using the material properties given in Section 2.1. The Mises yield surface was used to define isotropic yielding [30]. This surface was characterised by providing values of the uniaxial yield stress as a function of uniaxial equivalent plastic strain. An elastic-perfectly plastic relationship was used for couplers loaded monotonically to failure. For the cyclic tests, a combined hardening model was used.
3.2 Sleeve coupler
The sleeve couplers were analysed using a 4-point loading model and under models of the cyclic tests where the bolts were placed either uppermost or lowermost positions.
3.2.1 Four-point loading model
The first part of the analysis procedure was a displacement-controlled procedure that displaced the bolt through the bolt-hole and locked the coupler around the tubes. The Dynamic/Explicit analysis available in ABAQUS [30] was adopted in this study. The displacement used was 14mm for each coupler type as this corresponded with the measured experimental data. An example is shown for the sleeve coupler (Fig. 18).

30
Fig. 18. The sleeve coupler before testing, and after tightening the bolts in the finite element model
The sleeve couplers were placed such that the bolts were uppermost, on the side and below the scaffold tube. As can be seen in Table 1 the experimental results of sleeve couplers showed that couplers placed with the bolts uppermost or underneath had little difference. Consequently, sleeve couplers placed with the bolts underneath were modelled and the results are compared with the average outcomes given in the table.
The two extreme ends of the scaffold tubes were pinned and the side force applied as shown in Fig. 19. In the figure the orange cone represents the restraint direction, the blue cone represents the free direction and orange arrow represents the displacement direction.
The bolts were first subjected to a displacement-control procedure to be tightened. This step of the analysis procedure was calibrated based on the test arrangement (Figs. 8 and 9) and the test results (Fig. 7). The side load was then increased to failure to obtain the moment-rotation curve of the model under four-point loading. A summary of the loading procedure is:
(i) The boundary condition at both ends was pinned. (ii) Nuts were tightened to stress the bolts and lock the tubes. Contact interaction was enforced
between the bolts and the fastening nuts to ensure tightening. (iii) A side load was applied by displacement control to the two loading points and increased until
failure.
Fig.19. Boundary conditions and applied loads on sleeve coupler for four-points loading test
A mesh convergence study was performed where each coupler was simulated with a different mesh sizes and results were compared. The results were not affected by different mesh sizes. The mesh sizes were selected to maintain the shape of each component. Sufficiently small elements were used. As fracture was not considered and was not observed in the tests the results were not sensitive to mesh size as described by Li et al [31].

31
The numerical results are given in Fig. 20 where it can be seen that the finite element stiffness is slightly higher than the experimental stiffness. The oscillations in the finite element plot are due to the small stable time used in ABAQUS/explicit.
Fig. 20. Comparison of experimental result for experimental sample No. 4 with FE calculation
The results from the finite element calculation are: Initial stiffness 1239.37 kNm/rad, Second stiffness 11.99 kNm/rad, third stiffness 4.48 kNm/rad, maximum moment 6.47 kNm and maximum rotation 0.65 rad. The initial stiffness is significantly higher than that obtained experimentally. It is thought that the reason for the high stiffness is that bolt looseness was removed in the initial part of the numerical analysis. Looseness occurs when sleeve interiors are not perfectly smooth and hence the two tubes being joined may not be in perfect alignment. The higher stiffness calculated by the finite element analysis is also affected by the boundary conditions of the tubes as shown in Fig. 19. A better simulation of these supports resulted in long running time and accordingly such simplification can be accepted as it represents capacity with a reasonable running time. The four-point bending experiments were not able to detect this looseness but it does significantly reduce the initial stiffness.
Minor slippage with the bolts would also cause a significant reduction in stiffness. The second and third stiffnesses correspond well with the experimental results as do the maximum coupler capacity and rotation.
3.2.2 Flexural cyclic test
The model adapted for tests under cyclic loading was similar to that defined in Fig. 8 where the side load was applied under deflection control at the centre of the sleeve connection and the axial load applied at a roller end and maintained at the same value throughout the test. The other end of the tube was a pinned connection. In this case the cyclic load was applied three times from 0 to 5 kN initially followed by being reduced to a tensile load of 2 kN three times before being increased to failure to model the experimental procedure. A summary of the loading procedure is:
(i) The boundary condition at one end was taken as pinned and a roller joint applied at the
other end. (ii) Nuts were tightened to stress the bolts and lock the tubes. Contact interaction was enforced
between the bolts and the fastening nuts to ensure tightening. (iii) A side load was applied by displacement control applied to the centre of the sleeve
connection in accordance with the loading sequence defined above.

32
The modelling of the sleeve coupler was repeated three times, each with different axial loads,
namely: 25 kN, 50 kN and 75 kN. The moment-rotation curves of the cyclic procedure from ABAQUS are shown in Fig. 21together with the mean experimental curve obtained by plotting regression curves through the load increment cycle and obtaining the mean curve in accordance with the procedures of BS EN 12811 [2].Fig. 22 shows the stress distributions at each of the three axial load cases under the maximum achieved side load.
(a)
(b)

33
(c)
Fig. 21. Comparison of the moment-rotation curves of an experimental sleeve coupler and the finite element analysis with bolts uppermost under axial loads of(a) 25 kN, (b) 50 kN and (c)75 kN at the
maximum moment
(a)
(b)
(c)

34
Fig. 22. Stress distributions of sleeve couplers with bolts uppermost under axial loads of
(a) 25 kN, (b) 50 kN and (c) 75 kN at the maximum moment of loading
Table 5 shows the results of the finite analyses compared with the experimental results. It can be seen that the stiffness clearly depends upon the axial load and that, with the exception of finite element analysis 75FE, that the finite element results for looseness, maximum moment and maximum rotation are in agreement with experimental results. The stiffnesses differ but this can be attributed to the difficulty under a limited number of tests of getting accurate mean values.
The combined hardening model was used to simulate cyclic response with idealized elastic-plastic values. Using detailed experimental data of axial cyclic stress-strain of each component material into this model would be expected to improve the cyclic response of the connections but full details were available.
Table 5 Comparison of mean experimental and computational results for the sleeve coupler
Axial Load
Coupler bolts
position
Initial stiffness
(kNm/rad
Second stiffness
(kNm/rad)
Third stiffness
(kNm/rad)
Maximum moment (kNm)
Rotation at
maximum moment
(rad)
Looseness (rad)
25 exp mean 38.212 55.674 104.373 4.196 0.085 0.033 25 FE Uppermost 37.802 73.048 97.432 4.043 0.056 0.017 50 exp mean 13.259 18.430 14.967 3.416 0.228 0.045 50 FE Uppermost 33.046 40.589 46.041 3.901 0.070 0.022 75 exp mean 86.649 63.667 30.749 3.721 0.072 0.018 75 FE Uppermost 202.066 105.309 32.757 3.918 0.034 0.014
3.3 Right angle coupler
The right-angle coupler was modelled with the load applied as shown in Fig. 23. Following the experimental procedure described in Section 2.3 the following loading sequence was applied:
(i) Both ends of one tube were pinned as shown in Fig. 23. (ii) Nuts were tightened to stress the bolts and lock the tube. Contact interaction was enforced
between the bolts and the fastening nuts to ensure the tightening. The load was then applied at the end of the second tube using displacement control. See Fig. 24 for details of the effects of bolt tightening on the FE model.
(iii) A vertical load was applied by displacement control applied to the second tube connection in accordance with the loading sequence defined above.

35
Fig 23. Boundary conditions and applied loads on right-angle coupler
(a) Stress distribution before tightening (b) stress distribution after tightening the boltd
Fig. 24. Stress distribution within the right-angled coupler before and after tightening the bolts in
the finite element model
Fig. 25 shows a comparison of the experimental results for the monotonic side load to failure and the FE analyses.

36
(a) (b)
(c) (d)
Fig. 25. Comparison of the moment-rotation curves of the experimental right-angled coupler and the
finite element analysis with (a) bolt on the same side as the jack - RCHBJLTF, (b) bolt on the opposite side to the jack - RCHBRLTF, (c) the bolt above the tube - RCBALTF, (d) bolt below the tube -
RCBBLTF
Fig. 26 shows a typical stress distribution for the right-angled coupler with bolts in the 4 positions defined in Fig 23.

37
Fig. 26. Stress distribution for the 4 bolt positions The numerical results are given in Table 6 which includes a comparison between the experimental
and theoretical values.
Table 6 Comparison of mean experimental and computational results for the right-angled coupler
Specimen ID
Experimental maximum moment (kNm)
Calculated maximum moment (kNm)
Experimental Rotation at maximum
moment (rad)
Calculated Rotation at maximum
moment (rad)
Experimental initial stiffness
(kNm/rad)
Calculated initial
stiffness (kNm/rad)
RCHBJLTF 0.214 0.239 0.428 0.310 19.484 8.531 RCHBRLTF 0.131 0.170 0.372 0.340 13.912 14.063 RCBALTF 0.769 0.819 0.429 0.449 15.259 17.898 RCBBLTF 0.910 0.782 0.451 0.486 4.887 7.566
There is a good comparison between the experimental and finite element result for the experimental
maximum moments with a maximum difference of 14.4%. However, the experimental stiffnesses are significantly different with the initial stiffness of the experiment being in general much higher than that of the calculated version. This difference may be attributed to moments used to determine the boundaries of each stiffness as the plots show reasonable agreement and also to the amount of looseness in the experimental connection.
3.3 Swivel coupler
(a) RCHBJLTF (b) RCHBRLTF
(c) RCBALTF (d) RCBBLTF

38
The finite element model for the swivel coupler is given in Fig. 27. The loading schedule was similar to that of the right-angled coupler. The stress distribution after tightening the bolts is given in Fig. 28. The moment-curvature relationships are given in Fig. 29 and the stress plots at maximum load are presented in in Fig. 30.
Fig. 27. Boundary conditions and the applied loads to the swivel coupler
(a) (b)
Fig. 28. Stress distribution in the swivel coupler (a) before tightening, and (b) after tightening the bolts in the finite element model

39
(a)
(b)
Fig. 29. Comparison of the moment-rotation curves of the experimental right-angled coupler and the finite
element analysis with (a) bolt nearest the jack - SCHBJLTF, (b) bolt on the opposite side to the jack - SCHBRLTF,
(a) SCHBJLTF (b) SCHBRLTF
Fig. 30. Stress distributions for the two jack configurations at maximum moment.
The results of the finite element modelling are compared with those of the experiments in Table 7.
40
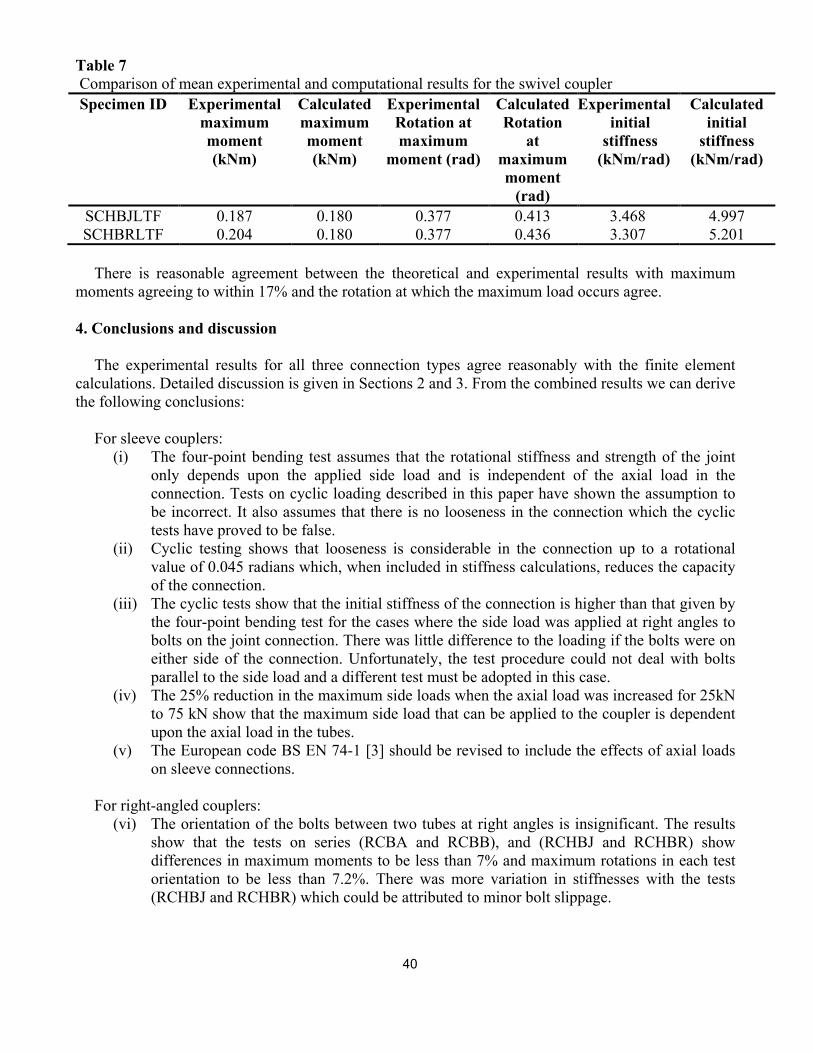
Table 7 Comparison of mean experimental and computational results for the swivel coupler Specimen ID Experimental
maximum moment (kNm)
Calculated maximum moment (kNm)
Experimental Rotation at maximum
moment (rad)
Calculated Rotation
at maximum moment
(rad)
Experimental initial
stiffness (kNm/rad)
Calculated initial
stiffness (kNm/rad)
SCHBJLTF 0.187 0.180 0.377 0.413 3.468 4.997 SCHBRLTF 0.204 0.180 0.377 0.436 3.307 5.201
There is reasonable agreement between the theoretical and experimental results with maximum
moments agreeing to within 17% and the rotation at which the maximum load occurs agree. 4. Conclusions and discussion
The experimental results for all three connection types agree reasonably with the finite element
calculations. Detailed discussion is given in Sections 2 and 3. From the combined results we can derive the following conclusions:
For sleeve couplers:
(i) The four-point bending test assumes that the rotational stiffness and strength of the joint only depends upon the applied side load and is independent of the axial load in the connection. Tests on cyclic loading described in this paper have shown the assumption to be incorrect. It also assumes that there is no looseness in the connection which the cyclic tests have proved to be false.
(ii) Cyclic testing shows that looseness is considerable in the connection up to a rotational value of 0.045 radians which, when included in stiffness calculations, reduces the capacity of the connection.
(iii) The cyclic tests show that the initial stiffness of the connection is higher than that given by the four-point bending test for the cases where the side load was applied at right angles to bolts on the joint connection. There was little difference to the loading if the bolts were on either side of the connection. Unfortunately, the test procedure could not deal with bolts parallel to the side load and a different test must be adopted in this case.
(iv) The 25% reduction in the maximum side loads when the axial load was increased for 25kN to 75 kN show that the maximum side load that can be applied to the coupler is dependent upon the axial load in the tubes.
(v) The European code BS EN 74-1 [3] should be revised to include the effects of axial loads on sleeve connections.
For right-angled couplers:
(vi) The orientation of the bolts between two tubes at right angles is insignificant. The results show that the tests on series (RCBA and RCBB), and (RCHBJ and RCHBR) show differences in maximum moments to be less than 7% and maximum rotations in each test orientation to be less than 7.2%. There was more variation in stiffnesses with the tests (RCHBJ and RCHBR) which could be attributed to minor bolt slippage.
41
(vii) The normal assumption that the moment-rotation about the axis normal to the plane formed by the two tubes being connected can be considered as rigid is shown to be false and indeed in these tests the stiffnesses were lower than those about the normal axis of rotation.
(viii) Looseness varied significantly between the tests but the mean value was approximately 0.016 radians.
For swivel couplers:
(ix) Similar to right-angled couplers the common assumption that the swivel coupler is rigid about an axis normal to the plane of the two tubes is proved to be false and tests must be undertaken to determine the stiffness.
(x) The initial stiffnesses varied when the test was conducted with the bolts away from the jack or adjacent to the jack were significantly smaller than corresponding tests for right-angled couplers with differences between the two cases attributed to bolt slippage.
(xi) Looseness in the connection is high under both orientations being approximately 0.05 radians.
Acknowledgements The authors wish to express their thanks to the University of Jordan for funding the experiments and Oxford Brookes University for enabling the testing to be undertaken. REFERENCES
[1] Beale, R, and André, J. (2017). Design Solutions and Innovations in Temporary Structures, IGI
Global, Hershey, USA. [2] BSI (2003). BS EN 12811-1:2003. Temporary works equipment, Part 1: Scaffolds-Performance
requirements and general design. London, UK: British Standards Institution. [3] BSI (2005). BS EN 74-1, Couplers, spigot pins and baseplates for use in falsework and scaffolds
– Part 1: Couplers for tubes - Requirements and test procedures, British Standards Institution, London.
[4] BSI (1982). BS 5975 Code of practice for falsework (1st ed.), British Standards Institution, London, UK.
[5] Bragg, S.L. (1975). Final report of the Advisory Committee on Falsework. Her Majesties Stationary Office, London, UK.
[6] BSI (2016). BS 5975:2008+A1:2011 – Code of practice for temporary structures procedures and the permissible stress design of falsework (3rd ed.), British Standards Institution, London, UK.
[7] Lightfoot, E. and Bhula, D. (1977). The idealisation of scaffold couplers for performance tests and scaffold analysis, Materieux et Constructions, 10(5-6), 159-168.
[8] Lightfoot, E. and Olivetto, G. (1977). The Collapse Strength of Tubular Steel Scaffold Assemblies. Proceedings of the Institution of Civil Engineers, 63(2), 311-329.
[9] Godley, M.H.R. (1990). The performance of the SGB connector, Oxford Polytechnic, Department of Civil Engineering, Building & Cartography, Report 221, Oxford, UK.
[10] Beale R. and Godley M. (1995). The analysis of scaffold structures using LUSAS. In: Proceedings of LUSAS 95, UK, 10-24.
[11] Beale, R.G. and Godley, M.H.R. (2006). Numerical Modelling of Tube and Fitting Access Scaffold Systems. Advanced Steel Construction, 2(3), 199-223.
[12] NASC (2008). TG20:08: Guide to Good Practice for Scaffolding with Tubes and Fittings. National Access and Scaffolding Confederation, London, UK.

42
[13] Abdel-Jaber M.S., Beale R.G., Shatarak N.K. and Shehadeh M.A., (2019). Experimental and theoretical investigation of spigot connections, Advanced Steel Construction - an International Journal, Vol.15(1), 30-46.
[14] André J. (2014). Determination of the main parameters affecting the performance of bridge falsework systems. PhD Thesis, Oxford Brookes University, Oxford, UK.
[15] André J., Beale R.G. and Baptista A.M., (2016). Experimental and theoretical investigation of Cuplok® Spigot Connections. In: Proceedings of the eighth International Conference on Steel and Aluminium Structures ICSAS 2016, Hong Kong, Paper 49, 16p.
[16] Adel-Jaber, M., Abdel-Jaber, M. S., Beale, R.G. and Shatarat, N.K. (2019). Cyclic Loading applied to Sleeve Couplers for Tube and Fitting Scaffolds”. Springer, Lecture Notes in Civil Engineering, Jun, 2019, 8p.
[17] Chu, A.Y.T., Chan, S.L. and Chung, K.F. (2002). Stability of modular steel scaffolding systems—Theory and verification. In: Advances in Building Technology, Elsevier, 1, 621-628.
[18] Peng, J., Ho, C., Lin, C. and Chen, W. (2015). Load carrying capacity of single-row steel scaffolds with various setups, Advanced Steel Construction - an International Journal, 11(2), 185-210.
[19] Peng, J.L., Yen, T., Pan, A.D.E., Chen, W.F. and Chan, S.L. (1996). In: Advances in Steel Structures, ICASS’ 96, Hong Kong, 251-256. Strain behavior of structural steel with yield strength up to 460 N/mm2. Frontiers of Structural and Civil Engineering, 8(2), 178-186.
[20] Chen, Y.Y., Sun, W. and Chan, T.M. (2013). Effect of loading protocols on the hysteresis behavior of structural carbon steel with yield strength up to 460N/mm2. Advances in Structural Engineering,16(4), 707–719.
[21] Chen, Y.Y., Sun, W. and Chan, T.M. (2014). Cyclic stress- strength up to 460N/mm2. Frontiers of Structural and Civil Engineering, 8(2), 178-186.
[22] Jia, L., Chen, Z., Liu, Z. and Wen, S. (2016). Mechanical properties of right-angle couplers in steel-tube coupler scaffolds. Journal of Constructional Steel Research, 125 (Oct), 43-60.
[23] Blazik-Borowa, E., Szer, J., Norowa, A., Robak, A. and Pienko, M. (2019). Modelling of load-displacement curves obtained from scaffold component tests. Bulletin of the Polish Academy of Sciences, 67(2), 317-327.
[24] Chandrangsu, T. and Rasmussen, K. (2011). Investigation of geometric imperfections and joint stiffness of support scaffold systems. Journal of Constructional Steel Research, 67(4), 576–584.
[25] Chandrangsu, T. and Rasmussen, K. (2011). Structural modelling of support scaffold systems. Journal of Constructional Steel Research, 67(5), 866–875.
[26] Beale, R.G. (2014). Scaffold Research – A review. Journal of Constructional Steel Research, 98(1), 188-200.
[27] Markazi, F.D., Godley, M.H.R. and Beale, R.G. (1997). “Experimental Analysis of Semi-Rigid Boltless connections”, Thin Walled Structures, 27, 53-87.
[28] BSI (2009). BS EN 15512:2009. Steel static storage systems - Adjustable pallet racking systems - Principles for structural design. London, UK: British Standards Institution.
[29] BSI (2002). BS EN 12811-3:2002. Temporary works equipment, Part 3: Load testing. London, UK: British Standards Institution.
[30] Dassault Systèmes Simulia Corp. (2013). ABAQUS Analysis User’s Manual Online Documentation, Version 6.13. Providence, RI, USA.
[31] Li, Y.N., Karr, D.G. and Wang, G. (2007). Mesh size effects in simulating ductile fracture of metals. In: Proceedings of 10th International Symposium on Practical Design on Ships and Other Floating Structures. Houston, TX, USA, 247-254.