focus market sales trends - rak ceramics · kajaria dynasty kale group pamesa rovese cecafi mulia...
TRANSCRIPT

September 2016
Investor Presentation

DISCLAIMER
2
• This information contained in the enclosed presentation summarizes preliminary and introductory information on RAK Ceramics PSC (the Company). This presentation has been prepared for information purposes only and is not and does not form part of or constitute any prospectus, offering memorandum or offering circular or offer for sale or solicitation of any offer to subscribe for or purchase or sell any securities nor shall it or any part of it form the basis of or be relied on in connection with any credit evaluation or third party evaluation of any securities or any offerings or contract or commitment whatsoever.
• The information contained herein has been prepared by the Company. Some of the information relied on by the Company is obtained from sources believed to be reliable but does not guarantee its accuracy or completeness. All potential recipients of the enclosed presentation are expected to be aware that the information contained herein is preliminary as of the date hereof, supersedes any previous such information delivered and will be superseded by any such information subsequently delivered. The information contained herein is subject to change without notice. The Company is under no obligation to update or keep current the information contained herein. No person shall have any right of action (except in case of fraud) against the Company or any other person in relation to the accuracy or completeness of the information contained herein.
• Some of the information in this presentation may contain projections or other forward-looking statements regarding future events or the future financial performance of The Company. These forward-looking statements include all matters that are not historical facts. The inclusion of such forward-looking information shall not be regarded as a representation by the Company or any other person that the objectives or plans of the Company will be achieved. Future events are subject to various risks which cannot be accurately predicted, forecasted or assessed. No assurance can be given that future events will occur or that the company’s assumptions are correct. Actual results may differ materially from those projected and past performance is not indicative of future results. The Company undertakes no obligation to publicly update or publicly revise any forward-looking statement, whether as a result of new information, future events or otherwise. Accordingly all potential recipients are expected to conduct their own due diligence on the information provided.
• These materials are confidential and are being submitted to selected recipients only for the purpose described above. They may not be taken away, reproduced (in whole or in part), distributed or transmitted to any other person without the prior written consent of the Company. These materials are not intended for distribution to, or use by any person or entity in any jurisdiction or country where such distribution or use would be contrary to local law or regulation and must not be acted on or relied on by persons who are not relevant persons. If this presentation has been received in error it must be returned immediately to the Company.

CONTENTS
ABOUT RAK CERAMICS
‣Investment Case
‣Brief Corporate History
‣Global Capacity by Segment & Market Positioning
‣Focus Markets
Q2/16 RESULTS
‣Operational Highlights
‣Progression against Value Creation Plan
‣Financial Performance
STRATEGY & OUTLOOK
‣2016 Priorities
‣Non Core Asset Sales to Continue
RAKCEC STOCK
‣Shareholder Composition and Stock Performance
‣Valuation vs. Peers
‣Analyst Coverage and Consensus Estimates
APPENDIX
‣5 Year Highlights
3

INVESTMENT CASE
• A Turnaround Story – RAK Ceramics is in the process of becoming a production-centric manufacturer of tiles focused on the distributor channel to a customer-centric ceramic goods manufacturer with a recognizable consumer brand selling in multiple channels.
• Active and Experienced Shareholders – In June 2014, a consortium led by SAMENA Capital bought over 30% of the company and took three seats on the board. The Vice Chairman of SAMENA also chairs the executive committee, tasked with oversight of the strategic agenda and the operational turnaround of RAK Ceramics. RAK Ceramics is SAMENA’s largest portfolio investment representing 1/3 of their AUMs.
• Strong Emerging Markets Exposure – The GCC, Bangladesh and India represent 65-70% of the company’s tiles and sanitaryware sales; these countries have exhibited faster rates of growth historically than the tile and sanitaryware industry. RAK Ceramics is also one of the few GCC Companies with established production capacity in Iran. The company has restarted Iranian production this year and is well positioned to benefit from improved business conditions in that country post removal of sanctions and integration in the global financial system.
• Earnings Leverage from Loss Making Operations – Today, RAK Ceramic’s manufacturing operations in India, Iran and China are losing money. Breaking even in Iran and China alone could add AED34mn at the EBITDA level (AED594mn EBITDA in 2015). The Indian operation has the greatest potential but the turnaround there will take longer to play out.
• High Dividend Yield and Low Valuation - For 2015, RAK Ceramics paid a 30 fils cash dividend plus a 5% stock dividend. On a current stock price of AED3.20, this represents ~9.4% dividend yield. The company’s attractive valuation (AED2,720mn) is further highlighted when once considers that the company has AED900mn of land on its books which does not contribute to earnings s stock and the value of the company’s stake in RAK Ceramics Bangladesh (a publicly listed entity on the Dhaka stock exchange) , currently valued at around AED650mn. We estimate that ex land and ex RAK Bangladesh stake, the stub value of RAK Ceramics is trading at a market cap of AED1,180mn, about 3.8x 2015 net earnings
4

BRIEF CORPORATE HISTORY
Founded by H.H. Sheikh
Saud Bin Saqr Al Qasimi,
Ruler of Ras Al Khaimah
1989
RAK Porcelain launched
with capacity of 15mn
pieces per year
2006
First tile plant started in
Ras Al Khaimah (RAK)
with capacity of 1.7mn
square meters (sqm)
per year
Kludi-RAK launched
with capacity of 0.5mn
pieces per year
2007
First sanitaryware
plant started in RAK
with capacity of
350,000 pieces per
year
Further 9 tile plants
were started in RAK
adding 76mn sqm of
capacity
WORLD
NO.1
1991 1993 1995-2009
Sanitaryware plants
added in UAE,
Bangladesh and India.
Output increases to
4.5mn pieces per year
2004-2008
Plants in Bangladesh,
China, Sudan, Iran and
India add tile capacity
of 21.8mn sqm per
year
2000-2006
SAMENA Capital
acquires 30.4% from
largest shareholder
2014
World's largest
ceramics manufacturer
with 117mn sqm of
annual capacity
2010
Expansion of capacity in
Bangladesh and UAE.
Exited Sudan.
2015
5

In 2016, we completed a tile capacity expansion in Bangladesh (42% increase) and sanitaryware capacity in the UAE (20% increase);
current capacity as of Q2/16 for all our production locations can be seen below. The utilisation rates* at our plants in 2015 was
83.4% in the UAE, 75.6% in Bangladesh and 95.5% in India; the China plant was idle and the Iranian plant only restarted production
in 2016. In Sanitaryware, utilisation rates at our plants in 2015 was 100% in the UAE, 89.0% in Bangladesh and 69.1% in India.
SANITARYWARE (MN PCS) TABLEWARE (MN PCS) TAPS/FAUCETS (MN PCS) TILES (MN SQM)
OUR CAPACITY & UTILISATION BY PRODUCT & LOCATION
UAE 81.9
Bangladesh 11.6
India 8.0
Iran 6.0
Total 107.5
China* 5.4
UAE 0.6
Total 0.6
UAE 24
Total 24
UAE 3.3
Bangladesh 1.6
India 0.7
Total 5.6
*Production halted.
6
* Tile utilization rates are calculated for a standard size tile and affected by varying sizes, widths and thicknesses

MARKET POSITIONING
In 2014, RAK Ceramics was the 4th largest producer of ceramic tiles globally and the 11th largest sanitary ware producer.
0 50 100 150 200 250
HR Johnson
Vitromex
White Horse
Lasselserger
Arwana
San Lorenzo (Argentina)
Kajaria
Dynasty
Kale Group
Pamesa
Rovese
Cecafi
Mulia
Saudi Ceramics
Grupo Cedasa
Incefra (Brazil)
RAK Ceramics
Lamosa
Siam Cement (Thailand)
Mohawk Industries
0 10 20 30 40
Siam Cement
Ferrum (Argentina)
Villeroy & Boch (Germany)
Saudi Ceramics (KSA)
Corporacion Ceramica
Lamosa (Mexico)
Duravit (Germany)
CISA Group (Chile)
Ideal Standard (Belgium)
RAK Ceramics
Vitra (Turkey)
Lecico (Egypt)
Rovese (Poland)
Lixil (Japan)
Duratex (Brazil)
Corona (Columbia)
Toto (Japan)
Sanitec
Kohler Group (USA)
Roca (Spain)
TILES MARKET PRODUCTION (MN SQM)
SANITARYWARE MARKET PRODUCTION (MN PCS)
7

0
50
100
150
200
250
300
2004 2005 2006 2007 2008 2009 2010 2011 2012 2013 2014
SQM
Mill
ion
s
Production Consumption
0
20
40
60
80
100
120
2004 2005 2006 2007 2008 2009 2010 2011 2012 2013 2014
SQM
Mill
ion
s
Production Consumption
0
200
400
600
800
1000
2004 2005 2006 2007 2008 2009 2010 2011 2012 2013 2014
SQM
Mill
ion
s
Production Consumption
0
10
20
30
40
50
60
2004 2005 2006 2007 2008 2009 2010 2011 2012 2013 2014
SQM
Mill
ion
s
Production Consumption
FOCUS MARKETS
BANGLADESH INDIA
UNITED ARAB EMIRATES SAUDI ARABIA
The UAE, KSA, Bangladesh and India are RAK Ceramic’s focus markets. The company has manufacturing plants in each of these
locations except in KSA which is supplied from the UAE. These four markets have seen tile production and consumption grow at
CAGR of 10-12% in the last 10 years vs. growth of 6-7% for the tile market globally. In 2015, these four markets accounted for 68%
of RAK Ceramic’s tile sales and 65% of sanitaryware sales.
Consumption CAGR + 50%
Production CAGR +25%
Consumption CAGR + 11%
Production CAGR +12%
Consumption CAGR + 3%
Production CAGR +3%
Consumption CAGR + 11%
Production CAGR +18%
*Production and consumption data in millions of square meters.
Our market share in Bangladesh is 11% Our market share in India is 2%
Our market share in UAE is 19% Our market share in KSA is 8%
8

H1/16 OPERATIONAL HIGHLIGHTS
Core Business CAPEX
AED1,492mn, -3.6% YoY driven
lower by non core (-AED68mn)
Cons. GM 29.8%, +190 bps YoY
Core at 30.0%, -10bps YoY
AED282.6mn, -0.8% YoY,
Margin is 18.9%, +50bps YoY
AED163.7mn, +14.0% YoY
Margin is 11.0%, +170ps YoY
AED158.0mn, +3% YoY excl.
provisions and one time losses
on asset sales
AED131.2mn, -9.9% YoY
Normalized Net Profit
Group Revenue Consolidated GM
AED8.2mn YTD
Dar Al Sharia certifies RAK
Ceramics shares to be Sharia
compliant for the purpose of
investing and trading
Net Debt to EBITDA improved to
3.0x from 3.1x at end of Q1/16
despite liquidity environment
EBITDA
Operating Profit
Sharia Compliance Gearing Raw Material Cost Savings
Reported Net Profit
9
EBITDA
REPORTED NET PROFIT
SHARIA COMPLIANCE
CONSOLIDATED GM
NORMALIZED NET PROFIT
GEARING
GROUP REVENUE
OPERATING PROFIT
RAW MATERIAL SAVINGS

VALUE CREATION PLAN PROGRESS
10
MEDIUM TERM QUICK WINS
BREAK THROUGH INITIATIVES
LONG TERM INITIATIVES
GREATEST POTENTIAL
LOW HANGING FRUIT
Strengthen B2B sales Non-core
Assets
Materials / Energy
Bangladesh strategy
Distributor JVs &
receivables
UAE expansion
Tableware Strategy
Iran
China restructuri
ng
India Strategy
Taps & Faucets
New markets
Sanitaryware
strategy Design team
Brand building Organizati
on & Managem
ent
Laticrete Investor relations
Corporate governanc
e
DIFFICULT EASY EASE OF IMPLEMENTATION
LOW
H
IGH
FI
NA
NC
IAL
IMPA
CT
Two years after adopting the VCP, we have made significant progress on the initial targets. In Q2/16 alone, we
integrated the German and UK Distribution in the group and we completed the acquisition of our Italian
Distributor. On the production front, we restarted Iran production, completed the expansions in UAE sanitaryware
and Bangladesh tiles. We will soon be releasing updated VCP initiatives (VCP 2.0) to set out our next priorities.
In Progress Completed

RESULTS SUMMARY
AED Millions Q2/14 Q3/14 Q4/14 Q1/15 Q2/15 Q3/15 Q4/15 Q1/16 Q2/16
Revenue (Net)
Tiles 574.3 542.0 524.3 480.3 514.3 531.5 470.8 496.0 487.0
SW 115.0 111.8 111.6 110.9 116.2 108.6 108.2 111.5 122.4
Porcelain - - 35.1 35.1 36.0 36.2 38.3 37.2 51.2
Core revenue 689.3 653.7 670.9 626.2 666.6 676.4 617.3 644.7 660.6
Non Core Revenue 123.5 131.1 118.8 118.0 137.6 106.4 130.8 91.0 96.1
Total Revenues 812.8 784.9 789.7 744.2 804.2 782.8 748.1 735.7 756.6
Total EBITDA 176.1 154.2 119.9 128.7 156.2 155.3 154.0 138.3 144.3
Total EBITDA Margin 21.7% 19.6% 15.2% 17.4% 19.4% 19.8% 20.6% 18.8% 19.1%
Total Net Profit 91.2 57.4 74.4 59.5 86.1 83.2 81.5 65.9 65.3
Net Profit Margin 11.2% 7.3% 9.4% 8.0% 10.7% 10.5% 10.9% 9.0% 8.6%
11

12
FOCUS MARKET SALES TRENDS
85 88 87
70
85 89
115
82 77 74
6 6 8 8 8 10 8 4 7 7
0
20
40
60
80
100
120
AED
Mill
ion
s
KSA
Tile Revenue Sanitaryware Revenue
41 37
32 36 35 36
32
41 36 36
24 23 22 22 22
25 20
25 25 27
0
20
40
60
AED
Mill
ion
s
Bangladesh
Tile Revenue Sanitaryware Revenue
110 111 118 112
120 122 122 118 129 131
31 34 29 29 33 36 34 34 33 35
0
20
40
60
80
100
120
140
AED
Mill
ion
s
UAE
Tile Revenue Sanitaryware Revenue
104 101 105 116
94 94 94 83
76 68
10 10 10 10 6 8 7 6 5 6
0
20
40
60
80
100
120
140
AED
Mill
ion
s
India
Tile Revenue Sanitaryware Revenue

• Q2/16 tile revenues decreased by 5.3% YoY and 1.8% QoQ.
• Sales to the UAE increased by 7.1% YoY whereas export markets were challenging. The GCC, in particular Saudi Arabia, saw volume and price declines as distributors were tentative about taking up inventory in the quarter. Sales to Europe increased by 39.4% YoY as a result of consolidation of the German and UK distribution units, 2.9% on a like for like basis.
• Tile revenues from India decreased by 27.5% YoY. Volumes decreased 21.6% and ASPs by 9.3% reflecting a competitive environment. The decline in ASPs also reflects a 6.8% devaluation in the Indian Rupee versus the USD YoY.
• Tile revenues from Bangladesh were fairly stable, down only 0.6% YoY.
TILE REVENUES
13
0
50
100
150
200
250
300
350
400
450
500
UAE Bangladesh India
AED
Mill
ion
s
Q1 2014 Q2 2014 Q3 2014 Q4 2014 Q1 2015
Q2 2015 Q3 2015 Q4 2015 Q1 2016 Q2 2016

• Q2/16 tile margins decreased by 100bps YoY and 70bps QoQ to 24.7%.
• By production location, UAE tile gross margin fell from 31.7% to 29.7% driven by a less profitable product mix.
• India tile margin fell from 17.8% to 15.9% as a result of lower volumes and selling prices.
• Bangladesh tile margin fell from 38.2% to 31.4% as we only started producing tiles from the new line mid quarter and as such higher fixed costs disproportionately affected the gross margin in Q2/16. We expect Bangladesh tile margins to improve in Q3/16.
TILE MARGINS
* We now calculate Gross Margins based on Net Revenue as opposed to Gross Revenue (i.e., before
intercompany eliminations) previously. Prior year results have been restated accordingly.
0.0%
5.0%
10.0%
15.0%
20.0%
25.0%
30.0%
35.0%
40.0%
UAE Bangladesh India
Q1 2014 Q2 2014 Q3 2014 Q4 2014 Q1 2015
Q2 2015 Q3 2015 Q4 2015 Q1 2016 Q2 2016
14

• Q2/16 Sanitaryware sales increased by 5.3% YoY and 9.8% QoQ.
• By production location, revenues from the UAE increased by 8.3% YoY as we rolled out production from the new line and results benefited from the consolidation of the European JVs. Sales to Europe increased 37.9% YoY, 16.3% on a like for like basis. Local sales decreased by 3.6% YoY but increased 7.0% QoQ; sales to the rest of the GCC were weak in line with business sentiment in the building materials and construction sectors.
• Revenues from India decreased by 32.9% YoY driven by volumes.
• Revenues from Bangladesh increased by 8.1% YoY even as we anniversary the SW expansion completed in Q2/15.
SANITARYWARE REVENUES
15
0
20
40
60
80
100
120
RAK Ceramics UAE Bangladesh India
AED
Mill
ion
s
Q1 2014 Q2 2014 Q3 2014 Q4 2014 Q1 2015
Q2 2015 Q3 2015 Q4 2015 Q1 2016 Q2 2016

• Q2/16 sanitaryware margins decreased by 230bps YoY but increased 30 bps QoQ to 40.8%.
• In terms of production location, UAE margins decreased from 43.3% to 42.2% in the quarter. The decline in sanitaryware margin resulted from higher labor costs and depreciation as the new line of sanitaryware only contributed to sales for half the quarter.
• India margins decreased from 32.6% to 4.4% as we took a decision to clear old inventory in the quarter which could also impact results in H2/16.
• Bangladesh margins decreased 260bps to 43.5%. Higher labour and utility costs impacted our cost of production.
SANITARYWARE MARGINS
* We now calculate Gross Margins based on Net Revenue as opposed to Gross Revenue (i.e., before
intercompany eliminations) previously. Prior year results have been restated accordingly.
16
0.0%
10.0%
20.0%
30.0%
40.0%
50.0%
60.0%
UAE Bangladesh India
Q1 2014 Q2 2014 Q3 2014 Q4 2014 Q1 2015
Q2 2015 Q3 2015 Q4 2015 Q1 2016 Q2 2016

TABLEWARE
• Q2/16 tableware revenues increased by 41.8% YoY and 37.6% QoQ. Excluding the impact of consolidation of RAK Porcelain Europe, revenue growth was 31.0% YoY on a like for like basis.
• On YoY basis, volumes increased 22.9% while ASPs rose 15.3% YoY.
• Q2/16 Gross Margin was 62.2%, +720bps YoY and near the record profitability we recorded in Q1/16. On a like for like basis, Q2/16 Porcelain gross margin increased 90bps YoY to 55.9%.
• Recent product introductions at RAK Porcelain continue to be very well received by the market and we remain confident of solid growth and profitability for tableware in 2016.
0.0
10.0
20.0
30.0
40.0
50.0
60.0
Q4 2014 Q1 2015 Q2 2015 Q3 2015 Q4 2015 Q1 2016 Q2 2016
AED
Mill
ion
s
SALES
0.0%
10.0%
20.0%
30.0%
40.0%
50.0%
60.0%
70.0%
Q4 2014 Q1 2015 Q2 2015 Q3 2015 Q4 2015 Q1 2016 Q2 2016
GROSS MARGIN
17

NET DEBT & CAPEX HIGHLIGHTS
• Net debt stood at AED1.77bn at the Q2/16, a 3.7% decline QoQ. Net Debt to EBITDA improved to 3.0x from 3.1x.
• We completed our capacity for Bangladesh tiles and UAE sanitaryware in the quarter. Year to date, AED147.7mn has been spent including a one-time connection charge to the Federal Electricity & Water Authority.
• We revised our CAPEX spend forecast of AED300mn for 2016 to AED240mn to exclude a previously considered AED60mn for further UAE Sanitaryware expansion as we continue to evaluate our needs against the current market environment and against opportunities outside of the UAE.
NET DEBT (AED Millions) Q2/15 Q3/15 Q4/15 Q1/16 Q2/16
Long Term Loan
1,244.5
1,350.3
1,309.7
1,281.9 1190.2
STL & TR
803.8
629.7
654.7
898.0 861.6
Overdraft
177.1
121.3
8.6
29.6
45.3
Gross Debt
2,225.4
2,101.3
1,973.0
2,209.5
2,097.1
Cash & Bank*
(627.2)
(508.1)
(363.4)
(369.0)
(325.5)
Net Debt
1,598.2
1,593.2
1,609.6
1,840.5
1,771.6 Cost of Debt 2.60% 2.45% 2.60% 2.61% 2.50% Net Debt to EBITDA 2.9x 2.8x 2.7x 3.1x 3.0x
18
(AED Millions) H1/15 H1/16 YoY
CAPEX
Core
UAE 48.7 85.1 74.7%
Bangladesh 32.0 17.9 -44.1%
India 7.4 0.9 -87.8%
Other Core 2.4 3.5 45.8%
Sum 90.5 107.6 18.7%
Non Core
AHCC 5.2 0.4 -92.3%
Other 3.6 2.3 -36.1%
Sum 8.8 2.7 -69.3%
FEWA Connection Charges 0.0 37.4 nm
Total CAPEX 99.3 147.7 48.5%

WORKING CAPITAL HIGHLIGHTS
• In light of the slowdown in the GCC construction sector and weak business sentiment, distributors were skittish about taking on more inventory in the quarter and as a result our inventory on hand grew to 206 days from 199 days at the end of Q1/16.
• Receivable days also rose to 113 days from 108 days at end of Q1/16 but remains better year and year and reflect stringent measures we put in place to minimize counter party risk.
• We were able to extend payable terms somewhat and payables rose to 80 days from 76 at the end of Q1/16.
19
100
105
110
115
120
Q1/15 Q2/15 Q3/15 Q4/15 Q1/16 Q2/16
RECEIVABLE DAYS OUTSTANDING
170
175
180
185
190
195
200
205
210
Q1/15 Q2/15 Q3/15 Q4/15 Q1/16 Q2/16
INVENTORY DAYS OUTSTANDING
62
64
66
68
70
72
74
76
78
80
82
Q1/15 Q2/15 Q3/15 Q4/15 Q1/16 Q2/16
PAYABLE DAYS OUTSTANDING

2016 FOCUS REMAINS THE SAME – SET STAGE FOR GROWTH
Core Business CAPEX
Preparations for new brand
image/logo/marketing campaign
at Cersaie in Q3 are on track
Hired ~200 employees and
restarted production in Q2/16
New CEO joined in May. New HR
Head recently appointed.
Process of rebuilding team under
way.
Inventory sale under way. Search
for buyer of plant continues.
Polishing machinery to be
moved to Iran.
UK and German team integration
ongoing, cost synergies
expected 2017. Italy
consolidation as of Q3/16
AED60mn funds earmarked for
expansion in UAE cut back from
2016 CAPEX plan.
Normalized Net Profit
Group Revenue Consolidated GM
Assets of Al Hamra and Electro
RAK Group most likely near term
candidates
Ongoing
Initiating production changes to
better match inventory and
demand for select products
EBITDA
Operating Profit
Sharia Compliance Gearing Raw Material Cost Savings
Reported Net Profit
20
INDIA TURNAROUND
EVALUATE OPTIONS FOR SW EXPANSION
OPPORTUNISTIC ACQUISITIONS
IRAN RESTART
RESTRUCTURING OF DISTRIBUTION JVs
WORKING CAPITAL MANAGEMENT
BRANDING PROJECT
CHINA PLANT SALE
CONTINUED NON CORE DISPOSALS

CAPEX CYCLE COMPLETED
CAPEX SPENDING - LAST 5 YEARS TILE CAPACITY ADDITIONS
SANITARYWARE CAPACITY ADDITIONS
2015 2016 Timing Cost
AED mn
UAE 2,700 3,294 Q1/16 81
2015 2016 Timing Cost
AED mn
Bangladesh 8.0 11.6 Q1/16 97
Shown in SQM millions
Shown in thousands of pieces
• 2014 shows core CAPEX only but total CAPEX spend that year was AED280mn.
• 2016 CAPEX includes AED55mn of growth CAPEX which was already spent by end Q2/16; maintenance CAPEX of AED185 includes a one time AED38mn connection fee to the UAE’s Federal Electricity and Water Authority
0
50
100
150
200
250
300
2011 2012 2013 2014 2015 2016e
AED
Mill
ion
s
21

ASSET DISPOSAL CYCLE
ASSETS PER SEGMENT (Q2/16) – AED MILLIONS EVOLUTION OF NON CORE ASSETS AS % OF TOTAL ASSETS
Assets outside of the ceramics business are 33% of total assets but only 16% of total revenues. Land contributes no income. The
company’s aim is to exit non core businesses in the next 12-18 months, depending on market conditions.
22
Core, 4,238 , 71%
Non Core, 567 , 10%
Land at al Jazeera, 899 ,
15%
Investment Properties,
255 , 4%
0.0%
5.0%
10.0%
15.0%
20.0%
25.0%

STOCK PERFORMANCE AND SHARE OWNERSHIP
STOCK PERFORMANCE SHARE OWNERSHIP
Samena Group, 31.6%
Sh. Saud bin Saqr Al Qasimi,
5.1%
RAK Royal Family, 6.8% RAK
Government, 5.0%
Institutions, 12.8%
Retail, 38.7%
0
20
40
60
80
100
120
140
12
/31
/20
14
1/3
1/2
01
5
2/2
8/2
01
5
3/3
1/2
01
5
4/3
0/2
01
5
5/3
1/2
01
5
6/3
0/2
01
5
7/3
1/2
01
5
8/3
1/2
01
5
9/3
0/2
01
5
10
/31
/20
15
11
/30
/20
15
12
/31
/20
15
1/3
1/2
01
6
2/2
9/2
01
6
3/3
1/2
01
6
4/3
0/2
01
6
5/3
1/2
01
6
6/3
0/2
01
6
Anwar Ceramics Saudi Ceramics 'RAK Ceramics'
LECICO Maha Ceramics ADX Index23

COMP TABLE
All figures in USD mns except share price. Source: Capital IQ 24
Valuation Benchmarking
(All figures in USDmn except share price)
Share Price EV / Sales EV / EBITDA EV / EBIT EV / EBIT P / E Net Debt /
(Local) (USD) M Cap EV P/B LTM 2016E 2017E LTM 2016E 2017E LTM 2015E 2016E LTM 2016E 2017E LTM EBITDA
Ceramics Producers
Ras Al Khaimah Ceramics PSC AED 3.17 0.9 741 1,205 0.9x 1.54x 1.53x 1.36x 8.0x 9.2x 8.1x 12.4x 12.4x 15.5x 8.8x 11.0x 8.6x 2.7x
RAK Ceramics (Bangladesh) Limited BDT 57.1 0.7 245 255 3.4x 3.86x na na 13.5x na na 16.9x 34.0x na 17.9x na na 0.6x
The Siam Cement Public Company Limited THB 518.0 15.0 17,963 20,373 2.8x 1.88x 1.84x 1.72x 10.4x 10.1x 9.8x 14.3x 15.2x 14.0x 12.4x 12.5x 12.5x 2.0x
Mohawk Industries Inc. USD 209.7 209.7 15,547 18,422 2.9x 2.13x 2.07x 1.96x 11.6x 10.9x 10.2x 15.3x 17.6x 14.3x 18.7x 16.7x 15.6x 1.8x
Grupo Lamosa, SAB de CV MXN 36.40 2.0 774 1,041 2.1x 1.69x na na 8.2x na na 9.9x 10.4x na 15.6x na na 2.0x
Saudi Ceramic Company SAR 34.73 9.3 463 677 0.9x 1.72x 1.81x 1.50x 6.5x 7.0x 6.4x 11.5x 8.6x 12.9x 8.9x 8.8x 7.6x 2.1x
Kajaria Ceramics Limited INR 1,249.9 18.7 1,487 1,535 10.7x 4.16x 3.74x 3.29x 20.3x 18.1x 16.3x 24.0x 28.0x 21.2x 40.4x 34.2x 29.4x 0.5x
Dynasty Ceramic Public Company Limited THB 4.30 0.1 811 836 8.8x 3.99x 3.90x 3.69x 13.8x 13.2x 12.4x 16.1x 16.6x 15.5x 19.8x 18.7x 17.5x 0.3x
Al Anwar Ceramic Tiles Company SAOG OMR 0.22 0.6 169 145 1.7x 2.39x 2.29x 2.21x 8.4x 7.5x 7.5x 12.0x 8.5x 9.9x 13.8x 13.0x 10.9x NM
Eternit S.A. BRL 1.78 0.6 100 151 0.6x 0.50x na na 3.3x na na 4.5x 3.2x na (38.6x) na na 1.0x
Mean 3.8x 2.31x 2.61x 2.40x 10.3x 11.1x 10.4x 13.4x 13.5x 14.7x 11.4x 17.3x 15.6x 1.4x
Median 2.4x 2.01x 2.18x 2.09x 9.4x 10.5x 10.0x 13.1x 12.8x 14.2x 14.7x 14.9x 14.0x 1.8x
Sanitary Ware Producers
LIXIL Group Corporation JPY 2,007.0 20.0 5,860 12,035 1.2x 0.67x 0.68x 0.67x 12.4x 10.6x 9.3x 32.2x 17.6x 20.2x nm 13.3x 10.2x 6.6x
Toto Ltd. JPY 3,845.0 38.3 6,456 5,647 2.4x 1.05x 1.03x 1.01x 9.0x 8.8x 8.3x 12.5x 12.9x 12.6x 18.5x 18.2x 17.6x NM
Villeroy & Boch AG EUR 13.69 15.4 408 598 2.2x 0.44x 0.43x 0.41x 5.6x 4.6x 4.4x 9.9x 9.9x 7.7x 13.2x 13.0x 11.5x NM
Rovese Spolka Akcyjna PLN 2.45 0.6 524 759 1.6x 1.63x na na 12.6x na na 34.9x 44.4x na na na na 4.0x
Lecico Egypt S.A.E. EGP 2.68 0.3 24 114 0.3x 0.80x 0.74x na 37.6x na na nm na na nm nm nm 29.7x
Mean 1.5x 0.92x 0.72x 0.70x 15.4x 8.0x 7.3x 22.4x 21.2x 13.5x 15.8x 14.8x 13.1x 13.4x
Median 1.6x 0.80x 0.71x 0.67x 12.4x 8.8x 8.3x 22.4x 15.2x 12.6x 15.8x 13.3x 11.5x 6.6x
Ceramic TableWare Producers
Churchill China plc GBP 7.74 10.1 110 95 2.7x 1.56x 1.51x 1.44x 11.7x 10.1x 9.4x 15.2x 15.2x 13.3x nm nm nm NM
Fiskars Oyj Abp EUR 17.52 19.8 1,616 1,889 1.3x 1.38x 1.35x -- 17.6x 14.5x -- 25.8x 27.2x 21.3x nm nm nm NM
Mean 2.0x 1.47x 1.43x 0.72x 14.6x 12.3x nm 20.5x 21.2x 17.3x # nm nm nm nm
Median 2.0x 1.47x 1.43x 0.72x 14.6x 12.3x nm 20.5x 21.2x 17.3x # nm nm nm nm
All Producers
Mean 2.8x 1.73x 1.78x 1.63x 12.6x 10.5x 8.5x 17.0x 16.8x 14.8x # 12.3x 16.5x 14.7x 5.0x
Median 2.1x 1.63x 1.66x 1.50x 11.6x 10.1x 9.3x 14.7x 15.2x 14.0x # 14.7x 13.3x 12.5x 2.0x

ANALYST COVERAGE AND CONSENSUS ESTIMATES
Company Analyst Date of last report Recommendation Target Price
(AED)
EFG Hermes Tarek El Shawarbi Jun 26 2016 Buy 4.10
CI Capital Alia El Mehelmy Mar 13 2016 Buy 4.70
Arqaam Capital Mohammed Kamal Aug 4 2016 Hold 3.50
SICO Anoop Fernandes Aug 4 2016 Buy 3.90
NBAD Sanyalaskna Manibandu Aug 4 2016 Buy 3.75
Mubasher Sherif Noureldeen Aug 4 2016 Buy 4.48
AED Mns Revenues
2016e Revenues
2017e EBITDA 2016e
EBITDA 2017e
Net Income 2016e
Net Income 2017e
Consensus Estimates as of August 18th 2016
3,219 3,402 557 605 317 356
25

REFERENCE AND CONTACT INFORMATION
Investor Relations Contact:
Philippe Habeichi, CFA – Head of Investor Relations
Email: [email protected]
26
2011-2015 HIGHLIGHTS
APPENDIX
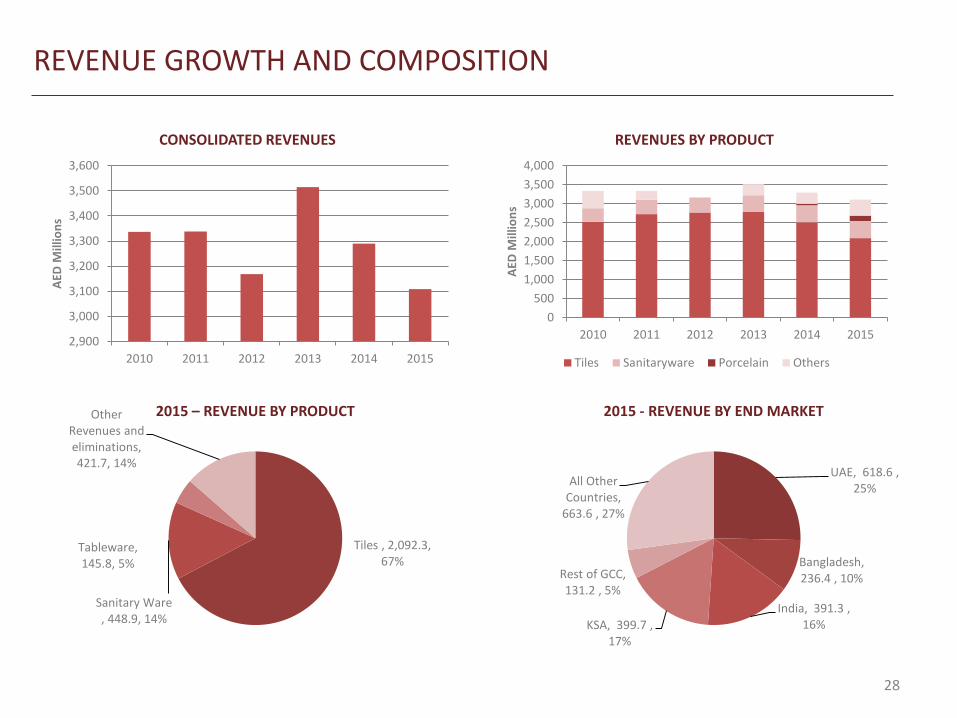
REVENUE GROWTH AND COMPOSITION
2,900
3,000
3,100
3,200
3,300
3,400
3,500
3,600
2010 2011 2012 2013 2014 2015
AED
Mill
ion
s
CONSOLIDATED REVENUES
0
500
1,000
1,500
2,000
2,500
3,000
3,500
4,000
2010 2011 2012 2013 2014 2015
AED
Mill
ion
s
REVENUES BY PRODUCT
Tiles Sanitaryware Porcelain Others
Tiles , 2,092.3, 67%
Sanitary Ware , 448.9, 14%
Tableware, 145.8, 5%
Other Revenues and eliminations, 421.7, 14%
2015 – REVENUE BY PRODUCT
UAE, 618.6 , 25%
Bangladesh, 236.4 , 10%
India, 391.3 , 16% KSA, 399.7 ,
17%
Rest of GCC, 131.2 , 5%
All Other Countries,
663.6 , 27%
2015 - REVENUE BY END MARKET
28

PERFORMANCE BY SEGMENT
0
200
400
600
800
1,000
1,200
1,400
1,600
1,800
2,000
AED
Mill
ion
s
TILE REVENUES BY SEGMENT
2010 2011 2012 2013 2014 2015
0
50
100
150
200
250
300
350
RAK Ceramics UAE Bangladesh India
AED
Mill
ion
s
SANITARYWARE REVENUES BY SEGMENT
2010 2011 2012 2013 2014 2015
29

MARGIN EVOLUTION
0.0%
5.0%
10.0%
15.0%
20.0%
25.0%
30.0%
0
100
200
300
400
500
600
700
800
900
2010 2011 2012 2013 2014 2015
AED
Mill
ion
s
EBITDA MARGIN
EBITDA EBITDA margin
0.0%
2.0%
4.0%
6.0%
8.0%
10.0%
12.0%
150
170
190
210
230
250
270
290
310
330
2010 2011 2012 2013 2014 2015
AED
Mill
ion
s
NET INCOME MARGIN
Net Income Net Margin
30

MARGINS BY LOCATION
0.0%
5.0%
10.0%
15.0%
20.0%
25.0%
30.0%
35.0%
40.0%
45.0%
Tile - UAE Tile -Elegance
Tile -Bangladesh
Tile - India Tile - Sudan
TILE GROSS MARGINS BY LOCATION
2010 2011 2012 2013 2014 2015
0.0%
5.0%
10.0%
15.0%
20.0%
25.0%
30.0%
35.0%
40.0%
45.0%
50.0%
SW - UAE SW - Bangladesh SW - India
SANITARYWARE GROSS MARGINS BY LOCATION
2010 2011 2012 2013 2014 2015
31

COGS BREAKDOWN EVOLUTION BY PRODUCT SEGMENT
46.9% 53.8% 54.8% 54.7% 57.0% 53.8%
21.7%
22.0% 21.8% 20.4% 22.1%
22.5%
8.0%
7.8% 7.8% 10.2% 8.2%
9.4% 5.8%
5.9% 6.0% 5.7% 4.9% 6.4% 9.6%
7.3% 4.1% 4.5% 6.5% 6.0%
0.0%
20.0%
40.0%
60.0%
80.0%
100.0%
120.0%
2010 2011 2012 2013 2014 2015
TILES
Materials Energy/Fuel/Utilities
Labour Repairs & maintenance
Depreciation
47.5% 46.5% 47.6% 49.5% 57.3%
51.6%
17.6% 19.8% 19.8% 23.6%
23.0% 25.1%
11.6% 12.6% 12.1%
11.5%
14.1% 13.5%
3.5% 4.1%
11.0% 6.2%
3.7% 7.4%
7.8% 5.6%
3.6% 3.9%
3.5% 4.3%
0.0%
20.0%
40.0%
60.0%
80.0%
100.0%
120.0%
2010 2011 2012 2013 2014 2015
SANITARYWARE
Materials Labor
Energy, fuel & utility Repairs & maintenance
Depreciation
32

0.0%
1.0%
2.0%
3.0%
4.0%
5.0%
6.0%
2011 2012 2013 2014 2015
ROA
0.0%
2.0%
4.0%
6.0%
8.0%
10.0%
12.0%
2011 2012 2013 2014 2015
ROE
0.0%
2.0%
4.0%
6.0%
8.0%
10.0%
2011 2012 2013 2014 2015
ROIC
HISTORICAL RETURNS
33

NET GEARING, FREE CASH FLOW & DIVIDEND
2.1
2.7
2.6
2.3 2.4
2.7
0.0
0.5
1.0
1.5
2.0
2.5
3.0
0
200
400
600
800
1,000
1,200
1,400
1,600
1,800
2,000
2010 2011 2012 2013 2014 2015
AED
Mill
ion
s
NET DEBT & NET DEBT TO EBITDA
Net Debt Net Debt to EBITDA
-100
0
100
200
300
400
500
600
FY 2010 FY 2011 FY 2012 FY 2013 FY 2014 FY 2015
AED
Mill
ion
s
FREE CASH FLOW & DIVIDEND HISTORY
CFO after W/C CAPEX Dividend
34