focus area 17: medical product safety progress review november 5, 2003
TRANSCRIPT

Focus Area 17:Medical Product Safety
Progress Review
November 5, 2003
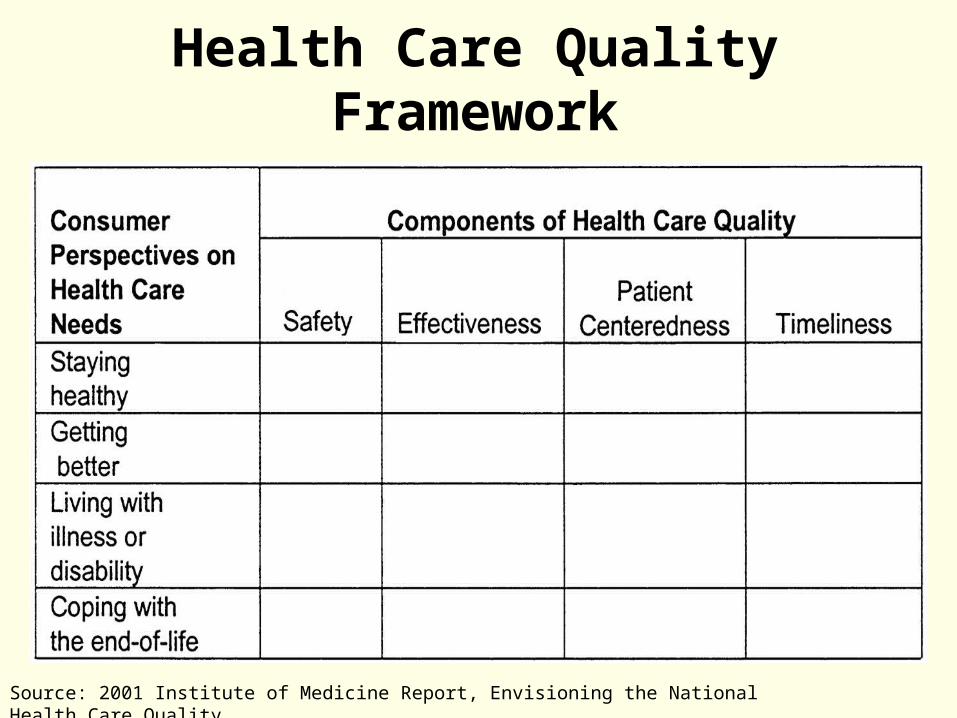
Health Care Quality Framework
Source: 2001 Institute of Medicine Report, Envisioning the National Health Care Quality.

Estimated Annual Burden
Adverse Medical Events 44,000 to 98,000 deaths Total national cost: $36.7 to $50 billion
Adverse Drug Events (ADE) 7,000 deaths due to medication error 2 out of 100 admissions experience
preventable ADE Average increased hospital cost of
preventable ADE: $4,700 per admission or $ 2 billion nationwide
Source: 1999 Institute of Medicine report, To Err Is Human Building a Safer Health System.

Leading Causes of Death: 2001
1. Heart disease
2. Malignant neoplasm
3. Cerebrovascular
4. Chronic lower respiratory
5. Unintentional injury
6. Diabetes
7. Influenza and pneumonia
8. Alzheimer’s disease
9. Nephritis
10. Septicemia
700,142
553,768
163,538
123,013
101,537
71,372
62,034
53,852
39,480
Adverse medical events (estimated): 44,000 – 98,000 *
Source: CDC, NCHS, National Vital Statistics System.
* Institute of Medicine report estimate.
Total Number of Deaths: 2,416,425
32,238

0
200
400
600
800
1000
1200
1400
1600
Number of Emergency Department Visits for Adverse Effects of
Medical Treatment
1992 1994 1996 1998 2000 2001
Number of visits (thousands)
Note: Data for 1994-2000 are 2-year averages. Source: CDC, NCHS, National Hospital Ambulatory Medical Care Survey.

Medical Product Safety Objectives
17-1* Monitoring of adverse medical events: a. associated with medical therapies
b. associated with medical devices17-2* Linked, automated information systems used:
a. by health care professionals in hospitals and integrated health systems b. by pharmacists and other dispensers
17-3* Provider review of medication taken by patients17-4* Receipt of useful information about prescription from pharmacies
17-5 Receipt of oral counseling about medication from:a. prescribers
b. dispensers17-6 Blood donation
*Developmental objectives; those in red have new baselines; those in grey have no baselines.
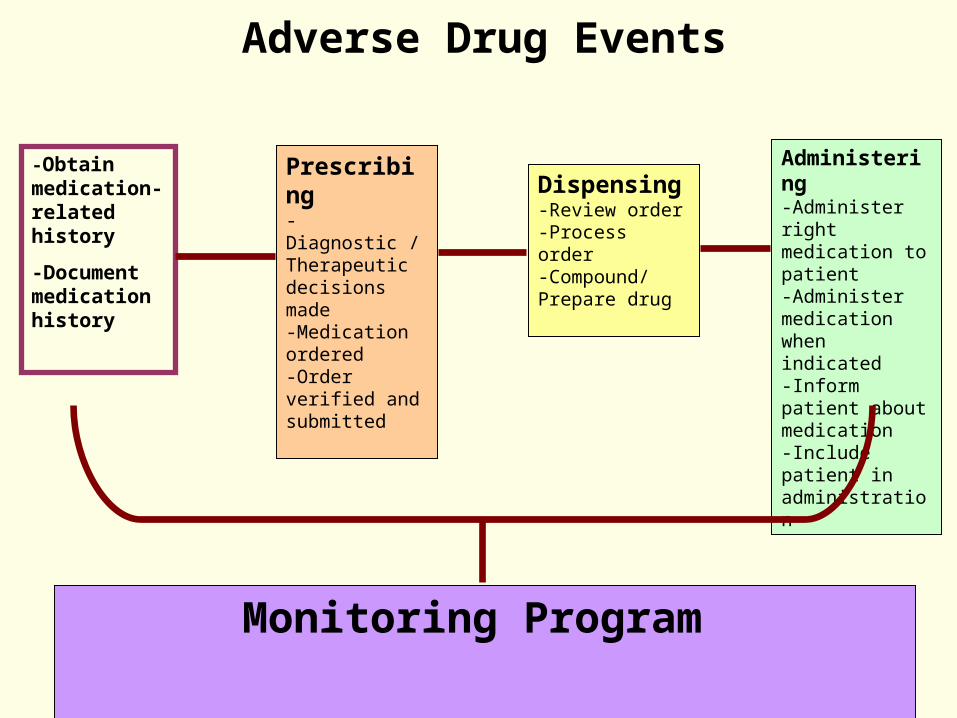
Administering-Administer right medication to patient-Administer medication when indicated-Inform patient about medication-Include patient in administration
Dispensing-Review order-Process order-Compound/Prepare drug
Prescribing-Diagnostic / Therapeutic decisions made-Medication ordered-Order verified and submitted
Monitoring Program
-Obtain medication-related history
-Document medication history
Adverse Drug Events

0
20
40
60
80
100
1998 2001
81.6 77.4
Hospitals with Monitoring Programs for Adverse Medical Drug Events
Percent of children’s and general medical surgical hospitals
Source: American Society of Health Systems Pharmacists, National Survey of Pharmacy Practice in Acute Care Settings,.
Obj. 17-1a: Developmental

2000 2001 2002 2003
19
131312
0
5
10
15
20
25
Obj. 17-2a: Developmental
Percent of health care organizations
Source: Health Information and Management Society, Annual HIMSS Leadership Survey.
Electronic Medical Record Use by Health Care Providers

0
10
20
30
40Percent of managed care and integrated health systems
2001
3133
Source: American Society of Health Systems Pharmacists, National Survey of Ambulatory Care Responsibilities of Pharmacists in Managed Care and Integrated Systems.
1999
Electronic Medical Record Use by Pharmacists
Obj. 17-2a: Developmental
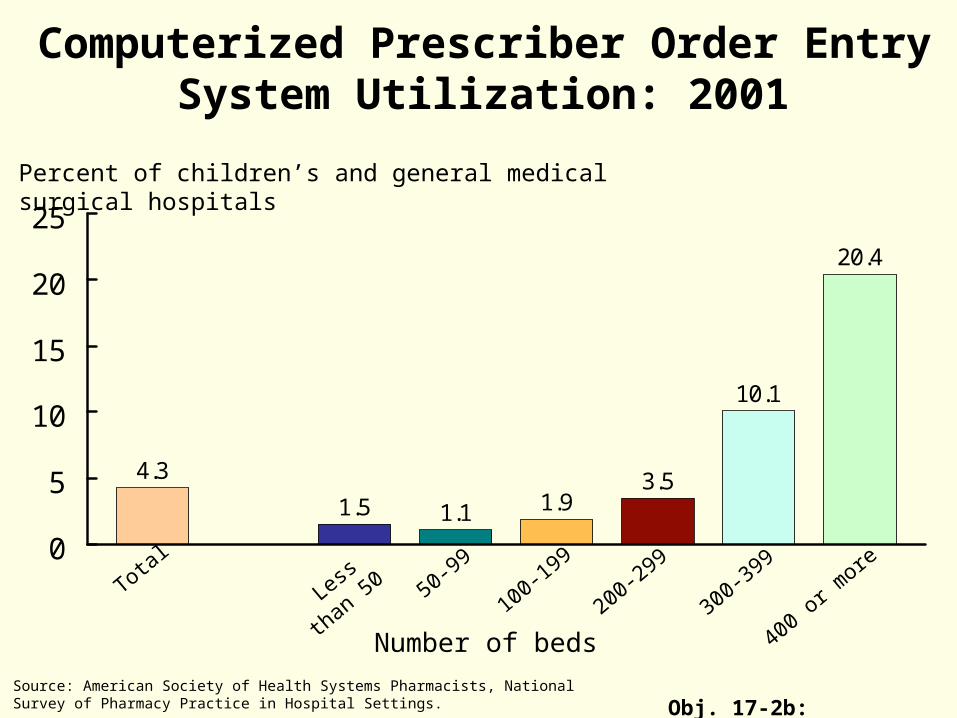
Computerized Prescriber Order Entry System Utilization: 2001
4.3
1.5 1.1 1.93.5
10.1
20.4
0
5
10
15
20
25
Source: American Society of Health Systems Pharmacists, National Survey of Pharmacy Practice in Hospital Settings.
Number of beds
Total
Less th
an
50 50-99
100-199
200-299
300-399
400 or more
Percent of children’s and general medical surgical hospitals
Obj. 17-2b: Developmental
0
20
40
60
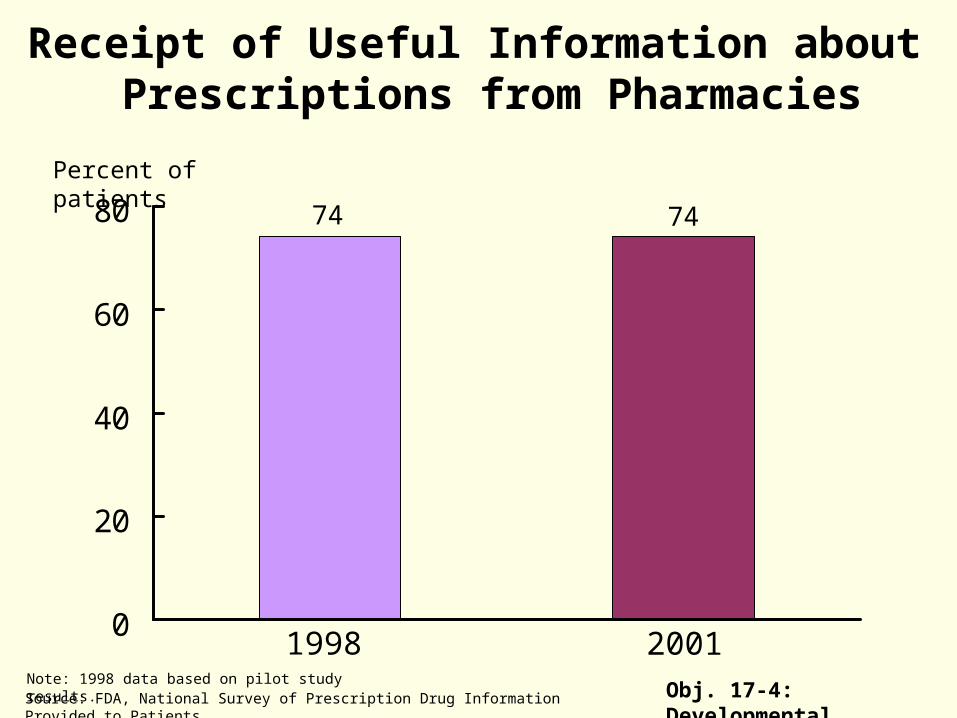
80Percent of patients
2001
74 74
Receipt of Useful Information about Prescriptions from Pharmacies
Source: FDA, National Survey of Prescription Drug Information Provided to Patients.
1998Obj. 17-4: Developmental
Note: 1998 data based on pilot study results.

Receipt of Oral Counseling from Prescribers and Pharmacists
Percent of patients
PharmacistsPrescribers
20001998
Obj. 17-5
2010 Target
90
100
30
10
Source: FDA, National Survey of Prescription Medicine Information Received by Consumers .
0
20
24 24
1412

0
2
4
6
8
10
Blood Donations, Adults 18 Years and Over:
1998 – 2001
Percent
Total
2010 Target
1998 1999 2000 2001Source: CDC, NCHS, National Health Interview Survey. Obj. 17-6

18-24 25-44 45-64 65+0
2
4
6
8
10Percent
Blood Donations by Age Group: 2001
Source: CDC, NCHS, National Health Interview Survey.Obj. 17-6
2010 Target
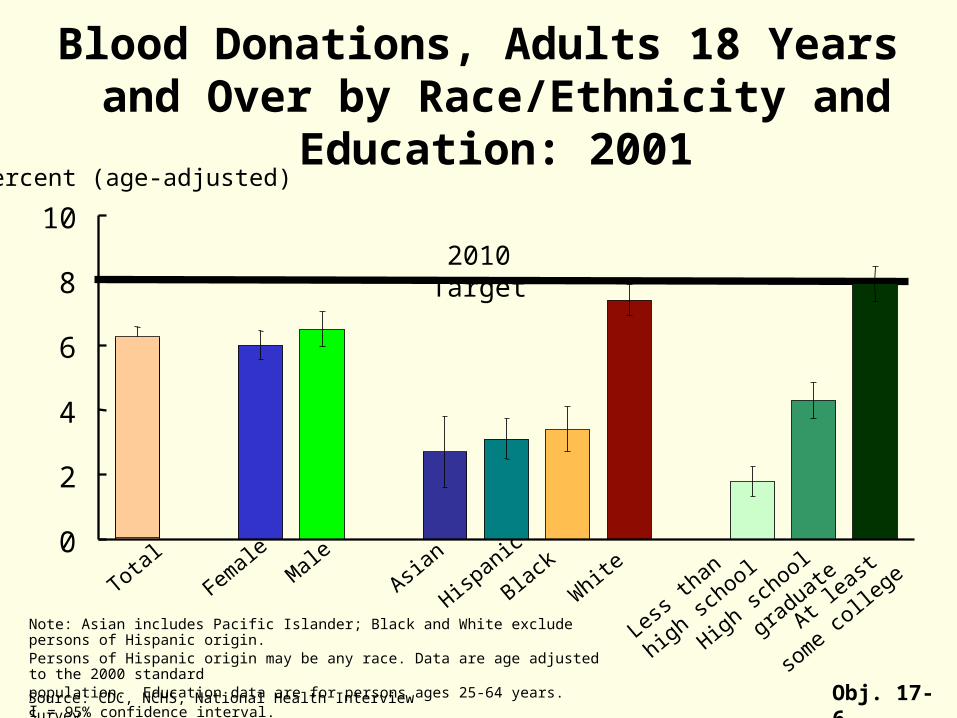
Blood Donations, Adults 18 Years and Over by Race/Ethnicity and
Education: 2001Percent (age-adjusted)
2010 Target
Source: CDC, NCHS, National Health Interview Survey.
TotalAsia
n
Hispanic
Black White
Less than
high school
High school
graduateAt le
ast
some college
Obj. 17-6
Note: Asian includes Pacific Islander; Black and White exclude persons of Hispanic origin. Persons of Hispanic origin may be any race. Data are age adjusted to the 2000 standard population. Education data are for persons ages 25-64 years.I = 95% confidence interval.
Female Male0
2
4
6
8
10

Progress review data and slidescan be found on the web at:
http://www.cdc.gov/nchs/hphome.htm