2003 tomato research progress report
TRANSCRIPT

Tomato Research Progress Report 2003 1
2003 Tomato Research Progress Report
Scott Stoddard
Assistant Farm Advisor
UCCE Merced & Madera Counties
University of California Cooperative Extension 2145 Wardrobe Ave.
Merced, CA 95340
(209) 385-7403 This report is also available at http://cemerced.ucdavis.edu
Table of Contents
Page
• Process Tomato Variety Trial ................................................................................... 2
• UCCE Statewide Processing Tomato Variety Trials ................................................. 6
• Regional Fresh Market Tomato Variety Trial ......................................................... 16
• Post Harvest Evaluations of Round Tomatoes: Merced .......................................... 23
• Evaluation of herbicides for the control of nutsedge and nightshade in processing
tomatoes ................................................................................................................ 30
• Ampacet Plastic Mulch ...........................................................................................36
• Worm control in late season fresh market tomatoes .................................................42
Tomato Research Progress Report 2003 2
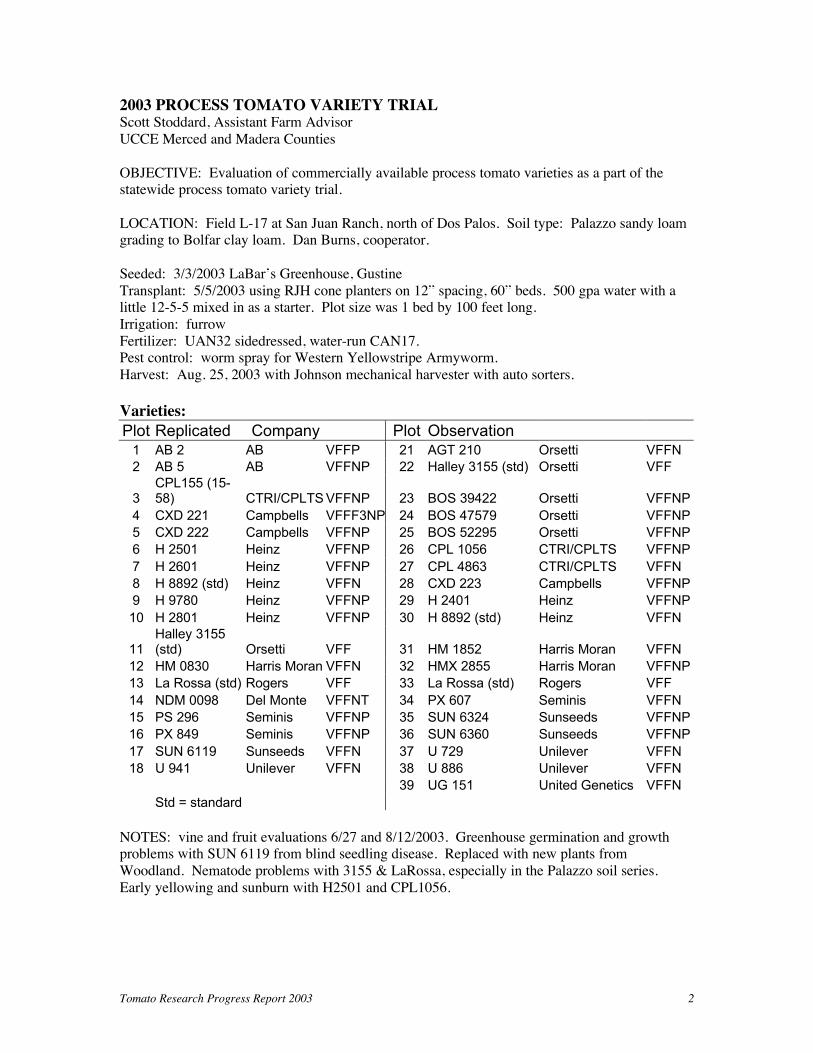
2003 PROCESS TOMATO VARIETY TRIAL Scott Stoddard, Assistant Farm Advisor
UCCE Merced and Madera Counties
OBJECTIVE: Evaluation of commercially available process tomato varieties as a part of the statewide process tomato variety trial.
LOCATION: Field L-17 at San Juan Ranch, north of Dos Palos. Soil type: Palazzo sandy loam grading to Bolfar clay loam. Dan Burns, cooperator.
Seeded: 3/3/2003 LaBar’s Greenhouse, Gustine
Transplant: 5/5/2003 using RJH cone planters on 12” spacing, 60” beds. 500 gpa water with a little 12-5-5 mixed in as a starter. Plot size was 1 bed by 100 feet long.
Irrigation: furrow
Fertilizer: UAN32 sidedressed, water-run CAN17. Pest control: worm spray for Western Yellowstripe Armyworm.
Harvest: Aug. 25, 2003 with Johnson mechanical harvester with auto sorters.
Varieties:
Plot Replicated Company Plot Observation 1 AB 2 AB VFFP 21 AGT 210 Orsetti VFFN
2 AB 5 AB VFFNP 22 Halley 3155 (std) Orsetti VFF
3 CPL155 (15-58) CTRI/CPLTS VFFNP 23 BOS 39422 Orsetti VFFNP
4 CXD 221 Campbells VFFF3NP 24 BOS 47579 Orsetti VFFNP
5 CXD 222 Campbells VFFNP 25 BOS 52295 Orsetti VFFNP
6 H 2501 Heinz VFFNP 26 CPL 1056 CTRI/CPLTS VFFNP
7 H 2601 Heinz VFFNP 27 CPL 4863 CTRI/CPLTS VFFN
8 H 8892 (std) Heinz VFFN 28 CXD 223 Campbells VFFNP
9 H 9780 Heinz VFFNP 29 H 2401 Heinz VFFNP
10 H 2801 Heinz VFFNP 30 H 8892 (std) Heinz VFFN
11 Halley 3155 (std) Orsetti VFF 31 HM 1852 Harris Moran VFFN
12 HM 0830 Harris Moran VFFN 32 HMX 2855 Harris Moran VFFNP
13 La Rossa (std) Rogers VFF 33 La Rossa (std) Rogers VFF
14 NDM 0098 Del Monte VFFNT 34 PX 607 Seminis VFFN
15 PS 296 Seminis VFFNP 35 SUN 6324 Sunseeds VFFNP
16 PX 849 Seminis VFFNP 36 SUN 6360 Sunseeds VFFNP
17 SUN 6119 Sunseeds VFFN 37 U 729 Unilever VFFN
18 U 941 Unilever VFFN 38 U 886 Unilever VFFN
39 UG 151 United Genetics VFFN
Std = standard
NOTES: vine and fruit evaluations 6/27 and 8/12/2003. Greenhouse germination and growth problems with SUN 6119 from blind seedling disease. Replaced with new plants from
Woodland. Nematode problems with 3155 & LaRossa, especially in the Palazzo soil series.
Early yellowing and sunburn with H2501 and CPL1056.

Tomato Research Progress Report 2003 3
RESULTS:
This trial was located near the San Joaquin River on a Palazzo sandy loam soil grading into Bolfar clay loam. Nematode pressure was high in the sandy loam soil, and the differences
between varieties that had nematode resistance (most) and those that did not (3155, LaRossa)
were striking. LaRossa and 3155 completely turned yellow and the plant canopy collapsed,
whereas the other lines were still green and healthy. Overall, this was an excellent trial, with average yields of 32 tons per acre and low weed and pest pressure.
In the observation trial, highest yields occurred with SUN 6324, H 8892, and CPL 4863, and
highest °Brix with PX 607, U886, and SUN 6324 (Table 1). H 8892 had a relatively low soluble
solids content of only 4.7%. Because SUN 6324 had high yields matched with high °Brix, it had
the highest Brix yield of 2.36 tons per acre. LED color and fruit pH are also shown in Table 1. Because there was no replication in this test, no statistics could be performed.
In the replicated trial, highest yields occurred with H8892, AB 5, NDM 0098, H 2801, and U 941, all with over 35 tons/A (Table 2). There were no significant differences between the varieties for
°Brix or color. Highest Brix yield occurred with AB 5 at nearly 2 tons/A, followed closely by
NDM 0098 and H 2801. While H 8892 yielded well, it had a relatively low °Brix of 4.4, which reduced its Brix yield to 1.81 tons/A. Yield and soluble solids % are shown in Figure 1.
Statewide Results. The results from all participating counties are shown in the report UCCE
Statewide Processing Tomato Variety Evaluation Trials 2003 following Figure 1.
ACKNOWLEDGEMENTS
Thanks to Mr. Dan Burns, San Juan Ranching Company, for his help and cooperation with this test, and to CTRI and participating seed companies for their financial support. The help of Larry
Burrow, Field Technician, is greatly appreciated.

Tomato Research Progress Report 2003 4
Table 1. 2003 Processing Tomato Variety Trial observation results, Merced County
disease Yield Brix Brix Yield LED
# Variety Company resistance tons/A (% ss) tons/A Color pH
35 SUN 6324 Sunseeds VFFNP 40.69 5.8 2.36 25 4.45
30 H 8892 Heinz VFFN 39.38 4.7 1.85 25 4.4
27 CPL 4863 CPLTS VFFN 38.33 5.0 1.92 27 4.41
36 SUN 6360 Sunseeds VFFNP 37.90 4.9 1.86 25 4.38
31 HM 1852 Harris Moran VFFN 36.37 4.9 1.78 25 4.37
28 CXD 223 Campbell's VFFNP 35.72 5.2 1.86 24 4.41
32 HMX 2855 Harris Moran VFFNP 34.37 5.0 1.72 26 4.49
24 BOS 47579 Orsetti VFFNP 33.76 5.6 1.89 27 4.36
29 H 2401 Heinz VFFNP 33.67 5.0 1.68 28 4.25
25 BOS 52295 Orsetti VFFNP 33.19 5.1 1.69 28 4.36
23 BOS 39422 Orsetti VFFNP 33.11 5.3 1.75 30 4.31
37 U 729 Unilever VFFN 33.02 5.8 1.92 23 4.38
39 UG 151 United Genetics VFFN 32.63 5.2 1.70 24 4.48
22 Halley 3155 Orsetti VFF 30.27 5.0 1.51 33 4.42
21 AGT 210 Asgrow VFFN 29.27 5.3 1.55 33 4.42
34 PX 607 Seminis VFFN 28.79 6.1 1.76 29 4.36
26 CPL 1056 CPLTS VFFNP 27.14 5.1 1.38 25 4.39
33 La Rossa Rogers VFF 23.30 5.7 1.33 28 4.36
38 U 886 Unilever VFFN 21.13 6.0 1.27 23 4.37
field HM 830 Harris Moran 35.46 ---- ---- ----- -----
Plot Average 32.74 5.30 1.73 26.74 4.39

Tomato Research Progress Report 2003 5
Merced tomato trial 2003
0.0
5.0
10.0
15.0
20.0
25.0
30.0
35.0
40.0
45.0
50.0
AB 2
Table 2. 2003 Processing Tomato Variety Trial replicated results, Merced County
disease Yield Brix brix Yield LED
# Variety Company resistance tons/A (% ss) tons/A Color pH
8 H 8892 Heinz VFFN 40.674 a 4.4 1.806 28.8 4.39
2 AB 5 AB Seeds VFNP 39.683 a b 5.0 1.990 27.3 4.37
14 NDM 0098 Nippon DelMonte VFFNT 38.834 a b c 5.0 1.946 25.0 4.43
10 H 2801 Heinz VFFNP 36.634 a b c d 5.1 1.867 28.0 4.49
18 U 941 Unilever VFFN 35.153 a b c d e 5.2 1.771 30.0 4.40
7 H 2601 Heinz VFFNP 34.641 b c d e f 4.9 1.693 29.0 4.45
9 H 9780 Heinz VFFNP 34.397 b c d e f g 5.0 1.723 29.5 4.37
6 H 2501 Heinz VFFNP 33.215 c d e f g h 5.3 1.743 28.5 4.40
16 PX 849 Seminis VFFNBsk 31.374 d e f g h I 5.2 1.638 30.3 4.38
1 AB 2 AB Seeds VFFP 30.470 e f g h I 5.2 1.589 24.8 4.33
5 CXD 222 Campbells VFFNP 30.056 e f g h I 5.4 1.617 29.0 4.36
15 PS 296 Seminis VFFNBsk 29.828 e f g h I 5.5 1.648 28.0 4.35
13 La Rossa Rogers VFF 29.392 f g h I 4.8 1.386 28.0 4.44
4 CXD 221 Campbells VFFFNP 28.924 g h I 5.3 1.541 28.5 4.44
12 HM 0830 Harris Moran VFFN 28.586 h I 5.2 1.484 26.5 4.46
3 CPL 155 (15-58) CPLTS VFFNP 28.379 h I 5.4 1.531 27.5 4.42
17 SUN 6119 Sunseeds VFFN 28.358 h I 5.2 1.437 31.5 4.41
11 Halley 3155 Orsetti VFF 26.484 I 4.9 1.297 28.8 4.40
average 32.505 5.1 1.650 28.3 4.40
LSD 0.05 5.6 NS 0.36 NS 0.08
CV, % 12.2 9.5 15.3 11.5 1.3
LSD 0.05 = least significant difference at the 95% probability level.
Means followed by the same letter are not significantly different
CV% = Coefficient of variation, a measure of the variability in the experiment
Tomato Research Progress Report 2003 6
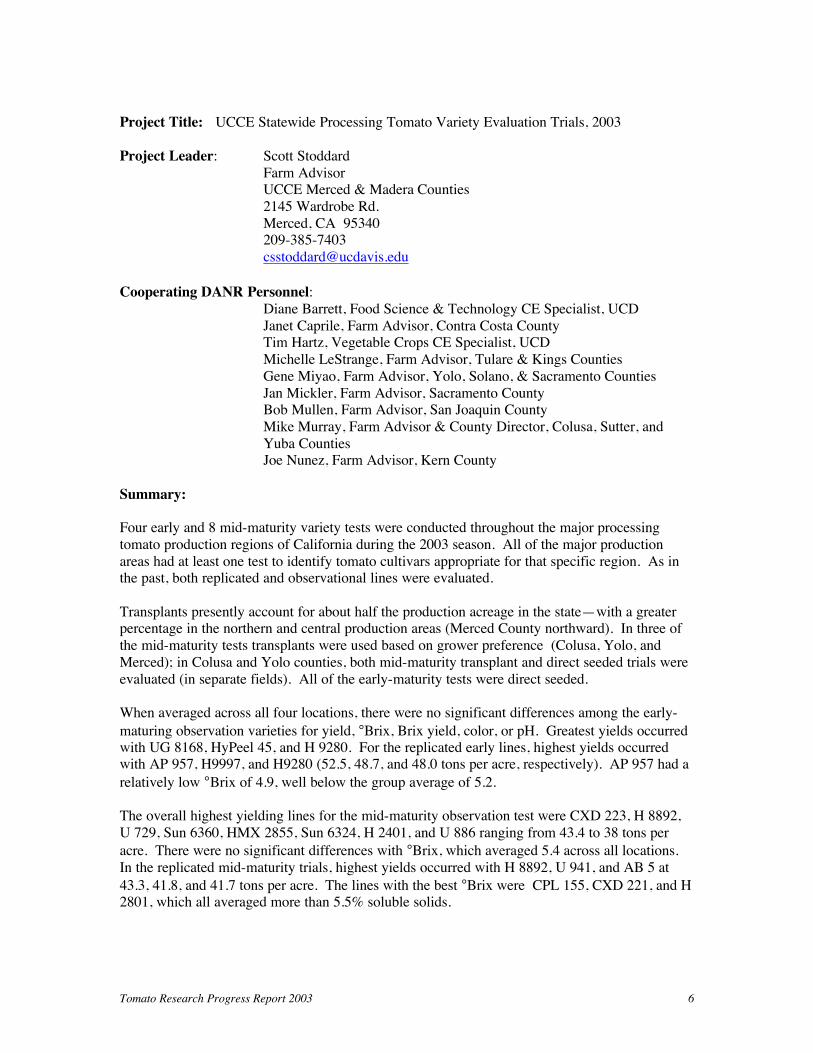
Project Title: UCCE Statewide Processing Tomato Variety Evaluation Trials, 2003
Project Leader: Scott Stoddard
Farm Advisor UCCE Merced & Madera Counties
2145 Wardrobe Rd.
Merced, CA 95340 209-385-7403
Cooperating DANR Personnel:
Diane Barrett, Food Science & Technology CE Specialist, UCD
Janet Caprile, Farm Advisor, Contra Costa County Tim Hartz, Vegetable Crops CE Specialist, UCD
Michelle LeStrange, Farm Advisor, Tulare & Kings Counties
Gene Miyao, Farm Advisor, Yolo, Solano, & Sacramento Counties
Jan Mickler, Farm Advisor, Sacramento County Bob Mullen, Farm Advisor, San Joaquin County
Mike Murray, Farm Advisor & County Director, Colusa, Sutter, and
Yuba Counties Joe Nunez, Farm Advisor, Kern County
Summary:
Four early and 8 mid-maturity variety tests were conducted throughout the major processing
tomato production regions of California during the 2003 season. All of the major production
areas had at least one test to identify tomato cultivars appropriate for that specific region. As in the past, both replicated and observational lines were evaluated.
Transplants presently account for about half the production acreage in the state—with a greater percentage in the northern and central production areas (Merced County northward). In three of
the mid-maturity tests transplants were used based on grower preference (Colusa, Yolo, and
Merced); in Colusa and Yolo counties, both mid-maturity transplant and direct seeded trials were
evaluated (in separate fields). All of the early-maturity tests were direct seeded.
When averaged across all four locations, there were no significant differences among the early-
maturing observation varieties for yield, °Brix, Brix yield, color, or pH. Greatest yields occurred with UG 8168, HyPeel 45, and H 9280. For the replicated early lines, highest yields occurred with AP 957, H9997, and H9280 (52.5, 48.7, and 48.0 tons per acre, respectively). AP 957 had a
relatively low °Brix of 4.9, well below the group average of 5.2.
The overall highest yielding lines for the mid-maturity observation test were CXD 223, H 8892,
U 729, Sun 6360, HMX 2855, Sun 6324, H 2401, and U 886 ranging from 43.4 to 38 tons per
acre. There were no significant differences with °Brix, which averaged 5.4 across all locations.
In the replicated mid-maturity trials, highest yields occurred with H 8892, U 941, and AB 5 at
43.3, 41.8, and 41.7 tons per acre. The lines with the best °Brix were CPL 155, CXD 221, and H 2801, which all averaged more than 5.5% soluble solids.

Tomato Research Progress Report 2003 7
Introduction: In 2003, the UCCE Statewide Farm Advisor Processing Tomato Variety Trial celebrates its 30
th
year of providing regional, unbiased variety information for the process tomato industry. The
project began in 1973 with three counties, and as the industry has expanded in the state, so has the
variety evaluation. Trials with both early and mid-season cultivars are performed in 6 – 8 counties. As in the past, the major objective of this statewide trial is to conduct processing
tomato variety field tests that evaluate fruit yield, °Brix (a measure of the soluble solids content), color, and pH in various statewide locations. The data from all test locations are used to analyze
variety adaptability under a wide range of growing conditions. These tests are designed and conducted with input from seed companies, processors, and other allied industry and are intended
to provide unbiased information on which to make variety decisions.
Procedures: Four early-maturity variety tests and 8 mid-maturity tests were conducted in 2003, each with an
observation and replicated component. Participating counties and Farm Advisors are listed in
Table 1. Variety entries and their disease resistances are listed in Tables 2a and 2b.
Early maturity tests were planted in February or early March and mid-maturity lines were planted
from March to May. New varieties are typically screened one or more years in non-replicated
observational trials before being included in the replicated trials. Tests were primarily conducted in commercial production fields with grower cooperators (the Fresno trials were located at the
West Side Research and Extension Center [WSREC] near Five Points).
Each variety was usually planted in one-bed wide by 100 foot long plots (Fresno used 75 foot
long plots), and was assigned to either a replicated or observational trial (Figure 1). All cultural
operations, with the exception of planting and harvest, were done by the grower cooperator using the same equipment and techniques as the rest of the field. All test locations were primarily
furrow irrigated. A field day was arranged at many of the test plots.
Shortly before harvest, fruit samples were collected from all plots and submitted to an area PTAB
station for soluble solids (°Brix) color (LED color, lower values indicate redder fruit), and pH determinations. The plots were harvested with commercial harvest equipment, conveyed to a GT
wagon equipped with weigh cells, and weighed before going to the trailers for processing (Figure
2). Because of planting problems with SUN 6119, it was not harvested in each county, and
therefore was not included in the combined-location analyses.
Results:
Only the combined results are presented here. A copy of the entire state report and summaries for individual counties can be found on the UC Vegetable Research and Information Center webpage
at http://www.vric.ucdavis.edu. Click on the Issues, News, and Events link to access the report.
Early observational. Results averaged across counties are presented in Table 3. There were no
significant differences between any of the varieties for any of the parameters measured in this
test. Average yield in the early observational trials was 42.5 tons/A with an average °Brix of 5.2.
The best yielding variety was UG 8168 at 48.4 tons/A at 5.4 °Brix. APT 410 had the highest
°Brix at 5.7%. Brix yield was highest in UG 8168 at 2.6 tons/A, but this was not significantly different from any of the other varieties even though this was 0.63 ton improvement (32%) over
the lowest yielder, HA 3523. Average color and pH were 24.7 and 4.42 respectively.

Tomato Research Progress Report 2003 8
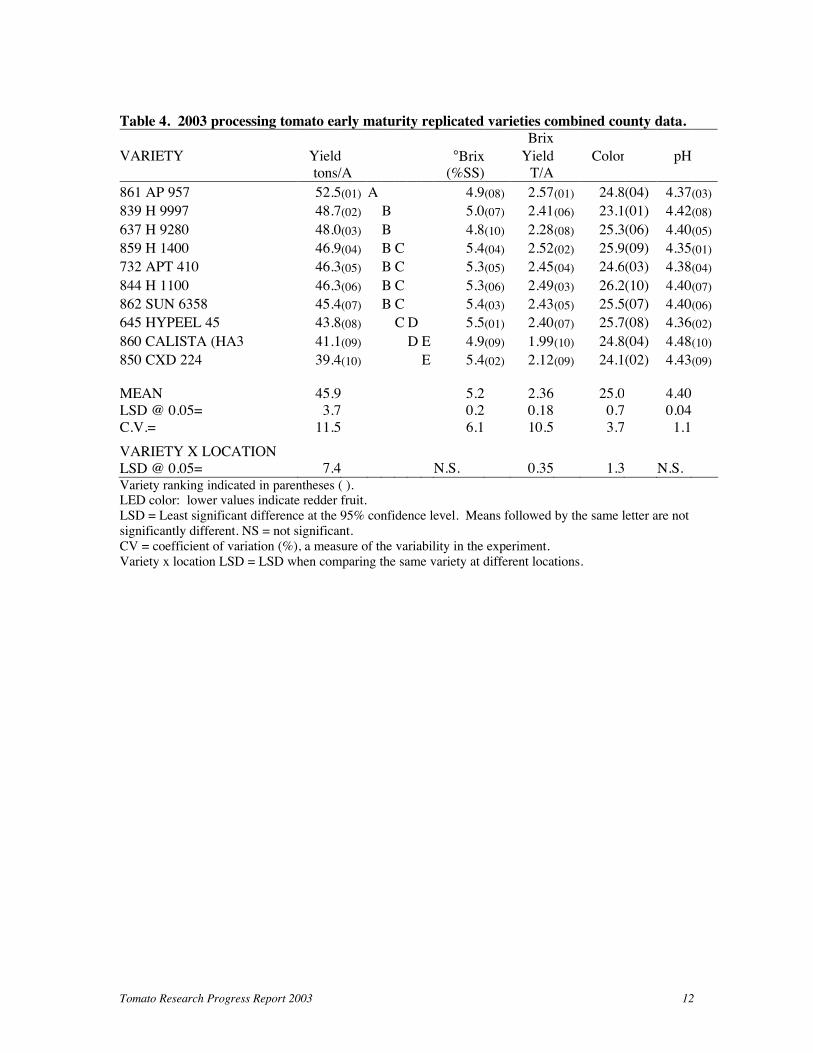
Early replicated. Early replicated results are presented in Table 4. Significant yield and °Brix differences were found between varieties, with the highest yields occurring with AP 957 at 52.5
tons/A. HyPeel 45, CXD 224, SUN 6358, H1400, APT 410, H 1100 had significantly better
°Brix than the other varieties, ranging from 5.5 to 5.3. Because AP 957 had a relatively low
°Brix of only 4.9, however, Brix yield was not significantly different between it and five other varieties. Large differences were found for color, with H9997 having significantly redder fruit
than all other varieties (23.1). Average pH was 4.40 and ranged from 4.35 for H 1400 to 4.48 for Calista (Table 4f).
Significant variety by location interactions occurred for yield, Brix yield, and color. This indicates that some varieties performed better at specific locations. Where significant, the variety
by location LSD can be used to compare the performance of the same variety at one location to
the other.
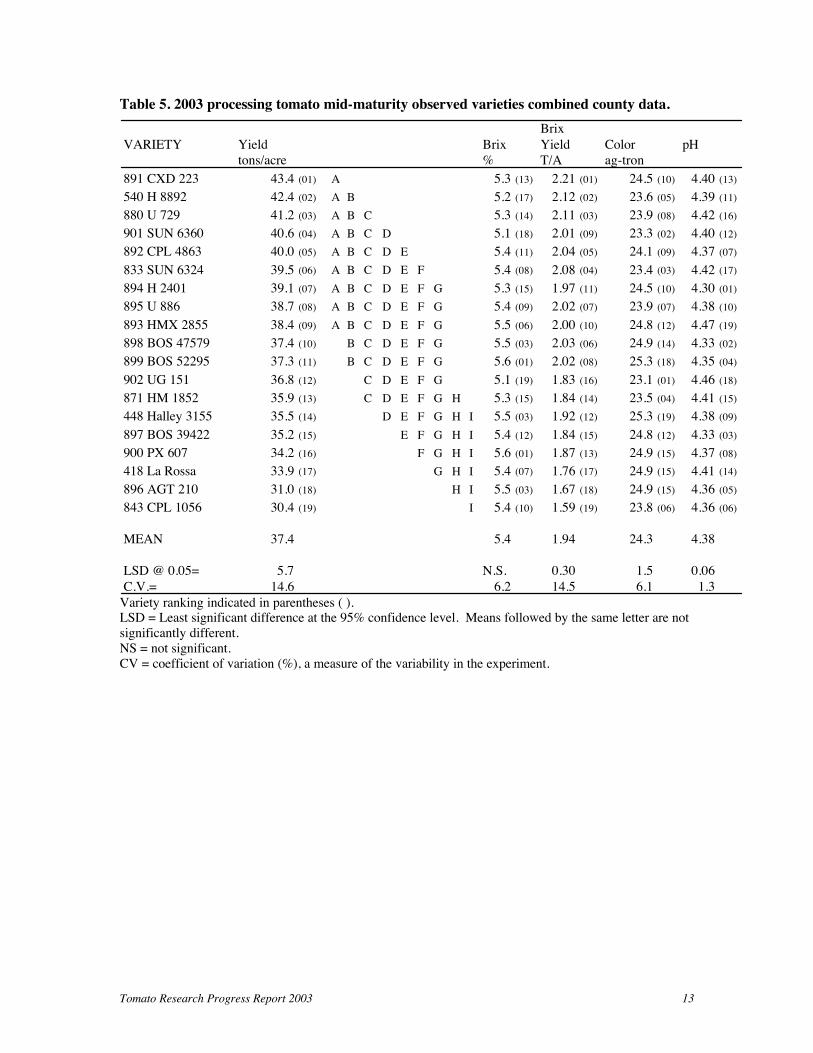
Mid observational. Mid-maturity observational results combining all locations are shown in
Table 5. When all counties were combined, significant differences were observed between
varieties for yield, Brix yield, color, and pH. The highest yields occurred with CXD 223, H 8892,
U729, and SUN 6360, all exceeding 40 tons/A. No significant differences were found for °Brix, which was good for all lines, ranging between 5.1 to 5.6. Brix yield ranged from 2.21 tons/A for
CXD 223 to 1.59 tons/A for CPL 1056, a 39% difference. Twelve varieties were in the top Brix
yield group. Best color (23.1) was held by UG151, while fruit pH ranged for 4.30 to 4.47.
Mid replicated. Combined mid-maturity replicated variety results are reported in Table 6.
Significant differences occurred for all parameters measured, though individual counties may not
have had significant differences for yield, °Brix, and color. Highest yields occurred with H 8892, U 941, and AB 5, at > 40 tons/A. SUN 6119 yielded well with an average 39.3 tons/A, but
because it was not tested in every location it is not included in the combined statistical analysis in Table 6; however, it was included in the individual counties where data were collected.
°Brix was significantly higher in CPL 155, CXD 221, and H 2801 compared to the other
varieties, at 5.6, 5.6, and 5.5 respectively. Lowest °Brix occurred with H 8892, at 4.8. AB5 had the highest Brix yield of 2.16 tons/A, followed closely by U 941 and H8892 in the same high
Brix yield group. Lowest Brix yield was with LaRossa at 1.60 tons/A—a reduction of 35% compared to the top yielding varieties. H2801, NDM0098, H2501, and AB2 had the best fruit
color with an LED rating of 23.8 to 24.3. Average pH ranged from 4.28 to 4.42.
Significant variety by location interactions occurred for yield, °Brix, Brix yield, and pH. This
suggests that certain varieties performed differently at different locations. H 8892, for example, yielded significantly better in Stanislaus than all other locations except Yolo. Kern and Colusa
often had significantly higher °Brix for the same variety at the other locations.
Acknowledgements:
Many thanks to CTRI, participating seed companies, and PTAB for their continued support for this project. Thanks to Gail Nishimoto for her help with the statistical analyses. And lastly, this
project would not be possible without the many excellent grower cooperators who were involved
with this project: Dan Burns with Live Oak Farms, Paul Simoni and Anthony Massoni with Simoni & Massoni Farms, Bill and Chuck Cox with Cox & Perez Farms, Louie Crettol, Button
and Turkovich, J.H. Meek and Sons, Joe Muller and Sons, Emerald Farms, Poundstone Bros, and
the field crew at WSREC.
Tomato Research Progress Report 2003 9
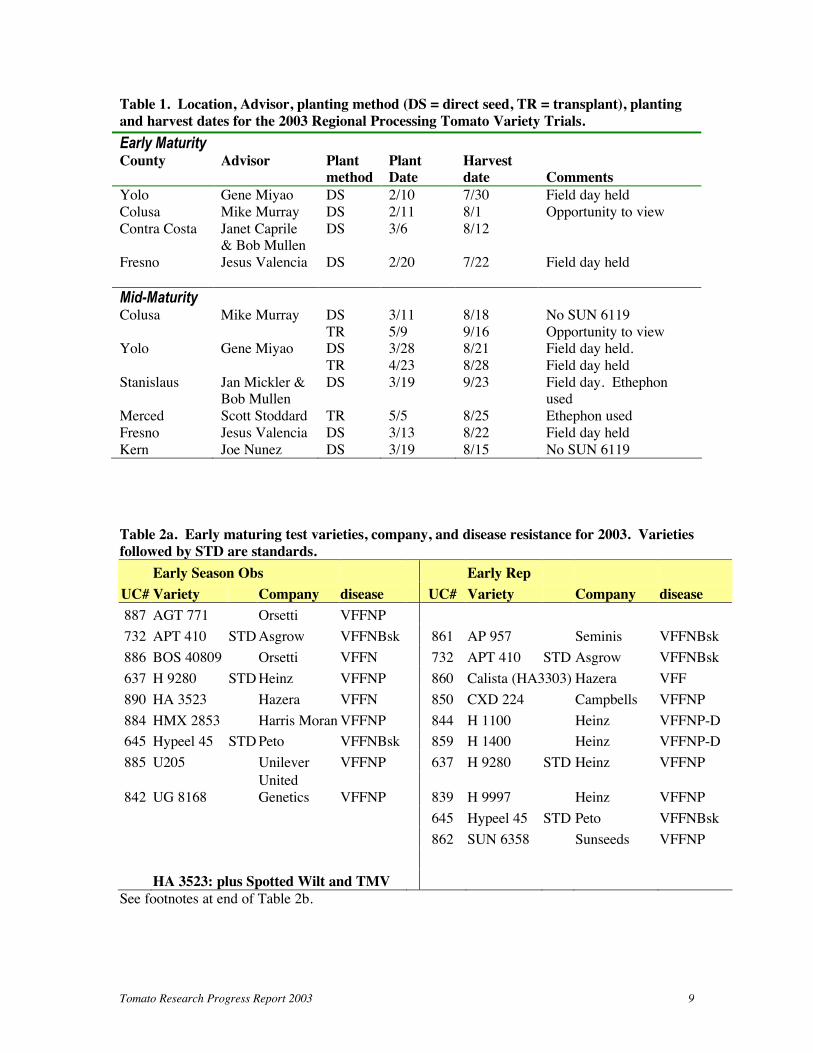
Table 1. Location, Advisor, planting method (DS = direct seed, TR = transplant), planting
and harvest dates for the 2003 Regional Processing Tomato Variety Trials.
Table 2a. Early maturing test varieties, company, and disease resistance for 2003. Varieties
followed by STD are standards.
Early Season Obs Early Rep
UC# Variety Company disease UC# Variety Company disease
887 AGT 771 Orsetti VFFNP
732 APT 410 STD Asgrow VFFNBsk 861 AP 957 Seminis VFFNBsk
886 BOS 40809 Orsetti VFFN 732 APT 410 STD Asgrow VFFNBsk
637 H 9280 STD Heinz VFFNP 860 Calista (HA3303) Hazera VFF
890 HA 3523 Hazera VFFN 850 CXD 224 Campbells VFFNP
884 HMX 2853 Harris Moran VFFNP 844 H 1100 Heinz VFFNP-D
645 Hypeel 45 STD Peto VFFNBsk 859 H 1400 Heinz VFFNP-D
885 U205 Unilever VFFNP 637 H 9280 STD Heinz VFFNP
842 UG 8168
United
Genetics VFFNP 839 H 9997 Heinz VFFNP
645 Hypeel 45 STD Peto VFFNBsk
862 SUN 6358 Sunseeds VFFNP
HA 3523: plus Spotted Wilt and TMV
See footnotes at end of Table 2b.
Early Maturity County Advisor Plant
method
Plant
Date
Harvest
date
Comments
Yolo Gene Miyao DS 2/10 7/30 Field day held
Colusa Mike Murray DS 2/11 8/1 Opportunity to view
Contra Costa Janet Caprile & Bob Mullen
DS 3/6 8/12
Fresno Jesus Valencia DS 2/20 7/22 Field day held
Mid-Maturity
Colusa Mike Murray DS 3/11 8/18 No SUN 6119
TR 5/9 9/16 Opportunity to view Yolo Gene Miyao DS 3/28 8/21 Field day held.
TR 4/23 8/28 Field day held
Stanislaus Jan Mickler & Bob Mullen
DS 3/19 9/23 Field day. Ethephon used
Merced Scott Stoddard TR 5/5 8/25 Ethephon used
Fresno Jesus Valencia DS 3/13 8/22 Field day held
Kern Joe Nunez DS 3/19 8/15 No SUN 6119

Tomato Research Progress Report 2003 10
Table 2b. Mid-maturity test varieties, company, and disease resistance for 2003. Varieties
followed by STD are standards.
Mid Season Obs Mid Season Replicated
UC# Variety Company disease UC# Variety Company disease
896 AGT 210 Orsetti VFFN 868 AB 2 AB VFFP
897 BOS 39422 Orsetti VFFNP 869 AB 5 AB VFFNP
898 BOS 47579 Orsetti VFFNP 888 CPL 155 (15-58) CTRI/CPLTS VFFNP
899 BOS 52295 Orsetti VFFNP 858 CXD 221 Campbell VFFF3NP
843 CPL 1056 CTRI/CPLTS VFFNP 863 CXD 222 Campbell VFFNP
892 CPL 4863 CTRI/CPLTS VFFN 864 H 2501 Heinz VFFNP
891 CXD 223 Campbells VFFNP 865 H 2601 Heinz VFFNP
894 H 2401 Heinz VFFNP 873 H 2801 Heinz VFFNP
540 H 8892 STD Heinz VFFN 540 H 8892 STD Heinz VFFN
448 Halley 3155 STD Orsetti VFF 866 H 9780 Heinz VFFNP
871 HM 1852 Harris Moran VFFN 448 Halley 3155 STD Orsetti VFF
893 HMX 2855 Harris Moran VFFNP 847 HM 0830 Harris Moran VFFN
418 La Rossa STD Rogers VFF 418 La Rossa STD Rogers VFF
900 PX 607 Seminis VFFN 877 NDM 0098 Del Monte VFFNT
833 SUN 6324 Sunseeds VFFNP 878 PS 296 Seminis VFFNBsk
901 SUN 6360 Sunseeds VFFNP 836 PX 849 Seminis VFFNBsk
880 U 729 Unilever VFFN 879 SUN 6119 Sunseeds VFFN
895 U 886 Unilever VFFN 889 U 941 Unilever VFFN
902 UG 151 United Genetics VFFN V = Verticillium Wilt Race 1
FFF3 = Fusarium wilt Race 1, 2, and 3 resistance
N = root knot nematode resistance
P = bacterial speck resistance
Bsk = bacterial speck resistance D = Dodder tolerant
Check with respective seed companies to confirm disease resistance information.

Tomato Research Progress Report 2003 11
Table 3. 2003 early maturity observational varieties combined county data.
VARIETY Yield Brix Brix Yield Color pH
tons/A % tons/A LED
842 UG 8168 48.4 (01) 5.4 (04) 2.60 (01) 25.3 (06) 4.42 (04)
645 HYPEEL 45 44.5 (02) 5.0 (07) 2.25 (03) 24.5 (05) 4.47 (09)
637 H 9280 44.0 (03) 4.8 (09) 2.09 (07) 24.3 (04) 4.44 (08)
732 APT 410 43.3 (04) 5.7 (01) 2.45 (02) 23.5 (02) 4.42 (05)
886 BOS 40809 41.7 (05) 4.9 (08) 2.04 (08) 26.5 (09) 4.43 (06)
884 HMX 2853 41.1 (06) 5.5 (03) 2.24 (04) 23.3 (01) 4.43 (06)
885 U205 40.2 (07) 5.3 (05) 2.12 (06) 25.5 (07) 4.37 (01)
887 AGT 771 40.1 (08) 5.5 (02) 2.21 (05) 24.0 (03) 4.40 (03)
890 HA 3523 39.0 (09) 5.1 (06) 1.97 (09) 25.5 (07) 4.38 (02)
MEAN 42.5 5.2 2.22 24.7 4.42
LSD @ 0.05= N.S. N.S. N.S. N.S. N.S.
C.V.= 17.0 9.3 18.5 6.4 1.2 Variety ranking indicated in parentheses ( ).
LSD = Least significant difference at the 95% confidence level. Means followed by the same letter are not
significantly different.
NS = not significant.
CV = coefficient of variation (%), a measure of the variability in the experiment.
LED color: lower values indicate redder fruit.
Tomato Research Progress Report 2003 12
Table 4. 2003 processing tomato early maturity replicated varieties combined county data.
Brix
VARIETY Yield °Brix Yield Color pH
tons/A (%SS) T/A
861 AP 957 52.5(01) A 4.9(08) 2.57 (01) 24.8(04) 4.37(03)
839 H 9997 48.7(02) B 5.0(07) 2.41 (06) 23.1(01) 4.42(08)
637 H 9280 48.0(03) B 4.8(10) 2.28 (08) 25.3(06) 4.40(05)
859 H 1400 46.9(04) B C 5.4(04) 2.52 (02) 25.9(09) 4.35(01)
732 APT 410 46.3(05) B C 5.3(05) 2.45 (04) 24.6(03) 4.38(04)
844 H 1100 46.3(06) B C 5.3(06) 2.49 (03) 26.2(10) 4.40(07)
862 SUN 6358 45.4(07) B C 5.4(03) 2.43 (05) 25.5(07) 4.40(06)
645 HYPEEL 45 43.8(08) C D 5.5(01) 2.40 (07) 25.7(08) 4.36(02)
860 CALISTA (HA3 41.1(09) D E 4.9(09) 1.99 (10) 24.8(04) 4.48(10)
850 CXD 224 39.4(10) E 5.4(02) 2.12 (09) 24.1(02) 4.43(09)
MEAN 45.9 5.2 2.36 25.0 4.40
LSD @ 0.05= 3.7 0.2 0.18 0.7 0.04
C.V.= 11.5 6.1 10.5 3.7 1.1
VARIETY X LOCATION
LSD @ 0.05= 7.4 N.S. 0.35 1.3 N.S.
Variety ranking indicated in parentheses ( ). LED color: lower values indicate redder fruit.
LSD = Least significant difference at the 95% confidence level. Means followed by the same letter are not
significantly different. NS = not significant.
CV = coefficient of variation (%), a measure of the variability in the experiment.
Variety x location LSD = LSD when comparing the same variety at different locations.
Tomato Research Progress Report 2003 13
Table 5. 2003 processing tomato mid-maturity observed varieties combined county data.
Variety ranking indicated in parentheses ( ). LSD = Least significant difference at the 95% confidence level. Means followed by the same letter are not
significantly different.
NS = not significant.
CV = coefficient of variation (%), a measure of the variability in the experiment.
Brix
VARIETY Yield Brix Yield Color pH
tons/acre % T/A ag-tron
891 CXD 223 43.4 (01) A 5.3 (13) 2.21 (01) 24.5 (10) 4.40 (13)
540 H 8892 42.4 (02) A B 5.2 (17) 2.12 (02) 23.6 (05) 4.39 (11)
880 U 729 41.2 (03) A B C 5.3 (14) 2.11 (03) 23.9 (08) 4.42 (16)
901 SUN 6360 40.6 (04) A B C D 5.1 (18) 2.01 (09) 23.3 (02) 4.40 (12)
892 CPL 4863 40.0 (05) A B C D E 5.4 (11) 2.04 (05) 24.1 (09) 4.37 (07)
833 SUN 6324 39.5 (06) A B C D E F 5.4 (08) 2.08 (04) 23.4 (03) 4.42 (17)
894 H 2401 39.1 (07) A B C D E F G 5.3 (15) 1.97 (11) 24.5 (10) 4.30 (01)
895 U 886 38.7 (08) A B C D E F G 5.4 (09) 2.02 (07) 23.9 (07) 4.38 (10)
893 HMX 2855 38.4 (09) A B C D E F G 5.5 (06) 2.00 (10) 24.8 (12) 4.47 (19)
898 BOS 47579 37.4 (10) B C D E F G 5.5 (03) 2.03 (06) 24.9 (14) 4.33 (02)
899 BOS 52295 37.3 (11) B C D E F G 5.6 (01) 2.02 (08) 25.3 (18) 4.35 (04)
902 UG 151 36.8 (12) C D E F G 5.1 (19) 1.83 (16) 23.1 (01) 4.46 (18)
871 HM 1852 35.9 (13) C D E F G H 5.3 (15) 1.84 (14) 23.5 (04) 4.41 (15)
448 Halley 3155 35.5 (14) D E F G H I 5.5 (03) 1.92 (12) 25.3 (19) 4.38 (09)
897 BOS 39422 35.2 (15) E F G H I 5.4 (12) 1.84 (15) 24.8 (12) 4.33 (03)
900 PX 607 34.2 (16) F G H I 5.6 (01) 1.87 (13) 24.9 (15) 4.37 (08)
418 La Rossa 33.9 (17) G H I 5.4 (07) 1.76 (17) 24.9 (15) 4.41 (14)
896 AGT 210 31.0 (18) H I 5.5 (03) 1.67 (18) 24.9 (15) 4.36 (05)
843 CPL 1056 30.4 (19) I 5.4 (10) 1.59 (19) 23.8 (06) 4.36 (06)
MEAN 37.4 5.4 1.94 24.3 4.38
LSD @ 0.05= 5.7 N.S. 0.30 1.5 0.06
C.V.= 14.6 6.2 14.5 6.1 1.3

Tomato Research Progress Report 2003 14
Table 6. 2003 processing tomato mid-maturity replicated varieties combined county data.
Variety ranking indicated in parentheses ( ).
LSD = Least significant difference at the 95% confidence level. Means followed by the same letter are not
significantly different.
NS = not significant.
CV = coefficient of variation (%), a measure of the variability in the experiment.
Variety x location LSD = LSD when comparing the same variety at different locations.
Brix
VARIETY Yield Brix Yield Color pH
tons/acre % T/A
540 H 8892 43.3 (01) A 4.8 (17) 2.06 (03) 24.6 (05) 4.37 (09)
889 U 941 41.8 (02) A B 5.1 (15) 2.06 (02) 25.5 (12) 4.39 (11)
869 AB 5 41.7 (03) A B 5.3 (09) 2.16 (01) 25.2 (09) 4.32 (03)
877 NDM 0098 39.8 (04) B C 5.1 (13) 1.98 (08) 23.8 (02) 4.39 (12)
864 H 2501 38.8 (05) C D 5.3 (08) 2.00 (04) 23.9 (03) 4.32 (04)
868 AB 2 38.1 (06) C D E 5.4 (05) 1.99 (05) 24.3 (04) 4.30 (02)
878 PS 296 37.8 (07) C D E 5.3 (06) 1.98 (07) 25.6 (14) 4.28 (01)
836 PX 849 37.1 (08) D E 5.2 (12) 1.90 (09) 26.4 (17) 4.32 (05)
873 H 2801 37.1 (09) D E 5.5 (03) 1.99 (06) 23.8 (01) 4.41 (16)
865 H 2601 36.7 (10) D E F 5.0 (16) 1.77 (14) 25.3 (11) 4.40 (13)
866 H 9780 36.2 (11) E F G 5.3 (10) 1.86 (10) 25.7 (15) 4.32 (05)
863 CXD 222 34.8 (12) F G H 5.2 (11) 1.80 (12) 24.8 (06) 4.36 (08)
448 Halley 3155 34.7 (13) F G H 5.3 (06) 1.80 (13) 25.6 (13) 4.34 (07)
847 HM 0830 34.5 (14) G H 5.4 (04) 1.83 (11) 25.1 (08) 4.42 (17)
418 La Rossa 32.8 (15) H 5.1 (14) 1.60 (17) 25.0 (07) 4.41 (14)
858 CXD 221 30.6 (16) I 5.6 (02) 1.66 (16) 25.2 (10) 4.41 (15)
888 CPL 155 (15- 30.6 (17) I 5.6 (01) 1.66 (15) 25.7 (16) 4.37 (10)
879 SUN 6119 39.3 5.1 1.72 26.9 4.35
MEAN 37.0 5.3 1.89 25.1 4.36
LSD @ 0.05= 2.1 0.2 0.12 0.8 0.02
C.V.= 11.6 6.1 13.0 6.4 1.1
VARIETY X
LOCATION LSD @
0.05= 6.0 0.4 0.34 N.S. 0.07

Tomato Research Progress Report 2003 15
Figure 1. The processing tomato variety trial in Merced County, 2003. The plots are 1-bed
by 100 feet long, with a different variety in each. At this stage in crop development, notes
are made on vine growth characteristics for each variety.
Figure 2. Harvested tomatoes are conveyed to a gondola equipped with a scale to measure
yields. Once full, the tomatoes are dumped into trailers for transport to the cannery.

Tomato Research Progress Report 2003 16
University of California Cooperative Extension
Regional Fresh Market Tomato Variety Trial, 2003
Scott Stoddard
Assistant Farm Advisor, Merced and Madera Counties
2145 Wardrobe Ave
Merced, CA 95340
OBJECTIVE: Evaluation of commercially available fresh market tomato varieties as a part of a
3-county fresh market tomato variety trial.
Cooperators: Bob Giampaoli, Live Oak Farms, LeGrand
Daniel Acevedo, Labar Greenhouses, Gustine
Various seed companies (see below)
Seeded: March 19, 2003
Transplant: May 13, 2003. 3-row planter, 16” spacing. Irrigation: buried drip in 2
nd year
Fertilizer: about 200-150-200 NPK, most N and K2O through the drip tube
IPM: 2 worm sprays (Avaunt) for armyworm and western yellowstripe armyworm Harvest: Aug. 1, 4, and 5, 2003. One time hand pick (destructive harvest).
Plot Design: Randomized block with 4 reps. 1 row by 50 ft plots.
Location: SE corner of Voorhees and Athlone Rds, in Merced County
Soil Type: Landlow silt loam. Imperfectly drained, slight salt build up in some places.
FIELD DAY JULY 31, 2003
Continuing Education Credits: 3 hrs OTHER. ID CODE: A-1226-03.
METHODS Seed selection took place in January, with the participating Farm Advisors making
recommendations to the seed companies. Once received, the seed was hand planted at LaBar’s
Greenhouse in Gustine. Plants were transplanted into a commercial field using a 3-row finger planter on 16” centers. Plants were drip irrigated throughout the season and fertilized with the
drip system as well. Fruit and vine characteristics were evaluated one day prior to harvest.
Varieties submitted and the field plot layout are shown in Tables 1 & 2.
Plants were harvested when the field was approximately 15% red (about 83 days after
transplanting. The plants were cut from a 12 ft section within each plot and the fruit were shook
onto the top of the bed. All fruit that were size small or larger were harvested. Red and cull fruit were weighed separately from the green; red fruit were added back to the sorter to get a final
weight for each size category. CTC standard grade sizes were used.
This year we sorted in the field by making a portable wooden sorter with grates set at the respective fruit sizes to sort the fruit. The picked tomatoes were brought to the sorter in a bucket,
dumped at one end, and rolled by gravity to the other end. The fruit fell through the slots into
boxes placed under each sizing area. Extra large fruit and larger (Jumbos) rolled to the end of the sorter. This new tool greatly increased the speed at which we could sort fruit, and allowed us to
keep the fruit in the field to be returned to the grower.

Tomato Research Progress Report 2003 17
At harvest, mature green and breaker fruit samples were taken by Dr. Marita Cantwell for post
harvest quality determinations.
Yield data for the replicated trial were analyzed using CoStat statistical software using standard
analysis of variance procedures. The observational trial had no replication and was not analyzed.
Small fruit were weighed but not included in the marketable yield.
RESULTS
This was a very good trial this year, with overall excellent yields. Disease and pest pressure were very low, though there was some curly top and spotted wilt strikes scattered throughout the plots.
Replicated trial yield and fruit characteristics are shown in Tables 3 and 4, while the observational trial results are shown in Tables 5 and 6. In the replicated trial, there was no
significant difference in marketable yields, which ranged from 3000 boxes per acre for Q-23 to
2200 boxes for BHN 464. Significant differences did occur for the sizes between varieties, with
L-312 having the most XL fruit (50%) and least medium fruit (11%). Cull tonnage for all lines was low this year, averaging 8.5 tons/A, and may reflect our new sorting method. Shady Lady
once again had the most red fruit at harvest (27%), showing that it matures early relative to the
other varieties in this test.
In the observation trial, yields ranged from 2900 boxes to 1047 boxes per acre (Table 5). Highest
yields were obtained with XTM 0230, BHN 581, and BHN 611, all in excess of 2800 boxes per acre. Fruit size was good for these varieties (~75%), though not quite as high as the replicated
lines. In general, BHN and Sakata did well in this trial, though some of Sakata’s lines were very
early and had more than 40% fruit at harvest.
A summary of the statewide yield results is shown in Table 7. The high yields we observe in our
trials mainly occur because we pick all fruit. The relative differences are what is important.
The post harvest evaluation report follows Table 7. In general, fruit from the trial this year were
slightly softer and had less soluble solids and acidity than the same varieties at the other locations
(Kings, San Joaquin).
ACKNOWLEDGEMENTS:
Many thanks to Bob Giampaoli, Daniel Acevedo, Dr. Jeff Mitchell, California Tomato
Commission, Seed Companies, Ed Bright, Larry Burrow, Jan Mickler, and especially Michelle LeStrange for helping put this thing together.

Tomato Research Progress Report 2003 18
Table 1. 2003 FM Tomato Varieties:
Replicated Observation
BHN Seed 1. BHN 464 BHN Seed 21. BHN 502 2. BHN 499 22. BHN 526 LSL Plant Science 3. L-312 23. BHN 581 Seminis 4. Sun King 24. BHN 611 Sunseeds 5. Shady Lady (std) 25. BHN 623 Syngenta 6. Quali T-21 D. Palmer 26. SDT 01-6 7. Quali T-23 27. SDT 01-7 8. Bobcat 28. DT 03-70 29. DT 03-71 Golden Valley Seed 30. GVS 51-182 31. GVS 51-178 32. GVS 51-193 33. GVS 51-993 34. GVS 51-992 35. GVS 51-644 36. GVS 51-643 Harris Moran 37. HMX 2807 LSL Plant Science 38. L-310 39. L-311 40. B-807 Sakata 41. XTM 0113 42. XTM 0115 43. XTM 0230 44. XTM 0231 Southwestern 45. SW 100 101 46. SW 100 102 47. SW 100 103 Syngenta 48. RFT 6047
Table 2. Field plot lay-out:
5 1 8 4 2 3 6 7 42 43 44 45 46 47 48
1 7 4 2 3 5 8 6 35 36 37 38 39 40 41
4 7 3 5 6 1 8 2 28 29 30 31 32 33 34
1 2 3 4 5 6 7 8 21 22 23 24 25 26 27

Tomato Research Progress Report 2003 19
Table 3. Fresh market tomato variety trial yield and grade results, 2003.
Replicated varieties, Merced County.
Market Yield XL L M S Culls total Red
Var # Variety Company Tons/A Boxes/A % of marketable yield tons/A tons/A tons/A %
7 Q-23 Syngenta 37.45 2996 39.1% 44.5% 16.4% 4.94 8.5 50.93 23.4%
6 Q-21 Syngenta 34.59 2768 36.1% 42.6% 21.3% 7.57 6.2 48.40 14.5%
2 BHN 499 BHN Seed 32.81 2625 34.3% 35.8% 29.8% 8.74 12.3 53.85 20.4%
4 Sun King Seminis 31.71 2537 22.9% 44.0% 33.1% 8.43 6.6 46.75 20.1%
8 Bobcat Syngenta 31.59 2527 34.6% 41.7% 23.8% 7.76 7.3 46.60 18.2%
5 Shady Lady Sun Seeds 31.05 2484 28.1% 41.6% 30.3% 8.09 7.4 46.56 27.4%
3 L-312 LSL 29.09 2327 50.3% 38.8% 10.9% 2.59 12.9 44.53 15.5%
1 BHN 464 BHN Seed 27.49 2199 27.9% 38.6% 33.5% 9.96 6.6 44.05 13.0%
Average 2558 34% 41% 25% 7.3 8.5 47.7 19%
LSD 0.05 NS 9.5 5.3 8.2 1.9 3.5 NS 8.2
CV, % 14.2 18.9 8.7 22.3 17.7 27.9 11.6 29.2
Market yield = XL + L + M size fruit, average of four replications. One box = 25 lbs.
XL, L, M% = weight of respective fruit sizes divided by marketable yield.
Red% = weight of all red fruit divided by total yield. Indicates relative maturity among tested varieties.
Culls, tons per acre: Any fruit so disfigured (due to rot, cat facing, insect damage, etc.) as to be unmarketable.
XL = 3 inches and larger in diameter
L = 2.5 to 3"
M = 2.25 to 2.5"
S = 2 to 2.25" Fruit smaller than 2" were not harvested.
LSD 0.05 = least significant difference at the 95% probablility level.
Yields followed by the same letter are not significantly different.
NS = not significant at the 95% probability level.
CV = coefficient of variation, a measure of the variability in the experiment.
Table 4. Fresh market tomato fruit and vine characteristics. Merced County, 2003.
REPLICATED varieities.
Vine Leaf Leaf Fruit Rough- Blossom Cat- Growth Sun- Zip-
Var # Variety Size cover roll shape ness end facing Cracks burn pers Disease Stem Comments
1 BHN 464 L G N G S T N N N N N SJ
2 BHN 499 L G SL G M SL N N SL N N SJ
3 Sun King VL OK N G S T N N SL N N J vine open late
4 L-312 M G S G, FG MR T S N SL N Y J catfacing, TSWV
5 Shady Lady L G N G, FG M T SL N SL N N J
6 Q-21 VL G N G, FG M T N N N SL N J vine sprawl
7 Q-23 L G N G, FG M SL N N SL N N J
8 Bobcat ML G S G, FG MR T N N N SL N J
Vine Size: M = medium ML = medium large L = large VL = very large
Leaf Cover: P = poor OK = adequate G = good
Leaf Roll: N = none SL = slight S = some
Fruit Shape: DG = deep globe G = globe FG = flat globe
Shoulder roughness:S = smooth M = medium MR = medium roughR = rough
Blossom End: T = tight SL = slight scar M = medium size scar
Cat Facing: N = none SL = slight S = some
Growth Cracks: N = none SL = slight S = some
Sunburn: N = none SL = slight S = some
Zippers: N = none SL = slight S = some
Stem: J = joint NJ = no joint SJ = semi joint
Disease: N = none Y = some symptoms seen

Tomato Research Progress Report 2003 20
Table 5. Fresh market tomato variety trial yield and grade results, 2003.
Observational varieties, Merced County.
Market Yield XL L M S Culls total Red
Var # Variety Company Tons/A Boxes/A % of marketable yield tons/A tons/A tons/A %
43 XTM 0230 Sakata 36.445 2916 28% 36% 36% 15.8 5.0 57.154 20.3%
23 BHN 581 BHN Seed 36.209 2897 31% 42% 27% 9.3 12.9 58.370 15.7%
24 BHN 611 BHN Seed 35.701 2856 30% 45% 25% 7.5 3.4 46.646 8.2%
22 BHN 526 BHN Seed 34.031 2723 40% 41% 19% 2.7 12.9 49.658 6.5%
21 BHN 502 BHN Seed 33.650 2692 14% 44% 41% 6.8 6.8 47.172 6.6%
48 RFT 6047 Seminis 31.781 2542 39% 43% 18% 9.7 8.7 50.167 11.3%
42 XTM 0115 Sakata 30.801 2464 24% 42% 34% 14.3 3.0 48.152 40.9%
39 L-311 LSL Plant Science 28.169 2254 22% 54% 24% 5.0 12.8 45.956 22.6%
28 DT 03-70 D. Palmer 27.679 2214 16% 56% 28% 8.3 9.7 45.647 41.7%
38 L-310 LSL Plant Science 27.497 2200 13% 58% 30% 3.7 9.6 40.747 32.2%
30 GVS 51-182 Golden Valley Seed 26.789 2143 42% 47% 11% 5.0 3.8 35.610 37.9%
26 SDT 01-6 D. Palmer 26.771 2142 22% 39% 38% 10.8 7.4 44.958 18.2%
25 BHN 623 BHN Seed 26.717 2137 26% 31% 43% 13.9 7.4 48.043 14.4%
41 XTM 0113 Sakata 24.666 1973 8% 37% 55% 13.8 4.7 43.161 41.0%
44 XTM 0230 Sakata 24.448 1956 29% 34% 37% 12.0 6.4 42.907 14.9%
40 B-807 LSL Plant Science 24.248 1940 10% 48% 43% 6.4 6.9 37.552 33.5%
27 SDT 01-7 D. Palmer 24.067 1925 17% 47% 36% 12.4 10.6 47.099 23.1%
37 HMX 2807 Harris Moran 21.943 1755 6% 42% 53% 11.6 2.7 36.264 6.9%
29 DT 03-71 D. Palmer 21.199 1696 8% 26% 66% 19.9 4.4 45.538 48.6%
45 SW 100 101 Southwestern 20.364 1629 16% 47% 37% 12.3 11.3 44.014 20.7%
33 GVS 51-993 Golden Valley Seed 20.292 1623 9% 38% 53% 17.6 9.8 47.735 16.0%
46 SW 100 102 Southwestern 20.201 1616 15% 35% 50% 16.0 10.1 46.283 15.4%
34 GVS 51-992 Golden Valley Seed 19.003 1520 4% 33% 64% 25.3 5.3 49.550 5.1%
32 GVS 51-193 Golden Valley Seed 18.894 1512 31% 32% 37% 9.7 5.2 33.795 23.6%
35 GVS 51-644 Golden Valley Seed 18.223 1458 3% 31% 66% 17.8 3.6 39.621 19.6%
47 SW 100 103 Southwestern 17.769 1422 20% 41% 40% 12.2 8.1 38.079 19.9%
31 GVS 51-178 Golden Valley Seed 14.683 1175 24% 57% 19% 5.5 10.9 31.073 18.9%
36 GVS 51-643 Golden Valley Seed 13.086 1047 0% 18% 82% 18.5 8.0 39.603 4.8%
Average 25.448 2036 20% 41% 39% 11.338 7.692 44.479 21%
Market yield = XL + L + M size fruit, average of four replications. One box = 25 lbs.
XL, L, M% = weight of respective fruit sizes divided by marketable yield.
Red% = weight of all red fruit divided by total yield. Indicates relative maturity among tested varieties.
Culls, tons per acre: Any fruit so disfigured (due to rot, cat facing, insect damage, etc.) as to be unmarketable.
XL = 3 inches and larger in diameter
L = 2.5 to 3"
M = 2.25 to 2.5"
S = 2 to 2.25" Fruit smaller than 2" were not harvested.

Tomato Research Progress Report 2003 21
Table 6. Fresh market tomato fruit and vine characteristics. Merced County, 2003.
OBSERVATIONAL varieities.
Vine Leaf Leaf Fruit Rough- Blossom Cat- Growth Sun- Zip-
Var # Variety Size cover roll shape ness end facing Cracks burn pers Stem Disease Comments
21 BHN 502 L OK S G, FG S SL N N SL SL J N
22 BHN 526 L G N G S SL S SL N SL SJ N late, many smalls, misshapen
23 BHN 581 L G N G M SL SL N N N SJ N early
24 BHN 611 L G N G M T N N N N J N
25 BHN 623 M OK SL G S T N N N N J N
26 SDT 01-6 L, sprawl OK N G, FG M SL N N SL N J N small, early
27 SDT 01-7 L G SL FG R M S N SL N NJ N
28 DT 03-70 ML OK Y G S T SL S N N J N
29 DT 03-71 ML G S FG S T SL SL SL N SJ N fruit streaking
30 GVS 51-182 VL, sprawl OK N G MR T SL SL SL SL SJ N many smalls, uneven ripening
31 GVS 51-178 VL, sprawl G N DG S M N N SL SL J BER
32 GVS 51-193 VL, sprawl OK N G M SL N S S N J N
33 GVS 51-993 VL OK N FG M SL SL SL SL SL J BER
34 GVS 51-992 L OK N G, FG R M N N N N NJ Y curly top, gr shoulders
35 GVS 51-644 VL OK N g R M N S SL SL J N fruit streaking
36 GVS 51-643 VL, sprawl G N FG MR M S N N N J Y curly top, all vine no tomatoes
37 HMX 2807 VL G N G R M S N N N SJ Y curly top
38 L-310 L OK N G M SL N N S N J Y curly top
39 L-311 ML G Y FG S T SL N S N J Y curly top
40 B-807 ML OK Y FG MR T S N S N J Y curly top
41 XTM 0113 L G N FG MR T N N N SL J N good color
42 XTM 0115 M G Y G M SL N N N SL J N good color
43 XTM 0230 L, sprawl OK N G, FG M T N N S N J N
44 XTM 0230 L, sprawl OK N G, FG M SL N N S S J N
45 SW 100 101 L OK Y G S T SL N S SL J N
46 SW 100 102 L, sprawl G N G M SL SL SL SL SL J N
47 SW 100 103 L OK N FG MR SL SL N S N J Y curly top
48 RFT 6047 L G N G MR SL SL N N N J Y curly top, deep shoulders
Vine Size: M = medium ML = medium large L = large VL = very large
Leaf Cover: P = poor OK = adequate G = good
Leaf Roll: N = none SL = slight S = some
Fruit Shape: DG = deep globe G = globe FG = flat globe R = Roma
Shoulder roughness: S = smooth M = medium MR = medium rough R = rough
Blossom End: T = tight SL = slight scar M = medium size scar
Cat Facing: N = none SL = slight S = some
Growth Cracks: N = none SL = slight S = some
Sunburn: N = none SL = slight S = some
Zippers: N = none SL = slight S = some
Stem: J = joint NJ = no joint SJ = semi joint
Disease: N = none Y = some symptoms seen BER = blossom end rot

Tomato Research Progress Report 2003 22
Table 7. Statewide combined results, replicated varieties.
% % % %
Variety Company Market Total Reds Market Total Reds Market Total Reds Market Total Reds
BHN 499 BHN Seed 28.1 39.7 24.0 40.9 49.0 34.1 32.8 53.9 20.4 10.6 16.3 17.5
Sun King Seminis 26.7 36.3 16.0 36.3 42.8 13.1 31.7 46.8 20.1 12.0 19.4 14.6
QualiT 23 Syngenta 25.4 32.9 16.2 26.7 30.9 15.3 37.4 50.9 23.4 11.9 16.9 9.8
L-312 LSL Plant Sci. 25.0 35.5 16.0 31.8 41.6 12.6 29.1 44.5 15.5 14.0 20.3 19.9
Bobcat Syngenta 24.5 33.4 17.3 27.4 32.5 18.8 31.6 46.6 18.2 14.6 20.9 15.1
QualiT 21 Syngenta 23.9 31.7 8.2 22.8 28.2 4.0 34.6 48.4 14.5 14.2 18.5 6.0
BHN 464 BHN Seed 20.8 30.8 13.1 25.2 31.6 20.0 27.5 44.1 13.0 9.7 16.8 6.3
Average 24.9 34.3 15.8 30.2 36.7 16.8 32.1 47.9 17.9 12.4 18.4 12.7
LSD .05 1.8 2.1 1.9
CV % 24.3 20.8 41.7
Shady Lady** 33.0 39.4 44.9 31.0 46.6 27.4
Variety x Location Interaction S NS S
Variety by Location Interaction - When this statistic is significant, it means that the varieties did not behave consistently at each location.
S = significant difference NS = not significantly different
* Market Yield = average weight in pounds of four replications converted to tons and boxes per acre of all marketable extra large,
large, and medium sized fruit. Small fruit were considered unmarketable this year.
TOTAL Yield = Marketable Yield plus small sized and cull fruit.
Percent Red = % reds by weight of TOTAL yield including culls to indicate maturity relative to all tested varieties.
** Shady Lady was not replicated in the San Joaquin County trial.
Yield T/A Yield T/A Yield T/A Yield T/A
(early season) (midseason) (late season)
YIELD & MATURITY* of Fresh Market Tomatoes - REPLICATED Varieties
Results Summary of Three Fresh Market Tomato Trials - 2003
Combined Results Kings Co. Merced Co. San Joaquin Co.
SORTED BY MARKETABLE YIELD

Tomato Research Progress Report 2003 23
26 November 2003
Tomato Variety Trial #2
Postharvest Evaluations of Round Tomatoes
Responsible:
Marita Cantwell Postharvest Specialist
Dept.Vegetable Crops, UC Davis, Davis, CA 95616
Tel: 530-752-7305; fax: 530-752-4554;
Project Cooperators:
Michelle LeStrange Coordinator Statewide Fresh Market Tomato Trials
UC Cooperative Extension Farm Advisor Tulare/Kings
Co.,
4437 S. Laspina St., Ste. B, Tulare, CA 93274
Tel: (559) 685-3309; fax: (559) 685-3319;
Scott Stoddard Farm Advisor, Merced County and Madera Counties
2145 Wardrobe Avenue, Merced, CA 95340-6496
tel: 209-385-7403; fax: 209-722-8856; [email protected]
Grower Cooperators:
Bob Giampaoli, Live Oak Farms
Daniel Acevedo, Labar Greenhouses
Objectives of Research: To evaluate the most important quality characteristics of ripened fresh market round
tomatoes from known varieties and new experimental lines.
Experimental Procedures Fruit Sampling and ripening
We harvested mature-green (MG) and vine-ripe (VR) fruit from the 2nd round tomato
variety trial for 8 replicated varieties and VR harvested fruit from 6 observational lines.
Vine-ripe (VR) fruit had 30-50% color at harvest and about 50 fruit per cultivar were
harvested. About 80 MG fruit or more were harvested in buckets, placed in plastic trays
for transport to the lab, and well-formed large (5x5 or 5x6) fruit were selected for
ripening and evaluation. A minimum of 24 fruit (3 reps of 8 each) from the VR harvested
fruit and a minimum of 45 (3 reps x 15 fruit) of MG harvested fruit were ripened under
standard conditions. MG fruit were of high maturity and were not treated with ethylene
in this trial. Fruit were placed on plastic-wrapped trays to complete ripening at 20°C.
Fruit were evaluated when they reached the table-ripe stage or color stage 6 on the
USDA scale + 1-2 days.
Tomato Research Progress Report 2003 24
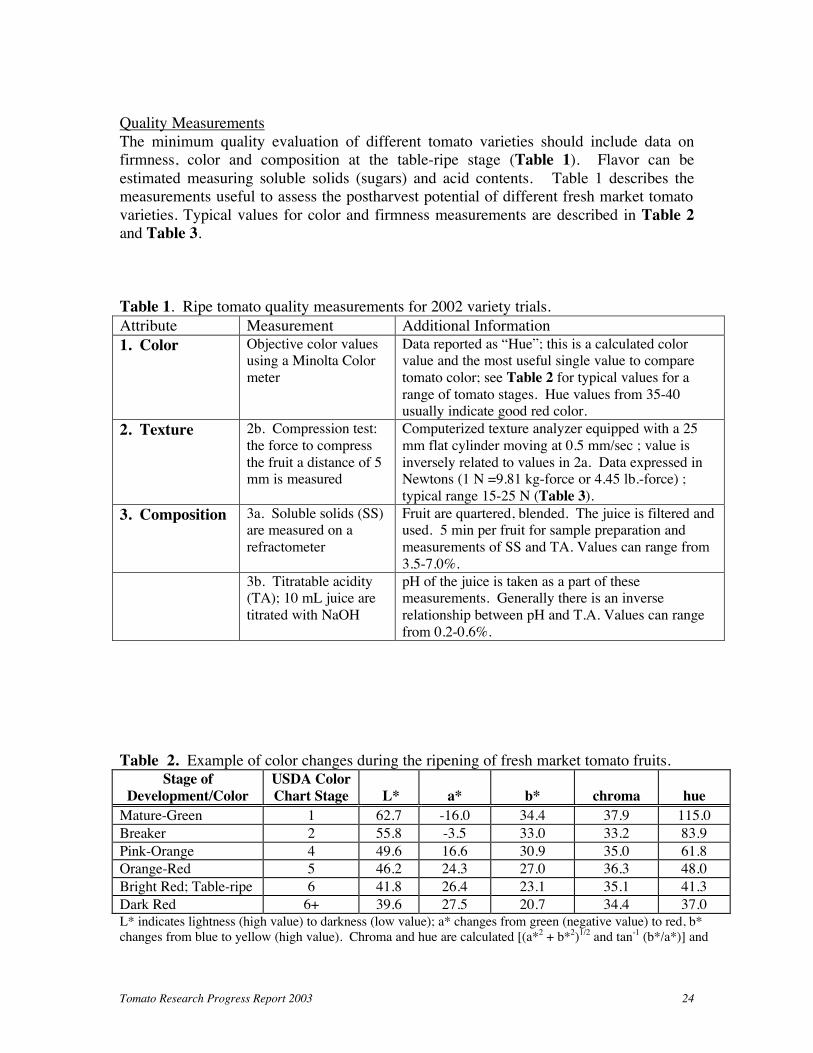
Quality Measurements
The minimum quality evaluation of different tomato varieties should include data on
firmness, color and composition at the table-ripe stage (Table 1). Flavor can be
estimated measuring soluble solids (sugars) and acid contents. Table 1 describes the
measurements useful to assess the postharvest potential of different fresh market tomato
varieties. Typical values for color and firmness measurements are described in Table 2
and Table 3.
Table 1. Ripe tomato quality measurements for 2002 variety trials.
Attribute Measurement Additional Information
1. Color Objective color values using a Minolta Color
meter
Data reported as “Hue”; this is a calculated color value and the most useful single value to compare
tomato color; see Table 2 for typical values for a
range of tomato stages. Hue values from 35-40 usually indicate good red color.
2. Texture 2b. Compression test:
the force to compress
the fruit a distance of 5 mm is measured
Computerized texture analyzer equipped with a 25
mm flat cylinder moving at 0.5 mm/sec ; value is
inversely related to values in 2a. Data expressed in Newtons (1 N =9.81 kg-force or 4.45 lb.-force) ;
typical range 15-25 N (Table 3).
3. Composition 3a. Soluble solids (SS) are measured on a
refractometer
Fruit are quartered, blended. The juice is filtered and used. 5 min per fruit for sample preparation and
measurements of SS and TA. Values can range from
3.5-7.0%.
3b. Titratable acidity (TA); 10 mL juice are
titrated with NaOH
pH of the juice is taken as a part of these measurements. Generally there is an inverse
relationship between pH and T.A. Values can range
from 0.2-0.6%.
Table 2. Example of color changes during the ripening of fresh market tomato fruits.
Stage of
Development/Color
USDA Color
Chart Stage
L*
a*
b*
chroma
hue
Mature-Green 1 62.7 -16.0 34.4 37.9 115.0
Breaker 2 55.8 -3.5 33.0 33.2 83.9
Pink-Orange 4 49.6 16.6 30.9 35.0 61.8
Orange-Red 5 46.2 24.3 27.0 36.3 48.0
Bright Red; Table-ripe 6 41.8 26.4 23.1 35.1 41.3
Dark Red 6+ 39.6 27.5 20.7 34.4 37.0 L* indicates lightness (high value) to darkness (low value); a* changes from green (negative value) to red, b*
changes from blue to yellow (high value). Chroma and hue are calculated [(a*2 + b*2)1/2 and tan-1 (b*/a*)] and

Tomato Research Progress Report 2003 25
indicate intensity and color, respectively. The lower the hue value, the redder the tomato. Hue is the single
most useful color value.
Table 3. Textural characteristics of tomatoes based on subjective and objective tests.
1Measured by placing a 500 g weight for 10 seconds on the equator of the fruit; see 2a in Table 1.
2 Measured by compressing fruit at the equator with a 25 mm flat cylindrical probe to a distance of 5 mm on a computerized texture analyzer. 1 Newton force = 9.81 kg-force or 4.45 pound-force.
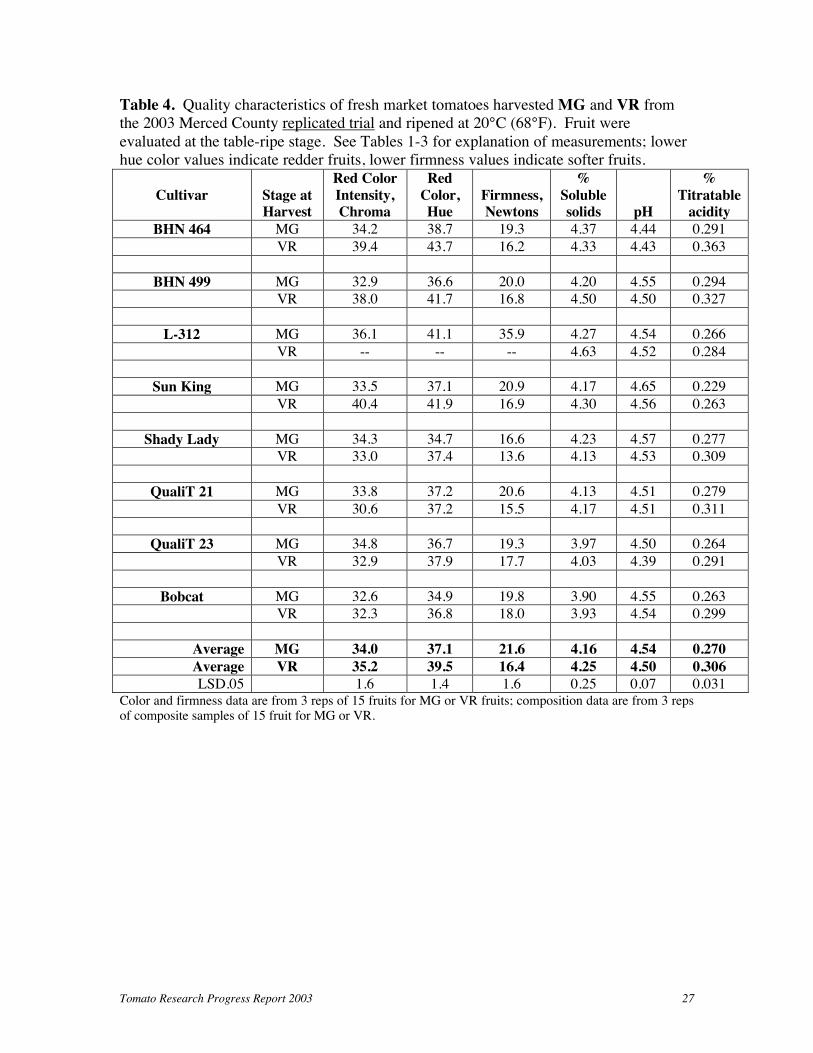
Results
Replicated Trial. Eight cultivars from the replicated trial were evaluated from MG and
VR harvested fruit (Table 4). Final red color was generally good but there were several
cultivars (BHN 464, BHN 499, Sun King) harvested VR had hue color values higher than
40 (higher values indicate less red color development). The MG harvested L-312 also
had red color values higher than 40. Firmness of the VR harvested fruit averaged 16.4 N
vs 19.6 for all cultivars except L-312. The MG harvested L-312 was very hard at the
table-ripe stage (35.9 N). Fruit from cv Shady Lady averaged the lowest firmness values
for both the MG and VR harvested fruit. The % soluble solids varied from 3.90 to 4.37%
for MG harvested fruit and from 3.93 to 4.63% for VR harvested fruit. VR harvested L-
312 fruit had the highest % soluble solids. The % titratable acidity was significantly
higher for the VR harvested fruit compared to the MG harvested fruit (0.31 vs 0.27%).
VR harvested fruit from cv. BHN 464 had the highest % titratable acidity (0.36%) while
MG harvested fruit from cv. Sun King had the lowest % (0.23%).
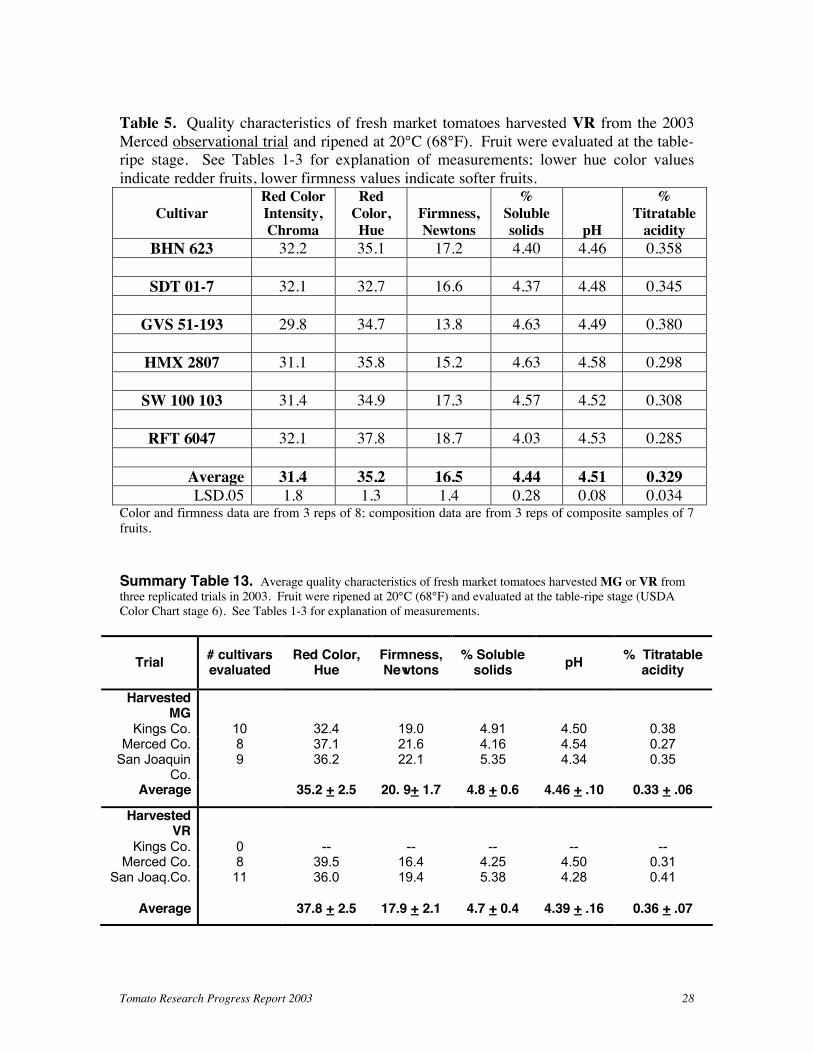
Observational Trial. In the fruit from the 6 cultivars harvested VR from the observation
trial (Table 5), all had excellent red color development at the table-ripe stage. Firmness
values averaged the same as VR harvested fruit from the replicated trial. Fruit of cv GVS
51-193 were notably softer than fruit from other cultivars. Average % soluble solids
were higher than for fruit from the replicated trial (4.51% vs 4.25%). HMX2807 fruit
had the highest % soluble solids (4.63%) and fruit from RFT 6047 has the lowest
(4.03%). The % titratable acidity varied from 0.285 to 0.358% and was on average
higher than for fruit from the replicated trial. Fruit from RFT 6047 had the lowest acidity
(0.285%) while fruit from BHN 623 had the highest acidity (0.358%). Based on the low
Firmness Class Description based on hand
and finger pressure
Manual Firmness
(mm compression)1
Texture Analyzer
Newtons Force2
Very Firm Fruit yields only slight to considerable
pressure
0.5-1.0
>25 Firm Fruit yields slightly to moderate pressure 1.0-1.5 18-25 Moderately Firm -- 1.5-2.0 15-18 Moderately Soft -- 2.0-2.5 12-15 Soft Fruit yields readily to slight pressure 2.5-3.0 8-12 Very Soft Fruits yields very readily to
slight pressure >3.0 <8

Tomato Research Progress Report 2003 26
soluble solids and acidity contents, fruit of RFT 6047 likely would have less flavor than
fruit of the other cultivars evaluated.
Three Trial Summaries:
Quality results were generally similar for a given cultivar between the Kings County and
San Joaquin County Trials, but the results for the Merced trial were often considerably
different. In general MG-harvested fruit from the Merced trial were softer (lower
firmness value), had lower % soluble solids and lower % titratable acidity. Color
development was similar in fruit from the Merced and San Joaquin trials, but was
sometimes better developed in fruit from the Kings trial (lower hue value). These results
are similar to those summarized in Table 13, which included varieties present in the 3
locations, but only in the replicated trial.
Nine cultivars were harvested as VR fruit in the Merced and San Joaquin replicated or
observational trials. The differences are similar to those of the MG-harvested fruit. Fruit
from the Merced trial were generally softer, had lower % soluble solids and lower %
titratable acidity than fruit from the San Joaquin trial. On average, red color
development was slightly better in fruit from the San Joaquin trial. These results are also
similar to the summary from the varieties in the replicated trial only (Table 13).
Table 14 summarizes average values for color, firmness, % soluble solids and titratable
acidity for 9 varieties that were evaluated on at least 4 occasions. Tomatoes were
evaluated from MG- or VR-harvested fruit. Table 15 provides an overall ranking of the
varieties based on color, firmness and composition values for 2003 evaluations. Cultivar
HMX 2807 was ranked the highest in overall quality, and BHN 464 ranked the lowest.
HMX 2807 ranked the best in flavor score and QualiT 23 ranked the lowest in overall
flavor score. Bobcat, QualiT 21 and Shady Lady ranked top in overall red color score
and L-312 ranked the lowest. Overall firmness score was highest for L-312 and lowest
for Shady Lady. In 2003, the fruit generally had higher contents of soluble solids and
titratable acidity than the fruit harvested in 2002.
Tomato Research Progress Report 2003 27
Table 4. Quality characteristics of fresh market tomatoes harvested MG and VR from
the 2003 Merced County replicated trial and ripened at 20°C (68°F). Fruit were
evaluated at the table-ripe stage. See Tables 1-3 for explanation of measurements; lower
hue color values indicate redder fruits, lower firmness values indicate softer fruits.
Cultivar
Stage at
Harvest
Red Color
Intensity,
Chroma
Red
Color,
Hue
Firmness,
Newtons
%
Soluble
solids
pH
%
Titratable
acidity
BHN 464 MG 34.2 38.7 19.3 4.37 4.44 0.291
VR 39.4 43.7 16.2 4.33 4.43 0.363
BHN 499 MG 32.9 36.6 20.0 4.20 4.55 0.294
VR 38.0 41.7 16.8 4.50 4.50 0.327
L-312 MG 36.1 41.1 35.9 4.27 4.54 0.266
VR -- -- -- 4.63 4.52 0.284
Sun King MG 33.5 37.1 20.9 4.17 4.65 0.229
VR 40.4 41.9 16.9 4.30 4.56 0.263
Shady Lady MG 34.3 34.7 16.6 4.23 4.57 0.277
VR 33.0 37.4 13.6 4.13 4.53 0.309
QualiT 21 MG 33.8 37.2 20.6 4.13 4.51 0.279
VR 30.6 37.2 15.5 4.17 4.51 0.311
QualiT 23 MG 34.8 36.7 19.3 3.97 4.50 0.264
VR 32.9 37.9 17.7 4.03 4.39 0.291
Bobcat MG 32.6 34.9 19.8 3.90 4.55 0.263
VR 32.3 36.8 18.0 3.93 4.54 0.299
Average MG 34.0 37.1 21.6 4.16 4.54 0.270
Average VR 35.2 39.5 16.4 4.25 4.50 0.306
LSD.05 1.6 1.4 1.6 0.25 0.07 0.031 Color and firmness data are from 3 reps of 15 fruits for MG or VR fruits; composition data are from 3 reps of composite samples of 15 fruit for MG or VR.
Tomato Research Progress Report 2003 28
Table 5. Quality characteristics of fresh market tomatoes harvested VR from the 2003
Merced observational trial and ripened at 20°C (68°F). Fruit were evaluated at the table-
ripe stage. See Tables 1-3 for explanation of measurements; lower hue color values
indicate redder fruits, lower firmness values indicate softer fruits.
Cultivar
Red Color
Intensity,
Chroma
Red
Color,
Hue
Firmness,
Newtons
%
Soluble
solids
pH
%
Titratable
acidity
BHN 623 32.2 35.1 17.2 4.40 4.46 0.358
SDT 01-7 32.1 32.7 16.6 4.37 4.48 0.345
GVS 51-193 29.8 34.7 13.8 4.63 4.49 0.380
HMX 2807 31.1 35.8 15.2 4.63 4.58 0.298
SW 100 103 31.4 34.9 17.3 4.57 4.52 0.308
RFT 6047 32.1 37.8 18.7 4.03 4.53 0.285
Average 31.4 35.2 16.5 4.44 4.51 0.329
LSD.05 1.8 1.3 1.4 0.28 0.08 0.034 Color and firmness data are from 3 reps of 8; composition data are from 3 reps of composite samples of 7
fruits.
Summary Table 13. Average quality characteristics of fresh market tomatoes harvested MG or VR from
three replicated trials in 2003. Fruit were ripened at 20°C (68°F) and evaluated at the table-ripe stage (USDA
Color Chart stage 6). See Tables 1-3 for explanation of measurements.
Trial # cultivars evaluated
Red Color, Hue
Firmness, Newtons
% Soluble solids
pH % Titratable
acidity
Harvested MG
Kings Co. 10 32.4 19.0 4.91 4.50 0.38 Merced Co. 8 37.1 21.6 4.16 4.54 0.27
San Joaquin Co.
9 36.2 22.1 5.35 4.34 0.35
Average 35.2 + 2.5 20. 9+ 1.7 4.8 + 0.6 4.46 + .10 0.33 + .06
Harvested VR
Kings Co. 0 -- -- -- -- -- Merced Co. 8 39.5 16.4 4.25 4.50 0.31
San Joaq.Co. 11 36.0 19.4 5.38 4.28 0.41
Average 37.8 + 2.5 17.9 + 2.1 4.7 + 0.4 4.39 + .16 0.36 + .07
Tomato Research Progress Report 2003 29
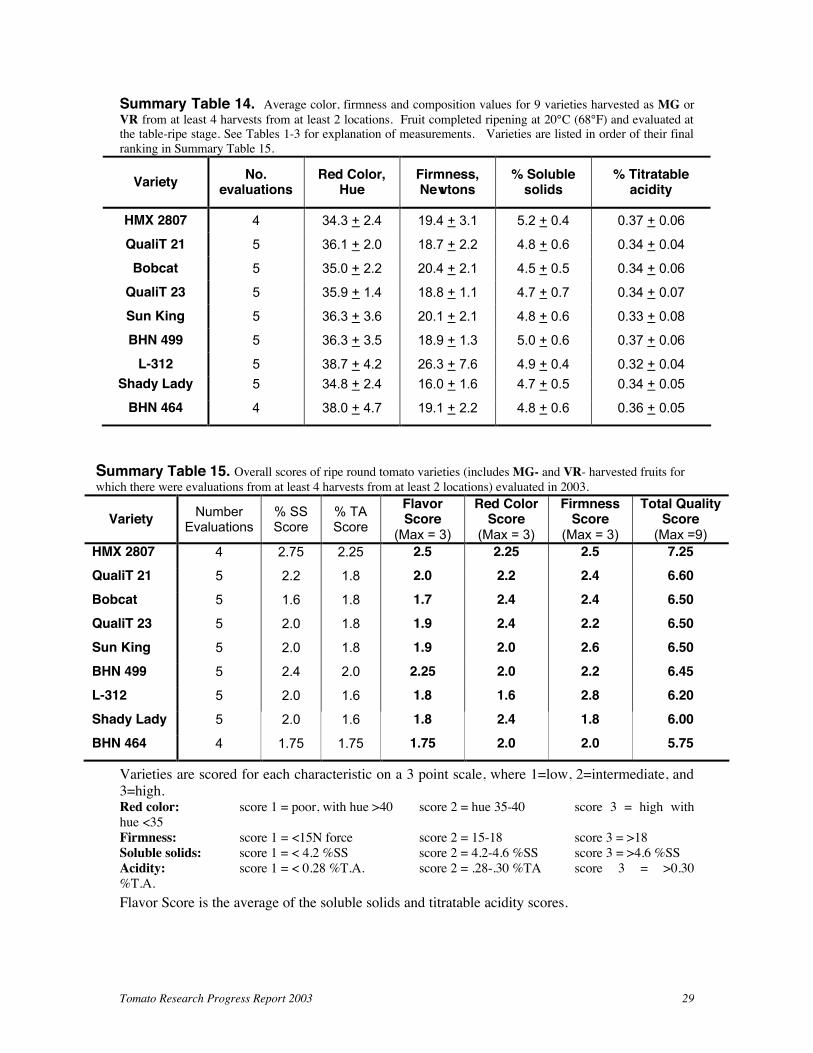
Summary Table 14. Average color, firmness and composition values for 9 varieties harvested as MG or
VR from at least 4 harvests from at least 2 locations. Fruit completed ripening at 20°C (68°F) and evaluated at the table-ripe stage. See Tables 1-3 for explanation of measurements. Varieties are listed in order of their final
ranking in Summary Table 15.
Variety No.
evaluations Red Color,
Hue Firmness, Newtons
% Soluble solids
% Titratable acidity
HMX 2807 4 34.3 + 2.4 19.4 + 3.1 5.2 + 0.4 0.37 + 0.06
QualiT 21 5 36.1 + 2.0 18.7 + 2.2 4.8 + 0.6 0.34 + 0.04
Bobcat 5 35.0 + 2.2 20.4 + 2.1 4.5 + 0.5 0.34 + 0.06
QualiT 23 5 35.9 + 1.4 18.8 + 1.1 4.7 + 0.7 0.34 + 0.07
Sun King 5 36.3 + 3.6 20.1 + 2.1 4.8 + 0.6 0.33 + 0.08
BHN 499 5 36.3 + 3.5 18.9 + 1.3 5.0 + 0.6 0.37 + 0.06
L-312 5 38.7 + 4.2 26.3 + 7.6 4.9 + 0.4 0.32 + 0.04
Shady Lady 5 34.8 + 2.4 16.0 + 1.6 4.7 + 0.5 0.34 + 0.05
BHN 464 4 38.0 + 4.7 19.1 + 2.2 4.8 + 0.6 0.36 + 0.05
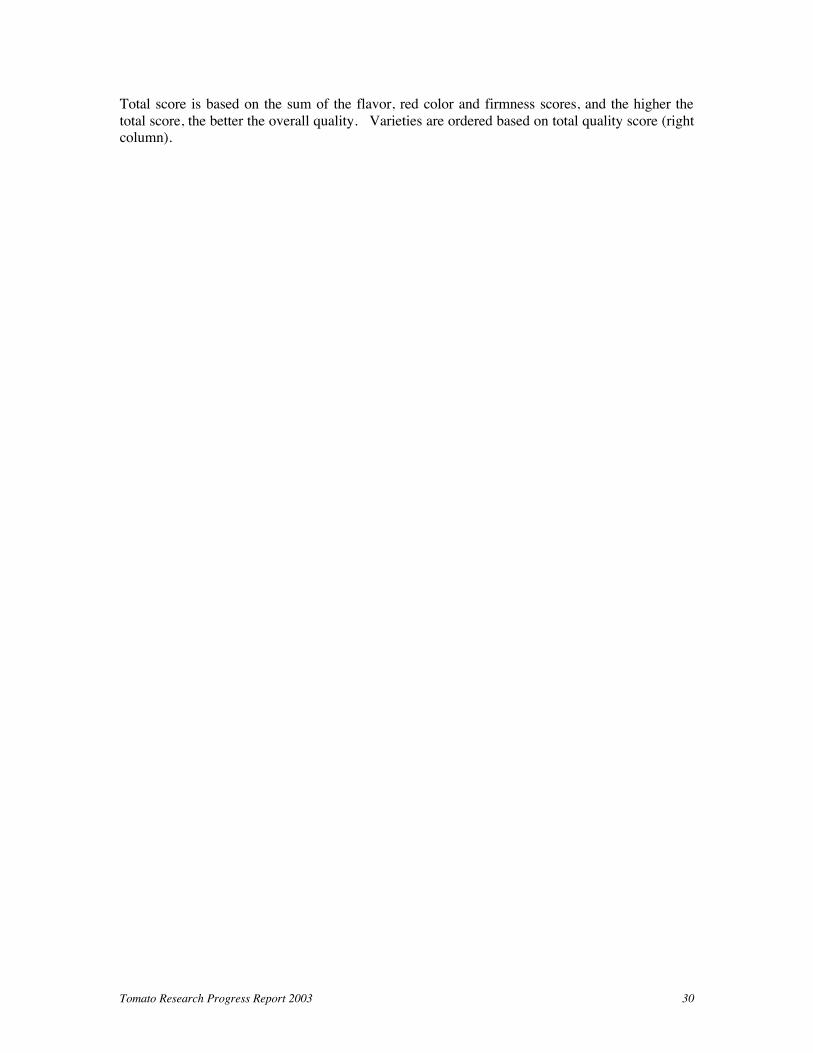
Summary Table 15. Overall scores of ripe round tomato varieties (includes MG- and VR- harvested fruits for
which there were evaluations from at least 4 harvests from at least 2 locations) evaluated in 2003.
Variety Number
Evaluations % SS Score
% TA Score
Flavor Score
(Max = 3)
Red Color Score
(Max = 3)
Firmness Score
(Max = 3)
Total Quality Score
(Max =9)
HMX 2807 4 2.75 2.25 2.5 2.25 2.5 7.25
QualiT 21 5 2.2 1.8 2.0 2.2 2.4 6.60
Bobcat 5 1.6 1.8 1.7 2.4 2.4 6.50
QualiT 23 5 2.0 1.8 1.9 2.4 2.2 6.50
Sun King 5 2.0 1.8 1.9 2.0 2.6 6.50
BHN 499 5 2.4 2.0 2.25 2.0 2.2 6.45
L-312 5 2.0 1.6 1.8 1.6 2.8 6.20
Shady Lady 5 2.0 1.6 1.8 2.4 1.8 6.00
BHN 464 4 1.75 1.75 1.75 2.0 2.0 5.75
Varieties are scored for each characteristic on a 3 point scale, where 1=low, 2=intermediate, and 3=high. Red color: score 1 = poor, with hue >40 score 2 = hue 35-40 score 3 = high with
hue <35
Firmness: score 1 = <15N force score 2 = 15-18 score 3 = >18
Soluble solids: score 1 = < 4.2 %SS score 2 = 4.2-4.6 %SS score 3 = >4.6 %SS
Acidity: score 1 = < 0.28 %T.A. score 2 = .28-.30 %TA score 3 = >0.30
%T.A.
Flavor Score is the average of the soluble solids and titratable acidity scores.
Tomato Research Progress Report 2003 30
Total score is based on the sum of the flavor, red color and firmness scores, and the higher the
total score, the better the overall quality. Varieties are ordered based on total quality score (right column).
Tomato Research Progress Report 2003 31
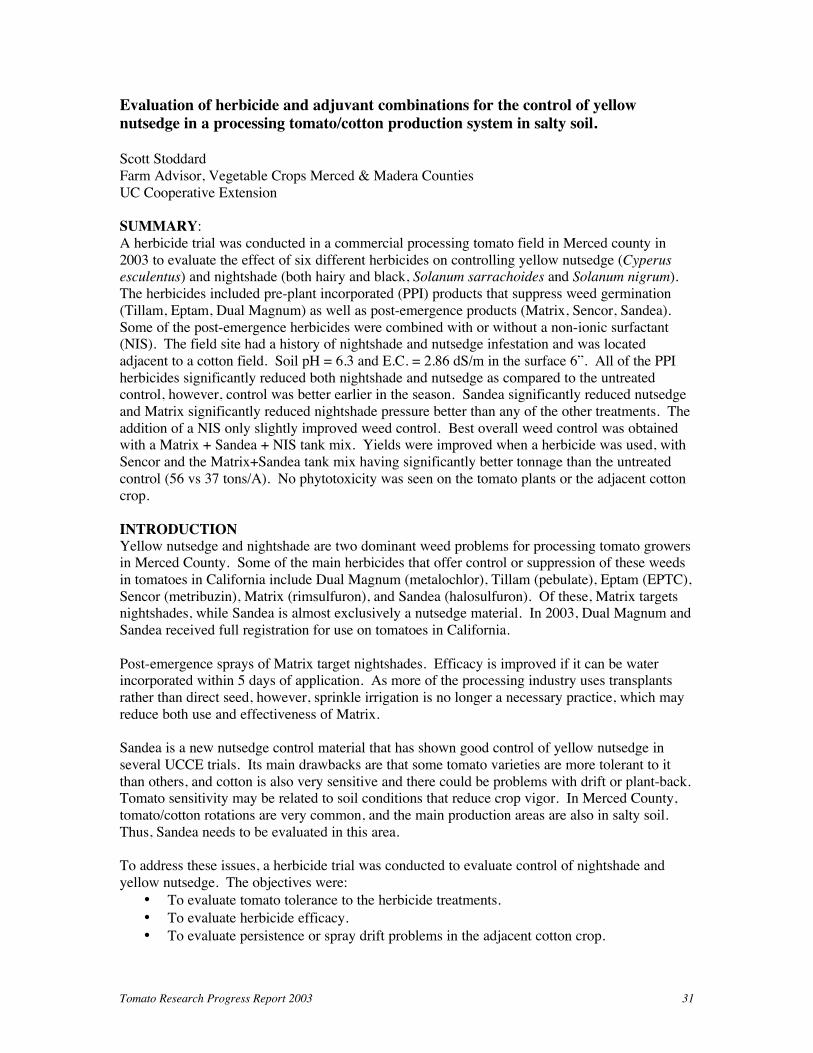
Evaluation of herbicide and adjuvant combinations for the control of yellow
nutsedge in a processing tomato/cotton production system in salty soil.
Scott Stoddard
Farm Advisor, Vegetable Crops Merced & Madera Counties
UC Cooperative Extension
SUMMARY:
A herbicide trial was conducted in a commercial processing tomato field in Merced county in
2003 to evaluate the effect of six different herbicides on controlling yellow nutsedge (Cyperus
esculentus) and nightshade (both hairy and black, Solanum sarrachoides and Solanum nigrum).
The herbicides included pre-plant incorporated (PPI) products that suppress weed germination
(Tillam, Eptam, Dual Magnum) as well as post-emergence products (Matrix, Sencor, Sandea).
Some of the post-emergence herbicides were combined with or without a non-ionic surfactant (NIS). The field site had a history of nightshade and nutsedge infestation and was located
adjacent to a cotton field. Soil pH = 6.3 and E.C. = 2.86 dS/m in the surface 6”. All of the PPI
herbicides significantly reduced both nightshade and nutsedge as compared to the untreated control, however, control was better earlier in the season. Sandea significantly reduced nutsedge
and Matrix significantly reduced nightshade pressure better than any of the other treatments. The
addition of a NIS only slightly improved weed control. Best overall weed control was obtained with a Matrix + Sandea + NIS tank mix. Yields were improved when a herbicide was used, with
Sencor and the Matrix+Sandea tank mix having significantly better tonnage than the untreated
control (56 vs 37 tons/A). No phytotoxicity was seen on the tomato plants or the adjacent cotton
crop.
INTRODUCTION Yellow nutsedge and nightshade are two dominant weed problems for processing tomato growers in Merced County. Some of the main herbicides that offer control or suppression of these weeds
in tomatoes in California include Dual Magnum (metalochlor), Tillam (pebulate), Eptam (EPTC),
Sencor (metribuzin), Matrix (rimsulfuron), and Sandea (halosulfuron). Of these, Matrix targets nightshades, while Sandea is almost exclusively a nutsedge material. In 2003, Dual Magnum and
Sandea received full registration for use on tomatoes in California.
Post-emergence sprays of Matrix target nightshades. Efficacy is improved if it can be water incorporated within 5 days of application. As more of the processing industry uses transplants
rather than direct seed, however, sprinkle irrigation is no longer a necessary practice, which may
reduce both use and effectiveness of Matrix.
Sandea is a new nutsedge control material that has shown good control of yellow nutsedge in
several UCCE trials. Its main drawbacks are that some tomato varieties are more tolerant to it
than others, and cotton is also very sensitive and there could be problems with drift or plant-back. Tomato sensitivity may be related to soil conditions that reduce crop vigor. In Merced County,
tomato/cotton rotations are very common, and the main production areas are also in salty soil.
Thus, Sandea needs to be evaluated in this area.
To address these issues, a herbicide trial was conducted to evaluate control of nightshade and
yellow nutsedge. The objectives were:
• To evaluate tomato tolerance to the herbicide treatments.
• To evaluate herbicide efficacy.
• To evaluate persistence or spray drift problems in the adjacent cotton crop.
Tomato Research Progress Report 2003 32
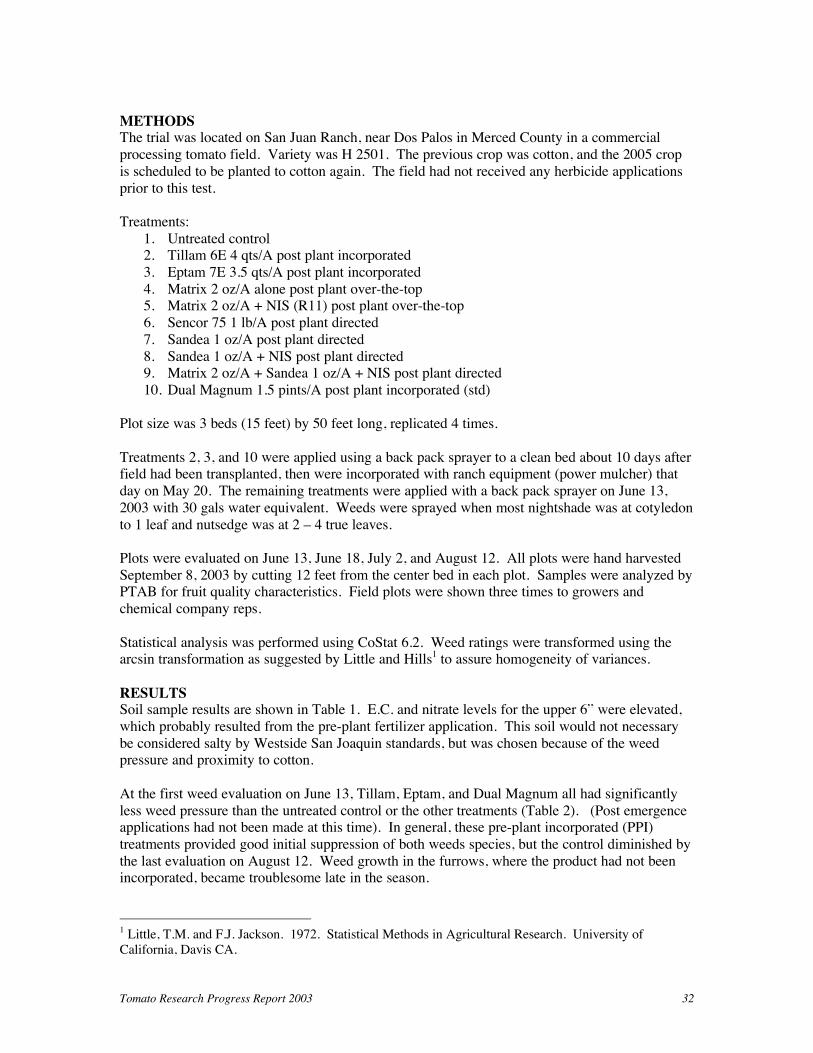
METHODS The trial was located on San Juan Ranch, near Dos Palos in Merced County in a commercial
processing tomato field. Variety was H 2501. The previous crop was cotton, and the 2005 crop
is scheduled to be planted to cotton again. The field had not received any herbicide applications
prior to this test.
Treatments:
1. Untreated control 2. Tillam 6E 4 qts/A post plant incorporated
3. Eptam 7E 3.5 qts/A post plant incorporated
4. Matrix 2 oz/A alone post plant over-the-top 5. Matrix 2 oz/A + NIS (R11) post plant over-the-top
6. Sencor 75 1 lb/A post plant directed
7. Sandea 1 oz/A post plant directed
8. Sandea 1 oz/A + NIS post plant directed 9. Matrix 2 oz/A + Sandea 1 oz/A + NIS post plant directed
10. Dual Magnum 1.5 pints/A post plant incorporated (std)
Plot size was 3 beds (15 feet) by 50 feet long, replicated 4 times.
Treatments 2, 3, and 10 were applied using a back pack sprayer to a clean bed about 10 days after field had been transplanted, then were incorporated with ranch equipment (power mulcher) that
day on May 20. The remaining treatments were applied with a back pack sprayer on June 13,
2003 with 30 gals water equivalent. Weeds were sprayed when most nightshade was at cotyledon
to 1 leaf and nutsedge was at 2 – 4 true leaves.
Plots were evaluated on June 13, June 18, July 2, and August 12. All plots were hand harvested
September 8, 2003 by cutting 12 feet from the center bed in each plot. Samples were analyzed by PTAB for fruit quality characteristics. Field plots were shown three times to growers and
chemical company reps.
Statistical analysis was performed using CoStat 6.2. Weed ratings were transformed using the arcsin transformation as suggested by Little and Hills
1 to assure homogeneity of variances.
RESULTS Soil sample results are shown in Table 1. E.C. and nitrate levels for the upper 6” were elevated,
which probably resulted from the pre-plant fertilizer application. This soil would not necessary
be considered salty by Westside San Joaquin standards, but was chosen because of the weed pressure and proximity to cotton.
At the first weed evaluation on June 13, Tillam, Eptam, and Dual Magnum all had significantly
less weed pressure than the untreated control or the other treatments (Table 2). (Post emergence applications had not been made at this time). In general, these pre-plant incorporated (PPI)
treatments provided good initial suppression of both weeds species, but the control diminished by
the last evaluation on August 12. Weed growth in the furrows, where the product had not been incorporated, became troublesome late in the season.
1 Little, T.M. and F.J. Jackson. 1972. Statistical Methods in Agricultural Research. University of
California, Davis CA.

Tomato Research Progress Report 2003 33
Best control of both weed species was obtained with the Matrix + Sandea combination. Not only
did this treatment provide fairly quick burn-down of the weed species, but lasted through the growing season (Table 2). Sandea alone did a good job of controlling nutsedge but had no effect
on nightshade, while Matrix did a very good job of controlling nightshade and had a slight
suppressive effect on nutsedge. Sencor did a good job of burning down both weed species if they
were small, but nightshade larger than the cotyledon stage had renewed growth, and much of the nutsedge recovered. Weed control is shown graphically in Figures 1A, B, and C.
No phytotoxicity problems were seen with any of the Sandea treatments on the tomatoes or the adjacent cotton (tomato variety was H2501).
Significant differences were found for tonnage between the treatments, which best yields occurring in the Sandea+Matrix combination and Sencor plots at about 56 tons/acre. There were
no significant differences with the other treatments, but the control plot was almost lowest
yielding at 37.2 tons/acre. There were no differences in the fruit quality measurements.
A surprising result of the trial was how effectively Matrix worked even though it was not
sprinkler incorporated. Very good nightshade control was obtained both with and without the
surfactant with only the over-the-top application. The treatment used the equivalent of 30 gallons per acre when applied. The addition of a surfactant slightly improved weed control for both
Sandea and Matrix in this trial (Table 2).

Tomato Research Progress Report 2003 34
Table 1. Soil analysis results, San Juan Ranch field site May 2003.
SP pH EC
Ca
(SP)
Mg
(SP)
Na
(SP) Cl (SP)
HCO3
(SP)
CO3
(SP) NO3-N
Olsen-
P X-K
Depth %
dS/m
meq/L
meq/L
meq/L
meq/L
meq/L
meq/L
ppm
ppm
ppm
0 – 6” 41 6.3 2.86 11.7 7.4 5.8 3.6 1.2 <0.1 97.0 63.6 158
6 – 12” 41 6.3 1.74 6.8 4.0 5.2 5.6 1.0 <0.1 99.0 34.5 100
12 – 18” 45 6.6 1.62 6.3 3.6 5.1 5.6 1.8 <0.1 32.5 22.3 79
SP = Saturated Paste Extract is the percent water and is approximately twice the field capacity of the soil.
EC = electrical conductivity, a measure of the salt content of the soil.
Figure 1A. Degree of weed pressure as affected by herbicide treatment on June 13.
Error bars represent LSD 0.05.
June 13, 2003
0.0
10.0
20.0
30.0
40.0
50.0
60.0
UTC
Tilla
m 4 qts PPI
Eptam 3.5
qts PPI
Mat
rix 2 oz
Matrix 2 oz
+ N
IS
Senc
or 75 1 lb
Sand
ea 1 oz
Sand
ea 1 oz + N
IS
Matrix + S
ande
a + N
IS
Dua
l Mag
num 1.5
pts PPI
deg
ree o
f w
eed
pressu
re
nutsedge
nightshade

Tomato Research Progress Report 2003 35
Figure 1B. Degree of weed pressure as affected by herbicide treatment on June 18.
Error bars represent LSD 0.05.
Figure 1C. Degree of weed pressure as affected by herbicide treatment on July 2.
Error bars represent LSD 0.05.
June 18, 2003
0.0
10.0
20.0
30.0
40.0
50.0
60.0
70.0
80.0
UTC
Tilla
m 4 qts PPI
Eptam 3.5
qts PPI
Mat
rix 2 oz
Matrix 2 oz
+ N
IS
Senc
or 75 1 lb
Sand
ea 1 oz
Sand
ea 1 oz + N
IS
Matrix + S
ande
a + N
IS
Dua
l Mag
num 1.5
pts PPI
deg
ree o
f w
eed
pressu
re
nutsedge
nightshade
July 2, 2003
0.0
10.0
20.0
30.0
40.0
50.0
60.0
70.0
UTC
Tilla
m 4 qts PPI
Eptam 3.5
qts PPI
Mat
rix 2 oz
Matrix 2 oz
+ N
IS
Senc
or 75 1 lb
Sand
ea 1 oz
Sand
ea 1 oz + N
IS
Matrix + S
ande
a + N
IS
Dua
l Mag
num 1.5
pts PPI
deg
ree o
f w
eed
pressu
re
nutsedge
nightshade

Tomato Research Progress Report 2003 36
Table 2. Efficacy of various herbicide and adjuvant combinations on the control of yellow nutsedge and nightshade in
processing tomatoes. Merced County 2003.
6/13/03 6/18/03 7/2/03 8/12/03
Nut- Night- Nut- Night- Nut- Night- Nut- Night- red yield LED
tr # treatment sedge shade sedge shade sedge shade sedge shade tons/A color SS pH
1 UTC 39.2 40.7 46.5 63.8 43.6 60.6 56.1 73.1 37.2 24.0 5.2 4.43
2 Tillam 4 qts PPI 22.5 24.2 23.2 36.0 31.5 39.2 39.1 54.1 36.7 22.8 5.2 4.39
3 Eptam 3.5 qts PPI 18.4 26.2 24.5 27.7 31.5 42.1 34.1 51.1 46.4 23.3 5.1 4.47
4 Matrix 2 oz 39.1 51.1 34.6 29.5 31.0 15.9 37.1 31.0 46.1 22.5 5.2 4.44
5 Matrix 2 oz + NIS 39.2 45.0 26.2 15.9 26.6 11.3 34.2 23.9 44.7 23.3 5.2 4.42
6 Sencor 75 1 lb 34.7 46.4 28.2 24.8 28.2 24.5 31.0 23.4 56.0 24.0 5.3 4.44
7 Sandea 1 oz 37.4 48.2 24.2 53.9 4.6 47.9 13.1 40.8 43.7 24.5 5.3 4.42
8 Sandea 1 oz + NIS 36.2 46.7 18.4 34.6 4.6 36.2 21.1 22.1 44.8 23.5 5.2 4.45
9 Matrix + Sandea + NIS 37.6 46.4 18.4 18.4 9.2 4.6 15.0 18.4 56.6 22.8 5.1 4.42
10 Dual Magnum 1.5 pts PPI 18.4 22.5 29.4 34.7 27.9 37.7 30.0 38.1 44.1 22.0 5.6 4.46
average 32.3 39.7 27.4 33.9 23.9 32.0 31.1 37.6 45.6 23.3 5.2 4.43
LSD 0.05 6.8 10.9 10.8 12.8 9.0 12.0 NS 28.2 11.1 NS NS NS
CV 14.6 18.9 27.1 25.9 26 25.9 48.4 43.8 14.2 4.5 5.8 1
with NIS 37.7 46.1 21.0 23.0 13.5 17.4 48.7
without NIS 38.3 49.6 29.4 41.7 17.8 31.9 44.9
F-test NS NS ** * NS NS NS
PPI 19.8 24.3 25.7 32.8 30.3 39.6 42.4
UTC 39.2 40.7 46.5 63.8 43.6 60.6 37.2
F-test ** ** ** ** ** ** NS
Weed ratings reflect weed pressure; lower values indicate less weed growth (better control).
0 = no weeds, 90 = all weeds
On June 13, only treatments 2, 3, and 10 had been applied.
LSD = least significant difference at the 95% confidence level. Means separated by less
than this amount are not significantly different. Weed analysis performed on transformed data.
** = significant at 95%, NS = not significant
NIS = non-ionic surfactant
PPI = post plant incorporated

Tomato Research Progress Report 2003 37
Plastic Mulch on Fresh Market Pole Tomatoes Scott Stoddard
Assistant Farm Advisor Merced & Madera Counties
OBJECTIVE: Evaluate different colored plastic mulches by Ampacet Corp. on early and late
planted fresh market pole tomato production and quality.
LOCATION: 1 mile west of Minturn Rd and 1/2 mile north of Buchanon Hollow Rd, near
LeGrand, CA. Cooperator: Jeff Marchini of J. Marchini and Sons.
TREATMENTS (Mulch color):
1. Grower black (std) 2. Red
3. Silver
4. Olive
5. White 6. Blue
7. White on black
8. Black 9. Grower white on black
PLOT DIAGRAM:
REP 3 REP 4
1 2 3 4 5 6 7 8 9 1 2 3 4 5 6 7 8 9
1 2 3 4 5 6 7 8 9 1 2 3 4 5 6 7 8 9
REP 1 REP 2
Plot size: 250 ft long x 5 ft (1 bed) wide, replicated 4 times. Total mulch length along bed about 500 ft. Sample size within each plot 12 ft. Early plant date trial shown above with 18 beds total.
Late plant trial had only 9 beds (2 replications).
Mulch application date: April 18, 2003. Applied with drip line. Variety: Bobcat on 16” centers.
Transplant dates: Early: May 1, 3002. Late: June 20, 2003
Harvest dates: Early trial hand harvested pinks and reds on July 28, Aug 1, Aug 7, Aug 15, and Aug 22, 2003. Late trial was not harvested.

Tomato Research Progress Report 2003 38
RESULTS
Because of the need to keep the plastic mulch intact throughout the length of the bed, it was applied from one field row to the next. There was not enough plastic for four replications along
the rows, so the field was split into two sampling areas, one on each side of the field. This gave
the equivalent of 4 replications for the early plant trial, however, only one incomplete set of
colors was applied for the late planted trial. Mulch application in April is shown in Figure 1.
The early trial was transplanted to variety Bobcat around May 1, about 3 weeks later than
originally planned. Poles were added about 4 weeks later to support the plants (Figure 2). Bobcat is bred to be a semi-determinant, bush type plant and not usually staked, but was used in
this field because of grower experience with this variety.
Red fruit yield and cull weights by planting date are presented in Table 1. Harvest weights were
similar for all mulch colors at the first harvest on July 28, but quickly segregated by the other
harvest dates. Yields peaked on August 15 and quickly dropped off (Figure 3). There were
significant differences in yield as affected by mulch color for harvests 2, 3, and 4, as well as total fruit yield. Red and grower black had significantly higher total fruit yields as compared to the
other colors. Lowest total yields were observed for both white on black mulches, white, and blue.
This field experienced heavy virus pressure (predominantly tomato spotted wilt and alfalfa
mosaic), and significant differences were found between the different colors on the number of
virus infected fruit. Highest virus cull weights were observed in the white, blue, and white on blue treatments (Figure 4). No differences were observed for culls not from viruses.
In the late planted trial (transplant date of June 20), colors had a large impact on plant stand loss
(Figure 5). Black, red, and green all had substantial plant stand loss as compared to the other mulch colors. Soil temperature readings were inconclusive, however, and did not really correlate
with plant stand loss. The late planted trial was not harvested because the field was almost 100%
infected with spotted wilt and alfalfa mosaic. The silver mulch had 3% of the plants with no symptoms of virus; all the other mulches were 100% infected (Figure 6).
In conclusion, best results in the early planted field were obtained with red and black mulch
colors. Lowest yields and highest virus infection occurred with white, blue, and white on black. This is well documented in the literature, as mulch colors heat the soil, improving early season
crop growth, and can also deter thrips and aphids that transmit viruses. Conversely, in late
planted fields, white and white on black mulches do better, as they help keep the soil cooler. In this trial, the black and red mulches caused substantial stand loss.
ACKNOWLEDGEMENTS Thanks to Jeff Marchini, cooperator, and Larry Burrow, County Ag Field Tech, for their help
with this trial.

Tomato Research Progress Report 2003 39
Figure 1. Colored plastic mulch test plot, early planting location.
Figure 2. Tranplanted tomatoes showing poles for support.

Tomato Research Progress Report 2003 40
Ampacet Mulch Trial 2003
tomato yield by date
0.0
100.0
200.0
300.0
400.0
500.0
600.0
700.0
800.0
Jul 28 Aug 1 Aug 7 Aug 15 Aug 22
harvest date
bo
xes/
A
gwr black
red
silver
green
white
blue
W/B
black
grw w/b
Figure 3. Red fruit yields by treatment and date. Significant differences were found
for the Aug 1, 7, and 15 harvest dates.
Ampacet Plastic Mulch 2003:
Total Tomato Yield & Culls
0.0
250.0
500.0
750.0
1000.0
1250.0
1500.0
1750.0
2000.0
gwr
black
red silver green white blue W/B black grw w/b
bo
xes/
A
RED FRUIT
culls
TSWV culls
Figure 4. Total fruit weight, culls, and virus culls by treatment.

Tomato Research Progress Report 2003 41
plant stand loss
80
85
90
95
100
105
110
Gwr Blac
kRed
silver
gree
n
white
blue w
/b
blac
k
Gwr w/b
mulch color
F
0.0
2.0
4.0
6.0
8.0
10.0
12.0
14.0
16.0
18.0
20.0
Dead
pla
nts
per 5
0 f
t
plant loss July 7
temp at 2"
Figure 5. Plant stand loss 2 weeks post-transplant in the late planted field.
Late planted mulch trial 2003
0
10
20
30
40
50
60
Gwr Blac
k
Figure 6. Number of virus infected plants out of 50 in the late planted mulch trial.
Skips were caused by early season transplant loss due to heat.

Tomato Research Progress Report 2003 42
Ampacet Plastic Mulch Trial on Fresh Market tomatoes
Merced County 2003
Table 1. Harvest weights, 25 lb boxes per acre, for the early planted mulch trial.
28-Jul 1-Aug 7-Aug 15-Aug 22-Aug
treatment red culls red culls red culls TSWV culls red culls TSWV culls red culls TSWV culls
1 gwr black 150.6 31.9 208.7 65.3 348.5 202.2 ---- 699.9 413.8 170.2 233.8 498.4 340.5
2 red 146.3 41.0 221.4 95.5 508.9 206.9 ---- 568.1 411.6 51.2 277.0 310.0 248.3
3 silver 90.8 42.1 147.0 70.4 206.2 310.7 15.2 463.6 440.7 160.4 335.0 355.7 263.5
4 green 160.8 60.3 143.4 49.4 217.1 188.8 50.8 524.2 397.1 129.6 242.8 317.6 242.8
5 white 82.0 50.8 84.2 76.6 152.1 306.0 66.1 172.8 408.0 524.9 163.4 238.1 571.0
6 blue 62.1 85.3 52.6 79.5 116.9 276.6 169.9 133.6 195.7 424.7 61.0 133.9 659.2
7 W/B 60.6 51.9 107.4 97.6 182.2 229.4 82.8 218.9 239.9 483.5 153.2 285.7 516.9
8 black 182.6 50.5 149.6 67.5 322.3 193.1 70.4 458.8 445.8 210.2 151.4 351.4 471.5
9 grw w/b 62.1 61.3 73.7 86.4 116.2 286.0 79.1 270.1 275.5 397.1 144.5 239.9 637.4
average 110.9 52.8 132.0 76.5 241.2 244.4 76.3 390.0 358.7 283.5 195.8 303.4 439.0
LSD 0.05 NS NS 104 NS 139 NS ---- 196 NS 264 162 157 258
CV, % 72 59 54 48 39 38 ---- 34 37 64 57 36 40
treatment RED FRUIT culls TSWV culls
1 gwr black 1641.5 1211.7 510.7
2 red 1721.7 1065.0 299.5
3 silver 1242.5 1219.7 424.0
4 green 1288.3 1013.1 372.4
5 white 654.5 1079.6 1095.9
6 blue 426.2 771.0 1083.9
7 W/B 722.4 904.6 1000.4
8 black 1264.7 1108.2 681.7
9 grw w/b 666.5 949.2 1034.6
average 1069.8 1035.8 722.6
LSD 0.05 400 NS 435
CV, % 26 22 41
TSWV culls are culled tomatoes caused by tomato spotted wilt virus (TSWV) and/or alfalfa mosaic. These were not segregated until the 3rd harvest.
LSD 0.05 = least significant difference at the 95% confidence level. Means separated by less than this amount are not significantly different.
NS = not significant.
CV = coefficient of variation, a measure of the variablilty in the experiment.
TOTAL boxes/A

Tomato Research Progress Report 2003 43
Worm Control Evaluation on Fresh Market Tomatoes Scott Stoddard
Assistant Farm Advisor Merced and Madera Counties
OBJECTIVE: Evaluate the performance of several insecticides on Lepidoptera pests in fresh
market tomatoes.
LOCATION: About 1/2 mile south of LeGrand Rd and 1/2 mile east of Athlone Rd in Merced
County. Bob Giampaoli and Jim Mueller, cooperators.
TREATMENTS:
1. UTC 2. Entrust (Spinosad, OMRI approved) 1.5 oz/A
3. Success (Spinosad) 4.5 fl oz/A
4. Intrepid (Methoxyfenozide) 4.0 fl oz/A
5. Intrepid 8 fl oz/A 6. Intrepid 12 fl oz/A
7. ProAxis (gamma-cyhalothrin) 3.8 fl oz/A
8. Warrior (lambda-cyhalothrin) 3.8 fl oz/A 9. Avaunt (Indoxocarb) 3.2 oz/A
10. Proclaim (Emamectin benzoate) 2.4 oz/A
11. Dipel 2X (Bacillus thuringiensis) 1 lb/A
NOTE: Intrepid has federal but does not have California label. No crop destruct required.
ProAxis (proposed name from GF-317) has no label and crop destruct is required.
PLOT DESIGN
• Randomized complete block with 4 replications
• Each plot was 2 beds wide (10 ft) by 35 ft long
• Trial was located at SW corner of 80 acre commercial field.
METHODS:
• Field variety Sunbrite transplanted Aug 3.
• Drip irrigation.
• Field had received one application of Avaunt prior to initiation of this test.
• Treatments applied 9/16/2003 and 9/26/2003 using a backpack CO2 sprayer at 30 psi with
6 L of water per treatment (~ 50 gpa). Latron B1956 was added to all treatments.
• Field surrounding plot area received second worm spray on 9/20/2003.
• Worm evaluations made 9/23, 10/3, and 10/10 by shaking 12 plants per plot. Fruit
damage rating performed on mature green fruit on 10/30/2003. 100 fruit per plot were
sampled.
RESULTS:
This field had been sprayed once for beet armyworm prior to the initiation of this experiment. Typically, late season fields such as this face high worm pest pressure, and 3 to 4 insecticide
applications are common. This field was scheduled for a second insecticide spray at the onset of
the trial on September 16. At that time, we recorded and average of three (3) egg clusters (beet

Tomato Research Progress Report 2003 44
armyworm) per 10 plants, which the PCA indicated was high enough for treatment. Specific
thresholds have not been developed for fresh market tomatoes, but the tolerance for beet armyworms is much lower than in processing tomatoes.
At the first evaluation on September 23, it was obvious there had been considerable egg laying
activity after the first treatment spray. Therefore, we sprayed the plots again on September 26. The remainder of the field was sprayed a second time on about September 20, which better
coincided with peak egg hatch. The field did not receive a third spray.
We determined efficacy of the treatments by hand shaking 12 plants per plot onto a cafeteria tray
one week post application. Live larvae and beneficial insects were totaled for each plot. The
predominant larvae were beet armyworm (Spodoptera exigua), though we also observed some tomato fruitworm (Helicoverpa [heliothis] zea), cabbage loopers, and hornworms. Beneficial
insects were predominantly the minute pirate bug, Orius spp. Near harvest, 100 mature fruit were
picked and scored for worm damage.
Statistical analysis was done using CoStat (Cohort Software). Normal ANOVA procedures were
followed, and mean separation procedures were performed using Tukey’s HSD. Due to the large
variability in the results, the data were transformed before analysis using both the square root and the arcsin transformation.
All treatments significantly reduced worm counts as compared to the untreated check after the first application (Table 1). Control ranged from 31% for Dipel to 71% for Success. After the
second application, however, there was no significant difference between the check plots and the
ProAxis and Warrior treatments (October 3 evaluation). All the other treatments significantly
reduced worm counts. By October 10, the Success, Intrepid, and Proclaim treatments all provided nearly 100% control (Figures 1, 2, and 3). No significant difference was seen between
any of the treatments on the number of beneficial insects observed in the plots (Table 1).
The amount of fruit damage was fairly low, ranging from about 2.5% for Entrust to 14% for the
untreated check plot (Figure 4). Fruit damage consisted of a combination of both surface scarring
and holes into the fruit, symptoms associated with both armyworm and fruitworms. ProAxis and
Warrior were not significantly different than the check plot; all other treatments significantly reduced fruit damage (Table 1).
One of the objectives of this trial was to determine if there was a rate response with Intrepid. In this trial with low worm pressure, there was no significant difference in worm control or fruit
damage by increasing the rate. The lack of a rate response may have been because there was only
light insect pressure in this field, and the low rate was more than adequate for control.
In conclusion, all treatments except for ProAxis and Warrior performed well in this trial,
significantly reducing both the number of live larvae per plot and the amount of damaged fruit at
harvest. No significant differences were seen between Entrust and Success, or the different rates of Intrepid. ProAxis and Warrior, which are pyrethroid class insecticides and very similar to each
other, did not provide adequate control of beet armyworm, and had similar fruit damage ratings as
the untreated control.
ACKNOWLEDGEMENTS
Thanks to Bob Giampaoli with Live Oak Farms and Dr. Jim Mueller with Dow AgroScience for
their help and cooperation with this test.

Tomato Research Progress Report 2003 45
Typical fruit damage found to tomato fruitworm (top) and beet armyworm (bottom).

Tomato Research Progress Report 2003 46
Table 1. Live Lepidoptera larvae counts after treatment application and damaged fruit.
Tomato worm control evaluation, Merced County 2003.
transformed data/plot (sqrt) 10/30/03
9/23/03 10/3/03 10/10/03 fruit damage fruit damage
Treatment Lep # % control Ben # Lep # % control Ben # Lep # % control Ben # arcsin (%) % of UTC
1 UTC 14.57 0.0 8.51 10.55 0.0 2.33 8.79 0.0 3.14 13.61 99.98
2 Entrust 1.5 oz/A 5.77 60.4 5.33 2.71 74.3 1.82 1.45 83.5 4.01 2.49 18.32
3 Success 4.5 fl oz/A 4.17 71.4 6.61 1.29 87.8 1.66 0.71 92.0 2.94 5.96 43.80
4 Intrepid 4.0 fl oz/A 6.77 53.5 5.53 2.56 75.7 1.82 1.29 85.4 3.66 4.67 34.28
5 Intrepid 8.0 fl oz/A 8.22 43.6 6.31 2.82 73.2 1.45 0.71 92.0 4.39 6.35 46.67
6 Intrepid 12.0 fl oz/A 7.62 47.7 5.64 2.49 76.4 1.87 0.71 92.0 2.45 6.81 50.06
7 Pro Axis 3.8 fl oz/A 8.95 38.5 5.63 7.71 26.9 2.54 6.65 24.3 3.28 12.97 95.32
8 Warrior 3.8 fl oz 6.56 55.0 4.73 6.84 35.1 2.40 8.41 4.3 2.61 12.32 90.56
9 Avaunt 3.2 oz 5.63 61.3 5.66 3.88 63.3 2.45 1.45 83.5 3.56 4.07 29.87
10 Proclaim 2.4 oz 7.05 51.6 5.01 1.71 83.8 2.40 0.71 92.0 2.54 6.34 46.56
11 Dipel 1 lb 10.04 31.1 5.22 3.59 65.9 3.21 2.77 68.5 3.40 7.40 54.34
Average 7.76 51.41 5.84 4.19 66.25 2.18 3.06 71.74 3.27 7.54 55.43
LSD 0.05 4.9 33.4 NS 3.9 36.7 NS 3 34.4 NS 6.2 45.2
MSD 0.05 8.3 56.8 ---- 6.6 62.4 ---- 5.2 58.7 ---- 10.5 ----
CV, % 44 49 25 64 42 68 69 36 36 57 57
Lep = live lepidoptera larvae per plot based on shake samples (square root transformation).
% control = percent control of larvae for treatment as compared to untreated plot.
Ben = live beneficial insects based on shake samples (predominantly minute pirate bug).
Fruit damage = mature fruit damaged from larvae, % (arcsin transformation) and as a percent of the untreated control (UTC).
LSD 0.05 = Least Significant Difference at the 95% confidence level. Means separated by less than this amount are not significantly different.
Data were transformed to assure homogeniety of variances.
MSD 0.05 = minimum significant difference used in the Tukey's means comparison test, more conservative than LSD.
CV = coefficient of variation, a measure of the variability in the experiment.
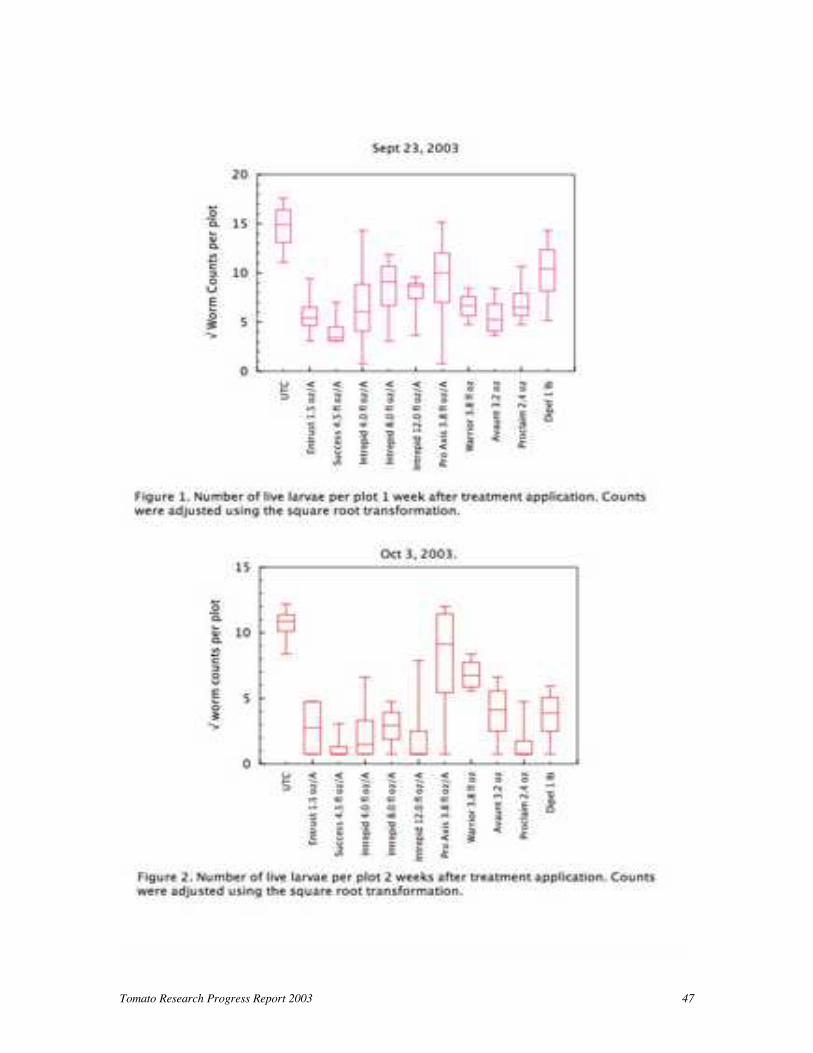
Tomato Research Progress Report 2003 47
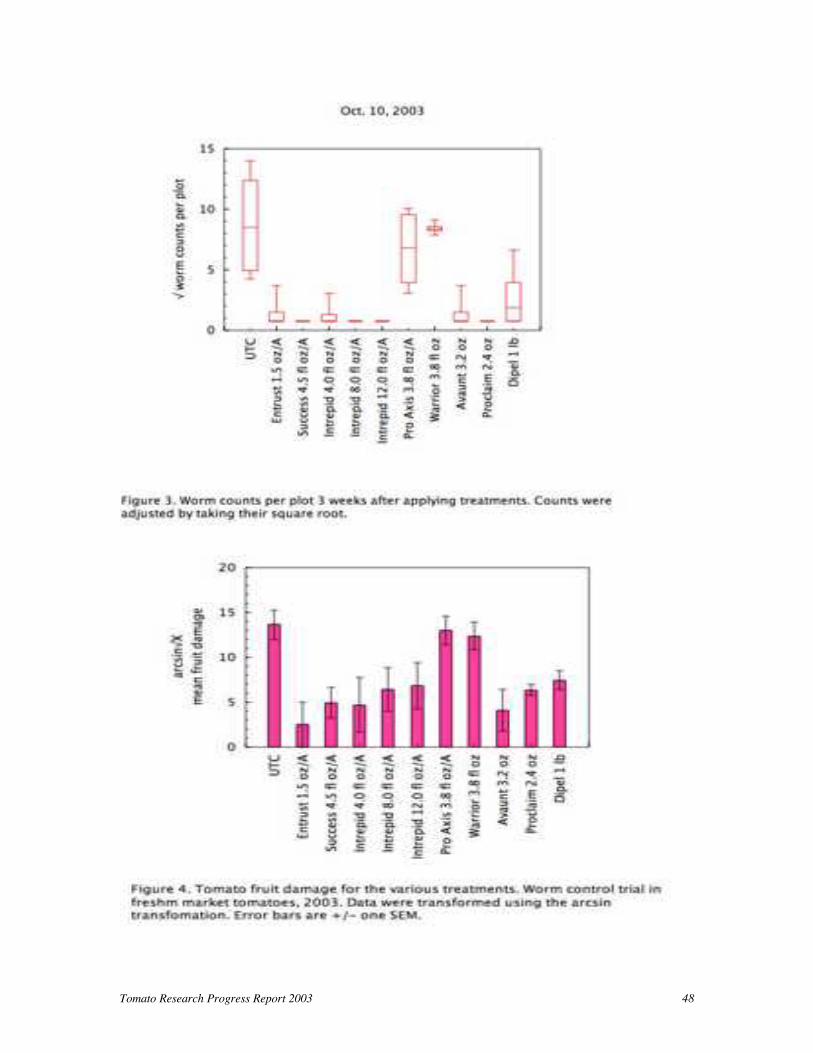
Tomato Research Progress Report 2003 48