fmp seta - sector skills plan - fp&m seta · fp&m seta sector skills plan for 2015-2020 3...
TRANSCRIPT

Sector Skills: Update 2015 - 2020
FOREW0RD .............................................................................................................................................................. 4
LIST OF ACRONYMS............................................................................................................................................... 5
CHAPTER 1: SECTOR PROFILE ....................................................................................................................... 7
1.1 INTRODUCTION .........................................................................................................................................................7
1.2 SCOPE OF COVERAGE................................................................................................................................................7
1.3 KEY ROLE PLAYERS ..................................................................................................................................................9
1.4 ECONOMIC PERFORMANCE .................................................................................................................................. 14
1.5 EMPLOYER PROFILE .............................................................................................................................................. 16
1.6 LABOUR MARKET PROFILE ................................................................................................................................... 17
1.7 CONCLUSION .......................................................................................................................................................... 24
CHAPTER 2: KEY SKILLS ISSUES.................................................................................................................. 26
2.1. INTRODUCTION ..................................................................................................................................... 26
2.2. CHANGE DRIVERS .................................................................................................................................. 26
2.3. ALIGNMENT WITH NATIONAL STRATEGIES AND PLANS .................................................................................. 30
2.4. ALIGNMENT WITH SECTORAL INDUSTRIAL STRATEGIES ................................................................................ 33
2.5. CONCLUSION .......................................................................................................................................................... 34
CHAPTER 3: EXTENT OF SKILLS MISMATCH .......................................................................................... 35
3.1. EXTENT AND NATURE OF SKILLS DEMAND ...................................................................................................... 35
3.2. EXTENT AND NATURE OF SUPPLY ...................................................................................................................... 37
3.3. SUPPLY IN THE FP&M SECTOR ........................................................................................................................... 39
3.4. IDENTIFICATION OF SCARCE AND CRITICAL SKILLS ......................................................................................... 48
3.5. CONCLUSION .......................................................................................................................................................... 50
CHAPTER 4: SECTOR PARTNERSHIPS ....................................................................................................... 52
4.1 INTRODUCTION ...................................................................................................................................................... 52
4.2 EXISTING FP&M PARTNERSHIPS ....................................................................................................................... 52
4.3 NEW PARTNERSHIPS ............................................................................................................................................ 56
4.4 CHALLENGES ENCOUNTERED WITH PARTNERSHIPS ...................................................................................... 57
4.5 BEST PRACTICE FOR EFFECTIVE PARTNERSHIPS ............................................................................................ 58
4.6 CONCLUSION .......................................................................................................................................................... 58
CHAPTER 5: SKILLS PRIORITY ACTIONS.................................................................................................. 59
5.1. INTRODUCTION ...................................................................................................................................................... 59
5.2. KEY FINDINGS FROM PREVIOUS CHAPTERS ....................................................................................................... 59
5.3. KEY PRIORITY A ACTIONS ..................................................................................................................................... 61
REFERENCES .......................................................................................................................................................... 68

FP&M SETA Sector Skills Plan for 2015-2020
3
Table of Tables
Table 1: Key Role Players in the FP&M sector: Government Departments ........................................................10 Table 2: Key Role players in the FP&M sector: Per Sub Sector ...........................................................................11 Table 3: Employers in the FP&M Sector..............................................................................................................17 Table 4: National Distribution of FP&M Employers ............................................................................................17 Table 5: Total employment in the FP&M sector as a percentage of total employment in manufacturing and the economy ............................................................................................................................................................................18 Table 6: Employee age per sub-sector ................................................................................................................22 Table 7: Employee race and gender per sub-sector ...........................................................................................23 Table 8: Employee disability per sub-sector .......................................................................................................24 Table 9: Implications of change drivers on skills development in the FP&M sector ..........................................29 Table 10: FP&M SETA learner enrollment per course – 2011/12 to 2013/14 ....................................................40 Table 11: Employment increase by sector (based on those who completed a learnership) ..............................45 Table 12: Top 10 scarce skills in the FP&M sector ..............................................................................................48 Table 13: Top 10 critical skills in the FP&M sector .............................................................................................49
Table of Figures
Figure 1: 13 FP&M sub-sectors ............................................................................................................................. 7 Figure 2: FP&M Sector Value Chain ...................................................................................................................... 8 Figure 3: Year on year economic growth ............................................................................................................14 Figure 4: FPM sector output relative to the economy ........................................................................................15 Figure 5: Sub-sector contribution to total output (Rm 2010 prices) ..................................................................15 Figure 6: Exports by sub-sector (Rm 2010 prices) ...............................................................................................16 Figure 7: Imports by sub-sector ..........................................................................................................................16 Figure 8: Change in employment over the past decade in FP&M, manufacturing as a whole and the economy19 Figure 9: Percentage change in employment: 2004-2014 ..................................................................................19 Figure 10: Employee Profile per Sub-sector ........................................................................................................20 Figure 11: Sector occupational profile ................................................................................................................21 Figure 12: Beneficiating goat fibre along the value chain ...................................................................................27 Figure 13: HIV prevalence by province, Source HSRC HIV Report (2012) ...........................................................29 Figure 14: Industrial Strategies ...........................................................................................................................33 Figure 15: Remuneration per employee rand in the FP&M sector .....................................................................36 Figure 16: An inverted education and training pyramid .....................................................................................38 Figure 17: Learnership profile .............................................................................................................................42 Figure 18: Apprenticeship profile........................................................................................................................43 Figure 19: Summary relevance of training to FP&M subsectors ........................................................................45

4
FOREW0RD
The FP&M SETA has been through a lengthy period of change and transition. After amalgamation of three SETAs, there were operational challenges that had to be addressed, whilst at the same time maintaining a focus on implementation of strategy. It was a hard balance to strike but with the support of a very pro-active and engaged Board, an innovative and strategic CEO and a hard working management team the work has been done. One of the concerns with the previous versions of the SSP was that it seemed like a “piecing together” of three separate plans of the three ex-SETAs. The management and board were concerned to rectify this and to produce a plan for the sector as a whole. The discussions related to the FP&M “value chain” have been particularly helpful in this respect. There is a sense that all of the 13 sub-sectors are now working together to achieve economic growth and development, and there are opportunities within the value chain to address further growth and sustainability of the FP&M sector. Another concern was that industry provides the SETA with an enormous amount of valuable information, but the SPP was not reflecting that. It was important to analyse the data and make meaning of it and to interpret the results of research in a manner that informs strategy. Whilst there will always be improvements that can be made, we have now found a way of analysing the sector and presenting the results in a manner that enables strategic discussions, not just within the SETA board, but more broadly in the sector. In August 2015 the senior management and board will engage over a period of two days on the sector strategy contained in this SSP, on the strategic five year plan to implement the strategy, on some of the strengths, weaknesses and risks involved in taking them forward and on the challenges of allocating both financial and human resources to achieve effective service delivery. There is strong buy in at board and management level for the plans that are now in place. It is important to emphasise that this is a “sector” plan not just a SETA plan. The challenge now will be for the SETA to engage with each of the sub-sector stakeholders and to develop partnerships, joint projects and delivery mechanisms and processes to implement the plan. There is a strongly held view in the sector that development and expansion can be achieved, and that jobs can be safeguarded and even expanded. This will require that the sector has the human capacity to achieve growth and improve competitiveness. Skills development has an important role to play in that. The SSP aims to identify employment and growth trends, the skills requirements of the relevant sectors and to prioritise these in terms of skills development. The process takes account of the environment, the nature of the sector and the demand and supply of skills. We trust that the capacity we have built in our sector will drive the plans toward achieving the results envisaged. Signed ____________________________________ Felleng Yende Chief Executive Office ____________________________________ Sipho Ngidi Chairman

FP&M SETA Sector Skills Plan for 2015-2020
5
LIST OF ACRONYMS
ATR Annual Training Report
BBBEE Broad Based Black Economic Empowerment
CSIR Centre for Scientific and Industrial Research
CSP Customised Sector Programmes
DTI Department of Trade and Industry
DHET Department of Higher Education and Training
DPE Department of Public Enterprises
ESSP Environmental Sector Skills Plan
FF Fast Fashion
FP&M SETA Fibre, Processing and Manufacturing Sector Skills Training Authority
FSA Forestry South Africa
GDP Gross Domestic Product
HIV Human Immunodeficiency Virus
HOMTEX South African Home textiles Manufacturers Employers Organisation
HRD-SA Human Resource Development for South Africa
HSRC Human Resources Development Council
ILO International Labour Organisation
ILDP International Leadership Development Programme
IPAP Industrial Policy Action Plan
KZN KwaZulu-Natal
NAWTM National Association of Worsted Textile Manufacturers
NDP National Development Plan
NFMA Narrow Fabric Manufacturers Association
NGP New Growth Path
NSDS 3 National Skills Development Strategy 3
NTMA National Textile Manufacturers Association
PAMSA Paper Manufacturers of South Africa
PIFSA Printing Industries Federation of South Africa
PSET Post-School Education & Training
QCTO Quality Council for Trades and Occupations
QR Quick Response

6
RPL Recognition of Prior Learning
SABMEO South African Blankets Manufacturers Employers Organisation
SACMEA South Africa Carpet Manufacturing Employers Association
SACTPEA South African Cotton textiles Processing Employers’ Associations
SARS South African Revenue Services
SETA Sector Skills and Training Authority
SIC Sector Industrial Classification
SIPS Strategic infrastructure Projects
SMME Small Medium and Micro Enterprises
SSP Sector Skills Plan
SAWAMPEO South African Wool and Mohair Processors Employers Organisation
TVET Technical Vocational Education and Training
UOT University of Technology
WC Western Cape
WIL Work Integrated Learning
WITS REAL University of the Witwatersrand, Centre for Researching Education and Labour
WSP Workplace Skills Plan
FP&M SETA Sector Skills Plan for 2015-2020
7
CHAPTER 1: SECTOR PROFILE
1.1 Introduction
This chapter presents a profile of the Fibre Processing and Manufacturing (FP&M) sector. A value chain approach is adopted in the discussion of the FP&M sector. This approach shows how the various sub-sectors within the sector are linked, and also explores how sectors and entities external to FP&M, for example suppliers of specialised inputs and services as well as providers of specialised infrastructure, governmental and other institutions contribute to the development and sustainability of the FP&M sector. Globally economic theory and labour market analysis is moving towards the understanding of value chains, which is a powerful concept in understanding beneficiation and what is required to expand domestic production and reduce reliance on imported machinery.
1.2 Scope of coverage
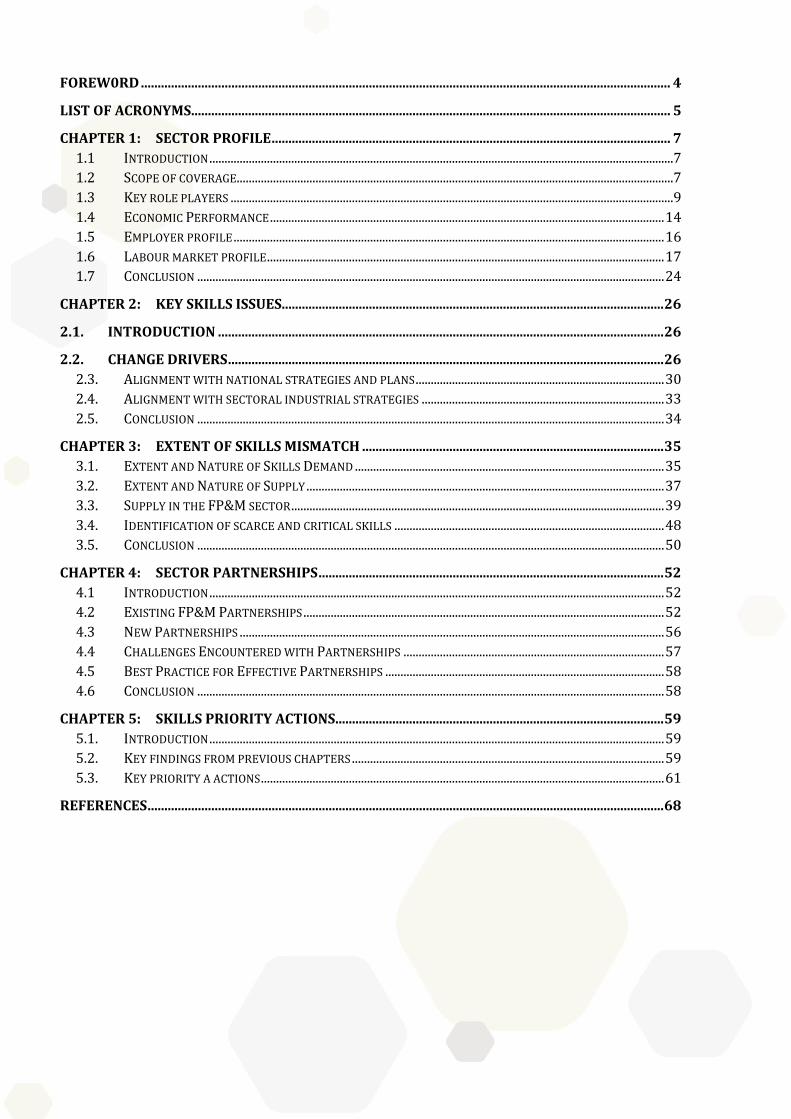
There are 13 sub-sectors that make up the FP&M sector: Clothing; Dry Cleaning; Footwear; Forestry; Furniture; General Goods; Leather; Packaging; Print Media; Printing; Publishing; Pulp & Paper; Textiles and Wood Products. Secondary and tertiary industry activities form the bulk of the sector and are focused on turning raw materials into finished products and making these available for sale. The exception is the forestry sub-sector, which is in the primary sector and dry cleaning, which is a service sector. Figure 1 represents the 13 sub-sectors, based on the standard industrial classification (SIC) framework, that fall under the scope of the Fibre, Processing and Manufacturing (FP&M) Sector Education and Training Authority (SETA). The FP&M SETA is responsible for skills development in the sector and reports directly to the Department of Higher Education and Training (DHET).
Figure 1: 13 FP&M sub-sectors
Source: FP&M Tracer Study, 2014
The FP&M sector has value chain linkages with other sectors based on the exchange and feeder relationships between primary and secondary production during manufacturing, and with the tertiary sector in the marketing and sale of produced goods. The value chain linkages are highlighted in Figure 2

8
Figure 2: FP&M Sector Value Chain
SOURCE: FP&M SETA STAKEHOLDER DISCUSSIONS
Some of the linkages highlighted in Figure 2 are explained below:
1. The forestry sub-sector is the upstream feeder into the Milling and Wood Products industries, an upstream feeder into the Pulp, Wood Chips, Timber, Paper and Lumber (an upstream to the Construction sector). These have upstream linkages to the wholesale and retailing of Wooden Products, Furniture, Footwear, as well as Print Media, Publishing and Printing, in the tertiary sector.
2. The plastic sub-sector (which is not part of the FP&M industries) is the upstream feeder to synthetic fibres. Synthetic and Natural fibres (agriculture is an upstream feeder into Natural Fibres) are an upstream feeder into Textiles, which is an upstream feeder into Printing, Furniture, Clothing, and Footwear.
3. Agriculture (which is not part of the FP&M industries) is an upstream feeder of natural fibres hides and skins into the leather sub-sector. The leather sub-sector is an upstream feeder into Furniture, Clothing, and Footwear, which are an upstream feeder into Dry Cleaning.
4. General Goods are feeders into the automotive sub-sector. 5. The Design and Packaging streams feed into the complete value chain from the primary to the tertiary
phase, as a side stream flow, together with the beneficiation of waste.
FP&M Seta
Value Chain
FO
RE
ST
RY
(R
ou
nd
wo
od
/ B
ark
)
Pulp / Paper Mills Pulp
Ra
Rayon Pulp Printing
Publishing
Furniture
Cellulose / Tissue Packaging / Hygiene / Recycle
Natural Fibres
Hide and Skins
Textiles
Leather
Design
Footwear
Clothing
General goods
Sawmills
Packaging
Synthetic Fibres
Wooden Products
Lin
k t
o
Ag
ricu
ltu
re
Pla
stic
ind
ust
ry
Primary Secondary Tertiary
Dry
Cle
an
ing
NOTES: Items in red either feed into or from the FP&M SETA, they do not form part of the FP&M SETA value chain
Board Mills
Pole Plants
Mng Timber Mills
Waste Paper
Charcoal/Matches
Particle Board
Treated Poles
Tannin Plants
Paper
Lumber
Mining Timber
Charcoal/Matches
Tannin
Co
nst
ructi
on
Beneficiation of Waste Streams
Su
ga
r C
an
e
Pri
nt
Me
dia
ITC
Se
cto
r S
erv
ice
s S
ect
or
Au
tom
oti
ve
Re
tail
Se
cto
r

FP&M SETA Sector Skills Plan for 2015-2020
9
The value chain linkages as outlined in Figure 2 extend to other sectors of the economy. The FP&M sector provides inputs into other sectors of the economy whilst relying on certain sectors for inputs:
Most of what gets produced within the FP&M sector ends up in the wholesale and retail sector.
Manufacturing, Engineering and Related Services Sector plays a support role in the supply of machinery and equipment used in the production process and the servicing and repair thereof.
There are some inputs from the chemicals sector that are utilised in the production process.
Some of the goods produced in the FP&M sector e.g. wood products, are used in the construction sector.
Products such as packaging, produced in the FP&M sector, are utilised extensively in the food and beverages sector.
Transport sector plays a pivotal role in moving the goods produced in the FP&M sector to where they are required.
Other sectors of the economy that provide services also have links with the FP&M sector, including banking and financial services, insurance, media and information technology.
A value chain approach to profiling and analysing the sector exposes holistic and integrated opportunities for sector development. For example it is evident where the major challenges are in relation to the processing of primary products into secondary products and the need for interventions to beneficiate and produce domestically what is currently being exported. Equally it is clear that there are opportunities to produce in more environmentally sustainable ways and to make use of waste produced at different points in the value chain – for example the huge amount of paper produced and discarded is a clear opportunity for recycling. There are also points in the value chain that overlap with other sectors, where collaboration could result in the expansion of jobs and a greater level of labour absorption than is currently taking place. Opportunities for reskilling across the sub-sectors can also be identified, e.g. machine operators working in one sub-sector could move horizontally to another sub-sector within the sector or identify career path opportunities across related sub-sectors.
1.3 Key role players
This section provides a glimpse into to some of the key role players within the FP&M SETA. The key role players within the FP&M sector include industry bodies, employer associations, government departments and institutions that provide policy direction or play a regulatory role, trade unions, and suppliers (Table 1and Table 2). Many of the suppliers are located outside of the FP&M sector. Industry bodies and employer organisations are represented within the FP&M SETA, as per the SETA’s constitution.

10
Table 1: Key Role Players in the FP&M sector: Government Departments
Government Department Definition
Department of Agriculture,
Fisheries and Forestry
There is a strong linkage between agriculture and forestry and the
FP&M sector. A lot of what gets manufactured in the FP&M sector
would have been produced in the agricultural sector. The DAFF provides
policy direction in Agriculture, Forestry and is an interested party in the
development of the FP&M sector. Extension services are the
responsibility of DAFF.
Department of Trade and
Industry
The FP&M sector contributes significantly to South Africa’s
manufacturing capacity. It plays an important role in the beneficiation
of various fibre related raw materials. The Department as the custodian
of the industrial policy action plan is responsible for the strategy and for
creating an enabling environment for sector expansion
Department of Rural
Development
The Department is tasked with ensuring the development of rural
communities in South Africa. The FP&M sector, particularly its primary
produce sub-sectors has a strong presence in rural areas and is
therefore integral to the national strategy for building sustainable rural
economies
Department of Small
Business Development
The FP&M sector is largely made up of small businesses. The
Department (alongside the DTI and DAFF) plays an important role in the
development of small businesses within the sector. It is important that
the SETA skills development interventions in relation to small
businesses are aligned to the wider support framework provided by the
responsible national departments.
Department of
Environmental Affairs
The Department as an interest in the preservation of the environment
and ensuring that environmentally sustainable methods of
manufacturing are applied across the economy.
Department of Water
Affairs and Sanitation
The FP&M sector relies increasingly on water for manufacturing
processes. The Department is the custodian of the country’s water
resources and provides policy direction in the preservation and use of
fresh water resources.
Department of Science and
Technology
Provides policy direction and spearheads research and development
(R&D) as well as innovation in the South African economy. The
Department has agencies such as the Council for Scientific and Industrial
Research (CSIR) and the National Research Foundation (NRF) whose
purpose is to advance research in areas including those covered by the
FP&M sector. The Department has a keen interest in commercialising
R&D and bridging the chasm between national system of innovation and
industry in South Africa. It is important that the SETA maintains a focus
on new developments and the skills required to support them.
Department of Higher
Education and Training
The Department is the custodian of the post school education and
training system of the country and an important policy driver in the
provision of skills and advancing research and development through
universities.

FP&M SETA Sector Skills Plan for 2015-2020
11
Table 2: Key Role players in the FP&M sector: Per Sub Sector
Key Role Players in the FP&M Sector : Per Sub Sector
Sub-
Sector
Organisation Description
Clothing Apparel
Manufacturers
Association of South
Africa (AMSA)
Apparel Manufacturers of South Africa (AMSA), is a body
representing five out of every six garment manufacturers in the
country, and has sought intervention of Durban’s labour court for
compelling the National Bargaining Council for the Clothing
Manufacturing Industry (NBC) to close about 400 companies that
are not willing to comply with the minimum wage norms.
SACTWU Southern Africa Clothing and Textile Workers Union (SACTWU) is
the biggest union in the clothing, textile and leather industry, with
more than 100 000 members. It negotiates wages and conditions
for the vast majority of workers in the clothing, textile and leather
industry and views skills development for its members as an
important objective.
Footwear South African
Footwear and
Leather Industries
Association (SAFLIA)
SAFLIA is formally registered with the Department of Labour as a
national employer organisation in terms of the Labour Relations
Act. Its constitution makes provision for three separate sections,
viz. Footwear Manufacturing Section, Supplier Section and the
Tanning Section.
National Footwear
and Leather Cluster -
VUT
The National Footwear and Leather Cluster is a not-for-profit
company established by the Department of Trade and Industry
within the administration of Vaal University of Technology. It
seeks to promote and support the expansion of manufacturing in
the sector.
Forestry Forestry South Africa
(FSA)
FSA is the largest forestry organisation representing growers of
timber in South Africa. Membership includes all 11 corporate
forestry companies active in the Industry, approximately 1 300
commercial timber farmers and some 20 000 emergent small
scale growers etc.
South African
Forestry Contractors
Association (SAFCA)
SAFCA offers assistance to all contractors regarding public liability
and other insurance, forestry technical assistance (harvesting,
silviculture and transport), business related assistance and
training (capacity development).
Furniture Federation of
Furniture
Manufacturers’
Association (FBUMA)
FBUMA serves as the collective entity of employers (businesses)
in this Industry and is registered (in terms of the Labour Relations
Act) as an Employers Organisation.
FBUMA represents its members in collective bargaining with
Unions at Industry level.

12
Key Role Players in the FP&M Sector : Per Sub Sector
Western Cape
Furniture Initiative
(WCFI)
The Western Cape Furniture Initiative was formally established in
2009 and to play a role in the furniture sector by building and
marketing a South Africa Furniture Brand locally and
internationally.
Leather Southern African
Footwear and
Leather Industries
Association (SAFLIA)
See section on footwear
Packaging The Institute of
Packaging South
Africa (IPSA)
The Institute of Packaging South Africa (IPSA) was established in
February 1970. One of its key objectives is to advance the
standards and methods of education in the field of packaging and
related subjects.
The Packaging
Council of South
Africa (PACSA)
The Packaging Council of South Africa (PACSA) founded in 1984 -
is a voluntary industry body which aims to provide effective
leadership and representation on major external and internal
issues in the packaging sector.
Printing Printing South Africa
(PSA)
PSA represents the interests of printing, paper/flexible packaging
and newspaper industries to be globally competitive and socially
responsible. Its mission is to promote the sector’s interests with
government, sectoral bodies and any other relevant entity, in
policy matters that affect the operations of its member
organisations.
Printing Employers
Association of South
Africa (PEASA)
An employer association looking after the interests of employers
in the printing industry.
South African
Typographical Union
(SATU)
The South African Typographical Union has traditionally
organised workers in the Printing Newspaper and Packaging
Industry but has extended its scope to include workers in
Stationary Outlets, Book Shops, Publishing Houses, Advertising
Agencies, Screen and Sign Display Sectors, Photocopy Shops,
Printing Suppliers.
Media
Print and Digital
Media South Africa
(PDMSA)
PDMSA is dedicated to promoting a free and independent press
through close interaction with members and by working together
across print and digital media.
It promotes and supports compliance with internationally
recognised good governance practices and effective stakeholder
management.

FP&M SETA Sector Skills Plan for 2015-2020
13
Key Role Players in the FP&M Sector : Per Sub Sector
The Media
Development and
Diversity Agency
(MDDA)
The Media Development and Diversity Agency (MDDA) was
established in 2002 to enable historically disadvantaged
communities and persons not adequately served by the media to
gain access to the media. Its beneficiaries are community media
and small commercial media.
Print Media SA Print and Digital Media South Africa is an umbrella body
incorporating print and digital media. The PDMSA evolved from
the long-established Print Media South Africa and is an
interactive organisation seeking to help its members keep in pace
with the fast-changing media world of the 21st Century.
Publishing Publishers
Association of South
Africa (PASA)
PASA is the largest publishing industry body in South Africa, and
is committed to creativity, literacy, the free flow of ideas and
encouraging a culture of reading.
Library and
Information
Association of South
Africa (LIASA)
LIASA is a professional non-profit organisation, uniting and
representing all institutions and people working in libraries and
information services in South Africa.
Pulp and
Paper
Paper Manufacturers
Association of South
Africa
PAMSA promotes the interests and efforts of the South African
pulp and paper industry and provides a forum for the
development and presentation of common views on pre-
competitive industry issues, and engages stakeholders on
matters of legislation, skills upliftment, education, research,
environment, sustainability, and recycling.
Textiles South African Cotton
textiles Processing
Employers’
Associations
(SACTPEA)
SACTPEA represents the interests of employers in Cotton textiles
Processing.
South African Home
textiles
Manufacturers
Employers
Organisation
(HOMTEX)
NAWTM represents the interests of Worsted Textile
Manufacturers.
National Textile
Manufacturers
Association (NTMA)
NTMA represents the interests of textile manufacturers.
Chemical, Energy,
Paper, Printing,
The union has members in industries ranging from Oil refineries,
Explosives, Chemical, Pulp, Paper, Printing, Furniture, Saw Milling

14
Key Role Players in the FP&M Sector : Per Sub Sector
Wood
Products
Wood and Allied
Workers Union
(CEPPWAWU)
etc. and is a majority union in all these industries. The union has
a membership of over 68,000 workers across these industries.
Sawmilling South
Africa
To promote the interest of sawmillers in South Africa including
education and training in the industry.
1.4 Economic Performance
5.1.1. Contribution to the economy
In Figure 3 the effects of the global economic crisis are evident in 2008/9 when economic growth rates within the FP&M sector, manufacturing broadly and throughout the economy began to plummet. A period of recovery occurred between 2009/10. However, since 2010 average growth has tended to stagnate across the economy. This is true even for FP&M despite cyclical upswings in growth in 2012 and more recently.
Figure 3: Year on year economic growth
Source: Quantec data, 2015
In 2014, output in the FP&M sector comprised 13, 1% of total manufacturing output (Figure 4). The FP&M sector’s contribution to total output in the economy has remained relatively stable over the past decade, ranging from a high of 4% in 2008 to 3, 3% in 2014.
2005 2006 2007 2008 2009 2010 2011 2012 2013 2014
FPM Sector 2.4% 4.4% 3.1% 10.2% -8.5% 1.7% -1.3% 0.4% -0.7% 0.7%
Manufacturing 3.9% 4.3% 3.6% 4.1% -7.7% 2.1% 0.4% 1.0% 1.1% 0.1%
Total Economy 5.1% 6.0% 4.8% 3.7% -2.2% 2.4% 2.3% 2.8% 2.3% 1.7%
-10.0%
-5.0%
0.0%
5.0%
10.0%
15.0%
FPM Sector Manufacturing Total Economy

FP&M SETA Sector Skills Plan for 2015-2020
15
Figure 4: FPM sector output relative to the economy
Source: Quantec data, 2015
Figure 5 illustrates each sub-sector’s contribution to economic output in real terms. The highest contributor is the paper and paper products sub sector, whose total contribution was R60 billion rand in 2014. Production in leather, leather products and footwear sub-sectors has stagnated over the past decade and are the smallest contributors to total output in the sector, just over R5 billion Rand each in 2014.
Figure 5: Sub-sector contribution to total output (Rm 2010 prices)
Source: Quantec data, 2015
Between 2008 and 2010, the global economic slowdown contributed to a sharp decline in exports across all sub-sectors. There has been some recovery in Wood and wood products, Leather and leather products and Textiles exports in recent years. The only sub-sector that had an “up-turn” in exports since 2012 is Paper and Paper Products (see Figure 6). This is also by far the largest contributor to exports in the sector, valued at R15 billion Rand in 2014. Since 2000, except for leather and leather products and to a lesser extent printing, publishing and recorded media, there has been a contraction in exports across the FP&M sector. This is likely to affect revenue within the sector, as well as the sector’s ability to retain and expand employment.
2004 2005 2006 2007 2008 2009 2010 2011 2012 2013 2014
Manufacturing 13.3% 13.1% 13.1% 13.0% 13.8% 13.7% 13.6% 13.4% 13.3% 13.1% 13.1%
Total Economy 3.9% 3.8% 3.8% 3.7% 4.0% 3.7% 3.7% 3.6% 3.5% 3.4% 3.3%
0.0%
2.0%
4.0%
6.0%
8.0%
10.0%
12.0%
14.0%
16.0%
Manufacturing Total Economy
-
10 000
20 000
30 000
40 000
50 000
60 000
70 000
80 000
2004 2005 2006 2007 2008 2009 2010 2011 2012 2013 2014
Textiles
Furniture
Printing, publishingand recorded mediaPaper and paperproductsWood and woodproductLeather and leatherproductsFootwear
Clothing

16
Figure 6: Exports by sub-sector (Rm 2010 prices)
Source: Quantec data 2015
While exports have declined, imports on the other hand, have increased dramatically in all sub-sectors since 2000 (Figure 7), with the exception of the Printing, Publishing and Recorded Media sub-sectors. The Clothing, Textiles, Footwear, Paper and Paper Products and Furniture sub-sectors have had the biggest increases in imports. Except for clothing, the overall trend in the FP&M sector has been a stabilisation of imports over the past two to three years. The total value of imports for the Clothing sub-sector has doubled from about R6 billion Rand in 2004 to almost R13 billion Rand in 2014. Wood and Wood products, and Leather and Leather Products have remained the smallest importers of products in the sector (Figure 7).
Figure 7: Imports by sub-sector
SOURCE: QUANTEC DATA, 2015
1.5 Employer profile
According to South African Revenue Service (SARS) database of employers in the FP&M sector, there are currently 22 661 employers in the sector. The majority employers are classified as small, employing less than 50 employees. About 50% of employers in the sector are classified as “unallocated.” The bulk of these are small businesses that have either not selected an industry code (probably because they do not pay the
-
2 000
4 000
6 000
8 000
10 000
12 000
14 000
16 000
2004 2005 2006 2007 2008 2009 2010 2011 2012 2013 2014
Imports per Sub-sectorRm 2005-prices
Textiles
Furniture
Printing, publishingand recorded media
Paper and paperproducts
Wood and woodproduct
Leather and leatherproducts
Footwear
Clothing
-
2 000
4 000
6 000
8 000
10 000
12 000
14 000
16 000
18 000
2004 2005 2006 2007 2008 2009 2010 2011 2012 2013 2014
Textiles
Furniture
Printing, publishing andrecorded media
Paper and paperproducts
Wood and woodproduct
Leather and leatherproducts
Footwear
Wearing apparel
FP&M SETA Sector Skills Plan for 2015-2020
17
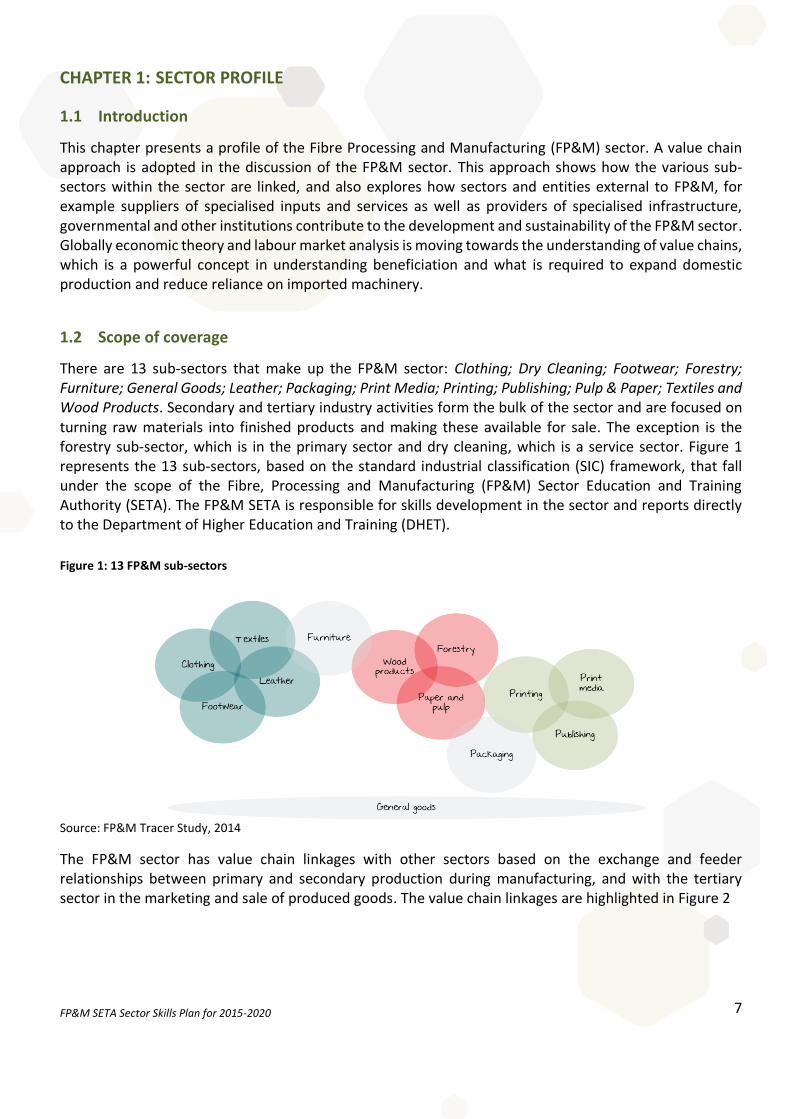
skills levy), or have not chosen a specific code as their businesses overlap multiple sub-sectors making it difficult to determine the most appropriate one.
Table 3: Employers in the FP&M Sector
Sub-sector Size Unallocated
Large (150+)
Medium (50-149)
Small (0-49) Total
Sub-sector Unallocated
1176 110 273 10423 11982
Clothing 9 117 211 3388 3725
Dry Cleaning 2 40 42
Footwear 1 31 40 634 706
Forestry 5 56 66 356 483
Furniture 6 20 31 416 473
General Goods 2 4 9 48 63
Leather 1 14 15 418 448
Packaging 3 27 28 267 325
Print Media 8 12 138 158
Printing 17 50 82 1319 1468
Publishing 3 15 15 345 378
Pulp and Paper 1 10 11 62 84
Textile 7 70 112 1515 1704
Wood Products 3 50 53 516 622
Total 1234 582 960 19885 22661
SOURCE: SARS DATABASE
Most of the employers are based in Gauteng, although KwaZulu Natal has the largest number of large employers employing more than 150 employees.
Table 4: National Distribution of FP&M Employers
Province Size Unallocated
Large (150+)
Medium (50-149)
Small (0-49)
Grand Total
Province Unallocated 8 4 12 454 478
Eastern Cape 69 35 39 1043 1186
Free State 21 15 40 526 602
Gauteng 496 141 190 7580 8407
KwaZulu-Natal 253 201 371 4128 4953
Limpopo 32 4 2 8 46
Mpumalanga 45 52 91 1116 1304
North West 24 1 6 239 270
Northern Cape 7 2 4 154 167
Outside SA 1 1
SA National (i.e. in SA but province unspecified)
1 1
Western Cape 277 127 205 4637 5246
Grand Total 1234 582 960 19885 22661
SOURCE: SARS DATABASE
1.6 Labour market profile
The following section analyses employment in the sector including trends in the various sub-sectors and occupational categories.
18
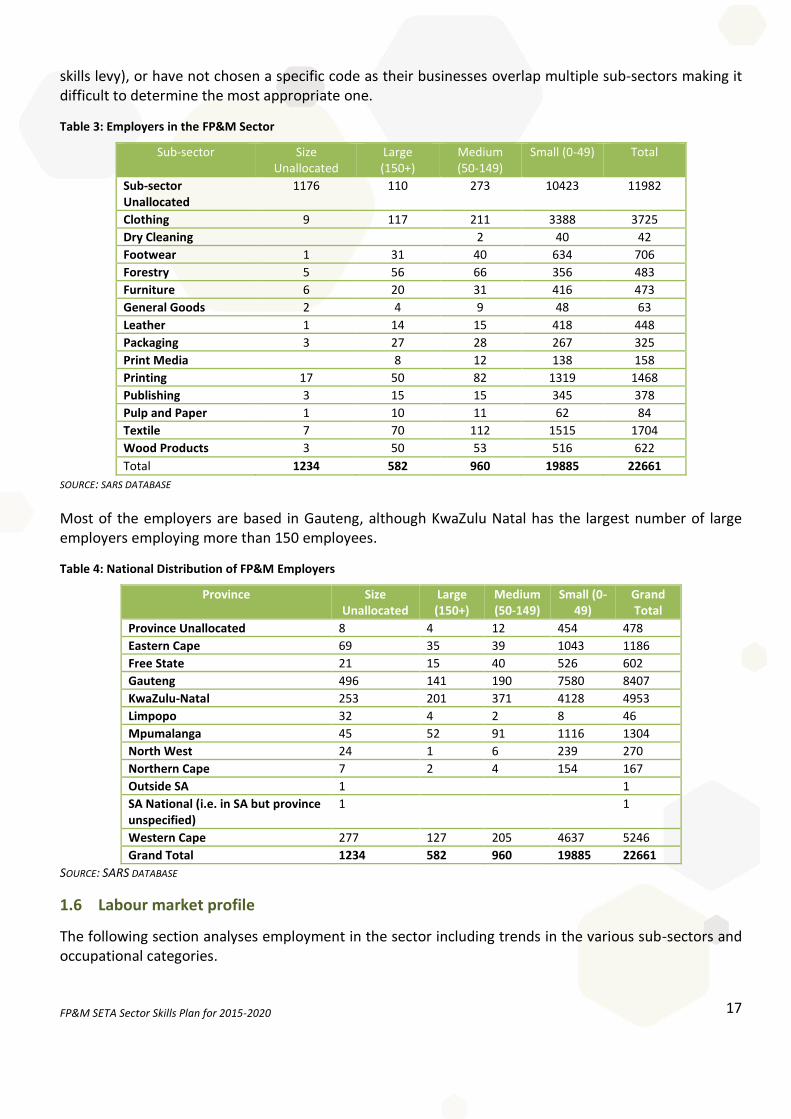
5.1.2. Total employment in the sector
Table 5 indicates that there are approximately 324 642 people employed in the FP&M sector1. This is about a quarter of the employed in the entire manufacturing sector and 2, 1% of employment in the total economy. The sector experienced a 27% decline in employment between 2004 and 2014, a total job loss of 121 000. On the whole, total employment in the sector reflected a decline, dropping from a peak of approximately 3, 6% of total employment in the country in 2004 to 2, 1% of total employment in 2014.
Table 5: Total employment in the FP&M sector as a percentage of total employment in manufacturing and the economy
Year Total
Economy Manufacturing
Sector FPM Sector FPM as % of
Manufacturing
FPM as % of Total Economy
2004 12 537 504 1 528 041 445 657 29,2% 3,6%
2005 12 846 267 1 582 427 449 324 28,4% 3,5%
2006 13 401 120 1 583 948 441 749 27,9% 3,3%
2007 13 803 938 1 584 483 439 077 27,7% 3,2%
2008 14 581 481 1 556 541 420 484 27,0% 2,9%
2009 14 189 346 1 434 872 372 704 26,0% 2,6%
2010 13 785 457 1 402 148 361 153 25,8% 2,6%
2011 14 067 125 1 390 198 353 064 25,4% 2,5%
2012 14 423 487 1 351 616 334 651 24,8% 2,3%
2013 14 864 716 1 381 682 334 588 24,2% 2,3%
2014 15 144 355 1 349 262 324 642 24,1% 2,1%
Quantec data, 2015
Over the past decade total employment in the FP&M sector has been in decline. The largest contraction happened between 2007 and 2009 during the global economic crisis. Compared to the rest of the manufacturing sector and the economy as a whole, the FP&M sector has been shedding jobs at a higher rate. (See Change in employment over the past decade in FP&M, manufacturing as a whole and the economy below):
1 Analysis based on Quantec data reflecting 2014 employment statistics. Figures exclude forestry and dry cleaning.

FP&M SETA Sector Skills Plan for 2015-2020
19
Figure 8: Change in employment over the past decade in FP&M, manufacturing as a whole and the economy
Quantec Data, 2015
The sector has generally been shedding jobs between 2004 and 2014. There was a 27% reduction in employment during this period across the sector, with the clothing experiencing the highest proportion of job losses at 47% (Figure 9). During this period, with the exception of paper and pulp sub-sector and footwear, all other sub-sectors experienced some job losses. Sector stakeholders have indicated that where job losses were as a result of imported goods being cheaper than locally produced goods, this is likely to be reversed because of exchange rates. A consistently and relatively weaker rand has rendered some imported goods expensive to import and these employers are starting to invest in local production, contributing to local employment.
Figure 9: Percentage change in employment: 2004-2014
Source: Quantec data, 2015
( 0.14)
( 0.12)
( 0.10)
( 0.08)
( 0.06)
( 0.04)
( 0.02)
-
0.02
0.04
0.06
0.08
2004 2005 2006 2007 2008 2009 2010 2011 2012 2013
Total Economy
ManufacturingSector
FPM Sector
-24%-26%
-10%
14%
-29% -28%
9%
-47%
-50%
-40%
-30%
-20%
-10%
0%
10%
20%
Textiles Furniture Printing,publishing
and recordedmedia
Paper andpaper
products
Wood andwood
product
Leather andleather
products
Footwear Clothing

20
5.1.3. Employee geographical spread
KwaZulu-Natal has the most employees, accounting for 34% of employees, followed by Western Cape (26%) and Gauteng (19%). The Northern Cape, which has the lowest population density in the country (Figure 10).
Figure 10: Employee Profile per Sub-sector
SOURCE: FP&M SETA MIS DATABASE, WSP SUBMISSIONS 2014
5.1.4. Employee occupational profile
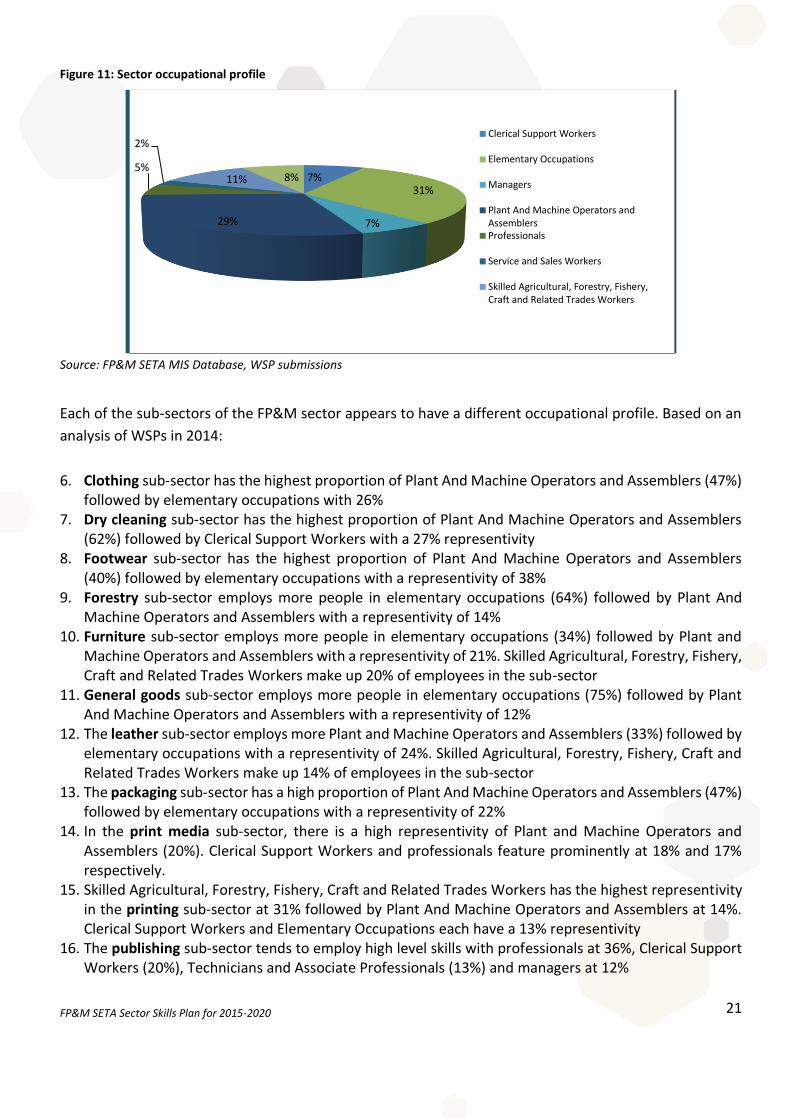
The occupational profile of the FP&M sector is informed by the nature of business that the sector is involved in and therefore the type of skills required in the production process. Based on an analysis of WSP submissions, Figure 11 depicts the highest proportion of the workforce employed in elementary occupations (31%) followed by Plant and Machine Operators and Assemblers (29%). These occupation groups account for 60% of the work force. Service and Sales Workers has the lowest representivity, accounting for 2% of the workforce whilst managers (7%) and professionals (5%) together account for 12% of the workforce. The occupational profile of the sector implies a requirement for lower level skills to ensure competitiveness.
EasternCape
Freestate GautengKwaZulu-
NatalLimpopo
Mpumalanga
NorthWest
NorthernCape
WesternCape
Employees 7759 1871 30606 55220 1628 12096 3612 142 41180
0
10000
20000
30000
40000
50000
60000
Employees per Province
FP&M SETA Sector Skills Plan for 2015-2020
21
Figure 11: Sector occupational profile
Source: FP&M SETA MIS Database, WSP submissions
Each of the sub-sectors of the FP&M sector appears to have a different occupational profile. Based on an
analysis of WSPs in 2014:
6. Clothing sub-sector has the highest proportion of Plant And Machine Operators and Assemblers (47%) followed by elementary occupations with 26%
7. Dry cleaning sub-sector has the highest proportion of Plant And Machine Operators and Assemblers (62%) followed by Clerical Support Workers with a 27% representivity
8. Footwear sub-sector has the highest proportion of Plant And Machine Operators and Assemblers (40%) followed by elementary occupations with a representivity of 38%
9. Forestry sub-sector employs more people in elementary occupations (64%) followed by Plant And Machine Operators and Assemblers with a representivity of 14%
10. Furniture sub-sector employs more people in elementary occupations (34%) followed by Plant and Machine Operators and Assemblers with a representivity of 21%. Skilled Agricultural, Forestry, Fishery, Craft and Related Trades Workers make up 20% of employees in the sub-sector
11. General goods sub-sector employs more people in elementary occupations (75%) followed by Plant And Machine Operators and Assemblers with a representivity of 12%
12. The leather sub-sector employs more Plant and Machine Operators and Assemblers (33%) followed by elementary occupations with a representivity of 24%. Skilled Agricultural, Forestry, Fishery, Craft and Related Trades Workers make up 14% of employees in the sub-sector
13. The packaging sub-sector has a high proportion of Plant And Machine Operators and Assemblers (47%) followed by elementary occupations with a representivity of 22%
14. In the print media sub-sector, there is a high representivity of Plant and Machine Operators and Assemblers (20%). Clerical Support Workers and professionals feature prominently at 18% and 17% respectively.
15. Skilled Agricultural, Forestry, Fishery, Craft and Related Trades Workers has the highest representivity in the printing sub-sector at 31% followed by Plant And Machine Operators and Assemblers at 14%. Clerical Support Workers and Elementary Occupations each have a 13% representivity
16. The publishing sub-sector tends to employ high level skills with professionals at 36%, Clerical Support Workers (20%), Technicians and Associate Professionals (13%) and managers at 12%
7%31%
7%29%
5%
2%
11% 8%
Clerical Support Workers
Elementary Occupations
Managers
Plant And Machine Operators andAssemblersProfessionals
Service and Sales Workers
Skilled Agricultural, Forestry, Fishery,Craft and Related Trades Workers
22
17. The paper and pulp sub-sector has a high representivity of Plant And Machine Operators and Assemblers (34%) followed by elementary occupations with a representivity of 20%
18. Textiles sub-sector employs more people in elementary occupations (37%) followed by Plant And Machine Operators and Assemblers with a representivity of 33%
19. The wood products sub-sector employs more people in elementary occupations (46%) followed by Plant And Machine Operators and Assemblers with a representivity of 22%
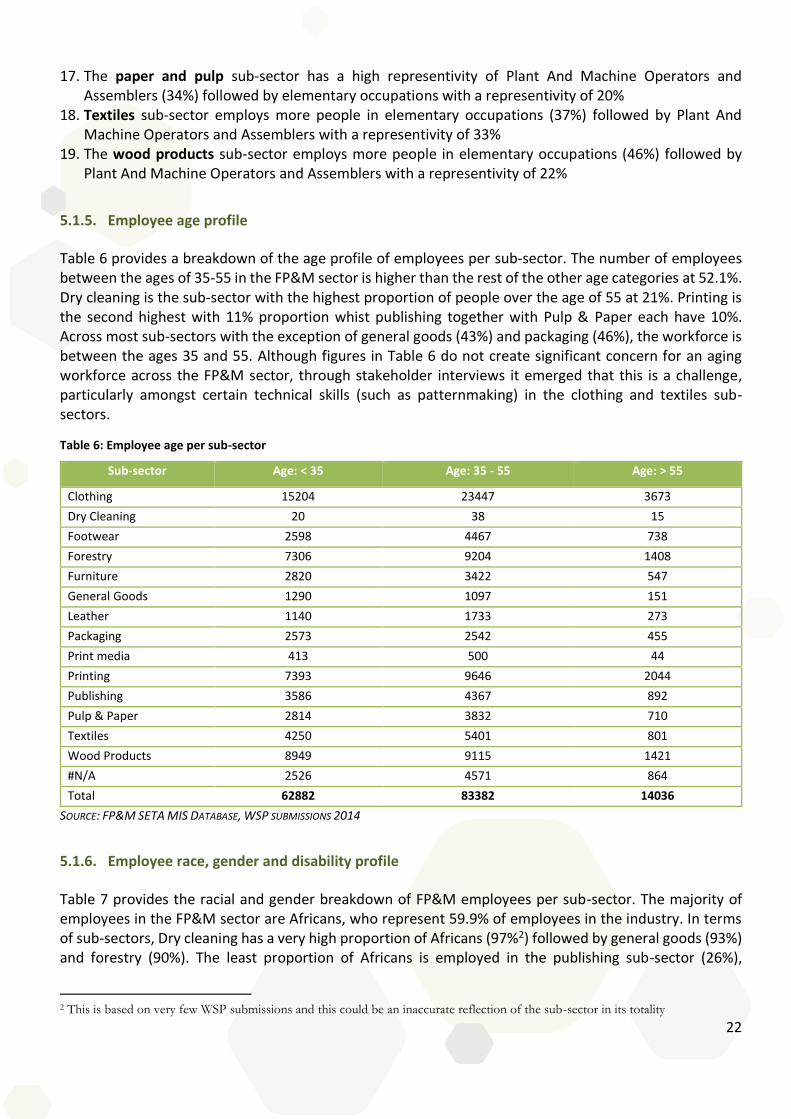
5.1.5. Employee age profile
Table 6 provides a breakdown of the age profile of employees per sub-sector. The number of employees between the ages of 35-55 in the FP&M sector is higher than the rest of the other age categories at 52.1%. Dry cleaning is the sub-sector with the highest proportion of people over the age of 55 at 21%. Printing is the second highest with 11% proportion whist publishing together with Pulp & Paper each have 10%. Across most sub-sectors with the exception of general goods (43%) and packaging (46%), the workforce is between the ages 35 and 55. Although figures in Table 6 do not create significant concern for an aging workforce across the FP&M sector, through stakeholder interviews it emerged that this is a challenge, particularly amongst certain technical skills (such as patternmaking) in the clothing and textiles sub-sectors.
Table 6: Employee age per sub-sector
Sub-sector Age: < 35 Age: 35 - 55 Age: > 55
Clothing 15204 23447 3673
Dry Cleaning 20 38 15
Footwear 2598 4467 738
Forestry 7306 9204 1408
Furniture 2820 3422 547
General Goods 1290 1097 151
Leather 1140 1733 273
Packaging 2573 2542 455
Print media 413 500 44
Printing 7393 9646 2044
Publishing 3586 4367 892
Pulp & Paper 2814 3832 710
Textiles 4250 5401 801
Wood Products 8949 9115 1421
#N/A 2526 4571 864
Total 62882 83382 14036
SOURCE: FP&M SETA MIS DATABASE, WSP SUBMISSIONS 2014
5.1.6. Employee race, gender and disability profile
Table 7 provides the racial and gender breakdown of FP&M employees per sub-sector. The majority of employees in the FP&M sector are Africans, who represent 59.9% of employees in the industry. In terms of sub-sectors, Dry cleaning has a very high proportion of Africans (97%2) followed by general goods (93%) and forestry (90%). The least proportion of Africans is employed in the publishing sub-sector (26%),
2 This is based on very few WSP submissions and this could be an inaccurate reflection of the sub-sector in its totality

FP&M SETA Sector Skills Plan for 2015-2020
23
dominated by the White population group. Females represent 53% of employees within the sector, whilst males represent 47% of the sector’s employees. This is important as it articulates with the objectives of the NDP, which prioritizes gender transformation and the empowerment of woman, working towards the achievement of provision of equal opportunities for all women in the country. The Clothing and Textiles sub-sectors have an overwhelming concentration of women employees. In terms of sub-sectors, clothing has the highest proportion of females (72%) followed by dry cleaning (66%) and footwear (60%). Pulp & paper (24%) together with packaging (25%) have the least number of females as a proportion of total workforce for the sub-sector.
Table 7: Employee race and gender per sub-sector
Sub-sector African Coloured Indian White Male Female
Clothing 22840 13434 3825 2225 11762 30562
Dry Cleaning 71 1 0 1 25 48
Footwear 3363 2960 1045 435 3123 4680
Forestry 16231 897 136 654 11730 6188
Furniture 4272 1405 555 557 4943 1846
General Goods 2369 55 46 68 1618 920
Leather 1948 801 129 268 1461 1685
Packaging 3893 645 572 460 4194 1376
Print media 382 131 168 276 663 294
Printing 7613 5329 2255 3886 12192 6891
Publishing 2272 2259 722 3592 3848 4997
Pulp & Paper 3771 1520 657 1408 5603 1753
Textiles 6148 3001 590 713 4883 5569
Wood Products 16509 999 349 1628 13242 6243
#N/A 4685 1351 712 1213 5954 2007
Total 96367 34788 11761 17384 85241 75059
SOURCE: FP&M SETA MIS DATABASE, WSP SUBMISSIONS 2014
Table 8 indicates the number of disabled employees per sub-sector. The manufacturing sector makes provision for equal opportunity of disabled people. The employee disability profile is based on analysis of WSP data, which gives broad indications of the profile in the sector. Based on analysis of WSP submissions by 676 employers in the sector, there are 942 people living with disabilities employed in the sector, reflecting 0.6% of total employment reported. 41% of the people with disabilities are African, 28% Coloured, 21% white and 9% Indian. The most people with disabilities are employed in the clothing sub-sector (21%) followed by Printing (19%) and Pulp & Paper (14%).

24
Table 8: Employee disability per sub-sector
Sub-sector African Coloured Indian White
Clothing 67 115 10 15
Dry Cleaning 0 0 0 0
Footwear 5 10 4 2
Forestry 26 3 0 5
Furniture 7 3 7 8
General Goods 1 3 0 0
Leather 16 8 8 3
Packaging 16 15 4 4
Print media 8 1 4 3
Printing 71 57 14 40
Publishing 21 7 7 62
Pulp & Paper 50 24 20 35
Textiles 11 10 4 3
Wood Products 84 5 4 8
#N/A 10 4 3 7
Total 393 265 89 195
Source: FP&M SETA MIS Database, WSP submissions 2014
1.7 Conclusion
Output in the FP&M sector has tended to follow that in the wider manufacturing sector and the economy as a whole. Economic decline in 2008/9 was a feature of the global economic crisis. This led to some recovery over 2009/10. Since 2010 growth in the sector, albeit with occasional cyclical upswings, has stagnated, mirroring that of output across the economy. The highest contributor to output is the paper and paper products sub sector, whose total contribution was R60 billion rand in 2014. Exports followed a similar trajectory, declining substantially between 2004 and 2014. Since 2000, except for leather and leather products and to a lesser extent printing, publishing and recorded media, there has been a contraction in exports across the FP&M sector. There has been some export recovery in Wood and wood products, Leather and leather products and Textiles exports in recent years. The only sub-sector that had an “up-turn” in exports since 2012 is Paper and Paper Products. This is also by far the largest contributor to exports in the sector, valued at R15 billion Rand in 2014. Whilst exports have declined, imports have increased dramatically in all sub-sectors since 2000, with the exception of the Printing, Publishing and Recorded Media sub-sectors. The total value of imports for the Clothing sub-sector has doubled from about R6 billion Rand in 2004 to almost R13 billion Rand in 2014. There are currently 22 661 employers in the sector, the majority of whom are small, employing less than 50 employees. The geographical spread of employers (both large and small) is biased towards the urban regions of Gauteng, KwaZulu-Natal and the Western Cape.

FP&M SETA Sector Skills Plan for 2015-2020
25
There are approximately 324 642 people employed in the FP&M sector3. This is about a quarter of the employed in the entire manufacturing sector and 2, 1% of employment in the total economy. The sector experienced a 27% decline in employment between 2004 and 2014, a total job loss of 121 000. KwaZulu-Natal has the most employees, accounting for 34% of employees, followed by Western Cape (26%) and Gauteng (19%). Compared to the rest of the manufacturing sector and the economy as a whole, the FP&M sector has been shedding jobs at a higher rate. With the exception of publishing and print media which have a higher proportion of highly skilled professionals (36% and 17% respectively) most of the sub-sectors employ mostly Plant and machine operators and assemblers, elementary occupations, and clerical support workers, based on an analysis of WSPs in 2014. The majority of employees in the FP&M sector are Africans, who represent 59.9% of employees in the industry. The least proportion of Africans is employed in the publishing sub-sector (26%), dominated by the White population group. Females represent 53% of employees within the sector, whilst males represent 47% of the sector’s employees. Based on analysis of WSP submissions by 676 employers in the sector, there are 942 people living with disabilities employed in the sector, reflecting 0.6% of total employment reported. This chapter reveals that the FP&M sector has value chain linkages with other sectors based on the exchange and feeder relationships between primary and secondary production during manufacturing, and with the tertiary sector in the marketing and sale of produced goods. A value chain approach to profiling and analysing the sector exposes holistic and integrated opportunities for sector development. For example it is evident where the major challenges are in relation to the processing of primary products into secondary products and the need for interventions to beneficiate and produce domestically what is currently being exported. Equally it is clear that there are opportunities to produce in more environmentally sustainable ways and to make use of waste produced at different points in the value chain – for example the huge amount of paper produced and discarded is a clear opportunity for recycling.
3 Analysis based on Quantec data reflecting 2014 employment statistics. Figures exclude forestry and dry cleaning.

26
CHAPTER 2: KEY SKILLS ISSUES
2.1. Introduction
This chapter highlights the key drivers of change influencing skills demand and supply across the FP&M sector. Change drivers include technological advancement and innovation, the heightened focus on beneficiation as a means to improve competitiveness within the sector and the expanding need for environmental sustainability through the emergence of a green economy.
2.2. Change drivers
2.2.1. Factors impacting on skills demand and supply
Technological advancement and innovation
Technological advancement and innovation has impacted profoundly on the FP&M sector and given its extensive policy focus in documents such as IPAP 3, is likely to expand. IPAP 3 identifies the development of new technologies in textiles and clothing including 3-dimensional body scanners; computer-aided design using 3-dimensional scanning data and, setting up a local, garment-sizing database. A new range of natural fibres will be processed such as flax, wild silk, cashmere and kenaf. New technologies in garment design will be explored as well as the commercialisation of new technologies such as fibre-reinforced composites. The aim is to better enable South Africa to compete in niche markets of the clothing sub-sector “on the back of home-grown garment technologies” (Department of Trade and Industry, 2013). Existing technology in large manufacturing companies in packaging, printing and print media, paper and pulp, textiles, clothing, for example, are designed to operate faster and more efficiently. The challenge is that this technology is manufactured abroad. Upskilling and training on new machines is expensive for local manufacturers, as trainers need to be brought in from elsewhere in the world. This is also true for maintenance related needs. Technological developments do not have a uniform effect on the demand for labour. On the one hand, the mechanisation and computerisation of processes may reduce the demand for labour. At the same time technological changes are the biggest drivers of skills demand in the sub-sector and all levels of workers have to continuously upgrade their skills if they are to keep up with technological changes. The use of electronic media is increasing at a rapid rate and is expected to change the face of the printing and publishing sub-sectors locally and internationally. Paper products used for communication purposes such as newspapers are under threat from digital technologies and have dropped substantially over the past few years. This has meant that the pulp & paper sector innovate and look to develop alternative niche markets such as cellulose in cigarette filters, absorbent wipes and stabilisers.
The importance of social media has grown globally. “Social media has emerged as one of the more important channels in the online discovery, research and purchase processes” (Indvik, 2012). Social networks are a huge source of consumer data that can be used effectively, but these sources have been underutilised so far. Some of the implications that the SETA should consider are the role of social media in changing the way that companies do business. For example, can blogging affect the bottom line or share price of a company and to what extent? Ideally, social media should be incorporated into the strategy of any business including that of the SETA.
FP&M SETA Sector Skills Plan for 2015-2020
27
Beneficiation
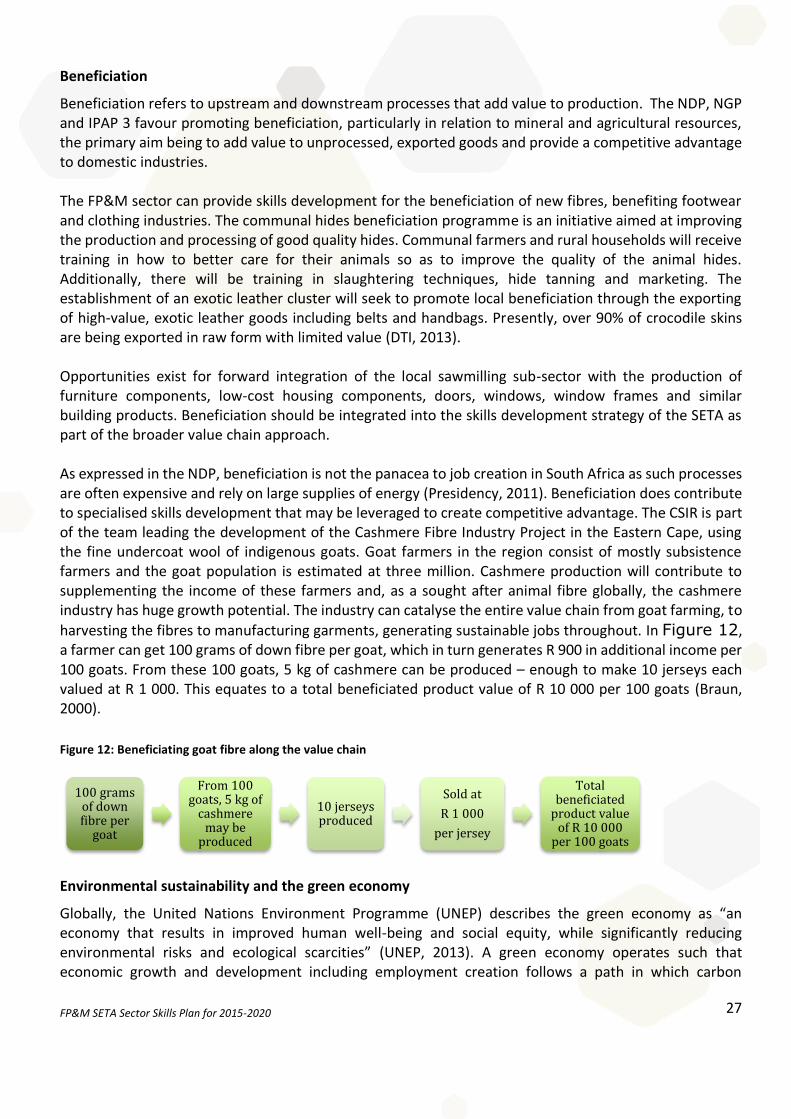
Beneficiation refers to upstream and downstream processes that add value to production. The NDP, NGP and IPAP 3 favour promoting beneficiation, particularly in relation to mineral and agricultural resources, the primary aim being to add value to unprocessed, exported goods and provide a competitive advantage to domestic industries. The FP&M sector can provide skills development for the beneficiation of new fibres, benefiting footwear and clothing industries. The communal hides beneficiation programme is an initiative aimed at improving the production and processing of good quality hides. Communal farmers and rural households will receive training in how to better care for their animals so as to improve the quality of the animal hides. Additionally, there will be training in slaughtering techniques, hide tanning and marketing. The establishment of an exotic leather cluster will seek to promote local beneficiation through the exporting of high-value, exotic leather goods including belts and handbags. Presently, over 90% of crocodile skins are being exported in raw form with limited value (DTI, 2013). Opportunities exist for forward integration of the local sawmilling sub-sector with the production of furniture components, low-cost housing components, doors, windows, window frames and similar building products. Beneficiation should be integrated into the skills development strategy of the SETA as part of the broader value chain approach. As expressed in the NDP, beneficiation is not the panacea to job creation in South Africa as such processes are often expensive and rely on large supplies of energy (Presidency, 2011). Beneficiation does contribute to specialised skills development that may be leveraged to create competitive advantage. The CSIR is part of the team leading the development of the Cashmere Fibre Industry Project in the Eastern Cape, using the fine undercoat wool of indigenous goats. Goat farmers in the region consist of mostly subsistence farmers and the goat population is estimated at three million. Cashmere production will contribute to supplementing the income of these farmers and, as a sought after animal fibre globally, the cashmere industry has huge growth potential. The industry can catalyse the entire value chain from goat farming, to
harvesting the fibres to manufacturing garments, generating sustainable jobs throughout. In Figure 12, a farmer can get 100 grams of down fibre per goat, which in turn generates R 900 in additional income per 100 goats. From these 100 goats, 5 kg of cashmere can be produced – enough to make 10 jerseys each valued at R 1 000. This equates to a total beneficiated product value of R 10 000 per 100 goats (Braun, 2000).
Figure 12: Beneficiating goat fibre along the value chain
Environmental sustainability and the green economy
Globally, the United Nations Environment Programme (UNEP) describes the green economy as “an economy that results in improved human well-being and social equity, while significantly reducing environmental risks and ecological scarcities” (UNEP, 2013). A green economy operates such that economic growth and development including employment creation follows a path in which carbon
100 grams of down fibre per
goat
From 100 goats, 5 kg of
cashmere may be
produced
10 jerseys produced
Sold at
R 1 000
per jersey
Total beneficiated
product value of R 10 000
per 100 goats
28
emissions are reduced, energy and resource efficiency is promoted and environmental degradation is lessoned. Expanded focus on environmental sustainability in policy documents such as the NDP, NGP and the Green Economy Accord has implications for skills development for the FP&M SETA. It necessitates a growth in higher level knowledge (through research) and skills linked to developing and implementing green technologies. Appropriate skills need to be developed that are aligned to local and international standards of environmental awareness and impact. SAPPI produces 60% of its own power using bark and industrial waste. Energy constraints in South Africa will ultimately affect skills development through the demand for energy-related/technical skills such as boilermakers, turbine operators, and electrical engineers. The carbon tax legislation intended to be implemented by Government in 2016 is likely to impact on business operations and the need for environmental-type skills including tree breeding scientists, climate change specialists and environmental research skills. Over and above technical skills training, is training in ethical matters pertaining to the protection of our environment and sustainability training. Through the Green Economy Accord of 2011 government commits “to expand training programmes linked to the skills needs of the green economy and to ensure that the new programmes take into account the requirements for the green economy. Where these are appropriate, retraining and refresher courses should be made available” (Economic Development Department, 2011, 31). The Environmental Sector Skills Plan (ESSP) of 2010 maps out key environmental skills needs in the South African economy. Lack of alignment between NSDS 3 and ESSP means that SETAs need support to integrate the environmental agenda into their education and training function (Department of Environmental Affairs, 2010). This requires cross-SETA collaboration and engagement with the Department of Environmental Affairs who have in place several environmental training programmes of their own. Environmental education and training must be streamlined into the primary function of all SETAs and not be treated as an ad hoc responsibility. The paper and pulp sub-sector is a big polluter of air and water. The industry generates 40% of their energy needs through renewable energy resources such as mill waste (EDD, 2011). For paper and packaging, targets are set for increasing the recycling rate of post-consumer waste. A reduction in waste generated through production processes is promoted, as is the re-use of waste products that may be used in producing other products (EDD, 2011). Research into bio pulping as an environmentally friendly method of pulping is worthwhile exploring. Water–efficiency improvements within manufacturing are a priority in the Paper and Paper Products sub-sector. Generally water availability and quality has been diminishing. Mills are focusing on technologies e.g. membrane technologies to clean up and recycle the water. In the printing sub-sector the dumping of ink down drains is a huge environmental challenge especially amongst small printing companies.
HIV/AIDS prevalence
According to the HSRC’s South African National HIV Survey of 2012, it is estimated that 12.2% of the population (6.4 million persons) were HIV positive, which is 1.2 million more PLHIV than in 2008 (10.6%, or 5.2 million). The results of the analysis of HIV-prevalence estimates by key demographic variables suggest that the overall HIV prevalence differed substantially by province (Human Sciences Research Council, 2012). Such variations are depicted in Figure 13.

FP&M SETA Sector Skills Plan for 2015-2020
29
Figure 13: HIV prevalence by province, Source HSRC HIV Report (2012)
HIV/AIDS has negative effects on the country’s labour force and increased prevalence is a threat to the economy’s growth and the continued productivity of the country’s labour force. This is thus an issue that needs to be addressed in skills planning in order to ensure that the workforce is educated and aware of the risks and these should jointly be mitigated through collaboration with government departments and employers.
2.2.2. Implications of these factors for skills planning
The main implications for skills planning that may occur as the result of the change drivers identified above are described in Table 9.
Table 9: Implications of change drivers on skills development in the FP&M sector
Outcome Implications for skills planning
Technological
advancement and
innovation
20. Mechanisation and computerisation may mean a reduction in the demand for lower level skills
21. Higher-level skills encouraged in niche areas 22. Increased upskilling of existing labour force 23. Creating industry-research partnerships with research institutions, science councils
and universities of technology in areas identified for innovation 24. Increased outsourcing of training on newly important equipment and machinery.
Eventually, funds should be mobilised for local training on imported equipment and
machinery as well as skills developed for maintaining these in the future.
Beneficiation 25. Developing specialised skills needed for processing raw materials 26. Creating value chain linkages within and across sectors 27. Skills development in support of new, niche industries and markets e.g. cashmere 28. Training as part of communal beneficiation programmes rolled out by Government
e.g. communal hides beneficiation programme.
Environmental
sustainability and
29. Skills development to support Green Industry initiatives 30. Integrating sustainability into education and training programmes for the sector. This
may require better alignment between NSDS 3, ESSP and SETA SSPs.

30
Outcome Implications for skills planning
the Green
Economy
31. Growth in high level knowledge (through research) and skills linked to developing and implementing green technologies.
32. Developing appropriate skills that are aligned to local and international standards of environmental awareness and impact.
HIV/AIDS
prevalence
33. Integration of HIV/AIDS awareness into skills planning programmes.
2.2.3. Research methods employed
The above analysis adopted the following research methods. A desktop review was initially conducted to acquire an understanding of the national policy environment and its impact on the FP&M sector. Polices, technical reports and research publications were referred to as part of the desktop review. Both qualitative and quantitative primary research methods were used to develop a concise understanding of the key drivers of change influencing skills development across the sector. Stakeholder interviews and focus groups were held within the main sub-sectors including forestry, clothing, textiles, leather and footwear, pulp and paper, print media and packaging. These interviews and focus groups were used as a means to interrogate key factors pertaining to the individual sub-sectors as a basis to formulate common themes emerging across sub-sectors that can be addressed in the SSP. An employer survey conducted online has also fed into the analysis contained in this chapter.
2.3. Alignment with national strategies and plans
It is imperative that this SSP aligns itself to national policy and strategy, including sector-based, industrial strategy. The National Development Plan (NDP) is the overarching framework guiding economic development. The implementation of the NDP is contained in the Medium Term Strategic Framework (MTSF). Other key policies that must be considered include the New Growth Path (NGP), Industrial Policy Action Plan (IPAP), Human Resource Development Strategy for South Africa (HRDS-SA), White Paper on Post School Education and Training and, National Skills Development Strategy III (NSDS III). Each of these is referred to in the tables below as well as their associated impacts on skills development in the FP&M sector.
The NDP is the over-arching, long-term plan for South Africa that aims to eliminate poverty and reduce inequality by 2030 through faster and more inclusive economic growth. A priority of the NDP is “improving the quality of education, skills development and innovation” (Presidency, 2011, 17). There is a focus on support for small businesses (including cooperatives) through initiatives such as public and private incubators and on sustainability through better technologies, research and adaptation strategies. This necessitates reskilling to accommodate technological advancements as well as building research and innovation skills across the system. A skills development platform that targets multiple areas of skills development across the value chain is required. If training can be provided as part of a wider package (including small business development and funding, incubators etc.) then the potential for impact is greater.
The NGP is aimed at enhancing growth, employment creation and equity, targeting 5 million jobs by 2020 through partnerships between the state and the private sector (EDD, 2011). Labour absorbing activities, clean manufacturing and environmental services are promoted. Clothing, Textiles, Leather and Footwear Sub-sectors are all potentially labour absorbing. The NGP emphasises strategies for growth supported by skills development. More research is required to establish potential partnerships in this area. The provision
FP&M SETA Sector Skills Plan for 2015-2020
31
of green economy-type skills that are more technical and environmentally conscious is key, particularly in the Paper and Paper Products environment. A growth area is recycling that has particular skills requirements. Employment growth in the sector requires up-skilling existing employees in contracting sectors to accommodate technological changes and changes in production methods.
IPAP 2013-2016 identifies a series of domestic constraints that continue to inhibit industrialisation and the economic growth of South Africa. Key sectoral interventions are mapped out for clothing and textiles, forestry, timber, paper, pulp and furniture sub-sectors. In the Clothing and Textiles, the key opportunity is to recapture a bigger share of the domestic market by improving competitiveness. Programmes to be introduced in the leather industry are communal hides beneficiation, innovation and technology and, the establishment of an exotic hides cluster. Action plans for forestry include the fast tracking of issuances of water licenses. Action plans for wood and wood products cater for productivity improvement and a sustainable supply of raw material. The Furniture Design Programme and Furniture Cluster Development are targeted at furniture manufacturing (DTI, 2013).
The implementation of these sectoral interventions has skills development implications. The hides beneficiation programme train communal farmers and rural households in caring for their animals to maximise hide quality. Training will incorporate slaughtering techniques, hide tanning, and marketing know-how. Support will be provided to rural communities that own land suited for forestry development and demonstrate an interest in afforestation. Communities will be assisted with water licencing applications; crafting business plans to apply for investment capital, forestry-related skills development, technological capacity and business management skills such mechanisms for leveraging financial support. In sawmilling, the plan is to assist small and medium-scale sawmills to improve their productivity through technology upgrading, market access, transfer of skills and securing long-term supply contracts. The furniture design programme will support high-level design skills that will help address market failures, encourage specialisation and improve productivity (DTI, 2013).
The HRDS-SA is a national framework, within which all other HRD-oriented policies operate, that has eight commitments, associated strategic priorities and objectives and, a list of indicators and outputs by which these may be measured. Targets are set for priority areas identified in IPAP and the NDP and framed in terms of educational attainment, skills development, science and innovation and labour market/employment policies. For FP&M SETA these include increasing the output of graduates with qualifications linked to skills demand in forestry, pulp and paper, and furniture industries in TVET, HE and SETA-facilitated training. Addressing skills mismatch in the economy requires increased employer input into programme development (Human Resource Development Council of South Africa, 2010). Understanding real sector needs depends on capacity building within SETAs in areas like skills planning, labour market forecasting, analysis and research.
The White Paper on Post-School Education and Training developed by the Department of Higher Education and Training provides a coherent and well-articulated framework within which the different stakeholders of the post-school system operate. SETAs need to work with TVET colleges, employers and industry experts in the development of occupationally directed programmes that address real skills needs. The SETA needs to engage more with employers and to incentivise and motivate them to create opportunities for more workplace learning and work-integrated learning. This includes expanding the public sector as a training space. Inter-departmental skills programmes are ideal (Department of Higher Education and Training, 2013). Also important are mentorship programmes that target those in employment as well as recent graduates.

32
NSDS III identifies the need to train people for employment and empower them to earn a living, with a particular emphasis on small businesses and cooperatives. To quote “Properly supported with adequate skills, these cooperatives can play an important role, not just in the margins, but in the very mainstream of the South African economy. The NSDS III must support the training needs of the cooperatives, including relevant capacity building for the secondary, apex and cooperative movements as a whole” (DHET, 2011, 19).
The development of cooperatives is emerging as part of a broader social plan of Government targeted at uplifting the unemployed, mainly women, youth and the disabled, through subsistence production. Eight sewing cooperatives in Katlehong were interviewed as part of a focus group discussion during the SSP research process. All of the eight cooperatives interviewed were registered and each comprised of 4-6 members. Most had received a small grant from the Cooperative Incentive Scheme of the DTI to buy equipment such as sewing machines. However, some members complained that grants had not been paid on time or were irregular. A few cooperatives had been contracted by the Department of Social Development to sew school uniforms. These were ad-hoc contracts that provided no stability. Also, uniforms produced had to be cheap and were therefore of poor quality. There was a sense that, in this case, Government failed to encourage entrepreneurship but, rather, subsistence production with products that do not meet quality standards. There was one cooperative that made leather shoes and horse saddles and another that sewed curtains and did upholstery. These had clearly identified niche markets and were using their expertise to produce a specialised product.
Except for one cooperative member, all of the other 40 odd members had not undergone any formal, skills training nor did they have a formal qualification. Members had varying levels of experience in sewing and may be suitable Recognition of Prior Learning (RPL) candidates. Formal training needs included technical skills training in areas such as garment design, pattern making, cutting and sewing as well as business skills such as developing a business plan, accessing finance, sourcing materials and equipment, accessing a suitable premises for the business, managing the business and members of the cooperative, negotiating costing and contracts and marketing products. Two cooperatives had identified potential niche markets for sewing hospital linen and socks (rather than school uniforms). Although these cooperatives expressed the desire to produce something different, they failed to understand how one turns a business idea into something tangible. A challenge facing many of the sewing cooperatives is the ability to see their businesses as a long-term commitment and not a short-term source of income.
It is important that primary cooperatives such as the sewing cooperatives in Katlehong become productive contributors to the mainstream economy – where their sustainability depends on what they produce rather than monetary grants from government. Cooperatives should ideally bring together skilled and semi-skilled workers that can apply their skills to a production or manufacturing process (such as the manufacturing of clothes or leather saddles or linen textiles). This requires that the SETA aligns its skills interventions with other government and private sector support (for example larger companies sub-contracting cooperatives). The 18 Strategic Integrated Projects (SIPs) currently being rolled out by Government across the country will boost economic and social infrastructure. Timber and wood are inputs used in the construction industry. Microcrystalline cellulose is a product manufactured by SAPPI that is used to coat tablets in the pharmaceutical industry. Both the construction and pharmaceutical industries have been identified as enablers for the Strategic Infrastructure Projects (SIPS). Through the SIPS Government plans to expand the skills base of the country. There is an opportunity for employers in the wood and paper and pulp industries in the sector to engage with skills development programmes aligned to the SIPS through the FP&M SETA.

FP&M SETA Sector Skills Plan for 2015-2020
33
2.4. Alignment with sectoral industrial strategies
Over the past five years, several of the sub-sectors in the FP&M cluster have engaged with Government (more specifically, the Department of Trade and Industry) to develop a number of industrial strategies, charters and or initiatives aimed at supporting the growth and development of the sector (See Figure 14). These are presented in the diagram below. Some are identified in IPAP 3 and all include reference to skills development. FP&M SETA has an important role to play in supporting skills development linked to these strategies.
Figure 14: Industrial Strategies
The following are some examples of how these strategies are impacting within the sector and on the work
of the FPM SETA:
i. Equity targets in sector charters such as forestry all have a skills development pillar. ii. Programmes geared at the sawmilling sub-sector, a labour intensive sub-sector and large employer
of rural women, incorporate improvements in the quality and output of materials via better technologies, improved market access, skills transfer and securing long-term contracts that are sustainable.
iii. Furniture clusters in KZN, WC and Gauteng create economies of scale with respect to reduced input costs, facilitates knowledge sharing and builds collective capacity for accessing markets.
iv. Furniture Centres of Competence for high level skills and technology training are geared at improving sub-sector competitiveness.
v. The Pulp and Paper education strategy seeks to expand partnerships, manage work-integrated learning, and support changing skills needs that align qualifications to sub-sector needs.
vi. Customised Sector Programs (CSPs) for clothing and textiles; leather; footwear and general leather goods aim to invest in critical skills development linked to using new technologies for fast and flexible production. The development of industrial design capability is key for growing a uniquely SA product segment of the market and links to new programme development and the setting up of skills transfer structures.
Industrial strategies, charters & initiatives
Sector Charters (e.g. Forestry)
Improving sawmilling quality & outputs
Furniture clusters (KZN, WC & Gauteng) and Furniture centres
of competence
Pulp & Paper education strategy (WIL; adapting to changing skills needs; qualifications alignment
to industry needs
Customised sector programmes:
Clothing & textiles, leather, footware &
general leather goods.
34
2.5. Conclusion
Chapter 2 provided a concise analysis of key drivers influencing change in the FP&M sector and associated skills development implications. Rapidly advancing technology and innovation has had profound impact on certain FP&M sub-sectors. There are new technologies being developed in textiles and clothing and new natural fibres are being explored. Existing technology used throughout the sector in manufacturing companies in packaging, printing and print media, paper and pulp, textiles, clothing are now designed to operate faster and more efficiently. Training on new machinery and maintenance is often sourced internationally. Increased mechanisation may reduce the demand for labour. At the same time technological changes are the biggest drivers of skills demand, as workers have to continuously upgrade their skills to keep up. Electronic media usage has expanded and is expected to change the face of the printing and publishing sub-sectors. Social media provides an additional source of valuable consumer data. Both national (IPAP & NDP) and sector-based industrial strategies are driving technological advancement and innovation through customised sector programmes and other initiatives. When these drivers of change are considered alongside the employment trends set out in Chapter 1 it becomes clear that the potential for large scale expansion in employment is quite limited. It is also the case that many employed workers are facing change and will need to adapt to achieve a secure future in the sector. Although the SETA will seek to contribute substantially to the development of new entrants to priority occupations in demand in the sector, there is a strong case for there to be substantial training targeted at existing employees to enable them to adapt to change and to position themselves to be able to contribute to future skills demand in the sector. An expanded focus on beneficiation is covered in all key national policies and strategies and will add value to unprocessed goods boosting our competitive edge in key markets such as exotic leather goods and cashmere products. Beneficiation necessitates skills development across value chains both within and between sectors. Environmental sustainability through reductions in carbon emissions and waste and more efficient fuel consumption has become, and is likely to continue to be, a key driver of change in the sector. Research into more environmentally friendly production methods such as biopulping is key to reducing waste and water contamination. National strategy such as the Green Economy Accord and the Environmental Sector Skills Plan all allude to the need for higher-level knowledge and skills linked to developing and using green technologies and, increased research on more sustainable means of production. Skills development must cater for such needs as well as the necessary ethical training required for developing an environmentally conscious workforce. HIV and AIDS, like in other sectors, continue to threaten the health of workers and their productivity levels. Skills development initiatives must continue to factor in the development of health conscientious employees.

FP&M SETA Sector Skills Plan for 2015-2020
35
CHAPTER 3: EXTENT OF SKILLS MISMATCH
Chapter 3 delves into the degree of skills mismatch in the FP&M sector and some or the reasons for this mismatch. Skills mismatch may be defined as a mismatch between the skills demanded and the skills supplied in an economy. These may result because of a shortage of skills, the existence of unsuitable skills and or recruitment related challenges. What follows here is an assessment of occupation-specific skills demand and supply challenges facing employers in the sector.
3.1. Extent and Nature of Skills Demand
The approach to skills demand in the sector analysis involves literature study to review the industry dynamics. The literature study entails the analysis of both industrial policies and strategies formulated for the different sectors. Secondly, interviews and focus group discussions are conducted with stakeholder and experts within each sub-sector. An analysis is conducted using both Stats SA’s Quarterly Labour Force Survey (QLFS) and the Quantec data. Finally, the findings of the literature survey, interviews and data analysis are presented to sub-sector representatives in workshops across three regions. Feedback is incorporated into the SSP.
3.1.1. Occupations that are hard to fill
There are some occupations that are hard to fill across multiple sub-sectors within the FP&M sector. For manufacturing companies in the clothing, textiles, pulp and paper, printing and packaging industries, these are generally mid-to-high level, technical occupations such as plant and machine operators, machine assemblers, machine mechanics, coded welders, technologists and technicians (FP&M SSP interviews, 2015). At the same time, there are elementary occupations in some sub-sectors that are also hard to fill. In clothing, for example, patternmakers, cutters and machinists are difficult to source particularly those that work in factories. The existing pool of pattern makers is aged and insufficient young people are attracted into the occupation. Likewise, in forestry, about 90% of the workforce in low skilled and in some cases illiterate in occupations such as planters and basic fire fighting. Labour turnover in the industry is high and this increases demand for short courses and skills programme type training as this turnover creates a constant flow of new recruits that require training (FP&M SSP interviews, 2015). Industries in print media and publishing sub-sectors experience difficulties in filling high-level, professional occupations including editing, digital publishing, translator and design (FP&M Employer survey, 2015).
Other reasons for the occupations that are hard to fill across the FP&M sector include:
Low wages in the sector rendering some occupations less attractive to young people
Technological improvement in the sector requiring a new skills set
Industry trends creating new pressures for employers in the sector to operate differently
Lack of immediate skills to replace an ageing and experienced workforce
Need for multi-skilled people to perform functions that were previously filled by people without multiple skills
Graduates lacking the requisite basic skills to function. In certain cases, occupations are not hard to fill but there is high turnover of employees because the jobs are used as a stepping-stone into other more lucrative jobs. In other words, people only hold on to the jobs because they have no options. High turnover exists from manufacturing into retail where the latter is considered more lucrative (SSP interviews, 2015).

36
The occupational profile of the sector implies a requirement for lower level skills to ensure competitiveness of the people employed. The increased investment in technology by employers in the sector is likely to have a negative bearing on the demand for low level skill and a move towards intermediate skills.
3.1.2. Occupational Wage Trends
Wage trends in the sector have generally been on a rise in nominal and real terms between 2004 and 2014. Given that majority of workers in the sector are in low-level and elementary jobs, the average wages are relatively low. Highest average wages are experienced in the printing, publishing and recorded media sub-sectors whilst clothing sub-sector has the lowest average wages per employee rand. Between 2004 and 2009 the highest average wages per employee rand were experienced in the paper and pulp sub-sector but since 2009, the printing, publishing and recorded media sub-sector wages became the highest. These two sub-sectors have some concentration of mid-level to higher level jobs and hence attract higher average salaries (See Figure 15).
Figure 15: Remuneration per employee rand in the FP&M sector
Source: Quantec, 2015
-
50,000
100,000
150,000
200,000
250,000
20042005200620072008200920102011201220132014
Remuneration per employee rand
Textiles
Furniture
Printing, publishing andrecorded media
Paper and paper products
Wood and wood product
Leather and leather products
Footwear
Clothing

FP&M SETA Sector Skills Plan for 2015-2020
37
3.1.3. Conditions of Employment
Conditions of employment in South Africa are regulated through a regime of labour laws that are viewed as being pro-worker. One of the challenges employers in the sector have is in relation to the employment of temporary workers. The latest amendments to the Labour Relations Act that came into effect in April 2015 stipulate that a temporary employee is automatically "deemed" to be a permanent employee of the client of the labour broker after just three months of work and if the nature of a position cannot be justified to be purely of a temporary nature. That means employers now have to grapple with how temporary workers are employed when needed.
The high unemployment rate in South Africa has often led to exploitation of workers in the sector by unscrupulous employers who do not adhere to the laws and regulations. In the clothing sector, there have been reported cases of employers largely CMTs) in KZN who pay below minimum wages set by the bargaining council. Union involvement does not always help as some workers still elect to work for the lower wages. Also, many of these CMTs are micro and small businesses operating informally making regulation of such businesses difficult.
3.1.4. Migration in the Sector
Between 2011 and 2013 South Africa issued almost 78,000 work permits to foreigners to work in sectors of the economy where there is need. These included quota work permits, general work permits; exceptional skills work permits and intra-company transfer work permits. The Department of Home Affairs does not indicate in which sectors the people receiving work permits are working.
Given the low skills levels required for employment in the sector, as well as the stringent requirements for work permits there is no immediate need for importation of specialised skills. Although there are indications of little importation of skills into the sector, sector stakeholders have reported on Malawian migrants being employed informally in the clothing sector.
3.2. Extent and Nature of Supply
The supply side data is based on a tracer study conducted and completed by the FP&M SETA at the end of 2014, interviews conducted with SETA management and focus groups conducted with employers in the FP&M sector.
3.2.1. State of Education and Training Provision
The PSET landscape in South Africa comprises 25 universities providing undergraduate and post-graduate qualifications, 50 TVET colleges providing vocational and occupational qualifications and a vast number of private institutions. The Department of Higher Education and Training is responsible for post-school education and training (PSET). In Figure 16, PSET provision is characterised by an inverted pyramid shape with the bulk of students at the top of the pyramid in universities and universities of technology. These institutions have more than double the number of students enrolled than TVET colleges. Additionally,

38
there are almost 3 million youths that are not in education, employment and training. These are termed the NEETs.
Figure 16: An inverted education and training pyramid
Source: CHET, 2013
For the purposes of the SSP, there are two fundamental challenges linked to the state of the E&T system that impact on skills development. The first is access. Despite improvements in access over the past decade, a very small percentage of the population are able to access PSET. Access to PSET is constrained by the poor quality of basic education, high school dropouts, as well as the limited financial aid and absorption capacity at PSET institutions. The massification of the PSET system is required to ramp-up provision and access. The system is recognised for its inverted, pyramid shape – with the bulk of enrolments (more than double) in universities rather than colleges. This limits skills development in desperately needed mid-to-higher-level bands of the NQF. Universities have reached their peak in terms of capacity and cannot provide the level of access required to meet the skills needs of the country, particularly in the mid-level band. The 50 TVET colleges across the country have greater potential to expand access, although there is concern over the quality of lecturers, resources and governance. Until such time that public TVET colleges become quality institutions of first choice, a partnership approach to skills development between SETAs, certain selected TVET colleges and employers is more viable, with SETAs driving increased collaboration and quality assurance within TVET colleges, negotiating on their behalf with employers.
New additional university places available in 2013
42776Government set 2013 public university enrolment target of
935,712 students less actual enrolments in public universities in 2010
University students
986,559
College students
404,849
18 to 24-year-oldsNot in education, employment or training
2,781,185
Public 892,936
Private 93,623
Public 326,889
Private 77,960
FP&M SETA Sector Skills Plan for 2015-2020
39
A second challenge is that of success. Throughput and graduation rates across the PSET system remain poor. In 2013 the graduation rate for 2013 was 21 % for Masters students and 13% for Doctoral students (DHET, 2015).4
3.3. Supply in the FP&M sector
Both public and private universities and colleges supply education and training in FP&M sector. Higher-level skills such as engineers are predominantly trained at public universities and universities of technology. Degree and Diploma graduates include chemical, design, process, mechanical and electrical engineers as well as engineering technologists and technicians. HEIs also supply high-level management skills in Human Resources, Operations, Finance, Accounting and IT. Public, TVET colleges provide low to mid-level skills through the old Nated programmes and more recent occupational qualifications and to a lesser extent, through vocational programmes such as the NCV. The use of public TVET colleges in the FP&M sector has been limited to a few sub-sectors (clothing and textiles in the Western Cape and KZN) using a few, more functional TVET colleges. This has been largely due to resource and capacity constraints of TVETs and their poor reputation amongst industry. The bulk of large manufacturers have opted for private colleges as the chosen type of provision both on and off-site (FP&M SSP Focus Groups, 2015).
There is also a substantial amount of unaccredited training taking place in-house, on the factory floors of manufacturers of clothing and textiles, wood products, printing, paper and pulp, and leather goods. Existing employees and supervisors, using heavy machinery used in production processes, often carry out training on-site. Focus group interviews with employers in these sectors generated a number of key benefits associated with such training. For example, it was felt that such training beneficial in its flexibility to train based on real and changing needs. It did not require employees to leave the factory site and trainees could be trained on the machinery and equipment used in production. On-site training also created exposure to the realities of manufacturing and what it entailed to work on the factory floor (FP&M SSP Focus Groups, 2015).
In the White Paper on PSET it states that, “private institutions play a significant role in providing post-school education to South Africans” (DHET, 2013). SAQA data suggests that between 1991 and 2010, 537 362 students obtained qualifications from private, post-school institutions. The private sector has been able to fill the gap in mid-level skills in the economy that the public sector could not fill. The growth of the public TVET sector has been a nationally driven agenda. Emphasis has been placed on expanding the size and quality TVET colleges through better resource provisioning, infrastructure investment, lecturer capacity building and improved qualifications that are occupationally based. As such, “the government’s main thrust, therefore, should be to direct public resources primarily to meeting national priorities and to provide for the masses of young people and adult learners through public institutions” (DHET, 2013).
3.3.1. FP&M SETA funded programmes
SETA-funded learnerships, apprenticeships, skills programmes and bursaries are an important vehicle in the supply of E&T in the FP&M sector. These are presented in Table 10 below. The most popular course offered by FP&M SETA is the National Certificate: Clothing, Textiles, Footwear and Leather Manufacturing Process, followed by two national certificates in furniture making (SAQA ID 49091 at 12% and 49105 at 7%). Some courses, such as Knitting Machine Mechanician and the Technical Dyer-Finisher have only one student listed on the MIS system.
4 Graduation rates are calculated by dividing the number of graduates in a given academic year by the head count enrolments of
that year. These graduation rates function as indicators of what the throughput rates of cohorts of students are likely to be.

40
Table 10: FP&M SETA learner enrollment per course – 2011/12 to 2013/14
SAQA ID SAQA qualification Number of
learners enrolled
Percentage enrollment (%)
58227 National Certificate: Clothing, Textile, Footwear and Leather Manufacturing Processes
2665 42.94%
49091 National Certificate: Furniture Making: Wood 747 12.03%
49105 National Certificate: Furniture Making: Wood 442 7.12%
50584 General Education and Training Certificate: Clothing Manufacturing Processes 246 3.96%
49082 General Education and Training Certificate: Wood Products Processing 222 3.58%
11263 National Craft Diploma: Lithography (Paper Section) 216 3.48%
11271 National Craft Diploma: Rotary Offset Machine Minding 170 2.74%
50225 General Education and Training Certificate: General Forestry 169 2.72%
21489 National Certificate: Lumber Drying 168 2.71%
11243 National Craft Diploma: Electronic Origination 123 1.98%
11285 National Craft Certificate: Rotary Printing and Re-Reeling - Flexography 108 1.74%
66312 National Certificate: Lumber Milling 85 1.37%
11269 National Craft Diploma: Roll Label Machine Minding 75 1.21%
11313 National Craft Diploma: Bookbinding Mechanised/Cutting 73 1.18%
66269 General Education and Training Certificate: Lumber Milling 71 1.14%
11281 National Craft Diploma: Carton Making 68 1.10%
21493 National Certificate: Dry Lumber Processing 68 1.10%
11295 National Craft Certificate: Corrugated Board Printing and Finishing Machine Minding 61 0.98%
11291 National Craft Certificate: Corrugated Board Manufacturing Machine Minding 41 0.66%
11317 National Craft Certificate: Printers' Mechanic 34 0.55%
21494 National Certificate: Dry Lumber Processing 32 0.52%
50266 National Certificate: Forestry: Silviculture 32 0.52%
11301 National Craft Certificate: End Making 26 0.42%
11323 National Craft Certificate: Printers' Electrician 25 0.40%
11353 National Craft Diploma: Gravure Machine Minding 24 0.39%
11297 National Craft Diploma: Can Making 23 0.37%
11319 National Craft Certificate: Stationery and Envelope Machine Adjuster 23 0.37%
11347 National Craft Diploma: Continuous Stationery Machine Minding 23 0.37%
49083 National Certificate: Wood Products Processing: Wood Preservation 21 0.34%
11265 National Craft Diploma: Lithography (Metal Decorating) 18 0.29%
11277 National Craft Diploma: Bag Making 17 0.27%
11235 National Craft Diploma: Photo-gravure Cylinder Processing 14 0.23%
49079 National Certificate: Pulp and Paper Technology 11 0.18%
11287 National Craft Certificate: Rotary Printing and Re-Reeling – Gravure 10 0.16%
11309 National Craft Certificate: Bookbinding Craft/Cutting 8 0.13%
66329 National Certificate: Lumber Milling 8 0.13%
48988 National Certificate: Forestry: Timber Harvesting 7 0.11%
11275 National Craft Certificate: Screen Printing 6 0.10%
61104 Weaving Machine Mechanician - Rapier Loom 6 0.10%
58913 Lithography ( Metal Decorating) Dry Litho Monoblock 5 0.08%
11315 National Craft Diploma: Ruling/Cutting 3 0.05%
60833 Upholsterer 3 0.05%

FP&M SETA Sector Skills Plan for 2015-2020
41
SAQA ID SAQA qualification Number of
learners enrolled
Percentage enrollment (%)
11305 National Craft Certificate: Paper Sack Making 2 0.03%
21486 National Certificate: Saw Doctoring 2 0.03%
65651 National Certificate: Sewing Machine Mechanics 2 0.03%
21485 National Certificate: Saw Doctoring 1 0.02%
61100 Knitting Machine Mechanician (Weft) 1 0.02%
61129 Technical Dyer-Finisher 1 0.02%
61132 Weaving Preparation-Technical Controller 1 0.02%
Total 6207 100%
3.3.1.1. Learner Profile
The FP&M Seta conducted a detailed tracer study in 2014 on learners accessing their learnerships and apprenticeships. Figure 17 illustrates the results of this tracer study for learnerships. The profile of students enrolling for a learnership shows that students are mostly black South Africans under the age of 25. The gender ratio is 60:40 female to male, with most students completing their learnerships in Gauteng, KwaZulu-Natal or the Western Cape. Over 80% of learners on learnerships are studying towards national certificates applicable to the clothing, textiles, furniture and forestry sub-sectors. The percentage of unemployed learners on learnerships is 66%. Apprentices tend to be older and skewed towards males with a ratio of 12:88 women to men. Apprentices are more likely to be employed at the time of enrolment than learnership students (55% employed).

42
Figure 17: Learnership profile
FP&M Employer Tracer Study, 2014

FP&M SETA Sector Skills Plan for 2015-2020
43
Figure 18 illustrates results emerging from the tracer study for learners enrolled on SETA apprenticeships. The majority of apprenticeships are conducted in the Printing and Packing subsectors, with very few in Textiles and Clothing. Apprenticeships occur mostly in Gauteng, followed by the Western Cape, KwaZulu-Natal and Eastern Cape. Apprentices are usually older than learnership students. The split between employed and unemployed learners in apprenticeships is relatively equal. Apprenticeship learners are mostly black South Africans making up 46% of the total portion of learners. Other race groups are more likely to take part in apprenticeships than they are to study learnerships.
Figure 18: Apprenticeship profile
FP&M Employer Tracer Study, 2014
Bursary students are mostly black, female South Africans between the ages of 21 and 25, living in the Western Cape or Gauteng.
44
3.3.1.2. Completion rates
There were difficulties experienced in collecting data on completion rates for both learnerships and apprenticeships during the tracer study conducted in 2014. Despite such challenges existing MIS data (collected for the years 2010 to 2013) and data that emerged through the learner survey as part of the tracer study suggests that the completion rate ranges between 68 % and 80 % for learnerships. Completion rates for apprenticeships are at 30 % as indicated in the MIS data. The tracer study survey conducted with apprentices suggests a higher completion rate of 66 %. In other words, the rate of completion ranges from 30 % to 66 %. Overall, completion rates are substantially higher for learnerships than apprenticeships.
3.3.1.3. Alignment of skills to employer needs
The FP&M 2014 Tracer Study indicates the percentage of employers surveyed who do not offer any of the relevant training initiatives, as well as the main reasons claimed for failing to offer such training. Paper and Pulp, Printing, Print Media, Packaging, Publishing and General Goods’ employers cited a lack of relevant training as the main reason for not offering training. Whilst some employers may be unaware of available training options and how to access these, there are gaps in the provision of SETA-funded training courses in Publishing, Print Media and Leather. In addition, the type of training provided via learnerships and apprenticeships may not be suitable for many employers. The need for highly specialised skills in digital publishing, for example, cannot be appropriately addressed through an apprenticeship or learnership. This may require specialised skills programmes that address a specialised set of needs. In the same vain, the majority of employers in labour-intensive industries such as clothing and forestry emphasised the need for low-level skills through short-term, on-site skills programmes. Here, a large number of increasingly mobile workers are employed (with workers moving between sub-sectors), not suited to longer-term training. The overall plea by employers was to go back the basic-level training as the sustainability of their industry depended on it (FP&M SSP interviews, 2015).
A valuable assessment made by clothing manufacturers interviewed was that learnerships do not provide the skills set needed for working on a production line in the factory. A machinist sewing the odd garment requires a different set of sills to a machinist sewing for a production line (FP&M SSP interviews, 2015).
Figure 19 provides a summary of the relevancy of training offered to different sectors by summarising the number of learners per sector, the number of courses offered and the percentage contribution of each sector to levies. There are sub-sector discrepancies emerging. The Publishing sub-sector contributes 10% of SETA levy income yet is not serviced in terms of SETA-funded training programmes. The furniture sub-sector contributes 9% of levy income generated yet has access to five learnerships that are described as relevant to their skills needs.

FP&M SETA Sector Skills Plan for 2015-2020
45
Figure 19: Summary relevance of training to FP&M subsectors
FP&M Employer Tracer Study, 2014
3.3.1.4. Learner employability and wages post training
The impact of skills interventions such as learnerships and apprenticeships on learners may be measured according to the employability of these leaners and their wage increase post the intervention. There is a positive correlation between the percentage of learners who complete a learnership or apprenticeship and their employability. For example, in Table 11, the number of learners employed in clothing doubled to 70% after completion of the learnership (FP&M Employer Tracer study, 2014).
Table 11: Employment increase by sector (based on those who completed a learnership)
Clothing Forestry Furniture Textiles
Wood Products
Currently employed
70% 44% 26% 61% 31%
Employed at the start
35% 42% 10% 37% 7%
% Employment increase
35% 2% 16% 24% 24%
FP&M Employer Tracer Study, 2014
The FP&M Employer survey (2014) revealed similar correlations between the level of training that a learner has and their salary. The average salaries for trained learners differ across the sectors, with some higher
46
or lower than others. The salary of a trained leaner is, however, always higher than the minimum wage. For example, in Forestry, the minimum wage is around R2 420 per month, and a trained learner earns nearly double this (on average about R4 000 per month). Income is also dependent on job role, with machinery operators and drivers earning on average R5 128 per month, and clerical and admin workers earning similarly at R5 275. Labourers earn less, with an average salary of R3 686.
After completing the apprenticeship, employed individuals earn on average R9 810 per month. This is more than double the R4 345 that they earned on average per month prior to obtaining the formal apprenticeship qualification (FP&M Employer Survey, 2014)
3.3.1.5. Employer perceptions of learners post training
The survey conducted with employers during the 2014 tracer study indicated that 72% of employers rating learnerships agree that employees from a learnership show an improved attitude towards their work, such as a new pride in what they do. The rating rises to 82% for apprenticeships. Employers also described employees with a learnership or apprenticeship as having a positive effect on productivity (74% learnerships and 82% apprenticeships) (FP&M Employer Tracer Study, 2014).
3.3.2. Supply problems facing employers
The range of supply problems facing employers in the FP&M sector varies across sub-sectors.
Appropriate providers: some industries in pulp and paper, packaging and printing continue to have internal training facilities that cater for training needs. In many cases this is preferred as the machinery and equipment used to train on is large-scale, on the factory floor and cannot be moved. In other industries such as clothing and textiles regular, more formalised training previously provided by industry training boards has collapsed and become ad-hoc. The impact of this reduced training is beginning to be felt with a shortage of patternmakers, machinists and mechanics. Cut Make and Trim (CMT) businesses are particularly challenged by the fact that they cannot compete with larger manufacturers that have the resources to train themselves. In forestry the problem lies with getting the balance right between the technical skills and the teaching skills. This impacts on the quality of training. There are many fly by nights and huge disparities in the quality of training provision. In the past SAPPI and MONDI both had internal training programmes. Now, only Mondi has its own training facilities. The general consensus reached during focus group discussions was that TVET colleges either do not offer the appropriate training programmes needed in the sector (usually because they do not have the necessary equipment and expertise) or in cases where they are able to cater for education and training, the quality is questioned.
Flexible training: It is vital for manufacturers to meet the rapidly changing needs in the clothing sector. Flexible ways to respond and multi-skilled workforce is no longer a nice to have. This requires flexible training methods and approaches.
Type of training: A concern in the clothing sector is that UOTs tend to focus on longer-term, academic programmes in design as opposed to short-term skills programmes geared towards the manufacturing of garments. Another complaint in this sub-sector was that training has been reoriented towards high-level skills and the result was that the need for basic-level skills had been overlooked.

FP&M SETA Sector Skills Plan for 2015-2020
47
Releasing employees for training: Manufacturers find it difficult to find time for employees to be released for training due to tight production schedules.

48
3.4. Identification of scarce and critical skills
3.4.1. Scarce Skills
Scarce skills refer to occupations in which there is a shortage of qualified and experienced people due to unavailability of such people or because these people do not meet given employment criteria. Scarcity can be absolute or relative. Scarcity may arise due to absolute scarcity in which few people hold the necessary skills or qualifications (such as those required in a new or emerging occupation). These skills are either impossible to replace or extremely difficult to replace should they exit the sector. Absolute scarcity results in low growth and productivity of companies in the sector and the sector itself. Relative scarcity of skills pertains to skills that are difficult to attain due to geographic location, equity requirements or the lead-time on attaining the necessary skills. Table 12 outlines the scarce skills occupations across the sector.
The methodology used to derive at the top 10 scarce and critical skills outlined in Table 12 and Table 13 below was mixed methods using both quantitative and qualitative data collections methods. Data was first sourced from last year’s SSP and through the online employer survey. This data was then verified and updated during stakeholder interviews and focus groups.
Table 12: Top 10 scarce skills in the FP&M sector
OFO CODE SCARCE SKILL
715302 Machinist
214908 Materials engineering technologist
653301 Machine mechanic
214101 Process engineer
683401 Upholsterer
131102 Production/Operations manager
821501 Forester (forestry worker)
652204 Pattern maker
312201 Production/Operator supervisor
216603 Multi-media designer
Critical skills refer to “top-up” skills within an occupation. These can include cognitive skills, such as problem solving, language and literacy skills. These “top-up” skills can be specific to a particular occupation resulting in skills gaps, which might arise because of phenomena
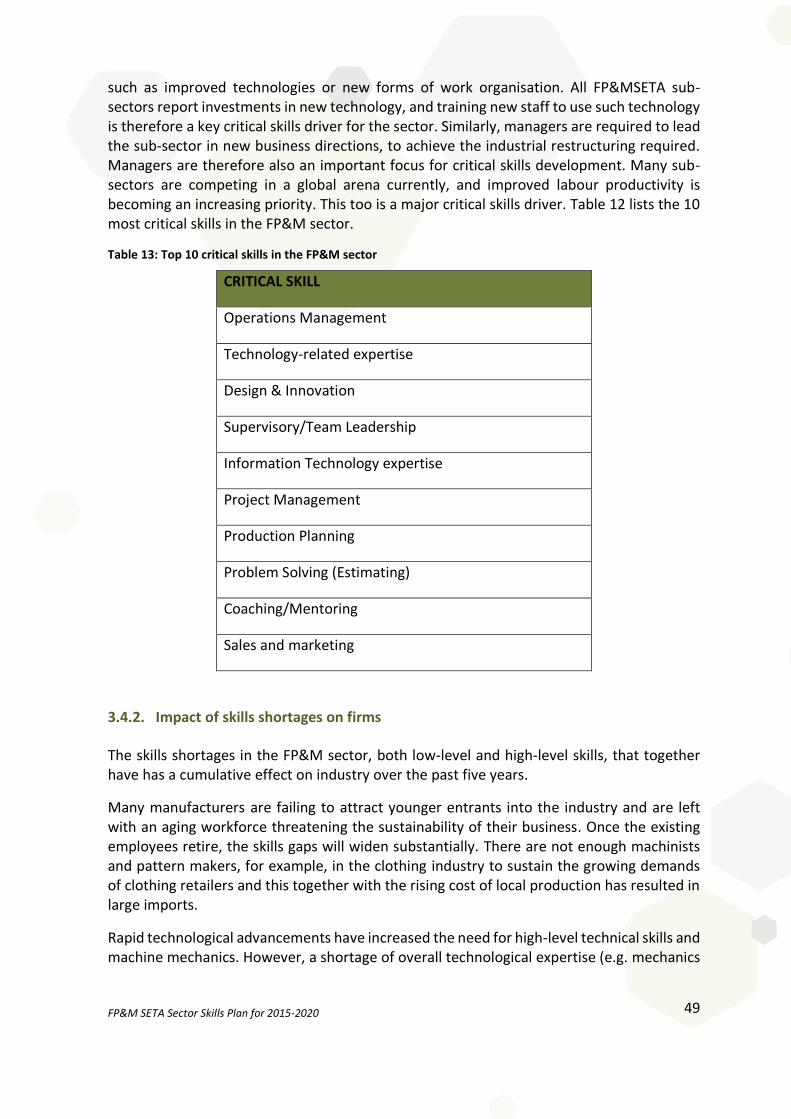
FP&M SETA Sector Skills Plan for 2015-2020
49
such as improved technologies or new forms of work organisation. All FP&MSETA sub-sectors report investments in new technology, and training new staff to use such technology is therefore a key critical skills driver for the sector. Similarly, managers are required to lead the sub-sector in new business directions, to achieve the industrial restructuring required. Managers are therefore also an important focus for critical skills development. Many sub-sectors are competing in a global arena currently, and improved labour productivity is becoming an increasing priority. This too is a major critical skills driver. Table 12 lists the 10 most critical skills in the FP&M sector.
Table 13: Top 10 critical skills in the FP&M sector
CRITICAL SKILL
Operations Management
Technology-related expertise
Design & Innovation
Supervisory/Team Leadership
Information Technology expertise
Project Management
Production Planning
Problem Solving (Estimating)
Coaching/Mentoring
Sales and marketing
3.4.2. Impact of skills shortages on firms
The skills shortages in the FP&M sector, both low-level and high-level skills, that together have has a cumulative effect on industry over the past five years.
Many manufacturers are failing to attract younger entrants into the industry and are left with an aging workforce threatening the sustainability of their business. Once the existing employees retire, the skills gaps will widen substantially. There are not enough machinists and pattern makers, for example, in the clothing industry to sustain the growing demands of clothing retailers and this together with the rising cost of local production has resulted in large imports.
Rapid technological advancements have increased the need for high-level technical skills and machine mechanics. However, a shortage of overall technological expertise (e.g. mechanics
50
and machinists) has meant that skills have had to be brought into the country from elsewhere to maintain and repair machinery and train employees on how to use them.
In some sub-sectors, such as clothing and textiles, basic-level skills training for patternmakers, cutters and machinists has succumbed to a heightened focus on design-type skills. The result has been growing skills gaps at lower skills levels, negatively affecting clothing and textiles manufacturing. Although higher level skills such as design are important for the growth of the local clothing and textiles industry that is targeting a high quality, niche market, the potential for generating large numbers jobs lies primarily with manufacturing and this require large numbers of low-level skills in addition to smaller numbers of high-level skills.
There are not enough mentors and potential trainers in the FP&M sector that can mentor and train on the factory floor. The result has been that many FP&M employers have opted for informal, unaccredited skills training using existing, more experienced employees and supervisors. A challenge faced is that only small numbers of employees can be trained and or up skilled in this way.
3.5. Conclusion
Employers in the FP&M sector experience a range of occupational challenges. Many manufacturing companies in clothing and textiles struggle to fill elementary positions such as pattern makers, cutters and machinists. At the same time, these companies find it difficult to source mid-high level, technical skills such as plant and machine operators, machine mechanics, technologists and technicians particularly due to mechanisation and changing technologies. Employers in print media and publishing struggle to fill professional occupations such as editing, digital publishing, translation and design. Reasons cited for these difficulties include an aging workforce, manufacturing occupations perceived as less lucrative than retail occupations, less attractive salaries, rapidly changing industry trends creating further productivity pressures, technological advancement requiring constant skills upgrading, the need for multi-level, flexible skills and underprepared graduates. Both public and private universities and colleges supply education and training in FP&M sector. Higher-level skills such as engineers are predominantly trained at public universities and universities of technology. Public, TVET colleges provide low to mid-level skills through the old Nated programmes and more recent occupational qualifications and to a lesser extent, through vocational programmes such as the NCV. The use of public TVETs in the FP&M sector has been limited to a few sub-sectors (clothing and textiles in the Western Cape and KZN) using a few, more functional TVET colleges. This has been largely due to resource and capacity constraints of TVET colleges and their poor reputation amongst industry. The bulk of large manufacturers have opted for private colleges as the chosen type of provision both on and off-site (SSP Focus Groups, 2015). There is also a substantial amount of unaccredited training taking place in-house, on the factory floors of manufacturers of clothing and textiles, wood products, printing, paper and pulp, and leather goods. Existing employees and supervisors, using heavy machinery used in production processes, often carry out training on-site.
SETA-funded learnerships, apprenticeships, skills programmes and bursaries are an important vehicle in the supply of E&T in the FP&M sector. Over 80% of learners on
FP&M SETA Sector Skills Plan for 2015-2020
51
learnerships are studying towards national certificates applicable to the clothing, textiles, furniture and forestry sub-sectors. The majority of apprenticeships are conducted in the Printing and Packing subsectors, with very few in Textiles and Clothing. Apprenticeships occur mostly in Gauteng, followed by the Western Cape, KwaZulu-Natal and Eastern Cape. Overall, completion rates are substantially higher for learnerships than apprenticeships. The FP&M Employer Tracer Study of 2014 indicates a positive correlation between the percentage of learners who complete a learnership or apprenticeship and their employability. Employers also felt that both work ethic and employee productivity improved post the learnership or apprenticeship.
Supply-side challenges are varied. Employers interviewed complained about the availability of suitable training providers. Many were restricted to informal, on-site training due to heavy machinery and equipment on the factory floor. In clothing, the collapse of the training boards has resulted in irregular, ad-hoc training on-site training resulting in shortages amongst patternmakers, cutters and machinists. TVET colleges are utilised for training in clothing-related occupations in the Western Cape and KZN, although this was not the case in Johannesburg. There is also a shortage of trainers and mentors across the sector. Production pressures have brought about the need for flexible training methods. A variety of training programmes ranging from long-term diplomas and degrees to short-term, skills programmes is a must especially in light of tight production schedules. Finally, a number of employers in clothing and textiles called for the need to include elementary, basic-level training in addition to high-level, design-type training.

52
CHAPTER 4: SECTOR PARTNERSHIPS
4.1 Introduction
The purpose of this chapter is to assess the effectiveness of existing FP&M SETA partnerships, with particular reference to the TVET College partnerships. The chapter identifies challenges to maintaining and creating partnerships and propose measures for strategic deepening of the TVET partnerships.
Partnership development is a key enabler to addressing the mission of the FP&M SETA. The FP&M SETA’s mission is to:
“To establish a credible institutional mechanism that facilitates an efficient and effective skills development process, through a range of quality services and partnerships, to contribute to the achievement of sector competitiveness, transformation and economic growth.”
At a policy level, much emphasis has been placed in the White Paper on Post School Education and Training on the importance of partnerships between SETAs, public TVET colleges and industry. Strategic partnerships have enabled the FP&M SETA to make a positive impact in areas of rural development, disability, poverty alleviation, gender transformation and youth development through meaningful skills development initiatives. The enabling of work integrated learning through partnerships with industry has increased the scarce and critical skills pool and created opportunities for unemployed graduates.
4.2 Existing FP&M Partnerships
This section explores the type and value of key, SETA partnerships in the FP&M sector. Specific attention is placed on those that involve public TVET colleges both directly and indirectly.
The FP&M SETA has a variety of partnerships with stakeholders in the sector. These include partnerships that relate to: i) the development of new qualifications; ii) boosting research outputs in the sector; iii) the development of SMMEs; iv) creating skills development centres of excellence and; v) the placement of graduates through internships, work experience and work integrated learning programmes. Each of these partnership types reflect the FP&M SETAs commitment to high-impact partnerships in strategic areas of need, closely aligned to national development imperatives in the White Paper on Post-School Education and Training, NSDS III, IPAP, NGP and NDP. This alone has attracted the support of high-level stakeholders both across government (e.g. the DHET, DTI) and within industry and their enhanced commitment towards public-institutions and community-based initiatives.
Qualifications development
The FP&M SETA has cultivated a close working relationship with the Quality Council for Trades and Occupations (QCTO) and stakeholder organisations to mutually work towards the development of qualifications within in our sub-sectors. This is a supply side partnership that has led to development of approximately 54 occupationally directed qualifications for 10 industrial sub-sectors (clothing, textiles, footwear, leather, forestry, pulp and paper,

FP&M SETA Sector Skills Plan for 2015-2020
53
printing, publishing. packaging, furniture, wood products). These are all aligned to QCTO requirements, new technologies and industry performance standards. These qualifications are intended to improve the competitiveness of the sector at a local and national level and form part of a national effort to align qualifications to specific occupations, combine theory and practical training and improve the relevance and quality of education and training. Some of these qualifications will be provided at TVET colleges. The FP&M SETA is continuously working towards the development of its sub-sectors and has thus maintained a mutually beneficial partnership with the QCTO.
Research and innovation
One of the key partnerships the FP&M SETA has embarked on is the Research Chair partnership with the University of Witwatersrand’s Centre for Researching Education and Labour (REAL) that will guide research in the sector over the next three years. One of the key deliverables of this initiative is to undertake the international comparability of 13 FP&M SETA sub-sectors and understand their global context, looking at the industrial structure of the global value chain and the successful industrial strategies implemented worldwide in the sector. The model adopted by the Research Chair at Wits University is to take a group of post-graduate students through a full dissertation route in the new inter-disciplinary field Sectors and Skills. The SETA has committed to an initial 3-year cycle of support. Research production and post-graduate training is emphasised in the White Paper on Post-School Education and Training, the NDP and the DST’s 10 Year Innovation Plan for the country. There is a direct relationship between the number of doctorates produced in a country and its improved Human Development Index and economic development. The FP&M SETA has acknowledged this relationship and the contribution of quality research to the economic success of the sector. This is reflected through its increased support for research partnerships that are larger and longer-term.
SMME development
The FP&M SETA has partnered with a number of clothing SMME clusters with a view to align with the DTI “industrial clustering” strategy to address industry and economic growth. The programme has created partnerships with over 50 companies the Western Cape and 40 companies in KwaZulu-Natal as beneficiaries of this programme aimed at the development of SMMEs. The programme is working towards improving the capability and sustainability of SMMEs. Training is focused on three key areas: world class manufacturing, technical skills development and management development and funding support is provided in the form of bursaries and grants. The development of SMMEs has been prioritised in national development agenda of the country, because of its ability to generate jobs and reduce poverty.
Community-based skills development
The Richmond-Indaleni Community Skills Centre is an initiative between FP&M SETA, Umgungundlovu TVET College and the Ministry of Higher Education and Training. The FP&M Board has allocated in excess of R25 million Rand towards the establishment of the skills centre. The centre will provide technical training and entrepreneurial skills under the

54
auspices of the TVET College. Almost half of the total value of the project will be spent on training interventions identified by the community in order to increase the employability and potential entrepreneurship opportunities for the unemployed youth living in the area. The Skills Centre will be accredited by the FP&M SETA’s Quality Assurance Division to implement the following FP&M SETA programmes:
Garment Construction
Furniture Making / Cabinet Making
Silviculture
Pest Control
Tree Felling & Timber Production
Footwear Hand Lacing
Other SETAs are to be approached to extend the scope of training of the Skills Centre to include additional technical and other training in Agriculture, Engineering related trades and Hospitality.
The project is still in the start-up phase and its success cannot be measured at this stage. The FP&M SETA has been successful in bringing together multiple stakeholders at both local and national level and in allocating a huge pool of resources and funding towards establishing the skills centre. The inclusion of other SETAs is likely to generate further skills development and benefits across the value chain.
Business skills and leadership development
The International Leadership Development Programme (ILDP) is a high level skills programme pitched at NQF level 7/8 and is specifically intended to give opportunities to previously disadvantaged individuals to acquire business leadership skills across the FP&M sector and to address transformation in the sector. It is anticipated that this programmes will provide the sector with potential leaders that have a grasp of the technical side as well as the business side. They need not necessarily come only from manufacturing. A budget of R8, 1 million has been set aside for this programme during the reporting period for implementation in the new financial year. The ILDP is expected to provide cutting-edge knowledge, best practices and trends in leadership, innovation and entrepreneurship, by visiting influential institutions and engaging established leaders in the USA and South Africa. The ILDP programme is aimed at creating and or enhancing the number and quality of BBBEE leaders (from previously disadvantaged backgrounds) at senior levels within industry, thereby improving equity at the higher levels of management and leadership that are more influential. Association for Independent Publishers (AIP) and Media24
The FP&M SETA, Media24 and the Association of Independent Publishers (AIP) have partnered to develop a digital training programme that will form part of Media24’s ongoing investment in skills development for independent publishers and is central to the company’s initiative to actualise the recommendations of the Print and Digital Media Transformation Task Team (PDMTTT) (Media 24, 2015). The training programme is funded and accredited by

FP&M SETA Sector Skills Plan for 2015-2020
55
the FP&M SETA with over 200 beneficiaries all of which are members of AIP who run their own newspapers in townships, small towns and rural areas across South Africa. Training focussed on assisting smaller publishers to make the transition from pure print products to digital products and the whole online world. The publishing and newspaper industry is rapidly evolving, resulting in major changes to its publishing strategy, such as electronic publishing, including the digital publication of e-books, digital magazines, and the development of digital libraries and catalogues. Such projects provides community publishers with intermediate and high level digital newspaper layout and design by developing their own websites and mobile sites. One of the key learnings of this project is on what is involved in building small publishers towards active participation in the digital economy, which demands a baseline of understanding. Small publishers require a change in mindset to become more adaptive to different platforms, and to break down uncertainties around delivery of digital content and jargon busting. Small publishers learn to work within this basic level to know how to create content for different platforms, hence Writing for Online and Mobile is crucial. This project has enabled the development of new partnerships within the media sector across old divisions between the mainstream media and small, independent publishers based in townships, small towns and rural areas. Graduate placement
The partnership between FP&M SETA and the South African Graduates Development Association is a R30 million Rand project facilitating the placement of approximately 857 University and TVET College Graduates on internships, work experience and work integrated learning programmes. Central to the partnership is the recognition that graduates exposed to professional environments are better placed to find employment. Host employers from a number of sub-sectors included Foschini, Green Cross, Teardrop Media, Avusa Publishing, Mocobo Communications, Times Media, Aranda Textiles, Adcock Ingram, Nemisa, Ndimase Trading, and City of Johannesburg.
One of the weaknesses of the education and training system in recent years has been the lack of work integrated learning and work experience as part of the programmes targeted at meeting the training needs of sector occupations in demand. Many providers have failed to integrate theory and practical experience into their curricula and many learners and graduates have not been provided with adequate opportunity to gain practical and work experience in industry resulting in these learners not being able to qualify and graduates not being able to find employment. The graduate placement programme will touch the lives of learners and graduates such as these through its partnerships formed with key industry players across various FP&M sub-sectors.
TVET partnerships
The FP&M SETA has to date accredited 21 TVET colleges providing occupationally directed programmes. In 2014/15 the SETA committed approximately R32 million towards TVET partnership projects. Due to the implementation of the LEAD-SETA TVET project, TVET colleges including South Cape Public TVET College, College of Cape Town and False Bay TVET College now have SETA offices on campus. This will assist in facilitating the rollout of SETA-initiated programmes in partnership with public TVET Colleges. The Furniture Skills Development Initiative in Khayelitsha in the Western Cape is a partnership between FP&M

56
SETA and False Bay TVET College providing furniture and cabinet making learnerships for 60 unemployed learners.
TVET partnerships like these contribute to enhancing the role of public TVET colleges in the education and training system and provide programmes relating to key occupations needed in the system. Public TVET colleges are located across the country, close to communities in need of skills development, education and training. Partnerships such as these will improve the quality of programmes offered by these colleges and will target skills needs within these communities and the greater economy. Expanded access across the post-school education and training (PSET) system is dependent on expanding quality provision at TVET colleges. SETAs are well placed to offer increased support to the public TVET system and their contribution to the occupational skills needs of the country.
A challenge is to link public TVET colleges with industry as part of a capacity-building agenda for colleges. Presently, a strongly held view amongst industry is that unless the capacity of TVET colleges is strengthened and the levels of bureaucracy are substantially reduced, industry cannot commit to working with dysfunctional TVET colleges. In the clothing industry in Gauteng, training provision is limited to informal, on-site training by industry itself. In some cases employees have to be sent to KZN for training, as there is no adequate provision in Gauteng. Another constraint is the type of training provided at TVET colleges. Garment making courses for example do not train students in the technical and production skills aligned to industry performance standards of a clothing production line. The development of effective partnerships with TVET colleges rests on the ability of FP&M SETA to broker partnerships between more functional TVET colleges and industry, as part of the joint-process of rolling out SETA-initiated programmes based on real skills needs.
4.3 New Partnerships
It is the mission of the FP&M SETA to establish a range of quality services and partnerships that facilitates an efficient and effective skills development process, which will contribute to achievement of sector competitiveness, transformation and economic growth. New partnerships are critical to invigorate growth of the sector. The FP&M SETA is currently in the advanced planning phase of initiating the following new partnerships:
SEDA
Key to the sectors industrial growth strategy, SMME development must be facilitated in a structured manner that would result in the establishment of new business enterprises registered with the Small Enterprise Development Agency (SEDA) and more new and quality jobs being created. The sector’s growth nodal areas lie in the development, support and promotion of small enterprises in the sector. Given the funding constraints of the FP&M SETA, opportunities exist for the SETA to develop collaboration projects with SEDA that can be co-funded to promote business entrepreneurship within the sector.
National Youth Development Agency (NYDA)

FP&M SETA Sector Skills Plan for 2015-2020
57
In order to address the MTEF priority of addressing youth unemployment, a strategic partnership with the National Youth Development Agency (NYDA) must be established. Targeted projects to address youth unemployment and the placement of unemployed graduates will further the objectives of the skills development mandate of the FP&M sector.
Provincial Government Linkages
Government and sector stakeholders recognize that certain industrial and economic sectors are vulnerable and the need for growth, employment and competitiveness through implementation of joint collaboration projects to address specific interventions aligned to key provincial and industrial strategies is key to secure its future sustainability and growth. The FP&M sector must have a footprint in all 9 provinces nationally in order to facilitate opportunities to establish collaboration projects and donor funding to address the scarce and critical skills needs of the sector.
4.4 Challenges Encountered with Partnerships
The implementation of high-level partnerships and continued commitment from stakeholders, particularly industry, has contributed to the success and sustainability of these partnerships. Challenges experienced in establishing and sustaining large-scale, high impact partnerships are briefly discussed below:
Limited Project Management Skills
The sustained management of large scale partnerships between two institutions that function differently is a limited skill within the SETAs. Challenges that arise in such partnerships are often linked to the smooth management of the project from a financial and reporting perspective.
Lack of Initiative from TVET colleges
The development of partnerships is also hindered by the inability of TVET colleges to initiate such partnerships through proactive engagement with SETAs and industry stakeholders. In such cases it is left to the SETAs to step in and broker the partnership. That said, unless all parties come to the party, the development and lifespan of the partnership is cut short.
Bureaucratic Delays
One of the main challenges faced in the partnership initiation phases is the long process of contracting, procurement that needs to consider regulations that govern the SETAs and equally those that govern the institution that the SETA is partnering with. These can be off putting particularly in new ventures that bring together potentially successful partnerships but which can fail when they face legislative or related bureaucratic challenges.
Risk of Slow Delivery
The slow delivery of outputs is a risk that is taken by SETAs each time it initiates partnerships, particularly with TVETs. Often times TVETs colleges that stand to benefit the most from the formation of partnerships with the SETAs are those with very limited resource to fully participate in the partnership. A number of the TVET colleges that the FP&M SETA has

58
partnerships with are located in rural areas thus limiting their administrative and electronic communication resources that are necessary for a successful and sustainable partnership.
4.5 Best Practice for Effective Partnerships
As a young organisation, the FP&M SETA has reviewed its current business operation and structures and identified the following overall need that are addressed under its new business model:
People and Structure
Based on the business review, it is imperative to improve the performance of staff members through internal training on good project management practices, regular monitoring and evaluation of project, and timeous delivery for more successful partnerships.
Technology
Cumbersome manual processes are tedious and time wasting. The implementation of Management Information Systems and new technology will assist in streamlining business processes.
Policies and Business Process
There is a need for simplified policies and process that encourage efficiency and create effective business operations.
The New Business Model is thus a newly implemented business tool that presents what is the for the FP&M SETA the best practice principles that allow for strengthening of the SETA’s partnerships as well optimising its service delivery capacity.
4.6 Conclusion
The NSDS III places great importance of the formation of partnerships and collective responsibility between government, public bodies, employers, business organisations, public and private training providers and SETAs.
This chapter presented the FP&M SETA’s key existing partnerships, reflecting the SETAs commitment for forming strategic partnerships towards skills development.

FP&M SETA Sector Skills Plan for 2015-2020
59
CHAPTER 5: SKILLS PRIORITY ACTIONS
5.1. Introduction
This chapter summarises the key findings that have emerged through the various chapters of this 2015 SSP. These are used to develop a set of skills priority actions for the FP&M Seta and FP&M sector. The skills priority actions will feed directly into the strategic plan of the Seta.
5.2. Key findings from previous chapters
5.2.1. Contribution of the FP&M sector to the economic growth and development
Output in the FP&M sector has tended to follow that in the wider manufacturing sector and the economy as a whole. Economic decline in 2008/9 was a feature of the global economic crisis. This led to some recovery over 2009/10. Since 2010 growth in the sector, albeit with occasional cyclical upswings, has stagnated, mirroring that of output across the economy. Exports followed a similar trajectory, declining substantially between 2004 and 2014. The only sub-sector that had an “up-turn” in exports since 2012 is Paper and Paper Products. Imports, on the contrary, have increased dramatically in all sub-sectors since 2000, with the exception of the Printing, Publishing and Recorded Media sub-sectors. The total value of imports for the Clothing sub-sector has doubled from about R6 billion Rand in 2004 to almost R13 billion Rand in 2014. There are approximately 324 642 people employed in the FP&M sector (Quantec, 2015). This is about a quarter of the employed in the entire manufacturing sector and 2, 1% of employment in the total economy. The sector experienced a 27% decline in employment between 2004 and 2014, a total job loss of 121 000. The FP&M sector has value chain linkages with other sectors based on the exchange and feeder relationships between primary and secondary production during manufacturing, and with the tertiary sector in the marketing and sale of produced goods. A value chain approach to profiling and analysing the sector exposes holistic and integrated opportunities for sector development. For example it is evident where the major challenges are in relation to the processing of primary products into secondary products and the need for interventions to beneficiate and produce domestically what is currently being exported. Equally it is clear that there are opportunities to produce in more environmentally sustainable ways and to make use of waste produced at different points in the value chain – for example the huge amount of paper produced and discarded is a clear opportunity for recycling.
An expanded focus on beneficiation is covered in all key national policies and strategies and will add value to unprocessed goods boosting our competitive edge in key markets such as exotic leather goods and cashmere products. Beneficiation necessitates skills development across value chains both within and between sectors. There are new technologies being developed in textiles and clothing and new natural fibres are being explored. Existing technology used throughout the sector in manufacturing companies in packaging, printing and print media, paper and pulp, textiles, clothing are now
60
designed to operate faster and more efficiently. Training on new machinery and maintenance is often sourced internationally. Increased mechanisation may reduce the demand for labour. At the same time technological changes are the biggest drivers of skills demand, as workers have to continuously upgrade their skills to keep up. Electronic media usage has expanded and is expected to change the face of the printing and publishing sub-sectors. Social media provides an additional source of valuable consumer data. Both national (IPAP & NDP) and sector-based industrial strategies are driving technological advancement and innovation through customised sector programmes and other initiatives. Environmental sustainability through reductions in carbon emissions and waste and more efficient fuel consumption has become and is likely to continue to be a key driver of change in the sector. There is a growing need for higher-level knowledge and skills linked to developing and using green technologies and, increased research on more sustainable means of production. Skills development must cater for such needs as well as the necessary ethical training required for developing an environmentally conscious workforce.
5.2.2. Demand-side challenges
Many manufacturing companies in clothing and textiles struggle to fill elementary positions such as pattern makers, cutters and machinists. At the same time, these companies find it difficult to source mid-high level, technical skills such as plant and machine operators, machine mechanics, technologists and technicians particularly due to mechanisation and changing technologies. Employers in print media and publishing struggle to fill professional occupations such as editing, digital publishing, translation and design.
5.2.3. Supply-side challenges
The use of public TVETs in the FP&M sector has been limited to a few sub-sectors (clothing and textiles in the Western Cape and KZN) using a few, more functional TVET colleges. This has been largely due to resource and capacity constraints of TVET colleges and their poor reputation amongst industry. The bulk of large manufacturers have opted for private colleges as the chosen type of provision both on and off-site (SSP Focus Groups, 2015). There is also a substantial amount of unaccredited training taking place in-house. There is a shortage of trainers and mentors across the sector. Long-term training programmes are not always suitable for manufacturers with tight production schedules. Many employers expressed a need for basic level training in elementary positions.
SETA-funded learnerships, apprenticeships, skills programmes and bursaries are another important vehicle in the supply of E&T. Over 80% of learners on learnerships are studying towards national certificates applicable to the clothing, textiles, furniture and forestry sub-sectors. The majority of apprenticeships are conducted in the Printing and Packing subsectors, with very few in Textiles and Clothing. That said, there are gaps in SETA training provision. For example, there are no qualifications offered for learners in the publishing sub-sector.
Africans represent 59.9% of employees in the industry. However, the least proportion of Africans is employed in the publishing sub-sector (26%), dominated by the White population

FP&M SETA Sector Skills Plan for 2015-2020
61
group, where salaries commanded are the highest in the sector. SETA training needs to factor in equity profile targets in higher level professions such as publishing. Females represent 53% of employees within the sector, whilst males represent 47% of the sector’s employees. The highest proportion of the workforce is employed in elementary occupations (31%) followed by Plant and Machine Operators and Assemblers (29%), resulting in low average wages across most sub-sectors.
5.2.4. Partnerships
The FP&M SETA has a variety of partnerships with stakeholders in the sector linked to the development of new qualifications; boosting research outputs in the sector; developing SMMEs; creating skills development centres of excellence and placing graduates through internships, work experience and work integrated learning programmes. In 2014/15 the SETA committed approximately R32 million towards TVET partnership projects. South Cape Public TVET College, College of Cape Town and False Bay TVET College now have SETA offices on campus. This will assist in facilitating the rollout of SETA-initiated programmes in partnership with public TVET Colleges. The Furniture Skills Development Initiative in Khayelitsha is a partnership between FP&M SETA and False Bay TVET College providing furniture and cabinet making learnerships for 60 unemployed learners.
Opportunities exist for the SETA to develop collaboration projects with SEDA that can be co-funded to promote business entrepreneurship within the sector. Partnerships in small business development with the NYDA are being explored. There are also joint-collaboration projects that may be set up in partnership with provincial governments.
Challenges experienced in establishing and sustaining large-scale, high impact partnerships include limited project management skills within the SETA to manage different types of organisations (for example universities, individuals, consultants etc.), the inability of TVET colleges to initiate partnerships, bureaucratic delays in the partnerships initiation phase of the SETA, and, the slow delivery of outputs in partnerships established with weaker TVET colleges.
5.3. Key priority actions
5.3.1. Expanding the economic contribution of the FP&M sector
Adopting a value-chain approach
Earlier chapters have alluded to the importance of a value-chain approach for boosting economic development and competitiveness. This approach requires increased interaction between the FP&M SETA and other SETAs involved in skills development across the value chain.

62
Incorporating skills development into the cluster model
Globally there have been success stories linked to the establishment of clusters (or economic zones/hubs) linked to specific industries. The cluster model values intra-firm cooperation, resource sharing, innovation spread, risk sharing and the benefits of Economies of Scale thereby promoting collective efficiency through such interactions. There are a number of initiatives already in place such as the furniture clusters in KZN, WC and Gauteng and the clothing and textiles cluster in the Western Cape and KZN. The SETA has an important role in supporting stakeholders and ensuring that such initiatives include a strong focus on skills development. In countries such as Finland where clusters have been developed structures similar to SETAs have a presence within the clusters, as do public tertiary and higher education institutions. Similar models can be explored for FP&M sector clusters.
Expanding industry competitiveness and exports
There is a window of opportunity opened up as a result of the weakness of the Rand. Imports will cost more and exporting could become more profitable. However creating new production capacity is not a simple matter as it implies planning beyond the traditional scope of current industries, and projecting skills needs not on the basis of current production but future potential production processes. If South African based companies are to compete globally (particularly in markets dominated by Chinese or other Asian countries) success will only be achieved through a significant improvement in labour productivity. Skills development for productivity improvement is thus an area that the FP&M SETA must give urgent attention to, including training in the use of future technologies and production methods. Equally there is a need to reduce the reliance on imported machinery: The printing and packaging sub-sectors are rapidly evolving, with major changes ranging from electronic origination and digital printing through to environmentally friendly packaging. However it will rely on imported machinery unless a strategy is put in place to develop local production of equipment. This challenge will require discussions between FP&M sector stakeholders and stakeholders in the metal industry manufacturing sector, as well as the Department of Science and Technology and DTI. The need to beneficiate primary produce is a key imperative for expanding exports competitiveness in the sector in niche markets.
Contributing to SIPS
The SETA has an important role to play in assisting stakeholders to combine and align their interests and achieve synergies between different strategies and programmes. Through the establishment of Occupational Teams, that bring together employers, training providers, professional bodies and other key stakeholders such as trade testers and license issuers, it is anticipated that there will be better alignment between the theoretical knowledge in the curricula of E&T institutions and practical learning in the workplace and that work placement will improve. The FP&M SETA has an opportunity to play a key facilitation role in the establishment and work of these Occupational Teams.
FP&M SETA Sector Skills Plan for 2015-2020
63
Training for technology-driven production
The technological drivers of change are challenging in most FPM sub-sectors. It will be important to develop skills development solutions to address emerging technologies, particularly where globally such production methods are resulting in increased productivity. Computerization has changed the FP&M sub-sector considerably in recent years and further innovations can be expected. Again this points to the need for research so that technological change can be planned and not take the sector by surprise. Those employees whose jobs will change due to application of modern production methods must be provided with the opportunity to learn these new production methods, and thereby not just retain their jobs but to go on to occupy more highly skilled and better paid jobs. Technology should be seen as an advantage but can only be seen as such if the people affected are able to be trained in its use. The rapid growth of social media has potential for assisting the sector. It will be important to leverage advantage for the FP&M sector and its sub-sectors, and also on the way that the SETA conducts its work. There is also potential for expanding eLearning within the sector. Industrial strategies within the sector should incorporate the development of local production of equipment and machinery. Initially, this may be at the level of developing local skills for maintaining imported equipment and machinery; and training trainers on use of new machinery and equipment. The production of local machinery and equipment must be investigated by the sector through well-researched cost-benefit analyses.
Growing quality SMMEs and cooperatives
There should be more support to the development of skills within SMMEs, including micro and emerging enterprises and cooperatives. This is not just a concern expressed by small businesses. Many of the larger organisations are of the opinion that there are excellent SMMEs that could provide them with products but that the development of skills within those SMMEs are not at a standard that makes them competitively marketable. There are many causes of small enterprises not benefiting from opportunities and skills are needed to address many of them. However it is difficult for small businesses to engage in training, and to develop capacity to do many things with few people. Training opportunities need to be structured in a manner that enables them to participate and take their organisations to new levels. One of the main complaints of small businesses is the complexity of engaging in them. Mechanisms must be found to enable greater participation. The creation of industry-specific incubators that include skills development as a central pillar, may be one approach to providing support to small and micro enterprises and improving their sustainability. Cooperatives in the sector must become part of the mainstream economy. Their sustainability should depend on what they produce rather than grants from the state. The FP&M SETA can contribute to technical up-skilling of cooperative members and the provision of business skills needed to effectively establish and run the cooperative. Business related skills may include business planning, negotiating contracts and establishing links with the market. The establishment of secondary cooperatives whose responsibility it is to provide
64
such business services, is an alternative approach and the SETA may need to assist such structures as well as the primary cooperatives. Secondary cooperative structures require a set of specialised, business skills whilst primary cooperatives are generally responsible for production.
The development of viable and sustainable cooperatives at both the primary and secondary level may be used as a vehicle for creating jobs, boosting skills and developing linkages across the value chain. This requires an integrated model that provides skills training and support along the value chain and multi-stakeholder collaboration between the province, municipalities, SETAs, DTI, Innovation Hub, the CSIR and large employers with the capacity to train and support such entities.
Promoting environmental sustainability
There is a need for a concerted approach to natural resource management including protection of scarce resources such as water, soil and marine life and the management of ecosystems, and generally improved risk management. Climate change will need to be monitored and managed and early warning systems developed. Research and the promotion of alternative production methods is envisaged as well as improved regulations and enforcement. There are significant opportunities for green production and other contributions to environmental sustainability. These need to be researched, explained, developed as projects and provided with skills development support. The sector can make a contribution in relation to the control of carbon emissions. There is potential for carbon sequestration in plantations to be recognised, as this can then be used to off-set carbon emissions in the sector and at the same time will assist in promotion of planting trees in community land. This will empower communities and lead to further economic development. There are opportunities for recycling and the emergence of small business to take on some of this work. The SETA will support training of such enterprises as they emerge.
5.3.2. Addressing demand-side challenges
Many scarce skills occupations such as machinists and machine mechanics have an aging workforce. This represents a threat not only because it may not be possible to replace the employees easily, but also because the older employees hold institutional memory regarding the development of the subsector which should not be lost. FP&M SETA will need to identify the scarce skills occupations where the skills may be lost due to retirement, and design interventions to address the challenges. This could include encouraging succession planning linked to internships, supported by quality coaching and mentoring. Incentives could be provided and recognition given to those who are prepared to share their knowledge and experience with others, through an awards scheme. Various strategies are being used to retain experienced people in different capacities linked to skills transfer and these should be supported and encouraged.

FP&M SETA Sector Skills Plan for 2015-2020
65
5.3.3. Addressing supply-side challenges
Creating a multi-skilled workforce (technical & managerial)
Changing demands by industry and consumers solidifies the need for workers and managers to be multi-skilled. That said, basic skills training must not be overlooked. The sustainability of the clothing industry in Johannesburg, for example, is dependent on producing basic level, technical skills such as machinists, pattern makers and cutters. A differentiated approach to skills development in the clothing and textiles sub-sector is required that takes cognisance of differing skills needs within the industry.
Developing existing and new employees
The core strategic challenge facing skills development in the sector is where to concentrate resources in ways that will best support the sub-sector to achieve the inclusive growth paths envisaged under the various industrial strategies. If (in some industries) it is necessary to focus less on new entrants on more on retraining of existing employees, and this is based on a sound analysis of need, then the sector must be prepared to invest in such training. In sub-sectors such as clothing, the aged population of existing workers necessitates an expanded focus on new and younger entrants. A priority may be to train retired machinists, pattern makers, cutters and operators to be trainers and or mentors of the younger cohort of entrants into the industry. Developing flexible training methods required for flexible production
Rapidly changing consumer demands in the clothing sub-sector has put pressure on clothing manufacturers to adjust manufacturing processes and systems accordingly in line with the changing demands of their consumers. Production models such as Quick Response (QR) and Fast Fashion (FF), increasingly used in clothing and textiles, are based on producing smaller product lines of the right product at the right time with minimum wastage. QR and FF production models require a different approach to skills development in the sub-sector. Existing employees are not able to leave the factory floor to be trained and upskilled due to tight production deadlines. Similarly, new entrants are expected to contribute to productivity as quickly as possible. The clothing industry needs to work with the FP&M SETA and explore alternative modes of training that are suited to the needs of QR and FF production systems.
Companies find it difficult to release staff for training when business is busy, and employees feel reluctant to take time off for training when they are most needed. Concern is being expressed that training initiatives must be aligned more to the seasonal timeframes of the industries, e.g. training should take place earlier in the year due to the demand for products increasing towards the end of the year. The SETA will need to explore the practicality of this with providers. Training on the factory floor becomes increasingly attractive for manufacturers both in terms of the practical training that can be delivered on site as well as the reduction in opportunity costs associated with off-site training such as, reduced productivity; costs
66
associated with transport and accommodation, and stipend costs. Changing delivery models of training will mean that industry will need to boost its capability and capacity to train on the factory floor. Industry-based training addresses the challenges associated with limited provider training in rural and other outlying areas. Distance education and e-learning modes of delivery should be explored especially for industry located in non-metro and rural areas. Employers in the sector are already conducting informal training, in-house, as part of training new entrants and upskilling existing employees. Such training must be recognised and supported by the SETA as it can respond more quickly to changing needs in the economy and contributes to skills development needs within industry. The idea of informal, on-site skills provision as another vehicle for skills development must be interrogated further by the SETA.
Expanding work-based training
There are gaps in learner or new entrant readiness after qualifying in occupational qualifications. Some training can only take place in the workplace. There has been the need identified for the addition of soft-skills to supplement the technical aspects of a qualification (often not addressed in formal programmes). Many sector stakeholders feel that there is a lack of basic life skills when an individual leaves an education institution, including communication skills and how to ‘sell yourself’ in the work environment. Many of the sub-sector role-players believe that in-house training adds more value at times than enrolling an individual employee with an education and training provider. There is also the concern that people applying for a position might have the theoretical knowledge, but may not have the required practical experience needed. The SETA therefore needs a particular focus on expanding workplace located training. This implies paying attention to the capacity of employers to plan and supervise effective on the job training and for improved partnerships between employers and providers to integrate workplace and institution-based training. Strategies such as mentor training and incubators need to be explored. In some subsectors there is a need for an expansion of internships, and the SETA will need to assist in the structuring of such programmes and supporting employers and interns to obtain maximum benefit.
Managing the quality of training and associated perceptions
There is a perceived gap or divide between the standards that sub-sectors are looking for in relation to new employees and what the education and training institutions are delivering. Some of this perception may be based on an unrealistic expectation of the role of education and training providers and the SETA can play a role in managing these expectations. However there is a real challenge that needs to be addressed. There is a need for the SETA to assist in developing stronger collaboration between sub-sector employers and stakeholders, and education and training institutions. The SETA must help bring providers and employer organisations together to address supply side concerns and issues. The greater degree of understanding that is developed between employers and providers, and the greater the number of partnership projects and programmes, the closer the sector will get to achieve the quality of performance from employees that is being sought.

FP&M SETA Sector Skills Plan for 2015-2020
67
5.3.4. Building partnerships
In certain sub-sectors such as Forestry and printing specifically, but also in other parts of the sector value chain, success is dependent on a number of public policy interventions and initiatives. For example in some sub-sectors there is a challenge of water availability, and in others procurement process where time frames and FP&M SETA Sector Skills Plan for 2015-2020 requirements impact on production plans. It will be important for the SETA to work with relevant government departments and public entities to put in place stakeholder structures that address some of the identified challenges. It will not be the role of the SETA to resolve operational problems facing industry, but to ensure that training is put in place, including where needed in relevant government departments that enable the problems to be addressed. The future of the clothing industry is dependent on two levels of skills provision, the first being the production of lower level, technical skills and the second, the production of higher level, technical and design-orientated skills needed to meet high-fashion demands of large retailers. It is imperative that a multi-layered, partnership approach is developed. Manufacturing companies and training providers (such as UOTs, TVETs and private providers) should partner in the development of basic level skills. Manufacturers and retailers should partner in the development of skills linked to fast-fashion and design. A lot of this already exists although; a few, large retailers drive the value chains, squeezing the profit margins of local manufacturers forcing many to close down. SETAs need to enhance support of manufacturers along the product value chain and lobby government support to grow the local manufacturing industry, as this is ultimately where the bulk of job creation lies. The sector needs to work towards integrating public TVET colleges into providing relevant, appropriate and high quality training in key areas of growth (e.g. furniture) and in areas that are not catered for adequately by existing provision, for example, clothing manufacturing in Gauteng. TVET integration on the supply side should be a gradual process starting with the FP&M SETA brokering partnerships between industry and the better functioning colleges.
68
References
Braun, A. 2000. Adding further value to South African indigenous goats through the production of cashmere. CSIR. Department of Economic Development. 2011. The New Growth Path (NGP). Department of Economic Development. 2011. Green Economy Accord. Department of Environmental Affairs. 2010. Environmental Skills Plan for South Africa. Department of Higher Education and Training. November 2013. Building an expanded, effective and integrated post-school system: A White Paper for Post-School Education and Training. Department of Higher Education and Training. National Skills Development Strategy 2011-2016. pp. 19. Department of Trade and Industry. 2013. Industrial Policy Action Plan (IPAP). FP&M SETA. 2011. SETA Constitution (2011-2016) FP&M SETA. May-June 2015. SSP Focus Groups. FP&M SETA, May 2015. Interview with senior management. FP&M SETA, 2014. Employer Tracer Study. Human Sciences Research Council. 2012. South African National HIV Survey
Human Resource Development Council of South Africa. 2010. Human Resource Development Strategy for South Africa 2010-2030.
Indvik, L. 2012. Three Shoe Brands Kicking Butt With Social Media, available at: http://mashable.com/2012/02/06/shoe-footwear-brands-social-mediamarketing/
Media 24. 2015. Partnerships in progress.
Quantec. 2015. Data reflecting 2014 employment statistics.
South African Presidency. 2011. National Development Plan (NDP), p. 17. United Nations Environment Programme (UNEP) 2013. Green economy: modelling report of South Africa, p. 9. Yende, F. (2014) New Business Model: Minimizing: Minimising Cost and Optimising Service Delivery Cost and Optimising Service Delivery, FP&M SETA.