annual report | 2011/12 - fp&m seta · fp&m seta annual report | 2011/12 ... expertise in...
TRANSCRIPT

Annual Report
2011/12
© Nampak

FP&M SETA Annual Report | 2011/12

FP&M SETA Annual Report | 2011/12
AnnuAl RepoRt of the fp&M SetA 1 ApRil 2011 to 31 MARch 2012Publisher FP&M SETA Building 2, Tuscany Office Park 6 Coombe Place Rivonia 2128
Tel: 011 234 2311 Fax: 011 234 2350
E-mail: [email protected] Website: www.fpmseta.org.za
Layout and Design Cre8or Global Communications Printer Seriti Printing (Pty) Ltd.Report Number RP179/2012ISBN Number 978-0-621-41015-0
For submission in terms of the Public Finance Management Act, 1999 (Act No.1 of 1999).
ViSion of the fp&M SetAThe vision of the FP&M SETA is to provide a quality, relevant post-schooling education and training system that will produce a highly skilled and world-class workforce, enhancing productivity and competitiveness of the sector leading to economic growth, employment and sustainability.
REPUBLIC OF SOUTH AFRICA

FP&M SETA Annual Report | 2011/12
Honourable Minister, it is my privilege and pleasure to present to you the Annual Report of the Fibre Processing and Manufacturing Sector Education and Training Authority (FP&M SETA), for the financial year ended March 2012.
On behalf of the FP&M SETA Board and staff I want to thank you and the Department of Higher Education and Training for your support during the reporting period.
Minister Blade Nzimande, MPMinister of Higher Education and Training
Mr. Bheki ZuluActing Chief Executive Officer: FP&M SETA

FP&M SETA Annual Report | 2011/12
contentS
Report from the Chairperson of the FP&M SETA ................ 01
Report from the Acting Chief Executive Officer ................... 03
Report on Predetermined Objectives ................................. 09
FP&M Seta ....................................................................... 26
Report from the Chief Financial Officer .............................. 27
Report of the Audit Committee of the FP&M SETA ............. 29
Report of the Auditor General ........................................... 31
Annual Financial Statements ............................................. 33
Statement of Responsibility ......................................................34 Report of the Accounting Authority of the FP&M SETA ..............35 Statement of Financial Performance .........................................41 Statement of Financial Position ................................................42 Statement of Changes in Net Assets .........................................43 Cash Flow Statement ...............................................................44 Accounting Policies to the Annual Financial Statements ............45 Notes to the Annual Financial Statements ................................50
Annexure 1: FP&M SETA Organogram and Equity Breakdown ............................................................ 85

FP&M SETA Annual Report | 2011/1201
RepoRt fRoM the chAiRpeRSon of the fp&M SetA
The Minister of Higher Education and Training’s decision in November 2010 to amalgamate the former Clothing, Textiles, Footwear and Leather (CTFL) SETA, the Forest Industries Education and Training Authority (FIETA) and identified sub-sectors of the Media, Advertising, Publishing, Printing and Packaging (MAPPP) SETA, signaled the start of a challenging but exciting new era in skills development.
The Fibre Processing and Manufacturing (FP&M) SETA was born from the amalgamation process to draw together sub-sectors with strong value-chain linkages.
The mandate of the newly formed SETA is to provide skills development services to the clothing, footwear, forestry, furniture, general goods, leather, packaging, print media, printing, publishing, pulp and paper, textiles and wood products sectors and to implement the objectives of the National Skills Development Strategy (NSDS III).
The promulgation of the amended Skills Development Amendment Act 2011 (Act 26 of 2011) afforded the Minister of Higher Education the responsibility to provide each SETA with a constitution in line with a standard constitution which set out inter alia the structure and responsibilities of the Accounting Authority of the SETA and made provision for the appointment of an independent chairperson and two ministerial appointees to the Board.
As an independent party to the FP&M SETA Board I was privileged to share the beginning of this new journey with a body of industry representatives from the various sub-sectors who brought with them not only a vast pool of knowledge, technical expertise and strategic planning capabilities but also an unsurpassed passion for skills development.
During the first six (6) months (April – September 2011), the Minister granted permission to the new SETA to operate in terms of an Interim Constitution that made provision for extended participation of sector representatives at Board level with the inclusion of six (6) observers (three (3) employer and three (3) labour representatives) in addition to the 12 members provided for in the standard constitution.
During this period, Interim Board members attended monthly meetings and made available their expertise in areas such as human resource (HR), financial and operational management to assist the acting executive management team and staff to develop a new dynamic organisation. The Interim Board was supported in these efforts by project managers appointed by the Department of Higher Education and Training (DHET).
The first order of business was to appoint an executive management team to pull together the staff from the former SETAs in order to design policies, procedures and processes to ensure continued operational functionality and service to the FP&M sector. Despite the organisation’s focus on and engagement with the amalgamation process, the SETA had to continue to fulfil its mandate during this time by engaging in the daily activities and responsibilities of a fully functional SETA. Internal task teams were formed to attend to the core business processes of the SETA relating to skills planning, funding and quality assurance of various training programmes and financial management. The FP&M SETA organisational structure was approved in September 2011 and provided a platform for the appointment of managers and staff in functional units. Mr. Bheki Zulu was appointed as Acting Chief Executive Officer and he provided leadership and direction to staff during the transformation period.
Mr. Sipho NgidiChairperson: FP&M SETA

FP&M SETA Annual Report | 2011/12 02
The FP&M SETA Board took over the governance of the SETA in October 2011 and with the assistance of essential committees such as the Audit Committee, Executive Committee, HR and Remuneration Committee, Governance and Strategy Committee and Finance and Projects Committee, oversaw the strategic and operational activities of the SETA to ensure good corporate governance and the implementation of acceptable financial practices.
In November 2011, the FP&M SETA Board and management team conducted a strategic planning workshop to map out the strategic priorities of the SETA for the remainder of NSDS III. The input generated from the workshop was incorporated into the FP&M SETA five-year strategic planning framework document and annual performance plan for submission to the DHET.
On behalf of the Board and its committees, I want to commend the SETA staff that came together under challenging circumstances, for their perseverance and dedication in providing skills development services to the new and expanded sector and to implement targeted initiatives to meet the scarce and critical skills needs of the sector as detailed in its Sector Skills Plan (SSP).
Despite the difficulties faced by the organisation during the amalgamation process, the staff prevailed and established common processes and procedures as well as performance and financial reporting systems and as a result produced Annual Financial Statements that fairly represented the financial position of the SETA. The Report on Predetermined Objectives as set out on pages 09 to 25 also indicate that the FP&M SETA made considerable progress in terms of the targets set out in its Annual Performance Plan. Discretionary grants and projects that were approved during the financial year will have a significant bearing on people employed in the FP&M sector, unemployed youth wanting to enter the world of work, people living with disabilities and people from rural areas.
It is with regret that the Board noted the qualified audit opinion issued by the Auditor-General of South Africa (AGSA) based on their finding that the FP&M SETA did not have adequate systems in place to monitor the apprenticeships commitments inherited from the former MAPPP-SETA. This finding will be addressed as a matter of priority in the new financial year.
I want to thank the members of the FP&M SETA governance structures for their robust participation in meetings of the Board and its committees, the sacrifice of their time and their wholehearted involvement in SETA activities on behalf of their constituencies, their sub-sectors and the FP&M sector as a whole.
We have set out ambitious goals for this organisation and I look forward to leading the FP&M SETA towards achieving these goals during the next four (4) years.
I believe that there is not yet sufficient commitment in the country to increase competitiveness locally and internationally through skills development. We will require more partnerships between enterprises and skills development institutions to identify the real skills needs and the skills development interventions required to address global competitiveness and sustainability of local enterprises in the medium to long term.
Mr. Sipho NgidiChairperson: FP&M SETA
FP&M SETA Board and Executive Managers (from left to right):Front: Mr. D. Fredericks, Mr. S. Mkhwanazi, Ms. S. Khumalo, Mr. S. Ngidi, Mr. B. Zulu, Ms. M. Odayan, Ms. G. LayzellBack: Mr. T. Maliti, Mr. M. Mokoana, Mr. D. Bowen. Mr. R. Godsmark, Ms. D. Erasmus, Mr. M. Truelock, Mr. P.K. Naicker.Absent: Mr. S. Sono, Mr. A. Kriel, Mr. J. Baard, Ms. D. Naidoo, Mr. B. Wafawarowa
FP&M SETA Annual Report | 2011/1203
Introduction
It is with a sense of elation and victory that one cherishes the opportunity to share with all our stakeholders the exciting journey that the FP&M SETA has undertaken during the 2011/2012 financial year. We take our hats off to all parties involved in the simultaneous processes of dissolving the three (3) former SETAs, i.e. CTFL SETA, FIETA, MAPPP-SETA and amalgamating them into one organisation, the FP&M SETA. The realization of these two complex processes was no small feat, hence the palpable excitement that has been shown by the FP&M SETA Board, staff and officials of DHET in providing support and business expertise during the amalgamation process, was highly appreciated.
2011/16 New SETA Landscape
The announcement of the 2011/2016 new SETA Landscape by the Minister of Higher Education and Training, Dr Blade Nzimande, in November 2010, heralded a new era of cooperation for the 13 sub-sectors now drawn together to form the FP&M SETA.
This development placed a very important responsibility on the Boards of the three (3) former SETAs, namely: ensuring a swift and smooth transformation of the entities they previously presided over and turning them from separate entities into a functional new organisation – and all this in the space of less than a year. Plans that had been drafted in anticipation of the disbandment of the three (3) organisations and their subsequent amalgamation into a new SETA had to be concretized and rolled out with speed and the activities contained in these plans had to be executed with military precision.
As plans can only reflect the ideals of their authors, it is exciting to note that these ideals were not far off the mark as demonstrated through the smooth transition process that took place. Credit must be given to the unwavering support offered by the Minister of Education and Training and the DHET right from the beginning of this process, the leadership and direction provided by the Boards of the dissolved SETAs, the guidance and expertise provided by the FP&M SETA Interim Board and the hard work put in by staff of the former SETAs. It took a high level of maturity and selflessness for those directly affected by the SETA restructuring process to deliver on the directive meted out by the Minister on behalf of Government whilst at the same time ensuring that the provision of services to stakeholders was not disrupted.
The Board and executive management team faced a number of challenges which arose as the amalgamation process unfolded and often had to deal with situations without a predetermined frame of reference. The challenges were compounded by the fact that the SETA was expected to continue to deliver an acceptable standard of skills development services to an expanded sector. Some of the challenges included -
RepoRt fRoM the ActinG chief eXecutiVe officeR
Mr. Bheki ZuluActing Chief Executive Officer: FP&M SETA

FP&M SETA Annual Report | 2011/12 04
a) Different cultures and geographical locations The three (3) former SETAs had different operational and business
cultures that played a big role in the integration of staff. At times this slowed down the momentum of integration but on the plus side it also challenged staff to move outside of their comfort zones and broaden their horizons. The fact that the former SETAs operated from different cities and different provinces and, during the interim period, continued to do so, presented logistical barriers which were addressed with the consolidation of staff into three (3) regional offices with 47 staff members based in Johannesburg, 9 based in Cape Town and the remaining 19 based in Durban. The regional spread of staff also enabled the SETA to provide services to members in various geographical areas.
b) New Organogram During the interim period (April to September 2011) SETA staff remained
in their previous positions which resulted in a duplication of functions. This was resolved with the approval of the organogram and the population of the organogram through a carefully executed staff placement strategy which included direct job matching and the conducting of competency based interviews. Although the process took its toll on both staff and management, by year-end most of the staff members had settled into their positions and by the end of the 2011/2012 financial year, the delivery of services and accountability were showing incremental improvement. Operating costs were also stabilizing and productivity was on a gradual increase.
New employment contracts have been signed to standardize employment
conditions across the organisation and HR policies and procedures have been approved by the Board for implementation.
Excess staff has been appointed on fixed term contracts and are currently deployed in the Projects Department to assist with the implementation of projects that are funded by the FP&M SETA.
c) Senior Managers Having three (3) former CEOs and a CFO involved in the amalgamation
process could have presented a serious challenge to the new organisation. However, to the contrary, this proved to be a blessing in disguise to the FP&M SETA. The collective experience and knowledge of these individuals ensured a smooth transition from the three dissolved SETAs to the new one. The commitment that has been shown to the organisation by staff can be attributed to a large degree to the loyalty shown to senior management who led by example by working together and building a new organisation that all affected parties could be proud of.
Statutory Compliance
As the existence and mandate of the FP&M SETA is determined by the Skills Development Act (Act No. 97 of 1998), the Skills Development Levies Act (Act No. 9 of 1999), the Public Finance Management Act (Act No. 29 of 1999), the NQF Act (Act No. 67 of 2008) and other applicable legislation, it is incumbent on an entity of this nature to comply with the prescribed requirements. These include the submission of strategic plans, annual performance plans, a Sector Skills Plan (SSP), quarterly reports and annual reports. The FP&M SETA complied with all these prescripts during the 2011/2012 financial period.
Being a new entity did not provide a reprieve to the FP&M SETA when it came to adherence to the deadlines applicable to all other fully functional SETAs.
The three (3) former SETAs submitted strategic and annual performance plans at the end of 2010 in line with Treasury regulations. These plans had to be consolidated into a workable strategic and annual performance plan for the new entity by the end of April 2011.
By the end of August 2011, the FP&M SETA submitted a comprehensive SSP covering the 13 sub-sectors falling within the scope of this entity. The Research Unit produced a thoroughly researched and well-written SSP that integrated the 13 sub-sectors of the FP&M sector into a recognizable value chain.
The SSP details the challenges experienced by each sub-sector, and it enumerates growth and development plans to revive and replenish scarce and critical skills for the various sub-sectors.
The critical information contained in the SSP was utilized in the development of the FP&M SETA Strategic Plan for 2011 – 2016 and the Annual Performance Plan for 2012-2013.
Performance against NSDS III Targets
The performance report that is reflected on page 09 to 25 of this annual report, demonstrates that the FP&M SETA performed well against most of the NSDS III targets. In areas where there was under-performance, plans have been put in place to remedy the situation in the coming years.
The new organisation hit the ground running and soon after its establishment on 1 April 2011, a strategy was put in place to manage the submission of mandatory grant applications by eligible firms from all 13 sub-sectors. The Skills Planning and Research Division drew on the available expertise of staff and implement an action plan to promote workplace skills planning and submission of mandatory grant applications by 30 June 2011. Despite the absence of an integrated Management Information System (MIS) at the time, staff belonging to the Skills Planning and Research Division and staff members based at regional offices processed 1,055 mandatory grant applications for payment, resulting in a payout rate of 55% of mandatory grant income.

FP&M SETA Annual Report | 2011/1205
Discretionary funding in the form of grants and special projects to the value of R111 million was allocated for skills development initiatives to the benefit of approximately 21,000 learners. By the end of this reporting period, R37 million, which is a combination of funding allocated to a wide range of training projects by the three dissolved SETAs in prior years and that which was allocated by FP&M SETA in 2011/2012, had been disbursed. This was mainly achieved under the watchful eye of the Finance and Projects Committee and the Projects Division.
The Projects Division managed the consolidation of the Discretionary Fund Commitments Registers of the former SETAs, the development and approval of Discretionary Fund Guidelines and Policies, the advertising of discretionary funding windows and the processing of discretionary funding applications in line with the scarce and critical skills needs identified in the FP&M SSP and the objectives set out in NSDS III.
The value of applications received far exceeded available discretionary grant funding and all applications were scrutinized and evaluated against criteria set out at the beginning of the process.
In addition to the discretionary grant categories, the FP&M SETA also received applications from sector organisations, government departments active in the FP&M sector, employer and labour organisations and community-based organisations to conduct special projects focused on priority areas such as the provision of skills development to people living in rural areas, skills development targeting designated groups (women, youth and people living with disabilities) and skills development interventions designed to address scarce and critical skills needs in the sector.
Project funding dedicated to special projects for rural development, disability and women accounted for 24.51%, 18.18% and 6.61% of disbursements respectively, which contributed to the SETA’s mandate to deliver against these key government priorities. Project funding was also allocated to projects aimed at developing business and entrepreneurial skills, addressing literacy and numeracy amongst the youth and promoting life skills through HIV/Aids awareness programmes. Approximately R21 million (82% of project funding) was allocated for learning programmes to support training interventions initiated by co-operatives, Non-Governmental Organisations (NGOs), Community Based Organisations (CBOs) and trade unions. In a bid to address higher level scarce skills, the FP&M SETA set aside R4 million for bursaries for students studying at public higher education institutions towards qualifications within the scope of the FP&M sector scarce skills list.
In terms of the discretionary grant funding window for learnerships, apprenticeships, bursaries and skills programmes, 33.58% of funding was allocated to employed workers to enhance middle, intermediate and high level skills of workers in the FP&M sector, whilst 66.02% was allocated to unemployed learners to access occupationally-directed middle level skills with the view to increase the skills pool of the FP&M sector. These disbursements also contributed to artisan development targets as contained in the National Skills Accord and created employment opportunities. The demand for learnership and apprenticeship grants by firms far exceeded available supply.
Although we have performed well in areas such as learnership implementation, management development, technologist and technical training, there are areas we need to improve on. One of the noted challenges exists in Adult
Education and Training (AET) provisioning and throughput, which stifles the progression of workers to higher bands of the NQF.
The global economic meltdown and the resultant financial pressure on firms in the FP&M sector, made it difficult for firms to survive and sustain employment levels. The FP&M SETA was proud to be one of a handful of SETAs to successfully implement the Training Lay-off Scheme (TLS), in collaboration with the DHET, the National Skills Fund (NSF), the Commission for Conciliation, Mediation and Arbitration (CCMA) and the Unemployment Insurance Fund (UIF). The purpose of the scheme is to assist firms experiencing financial difficulties to equip staff earmarked for possible retrenchments with transferable skills in order to make them more employable or more productive.
The FP&M SETA has touched the lives of many workers and unemployed youth in the FP&M sector through the implementation of local and international project initiatives such as:
a) KwaZulu Natal Department of Economic Development and Tourism (KZN DEDT) Collaboration Project with the Technical University of Liberec (TUL) for the Textiles Sector
The SETA’s collaboration with the KZN DEDT and the TUL in the Czech Republic reaped just rewards for the sector. Seven (7) MSc students who attended the TUL for a period of two (2) years, completed their credit dissertations and passed their final examinations during the year under review.
In addition, 27 students/employees in the clothing and textiles sector undertook a 6-week programme at the TUL during August-September 2011, at a cost of R2,4 million. The group consisting of clothing and textile industry employees, staff from higher education institutions and members of co-operatives and high-performing clothing and textile final year students, were given an opportunity to attend the Continuous Professional Development Programme (CPD) in the Czech Republic. The programme included lectures by renowned academics and visits to companies and businesses with advanced technologies and manufacturing processes.
b) Mitchells Plain Project for the Unemployed Youth
The Mitchells Plain area was identified as an area with a large number of unemployed and unskilled youth. The former FIETA Board approved a project to train a total of 150 learners in cabinet-making, upholstery and wood finishing and this project was conducted during the period under review at the Mitchell’s Plain Training Centre, the establishment of which was an outcome of the project. The centre caters for the upskilling of the unemployed and unskilled youth and assisting them with work placement.
The FP&M SETA Board approved funding for an additional 69 learners to undergo training in the same disciplines. This project has commenced and will be concluded in the next financial year.

FP&M SETA Annual Report | 2011/12 06
c) Footwear Design Learnership Project
Footwear design has been identified as an absolute scarce skill in South Africa but is critical to the footwear industry if it is to reclaim their share of an increasingly competitive global market, driven by fashion conscious consumers. During this intervention, footwear design learners from Eddels Shoes (Pty) Ltd in Pietermaritzburg, KZN, have stunned footwear industry experts with trendy and imaginative shoe designs produced as part of their NQF Level 2 learnership training. The six (6) unemployed youth were recruited onto the footwear design learnership at NQF Level 2 (National Certificate in CTFL Manufacturing Processes: Design) by Eddels Shoes (Pty) Ltd, a training provider registered with the Department of Education as a private Further Education and Training (FET) College and accredited by both Umalusi and the FP&M SETA to offer the qualification. The learners were coached and mentored by internal skills development facilitators at the factory on the practical application of the pattern producing modules. A senior delegation from the procurement division of Edgars visited the factory and was astounded at the innovative and trendsetting designs and products produced by the learners. The Edgars delegation was so impressed with the learners that they publicized their achievements throughout their stores.
d) Qualifications Development Project in Partnership with the Paper Manufacturers Association of South Africa (PAMSA) and Public FET Colleges
This was a pilot project to set up the curriculum frameworks and learner support materials for the pulp and paper industries, culminating in the implementation of the first National Certificate Vocational (NCV) qualification in Pulp and Papermaking Technology. Learners were recruited to register against the programme through the Umfolozi and Ekurhuleni East Public FET Colleges. The project covered learning material development, textbooks and 45% of tuition fees. This programme was the first of its kind in the pulp and paper industry and these learners were also placed in workplaces to gain experiential learning. The throughput rate of unemployed learners on this programme was excellent.
e) Adult Education and Training (AET) Projects
The Komatiland Forest AET project entails AET interventions for 500 learners in seven (7) provinces. The project is being conducted in the provinces of KZN, Mpumalanga, Gauteng and Limpopo. The learners are being trained on AET programmes (level 1 – 4) in partnership with Komatiland Forest. The focus of the training is to improve the literacy and numeracy skills of the learners.
In addition to the above, the FP&M SETA made available funding for a project in partnership with the Department of Agriculture, Fisheries and Forestry (DAFF) to provide literacy and numeracy skills to 574 foresters in four provinces namely Limpopo, Mpumalanga, KZN and the Eastern Cape. Approximately 50% of the learners were selected for interventions at AET level 3 and 4.
These projects will contribute to the SETA’s objective to assist the country in reducing levels of illiteracy amongst the youth.
Assuring quality education and training provision
From a quality assurance perspective much of the period under review focused on the challenges of amalgamating the three quality assurance frameworks of the former SETAs, while ensuring the adoption of best practices. The ETQA division developed, benchmarked and finalized an accreditation policy, learning programmes policy, certification policy and a Memorandum of Agreement (MoA) template.
Merging of ETQA databases for accredited training providers, qualifications, learner graduates and certification was completed with the successful migration of data onto the FP&M SETA ETQA MIS.
Legislation pertaining to the changing education and training landscape and the establishment of the new Quality Council for Trades and Occupations (QCTO) resulted in the transfer of quality assurance responsibilities from the South African Qualifications Authority (SAQA) to the QCTO. In order to formalize this transfer the FP&M SETA signed a Memorandum of Agreement with the QCTO, which delegated the quality assurance responsibilities to the FP&M SETA and extended the accreditation status of this entity as an education and training quality assurance body (ETQA) until 30 September 2012.
The FP&M SETA’s responsibility to accredit both public and private training providers to deliver NQF-aligned learning programmes is an ongoing function. The ETQA has a database of 688 accredited training providers nationally, including Public FET Colleges. A large number of private training providers are accredited for skills programmes.
During the current reporting period the FP&M SETA concluded 5 partnership agreements with the following public FET Colleges to offer qualifications in the FP&M sector:• WestcolFETCollege• EkurhuleniEastFETCollege• SekhukhuneFETCollege• UmgungundlovuFETCollege• UmfoloziFETCollege
The FP&M SETA was a signatory to the KZN Inter-SETA/FET Cluster, which fosters linkages and partnerships between SETAs and public FET colleges
The ETQA conducted the verification of learner achievements and issued certificates to successful learners during the period under review. In total, 329 employed (18.1) and 567 unemployed (18.2) learners successfully completed their learnership qualifications. In the current year of reporting, the FP&M SETA ETQA presented artisan certificates to 52 employed (18.1) apprenticeship graduates. In addition, a large number of learners completed skills programmes (311 employed learners and 448 unemployed learners).
The FP&M ETQA complied with the reporting requirements of SAQA and the NLRD and was congratulated on a number of occasions by the SAQA NLRD Directorate for submitting data within the specified deadline and according to the requirements contained in the NLRD Minimum Standard for Data Loads.

FP&M SETA Annual Report | 2011/1207
The FP&M SETA was one of a few SETAs to be awarded a green status on the NLRD league table during its first attempt of uploading data on the SAQA database as a newly established entity.
A central database of registered assessors and moderators in the FP&M sector has been established as part of the FP&M SETA MIS, thus facilitating the registration process for both assessors and moderators. The number of registered assessors is 1,024 and that of moderators, 138.
Occupational qualifications development is a critical function of the FP&M SETA ETQA. The FP&M SETA concluded a service level agreement with the QCTO, which resulted in the issuing of six delegation certificates to the FP&M SETA as a Development Quality Partner (DQP) for QCTO occupationally-directed qualifications in the clothing, textiles, footwear, leather and printing sub-sectors. The FP&M SETA ETQA held a number of focused workshops in order to review and scope the occupations within the FP&M sub-sectors to ensure alignment of occupationally-directed qualifications with the Organising Framework for Qualifications (OFO). Qualifications development workshops were held with representatives of the clothing, textiles, footwear, leather and printing sub-sectors to convert current SAQA-registered qualifications to the QCTO qualifications format, which will be registered in the 2012/2013 financial year.
Monitoring and Evaluation
A lot of effort has been employed during the period under review to build internal capacity to enhance the effectiveness and reach of the Monitoring and Evaluation division. This function has been introduced to evaluate and monitor the impact of approved projects on beneficiaries and enterprises in the sector, to gather and report accurate and reliable information to the SETA’s’ governance structures, monitor and evaluate the quality of all aspects of skills development provision e.g. quality of the curriculum, sufficiency of resources and staff expertise. This will enable the SETA to record lessons learnt and to identify gaps and best practices with a view to foster the culture of economic and efficient usage of limited resources as well as continuous improvement of quality skills development delivery.
Promoting the new organisation
One of the first priorities of the Amalgmation Task Team was to establish a new brand identity for the FP&M SETA. The FP&M SETA logo was developed during the early stages of the amalgamation process and a website and promotional materials were designed to promote the organisation to the sector and the wider public.
The FP&M SETA communicated with its stakeholders through its website, regular newsletters and correspondence as well as regional workshops. The SETA also shared information through public media channels such as newspapers and magazines with particular focus on industry publications and publications with a skills development agenda.
The FP&M SETA Marketing and Communications Division facilitated the SETA’s involvement in seven (7) identified career exhibitions aimed at informing high school learners, school leavers and unemployed youth of
career opportunities in the FP&M sector. A draft Careers Guide for the sector has been developed and will be published in the new financial year.
Financial Management
One of the principles adopted by the Board of the FP&M SETA as a building block towards developing and promoting a service delivery oriented organisational culture, is that of fiscal discipline and prudent utilization of our scarce resources. This noble mission has enabled the FP&M SETA in its very first year of existence to operate within the available administration budget of R35 million. This target has been achieved despite the numerous extra-ordinary expenses relating to the SETA restructuring processes that had to be catered for.
Mandatory grants to the value of R93 million had been disbursed at the end of the 2011/2012 financial period, posting a 55% performance rate by the SETA. We believe this is a good start for a SETA that has just been established and we are confident that the plans already put in place to enhance communication and support to our stakeholders with regards to the submission of Workplace Skills Plans (WSPs) and Annual Training Reports (ATRs) will contribute towards improved performance on this function going forward.
Challenges
The high rate of unemployment, particularly among young people which is estimated by the International Labour Organisation at 70% of the entire 25% of unemployed South Africans, is Government’s single most important challenge. Since skills development interventions are viewed as one of the critical mechanisms for addressing this challenge, a big responsibility has been bestowed on SETAs for meaningful and profound contribution towards the fight against unemployment. FP&M SETA is one of the SETAs with a modest levy income yet services a sector whose industries are located towards the bottom end of the profit making hierarchical order. This has put a strain on the ability of the SETA to allocate adequate funding towards education and training initiatives and resulted in support to a limited number of beneficiaries and discontent being expressed in some quarters of our stakeholder base.
FP&M SETA would need to embark on an aggressive mission of forging partnerships with other bodies and organisations such as the NSF and other government departments in a bid to explore opportunities for increasing funding to address the sector’s skills development needs.
Many gaps exist with respect to research data which is a critical area to address to ensure proper planning of skills development interventions. The 13 economic sub-sectors that fall within the scope of the FP&M SETA are at different levels with regards to the availability of research data and maturity of research systems currently in place.
The SETA is on the verge of undertaking a large-scale research project which will be aimed at providing the sector with reliable baseline data on issues of education and training and which will provide a foundation upon which the SETA can build a reliable skills development research and planning infrastructure.

FP&M SETA Annual Report | 2011/12 08
Finally, the FP&M SETA comprises industries that are fraught with economic activity shrinkage due to, amongst numerous factors, competition waged by foreign manufactures of goods, rapid technological advancement in the fields of communication and migration to digital media.
Acceleration of skills development interventions including proper scoping of skills required to render the FP&M industries and promotion of innovation and research would go a long way towards enabling these industries to re-invent themselves, thereby turning the tide and putting these economic sectors on the road to sustainability and profitability.
Appreciation
I take this opportunity to thank the FP&M SETA Board for providing the required leadership, direction, support and guidance during the challenging period of SETA restructuring, and the management and staff for their commitment and dedication towards the business of the FP&M SETA. Their display of amazing maturity and patience during the staff placement process is appreciated.
Finally, our heartfelt gratitude go towards our stakeholders for their understanding, unwavering support and display of optimism and faith in the FP&M SETA leadership at the time of the restructuring of the SETA when the risks of uncertainty and despondency could have easily set in.
Bheki ZuluActing Chief Executive Officer
FP&M SETA Executive Management (from left to right): Mr. Simangaliso Mkhwanazi (Chief Executive: Strategy and Corporate Affairs), Mr. Bheki Zulu (Acting Chief Executive Officer), Ms. Gina Layzell (Chief Financial Officer), Mr. PK Naicker (Chief Operations Officer).

FP&M SETA Annual Report | 2011/1209
RepoRt on pRedeteRMined objectiVeSfor the period 1 April 2011 to 31 March 2012
The schedule below reflects the actual achievements of the FP&M SETA against the predetermined objectives set out in its Annual Performance Plan (revised version submitted at the end of September 2011) for the period 1 April 2011 to 31 March 2012 and is aligned to the objectives of NSDS III. For more details on discretionary funding expenditure, refer to Note 32 of Notes to the Annual Financial Statements.
NSDS Objective 4.1 Establishing a credible institutional mechanism for skills planning
NSDS Outcome 4.1.1: National need in relation to skills development is researched, documented and communicated to enable effective planning across all economic sectors.
NSDS III Objectives / Indicators
FP&M SETA Targets for 2011– 2012
Performance against targets for 2011– 2012 Reasons for Variance
Budget v UtilisedR’000
2011/12
Output 4.1.1.2: Sector skills plans are professionally researched, provide a sound analysis of the sector and articulate an agreed sector strategy to address skills needs.
FP&M SETA develop and implement a project plan to consolidate sector specific information into SSP. Consolidated FP&M SSP submitted to DHET by 31 August 2011.
The FP&M SETA submitted a final SSP Update by 31 August 2011. The update was the result of the consolidation of the SSPs compiled by the former SETAs (CTFL, FIETA and MAPPP-SETA).
Met the target - no variance.
Budget: R250Utilised: R137Voted: R113
Output 4.1.1.3: Sector and nationally commissioned research and data is analysed, validated and captured in an integrated database that is accessible to stakeholders.
FP&M SETA develop and implement a Research Agenda to address specific areas of need including impact studies identified in NSDS III.
The FP&M SETA Skills Planning and Research Division has developed a Research Agenda and has commenced with research activities in accordance with the agenda. This included research for the purpose of updating the SSP.
Met the target - no variance.
Costs are included in the FP&M SETA administrative
budget (staff costs – Research Division).
FP&M SETA develop and maintain central skills planning and learner database. Data to be supplied in Quarterly and Annual reports and on ad hoc basis as requested from DHET.
The FP&M SETA has implemented an interim management information system (MIS) for the management of financial and learner information.Annual reports relating to the reporting period 2010-2011 were submitted for the three former SETAs at the end of August 2011.The FP&M SETA submitted four quarterly reports to the DHET as per the agreed deadline dates.
Met the target - no variance.
Costs relating to the implementation of the MIS are included in the FP&M
SETA administrative budget.
Costs relating to the publication of the Annual
Reports are included in the FP&M SETA Marketing & Communications budget.

FP&M SETA Annual Report | 2011/12
NSDS Objective 4.2 Increasing access to occupationally-directed programmes
NSDS Outcome 4.2.1: Middle level skills needs are identified and addressed in all sectors
NSDS III Objectives / Indicators
FP&M SETA Targets for 2011– 2012
Performance against targets for 2011– 2012 Reasons for Variance
Budget v UtilisedR’000
2011/12
Output 4.2.1.1: SETAs research and identify middle level skills needs in their sectors and put in place strategies to address them, particularly through the use of the public FET colleges and universities of technology working in partnership with employers providing workplace- based training.
FP&M SETA conduct annual WSP/ATR analysis to determine current supply of middle level skills needs and develop strategies to address needs in partnerships with providers.
A statistical analysis of WSP/ ATRs submitted by 30 June 2011 has been conducted and the information has been used as a base to inform WSP strategy development and implementation in the sector.
Met the target - no variance.
Costs are included in the FP&M SETA administrative
budget.
Output 4.2.1.2: Projects are established to address middle level skills in each sector.
50 workers assisted to enter and 25 successfully complete learning programmes through RPL processes.
NIL workers entered learning programmes through RPL processes.NIL workers completed learning programmes through RPL processes.
Registrations:Negative variance of 50.Completions:Negative variance of 25.
In November 2011, the FP&M SETA Board allocated 50 grants to firms to address this target. Training will commence in the new financial year.
The development of QCTO qualifications will facilitate RPL strategy development and implementation in the sector. This will be informed by the research currently being conducted by the DHET in this field.
Budget: R50Committed: NIL
Voted: R50
10

NSDS III Objectives / Indicators
FP&M SETA Targets for 2011– 2012
Performance against targets for 2011– 2012 Reasons for Variance
Budget v UtilisedR’000
2011/12
Output 4.2.1.2: Projects are established to address middle level skills in each sector.
800 workers assisted to enter and at least 400 workers successfully complete AET learning programmes level 1 - 4 or equivalent learning programmes.
209 workers were registered on AET level 1 – 4 or equivalent programmes.
52 workers completed AET level 1 – 4 or equivalent programmes.
Registrations: Negative variance of 591.Completions:Negative variance of 348.
AET grants were allocated to firms and training providers to conduct AET programmes in November 2011.These programmes will be conducted in the new financial year.
The FP&M SETA has also allocated funding for the provision of AET to 574 employed learners in four (4) provinces in collaboration with the DAFF. This project is currently underway and will be completed in the new financial year. (Budget included under Sector Projects.)
Budget: R2 400Utilised: R9
Committed: R477Voted: R1 911
Unallocated: R3
FP&M SETA Annual Report | 2011/1211

NSDS III Objectives / Indicators
FP&M SETA Targets for 2011– 2012
Performance against targets for 2011– 2012 Reasons for Variance
Budget v UtilisedR’000
2011/12
Output 4.2.1.2 Continued: 600 employed and 1 200 unemployed learners assisted to enter and at least 300 employed and 600 unemployed learners successfully complete learnerships at NQF level 2 and above. 70% of graduates are placed in employment on completion of the programme.
522 employed and 978 unemployed learners were registered on learnership programmes.
329 employed and 567 unemployed learners completed learnership programmes.
The number of graduates placed in employment on completion of the programme is unknown.
Registrations:Employed: Negative variance of 78. Unemployed: Negative variance of 222. Completions:Employed: Positive variance of 29.Unemployed: Negative variance of 33.
Learnership completions reported for this period refer to learners who entered learnerships during the previous financial year (funded by the former SETAs).
The FP&M SETA Board allocated a total of 1 841 learnership grants during 2011/2012. Some of these learners have commenced with their learnership programmes in the last quarter of 2011/12. The outstanding learnership agreements will be processed in the new financial year and programmes will run for a period of 8 – 12 months after which completions will be reported on.
A tracer study on learners will be conducted in the third year of NSDS III implementation.
Current MoAs with employers stipulate a minimum of 60% placement requirement for unemployed learners. The MoAs will be reviewed to encourage employers to increase the placement of graduates in the sector to 70%.
Budget: R42 000Additional Amount Approved
by the Board: R875Utilised: R65
Committed: R7 670Voted: R35 140
FP&M SETA Annual Report | 2011/12 12

FP&M SETA Annual Report | 2011/1213
NSDS III Objectives / Indicators
FP&M SETA Targets for 2011– 2012
Performance against targets for 2011– 2012 Reasons for Variance
Budget v UtilisedR’000
2011/12
Output 4.2.1.2 Continued: 200 employed and 500 unemployed learners assisted to enter and at least 100 employed and 250 unemployed learners successfully complete credit bearing skills programmes relating to management and technical scarce / critical skills areas.
708 employed and 628 unemployed learners entered credit bearing skills programmes relating to management and technical scarce / critical skills areas.
311 employed and 448 unemployed learners successfully completed credit bearing skills programmes relating to management and technical scarce / critical skills areas
Registrations:Employed: Positive variance of 508.Unemployed: Positive variance of 128.Completions:Employed: Positive variance of 211.Unemployed: Positive variance of 198.
Grants for skills programmes have been allocated to firms in the latter part of the year. These programme completions will be reported on in the new financial year.
Budget: R5 040Additional Amount Approved
by the Board: R2 467Utilised: R89
Committed: R1 765Voted: R5 654
80 employed and 100 unemployed learners assisted to enter and 40 employed and 50 unemployed learners successfully complete (graduate) bursary programmes at Higher Education and Training (HET) or FET institutions.
70% of graduates have access to further learning or is placed in employment on completion of programmes.
18 employed and 125 unemployed learners entered (graduate) bursary programmes at HET or FET institutions.
NIL employed and NIL unemployed learners successfully complete (graduate) bursary programmes at HET or FET institutions.
The number of graduates placed in employment on completion of the programme is unknown.
Registered:Employed: Negative variance of 62.Unemployed: Positive variance of 25.
Completed:Employed: Negative variance of 40.Unemployed: Negative variance of 50.
The FP&M SETA Board allocated 184 bursaries to firms to register employed and unemployed learners on HET or FET programmes.
An additional R4 million was allocated to fund bursaries for 86 existing students from funding originally set aside to sponsor students in terms of the NSFAS.
A tracer study will be conducted once programmes have been completed to establish the placement rate of graduates in employment.
Budget: R6 300Additional Amount Approved
by the Board: R140 Utilised: NIL
Committed: R186Voted: R6 254
NSFAS Budget: R4 000Utilised: R31
Committed: R3 129*Voted: R3 160
Unallocated: R840
*This amount includes 10 internship grants
(see below).

FP&M SETA Annual Report | 2011/12 14
NSDS III Objectives / Indicators
FP&M SETA Targets for 2011– 2012
Performance against targets for 2011– 2012 Reasons for Variance
Budget v UtilisedR’000
2011/12
Output 4.2.1.2 Continued: 90 unemployed learners who have completed vocational programmes such as NVC programmes or occupationally directed learning programmes such as learnerships or apprenticeships have been placed for work experience / internships in entities in the FP&M sector. Employers and institutions have entered into agreements with the SETA (duration 6 - 12 months).
28 unemployed learners who have completed vocational programmes have been placed for work experience / internships in entities in the FP&M sector.
11 firms have entered into agreements with the SETA and FET / HET Institutions (duration 6 - 12 months).
Placements:Unemployed: Negative variance of 62.
Memorandums of Agreement (MoAs):No variance – numerical target not set.
The FP&M SETA Board has allocated 91 grants to firms to provide experiential learning to graduates / interns.
In addition, 10 internships were allocated from funding set aside for NSFAS.
MoAs will be signed between the SETA and the employers to activate the grants.
Budget: R2 700Utilised: NIL
Committed: R165Voted: R1 200
*Unallocated: R1 335
*The budget was based on 12 month internships / work experience grants (R30 000). The FP&M SETA Board allocated grants for a time period of 6 months (R15 000 per grant). The funding will be transferred to the new financial year.
NSDS Outcome 4.2.2: 10,000 artisans per year qualify with relevant skills and find employment
NSDS III Objectives / Indicators
FP&M SETA Targets for 2011– 2012
Performance against targets for 2011– 2012 Reasons for Variance
Budget v UtilisedR’000
2011/12
Output 4.2.2.1: SETAs establish projects and partnerships to enable the relevant number of artisans for their sector to be trained, to qualify and become work ready.
100 employed and 100 unemployed learners assisted to enter and at least 50 employed and 50 unemployed learners successfully complete Section 13 Apprenticeships at NQF level 3 and above.
70% of graduates are placed in employment on completion of the programme.
47 employed and 54 unemployed Section 13(1) apprentices were registered on artisan programmes.
52 employed and NIL unemployed Section 13(1) apprentices completed artisan programmes.
The number of graduates placed in employment on completion of the programme is unknown.
Registrations:Employed: Negative variance of 53.Unemployed: Negative variance of 46.Completions:Employed: Positive variance of 2. Unemployed: Negative variance of 50.
The FP&M SETA Board apprenticeship grants to the value of R12,5 million to firms in the industry to indenture learners on apprenticeships. These artisan / apprenticeship programmes range between two (2) to four (4) years in duration.
Budget: R6 000Additional Amount Approved
by the Board: R6 510Utilised: NIL
Committed: R1 640 Voted: R10 870

FP&M SETA Annual Report | 2011/1215
NSDS III Objectives / Indicators
FP&M SETA Targets for 2011– 2012
Performance against targets for 2011– 2012 Reasons for Variance
Budget v UtilisedR’000
2011/12
Output 4.2.2.1 continued: Completions reported above relate to apprenticeships that were inherited from the former SETAs.
A tracer study will be conducted once programmes have been completed to establish the placement rate of unemployed artisans in employment.
50 learners assisted to achieve artisan qualifications (apprenticeships) at NQF level 3 and above through Section 28 RPL route .
70% of graduates are placed in employment on completion of the programme.
The FP&M SETA received 2 applications to conduct Section 28 trade tests during the period under review.
Negative variance of 48 learners.
50 learners were assisted through grants to achieve artisan qualifications (apprenticeships) at NQF level 3 and above through Section 28 RPL route.
Budget: R250Additional Amount
Approved by the Board: R15Utilised: NIL
Committed: R40Voted: R225
NSDS Outcome 4.2.3: High level national scarce skills needs are being addressed by work ready graduates from higher education institutions
NSDS III Objectives / Indicators
FP&M SETA Targets for 2011– 2012
Performance against targets for 2011– 2012 Reasons for Variance
Budget v UtilisedR’000
2011/12
Output 4.2.3.1: Sector skills plans identify the supply challenges in relation to high level scarce skills gaps and set out strategies for addressing them.
FP&M SETA develop a strategy to address high level skills needs (post-grad level) based on research conducted in the sector. This strategy to include the continued support of identified Institutes for Sector or Occupational Excellence (ISOEs) located at HETs and UOTs.
The SETA is in process of developing a strategy to support identified ISOEs to provide high level skills for the FP&M Sector.
Due to the amalgamation process, the consolidation of existing strategic documents was prioritised. The development of an ISOE strategy will be finalised in the new financial year.
Costs are included in the FP&M SETA administrative
budget (staff costs – Research Division).
Output 4.2.3.2:Agreements are entered into between SETAs, university faculties and other stakeholders on appropriate interventions to support improved entry to priority programmes, increased work experience and experiential learning for students and access to post-graduate work.
FP&M SETA establish a Provider/Stakeholder forum for stakeholders (providers, employers, SETAs and Government departments).
The FP&M SETA Research Division entered into collaboration discussions with the South African Bureau of Standards (SABS), the Durban University of Technology (DUT), Cape Peninsula University of Technology (CPUT) and the University of Johannesburg (UJ) to develop a generic design course. This course is aimed at assisting employers to stimulate productivity improvements on the work floor by introducing the design aspect in industrial processes. This course could also be used as an access course for learners aiming to specialise in design related careers e.g. fashion, furniture, textiles, footwear and graphic design.
Met the target - no variance.
Costs are included in the discretionary grant administrative budget.

FP&M SETA Annual Report | 2011/12 16
NSDS Outcome 4.2.4: Relevant research and development and innovation capacity is developed and innovative research projects established.
NSDS III Objectives / Indicators
FP&M SETA Targets for 2011– 2012
Performance against targets for 2011– 2012 Reasons for Variance
Budget v UtilisedR’000
2011/12
Output 4.2.4.1: Sector skills plans identify the focal areas for research, innovation and development.
FP&M SETA develop and implement Annual Research Agenda.
The FP&M SETA Skills Planning and Research Division has developed a Research Agenda and has commenced with research activities in accordance with the agenda.
Met the target - no variance.
Costs are included in the FP&M SETA administrative
budget (staff costs – Research Division).
Output 4.2.4.2: Agreements are entered into between SETAs, university faculties and other stakeholders on flagship research projects linked to sector development in a knowledge economy.
FP&M sign MOU with 1 HET/UOT (or identified ISOE) to conduct identified sector related research projects.
The SETA is collaborating with the SABS Design Institute, the DTI and identified HET institutions to develop a design qualification for the sector. A concept paper has been developed.
An MoU will be signed in the new financial year.
Costs are included in the FP&M SETA administrative
budget (staff costs – Research Division).
Additional project funding for implementation of the
programme in 2012/13 will be negotiated in the next
financial year.
Output 4.2.4.3: Programmes are put in place that focus on the skills needed to produce research that will be relevant and have an impact on the achievement of economic and skills development goals.
5 employed and 10 unemployed post graduate students are assisted to enter and 4 employed and 8 unemployed students successfully complete post graduate programmes including honours, masters and doctoral programmes in publishing, science, engineering and technology as applicable to the FP&M sector.
5 employed and 3 unemployed post graduate students received bursaries for Masters and BTech programmes.
NIL employed and 7 unemployed post graduate students completed their studies successfully.
Registered:Employed: NIL variance.Unemployed: Negative variance of 7.
Completions:Employed: Negative variance of 4.Unemployed: Negative variance of 1.
The FP&M SETA Board has allocated 15 bursaries for post graduate students to enter programmes. The additional registration and completion will be reported on in the new financial year.
Seven (7) post graduate students completed their Masters in Textile Science at the Technical University of Liberec in the Czech Republic. These students were funded from a collaboration project between the former CTFL SETA and the KZN DEDT.
Budget: R250Utilised: NIL
Committed:R140 Voted: R110

FP&M SETA Annual Report | 2011/1217
NSDS Objective 4.3 Promoting the growth of a public FET college system that is responsive to sector, local, regional and national skills needs and priorities.
NSDS Outcome 4.3.1: The National Certificate (Vocational) and N-courses are recognised by employers as important base qualifications through which young people are obtaining additional vocational skills and work experience, entering the labour market with marketable skills, and obtaining employment.
NSDS III Objectives / Indicators
FP&M SETA Targets for 2011– 2012
Performance against targets for 2011– 2012 Reasons for Variance
Budget v UtilisedR’000
2011/12
Output 4.3.1.2: The programmes offered to meet industry needs, including those supporting apprenticeships and N-courses, are reviewed, updated and made available to and accessed by employers.
FP&M SETA establish regional Liaison Committees to review and update course offerings. A minimum of 1 Public FET college per province is accredited to offer FP&M learning programmes.
The FP&M SETA has accredited 9 Public FET Colleges:
In KZN:• Umgungundlovu FET College • ElangeniFETCollege• ThekwiniFETCollege• UmfoloziFETCollegeIn Gauteng:• WestcolFETCollege• TshwaneNorth FET College• EkurhuleniEast FET CollegeIn Limpopo• Carpricorn FET College• Sekhukune FET College
Negative variance: 6 provinces.
The Research Unit will conduct a geographical mapping exercise to determine the profile of FET colleges and their capacity to deliver on FP&M sector learning programmes in all provinces.
Costs are included in the administrative budget
relating to the ETQA division.
NSDS Outcome 4.3.2: Partnerships between DHET, SETAs, employers, private providers and public FET colleges are resulting in increased capacity to meet industry needs throughout the country.
NSDS III Objectives / Indicators
FP&M SETA Targets for 2011– 2012
Performance against targets for 2011– 2012 Reasons for Variance
Budget v UtilisedR’000
2011/12
Output 4.3.2.2: SETAs identify FET colleges with relevant programmes and put in place partnerships to offer vocational courses and work experience for college learners.
FP&M develop a strategy to establish linkages with FETs and facilitate partnerships between FETs and employers. This strategy to include the continued support of 10 ISOEs located within FETs.
The FP&M SETA Board approved funding for the sector projects to be conducted in collaboration with FET/HET institutions and ISOEs. Included in this group of institutions are 3 ISOES inherited from the former SETAs namely DUT, CPUT and Furntech (see details of institutions under committed/voted funds).
5 partnership agreements were concluded with FETs to offer FP&M sector qualifications:• WestcolFETCollege• EkurhuleniEast FET College• Sekhukune FET College• Umgungundlovu FET College• UmfoloziFETCollege
Negative variance: 7 ISOEs.
An FET MoU is in place to address linkages and partnerships with FET Colleges.
Budget: R2 500Utilised: NIL
Committed: R450PAMSA in partnership with
Umfolozi and Ekurhuleni East FET
Colleges: R450Voted: R2 050
DUT: R810Eastern Cape
Communication Forum: R216
Esayidi FET College: R108Western Cape Learnership
Centre: R216CPUT: R70
Furntech: R300Nelson Mandela
Metropolitan University – Saasveld: R105
West Coast FET: R225

FP&M SETA Annual Report | 2011/12 18
NSDS Objective 4.4 Addressing the low level of youth and adult language and numeracy skills to enable additional training
NSDS Outcome 4.4.1: A national strategy is in place to provide all young people leaving school with an opportunity to engage in training or work experience, and improve their employability.
NSDS III Objectives / Indicators
FP&M SETA Targets for 2011– 2012
Performance against targets for 2011– 2012 Reasons for Variance
Budget v UtilisedR’000
2011/12
Output 4.4.1.2: A national database tracks training and work opportunities, and reports on implementation of the strategy.
FP& M develop and maintain central skills planning and learner database. Data to be supplied in Quarterly and Annual reports and on ad hoc basis as requested from DHET.
The FP&M SETA has implemented an interim management information system (MIS) for the management of financial and learner information.Annual reports relating to the reporting period 2010-2011 were submitted for the three former SETAs at the end of August 2011.The FP&M SETA submitted four quarterly reports to the DHET as per the agreed deadline dates.
Met the target - no variance.
Costs are included in the FP&M SETA
administrative budget.
NSDS Objective 4.5 Encouraging better use of workplace-based skills development
NSDS Outcome 4.5.1: Training of employed workers addresses critical skills, enabling improved productivity, economic growth and the ability of the work force to adapt to change in the labour market.
NSDS III Objectives / Indicators
FP&M SETA Targets for 2011– 2012
Performance against targets for 2011– 2012 Reasons for Variance
Budget v UtilisedR’000
2011/12
Output 4.5.1.1: SETA stakeholders agree on the provision of substantial quality programmes for employed workers and report on the impact of the training.
At least 80% of large firms submit WSP/ATR claims by 30 June 2011.
Due to the use of the interim MIS system and the unreliability of SARS data relating to the number of employees per levy paying firm, the FP&M SETA was unable to establish the breakdown of levy paying entities per size category and therefore we were unable to do a comparison.
The FP&M SETA have put systems in place to cater for comparative reporting and accurate capturing of employment statistics in the next financial year.
Plans are also in place to conduct a detailed baseline study for the FP&M sector.
Costs are included in the FP&M SETA
administrative budget.

FP&M SETA Annual Report | 2011/1219
NSDS III Objectives / Indicators
FP&M SETA Targets for 2011– 2012
Performance against targets for 2011– 2012 Reasons for Variance
Budget v UtilisedR’000
2011/12
Output 4.5.1.1 continued: Mandatory grants (relating to 2011/2012) were paid to 1 055 of the 1 258 firms that submitted WSP/ATRs. A total payout rate of 55% of mandatory grant income was achieved.
At least 60% of medium firms submit WSP/ATR claims by 30 June 2011.
FP&M SETA was unable to establish the breakdown of levy paying entities per size category and therefore we were unable to do a comparison.
Costs are included in the FP&M SETA administrative
budget.
At least 40% of small firms submit WSP/ATR claims by 30 June 2011.
FP&M SETA was unable to establish the breakdown of levy paying entities per size category and therefore we were unable to do a comparison.
Costs are includedin the FP&M SETA
administrative budget.
FP&M develop and maintain a database of accredited training providers.
The ETQA Department maintains a detailed database of all accredited training providers on the interim MIS system.
Met the target - no variance.
Costs are included in the FP&M SETA administrative
budget.
Output 4.5.1.2: Sector projects are put in place to address specific sector skills gaps.
FP&M advertise discretionary funding windows for specific sector projects to address sector skills gaps. (Qualification Development).
The FP&M SETA advertised discretionary grant funding windows in including funding for special projects to address sector skills gaps in September 2011.Regional workshops were held in October 2011 to further promote discretionary funding opportunities.
Met the target - no variance.
Budget: R1 500Utilised: NIL
Committed: NILVoted: R1 500
FP&M enter into at least 1 collaboration agreement with other SETAs or line departments to address skills along the local supply chain.
The FP&M SETA continued with an existing collaboration agreement with the KZN DEDT to fund Textile Science Masters programmes.The FP&M SETA entered an agreement and allocated funding to the DAFF during 2011/12 to address skills needs in the sector identified by the departments.(See Sector Projects).
Met the target – no variance.
Budget: R1 000Utilised: NIL
Committed: NILVoted: R1 000

FP&M SETA Annual Report | 2011/12 20
NSDS Objective 4.6 Encouraging and supporting cooperatives, small enterprises, worker-initiated, NGO and community training initiatives
NSDS Outcome 4.6.1: Cooperatives supported with skills training and development expand and contribute to sector economic and employment growth
NSDS III Objectives / Indicators
FP&M SETA Targets for 2011– 2012
Performance against targets for 2011– 2012 Reasons for Variance
Budget v UtilisedR’000
2011/12
Output 4.6.1.1:SETAs identify in their skills planning research, established and emergent cooperatives and their skills needs.
FP&M SETA develop and implement strategy to address skills needs relating to cooperatives.
The FP&M SETA made provision for the funding of project interventions initiated by cooperatives in its discretionary funding strategy.
The FP&M SETA will engage with co-operatives during the new financial year to discuss a sector strategy as well as possible collaboration projects between the SETA and identified co-operatives active in the sector.
Costs are included in the discretionary grant administrative budget.
Output 4.6.1.2: Sector projects are established by sector stakeholders, supported by the NSF.
Identify 20 cooperatives in the sector and develop a cluster / sector project to address skills needs ( conditional upon NSF / national / provincial government funding).
E-skills (co-operative in KZN) was awarded discretionary project funding.
The FP&M SETA attended a Rural Women Empowerment Expo in Kimberley which was attended by representatives of small businesses and co-operatives from the Northern Cape Region.
(See projects for Rural Areas)
Negative variance of 19 co-operatives.
The FP&M SETA will assist co-operatives to submit funding applications to the NSF or provincial government once a strategy has been finalised.
Budget: NIL
Dependent on external funding.
Output 4.6.1.3: A national database of cooperatives supported with skills development is established and the impact of training reported on.
FP&M develop and maintain a record of interventions involving cooperatives and conduct an impact study on conclusion of the cluster / sector project.
The Project and Monitoring and Evaluation Divisions are keeping record of all SETA funded interventions via the MIS and regular monitoring visits are undertaken. The Research Division will conduct impact studies once projects have been completed.
Met the target - no variance.
Costs are included in the FP&M SETA
administrative budget.
FP&M SETA Annual Report | 2011/1221
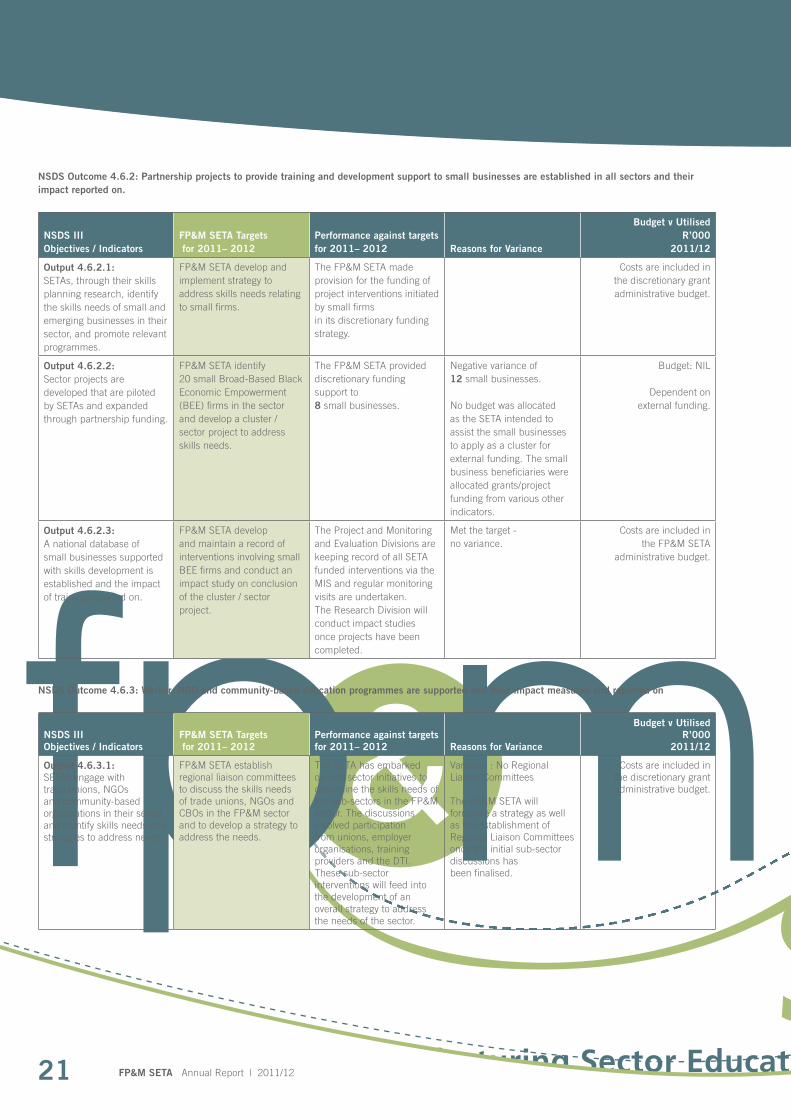
NSDS Outcome 4.6.2: Partnership projects to provide training and development support to small businesses are established in all sectors and their impact reported on.
NSDS III Objectives / Indicators
FP&M SETA Targets for 2011– 2012
Performance against targets for 2011– 2012 Reasons for Variance
Budget v UtilisedR’000
2011/12
Output 4.6.2.1: SETAs, through their skills planning research, identify the skills needs of small and emerging businesses in their sector, and promote relevant programmes.
FP&M SETA develop and implement strategy to address skills needs relating to small firms.
The FP&M SETA made provision for the funding of project interventions initiated by small firms in its discretionary funding strategy.
Costs are included in the discretionary grant administrative budget.
Output 4.6.2.2: Sector projects are developed that are piloted by SETAs and expanded through partnership funding.
FP&M SETA identify 20 small Broad-Based Black Economic Empowerment (BEE) firms in the sector and develop a cluster / sector project to address skills needs.
The FP&M SETA provided discretionary funding support to 8 small businesses.
Negative variance of 12 small businesses.
No budget was allocated as the SETA intended to assist the small businesses to apply as a cluster for external funding. The small business beneficiaries were allocated grants/project funding from various other indicators.
Budget: NIL
Dependent on external funding.
Output 4.6.2.3: A national database of small businesses supported with skills development is established and the impact of training reported on.
FP&M SETA develop and maintain a record of interventions involving small BEE firms and conduct an impact study on conclusion of the cluster / sector project.
The Project and Monitoring and Evaluation Divisions are keeping record of all SETA funded interventions via the MIS and regular monitoring visits are undertaken. The Research Division will conduct impact studies once projects have been completed.
Met the target - no variance.
Costs are included in the FP&M SETA
administrative budget.
NSDS Outcome 4.6.3: Worker, NGO and community-based education programmes are supported and their impact measured and reported on
NSDS III Objectives / Indicators
FP&M SETA Targets for 2011– 2012
Performance against targets for 2011– 2012 Reasons for Variance
Budget v UtilisedR’000
2011/12
Output 4.6.3.1: SETAs engage with trade unions, NGOs and community-based organisations in their sector and identify skills needs and strategies to address needs.
FP&M SETA establish regional liaison committees to discuss the skills needs of trade unions, NGOs and CBOs in the FP&M sector and to develop a strategy to address the needs.
The SETA has embarked on sub-sector initiatives to determine the skills needs of the sub-sectors in the FP&M sector. The discussions involved participation from unions, employer organisations, training providers and the DTI.These sub-sector interventions will feed into the development of an overall strategy to address the needs of the sector.
Variance : No Regional Liaison Committees
The FP&M SETA will formalise a strategy as well as the establishment of Regional Liaison Committees once the initial sub-sector discussions has been finalised.
Costs are included in the discretionary grant administrative budget.

FP&M SETA Annual Report | 2011/12 22
NSDS III Objectives / Indicators
FP&M SETA Targets for 2011– 2012
Performance against targets for 2011– 2012 Reasons for Variance
Budget v UtilisedR’000
2011/12
Output 4.6.3.2: SETAs establish quality pilot projects.
Fund project proposals received from labour unions, NGOs and CBOs to address identified skills needs.
A number of organisations in this category were awarded project funding to address identified skills needs (see details of institutions under committed/voted funds).
Met the target - no variance.
Budget: R2 000Additional Amount Approved
by the Board:R3 756Committed: R882
SA Forestry Contractors Association: R252CEPPWAWU: R630
Voted: R4 874National Clothing Bargaining
Council: R150CEPPWAWU: R2 000
SACTWU: R2 000FAWU: R724
Output 4.6.3.3: Stakeholders expand successful projects with support from the NSF.
Assist labour unions, NGOs and CBOs to submit proposals to NSF.
No progress. The FP&M SETA will assist co-operatives to submit funding applications to the NSF or provincial government once a strategy has been finalised.
Budget: NIL
Dependent on external funding.
NSDS Objective 4.8 Building career and vocational guidance
NSDS Outcome 4.8.1: Career paths are mapped to qualifications in all sectors and sub-sectors, and communicated effectively, contributing to improved relevance of training and greater mobility and progression.
NSDS III Objectives / Indicators
FP&M SETA Targets for 2011– 2012
Performance against targets for 2011– 2012 Reasons for Variance
Budget v UtilisedR’000
2011/12
Output 4.8.1.1: Career guides are developed with labour market information from SETAs, addressing sub-sectors within their sector.
FP&M develop information package pertaining to careers in the sectors and make the information available to DHET for inclusion in National publications, on FP&M website and other printed media (eg brochures).
An FP&M SETA Careers Information Brochure has been compiled and the SETA participated in various career publications during the period under review. The FP&M SETA has compiled a comprehensive Careers Guide, which is currently in draft format and awaiting comment from industry. The publication will be published in the new financial year.
Met the target - no variance.
Included in the Marketing & Communications Budget
FP&M SETA Annual Report | 2011/1223
NSDS IIIObjectives / Indicators
FP&M SETA Targets for 2011– 2012
Performance against targets for 2011– 2012 Reasons for Variance
Budget v UtilisedR’000
2011/12
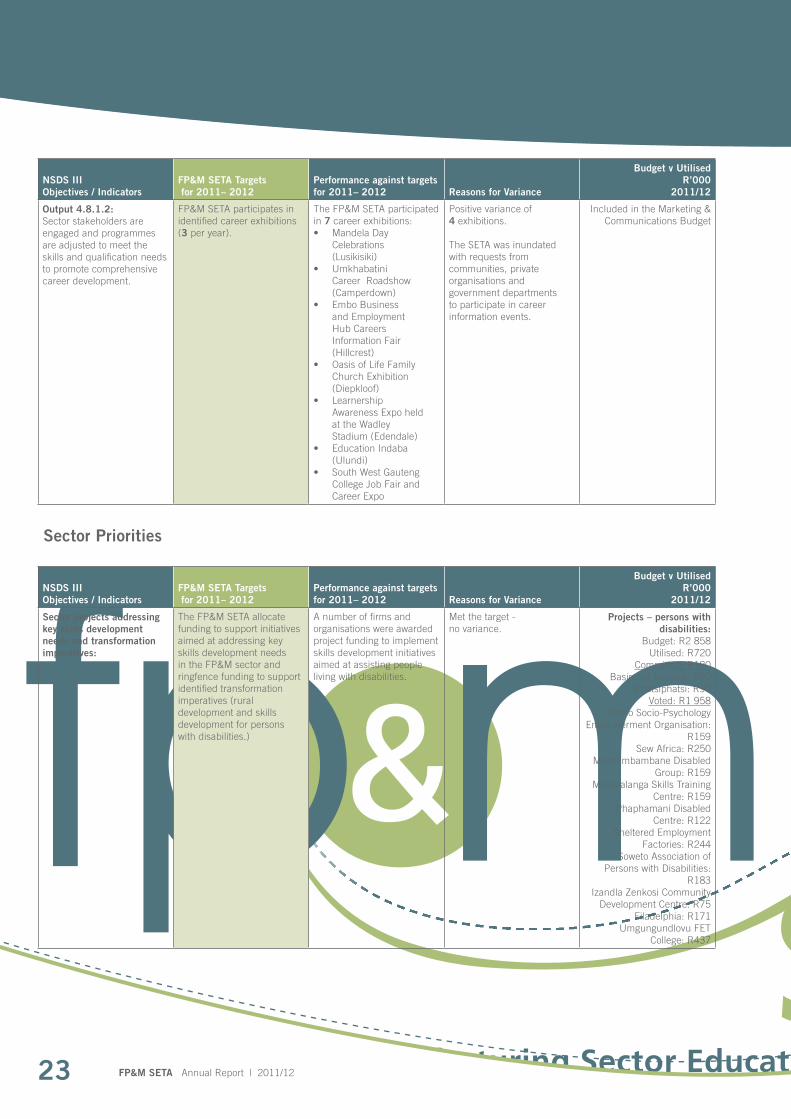
Output 4.8.1.2: Sector stakeholders are engaged and programmes are adjusted to meet the skills and qualification needs to promote comprehensive career development.
FP&M SETA participates in identified career exhibitions (3 per year).
The FP&M SETA participated in 7 career exhibitions: • MandelaDay Celebrations (Lusikisiki) • Umkhabatini Career Roadshow (Camperdown) • EmboBusiness and Employment Hub Careers Information Fair (Hillcrest)• OasisofLifeFamily Church Exhibition (Diepkloof) • Learnership Awareness Expo held at the Wadley Stadium (Edendale) • EducationIndaba (Ulundi) • SouthWestGauteng College Job Fair and Career Expo
Positive variance of 4 exhibitions.
The SETA was inundated with requests from communities, private organisations and government departments to participate in career information events.
Included in the Marketing & Communications Budget
Sector Priorities
NSDS III Objectives / Indicators
FP&M SETA Targets for 2011– 2012
Performance against targets for 2011– 2012 Reasons for Variance
Budget v UtilisedR’000
2011/12
Sector projects addressing key skills development needs and transformation imperatives:
The FP&M SETA allocate funding to support initiatives aimed at addressing key skills development needs in the FP&M sector and ringfence funding to support identified transformation imperatives (rural development and skills development for persons with disabilities.)
A number of firms and organisations were awarded project funding to implement skills development initiatives aimed at assisting people living with disabilities.
Met the target - no variance.
Projects – persons with disabilities:
Budget: R2 858Utilised: R720
Committed: R180Basimodi Training: R90
Phatsiphatsi: R90Voted: R1 958
Batho Socio-Psychology Empo-werment Organisation:
R159Sew Africa: R250
Mashambambane Disabled Group: R159
Mpumalanga Skills Training Centre: R159
Phaphamani Disabled Centre: R122
Sheltered Employment Factories: R244
Soweto Association of Persons with Disabilities:
R183Izandla Zenkosi Community
Development Centre: R75Filadelphia: R171
Umgungundlovu FET College: R437

FP&M SETA Annual Report | 2011/12 24
NSDS IIIObjectives / Indicators
FP&M SETA Targets for 2011– 2012
Performance against targets for 2011– 2012 Reasons for Variance
Budget v UtilisedR’000
2011/12
Sector projects continues: A number of firms and organisations were awarded project funding to implement skills development initiatives in rural areas. (See details of organisations under committed/voted funds).
Met the target - no variance.
Projects – rural development:
Budget: R5 900Utilised: R635
Committed: R808Furniture World Private
College: R600Ditholoana Tsa Setshaba:
R102Striving Minds: R106
Voted: R4 448Parowkloof Investments t/a
L&X Project V: R216Enhlazane: R108
Forestry Skills Injection: R500
Tirhani Skills Training:R72 Alliance for Poor, Orphaned
and Unemployed: R300E-Skills: R400
DUT & Injija Interiors: R144Eyomama in Agriculture and
Rural Development KZN: R460
Zusbo Forestry Contractors: R144
Mondisa Co-operative: R450Tipfuxeni Community: R450
DevelopmentNational Department of
Public Works: R128Tsakarhula Khensani
Trading: R252Genesis Power Trading
Enterprise: R324Mitchells Plain Skills
Centre:R500Unallocated funding: R10

FP&M SETA Annual Report | 2011/1225
NSDS III Objectives / Indicators
FP&M SETA Targets for 2011– 2012
Performance against targets for 2011– 2012 Reasons for Variance
Budget v UtilisedR’000
2011/12
Sector projects continued: A number of firms and organisations were awarded project funding to address key skills development needs in the FP&M sector(See details of organisations under committed /voted funds).
Met the target - no variance
Projects – sector skills priorities:
Budget: R5 213Additional Amount Approved
by the Board: R2 196Utilised: R576
Committed: R152CN Business Furniture: R50
Sycint Trading: R102DAFF: R1 746Voted:R4 996
Africa Skills Village R280Cape Clothing Association:
R145 Publishing SA: R900
Duduza Development: R108Eastern Cape
Communication Forum: R60Sol Plaatje Institute for
Media Leadership, School of Journalism and Media
Studies, Rhodes University: R480
Printing SA: R179Eddels Shoes (PTY) Ltd:
R225PIFSA: R900
Experiential Learning (Internal Project): R1 000
CPUT: R168Western Cape Furniture
Initiative WCFI): R150Hope Training &
Development Centre: R144Blessings are Forever
Training & Projects: R108National Bargaining Council of the Wood & Paper Sector:
R44Hays Print: R35
Intrepid Printers: R70

FP&M SETA Annual Report | 2011/12 26
The FP&M SETA Head Office and Gauteng Regional Office is situated at Tuscany Office Park, Building 2, 6 Coombe Place, Rivonia, Sandton. Tel: 011 234 2311.
The FP&M SETA Western Cape Regional Office is situated at 301 Premier Centre, 451 Main Road, Observatory, Cape Town. Tel: 021 447 3373.
The FP&M SETA KZN Regional Office is situated on the 2nd & 3rd Floor, Umdoni Centre, 28 Crompton Street, Pinetown. Tel: 031 702 4482.
fp&M SetA officeS

FP&M SETA Annual Report | 2011/1227
Introduction
The FP&M SETA’s interim accounting and administrative controls provide reasonable assurance to all stakeholders that their interests are safeguarded and that all transactions are executed and recorded in accordance with generally accepted business practices and strict internal policies and procedures. The Finance Department is comprised of a centralised function by which supply chain management and financial management services are rendered to the entity.
On 1 April 2011 CTFL SETA, FIETA and identified sub-sectors of MAPPP-SETA amalgamated to form FP&M SETA. The finance department has played a significant role in merging three financial systems into one and has effectively supported the entity with a view to deliver on its key performance objectives. Support was focussed on ensuring that mandatory and discretionary grants were paid timeously while also ensuring sound governance and compliance with applicable legislation. An interim MIS system was put in place to allow the SETA to operate from one MIS system.
The Finance Department is responsible for the processing of payments and data integrity of financial records including the preparation of financial statements, annual budgets, budgetary control and monthly and quarterly financial reports. It further oversees and monitors the cash management requirements of the entity by implementing the FP&M SETA investment policy.
Financial Stability
All SETAs have been established for a period of five years ending on the 31 of March 2016 and are required to apply for re-establishment during the course of the financial year ending 2016.The Act required in Section 9A (4) that when FP&M SETA was established, all the assets, rights, liabilities and obligations of the amalgamating SETAs namely CTFL SETA, FIETA and part of the MAPPP-SETA would upon dissolution, vest in the FP&M SETA. The Annual Financial Statements for FP&M SETA have therefore been prepared as a going concern.
Revenue
The revenue for the FP&M SETA amounted to R308 million for the first year of its license. R274,6 million was received in skills development levies which was split into R35, 5 million for administration, R173,1 million for mandatory grants and R65,5 million for discretionary funding. R2,9 million was received by FP&M SETA for interest and penalties on skills development levies paid over to SARS. FP&M SETA received R11,7 million in donor funding for which the conditions were met. Investment income totalled R18,7 million.
Ms. Gina LayzellChief Financial Officer
RepoRt fRoM the chief finAnciAl officeR

FP&M SETA Annual Report | 2011/12 28
Investment Income
Section (31.3.3) of Treasury regulations instructs schedule 3A and 3C entities to invest with the Corporation for Public Deposits (CPD). FP&M SETA has invested excess funds with the CPD in line with its investment policy.
Expenditure
Resources of the entity have been applied strictly in accordance with its approved budget. Funds were reallocated within its administrative budget during the year between items where there was a saving to line items which were under strain. This reallocation was approved by the Finance and Projects Committee and the FP&M SETA Board during the financial year. The total administrative expenditure totalled R31 million. The life of the fixed assets inherited by FP&M SETA were extended in line with the policies of FP&M SETA. This had a positive effect on depreciation which contributed to the administrative surplus.
FP&M SETA places significant emphasis on its internal controls to ensure that it delivers on its key performance objectives within an environment conducive to sound corporate governance. To enable management to do so, the Board sets standards for internal control aimed at reducing the risk of error or loss in a cost effective manner. The internal accounting and administrative controls provide reasonable assurance that assets are safe guarded and that transactions are executed and recorded in accordance with Standards of Generally Recognised Accounting Practice (GRAP) and adopted policies.
The overall financial strategy is therefore to optimize working capital requirements by curtailing overhead expenditure where possible. Administration expenditure was well contained in accordance with the budget approved by the Board for the 2011/2012 financial year which totaled R37 million. Actual expenditure on administrative expenses has been R31 million.
Commitments
As a result of the Minister of Higher Education’s decision to restructure the SETA landscape, the sub-sectors of the former MAPPP-SETA were split between three (3) SETAs, these being the FP&M SETA, CATHSSETA and MICT SETA. This required a delineation process whereby the assets and commitments of the former MAPPP-SETA were divided between the SETAs. During the delineation process, the FP&M SETA Finance and Projects Divisions aligned the apprenticeship contracts inherited from the MAPPP-SETA to the commitments reported in the 2011/12 financial year. The process to confirm these commitments with the effected parties is still underway and as a result the FP&M SETA considered it prudent to disclose the total commitment reported in the MAPPP-SETA commitments register to accommodate all possible claims for apprenticeships grants that may arise once the process has been completed.
During the audit process, the AGSA was unable to confirm the occurrence, accuracy, and completeness of the apprenticeships commitments inherited from the former MAPPP-SETA and reported a finding that the FP&M SETA did not have adequate systems in place to monitor the apprenticeships commitments inherited from the former MAPPP-SETA. As a result the AGSA issued a qualified audit opinion.
The FP&M SETA has put an action plan in place to resolve the matter and to implement further controls to strengthen our project management processes.
Gina LayzellChief Financial Officer

FP&M SETA Annual Report | 2011/1229
RepoRt of Audit coMMittee of the fp&M SetA
in Respect of the Year Ended 31 March 2012
The Audit Committee is pleased to present its report for the financial year ended 31 March 2012.
Audit Committee Members and Attendance
The Audit Committee consists of the members listed hereunder. It is required to meet at least four times per annum in terms of its Board approved terms of reference. During the 2011/2012 financial year, 3 meetings were held:
Interim Audit Committee for the period 01 April 2011 to 30 September 2011
Member Membership Status
No of Meetings Attended
Mr. Trevor Boltman (Chairman) Independent Chairperson 1 of 1
Mr. Rob Whiteford Independent Member 1 of 1
Mr. Duke Sidaki Independent Member 1 of 1
Mr. Richard Kinnear Independent Member 1 of 1
Mr. Roger Godsmark Member: Employer Representative 1 of 1
Audit Committee for the period 01 October 2011 to 31 March 2012
Member Membership Status
No of Meetings Attended
Mr. Trevor Boltman (Chairman) Independent Chairperson 2 of 2
Ms. Motseoa Lugemwa Independent Member 2 of 2
Ms. Wasanya Methola Independent Member 1 of 2
Mr. Zakariya Suder Labour Representative 1 of 2
Mr. Roger Godsmark Employer Representative 2 of 2
It must be noted that the FP&M SETA appointed an Interim Audit Committee during August 2011 and that the current Audit Committee was appointed during November 2011.
Audit Committee ResponsibilityThe Audit Committee has complied with its responsibilities as stipulated in Section 77 of the Public Finance Management Act 1 of 1999 and Treasury Regulation 3.1.
The Audit Committee also reports that it has adopted, with approval from the Board, appropriate formal terms of reference as its Audit Committee Charter.
This Audit Committee Charter will be reviewed on an annual basis to ensure its continuing relevance and effectiveness. The Audit Committee has regulated its affairs in compliance with this charter and has discharged all its responsibilities as contained therein.
Both the Audit Committee and Internal Audit terms of reference are reviewed and revised on an annual basis.
Mr. Trevor BoltmanChairman of the Audit Committee

FP&M SETA Annual Report | 2011/12 30
Effectiveness of Internal Controls
The Audit Committee is of the opinion, based on the information and explanations given by management and discussions with the independent external auditors (Auditor-General of South Africa) on the results of its audits, that the internal accounting controls are operating to ensure that the financial records may be relied upon for preparing the Annual Financial Statements, and that accountability for assets and liabilities is maintained.
However, it must be reported that there were incidents where the control system was found to be lacking. More information relating to this can be found in the Accounting Authority’s report, AGSA’s report and the financial statements.
Accordingly, we can report that the system of internal control for the period under review was efficient and effective, except for those areas which were raised by the AGSA.
Evaluation of Annual Financial Statements
The Audit Committee has reviewed and discussed:
• TheauditedAnnualFinancialStatementstobeincludedintheannualreport with the Auditor-General and the Accounting Authority;
• Managementletterandmanagement’sresponsethereto;and• Reviewedsignificantadjustmentsresultingfromtheaudit.
The Audit Committee concurs and accepts the Auditor-General South Africa’s conclusions on the Annual Financial Statements and is of the opinion that the audited Annual Financial Statements be accepted and read together with the report of the Auditor-General and has recommended these to the Board for adoption.
Conclusion
In our opinion, based on feedback to Audit Committee meetings, both general and specific controls have been identified with weak areas for urgent attention. These areas are being addressed and this corrective process must be ongoing and conclusive to mitigate the risk of not achieving FP&M SETA’s agreed strategic objectives. In our opinion, based on feedback to the Audit Committee meetings, the FP&M SETA’s key performance indicators are being monitored within the environmental and cash flow constraints this SETA faces. The FP&M SETA is achieving in most key performance areas.
Trevor Boltman

FP&M SETA Annual Report | 2011/1231
REPORT ON THE FINANCIAL STATEMENTS
Introduction
1. I have audited the financial statements of the Fibre Processing and Manufacturing Sector Training and Authority (FP&M SETA) set out on pages 41 to 84, which comprise the statement of financial position as at 31 March 2012, the statement of financial performance, statement of changes in net assets and the cash flow statement for the year then ended, the notes, comprising a summary of significant accounting policies and other explanatory information.
Accounting authority’s responsibility for the financial statements
2. The accounting authority is responsible for the preparation and fair presentation of these financial statements in accordance with South African Standards of Generally Recognised Accounting Practice (SA Statements of GRAP) and the requirements of the Public Finance Management Act of South Africa, 1999 (Act No. 1 of 1999) (PFMA), and for such internal control as the accounting authority determines is necessary to enable the preparation of financial statements that are free from material misstatement, whether due to fraud or error.
Auditor-General’s responsibility
3. My responsibility is to express an opinion on these financial statements based on my audit. I conducted my audit in accordance with the Public Audit Act of South Africa, 2004 (Act No. 25 of 2001) (PAA), the General Notice issued in terms thereof and International Standards on Auditing. Those standards require that I comply with ethical requirements and plan and perform the audit to obtain reasonable assurance about whether the financial statements are free from material misstatement.
4. An audit involves performing procedures to obtain audit evidence about the amounts and disclosures in the financial statements. The procedures selected depend on the auditor’s judgement, including the assessment of the risks of material misstatement of the financial statements, whether due to fraud or error. In making those risk assessments, the auditor considers internal control relevant to the entity’s preparation and fair presentation of the financial statements in order to design audit procedures that are appropriate in the circumstances, but not for the purpose of expressing an opinion on the effectiveness of the entity’s internal control. An audit also includes evaluating the appropriateness of accounting policies used and the reasonableness of accounting estimates made by management, as well as evaluating the overall presentation of the financial statements.
5. I believe that the audit evidence I have obtained is sufficient and
appropriate to provide a basis for my qualified audit opinion.
Basis for qualified opinion
6. Included in the commitments in note 26 to the annual financial statements is an amount of R 37 890 000 relating to apprenticeships of the ex-MAPPP-SETA. I was unable to confirm the occurrence, accuracy and completeness as the entity did not have adequate systems in place to monitor these apprenticeship commitments. As a result, I have modified my opinion accordingly. I was also unable to confirm the disclosure by alternative means.
Opinion
7. In my opinion, except for the effects of the matter described in the Basis for qualified opinion paragraph, the financial statements present fairly, in all material respects, the financial position of the Fibre Processing and Manufacturing Sector Training and Authority (FP&M SETA) as at 31 March 2012, and their financial performance and cash flows for the year then ended in accordance with South African Standards of Generally Recognised Accounting Practice (SA Statements of GRAP) and the requirements of the Public Finance Management Act of South Africa, 1999 (Act No. 1 of 1999) (PFMA).
Additional matters 8. I draw attention to the matters below. My opinion is not modified in
respect of these matters.
The amalgamation process of FP&M SETA
9. The FP&M SETA was established on 1 April 2011 from the amalgamation of three SETAs, namely the Clothing, Textiles, Footwear and Leather SETA (CTFL SETA), Forest Industries SETA (FIETA) and a part of the Media, Advertising, Publishing, Printing and Packaging SETA (MAPPP-SETA) as disclosed in note 13 of the annual financial statements.
Comparative figures
10. The FP&M SETA will not be reporting on comparative figures because this is the first year of existence of the SETA as disclosed in note 13.
REPORT ON OTHER LEGAL AND REGULATORY REQUIREMENTS
11. In accordance with the PAA and the General Notice issued in terms thereof, I report the following findings relevant to performance against predetermined objectives, compliance with laws and regulations and internal control, but not for the purpose of expressing an opinion.
RepoRt of the AuditoR-GeneRAl to the pARliAMent on finAnciAl StAteMentS
of the fp&M SetA

FP&M SETA Annual Report | 2011/12 32
Predetermined objectives
12. I performed procedures to obtain evidence about the usefulness and reliability of the information in the annual performance report as set out on pages 09 to 25 of the annual report.
13. The reported performance against predetermined objectives was evaluated against the overall criteria of usefulness and reliability. The usefulness of information in the annual performance report relates to whether it is presented in accordance with the National Treasury annual reporting principles and whether the reported performance is consistent with the planned objectives. The usefulness of information further relates to whether indicators and targets are measurable (i.e. well defined, verifiable, specific, measurable and time bound) and relevant as required by the National Treasury Framework for managing programme performance information.
The reliability of the information in respect of the selected objectives development priorities or objectives is assessed to determine whether it adequately reflects the facts (i.e. whether it is valid, accurate and complete).
14. There were no material findings on the annual performance report concerning the usefulness and reliability of the information.
Additional matter
15. Although no material findings concerning the usefulness and reliability of the performance information were identified in the annual performance report, I draw attention to the following matter below.
Achievement of planned targets
16. The FP&M Seta has not achieved 51% of all the planned targets. The reasons for non-achievement have been disclosed on the performance annual report, the non-achievement can be mainly ascribed to underspending of the allocated budget.
Compliance with laws and regulations
17. I performed procedures to obtain evidence that the entity has complied with applicable laws and regulations regarding financial matters, financial management and other related matters. My findings on material non-compliance with specific matters in key applicable laws and regulations as set out in the General Notice issued in terms thereof issued in terms of the PAA are as follows:
Internal audit was not effective for the year under review
18. The internal audit function did not adhere to the requirements of Treasury Regulation 27.2.7 in that no internal audit reports detailing the performance against the plan were submitted by the appointed internal audit, and it could not be verified that internal audit did contribute towards developing recommendations for the enhancement or improvement of the processes.
Risk assessment
19. The FP&M SETA has not performed a risk assessment to determine the material risks to which the entity is exposed as required by Treasury Regulations 27.2.1.
Internal control
20. I considered internal control relevant to my audit of the financial statements, annual performance report and compliance with laws and regulations. The matters reported below under the fundamentals of internal control are limited to the significant deficiencies that resulted in the findings on the annual performance report and the findings on compliance with laws and regulations included in this report.
Leadership
21. The accounting authority did not implement adequate controls to ensure that all planned targets are achieved as set out in the strategy document at the FP&M SETA.
22. Management did not perform a risk assessment to identify risks that the FP&M SETA will be exposed to in the current reporting period.
Financial and performance management
23. The accounting authority did not implement adequate controls to ensure that the commitment register at year-end reflects accurate balances.
24. There was a lack of adequate monitoring and evaluation controls relating to apprenticeships.
Governance
25. Internal audit did not fulfil its responsibilities as set out in legislation and in accordance with accepted best practice and standards.
Pretoria31 July 2012

FP&M SETA Annual Report | 2011/1233
contentS
Statement of Responsibility ....................................................... 34
Report of the Accounting Authority of the FP&M SETA ............... 35
Statement of Financial Performance .......................................... 41
Statement of Financial Position ................................................. 42
Statement of Changes in Net Assets .......................................... 43
Cash Flow Statement ................................................................ 44
Accounting Policies to the Annual Financial Statements ............. 45
Notes to the Annual Financial Statements ................................. 50
AnnuAl finAnciAl StAteMentS
33

Chairman of the Audit Committee It is the FP&M SETA Board’s responsibility to oversee the preparation of the SETA’s Annual Financial Statements and to ensure that the Annual Financial Statements fairly present the SETA’s financial position at 31 March 2012 and the financial transactions conducted during the period under review. The Annual Financial Statements have been prepared in accordance with the Statements of Generally Accepted Accounting Practice (GAAP) and Generally Recognised Accounting Practice (GRAP) as prescribed in the Treasury Regulations and the Public Finance Management Act, 1999 (Act No. 1 of 1999) and relevant guidelines issued by the National Treasury.
It was the responsibility of the FP&M SETA Board during the period under review to:• GuidestafffromthethreeformerSETAsduringtheamalgamationprocess
and to establish a new SETA for the Fibre Processing and Manufacturing sector;
• Provideeffective leadershipand toensure implementationof thegoalsof NSDS III as set out in the SETA’s five year 2011 – 2016 Strategic Plan and 2011 – 2012 Annual Performance Plan as contained in the 2011- 2012 Service Level Agreement entered into with the Minister of Higher Education and Training; and
• Approvepoliciesandprocedurestogoverntheactivitiesandconductofthe Board, Committee and staff members of the SETA in order to ensure good governance and transparency in all SETA business practices.
The FP&M SETA Board and Audit Committee continuously monitored the implementation of the policies and procedures across all governance structures and SETA departments to ensure ethical conduct, fair practice and
StAteMent of ReSponSibility by the fp&M SetA boARdfor the period ending 31 March 2012
sound financial management.
The FP&M SETA Board is confident that the financial management of the FP&M SETA has been conducted in accordance with the SETA’s Financial Policies and Procedures that comply with the Public Finance Management Act, 1999 (Act No. 1 of 1999).
The Board has adopted the going concern basis in preparing the Annual Financial Statements and it is not aware of any matters or circumstances arising since the end of the financial year not otherwise dealt with in the Annual Financial Statements, which will have a significant effect on the operations or financial position of the SETA.
The FP&M SETA Annual Financial Statements for the year ending 31 March 2012 as set out on page 41 to 84 were approved by the FP&M SETA Board on 30 May 2012 and signed on its behalf by:
Mr. Sipho NgidiChairperson
Mr. Bheki Zulu Acting Chief Executive Officer
34FP&M SETA Annual Report | 2011/12

FP&M SETA Annual Report | 2011/1235
Report of the Accounting Authority of the FP&M SETA to the Department of Higher Education and Training (DHET) and Parliament of the Republic of South Africa for the year ended 31 March 2012.
The Fibre Processing and Manufacturing Sector Education and Training Authority (FP&M SETA) has been established in terms of Section 9(1) of the Skills Development Act, 1998 (Act No.97 of 1998) as amended, as a Sector Education and Training Authority with effect from 1 April 2011 to 31 March 2016.
Business Address
Building 2, Tuscany Office Park, 6 Coombe Place, Rivonia, Sandton, 2128.
The FP&M SETA is governed by:
1. Section 9 of the Skills Development Act, 1998 (Act No.97 of 1998) as amended;2. Skills Development Amendment Act, 2008 (Act No.37 of 2008);3. Skills Development Amendment Act, 2011 (Act No. 26 of 2011)4. The South African Qualifications Authority Act, 1995 (Act No.58 of 1995); 5. The National Qualifications Framework Act, 2008 (Act No. 67 of 2008);6. The Skills Development Levies Act, 1999 (Act No.09 of 1999); 7. The Public Finance Management Act, 1999 (Act No.01 of 1999) as
amended); and8. Treasury Regulations for Departments, Constitutional Institutions and
Public Entities.
General review of the state of financial affairs
Levy Income
Despite the ongoing economic downturn which put many companies under economic strain resulting in the retrenchment of hordes of employees and even closure of factories, the skills development levy income received by FP&M SETA increased from R244 million to R274 million when comparing the levies received by FP&M SETA to the levies received in the former SETAs, namely CTFL SETA, FIETA and MAPPP-SETA sub-sectors. This reflected a marginal increase of R30 million. This put the newly formed SETA in a better position to broaden its service offerings and enhance the quality of its administration and also meeting the costs of amalgamating the former SETAs.
Administration expenses
In terms of Section 14 (3) of the Skills Development Act (Act No.97 of 1998, as amended), the Minister must prescribe the limit within which the SETA shall pay its administration expenses (currently 10%) of the skills development levies payable by the employers within the sector to fund the administration costs of the SETA. FP&M SETA informed the DHET on 13 November 2011 of the potential for the SETA to exceed the regulated 10% threshold based on a budgeted increase in levies of 3% as the Board agreed to a conservative budget approach. The actual administrative expenses have not exceeded the total administrative levies received by FP&M SETA as the total skills levy income received by FP&M SETA exceeded the budgeted skills levy income and FP&M SETA did not exceed the total budgeted administration expenses.
Services rendered by the FP&M SETA
In terms of its legislative mandate, the FP&M SETA is required to execute the following functions:
• Facilitate,coordinateandmonitortheimplementationoftheNSDSIIIinthe FP&M sector;
• Develop and implement an effective andefficient sector skills strategyaligned to the Sector Skills Plan (SSP) to address critical and scarce skills in the FP&M sector;
• Support the development of the skills of employees in the sector toimprove their quality of life and labour market prospects;
• Strengthen the institutional capacity of the SETA to improve servicedelivery to its stakeholders; Promote workplace skills planning and increased investment in skills development, resulting in improved performance, productivity and competitiveness;
• Promoteaccesstotheworldofworkforpersonsfromdesignatedgroupsby providing skills development opportunities and facilitating work placement for learners and graduates;
• Provideskillsdevelopmentsupporttonewventures,smallfirms,informalsector, cooperatives community based organisations and other income generating initiatives for the unemployed;
• Promote quality occupation-based learning through implementation ofpivotal learning programmes including apprenticeships and learnerships; and
• Promote effective communication between all parties involved in skillsdevelopment including employers, educational institutions and other bodies including the QCTO.
RepoRt of the AccountinG AuthoRity of the fp&M SetA

FP&M SETA Annual Report | 2011/12 36
Background
In November 2010, the Minister of Higher Education and Training announced the new SETA landscape which inter alia required the amalgamation of the CTFL SETA, FIETA and the printing, packaging, print media and publishing sub-sectors of MAPPP-SETA.
The DHET facilitated the amalgamation process through the appointment of a project manager, supported by staff from the Department and legal service provider. Stakeholder representatives from the CTFL SETA, FIETA and the affected sectors from MAPPP-SETA were nominated to serve on an Amalgamation Task Team with the DHET team to thrash out the details of the amalgamation process. Meetings of the task team were facilitated by the legal advisors.
During the first meeting of the task team in January 2011, a Memorandum of Understanding (MoU) was developed to provide structure to the process and to guide the operations of the task team. The MoU was finalised and signed at the second meeting of the Amalgamation Task Team which took place in February 2011.
The Amalgamation Task Team met four (4) times between January and March 2011 to deal with matters such as the development of the Interim Constitution, representation of the fibre processing and manufacturing constituents on governance structures, development of a staff organogram and an analysis of contractual commitments of the three SETAs that were to be disbanded.
A smaller Steering Committee drawn from the members of the Amalgamation Task Team was appointed to meet on a more regular intervals to address the details around rolling out the operations of the FP&M SETA asfrom 1 April 2011, employment of staff and matters relating to the financial management of the SETA. Task teams comprising staff from the three affected SETAs, were established to set up effective systems and procedures relating to the core performance areas of the SETA e.g. skills planning, finance and supply chain management and ETQA. These teams developed draft policies and processes based on best practices taken from the SETAs to ensure a seamless transfer of operations from the SETAs that were to be dissolved to the new one post 31 March 2011.
Due to the fact that the MAPPP-SETA was not to be merged with CTFL SETA and FIETA in its entirety, but instead was to be divided between the FP&M SETA, CATHSSETA and MICT SETA, parallel discussions took place to determine the delineation of assets and discretionary fund commitments between the FP&M SETA and the other two SETAs.
The collective effort of the Amalgamation Task Team and the DHET resulted in the signing of an Interim Constitution on 28 March 2011 to govern the soon to be established FP&M SETA during the first six (6) months of its existence.
The FP&M SETA was established on 1 April 2011 by the Minister of Higher Education and Training. The Amalgamation Task Team was replaced by an Interim Board, appointed by the Minister to take responsibility for the governance of the FP&M SETA over the following six (6) months during which it was expected all activities related to the amalgamation process would have been concluded.
FP&M SETA Constitution and Governance Structures
The FP&M SETA is governed by its Constitution which provides an “institutional framework for the SETA to develop and implement national, sectoral and workplace strategies, in order to develop and improve the skills of the South African workforce”.
The Interim Constitution made provision for the establishment of an Interim Board comprising of 12 members representing stakeholder constituencies (six (6) employer and six (6) labour representatives) and six (6) observers (three (3) employer and three (3) labour representatives). In addition to this, the Minister of Higher Education and Training directly appointed three individuals to serve on the FP&M SETA Board, one (1) as an independent chairperson and the other two (2) as members of this SETA governance structure.
The Interim Board met five (5) times during their tenure and provided leadership to senior management and staff to finalise the amalgamation process. Meetings were focussed on addressing issues such as staffing, financial management, performance management and policy development. The Interim Board also provided assistance to senior management and staff with the compilation of an integrated FP&M SETA Sector Skills Plan and Strategic Plan for the period 2011 – 2016 and approved policies and procedures to ensure sound corporate governance and financial management during the transitional period.
As part of their responsibilities, the Interim Board appointed an interim executive management team to set up and manage the FP&M SETA operational processes, thereby ensuring the continuation of service provision to the fibre processing and manufacturing sector.
In August 2011, the SETA called for nominations of members to serve on the permanent FP&M SETA Board. The nominations were submitted to the Minister of Higher Education and Training for approval. This was followed by the signing of the FP&M SETA Constitution (based on the standard constitution for SETAs) on 9 September 2011. The Minister of Higher Education and Training formally appointed the FP&M SETA Board members on 3 October 2011 for the period 1 October 2011 – 31 March 2016.
The FP&M SETA Board comprises of 15 Board members (an independent chairperson, six (6) employer and six (6) labour representatives and two (2) ministerial appointees). The Board met twice during the period October 2011 to March 2012 and participated with the FP&M SETA management team in a two-day workshop in November 2011 to provide input into the strategic planning processes of the SETA for the term of the NSDS III. Meetings of the Board were conducted in line with the procedures set out in the Constitution and duties were carried out in a fair and responsible manner.

FP&M SETA Annual Report | 2011/1237
In addition to the Board, the following essential committees were established according to the requirement of the FP&M SETA Constitution to oversee financial and operational activities of the SETA:
• ExecutiveCommittee(EXCO)whichmeetsmonthlytoprovideoperationalguidance to the SETA management team. The EXCO is chaired by the chairperson of the Board;
• FinanceandProjectsCommitteewhichmakesrecommendationstotheBoard on matters relating to the financial activities of the SETA and the management of discretionary funding allocation;
• Human Resources and Remuneration Committee which makesrecommendations to the Board with regards to the management of human resources as well as the remuneration of staff, Board members and committee members;
• GovernanceandStrategyCommitteewhichprovidesinputintotheSETA’sannual strategic planning process and oversee the implementation of good governance principles. The chairperson of the Board is an ex-officio member of this committee; and
• An independentAuditCommitteewhich is chairedbyan independentchairperson appointed by the Board. The Audit Committee monitors and reinforces the effectiveness of both the internal control system and the internal audit function. A separate report from the chairperson of the Audit Committee is included on pages 29 to 30.
Attendance of Board meetings FP&M SETA Interim Board (Period 1 April 2011 to 30 September 2011)
Representative Constituency Membership Status Attendance of meetings
Ms. Abieda Abrahams Organised Labour - SACTWU Member 4 of 5
Mr. Johann Baard Organised Business - Clothing Member 1 of 5
Mr. David Bowen Organised Business - Textiles Member 5 of 5
Ms. Daphne Erasmus Organised Business - Printing Member 3 of 5
Mr. Derick Fredericks Organised Labour - SATU Member 5 of 5
Mr. Roger Godsmark Organised Business - Forestry Observer 4 of 5
Ms. Suzan Khumalo Organised Labour - SACTWU Observer 2 of 5
Mr. Chris Kilowan Ministerial Appointee Member 0 of 5
Mr. Andre Kriel Organised Labour - SACTWU Member 4 of 5
Mr. Patrick Lacy Organised Business - Printing & Packaging Observer 3 of 5
Mr. Tandile Maliti Organised Labour - SACTWU Observer 4 of 5
Mr. Michael Mokoana Organised Labour - CEPPWAWU Member 5 of 5
Ms. Jane Molony Organised Business - Paper & Pulp Member 5 of 5
Ms. Devarani Naidoo Organised Labour - SACTWU Observer 5 of 5
Mr. Sipho Ngidi Ministerial Appointee Independent Chairperson 5 of 5
Mr. Nhlanhla Ngubane Organised Business - Publishing Member 4 of 5
Mr. Michael Ngwenya Organised Labour - NULAW Member 3 of 5
Adv. Michelle Odayan Ministerial Appointee Member 3 of 5
Mr. Mlamleli Pukwana Organised Labour - FAWU Member 5 of 5
Mr. Paul Theron Organised Business - Footwear & Leather Observer 3 of 5
Mr. Mike Truelock Organised Business - Paper & Pulp Member 5 of 5
The independent members serving on the Audit Committee were appointed through a public nomination process. One (1) employer and one (1) labour representative were appointed through internal stakeholder nomination processes. Members serving on the other essential committees were appointed through internal stakeholders’ nomination processes and committees comprise equal labour and employer representation.
The FP&M SETA Board and committees support the principle of good corporate governance as contained in the King III Report.
The Code of Conduct contained in the Constitution guided the conduct of members of the Board and committees and provided an ethical framework for the functioning of the FP&M SETA governance structures. Policies and procedures for disclosure of interest and gifts were developed and implemented.
The FP&M SETA professional staff was governed in the execution of their duties by policies and procedures and acceptable practices and was advised by the SETA Board and committee members in areas where additional expertise was required.
The FP&M SETA complied with the relevant laws and regulations of the country as constituted.

FP&M SETA Annual Report | 2011/12 38
FP&M SETA Board (Period 1 October 2011 to 31 March 2012)
Representative Constituency Membership Status Attendance of meetings
Mr. Johann Baard Organised Business - Clothing Member 1 of 2
Mr. David Bowen Organised Business - Textiles Member 2 of 2
Ms. Daphne Erasmus Organised Business - Printing and Packaging Member 2 of 2
Mr. Derick Fredericks Organised Labour - SATU Member 2 of 2
Mr. Roger Godsmark Organised Business - Forestry Member 1 of 2
Ms. Suzan Khumalo Organised Labour - SACTWU Member 2 of 2
Mr. Andre Kriel Organised Labour - SACTWU Member 1 of 2
Mr. Tandile Maliti Organised Labour - SACTWU Member 2 of 2
Mr. Michael Mokoana Organised Labour - CEPPWAWU Member 2 of 2
Ms. Devarani Naidoo Organised Labour - SACTWU Member 2 of 2
Mr. Sipho Ngidi Ministerial Appointee Independent Chairperson 1 of 2
Adv. Michelle Odayan Ministerial Appointee Member 1 of 2
Mr. Sipho Sono Ministerial Appointee Member 2 of 2
Mr. Mike Truelock Organised Business - Paper & Pulp Member 2 of 2
Mr. Brian Wafawarowa Organised Business - Publishing Member 1 of 2
Remuneration of Accounting Authority and Committee Members
During the amalgamation discussions, it was agreed by the parties that constituency representatives serving on the SETA governance structures would not receive remuneration and the principle was written into the Interim Constitution. Although this principle is not contained in the current Constitution (which is based on the standard SETA constitution), the Board continued to honour the agreement when they approved the remuneration structure for Board and committee members on 24 November 2011. The Board based its remuneration structure on the recommendations
provided by the DHET and National Treasury and stipulated that remuneration would only apply to ministerial appointees, independent members of the Audit Committee and, on application, to members of the Board/committees who are not employed by the constituencies they represent.
In the period under review, the following Board and/or committee members received remuneration and the total amount paid in this regard was R 206 137.
Name Status of MembershipNumber of
meetingsMeeting
Attendance fee Travel Expenses Board Fee Total
Mr. Sipho NgidiIndependent Chairperson - Board / Exco 13 R43 219 R6 570 R69 293 R119 082
Mr. Sipho Sono Ministerial Appointee - Board 1 R3 055 R464 R4 810 R8 329
Adv. Michelle Odayan Ministerial Appointee - Board 3 R9 165 - R14 431 R23 596
Mr. Nhlanhla NgubaneIndependent member - Interim Board 5 R15 275 R2 745 R24 051 R42 071
Mr. Trevor BoltmanIndependent Chairperson - Audit Committee 4 R6 309 R1 373 - R7 681
Ms. Motseoa LugemwaIndependent Member - Audit Committee 1 R741 - - R 741
Mr. Duke SidakiIndependent Member - Interim Audit committee 1 R1 855 R65 - R1 920
Mr. Rob WhitefordIndependent Member - Interim Audit committee 1 R1 235 - - R1 235
Mr. Richard KinnearIndependent Member - Interim Audit committee 1 R1 482 - - R1 482
TOTAL R82 336 R11 217 R112 585 R206 137

FP&M SETA Annual Report | 2011/1239
Risk Management and Fraud Prevention
During the amalgamation discussions, it was determined that the process would involve the joining of three (3) going concerns and not the establishment of a new organisation in the strictest sense. This made provision for the transfer of existing policies, procedures, employment contracts and agreements to the amalgamated organisation. The former SETAs had existing Risk Management Frameworks in place, which included processes to identify and manage risk through the implementation of effective internal controls.
A process to update the FP&M SETA Risk Profile and to develop an integrated Risk Management Framework commenced in the latter part of the financial year and will be completed in the new year to identify new inherent and external factors that could pose a threat to the organisation. A Risk Management Policy was developed in consultation with the Audit Committee and the policy will be tabled for approval early in the new financial year.
The Fraud Prevention Plans inherited from the former SETAs were applied to protect the SETA’s revenue, expenditure, assets and reputation from attempts by any person to gain financial or other benefit in an unlawful, dishonest or unethical manner.
Internal Audit Function
The FP&M SETA entered into an agreement with the Internal Audit Unit of the KZN Provincial Treasury to conduct regular internal audits according to an agreed internal audit plan. The Internal Auditors were also invited to attend meetings of the FP&M SETA Audit Committee to report on progress made and areas of risk identified during the internal audit visits.
However, the Internal Auditors did not perform according to agreed expectations and timeframes. Despite continuous interaction between the Internal Auditors and the SETA staff as well as intervention from the Audit Committee to ensure that the internal audit visits were conducted before year-end, the Internal Audit Unit failed to submit final reports on any of the areas they undertook to audit. As a result the FP&M SETA Board decided not to consider a renewal of the agreement with KZN Provincial Treasury and commenced with a tendering process to procure the services of a new internal audit service provider.
In addition to the appointment of the Internal Auditors, the FP&M SETA Board appointed KPMG to audit the MAPPP-SETA delineation process to ensure the accurate calculation of funds to be transferred by the FP&M SETA Board from the MAPPP-SETA bank accounts to the FP&M SETA, CATHSSETA and MICT SETA.
Staffing and Human Capital Development
The amalgamation of the three SETAs required the bringing together of three organisations which had different processes, organisational structures and working cultures. The Minister of Higher Education and Training’s sentiments were clear at the time of announcing the SETA landscape that the process should not result in job losses. The FP&M SETA Board took up this challenge and worked along with acting executive managers to design a fit-for-purpose organisational structure which would be able to deliver against the SETA’s national and sectoral targets while operating within the limits of the 10% legislated administrative expenditure.
Discussions with the two SETAs that inherited the other sub-sectors of MAPPP-SETA resulted in the successful placement of about 20 former MAPPP-SETA staff within their organisations.
The employment contracts of staff from the CTFL SETA, FIETA and the remainder of MAPPP-SETA staff were transferred for the interim period (April 2011 to September 2011) to the FP&M SETA with existing conditions and job descriptions to allow time for the Interim Board to finalise the organisational structure and develop HR policies and procedures.
During the interim period, arrangements were made to unite staff from the different regions in three (3) regional office settings namely Rivonia, Johannesburg (head office and Gauteng regional office), Pinetown, Durban (KZN regional office) and Observatory, Cape Town (Western Cape regional office).
The Interim Board finalised the organisational structure in September 2011 and commenced with the process of staff placement. Acting executive managers worked with the HR and Remuneration Committee and a HR consultant to appoint the management team who in turn joined forces with the executive management team to appoint staff to the remainder of the positions on the organogram. The Board decided to appoint staff that could not be placed in terms of the organogram on fixed term contracts for an additional 12 months (up to 31 March 2013) to provide additional resources to the Projects Division and other support functions during the transformation phase.
During this process, the FP&M SETA confirmed its commitment to the implementation of employment equity, the elimination of unfair discrimination and the creation of a diverse team in line with the demographic realities of South Africa. Executive management ensured equal employment opportunity and supported affirmative action objectives.
Skills development interventions were undertaken to address the immediate needs of the organisation and individual staff members in order to create the necessary operational capacity. A workplace skills plan will be developed in the new financial year for submission to the ETDP SETA to realize the future planned staff training and development interventions through the mechanism of mandatory grants as one of the human resource capacity building and talent growth and management strategies.
A detailed organogram is attached as Annexure 1 on pages 85 to 87.

FP&M SETA Annual Report | 2011/12 40
Remuneration of Executive Management
The FP&M SETA staff operated successfully in this year under the leadership of key executive managers, being the Acting Chief Executive Officer (ACEO), the Chief Executive: Strategy and Corporate Affairs (CE: S&CA), the Chief
Financial Officer (CFO) and the Chief Operating Officer (COO) have been remunerated on a cost to company basis as follows:
Incumbent (at 31 March 2012) Basic Salary Allowances:Contributions:
Social Benefits Bonus Back PayTotal 2011/12 Cost
to company
Bheki Zulu - ACEO R737 241 R120 000 - R28 000 R27 183 R912 423
Simangaliso Mkhwanazi - CE: S&CA R773 990 R72 000 - R29 000 - R874 990
P.K. Naicker - COO R535 140 R14 151 R89 515 R20 500 R33 859 R693 165
Gina Layzell - CFO R480 225 - R75 519 R18 000 R38 215 R611 958
Total 20011/12 R2 526 596 R206 151 R165 034 R95 500 R99 257 R3 092 538
Note 1: For the period April – December 2011, executive managers were appointed in acting capacity. During this period, Mr. Mkhwanazi guided the SETA through the amalgamation process as acting CEO. He was supported during this challenging period by Mr. Zulu, Acting Deputy CEO, Ms. Layzell, Acting CFO and Mr. Naicker, Acting COO. In December 2011, the Board appointed Mr. Zulu as Acting CEO (pending approval of his appointment by the Minister of Higher Education and Training), Mr. Mkhwanazi as CE: S&CA, Ms. Layzell as CFO and Mr. Naicker as COO.
Use of Consultants / Outsourcing of Functions
The FP&M SETA employed consultants to assist the SETA in areas where sufficient internal capacity was not available e.g. financial and accounting services, auditing services, HR and recruitment services and salary management. The total amount spent in this regard was R3,7 million.
Safety, Health and Environmental Management Policies and Practices
The Board and management of the SETA remain committed to the protection of all its assets, both human and material, from exposure to risk that could arise from sub-standard practices, procedures or conditions. This is managed through the implementation of comprehensive health (including HIV Aids), safety and security policies and procedures, the training and education of staff to prevent exposure to risk and the maintenance of procedures to ensure the safety of staff and assets.
Social Investment Prioritisation and Spending
The FP&M SETA supply chain management policies and procedures encompass the maintenance of good corporate governance through compliance to the relevant legislation and regulations, the promotion of procurement from BEE compliant and SMME suppliers, the application of procurement to achieve the strategic objectives as stipulated in the strategic plan and the SSP and ensuring value for money when procuring goods and services.
Current and New Projects
Details of current projects (inherited from the former SETAs) are included in the CTFL / FIETA & MAPPP-SETA Commitment Schedule.Details of new projects and current FP&M SETA Projects are included in the FP&M SETA Commitment Schedule.
Performance Information
The FP&M SETA has made training grants, bursaries and skills development support available to firms in the FP&M sector in line with its strategic plan and in an effort to reach its predetermined objectives. A detailed report on the FP&M SETA’s performance against NSDS III objectives has been included on pages 09 to 25.
Events after Reporting Date
The FP&M SETA Board and management are not aware of any post balance sheet events that may affect the Financial Statements.
SCOPA Resolutions
None

FP&M SETA Annual Report | 2011/1241
2011/12
Notes R’000
REVENUE Actual
Non Exchange Skills Development Levy Revenue 2.1 274 630
Non Exchange Skills Development Levy Revenue: Penalties and Interest 2.2 2 853
KZN DEDT: Special Project 14 637
National Skills Fund Income 15 2 881
Government grants and donor funding 21 112
W&R SETA Joint Collaboration Project 16 770
TLS - UIF 18 2 691
TLS - W&R SETA 20 3 317
TLS - DHET 17 1 247
Investment Income 3 18 664
Other Revenue 4 146
Total revenue 307 948
EXPENSES
Employer grant and project expenses 5 (130 388)
Administration expenses 6 (31 062)
National Skills Fund Expenses 15 (2 881)
Government grants and donor funding 21 (112)
KZN DEDT: Special Project 14 (637)
TLS - UIF 18 (2 691)
TLS - W&R SETA 20 (3 317)
TLS - DHET 17 (1 247)
W&R SETA Joint Collaboration Project - Funds Expensed 16 ( 770)
Total expenses (173 105)
NET SURPLUS/(DEFICIT) FOR THE PERIOD 134 843
StAteMent of finAnciAl peRfoRMAncefor the year ended 31 March 2012

FP&M SETA Annual Report | 2011/12 42
2011/12
Notes R’000
ASSETS
Non-current assets
Property, plant and equipment 7 3 961
Intangible assets 8 123
4 084
Current assets
Receivables from non-exchange transactions 9.1 5 255
Receivables from exchange transactions 9.2 1 154
Inventories 10 111
Cash and cash equivalents 11 423 935
430 455
Total Assets 434 539
LIABILITIES
Non-current liabilities
Finance lease obligations 22 95
Retirement benefit obligations 19 -
95
Current liabilities
Trade and Other Payables non – exchange transactions 13.1 46 243
Trade and Other Payables – exchange transactions 13.2 2 001
Current portion of finance lease obligations 22 115
National Skills Fund received in advance 15 -
Government grants and donor funding received in advance 21 11 708
KZN DEDT funds received in advance 14 -
TLS UIF funds received in advance 18 1 048
TLS W&R UIF funds received in advance 20 256
W&R SETA funds received in advance 16 852
DHET funds received in advance 17 2 563
Loan account - MICT SETA 23 7
Loan account - CATHSSETA 24 5 992
Total Liabilities 70 783
363 661
NET ASSETS
Administration reserve 26 4 084
Employer grant reserve 26 33
Discretionary reserve 26 359 544
363 661
TOTAL NET ASSETS AND LIABILITIES 363 661
StAteMent of finAnciAl poSitionas at 31 March 2012

FP&M SETA Annual Report | 2011/1243
NotesAdministration
reserveEmployer grant
reserveDiscretionary
reserveUnappropriated
surplus Total
R’000 R’000 R’000 R’000 R’000
Amalgamation balance at 1 April 2011 1 746 132 258 612 - 260 490
Less amount transferred to MICT SETA as at 1 April 2011 - - (12 295) - (12 295)
Less amount transferred to CATHSSETA as at 1 April 2011 - - (19 301) - (19 301)
Restated balance 1 746 132 227 017 - 228 894
Add expenses paid by FP&M SETA on behalf of CATHS SETA in 2011/12 - - (76) - (76)
Net surplus per Statement of Financial Performance - - - 134 843 134 843
Allocation of unappropriated surplus 1 4 925 79 776 50 142 (134 843) -
Excess reserves transferred to Discretionary reserve (2 587) (79 875) 82 462 - -
Balance at 31 March 2012 4 084 33 359 544 - 363 661
StAteMent of chAnGeS in net ASSetSfor the year ended 31 March 2012

FP&M SETA Annual Report | 2011/12 44
cASh flow StAteMentfor the year ended 31 March 2012
2011/12
Notes R’000
CASH FLOWS FROM OPERATING ACTIVITIES
Operating activities
Cash receipts from stakeholders 284 220
Levies, interest and penalties received 277 483
Other cash receipts from stakeholders 6 738
Cash paid to stakeholders, suppliers and employees (254 860)
Grants and project payments (96 669)
Discretionary expenses paid by FP&M SETA on behalf of CATHSSETA and MICT SETA (11 826)
Special projects (11 655)
Compensation of employees (16 045)
Payments to suppliers and other (118 665)
Cash generated from/(utilised in) operations 25 29 360
Investment income 3 18 664
Movement on reserves 47 935
Net cash inflow/(outflow) from operating activities 95 959
CASH FLOW FROM INVESTING ACTIVITIES
Purchase of property, plant and equipment and Intangibles 7 & 8 (46)
Net cash inflow/(outflow) from investing activities (46)
Net increase/(decrease) in cash and cash equivalents 95 913
Cash and cash equivalents at beginning of year 328 022
Cash and cash equivalents at end of year 11 423 935

FP&M SETA Annual Report | 2011/1245
1. Basis of preparation The annual financial statements have been prepared on a going concern and on the historical basis unless otherwise stated in accordance with the effective Standards of Generally Recognised Accounting Practices (GRAP) including any interpretations, guidelines and directives issued by the Accounting Standards Board and the Public Finance Management Act (PFMA), 1999 (Act No. 1 of 1999) Standard of GRAP GRAP 1: Presentation of annual financial statementsGRAP 2: Cash flow statements GRAP 3: Accounting policies, changes in accounting estimates and errorsGRAP 4: Effects of changes in foreign exchange ratesGRAP 5: Borrowing costs GRAP 9: Revenue from exchange transactions GRAP 12: InventoriesGRAP 13: LeasesGRAP 14: Events after the reporting dateGRAP 17: Property, plant and equipmentGRAP 19: Provisions, contingent liabilities and contingent assetsGRAP 100: Non-current assets held for sale and discontinued operations GRAP 102: Intangible assetsGRAP 107: Mergers
Replaced Statement of GAAPAC101: Presentation of Annual Financial StatementsAC118: Cash flow statementsAC103: Accounting policies, changes in accounting estimates and errors Currently the recognition and measurement principles in the above GRAP and GAAP Statements do not differ or result in material differences in items presented and disclosed in the Annual Financial Statements. The implementation of GRAP 1, 2 & 3 has resulted in the following changes in the presentation of the Annual Financial Statements: Standard of GRAP GRAP 1: Presentation of Annual Financial statementsGrap 2 : Cash flow statementsGrap 3: Accounting policies, changes in accounting estimates and errors Replace statement of GAAP AC101: Presentation of Annual Financial statementsAC 118: Cash flow statementsAC 103: Accounting policies , changes in accounting estimates and errors
Currently the recognition and measurement principles in the above GRAP and GAAP Statements do not differ or result in material differences in items presented and disclosed in the financial statements. The implementation of GRAP 1,2,& 3 has resulted in the following changes in the presentation of the financial statements: 1. Terminology differences:
Standard of GRAP Statement of financial performance Statement of financial position Statement of changes in net assets Net assets Surplus/deficit Accumulated surplus/deficit Contributions from owners Distributions to owners Reporting Date Replaced Statement of GAAP Income statement Balance sheet Statement of changes in equity Equity Profit/loss Retained earnings Share capital Dividends Balance Date
2. The cash flow statement can only be prepared in accordance with the
direct method.
3. Specific information has been presented separately on the Statement of Financial Position such as: (a) receivables from non-exchange transactions, including taxes and transfers;
(b) taxes and transfers payable; (c) trade and other payables from non-exchange transactions
4. Amount and nature of any restrictions on cash balances is required . The principal accounting policies adopted in the preparation of the Annual Financial Statements are set out below and are, in all material respects, consistent with those of the previous year, except as otherwise indicated.
AccountinG policieS to the AnnuAl finAnciAl StAteMentS
for the period ended 31 March 2012

FP&M SETA Annual Report | 2011/12 46
2. Currency The Annual Financial Statements are presented in South African Rands since that is the currency in which the majority of the entity transactions are denominated.
3. Revenue recognition Revenue is recognised when it is probable that future economic benefits will flow to the enterprise and these benefits can be reliably measured.
3.1 Levy income In terms of section 3(1) and 3(4) of the Skills Development Levies Act, 1999 (Act No. 9 of 1999), registered member companies of the SETA pay a skills development levy of 1% of the total payroll cost to the South African Revenue Services (SARS).
80% of skills development levies are paid over to the SETA (net of the 20% contribution to the National Skills Fund). Levy income is recognised on the accrual basis. The SETA refunds amounts to employers in the form of grants, based on information from SARS. Where SARS retrospectively amends the information on levies collected, it may result in grants that have been paid to certain employers that are in excess of the amount the SETA is permitted to have granted to employers. A receivable relating to the overpayment to the employer in earlier periods is raised at the amount of such grant over payment, net of bad debts and provision for irrecoverable amounts. Revenue is adjusted for Inter-SETA transfers due to employers changing SETA’s. Such adjustments are separately disclosed as Inter-SETA transfers. The amount of the Inter-SETA adjustment is calculated according to the Standard Operating Procedures issued by the Department of Higher Education & Training (DHET) on 15 May 2007. When a new employer is transferred to the SETA, the levies transferred by the former SETA are recognised as revenue and allocated to the respective category to maintain its original identity. The SDL transfer is measured at the fair value of the consideration received. Skills Development Levy (SDL) income is recognized when it is probable that future economic benefits will flow to the SETA and these benefits can be measured reliably. This occurs when the DHET either makes an allocation or payment, whichever comes first, to the SETA, as required by section 8 of the Skills Development Levies act, 1999 (Act No. 9 of 1999)
3.2 Interest and penalties Interest and penalties on the skills development levy is recognised on the earlier of the time the Department of Higher Education and Training (DHET) makes the allocation or payment of the funds in the bank account of the SETA. 3.3 Funds allocated by the KZN DEDT: SPECIAL PROJECTS Funds transferred by the KZN DEDT are accounted for in the Annual Financial Statements of the SETA as a liability until the related eligible special projects expenses are incurred, when the liability is extinguished and revenue recognised. 3.4 Government grants and other donor income Conditional government grants and other conditional donor funding received are recorded as deferred income when they become receivable and are then recognised as income on a systematic basis over the period necessary to match the grants with the related costs which they are intended to compensate. Unconditional grants received are recognised when the amounts have been received.
3.5 Investment income
Interest income is accrued on a time proportion basis, taking into account the principal outstanding and the effective interest rate over the period to maturity.
4. Grants and project expenditure A registered company may recover its total levy payment by complying with the grant criteria in accordance with the Skills Development Regulations issued in terms of the Skills Development Act 1999 (Act No 9 of 1999).
Mandatory grants The grant payable and the related expenditure are recognised when the employer has submitted an application for a grant in the prescribed form within the agreed upon cut-off period and the application has been approved as the payment then becomes probable. The grant is equivalent to 50% (2010/11 : 50%) of the total levies paid by the employer during the corresponding financial period for the skills grant respectively. Discretionary grants A SETA may out of any surplus monies determine and allocate discretionary grants to employers, education and training providers and workers of the employers who have submitted an application for a discretionary grant in the prescribed form within the agreed upon cut-off period. The grant payable and the related expenditure are recognised when the application has been approved to the extent that the conditions of the grant have been met.
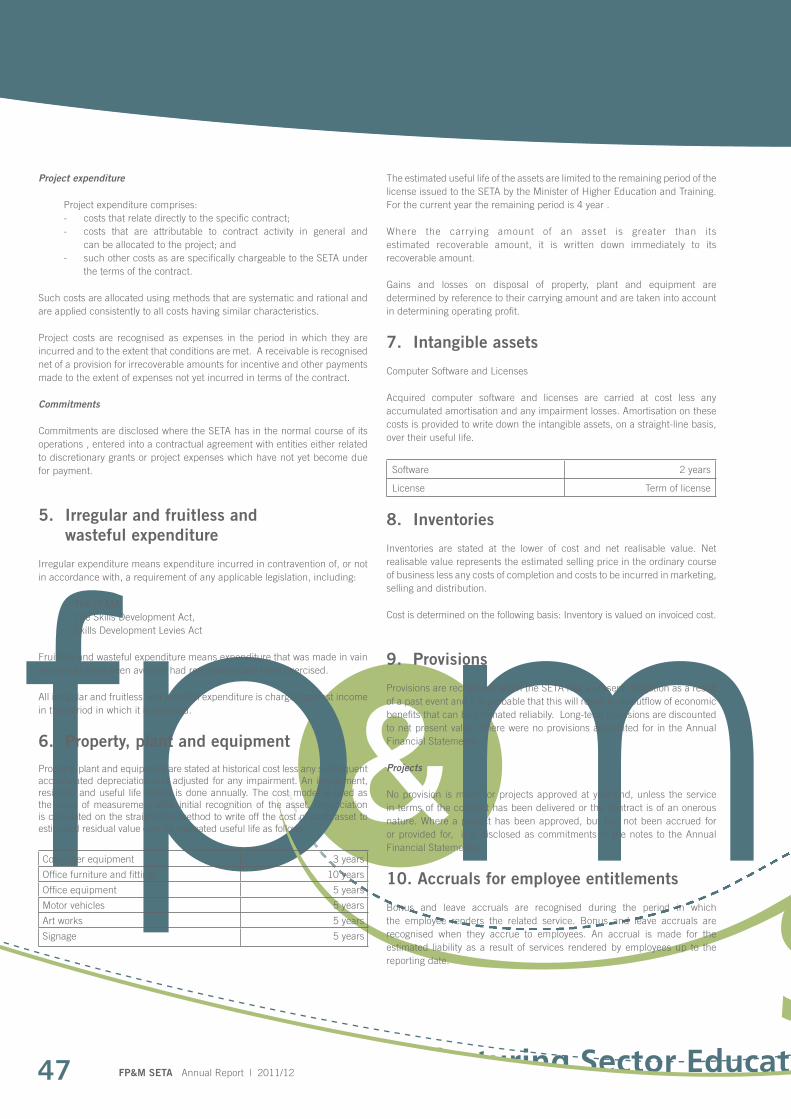
FP&M SETA Annual Report | 2011/1247
Project expenditure
Project expenditure comprises: - costs that relate directly to the specific contract; - costs that are attributable to contract activity in general and can be allocated to the project; and - such other costs as are specifically chargeable to the SETA under the terms of the contract.
Such costs are allocated using methods that are systematic and rational and are applied consistently to all costs having similar characteristics. Project costs are recognised as expenses in the period in which they are incurred and to the extent that conditions are met. A receivable is recognised net of a provision for irrecoverable amounts for incentive and other payments made to the extent of expenses not yet incurred in terms of the contract. Commitments Commitments are disclosed where the SETA has in the normal course of its operations , entered into a contractual agreement with entities either related to discretionary grants or project expenses which have not yet become due for payment.
5. Irregular and fruitless and wasteful expenditure Irregular expenditure means expenditure incurred in contravention of, or not in accordance with, a requirement of any applicable legislation, including: - The PFMA, - The Skills Development Act, - Skills Development Levies Act Fruitless and wasteful expenditure means expenditure that was made in vain and would have been avoided had reasonable care been exercised. All irregular and fruitless and wasteful expenditure is charged against income in the period in which it is incurred.
6. Property, plant and equipment Property, plant and equipment are stated at historical cost less any subsequent accumulated depreciation and adjusted for any impairment. An impairment, residual and useful life review is done annually. The cost model is used as the basis of measurement after initial recognition of the asset. Depreciation is calculated on the straight-line method to write off the cost of each asset to estimated residual value over its estimated useful life as follows:
Computer equipment 3 years
Office furniture and fittings 10 years
Office equipment 5 years
Motor vehicles 5 years
Art works 5 years
Signage 5 years
The estimated useful life of the assets are limited to the remaining period of the license issued to the SETA by the Minister of Higher Education and Training. For the current year the remaining period is 4 year .
Where the carrying amount of an asset is greater than its estimated recoverable amount, it is written down immediately to its recoverable amount. Gains and losses on disposal of property, plant and equipment are determined by reference to their carrying amount and are taken into account in determining operating profit.
7. Intangible assets Computer Software and Licenses
Acquired computer software and licenses are carried at cost less any accumulated amortisation and any impairment losses. Amortisation on these costs is provided to write down the intangible assets, on a straight-line basis, over their useful life.
Software 2 years
License Term of license
8. Inventories Inventories are stated at the lower of cost and net realisable value. Net realisable value represents the estimated selling price in the ordinary course of business less any costs of completion and costs to be incurred in marketing, selling and distribution.
Cost is determined on the following basis: Inventory is valued on invoiced cost.
9. Provisions Provisions are recognised when the SETA has a present obligation as a result of a past event and it is probable that this will result in an outflow of economic benefits that can be estimated reliabily. Long-term provisions are discounted to net present value. There were no provisions accounted for in the Annual Financial Statements.
Projects No provision is made for projects approved at year-end, unless the service in terms of the contract has been delivered or the contract is of an onerous nature. Where a project has been approved, but has not been accrued for or provided for, it is disclosed as commitments in the notes to the Annual Financial Statements.
10. Accruals for employee entitlements Bonus and leave accruals are recognised during the period in which the employee renders the related service. Bonus and leave accruals are recognised when they accrue to employees. An accrual is made for the estimated liability as a result of services rendered by employees up to the reporting date.

FP&M SETA Annual Report | 2011/12 48
11. Financial instruments Recognition Financial assets and financial liabilities are recognised on the SETA’s Statement of Financial Position when the SETA becomes a party to the contractual provisions of the instrument.
All ordinary purchases and sales of financial assets are initially recognised on transaction date. Measurement Financial instruments are initially measured at fair value, which includes transaction costs. Subsequent to initial recognition these instruments are measured as set out below. Financial assets The SETA’s principal financial assets are accounts and other receivables and cash and cash equivalents.
Investments and loans The following categories of investments are measured at subsequent reporting dates at amortised cost by using the effective interest rate method if they have a fixed maturity, or at cost if there is no fixed maturity:
- Loans and receivables originated by the group; - Held-to-maturity investments; - An investment that does not have a quoted market price in an active market and whose fair value cannot be measured reliably. Cost and amortised cost are inclusive of any impairment loss recognised to reflect irrecoverable amounts. The financial assets are subject to review for impairment at each balance sheet date.
Investments other than those listed above are classified as available-for-sale investments or investments held-for-trading and are measured at subsequent reporting dates at fair value without any deduction for transaction costs that may be incurred on sale or other disposal. Accounts and other receivables Accounts and other receivables are stated at amortised costs and reduced by appropriate allowances for estimated irrecoverable amounts which are written off. Cash and cash equivalents Cash and cash equivalents comprises cash on hand, demand deposits and other short term highly liquid investments that are readily convertible to a known amount of cash and subjected to an insignificant risk of changes in value, these are initially and subsequently recorded at fair value.
Financial liabilities The SETA’s principal financial liabilities are accounts payables. Financial liabilities are measured initially at fair value but subsequently at amortised cost. Gains and losses on subsequent measurement Gains and losses arising from a change in the fair value of financial instruments, other than available-for-sale financial assets, are included in net profit or loss in the period in which it arises. Gains and losses arising from a change in the fair value of available-for-sale financial assets are recognised in equity, until the investment is disposed of or is determined to be impaired, at which time the net profit or loss is included in the net profit or loss for the period.
Derecognition A financial asset or a portion thereof is derecognised when the Seta realises the contractual rights to the benefits specified in the contract, the rights expire, the SETA surrenders those rights or otherwise loses control of the contractual rights that comprise the financial asset. On derecognition, the difference between the carrying amount of the financial asset and the sum of the proceeds receivable and any prior adjustment to reflect the fair value of the asset that had been reported in equity is included in net profit or loss for the period.
A financial liability or a part thereof is derecognised when the obligation specified in the contract is discharged, cancelled, or expires. On derecognition, the difference between the carrying amount of the financial liability, including related unamortised costs, and the amount paid for it is included in net profit or loss for the period. Fair value considerations The fair values at which financial instruments are carried at the balance sheet date have been determined using available market values. Where market values are not available, fair values have been calculated by discounting expected future cash flows at prevailing interest rates. The fair values have been estimated using available market information and appropriate valuation methodologies, but are not necessarily indicative of the amounts that the SETA could realise in the normal course of business. The carrying amounts of financial assets and financial liabilities with a maturity of less than one year are assumed to approximate their fair value due to the short-term trading cycle of these items.
Offsetting Financial assets and financial liabilities are offset if there is any intention to realise the asset and settle the liability simultaneously and a legally enforceable right to set off exists.

FP&M SETA Annual Report | 2011/1249
12. Reserves Equity are sub-classified in the Statement of Financial Position between the following funds and reserves: - Administration reserve - Employer grant reserve - Discretionary reserve This sub-classification is made based on the restrictions placed on the distribution of monies received in accordance with the Regulations issued in terms of the Skills Development Act, 1998 (Act No. 97 of 1998). Member employer company levy payments are set aside in terms of the Skills Development Act and the regulations issued in terms of the Act, for the purpose of:
2011/12
%
Administration costs of the SETA 10
Employer Levy Grant Fund 50
Mandatory Grant (WSP/ATR) 50
Discretionary grants and projects 20
80 In addition, contributions received from public service employers in the national or provincial spheres of government may be used to pay for its administration costs. Interest and penalties received from SARS are utilised for discretionary grants. Other income received is utilised in accordance with the original source of the income. The net surplus/deficit is allocated to the administration reserve, the mandatory grant reserve and the discretionary fund reserve based on the above. The amount retained in the administration reserve equates to the net book value of property plant and equipment and intangible assets. Excess cash reserves are transfered to the discretionary reserve. Surplus funds in the employer grant reserve are transfered to the discretionary reserve at the end of the financial year. An amount is retained in the employer grant reserve, after consideration is given to new companies, which in term of the regulations, has six months after joining to submit their work place skills plan.
13. Comparative Figures The FP&M SETA does not have comparative figures. Three SETAs (FIETA , CTFL SETA and part of MAPPP-SETA) merged to form FP&M SETA. This has been treated as a merger in line with GRAP 107.
14. Taxation No provision has been made for taxation, as the SETA is exempt from income tax in terms of Section 10 of the Income Tax Act.
15. Operating Leases Payments made under operating leases are deducted in arriving at net profit /loss on the straight line basis over the period of the lease.
16. Contingencies In terms of the PFMA, all surplus funds as at year-end may be forfeited to National Treasury, should an application for retention of surplus funds be denied. We have on the 31 May 2012 submitted an application to the DHET for retention of surplus funds. As in the previous year FP&M SETA expects that National Treasury will approve the retention of surplus funds. In terms of the PFMA , all new companies which have registered with Sars in the last six months of the financial year were still able to submit a work place skills plan and recieve mandatory grants , this resulted in a contingency liability of R33 000 in the mandatory grant reserves on the statement of Financial position.
MAPPP-SETA was delineated between three SETAs being FP&M SETA, CATHSSETA, MICT SETA. All commitments of MAPPP-SETA were split between these three SETAs. There was an unallocated discretionary reserve amount which was split between FP&M SETA and CATHSSETA. CATHSSETA is due to receive R5 991 543 of these unallocated funds. The apprentiship committments which were transfered to FP&M SETA have been confirmed to the contracts now held by FP&M SETA. There is a contigent liability of R1 516 000 which may have to be paid over to CATHSSETA for additional unallocated discretionary funds once the apprentiships have been further reviewed.
17. Related Party Transactions Transactions are disclosed as other related party transactions where the SETA has in the normal course of its operations , entered into certain transactions with entities either related to the DHET or which had a nominated representative serving on the SETA Board. Transactions are disclosed as other related party transactions where Inter-SETA transactions arise due to the movement of employees from one SETA to another.

FP&M SETA Annual Report | 2011/12 50
noteS to the AnnuAl finAnciAl StAteMentSfor the year ended 31 March 2012
1. ALLOCATION OF NET SURPLUS FOR THE YEAR TO RESERVES
2011/12 Notes
Total per Statement of Performance
Administration Reserve
Employer Reserve
Mandatory Grants Discretionary Reserve
R’000 R’000 R’000
Discretionary Grants R’000
Special projects
Total discretionary
R’000
Total revenue 307 948 35 987 173 195 87 110 11 655 98 765
Skills development levy: income
Administration levy income (10%) 35 987 35 987 - - - -
Grant levy income (70%) 238 643 - 173 195 65 448 - 65 448
Skills development levy: penalties and interest 2 853 - - 2 853 - 2 853
KZN DEDT & CTFL SETA project 15 637 - - - 637 637
National Skills Fund income 2 881 - - - 2 881 2 881
Government grants and donor funding received in advance 112 - - - 112 112
W&R SETA - Joint collaboration project 16 770 - - - 770 770
TLS - UIF 18 2 691 - - - 2 691 2 691
TLS - W&R SETA 20 3 317 - - - 3 317 3 317
TLS - DHET 1 247 - - - 1 247 1 247
Investment income 18 664 - - 18 664 - 18 664
Other revenue 146 - - 146 - 146
Total expenses 173 105 31 062 93 419 36 969 11 655 48 624
Administration expenses 31 062 31 062 - - - -
KZN DEDT & CTFL SETA project 15 637 - - - 637 637
W&R SETA - Joint collaboration project 16 770 - - - 770 770
TLS - UIF 18 2 691 - - - 2 691 2 691
TLS - W&R SETA 20 3 317 - - - 3 317 3 317
TLS - DHET 1 247 - - - 1 247 1 247
NSF expenses 2 881 - - - 2 881 2 881
Government Grants and donor funding received in advance 112 - - - 112 112
Employer grants and project expenses 130 388 - 93 419 36 969 - 36 969
Net surplus per Statement of Performance allocated 134 843 4 925 79 776 50 141 - 50 141
FP&M SETA submitted an application to the DHET to exceed the 10% administration income due to the expected decrease in budgeted skills development levy income compared to previous financial years of the former SETAs. Cost cutting measures were sent through to the DHET during the financial year and expenses were closely monitored against budgets. As at the 31 of March 2012, approval had not been received from the DHET. However, the FP&M SETA managed not to exceed the 10% administration income.

FP&M SETA Annual Report | 2011/1251
2. NON EXCHANGE SKILLS DEVELOPMENT LEVY REVENUE AND INTEREST AND PENALTIES
2.1 Non Exchange Skills Development Levy Revenue
2011/12
Notes R’000
The total levy revenue, excluding interest and penalties, per the Statement of Performance is as follows:
Levy Revenue: Administration 35 987
Levies received 35 987
Levies received from SARS 36 022
Inter-SETA transfers in 8
Inter-SETA transfers out (43)
Levies accrued for levies and Inter-SETA transfers -
Levy revenue: Employer Grants 173 195
Levies received 173 195
Levies received from SARS 173 367
Inter-SETA transfers in 42
Inter-SETA transfers out (214)
Levies accrued for levies and Inter-SETA transfers -
Levy revenue: Discretionary Grants 65 448
Levies received 65 448
Levies received from SARS 65 516
Inter-SETA transfers in 17
Inter-SETA transfers out (86)
Levies accrued for levies and Inter-SETA transfers -
274 630
2.2 Non Exchange Skills Development Levy Revenue : Penalties and Interest
Interest and Penalties
Interest and Penalties received 2 853
2 853

FP&M SETA Annual Report | 2011/12 52
3. INVESTMENT INCOME2011/12
Notes R’000
Interest income 18 664
Interest income received 17 640
Accrued Interest 1 023
18 664
4. OTHER REVENUE Testing certificates / insurance refunds 146
146
5. EMPLOYER GRANT AND PROJECT EXPENSESMandatory grants 93 419
Disbursed 62 715
Movement in provisions and accruals 30 704
Discretionary grants 36 969
Disbursed 33 955
Movement in provisions and accruals 3 014
130 388

FP&M SETA Annual Report | 2011/1253
6. ADMINISTRATION EXPENSES2011/12
Notes R’000Depreciation (2 629)
Amortisation 45
Operating lease rentals (minimum lease payments) 2 512
Buildings 2 512
Maintenance, repairs and running costs 118
Other Repairs 118
Advertising, marketing and promotions, communication 153
Gifts, donations and sponsorships paid 9
Consultancy and service provider fees 3 664
Legal fees 72
Cost of employment 6.1 16 045
Travel and subsistence 2 081
Staff training and development 55
Remuneration to members of the accounting authority 235
Research & development costs 958
Remuneration to members of the audit committee 75
External auditor’s remuneration 3 296
Audit fees 3 296
Bad debts written off 106
Other 4 268
Workshops & Functions 258
Sundry 3 134
Audit Internal 332
Computer Expenses 475
Cleaning 80
Staff workshops 38
Staff Welfare 10
Electricity 276
Bank Charges 108
Finance Charges 34
Insurance 218
Motor expenses 147
Office Expenses 192
Postages 168
Equipment rental 83
Loss on asset disposal 363
Printing and Publications 162
Professional Indemnity 46
ETQA 114
Stationary 49
Subscriptions & memberships 206
Security 33
Telephone 876
31 062

FP&M SETA Annual Report | 2011/12 54
6.1 Cost of employment
2011/12
Notes R’000
Salaries and wages 14 341
Basic salaries 14 236
Leave payments/adjustment of accruals 90
Overtime payments 15
Social contributions 1 704
Medical aid contributions 695
Provident fund contributions: defined contribution plans 635
UIF 150
Insurance 59
Other salary related costs 165
16 045
Allocation of cost of employment
Administration expenses 6 16 045
16 045
NB: Salaries of Senior Executive Managers are listed in the Accounting Authority Report.
7. PROPERTY, PLANT AND EQUIPMENT
Cost
Accumulated depreciation/
impairmentClosing carrying
amount
For the period ended 31 March 2012 R’000 R’000 R’000
Computer equipment 1 741 (1 437) 304
Office furniture and fittings 5 346 (2 209) 3 137
Office equipment 910 (627) 283
Motor Vehicles 141 (127) 14
Signage 170 (170) -
Artwork 279 (56) 223
8 587 (4 626) 3 961
Movement summary 2012
Amalgamation opening amount
2011 Additions Disposals
Depreciation/ Amortisation
charge
Accumulated depreciation on disposals
Carrying amount
2012
R’000 R’000 R’000 R’000 R’000 R’000
Computer equipment 456 10 (1 379) ( 38) 1 256 304
Office furniture and fittings 594 - (1 206) 2 648 1 100 3 137
Office equipment 301 32 ( 165) 82 33 283
Motor Vehicles 21 - - ( 7) - 14
Artwork 279 - - (56) - 223
Balance at end of March 2012 1 651 42 (2 750) 2 629 2 389 3 961

FP&M SETA Annual Report | 2011/1255
8. INTANGIBLE ASSETS
CostAccumulated
amortisation chargeClosing carrying
amountFor the period ended 31 March 2012 R’000 R’000 R’000Computer Software 1 107 (984) 123
1 107 (984) 123
Amalgamation opening amount
2011 AdditionsDepreciation/
Amortisation chargeCarrying amount
2012Movement Summary 2012 R’000 R’000 R’000 R’000Computer Software 119 11 (20) 110
Software Licenses 2 35 (25) 13
Balance at end of March 2012 121 46 (45) 123
9. RECEIVABLES FROM NON-EXCHANGE TRANSACTIONS AND EXCHANGE TRANSACTIONS
2011/12Notes R’000
9.1 Receivables from non-exchange transactions5 256
Inter-SETA debtors 25.1 73
Employer receivables overpayments due to SARS Reversals 9.1.1 2 295
TLS DHET 2 054
TLS UIF 834
5 256
9.1.1 Employer receivableEmployer receivable
Overpayment to employers 2 628
2 628
Allowance for doubtful debts (333)
Open carrying amount (320)
Increase/ (decrease) in current year provision (13)
Net effect of SARS retrospective adjustments on affected employers 2 295
R 2 628 000 was recognised as a receivable relating to the overpayment to the employer in earlier periods and is based on the amount of such grant over payments.
9.2 Receivables from exchange transactions 1 154
Deposits 112
Interest receivable 1 023
Prepaid expenses 11
Staff Advances / ETDP SETA 8
1 154

FP&M SETA Annual Report | 2011/12 56
10. INVENTORIES2011/12
Notes R’000
Amalgamation opening amount 57
Purchases 85
Amounts utilised (32)
110
Inventories comprises a bulk purchase of photostat paper for office use.
11. CASH AND CASH EQUIVALENTSCash at bank and in hand 423 935
Cash at bank 423 920
Cash on hand 15
Cash and cash equivalents at end of March 2012 423 935
As required in Treasury Regulation 31.2, National Treasury approved the banks where the bank accounts are held.
Cash includes cash on hand and cash with banks. Cash equivalents are short term, highly liquid investments that are held with registered banking institutions with maturities of three months or less and that are subject to an insignificant risk of change in value.
For the purpose of the Cash Flow Statement, cash and cash equivalents comprise cash on hand and deposits held at the CPD and call accounts.
12. SURPLUS FUNDS TRANSFERABLE TO NATIONAL TREASURYAmalgamation opening amount -
Transfers of excess funds from:
SDL: Administration reserve -
SDL: Employer Grant reserve 33
Discretionary reserve 359 544
Amounts transferred to Administration reserve 4 084
Application for approval for accumulation (363 661)
Closing carrying amount -

FP&M SETA Annual Report | 2011/1257
13. TRADE AND OTHER PAYABLES NON-EXCHANGE AND EXCHANGE TRANSACTIONS
2011/12
Notes R’000
13.1 Trade and Other Payables non – exchange transactions 46 242
Trade and Other Payables non – exchange transactions: Mandatory Grants 32 999
Trade and Other Payables non – exchange transactions: Discretionary Grants 3 014
SARS Payable 13.3 9 437
Inter-SETA payables 510
Duty Credit Certificate (DCC) Holdings Account 281
13.2 Trade and Other Payables – exchange transactions 2 001
Sundry payables 1 299
Bonus and leave payable 701
48 243
13.3 SARS Payables
Amalgamation opening amount Additions
Closingbalance
R’000 R’000 R’000
For the period ended 31 March 2012
Levies incorrectly received 8 444 993 9 437
8 444 993 9 437

FP&M SETA Annual Report | 2011/12 58
14. KZN DEDT SPECIAL PROJECTS2011/12
R’000
Opening balance 637
Course fees (637)
Closing Balance -
15. NATIONAL SKILLS FUNDAmalgamation opening amount - SABC Project 3 078
Amalgamation opening amount - NSF Vul’amathuba project 1 262
Utilised and recognised as revenue - conditions met: SABC PROJECT (2 881)
Utilised and recognised as revenue - refunded to NSF (1 262)
Paid to MICT SETA ( 197)
Closing balance -
During the current year conditional funds of Rnil was received from the National Skills Fund (NSF) for the purposes of the “NSF Vul’amathuba project”. This amount was recognised as a liability until the conditions attached were met. During the year, Rnil eligible project special expenses were incurred and a corresponding amount was recognised as revenue. An amount of R1 262 000 was paid back to National Skills Fund (NSF). An amount of R197 000 was paid to MICT SETA due to the delineation of MAPPP-SETA.
16. W&R SETA AND CTFL SETA JOINT COLLABORATION PROJECTAmalgamation opening amount 621
Received during the year 1 000
W&R SETA joint collaboration project learnership 1 000
Utilised and recognised as revenue conditions met: ( 770)
Closing balance 852
17. DHETAmalgamation opening amount -
Received during the year 3 809
W&R SETA joint collaboration project learnership 3 809
Utilised and recognised as revenue conditions met: (1 247)
Closing balance 2 562

FP&M SETA Annual Report | 2011/1259
18 . TRAINING LAY-OFF SCHEME - UIF2011/12
R’000
Amalgamation opening amount 992
Received during the year 2 746
Company disbursements (2 691)
Closing balance 1 048
19 . RETIREMENT BENEFIT OBLIGATION
The MAPPP-SETA provides for post employment healthcare benefits to its retired employees with more than ten years continued service. These benefits are unfunded but due to possible labour implications it has been referred to a sub committee of the Authority to investigate. The following tables summarise the components of the net expense recognised in the Statement of Financial Performance, the funded status and the amounts recognised in the Statement of Financial Performance.
Net Benefit Expense
Expected employer benefit payments 154
Actuarial (gain) / Loss recognised in the year 396
550
Actuarial Return on planned assets
The actuarial valuation as at 31/03/2012 amounted to R3 459 989. This total amount was paid out to the beneficaries.
20 . TRAINING LAY-OFF SCHEME - W&R SETAAmalgamation opening amount 319
Received during the year 3 254
Utilised and recognised as revenue -conditions met: (3 317)
Closing balance 256
21. GOVERNMENT GRANTS AND DONOR FUNDING RECEIVED IN ADVANCECreate SA
Amalgamation opening amount 8 961
Received during the year 1 165
Utilised and recognised as revenue -conditions met: (112)
Closing balance 10 015

FP&M SETA Annual Report | 2011/12 60
2011/12
R’000
Department of Arts and Culture
Amalgamation opening amount -
Received during the year 1 531
Utilised and recognised as revenue conditions met: 161
Closing balance 1 692
22. FINANCE LEASE OBLIGATIONSFinance Lease liability 210
Less : Short term Portion disclosed under current liabilities 115
Non - Current Lease Liability 95
Present Value
Interest Payment
R’000 R’000 R’000
Due not later than one year 115 17 132
Due not later than one year and not later than five years 95 11 106
210 28 238
FIETA has entered into finance lease agreements for rental of photocopying and printing equipment with the latest agreement due to expire in 2015. The lease agreements have an escalation rate of 15%. These have been accounted for in terms of GRAP 13.
23. LOAN ACCOUNT - MICT SETA
Amalgamation opening amount (26 445)
Movement during the year 26 438
Closing balance (7)
24. LOAN ACCOUNT - CATHSSETA
Amalgamation opening amount (21 490)
Movement during the year 21 484
Closing balance (5 992)
On the 1st of April 2011 CTFL SETA , FIETA and part of MAPPP-SETA merged to form FP&M SETA. MAPPP-SETA was delineated into three SETAs namely FP&M SETA , MICT SETA and CATHSSETA. During the financial year end 2011/12 , FP&M SETA delineated the MAPPP-SETA opening balances. An amount of R7 028 is due to MICT SETA and R5 991 542 is due to CATHSSETA

FP&M SETA Annual Report | 2011/1261
25. RECONCILIATION OF NET CASH FLOW FROM OPERATING ACTIVITIES TO NET SURPLUS/(DEFICIT)
2011/12
R’000
Net surplus/(deficit) as per Statement of Financial Performance 134 843
Adjusted for non-cash items:
Depreciation & Amortisation (2 584)
Restatement of Reserves (31 672)
(Profit)/loss on disposal of property, plant and equipment 363
Bad debts written off 106
Adjusted for items separately disclosed
Investment income (18 664)
Adjusted for working capital changes:
(Increase)/decrease in receivables (3 603)
Increase/(decrease) in payables (49 376)
(Increase)/decrease in Inventory ( 54)
Cash generated from/(utilised in) operations 29 359
26. CONTINGENCIES
Surplus Funds
In terms of the PFMA, all surplus funds as at year-end may be forfeited to National Treasury. As at year-end, this amount could not be quantified as National Treasury has not defined surplus funds. Approval was received from the National Treasury to roll-over surplus funding from thre amalgamating SETAs namely CTFL SETA, FIETA and MAPPP-SETA relating to the 2010/11 financial year. No formal approval has been obtained from National Treasury to retain surplus funds. The application to retain the surplus funds from the 2011/12 financial year has been submitted to National Treasury on 31 May 2012.
Administration Reserve 4 084
Employer Grants Reserve 33
Discretionary Grants Reserve 359 544
Unappropriated Surplus -
Total Funds as per Statement of Financial Position 363 661

FP&M SETA Annual Report | 2011/12 62
27. OPERATING LEASES2011/12
R’000
Total of future minimum lease payments under non-cancelable leases:
Not later than one year 1 218
Later than one year and not later than five years -
Later than five years -
1 218
The operating leases relates to building premises used as office accommodation. The current lease agreements in Durban, for 2nd and 3rd floor office premises in Umdoni Centre, Pinetown, expires on 31 March 2012. The Cape Town office lease in Premier Centre Observatory, expires on the 31 March, 2012. The Gauteng office lease in Tuscany Office Park, Rivonia , expires on the 31 March 2012. All three lease agreements have been extended in the new financial year.
28. MATERIAL LOSSES THROUGH CRIMINAL CONDUCT, IRREGULAR, FRUITLESS AND WASTEFUL EXPENDITURE
Late Payment of Invoices and Failure to recover rental deposit
Reconciliation of Fruitless and Wasteful Expenditure
Relating to Current Year 27
Less: Amounts Condoned -
Less: Amount Recovered -
Fruitless and Wasteful Expenditure awaiting condonation 27
During the year FP&M SETA had to pay interest to Service Providers on invoices that were paid beyond the specified credit terms. A decision will need to be made by the Board about the recoverability of the amount. In future, management will implement processes to pay invoices within the stipulated credit period. Due to the merger the former FIETA had not given adequate notice to terminate the lease agreement therefore resulting in forfeiture of the lease deposit. The photocopier under lease has been written off therefore incurring wasteful expenditure on interest on lease.

FP&M SETA Annual Report | 2011/1263
29. FINANCIAL INSTRUMENTS
In the course of the SETA operations it is exposed to interest rate, credit, liquidity and market risk. The SETA has developed a comprehensive risk strategy in terms of TR 28.1 in order to monitor and control these risks. The risk management process relating to each of these risks is discussed under the headings below.
Interest rate risk
The SETA manages its interest rate risk by investing in the financial institutions approved by National Treasury.
The SETA’s exposure to interest rate risk and the effective interest rates on financial instruments at Statement of Financial Position date are as follows:
Floating RateNon-interest
bearing
TOTAL R’000
Amount R’000
Effective interest rate
Amount R’000
Year ended 31 March 2012
Assets
Cash and cash equivalents 423 920 6% 15 423 935
Receivables from non-exchange transactions - - 5 255 5 255
Receivables from exchange transactions - - 1 154 1 154
Total financial assets 423 920 6% 6 424 430 344
Liabilities
Trade and Other Payables non – exchange transactions - - (46 243) (46 243)
Trade and Other Payables – exchange transactions - - (2 001) (2 001)
KZN DEDT project funds received in advance - - - -
W&R SETA funds received in advance - - (852) (852)
TLS - W&R SETA - - (256) (256)
TLS - UIF - - (1 048) (1 048)
TLS - DHET - - (2 562) (2 562)
Create SA - - (10 015) (10 015)
Department of Arts and Culture - - (1 692) (1 692)
Total financial liabilities - - (64 668) (64 668)

FP&M SETA Annual Report | 2011/12 64
Credit risk
Financial assets, which potentially subject the SETA to the risk of non performance by counter parties and thereby subject to credit concentrations of credit risk, consist mainly of cash and cash equivalents, investments and accounts receivable. The maximum exposure to credit risk is equal to the carrying amount of the financial instruments.
The ageing of Trade & Other Receivable from non exchange transactions:
2011/12
Gross Impairment
Not past due - -
Past due 0 - 30 days - -
Past due 31 - 120 days 2 368 -
More than one year - -
The ageing of Trade & Other Receivable from exchange transactions:
2011/12
Gross Impairment
Not past due - -
Past due 0 - 30 days 1 023 -
Past due 31 - 120 days 11 -
More than one year-deposits 112 -
Cash and Cash Equivalents:
2011/12
Gross Impairment
Not past due 423 920 -
Past due 0 - 30 days - -
Past due 31 - 120 days - -
More than one year - -
The SETA limits its treasury counter-party exposure by only dealing with well-established financial institutions approved by National Treasury through the approval of their investment policy in terms of Treasury Regulation. The SETA’s exposure is continuously monitored by the Executive Committee.
Credit risk with respect to levy paying employers is limited due to the nature of the income received. The SETA does not have any material exposure to any individual or counter-party. The SETAs concentration of credit risk is limited to the industry in which the SETA operates. No significant events occurred in the industry during the financial year that may have an impact on the accounts receivable that has not been adequately provided for. Accounts receivable are presented net of allowance for doubtful debt.

FP&M SETA Annual Report | 2011/1265
Liquidity Risk
The SETA manages liquidity risk through proper management of working capital, capital expenditure. Adequate reserves and liquid resources are maintained.
2011/12 NoteCarrying Amount
Contractual Cash Flows
6 Months or less
Trade and other Payables from exchange transactions 13.1 2 001 2 001 1 299
Market risk
The SETA is exposed to fluctuations in the employment market for example sudden increases in unemployment and changes in the wage rates. No significant events occurred during the year that the SETA are aware of.
Fair values
The SETA’s financial instruments consist mainly of cash and cash equivalents, account and other receivables, and account and other payables. No financial instruments were carried at an amount in excess of its fair value. No financial asset was carried at an amount in excess of its fair value and fair values could be reliably measured for all financial instruments.
The following methods and assumptions are used to determine the fair value of each class of financial instruments:
Cash and cash equivalents
The carrying amount of cash and cash equivalents approximates fair value due to the relatively short-term maturity of these financial assets.
Accounts receivable
The carrying amount of accounts receivable, net of allowance for impairment, approximates fair value due to the relatively short-term maturity of these financial assets. Interest is levied at the prescribed rate as determined by the Act should employers pay skills development levy late. This interest is then transferred to the SETA via DHET.
Accounts payable
The carrying amount of account and other payables approximates fair value due to the relatively short-term maturity of these financial liabilities.
Foreign Exchange Risk
The SETA is exposed foreign exchange risks arising from contracts with the KZN DEDT project were payments are made to the University of Liberec.

FP&M SETA Annual Report | 2011/12 66
30. RELATED PARTY TRANSACTIONS
30.1 Transactions with other SETAs
Inter-SETA transactions and balances arise due to the movement of employers from one SETA to another. No other transactions occurred during the year with other SETAs. The parent entity of all SETAs is the DHET.
The balances at year-end included in receivables and payables are:
NotesAmount of the
transaction
Amount receivable/
(payable)
Receivables 9 - 67
Services SETA - 26
W&R SETA - 12
Agri SETA - 2
ISETT SETA - 22
FASSET - 5
Payables 13 (44) (331)
merSETA - (5)
THETA - (93)
ISETT SETA - (175)
Agri SETA - (10)
FoodBev SETA (11) -
CETA (33) (15)
Services SETA - (33)
Total (44) (264)

FP&M SETA Annual Report | 2011/1267
30.2 Transactions with other related parties
During the year members of the Accounting Authority and Committees and employees were required to disclose their interest in any contracts that the SETA is entering into with an outside party. As a result the SETA entered into the following transactions with related parties:
2011/12
R’000
Related party Nature of relationship Transaction typeAmount of the
transaction
Amount receivable/
payable
Payables 6 211 1 849
Frame Textiles Group Mr. David Bowen (Authority Member) Discretionary Grants 133 -
Frame Textiles Group Mr. David Bowen (Authority Member) Mandatory Grants 408 24
Zenzeleni Clothing Mr. Andre Kriel (Authority Member) Mandatory Grants 43 3
SACTWU Mr. Andre Kriel (Authority Member) Discretionary Grants 2 350 -
Prestige Clothing Mr. Graham Choice (Committee Member) Discretionary Grants 130 -
Prestige Clothing Mr. Graham Choice (Committee Member) Mandatory Grants 140 30
Western Cape Leanership Centre Mr. Graham Choice (Committee Member) Discretionary Grants 945 459
Bonwit (Seardel Group) Mr. David Bowen (Authority Member) Mandatory Grants 444 -
Monviso Knitwear (Seardel Group) Mr. David Bowen(Authority Member) Mandatory Grants 222 37
Monviso Knitwear (Seardel Group) Mr. David Bowen (Authority Member) Discretionary Grants 33 -
Prima Toys Mr. David Bowen (Authority Member) Mandatory Grants - 32
Romatex (Seardel Group) Mr. David Bowen (Authority Member) Mandatory Grants 96 146
Prestige Lingerie (Seardel Group) Mr. David Bowen (Authority Member) Mandatory Grants 391 82
Brits Textiles Mr. David Bowen (Authority Member) Mandatory Grants 14 36
Cape Clothing Association Mr. Johann Baard (Authority Member) Discretionary Grants 55 -
SAPPI Mr. Mike Truelock (Authority Member) Mandatory Grants 663 -
PASA Mr. Brian Wafawarowa (Authority Member)
Discretionary Grants 144 1 000
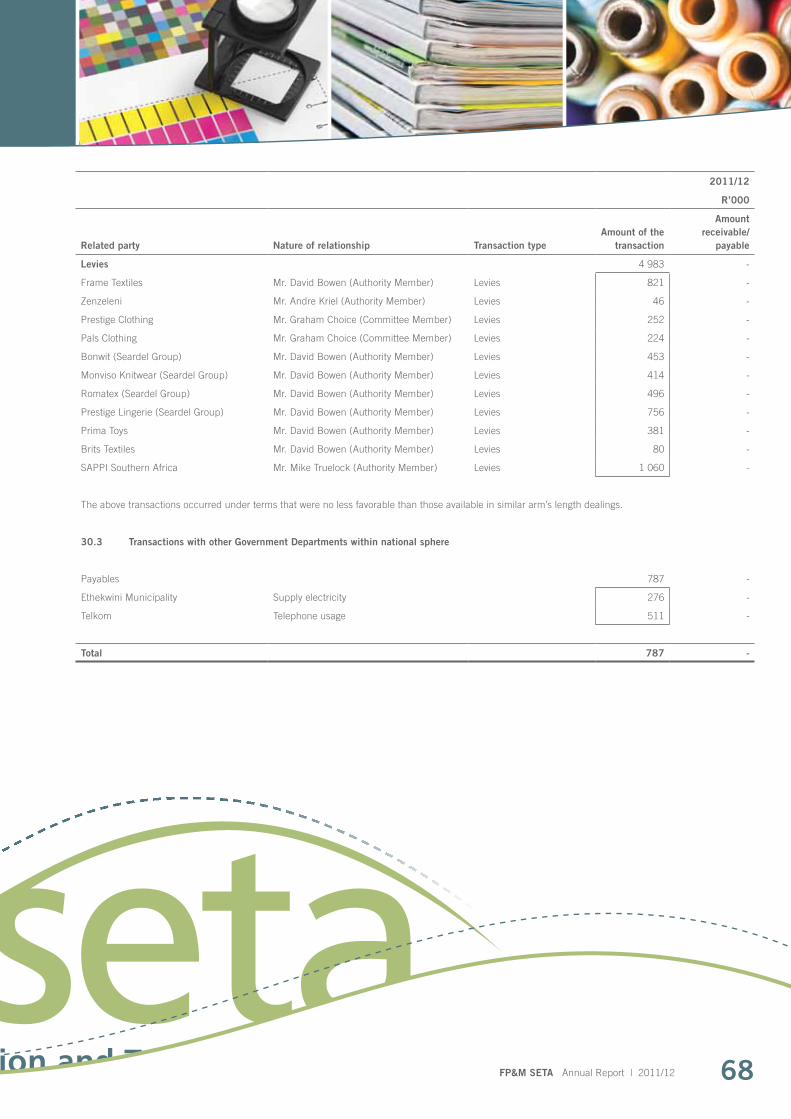
FP&M SETA Annual Report | 2011/12 68
2011/12
R’000
Related party Nature of relationship Transaction typeAmount of the
transaction
Amount receivable/
payable
Levies 4 983 -
Frame Textiles Mr. David Bowen (Authority Member) Levies 821 -
Zenzeleni Mr. Andre Kriel (Authority Member) Levies 46 -
Prestige Clothing Mr. Graham Choice (Committee Member) Levies 252 -
Pals Clothing Mr. Graham Choice (Committee Member) Levies 224 -
Bonwit (Seardel Group) Mr. David Bowen (Authority Member) Levies 453 -
Monviso Knitwear (Seardel Group) Mr. David Bowen (Authority Member) Levies 414 -
Romatex (Seardel Group) Mr. David Bowen (Authority Member) Levies 496 -
Prestige Lingerie (Seardel Group) Mr. David Bowen (Authority Member) Levies 756 -
Prima Toys Mr. David Bowen (Authority Member) Levies 381 -
Brits Textiles Mr. David Bowen (Authority Member) Levies 80 -
SAPPI Southern Africa Mr. Mike Truelock (Authority Member) Levies 1 060 -
The above transactions occurred under terms that were no less favorable than those available in similar arm’s length dealings.
30.3 Transactions with other Government Departments within national sphere
Payables 787 -
Ethekwini Municipality Supply electricity 276 -
Telkom Telephone usage 511 -
Total 787 -

FP&M SETA Annual Report | 2011/1269
31. BUDGET VS ACTUAL FIGURES
The financial statements and the budget were prepared on the same basis of accounting.
FP&M SETA budget comparison with actual figures
2011/12 2011/12 2011/12
‘000 ‘000 ‘000
Statement of Financial Performance
Actual Budget Variance
Skills Development Levies 274 630 236 835 37 795 note 1
Administrative income 35 987 29 604 6 383
Mandatory grant income 173 195 118 417 54 778
Discretionary grant income 65 448 88 813 (23 366)
Interest & Penalties 2 853 1 792 1 061
Investment income 18 664 9 768 8 896
KZN DEDT income 637 637 -
W&R SETA - Joint collaboration project 770 621 149
TLS - UIF 2 691 992 1 699
TLS - W&R SETA 3 317 319 2 998
TLS - DHET 1 247 - 1 247
National Skills Fund received in advance 2 881 4 342 (1 461)
Government grants and donor funding received in advance 112 10 493 (10 381)
Other revenue 146 - 146
Total 307 948 265 799 52 597
Mandatory grant expenses (93 419) (88 376) (5 043) note 2
Pivotal grants (23 683) 23 683
Discretionary expenses (36 969) (90 481) 53 512 note 3
Discretionary / project administration expenses - (5 900) 5 900 note 3
Discretionary , projects expenses from prior year - (259 600) 259 600 note 3
National Skills Fund received in advance (2 881) (4 342) 1 461
Government grants and donor funding received in advance (112) (10 493) 10 381
KZN DEDT: Special project (637) (637) -
W&R SETA - Joint collaboration project-Funds expensed (770) (992) 222
TLS - UIF (2 691) (319) (2 372)
TLS - W&R SETA (3 317) (621) (2 696)
TLS - DHET (1 247) - (1 247)

FP&M SETA Annual Report | 2011/12 70
2011/12 2011/12 2011/12
‘000 ‘000 ‘000
Actual Budget Variance
Administration expenses (31 062) (37 760) 6 698
Accommodation & meals (231) (331) 100
Accounting Authority fees (235) (235) -
Airfares & travel costs (1 570) (1 570) -
Staff Travel - Re-imbursment (280) (280) -
Amortisation (44) (69) 24
Audit Committee (75) (90) 15
Audit fees (3 296) (3 867) 570
Bad Debts (106) (106) -
Bank Charges (108) (111) 3
Catering and refreshments -functions & meetings (258) (259) -
Cleaning (80) (91) 11
Advertising (153) (153) -
Consultancy and service provider fees (3 664) (4 197) 533
Courier and Postage (168) (171) 3
Depreciation 2 629 (258) 2 887
Donations and sponsorships (9) (9) -
Electricity & water (276) (321) 44
Equipment rental - (12) 12
interest in finance lease (34) (35) 1
interest - (5) 5
ETQA Exp - Accomodation-SSF (5) (16) 11
ETQA Exp - Airfares-SSF (52) (117) 65
ETQA Exp - Functions & Meetings - (20) 20
ETQA Exp - Motor expenses (15) (23) 7
ETQA Exp - Travel (38) (44) 7
ETQA subsistance (4) (4) -
Finance Committee - (42) 42
HR & Remuneration Committee - (30) 30
Insurance (218) (244) 27
Internal audit (331) (381) 51
Leasing charges-equipment (83) (83) -
Legal fees (72) (99) 27
Loss on disposal of property, plant and equipment (363) (382) 19
Motor vehicle hire (147) (147) -
Vehicle - Fuel and lubrication - (15) 15
Vehicle - Maintenance - (7) 7

FP&M SETA Annual Report | 2011/1271
2011/12 2011/12 2011/12
‘000 ‘000 ‘000
Actual Budget Variance
Office Expenses (192) (192) -
Possible Audit Committee investigations (12) 12
Printing and Publications (162) (227) 64
Professional indemnity (46) (57) 11
Rent paid (2 512) (2 637) 125
Repairs and maintenance of building , office equipment & computers (118) (149) 31
Computer expenses (475) (539) 64
Salaries and staff related costs (16 045) (17 022) 977
Security expenses (33) (35) 2
Staff & Board training (55) (215) 160
Staff welfare (10) (50) 40
Stationary (49) (126) 76
Subscriptions and memberships (206) (206) -
Telephone (876) (1 004) 127
Workshop- Team building (38) (118) 80
Workshops - (175) 175
MIS for FP&M SETA (958) (1 177) 219
Net surplus 134 843 (257 405) 392 248
Statement of Financial Position
Non-current assets
Property, plant and equipment and intangible assets 4 084 1 844 2 240 note 4
Current assets
Receivables from non-exchange transactions 5 255 300 4 955
Receivables from exchange transactions 1 154 1 014 140
Inventories 111 80 31
Cash and cash equivalents 423 935 22 351 401 584 note 5
Total assets 434 539 25 589 408 950
Funds and reserves
Administration reserve 4 084 1 844 2 240
Employer grant reserve 33 500 (467) note 6
Discretionary reserve 359 544 1 880 357 664

FP&M SETA Annual Report | 2011/12 72
2011/12 2011/12 2011/12
‘000 ‘000 ‘000
Actual Budget Variance
Non - current Liabilities
Finance lease obligations 95 95
Retirement benefit obligations - -
Current liabilities
Trade and Other Payables non – exchange transactions 46 243 17 365 28 878 note 7
Trade and Other Payables – exchange transactions 2 001 2 000 1
Current portion of finance lease obligations 115 - 115
Government grants and donor funding received in advance 11 708 - 11 708 note 8
KZN DEDT project funds received in advance - - - note 8
W&R SETA funds received in advance 852 - 852 note 8
TLS W&R UIF funds received in advance 256 - 256 note 8
W&R SETA funds received in advance 1 048 - 1 048 note 8
DHET funds received in advance 2 563 - 2 563 note 8
Loan account - MICT SETA 7 - 7 note 8
Loan account - CATHSSETA 5 992 - 5 992 note 8
Provisions - 2 000 (2 000) note 9
Total equity and liabilities 434 539 25 589 408 950
Note 1 An increase of 3% for skills levies received in the 2011/12 financial year of the three amalgamating SETAs was budgeted for as the Accounting Authority agreed to take a more conservative approach as it was the first year of the FP&M SETA. The actual increase was 16%.Note 2 A payout ratio of 78% was budgeted for, the actual payout ratio for FP&M SETA was 55%, this accounts for the various in actual and budgeted amounts.Note 3 FP&M SETA budgeted for pivotal grants to be paid out, the PIVOTAL grant regulations are still in the process of being finalised. Discretionary grant allocations were finalised late in the financial year as the merger had to be completed by September 2011 , this accounts for the variance in discretionary expenses and project administration expenses. The budget also assumed that all commitments carried over in the amalgamation into the FP&M SETA would be expensed in the 2011/12 financial year . This was due to the merger being completed in September 2011.Note 4 The variance between budgeted and actual fixed assets is due to the life of the FP&M SETA assets being extended .Note 5 The variance between the budgeted and actual amount between cash and cash equivalent is due to the delay in discretionary grant spending as a result of the amalgamation process.Note 6 Employer grant reserve was less than budgeted for as fewer companies registered with FP&M SETA in the last 6 months of the financial year.Note 7 The variance in Trade and Other Payables non – exchange transactions is due to the actual mandatory grant accrual being calculated on two months levies as two months levy down loads were received after the financial year end. The budget accounts for only one month mandatory grant accrual Note 8 No donor funds were budgeted for as the donor funds in the FP&M SETA financials have been carried over during the amalgamation processNote 9 This budgeted provision was for the companies which fall below the R500 000 threshold and are exempt from paying levies. The actual provision has been disclosed in Note 13: Trade and Other Payables Non-exchange Transactions.

FP&M SETA Annual Report | 2011/1273
32. COMMITMENTS
Of the balance of R359 544 million available in the Discretionary Reserves at the end of March 2012, R102,2 million has been approved and contractually committed. Amounts for expenses that have already been contracted or incurred and therefore included in grant expenses in the Statement of Financial performance are also indicated. A request for the accumulation of these funds has been submitted to National Treasury on the 31 of May 2012. At the time of compiling the Annual Financial Statements, no reply had been received. As FP&M SETA is a newly formed SETA and the merger of the three amalgamating SETAs forming FP&M SETA had to be completed within the first 6 months of the financial year, the FP&M SETA was unable to commit all the discretionary reserves for 2011/12 by the 31 of March 2012. Care was taken by the Accounting Authority to ensure that there were proper systems and governance structures in place before the discretionary funds were allocated to various projects and discretionary grants.The Commitments note shows the commitments carried over from the amalgamation of FIETA, CTFL SETA and part of MAPPP-SETA which was applicable to NSDS II.The FP&M SETA commitments register for the first year of existence is aligned to NSDS III.
FP&M SETA TOTAL COMMITMENTS AND APPROVED FUNDS
End March2012
Committed
NSDSII R’000
CTFL SETA 42 914
FIETA 3 595
MAPPP-SETA 39 824
SubTotal 74 742
NSDSIII
FP&M SETA 15 851
TOTAL 102 185

FP&M SETA Annual Report | 2011/12 74
NSDSIII
NSDSIII Objective
Budget approved by
the Board
TOTAL Discretionary
Grant Funding Allocations
approved by the Accounting
Authority
Additional Funding
approved by the Board to meet further
allocations
Adjustments to Project
Commitments
Expenditure - April to Mar
2012
Balance of Approved and Contractually
Committed at 31 of March 2012
NSDS Objective 4.1 Establishing a credible institutional mechanism for skills planning
Output 4.1.1.2: Sector skills plans are professionally researched, provide a sound analysis of the sector and articulate an agreed sector strategy to address skills needs. 250 250 (113) 137 -
NSDS Objective 4.2 Increasing access to occupationally-directed programmes
Output 4.2.1.2: Projects are established to address middle level skills in each sector. 58 490 60 634 3 482 (50 209) 163 10 263
RPL processes 50 50 - (50) - -
AE level 1 - 4 or equivalent learning programmes 2 400 2 397 - (1 911) 9 477
Learnerships at NQF level 2 and above. 42 000 42 875 875 (35 140) 65 7 670
Skills programmes relating to management and technical scarce / critical skills areas. 5 040 7 507 2 467 (5 654) 89 1 765
Bursary programmes at HET or FET institutions 6 300 6 440 140 (6 254) - 186
Work experience / internships in entities in the FP&M sector 2 700 1 365 - (1 200) - 165
NSDS Outcome 4.2.2: 10,000 artisans per year qualify with relevant skills and find employment
Output 4.2.2.1: SETAs establish projects and partnerships to enable the relevant number of artisans for their sector to be trained, to qualify and become work ready. 6 250 12 775 6 525 (11 095) - 1 680
Section 13 Apprenticeships 6000 12 510 6 510 (10 870) - 1 640
Section 28 Apprenticeships 250 265 15 (225) - 40
NSDS Outcome 4.2.4: Relevant research and development and innovation capacity is developed and innovative research projects established
Output 4.2.4.3: Programmes are put in place that focus on the skills needed to produce relevant research. 250 250 - (110) - 140
Post graduate studies 250 250 - (110) - 140

FP&M SETA Annual Report | 2011/1275
NSDSIII Objective
Budget approved by
the Board
TOTAL Discretionary
Grant Funding Allocations
approved by the Board
Additional Funding
approved by the Board to meet further
allocations
Adjustments to Project
Commitments
Expenditure April to
March 2012
Balance of Approved and Contractually Committed at
31 of March 2012
NSDS Objective 4.3 Promoting the growth of a public FET college system that is responsive to sector, local, regional and national skills needs and priorities
Output 4.3.2.2: SETAs identify FET colleges with relevant programmes and put in place partnerships to offer vocational courses and work experience for college learners. 2 500 2 500 - (2 500) -
DUT - 540 - (540) - -
Eastern Cape Communication Forum - 216 - (216) - -
Esayidi FET College - 108 - (108) - -
Western Cape Learnership Centre (WCLC) CPT - 108 - (108) - -
CPUT (Shamil) - 70 - (70) - -
Furntech - 300 - (300) - -
NMMU - Saasveld - 105 - (105) - -
WCLC CPT - 108 - (108) - -
West Coast FET - 225 - (225) - -
DUT - 90 - (90) - -
PAMSA - 450 - (450) -
DUT in collaboration with Saris for Good Karma - 180 - (180) - -
NSDS Outcome 4.5.1: Training of employed workers addresses critical skills, enabling improved productivity, economic growth and the ability of the work force to adapt to change in the labour market
Output 4.5.1.2: Sector projects are put in place to address specific sector skills gaps. 1 500 1 500 - (1 500) - -
Output 4.5.1.3: Cross-sectoral projects are established to address skills needs along local supply chains aimed at supporting local economic development. 1 000 1 000 - (1 000) - -
Output 4.6.3.2: SETAs establish quality pilot projects. 2 000 5 756 3 756 (4 874) - 882
National Bargaining Council of the Clothing Industry - 150 - (150) - -
SACTWU EDUPEG Project - 2 000 - (2 000) - -
CEPPWAWU Training for Retrenched Workers - 2 000 - (2 000) - -
SAFCA - 252 - - - 252
CEPPWAWU - 630 - - - 630
FAWU Skills Programmes - 724 - (724) - -

FP&M SETA Annual Report | 2011/12 76
NSDSIII (continues):
NSDSIII Objective
Budget approved by
the Board
TOTAL Discretionary
Grant Funding Allocations
approved by the Board
Additional Funding
approved by the Board to meet further
allocations
Adjustments to Project
Commitments
Expenditure April to
March 2012
Balance of Approved and Contractually Committed at
31 of March 2012
Ringfencing for disabled (4%) 2 360 2 858 498 (1 958) 720 180
Batho Socio-Psychology Empowerment Organization - 159 - (159) - -
Sew Africa - 250 - (250) - -
Mashabambane Disabled Group - 159 - (159) - -
Mpumulanga Skills Training Centre - 159 - (159) - -
Phaphamani Disabled Centre - 122 - (122) - -
Sheltered Employment Factories - 244 - (244) - -
Soweto Association of Persons with Disabilities - 183 - (183) - -
Izandla Zenkosi Community Development Centre - 75 - (75) - -
Filadelphia - 171 - (171) - -
Basimodi Training - 300 - - 210 90
Umgungundlovu FET College - 437 - (437) - -
JHB Society for the Blind - 300 - - 300 -
Phatsiphatsi - 300 - - 210 90
Ringfencing for rural development (10%) 5 900 5 890 - (4 448) 635 808
Parowkloof Investments t/a L&X Project V - 216 (216) - -
Enhlazane (Disabled) - 108 (108) - -
Forestry Skills Injection - 500 (500) - -
Tirhani Skills Training - 72 (72) - -
Alliance for Poor orphaned and unemployed - 300 (300) - -
E-Skills (& and Co-operatives) - 400 (400) - -
Durban University of Technology (DUT) - Injija Interiors - 144 (144) - -
Eyomama in Agriculture and Rural Development KZN - 460 (460) - -
Zusbo Forestry Contractors - 144 (144) - -
Mondisa Co-operative - 450 (450) - -
Tipfuxeni Community Development - 450 (450) - -
National Department of Public Works - 128 (128) - -
Tsakrhula Khensani Trading - 252 (252) - -
Genesis Power Trading Enterprise - 324 (324) - -
Mitchells Plain Skills Centre - 500 (500) - -
Furniture World Private College - 750 - 150 600
Ditholoana Tsa Setshaba - 341 - 239 102
Striving Minds - 352 - 246 106

FP&M SETA Annual Report | 2011/1277
NSDSIII (continues):
NSDSIII Objective
Budget approved by
the Board
TOTAL Discretionary
Grant Funding Allocations
approved by the Board
Additional Funding
approved by the Board to meet further
allocations
Adjustments to Project
Commitments
Expenditure April to
March 2012
Balance of Approved and Contractually Committed at
31 of March 2012
Special sector skills development projects 5 213 7 409 - (4 934) 576 1 899
Africa Skills Village - 280 (280) - -
Cape Clothing Association - 145 (145) - -
Publishers’ Association of South Africa - 900 (900) - -
Duduza Development - 108 (108) - -
Eastern Cape Communication Forum - 60 (60) - -
Sol Plaatje Institute for Media Leadership, School of Journalism and Media Studies, Rhodes University - 480 (480) - -
PAMSA - 179 (179) - -
Eddels Shoes (PTY) Ltd - 225 (225) - -
CN Business furniture - 72 - 22 50
Sycint Trading - 341 - 238 102
DAFF - 2 000 62 316 1 746
Printing SA QCTO Sheeted Lithographer - 900 (900) - -
FP&M SETA experiential project - 1 000 (1 000) - -
CPUT (Ntombie Nonxuba) - 168 (168) - -
Western Cape Furniture initiative - 150 (150) - -
Hope Training & Development Centre - 144 (144) - -
Blessings are Forever Training & Projects - 108 (108) - -
National Bargaining Council of the Wood & Paper Sector - 44 (44) - -
Hays Print - 35 (35) - -
Intrepid Printers - 70 (70) - -
Project Admin Budget (10%) 5 900 5 878 (5 878) - -
Capacity Building of Stakeholders: Marketing and Communication 1 500 1 500 (182) 1 318 -
NSFAS 4 000 3 160 (3 129) 31 -
TOTAL 97 113 111 359 14 260 (91 929) 3 581 15 851

FP&M SETA Annual Report | 2011/12 78
Commitments carried over from CTFL SETA after the amalgamation
NSDS 2 Projects
Balance as per 2010/2011 CTFL SETA
Annual Report R’000
Approved in 2010/2011
and committed in 2011/2012
R’000 Expenditure
Closing Balance at
March 2012 R’000
Indicator 1.2
Ind 1.2A: Design and print critical skills guide and distribute to learners. 73 - - 73
SUBTOTAL OBJECTIVE 1 73 - - 73
OBJECTIVE 2:
Ind 2.2A: Skills Development Projects for small compnaies 779 - - 779
Project 3: Mechanician: Small Companies 30 - - 30
Project 7: CTFL SMME : Small Companie 147 - (47) 100
Project 9: Sewing Industry Training Trust (SITT) Mechanician Operators Project 2 53 - - 53
Project 10: SITT modular training course on sewing machine repairs & maintenance of industrial machines 50 - - 50
Ind 2.2B: ETDP Bursaries for Small Companies 268 - (14) 254
Ind 2.2C: Learnership Grants for small companies 860 - - 860
Ind 2.2D: Management Bursaries for small Co’s 276 - - 276
Ind 2.2E: Sector Skills Facilitation (WSPs) 1 339 - (1 001) 338
Ind 2.5: Support to small BEE firms and co-operatives 613 - (19) 594
Ind 2.7: Bursaries support to workers to achieve ABET 4 753 - (155) 4 598
Ind 2.8A: Learnership grants for workers (18.1 learners) 10 218 - (3 490) 6 728
Ind 2.8B: Technologist Bursaries for Workers 3 086 - (125) 2 961
Ind 2.8C: Management Bursaries for workers 5 159 - (419) 4 740
Ind 2.8E: Sewing Machine Mechanics 990 - (150) 840
Ind 2.8F: Work Study Bursaries 284 - (29) 255
Ind 2.8G: Textile Apprentices 3 260 - - 3 260
Ind 2.8H: Liberec (jipsa) masters program 3 - - 3
Ind2.8I: Project 1 Computer Pattermaking 401 - (48) 353
Ind2.8I: Project 4 CPUT High Level Operator 9 - - 9
Ind2.8I: Project 5 CPUT Atlantis Cluster 100 - - 100
Ind2.8I: Project 6 Disabled Learners - - - -
Ind2.8I: KZN DEDT & CTFL SETA joint project seminar & CPD programs 2 817 - (2 322) 495
SUBTOTAL OBJECTIVE 2 35 495 - (7 819) 27 676
OBJECTIVE 3:
Ind 3.2: Support to NLPs, CBOs and NGOs (accreditation & grant support) 22 - - 22
SUBTOTAL OBJECTIVE 3 22 - - 22
OBJECTIVE 4:
Ind 4.1A: Technologist Bursaries for Unemployed learners 1 979 - (553) 1 426
Ind 4.1B: Learnership grants for unemployed learners (18.2 Learners) 8 353 - (1 095) 7 258
Ind 4.2: Work experience grants and technologist bursaries 2 144 - (34) 2 110
Ind 4.3: New venture creation grants 579 - (145) 434
Ind 4.3: DUT NVC Management Programme 201 - - 201
SUBTOTAL OBJECTIVE 4 13 256 - (1 827) 11 429
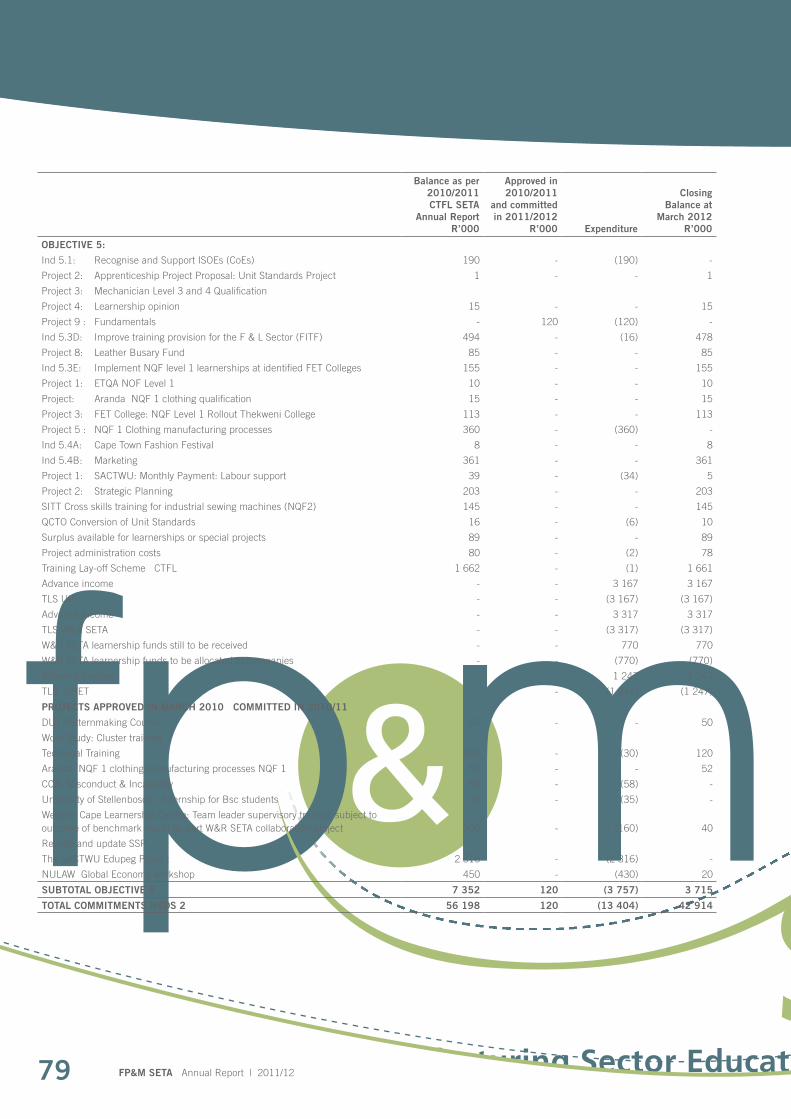
Balance as per 2010/2011 CTFL SETA
Annual Report R’000
Approved in 2010/2011
and committed in 2011/2012
R’000 Expenditure
Closing Balance at
March 2012 R’000
OBJECTIVE 5:
Ind 5.1: Recognise and Support ISOEs (CoEs) 190 - (190) -
Project 2: Apprenticeship Project Proposal: Unit Standards Project 1 - - 1
Project 3: Mechanician Level 3 and 4 Qualification
Project 4: Learnership opinion 15 - - 15
Project 9 : Fundamentals - 120 (120) -
Ind 5.3D: Improve training provision for the F & L Sector (FITF) 494 - (16) 478
Project 8: Leather Busary Fund 85 - - 85
Ind 5.3E: Implement NQF level 1 learnerships at identified FET Colleges 155 - - 155
Project 1: ETQA NOF Level 1 10 - - 10
Project: Aranda ‐NQF 1 clothing qualification 15 - - 15
Project 3: FET College: NQF Level 1 Rollout Thekweni College 113 - - 113
Project 5 : NQF 1 Clothing manufacturing processes 360 - (360) -
Ind 5.4A: Cape Town Fashion Festival 8 - - 8
Ind 5.4B: Marketing 361 - - 361
Project 1: SACTWU: Monthly Payment: Labour support 39 - (34) 5
Project 2: Strategic Planning 203 - - 203
SITT Cross skills training for industrial sewing machines (NQF2) 145 - - 145
QCTO Conversion of Unit Standards 16 - (6) 10
Surplus available for learnerships or special projects 89 - - 89
Project administration costs 80 - (2) 78
Training Lay-off Scheme ‐ CTFL 1 662 - (1) 1 661
Advance income - - 3 167 3 167
TLS UIF - - (3 167) (3 167)
Advance income - - 3 317 3 317
TLS W&R SETA - - (3 317) (3 317)
W&R SETA learnership funds still to be received - - 770 770
W&R SETA learnership funds to be allocated to companies - - (770) (770)
Advance income - - 1 247 1 247
TLS ‐DHET - - (1 247) (1 247)
PROJECTS APPROVED IN MARCH 2010 ‐ COMMITTED IN 2010/11
DUT Patternmaking Course 50 - - 50
Work Study: Cluster training
Technical Training 150 - (30) 120
Aranda ‐NQF 1 clothing manufacturing processes NQF 1 52 - - 52
CCA: Misconduct & Incapacity 58 - (58) -
University of Stellenbosch : Internship for Bsc students 35 - (35) -
Western Cape Learnership Centre: Team leader supervisory training subject to outcome of benchmark report as part W&R SETA collaboration project 200 - (160) 40
Rewrite and update SSP
The SACTWU Edupeg Project 2 316 - (2 316) -
NULAW ‐Global Economy workshop 450 - (430) 20
SUBTOTAL OBJECTIVE 5 7 352 120 (3 757) 3 715
TOTAL COMMITMENTS NSDS 2 56 198 120 (13 404) 42 914
79 FP&M SETA Annual Report | 2011/12

FP&M SETA Annual Report | 2011/12 80
Commitments carried over from FIETA after the amalgamation
NSDS Objective & Indicator
Balance as per
2010/2011 Annual Report
R’000Committed
R’000Expenditure
R’000
Closing Balance as at
March 2012 R’000
Realloction of funds to be
approved by FP&M
SETA Board R’000
Closing Balance as at March 2012
R’000
Authority 4 374 2 515 (5 305) (931) 993 62
4.1: Chamber 40% Contribution to Authority 4 325 1 940 (4 283) 42 - 42
2.8: Quality Management System FIETA and Providers 1 - - 1 - 1
2.8: Strategic Disability Project 6 - - 6 - 6
2.8: Training of Master Assessors 122 299 (433) (310) 310 -
2.8: NSF Vul'amathuba (42) 114 (116) (158) 158 -
3.2: Amahlati Emerging Contractors Project 11 - - 11 - 11
4.1: Working for Fire & Woodlands: Contractor Training 35 - (32) 3 - 3
4.1: Research and Impact Studies 7 - (86) (80) 80 -
4.1: Training Lay-off Scheme (182) 162 - (182) 182 -
4.1: Amalgamation Project 91 - (354) (263) 263 -
Forestry Chamber 3 218 1 129 (974) 2 243 424 2 667
1.1: Allocated for promotion of Forestry Chamber Objectives 73 - - 73 - 73
1.1: Generation of Unit Standards and Qualifications in Forestry 80 - - 80 - 80
1.2: Saasveld Bridging Course 3 - - 3 - 3
1.2: Saasveld second year 3 months practical 121 - (113) 8 - 8
2.5: NSDS exhibitions 6 - - 6 - 6
2.7: Forestry discretionary projects 1 - - 1 - 1
2.8: Adult Basic Education Training facilitator training 1 - - 1 - 1
2.5: University of Stellenbosch - contractor project 42 - - 42 - 42
2.8: Development of Scarce and Critical Skills guides (2) - (113) (115) 115 -
2.8: Development and support for Broad Based BEE 30 - - 30 - 30
2.8: SDF capacity building on scarce and critical skills 1 - - 1 - 1
2.8: Support for NGOs, CBO, Community-based cooperatives 41 - - 41 - 41
2.8: Work Experience grant for FET and HET graduates 149 - (72) 76 - 76
2.8: New venture creation project 78 - - 78 - 78
2.8: Development & support for Sectoral or Occupational Excellence 15 - - 15 - 15
2.8: NSF constituency capacity building and advocacy 1 - - 1 - 1
2.8: Research and Impact Studies (241) - (241) 241 -
2.8: NQF Insitutions Support Project 1 - 1 1
2.8: Strategic ABET Interventions 1 48 1 1
2.8: SME Support Programme (1) - (1) 1 -
2.8: SMME 3 23 - 23 23
2.8: Cost & Management Accounting for Forestry contractors 38 - 38 38
3.2: Land Claimants Capacity Building Project (8) 147 1 (7) 7 -

FP&M SETA Annual Report | 2011/1281
Commitments carried over from FIETA after the amalgamation (continues):
NSDS Objective & Indicator
Balance as per
2010/2011 Annual Report
R’000Committed
R’000Expenditure
R’000
Closing Balance as at
March 2012 R’000
Realloction of funds to be
approved by FP&M
SETA Board R’000
Closing Balance as at March 2012
R’000
3.2: Learnerships in support of NSDS 2.8 and 4.1 1 - (150) (149) (149)
3.2: Artisan (Apprentices/Interns) Development Project 761 327 ( 97) 663 663
3.2: Sector Bursaries 163 - 163 163
3.2: Forestry Community-based-projects Upskilling Project 140 - (8) 133 133
4.1: Scarce Skills Learnership Project 2007-2008 11 - (3) 7 7
4.1: Working on Fire 196 180 (91) 105 105
Learner tracking 3 - 3 3
Fire Managers Hand Book 149 100 (100) 49 49
4.1: Ground Based Harvesting Hand Book 1 - 1 1
4.1: DWAF Experiential Learners 2 95 2 2
4.1: Small Forest Enterprise Programme 1 - 1 1
4.1: Lands Claims Initiative 148 - (10) 138 138
4.1: Municipalities Fire Fighting Project 249 - 249 249
4.1: Arboriculture Qualification 1 - 1 1
4.1: Programme for the Disabled 2 29 2 2
4.1: ABET 1 177 1 1
4.1: Bursary's 858 - (102) 757 757
4.1: Capacity Building - Labour 6 - 6 6
4.1: Disability Learnerships (1) - (1) 1 -
4.1: Ministerial Priorities 1 - (59) ( 58) 58 -
4.1: Monitoring of Projects 75 26 (59) 16 16
Furniture Chamber 3 567 5 150 (4 842) (1 275) 1 585 310
1.2: Unallocated expenditure 2 183 - 2 183 (2 183) -
1.2: Development of Standards, Qualifications and Learnerships 1 - 1 1
1.2: ABET 1 - 1 1
1.2: Learnerships 333 909 ( 723) ( 390) 390 -
1.2: Stakeholder communication 4 - 4 4
2.5: NSDS exhibitions 11 - 11 11
2.8: Usindiso Ministries Upholstery for Abused Women 40 - 40 40
2.8: Scarce and critical skills project 1 - 1 1
2.8: Development of Scarce and Critical Skills guides 1 - 1 1
2.8: Research and impact studies 11 - 11 11
2.8: Usindiso Strategic Women Project (Upholstery) (4) - (4) 4 -
4.1: Artisan Development: MTA Section 28 Project 2007-2008 229 - 229 229
4.1: Labour Capacity Building on NQF Furnwood Chamber - 225 (225) (225) 225 -
4.1: Learner tracking 24 - (48) (23) 23 -
4.1: Furnwood Bursaries 2 - 2 2

NSDS Objective & Indicator
Balance as per
2010/2011 Annual Report
R’000Committed
R’000Expenditure
R’000
Closing Balance as at
March 2012 R’000
Realloction of funds to be
approved by FP&M
SETA Board R’000
Closing Balance as at March 2012
R’000
4.1: Skills Training for Society for the Blind 1 - (327) (327) 327 -
4.1: Learnerships - 1 025 - - -
4.1: SA Timber and Recovery 1 - (3) ( 2) 2 -
4.1: Disability Learnerships 22 - (14) 8 8
4.1: Ministerial Priorities 1 1 421 (1 848) (1 847) 1 847 -
4.1: Monitoring of projects (142) - - (142) 142 -
4.1: Unemployed Youth Qwaqwa 847 1 570 (1 655) (808) 808 -
Pulp and Paper Chamber (605) 177 ( 545) (1 151) 1 352 201
1.2: Allocated for promotion of Pulp and Paper Chamber objectives 1 - - 1 - 1
1.2: Subvention of the B Tech programme at Natal Technikon 37 - - 37 - 37
2.1: Learnerships for Artisans (283) - (1) (284) 284 -
2.2: Training of SDF's 1 148 (148) (147) 147 -
2.5: Develop,implement and incentivise 1 - - 1 - 1
2.5: NSDS Exhibitions 2 - - 2 - 2
2.5: Industry Training School 10 - - 10 - 10
2.8: SDF capacity building on scarce and critical skills 1 - - 1 - 1
2.8: Support for NGOs, CBO, Community-based Co-operatives 10 - - 10 - 10
2.8: Work Experience grant for FET and HET Graduates (10) - (61) (70) 70 -
2.8: NSF constituency capacity building and advocacy 57 - - 57 - 57
2.8: Research and impact studies (61) - (3) (64) 64 -
2.8: NQF Institutions Support Project (105) 19 (65) (170) 171 -
2.8: Pulp & Paper Disability Project - DEAFSA (Western Cape) 31 - - 31 - 31
2.8: Strategic Pulp & Paper ABET Project 26 - - 26 - 26
3.2: Material Development (79) - - (79) 79 -
3.2: Coaching, Mentoring & Assessor Training 22 - - 22 - 22
3.2: Certificate in Pulp & Paper (299) - - (299) 299 -
4.1: New Venture Creation 1 - - 1 - 1
4.1: Project Sort It - PAMSA PRASA 30 - (267) (237) 237 -
4.1: Ministerial Priorities 1 10 - 1 - 1
FP&M SETA Annual Report | 2011/12 82

FP&M SETA Annual Report | 2011/1283
Commitments carried over from FIETA after the amalgamation (continues):
NSDS Objective & Indicator
Balance as per
2010/2011 Annual Report
R’000Committed
R’000Expenditure
R’000
Closing Balance as at
March 2012 R’000
Realloction of funds to be
approved by FP&M
SETA Board R’000
Closing Balance as at March 2012
R’000
Wood Products Chamber 521 1 585 (1 1 48) ( 627) 982 355
1.2: SMME Charcoal project (19) 40 (26) ( 45) 45 -
1.2: Wood Products SGB 2 - - 2 - 2
2.2: Low cost sawmilling network initiative 330 40 (253) 78 - 78
2.6: Discretionary: Chris Hani District Municipality 17 - - 17 - 17
2.8: CEPPWAWU - Capacity Building 10 - - 10 - 10
2.8: Development of Scarce and Critical Skills guides 1 - - 1 - 1
2.8: Development and support for Broad Based BEE 35 - - 35 - 35
2.8: SDF capacity building on scarce and critical skills 3 - - 3 - 3
2.8: Support for NGOs, CBO, Community-based Co-operatives 4 - - 4 - 4
2.8: Work Experience grant for FET and HET Graduates (18) - (6) (24) 24 -
2.8: New Venture Creation project 97 - - 97 - 97
2.8: Development & support for Sectoral or Occupational Excellence 49 - - 49 - 49
2.8: NSF constituency capacity building and advocacy 5 - - 5 - 5
2.8: Research and impact studies (41) - (20) (61) 61 -
2.8: NQF Institutions Support Project 32 - (85) (53) 53 -
2.8: Strategic 18.2 Youth Project (East Rand) 113 - (177) (64) 64 -
2.8: SME Support Programme 52 - - 52 - 52
4.1: Furniture Design: e-Learning 1 - - 1 - 1
4.1: Discretionary grants - January 2010 1 - - 1 - 1
4.1: Ministerial Priorities (152) 1 380 (519) (671) 671 -
Umgungunglovu FET College - catering costs - 125 (63) (63) 63 -
11074 10 556 (12 815) (1 741) 5 336 3 595

FP&M SETA Annual Report | 2011/12 84
Commitments carried over from MAPPP-SETA
Commitments
Commitments as per
MAPPP-SETA Annual Report
Prior year adjustments to
the Amalgamation balances carried
over from MAPPP commitments
register
Adjustment to revised
amalgamation balances
carried over from
MAPPP-SETA
Revised commitments for carried over from
MAPPP-SETA
Commitments transferred
over to MICT SETA
Less expenses paid by
FP&M SETA on behalf of MICT SETA
Balance transferred to
MICT SETA
ABET 386 (8) 378 324 246 78
Bursaries 3 030 180 3 210 2 405 1 450 955
Internships 1 737 260 1 997 898 858 40
Learnerships 3 582 10 3 592 1 905 784 1 121
Skills programs 19 164 (7 137) 12 027 6 163 2 251 3 912
Mentorships 802 38 840 - - -
ISOE 3 173 - 3 173 - - -
ApprenticeshipsNote 1 27 090 41 298 (25 267) 43 121 - - -
Total 58 965 34 640 (25 267) 68 339 11 695 5 588 6 107
Commitments carried over from MAPPP-SETA (continues):
Commitments
Commitments transferred
over to CATHSSETA
Less expenses paid by FP&M
SETA on behalf of CATHSSETA
Balance transferred to CATHSSETA
Portion of Commitments transferred to FP&M SETA
from MAPPP-SETA
FP&M SETA commitments
after delineation Expenditure
Balance at Year end
ABET 54 54 - - - - -
Bursaries 443 245 198 362 362 349 14
Internships 96 87 9 1 003 1 003 645 360
Learnerships 1 201 1 072 129 487 487 390 97
Skills programs 4 857 2 871 1 985 1 008 1 008 554 454
Mentorships 830 736 94 10 10 - 10
ISOE 2 173 1 173 1 000 1 000 1 000 - 1 000
ApprenticeshipsNote 1 - - - 43 121 43 121 5 231 37 890
Total 9 654 6 238 3 416 46 990 46 990 7 169 39 824
Note 1: MAPPP-SETA was delineated between three SETAs being FP&M SETA, CATHSSETA and MICT SETA. All commitments of MAPPP-SETA where split between these three SETAs. There was an unallocated discretionary reserve amount which was split between FP&M SETA and CATHSSETA. CATHSSETA is due R5 991 543 of theses unallocated funds. The apprenticeship commitments which were transferred to FP&M SETA have been compared to the contracts now held by FP&M SETA . There is a contingent liability of R1 516 000 which may have to be paid over to CATHSSETA for additional unallocated discretionary funds once all the inherited apprenticeship contracts of the former MAPPP-SETA have been further reviewed in 2012/13. All the inherited apprenticeship contracts of the former MAPPP-SETA will be further reviewed in 2012/13.

FP&M SETA Annual Report | 2011/1285
AnneXuRe 1: fp&M SetA oRGAnoGRAM And equity bReAkdown
as at 31 March 2012
GRANTS ACCChereece Balkisson
FIN ACCAvinash Gangoo
HR MANVacant
SCM MANAnne Gideon
SCM SPECVicky Lukhele
SCM ADMINLungile Manganyi
FIN ADMIN Samkilisiwe Ngwira
PAYROLL ADMIN Marcia Mothielall
GRANTS ADMIN Razia Iyoob
M & C MANElmine Baumann
HR SPECAmanda
Madonsela
M & C SPECVacant
GENERAL OFFICE WORKER
Sylvia Patho & Thelma Gcaza
CLIENT LIAISON ADMIN
Qhamani Mali
Africa
n Fe
male
Senior Management Specialist / Coordinator General Worker Middle Management Administrator
Colour
ed F
emale
Permanent Staff
India
n Fe
male
Whit
e Fem
ale
Africa
n M
ale
Colour
ed M
ale
India
n M
ale
Whit
e Male
Vaca
nt
DOC & LOGISTIC ADMIN
Daniel Majoe
IT SPECBongani Masango
EXEC ASSISTZanele Sithole
CFOGina Layzell
25
20
15
10
5
0
24
11
33
326
8
1

FP&M SETA Annual Report | 2011/12 86
ACTING CEOBheki Zulu
RISK & IA MANBreezer Gule
PROJ MANLinda Mngadi
REG MAN WCAlan Taylor
M & E MANSylvia Tsunke
M & E SPECLaurika Van Den
Heever
REG MAN KZNTimothy Canham
SP & RESEARCH MAN
Dikeledi Mosalo
REG MAN GAUAnsie Nagel
ETQA MANJohnny Modiba
M & E ADMINLinda Zwane
SKILLS PLAN SPEC
Xoliswa Radebe
RESEARCH ADMIN
Mduduzi Gama
RESEARCH SPEC
Drina Davies
SP ADMINCaroline Meintjies
PROJ SPECAmery Brightmore
SP SPECGloria Ngqinambi
SP SPECZwelakhe Mbatha
SP SPECPearl Ngiba
ETQA CO-ORDLenny Paltu &
Andre Els
ADMINJudy Porter
ADMINLouise Anthony
ADMINDebrah Kadi
PROJ CO-ORDThuso Malatjie
ETQA SPECKehilwe Khwane
ETQA SPECLeigh Hayes
ETQA SPECCarol Nkosi
PROJ ADMINLuntu Phillips
PROJ SPECElizabeth Goncalves
PROJ SPEC Lloyd Mpe
PROJ SPECPriscilla Mnisi
ETQA ADMINAnusha Baijnath
ADMIN ASSISTSoraya Abrahams
ADMIN ASSISTCharmaine
Hansraj
GEN OFFICE WORKER
Zanele Mgaba
GEN OFFICEWORKER
Mayvis Madlala
COOPK Naicker
CE: STRATEGY & CORPORATE AFFAIRS
Simangaliso Mkhwanazi
SECRETARYHelvy Mnisi
SECRETARYLindy Mkhize
SP CO-ORDSibahle Ndlovu
FIN = Finance HR = Human ResourcesIA = Internal Audit IT = Information TechnologyM & E = Monitoring and Evaluation SPEC = SpecialistM & C = Marketing and Communications PROJ = ProjectsREG MAN = Regional Manager SP = Skills PlanningSCM = Supply Chain Management ACC = AccountantADMIN = Administrator CO-ORD = CoordinatorMAN = Manager ASSIST = Assistant

FP&M SETA Annual Report | 2011/1287
Africa
n Fe
male
General Worker Administrator Specialist
Colour
ed F
emale
Fixed Term Contract Staff
Whit
e Fem
ale
Africa
n M
ale
India
n Fe
male
5
4
3
2
1
0
5
3 3
2
1
fiXed teRM contRAct StAffas at 31 March 2012
NAME POSITION
Zalda Carelse Financial Accountant: Consultant
Amelia Ferreira Financial Accountant: Consultant
Ashika Benjamin Projects Assistant: Special Projects
Tarryn Fynn Projects Assistant: Western Cape Regional Office
Boitumelo Gezane Projects Assistant: Bursaries
Nelly Kooko Projects Assistant: Gauteng Regional Office
Bongani Kunene Projects Assistant: Learnerships & Apprenticeships
Tintswalo Makhuvele Projects Assistant: Payments
Sisinyana Matshego Projects Assistant: Special Projects
Halima Rahim Projects Assistant: KZN Regional Office
Pulane Molelekoa General Office Worker: Head Office
Bongumusa Ngcobo General Office Worker: Head Office
Bongiwe Skempers General Office Worker: Western Cape Regional Office
Mandla Nkosi Driver

FP&M SETA Annual Report | 2011/12 88

FP&M SETA Annual Report | 2011/1289

FP&M SETA Annual Report | 2011/12

Head Office & Gauteng Regional Office
Tuscany Office Park, Building 2, Coombe Place, Rivonia, 2128
PO Box 199, Rivonia, 2128
Tel: 011 234 2311 | Fax: 011 234 2350E-mail: [email protected]
KwaZulu Natal Regional Office
3rd Floor, Umdoni Centre, 28 Crompton Street, Pinetown, 3601
PO Box 935, Pinetown, 3600
Tel: 031 702 4482 | Fax: 031 702 4113
Western Cape Regional Office
301 Premier Centre, 451 Main Road, Observatory, 7925
PO Box 351, Woodstock, 7915
Tel: 021 447 3373 | Fax: 021 447 3365
www.fpmseta.org.za
REPUBLIC OF SOUTH AFRICA
Servicing the Clothing, Footwear, Forestry, Furniture, General Goods, Leather, Packaging, Print Media, Printing, Publishing, Pulp and Paper, Textiles and Wood Products sectors
Report Number : RP179/2012ISBN Number : 978-0-621-41015-0