fluxnet: database of fluxes, site characteristics, and
TRANSCRIPT

(ORNUTM-20031204
MANAGED BY UT-BATTELLE FOR THE DEPARTMENT OF ENERGY
FLUXNET: Database of Fluxes, Site Characteristics, and Flux-Community Information
February 2004
Prepared by R. J. Olson S. K. Holladay R. B. Cook Environmental Sciences Division Oak Ridge National Laboratory
E. Falge Universitat Bayreuth 95440 Bayreuth, Germany
D. Baldscchi University of California Berkeley, CA 94704
L. Gu Environmental Sciences Division Oak Ridge National Laboratory
UT-BATTELLE ORNL-27 (2-03)


ORNL/TM-2003/204
Environmental Sciences Division
FLUXNET: Database of Fluxes, Site Characteristics,
and Flux-Community Information R. J. Olson
S. K. Holladay R. B. Cook
Environmental Sciences Division Oak Ridge National Laboratory
E. Falge Universitat Bayreuth
95440 Bayreuth, Germany
D. Baldocchi University of California
Berkeley, CA 94704
L. Gu Environmental Sciences Division Oak Ridge National Laboratory
Date Published: February 2004
Prepared for U.S. Department of Energy
This work was funded by the Terrestrial Ecosystem Program and Earth Observing System Date and Information System (ESDIS) of the
U.S. National Aeronautics and Space Administration (NASA Reference Number 46WR41201 under
Interagency Agreement number 201 3-MI64-Al with the U.S. Department of Energy)
Prepared by OAK RZDGE NATIONAL LABORATORY
P.O. Box 2008 Oak Ridge, Tennessee 3783 1
managed by
for the U.S. DEPARTMENT OF ENERGY
under contract DE-AC05-000R22725
UT-BATTELLE, LLC


CONTENTS
Page
LIST OF FIGURES ........................................................................................... v
LIST OF TABLES ............................................................................................. vii
LIST OF ABBREVIATIONS AND ACRONYMS ........................................... ix
ABSTRACT ....................................................................................................... xi
1 . FLUXNET BACKGROUND ............................................................................ 1 9 9
1.3 Flux Measurement Methods ...................................................................... 10 1.4 Progress to Date ......................................................................................... 12
1.1 Origin and Scope of FLUXNET ................................................................ 1.2 FLUXNET-DIS Mission and Objectives ...................................................
2 . FLUXNET DATA AND INFORMATION SYSTEM DESIGN ...................... 15 2.1 Data and Information Strategy ................................................................... 15 2.2 Flux Community Data and Information .................................................... 16 2.3 FLUXNET Database Considerations ........................................................ 18 2.4 FLUXNET Data and Information System ................................................. 22
3 . FLUX TOWER SITE CHARACTERIZATION ............................................... 29
4 . FLUX QA AND DATA PROCESSING ........................................................... 29
5 . GAP.FILLLNG. NIGHTTIME FLUX CORRECTION. AND AGGREGATION ................................................................................... 33
6 . REMOTE SENSING ........................................................................................ 35
7 . ACKNOWLEDGMENTS ................................................................................. 37
8 . REFERENCES .................................................................................................. 39
APPENDIX A FLUXNET-DIS Web Site Descriptions ............................ A-1
APPENDIX B FLUXNET-DIS Parameter Definitions ............................. B-1
APPENDIX C FLUXNET-DIS Relational Database Management System Description ........................................................... C-1
APPENDIX D FLUXNET-DIS File Formats ............................................ D- 1
... 111


LIST OF FIGURES
Figure Page
1 Distribution of towers by regional network affiliation that are registered in FLUXNET-DIS (total of 216 towers as of July 2003) ........... 3
2 Growth of the number of flux towers registered in FLUXNET-DIS by year for each of the regional networks ........................................................ 4
3 Distribution of flux towers by land cover derived from the MODIS land cover product (MOD12Q1; Collection 3) for 2002 at 1 -km resolution .................................................................................................... 5
4 Distribution of flux towers within global climate based on precipitation and temperature for 0.5" grid cells ........................................ 6
V


LIST OF TABLES
Table Page
1 Regional networks of flux towers associated with FLUXNET (July 2003) ................................................................................................... 2
2 FLUXNET database statistics as of July 2003 ............................................ 13
3 Number of operating flux tower sites within regional networks by year .... 13
4 Description of the FLUXNET FTP server subdirectories ........................... 18
5 Core variables for the FLUXNET database ................................................ 19
6 Site characteristics information. usually representing long-term status ...... 20
7 Description of the FLUXNET relational database tables ............................ 24
8 FLUXNET variables. units of measure. and typical minimum and maximum values ................................................................................... 32
9 MODIS products currently available in ASCII format and subsetted for selected sites .......................................................................................... 35
vii


LIST OF ABBREVIATIONS AND ACRONYMS
AET ANPP ASCII AVHRR DAAC DIS EOS ETM FLUXNET FTP GIS LA1 MODIS NASA NDVI NEE NEP NOAA NPP ORNL PAR PI PPFD QA QC RDMS SD TEM Terra TM URL UTC
actual evapotranspiration aboveground net primary productivity American Standard Code for Information Interchange advanced very-high-resolution radiometer Distributed Active Archive Center Data and Information System Earth Observing System enhanced thematic mapper Flux Network file transfer protocol geographic information system leaf area index moderate resolution imaging spectroradiometer National Aeronautics and Space Administration (USA) Normalized Difference Vegetation Index net ecosystem exchange net ecosystem productivity National Oceanic and Atmospheric Administration (USA) net primary productivity Oak Ridge National Laboratory (USA) photosynthetically active radiation Principal Investigator photosynthetic active radiation quality assessment quality control Relational Database Management System standard deviation Terrestrial Ecosystem Model Earth Observation Satellite - Land thematic mapper Uniform Resource Locator Coordinated Universal Time
ix


ABSTRACT
R. J Olson, S. K. Holladay, R B. Cook, E. Falge, D. Baldocchi, andL. Gu. 2003. FLUXNET: Database ofjlmes, site characteristics, and flux-community information. ORNWTM-2003/204. Oak Ridge National Laboratory, Oak Ridge, Tennessee.
FLUXNET is a “network of regional networks” created by international scientists to coordinate regional and global analysis of observations from micrometeorological tower sites. The flux tower sites use eddy covariance methods to measure the exchanges of carbon dioxide (C02), water vapor, and energy between terrestrial ecosystems and the atmosphere. FLUXNET’S goals are to aid in understanding the mechanisms controlling the exchanges of C02, water vapor, and energy across a range of time (0.5 hours to annual periods) and space scales.
FLUXNET provides an infrastructure for the synthesis and analysis of world-wide, long-term flux data compiled from various regional flux networks. Information compiled by the FLUXNET project is being used to validate remote sensing products associated with the National Aeronautics and Space Administration (NASA) Terra and Aqua satellites. FLUXNET provides access to ground information for validating estimates of net primary productivity, and energy absorption that are being generated by the Moderate Resolution Imaging Spectroradiometer (MODIS) sensors. In addition, this information is also used to develop and validate ecosystem models.
The FLUXNET project is fbnded by NASA. The FLUXNET Data and Information System (DIS) component compiles, documents, archives, and distributes flux, meteorological, plant, and soil data to the scientific community. The flux data, site ancillary observations, and flux community information are available from the FLUXNET-DIS website, httr>://www.daac.ornl.gov/FLUXNET.
The FLUXNET-DIS database consists of interrelated tables of information, some that contain measurements and others that contain links to independent data sets, imagery, or external Web sites. For example, each new site is registered in a site table that includes site name, location, flux tower description, site investigator, climate, biome type, and vegetation type. Both original (as provided by investigators) and harmonized half-hour data and gap-filled products (e.g., estimates of annual net ecosystem exchange for sites) are available through the FLUXNET-DIS FTP server area. The FLUXNET-DIS provides the following types of additional information to support the flux community: general information on the FLUXNET project, contact list with email server, lists of new publications and searchable bibliography of flux related citations, announcements of meetings and resulting meeting reports, job announcements, and community news and opportunities for collaborative research.
FLUXNET builds upon the scientific initiatives of regional networks of flux sites in South, Central, and North America (AmeriFlux, Fluxnet-Canada), Europe (CARBOEUROFLUX, which incorporated EUROFLUX and MedFlu), Asia (AsiaFlux and Koflux), and Australia and New Zealand (OzFlux), as well as independent sites. At present, over 200 sites worldwide are operating on a long-term and continuous basis. Sites exist on five continents and their latitudinal distribution ranges from 70 degrees north to 30 degrees south. Vegetation under study includes temperate conifer, and broadleaved (deciduous and evergreen) forests, tropical and boreal forests, crops, grasslands, chaparral, wetlands, and tundra.
xi


1. FLUXNET BACKGROUND
FLUXNET is a “network of regional networks” created by international scientists to coordinate regional and global analysis of observations from micrometeorological tower sites (Table 1). The flux tower sites use eddy covariance methods to measure the exchanges of carbon dioxide (COz), water vapor, and energy between terrestrial ecosystems and the atmosphere. FLUXNET’S goals are to understand the mechanisms controlling the exchanges of COZY water vapor, and energy across a spectrum of time and space scales. The primary objective of FLUXNET is to promote the synthesis and analysis of long-term carbon, water, and energy flux data that are being acquired world-wide by various regional flux networks. The FLUXNET supports the secondary use of flux data, that is, use by investigators who may not have been associated with the initial collection and analysis of the data. FLUXNET provides both documentation and source information so that secondary users can understand the data and also give credit to the original collectors of the data.
The FLUXNET project consists of two closely related projects funded within the National Aeronautic and Space Administration (NASA) Earth Observing System (EOS) Validation Program and Terrestrial Ecosystem Program (TEP): (1) FLUXNET: Unifying A Global Array of Tower Flux Networks For Validating EOS Terrestrial Carbon, Water and Energy Budgets (Principal Investigator: Dennis Baldocchi, University of California Berkeley, California) and (2) FLUXNET-DIS: A Global Flux Data and Information System to Support EOS Product Validation [Principal Investigator: Robert Cook (formerly Richard Olson, 1997-2003), Oak Ridge National Laboratory (ORNL), Tennessee].
Information compiled by the FLUXNET project is being used by the EOS validation community to validate remote sensing products associated with the NASA Terra and Aqua satellites. FLUXNET provides access via the Mercury System (http://mercurv.ornl.aov/ornldaac/) to ground information for validating satellite-derived estimates of net primary productivity and energy absorption that are being generated by the Moderate Resolution Imaging Spectroradiometer (MODIS) sensors. In addition, this information is used to develop and validate ecosystem models.
FLUXNET-DIS has several functions. First, it provides infrastructure for compiling and distributing carbon, water, and energy flux measurement, meteorological, plant, and soil data. Data and information are available Erom the FL-T-DIS website, http://www.daac.ornl.rrov/FLUXNET. Second, the project supports calibration and flux inter- comparison activities by providing consistent and complete data products so data from the regional networks are inter-comparable. And FLUXNET-DIS supports the synthesis, discussion, and communication of ideas by providing specific flux data products for project scientists, workshop participants, and visiting scientists. To understand flux measurements at a site or among sites at broader scale studies, FLUXNET provides information on instruments, site characteristics, off-tower measurements of vegetation and soil dynamics, and remote sensing imagery. FLUXNET also provides information about site investigators, publications, meetings, and other flux community activities.
1

Table I. Regional networks of flux towers associated with FLUXNET (July 2003) ll_l I___ -.
Year No. of Network Geographic extent established towers Notes
AmexiFlux
CARBOEUROFLUX
North and South America 1996
Europe 1996
OzNet
Large-Scale Biospherc- Atmosphere Experiment (LBA)
AsiaFlux
KoFlux
Safari2000
TropiFlux
CARBOMONT
Fluxnet-Canada
‘TCOS-Siberia
Other
Inactive
All towers
Australia and New 2002 Zealand
South America 2002
Japan, Korea, China, 1998 Malaysia, Thailand, Indonesia, Siberia
South Korea 2002
Southern Afkica 2002
Panama
2002
Canada 2002
Siberia 200 1
41
39
6
14
14
4
6
2
3
21
8
9
19
216
Includes data EUROFLUX and MedeFld
Some sites are also members of AmeriFlux, CARAOEUROFEUX
Initially called JapanNet
Savannah Systems
Some sites are also members of AmeriFlux
Not currently active, but had previously provided flux data
This document describes the FLUXNET Data and Information System (DIS) component. It defines the parameters stored in the FLUXNET database; describes the processing, quality assurance checks, and documentation performed by FLUXNET; and defines the products available from the FLUXNET Web site. The document provides new investigators and networks guidelines for data formats, processing, management, and distribution. These guidelines are intended to encourage investigators to submit data in more complete and consistent formats. Chapter 2 describes the DIS components, including the various file formats and parameter definitions. Chapter 3 describes the process to register new flux tower sites, including requirements for standard site information to characterize the location and environment of a tower. Chapter 4 outlines the data QA checks that are done by FLUXNET, and the gap-filling procedure and temporal aggregation process are described in Chapter 5 . The expanding collection of remote sensing products for flux tower sites is described in Chapter 6.
Data compiled by FLUXNET are being used to quantify and compare magnitudes and dynamics of annual ecosystem carbon, water, and energy balances, to quantify the response of stand-scale carbon dioxide and water vapor flux intensities to controlling biotic and abiotic factors, and to validate a hierarchy of soil-plant-atmosphere trace gas exchange models (Baldocchi et al. 2002). Findings so far include (1) net C02 exchange of temperate broadleaved forests increases by about 5.7 g C m-2 per day for each additional day that the growing season i s extended; (2) the sensitivity
2

5.7 g C rn-’ per day for each additional day that the growing season is extended, (2) the sensitivity of net ecosystem GO2 exchange to sunlight intensity doubles if the sky is cloudy rather than elm, (3) spectral analysis of COa flux intensities show that highest intensities WUT at time scales of days, weeks, and year, and a spectral gap occurs at the month t h e scale; (4) the optimal temperature of net COa exchange varies with man summer temperature; and ( 5 ) stand age affects carbon dioxide and water vapor fluxes (Baldwehi et d. 2001).
At present, over 200 sites worldwide are operating on a long-term mi continuous bmis (“able 1; Fig. 1). FLUXNET builds upon the scientific initiatives of regional networks of flux sites in
hria (AmmiFlux), Europe (CARBOEUROFLUX, which incorprarated and MedFlu), Asia (AsiaFlwr and Koflux), Australia a d New Zeal& (OzFlux),
and Canada (Fluxnet-Canada), as well as independent sites (Fig. 1). Sites exist on five continents and thei btitlcdinal distribution ranges from 70 degress north to 30 degrees south. Mew fluxtower sites are being added at the rate of 1&30 sites a year pig. 2). Vegetation under study includes ternperate coni€er and broadleaved (deciduous and evergreen) forests, tropical and boreal fomts, crops, grasslands, chaparral, wetlands, and tundra (Fig. 3). Tb flux towers also cover a broad rslnge of the globa) climate. Figure 4 shows the global amy of temperature-precipitation combinations for 9.5 @ grid cells (Cnuner et al. 2001) with the flaw towers sup>erimposed in black dots. Researchiess also c u l k t dtita on site vegetation, soil, hydrologic, and mteoralogical characteristics. Criteria for being inchded in the FLUXNET network are use of the eddy covariance method, continuous flux scientists,
ts, and a willingness to share data with other
,,. ’- -7
Network A AmeriFlur A Asiianux A CarboCuroflux A FLUXNET A Flm&Camda A KoFlU A LBA A OzNet A Safari2000 A TCOS-Sibsria A TmpiFlux
P ;-
- 1 - -.r-m- 4 ‘igure 1. Distribution of towers by regional network affiliation that are registered in ’LUXNET-DIS (total of 216 towers as of July 2003).
3

Growth of FLUXNET, July 2003
250 = AmeriFlux = CarboEuroRux = Amazon/LBA
= KoFlux = OzNet = CARBOMONT I? al 3 150 - =Other 0 = Fluxnet-Canada 0 D Safari2000 4) = TCOS-Siberia -P E 100 - = TropiFlux J D Inactive z
200 - = AsiaFlux
U IC
L
"1 I 1990 1992 1994 1996 1998 2000 2002 2004
Year
Figure 2. Growth of the number of flux towers registered in FLUXNET=DIS by year for each of the regional networks.
4

Distribution by Land Cover Types Series 1 (black) - flux towers (216), Series 2 (red) - land area
10 20 30 40
Landcover codes: C-Shrubland - closed shrubland, DBL - deciduous broadleaf, DNL - deciduous needdeaf, EBL -evergreen broadleaf, EN1 - evergreen needleleaf, 0-shrubland - open shrublands
Figure 3. Distribution of flux towers by land cover (black) derived from the MODIS land cover product (MOD12Q1; C C-Shrubland - closed shrubland, DBL - deciduous broad E3L - evergreen broadleaf, ENL - evergreen needle led, comparison, the land cover classes for global 1 same scale BS the numbers of flux towers. The is calculated and then multiplied by the total number of towers (216).
3) fQr 2W2 at 1-km re.soluthn. Lmdcover codes:
tage of land cover classes for dl land pixels
5

Global Climate Data - Cramer et al. P r e c i p
m m 4 0 0 0 l *:-...e
3500-
3000-
2 5 0 0 -
2 0 0 0 -
1500 .
1000-
500-
F. 1
Figure 4. Distribution of flux towers within global climate based on precipitation and temperature for 0.5" grid cells. This figure shows the global array of temperature-precipitation combinations for 0.5" land grid cells based on CrameI et d. (2001) with the blue representing grid cells at high latitudes (greater than 50" or less than -5.003, green representing mid-latitudes (15" to 50" or -50" to -15"), and red representing tropical latitudes (-15" to +W). Flux towers are superimposed (black dots) based on their long-term climate.
6

1.1 Origin and Scope of FLUXNET
Study of the Earth’s biogeochemistry and hydrology involves quantifying the flows of matter in and out of the atmosphere with an array of methods (Canadell et al. 2000). Contemporary investigators apply the eddy covariance technique to acquire nearly continuous measurements of carbon exchange between the atmosphere and biosphere. The eddy covariance method, a micrometeorological technique, provides a measure of net carbon and water fluxes between vegetated canopies and the atmosphere (Baldocchi et al. 1988; Aubinet et aI. 2000). With the eddy covariance method, ecosystem responses to environmental forcings are measured at the stand scale, and their temporal variability is quantified. Data may be aggregated to monthly and annual time periods. This method is able to estimate fluxes quasi-continuously with minimal disturbance to the underlying vegetation. In effect, measurements at the flux tower represent ecosystem processes over a relatively large area of land (> 1 km’) depending on the height of the tower and meteorological conditions.
The concept of a global network of long-term flux measurement sites had a genesis as early as 1993, as noted in the Science Plan of the IGBPBAHC (International Geosphere-Biosphere Programh3iospheric Aspects of the Hydrological Cycle). Formal discussion of the concept among the international science community occurred at the 1995 La Thuile workshop (Baldocchi et al. 1996). Regional collections of eddy covariance flux towers were formalized into the EUROFLUX and AmeriFlux networks in 1996. Although some towers had been in operation for many years, the La Thuile meeting was the start of flux community efforts to understand the controls on carbon fluxes across sites.
The FLUXNET project was established in 1997 to compile the long-term measurements from the regional networks into consistent, quality assured, documented data sets for a variety of worldwide ecosystems (Baldocchi et al. 1996; Running et al. 1999). FLUXNET is a “partnership of partnerships” that was formed initially by linking AmeriFlux, EUROFLUX, and independent sites. New sites and regional networks are continually being added to FLUXNET (Fig. 2). Criteria for being included in the FLUXNET network are use of the eddy covariance method, continuous flux measurements, and a willingness to share data with other scientists.
FLUXNET is an umbrella organization that facilitates the interaction, coordination, cooperation and organization of regional flux measurement networks to form a global network for measuring and assessing carbon, water, and energy exchange between ecosystems and the atmosphere (Valentini et al. 1999). Its mission is
0
0
to identify and quantify temporal and spatial patterns of carbon, water, and energy fluxes on the global scale, that may not be detectable by individual sites or regional networks; to produce value-added products on stand-scale COZ, water, and energy fluxes by synthesizing data at the biome, cross-biome, continental, and global scales; to sponsor a central database for the archiving, documenting, and disseminating of flux data and supporting metadata on climate, site, vegetation, and soil characteristics for the global ecological and biogeochemical research community; and to support validation of remote sensing land products and models. 0
7

The FLUXNET project serves as a mechanism for uniting the activities of several regional and continental networks (Table 1) into an integrated global network. Research sites are operating across the globe in North, Central and South America, Europe, Scandinavia, Siberia, Asia, and Africa.
FLUXNET is a collection of networks of flux towers. The placement of individual field sites has often been decided by the investigator, due to funding and investigator opportunities, rather than following a network-wide geostatistical design. Generally, individuals join FLUXNET because they want to share experiences, methodologies, and data. With the current network configuration, we are not capable of estimating representative fluxes from every unique environment on Earth. On the other hand, this coordinated network of sites is able to deduce certain information on spatial patterns of fluxes from research sites across a range of climates and biomes. Eddy flux' measurements in combination with ecosystem and biophysical models and satellite products can be used to construct spatially integrated fluxes of carbon and water vapor.
The global nature of FLUXNET extends the diversity of climates, biomes, and methods that are associated with the regional networks. For example, sites in the original EUROFLUX network consisted of conifer and deciduous forests and Mediterranean shrubland. The European networks used a standard methodology, based on closed-path infrared spectrometers. By contrast, the American network, AmeriFlux, had more diversity in terms of the number of biomes and climates studied and methods used. The American regional network includes sites in temperate conifer and deciduous forests, tundra, cropland, grassland, chaparral, boreal forests, and tropical forests. Sites use open or closed-path infrared spectrometers to measure COz and water vapor fluctuations. Another unique dimension of AmeriFlux is its inclusion of a tall (400-m) tower for study of COz flux and concentration profiles and boundary layer dynamics. By combining the results from both networks, the broader diversity of sites and methods provides data to confirm and extend the results based on the separate networks.
FLUXNET does not fund tower sites directly, but depends upon institutional support associated with the funding of the AmeriFlux, CARBOEUROFLUX, AsiaFlux, OzFlux, and other networks. Funding for the numerous scientists, students, and technicians responsible for the day-to-day gathering of the flux data at individual field sites is provided by a variety of government agencies and organizations (see box).
8
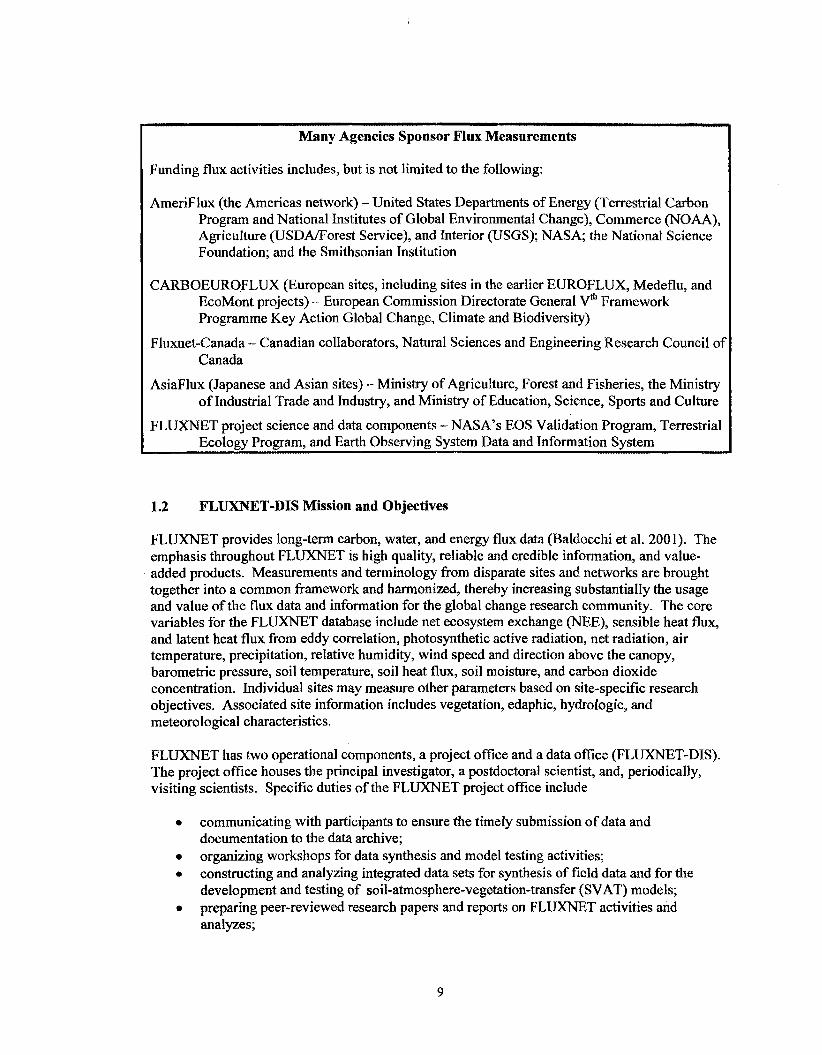
Many Agencies Sponsor Flux Measurements
AmeriFlux (the Americas network) - United States Departments of Energy (Terrestrial Carbon Program and National Institutes of Global Environmental Change), Commerce (NOAA), Agriculture (USDA/Forest Service), and Interior (USGS); NASA; the National Science Foundation; and the Smithsonian Institution
,
Funding flux activities includes, but is not limited to the following:
CARBOEUROFLUX (European sites, including sites in the earlier EUROFLUX, Medeflu, and EcoMont projects) - European Commission Directorate General V' Framework Programme Key Action Global Change, Climate and Biodiversity)
1 Fluxnet-Canada - Canadian collaborators, Natural Sciences and Engineering Research Council of Canada
AsiaFlux (Japanese and Asian sites) - Ministry of Agriculture, Forest and Fisheries, the Ministry of Industrial Trade and Industry, and Ministry of Education, Science, Sports and Culture
FLUXNET project science and data components - NASA's EOS Validation Program, Terrestrial Ecoloav Promam. and Earth Observing System Data and Information System
,
1.2 FLUXNET-DIS Mission and Objectives
FLUXNET provides long-term carbon, water, and energy flux data (Baldocchi et al. 200 I). The emphasis throughout FLUXNET is high quality, reliable and credible information, and value- added products. Measurements and terminology from disparate sites and networks are brought together into a common framework and harmonized, thereby increasing substantially the usage and value of the flux data and information for the global change research community. The core variables for the FLUXNET database include net ecosystem exchange (NEE), sensible heat flux, and latent heat flux from eddy correlation, photosynthetic active radiation, net radiation, air temperature, precipitation, relative humidity, wind speed and direction above the canopy, barometric pressure, soil temperature, soil heat flux, soil moisture, and carbon dioxide concentration. Individual sites may measure other parameters based on site-specific research objectives. Associated site information includes vegetation, edaphic, hydrologic, and meteorological characteristics.
FLUXNET has two operational components, a project office and a data ofice (FLUXNET-DIS). The project office houses the principal investigator, a postdoctoral scientist, and, periodically, visiting scientists. Specific duties of the FLUXNET project office include
0
0
0
0
communicating with participants to ensure the timely submission of data and documentation to the data archive; organizing workshops for data synthesis and model testing activities; constructing and analyzing integrated data sets for synthesis of field data and for the development and testing of soil-atmosphere-vegetation-transfer (SVAT) models; preparing peer-reviewed research papers and reports on FLUXNET activities and analyzes;
9

0
m
funding the planning, implementation, and analysis of site inter-comparison studies; providing scientific guidance to the FLUXNET-DIS; supporting travel expenses for scientists traveling to regional workshops or for extended stays at the FLUXNET project office to conduct data analysis projects; and creating databases, with FLUXNET-DIS, on site metadata @EM, IKONOS images, soil carbon content, climate data, leaf physiological parameters, etc.) in order to form a FLUXNET GIs.
The FLUXNET-DIS ofice is responsible for
e compiling and documenting eddy covariance data, including: data files as submitted,
e
0
developing data guidelines of the FLUXNET-DIS; examining data sets with standard quality control and assurance procedures; providing data and support for activities sponsored by the FLUXNET project office as listed above; maintaining the FLUXNET Web page for communications and data exchange (http ://www, daac .ornl. gov/FLUXNET/); and transferring flux data and metadata to a long-term archive, currently designated as the Oak Ridge National Laboratory (ORNL) Distributed Active Archive Center (DAAC).
harmonized data to achieve consistency and completeness for variable names, units of measure, missing value codes, and formats (see Chapter 4), value-added products as submitted, and flux and site ancillary data in consistent formats;
0
e
0
0
Back up of data and long-term accessibility of the data, provided by FLUXIWT-DIS, ensures the protection and extended use of the data by project scientists, as well as the flux and other global change communities, well into the future,
1.3 Flux Measurement Methods
The eddy covariance method is used to assess trace gas fluxes between the biosphere and atmosphere at each site within the FLUXNET community. Vertical flux intensities of COZ (Fc)) latent (LE), and sensible heat (€I) between vegetation and the atmosphere are proportional to the mean covariance between vertical velocity and the respective scalar fluctuations (e.g., C02, water vapor, and temperature). Turbulent fluctuations are computed as the difference between instantaneous and mean scalar quantities.
Typical instrumentation at flux tower sites includes a three-dimensional sonic anemometer, to measure wind velocities and virtual temperature, and a fast responding sensor to measure COz and water vapor. Scalar concentration fluctuations are measured with open or closed-path infrared gas analyzers. Sampling frequencies between 10 and 20 Hz ensure complete sampling of the high frequency components of the flux signal. Standardized data processing routines are used by the individual site investigators to compute flux covariances to produce flux estimates for either 30- or 60-minute averaging period. FLUXNET-DIS stores and distributes the 30- or 60-minute summary data,
10

Application of the eddy covariance method requires site scientists to address issues relating to the tower site, instrument placement, sampling duration and frequency, calibration, and post- processing. Ideally the field site should be flat, with an extensive fetch of uniform vegetation. In practice many of the flux tower sites are on undulating or gently sloping terrain, as this is where native vegetation exists. Sites on extreme terrain can have complex air flow and may not be readily analyzed by the eddy covariance method. The degree of uniformity of the underlying vegetation varies across the network, too. Some sites consist of monospecific vegetation (e.g., agricultural or forest plantations), others contain a mixture of species, and a third grouping possesses different plant functional types in different wind quadrants. All sites have sufficient fetch to generate an internal boundary layer where concentrations are constant with height.
Agricultural scientists mount their sensors on small poles, while forest scientists use either walk- up scaffolding or existing radio or TV towers. The height of the sensors depends on the height of the vegetation, the extent of fetch, the range of wind velocity and the frequency response of the instruments. To minimize tower interference on scaffold towers, investigators place their instruments on booms that point several meters up-wind or at the top of the tower. Spatial separation between anemometry and gas analyzers depends on whether one uses a closed- or open-path gas sensor. With the closed-path systems, the intake is often near or within the volume of the sonic anemometers. A delay between gas sample collection and analysis occurs as air flows through the tubing to the sensor. Corrections for this delay are made during post- processing. Some investigators place their gas transducer on the tower in a constant environment box to minimize the lag time from the sample port and the sensor. Others draw air down long tubes to instruments housed in a climate-controlled hut at the base of the tower. In either circumstance, flow rates are high (6 Wmin) to ensure that gas collected at time t will minimally mix with gas collected at time t +l. Open-path gas sensors are typically placed within a 0.5 m of a sonic anemometer, a distance that minimizes flow distortion and lag effects.
Calibration frequencies of gas instruments vary from team to team. With closed-path sensors, investigators are able to calibrate frequently and automatically, such as hourly or daily. Teams using open-path sensors calibrate with less frequency (e.g. every few weeks). However, a body of accumulating data indicates that calibration coefficients of both types of instruments remain steady over a few weeks (f 5%). Scientists using open-path sensors also compare their instrument responses to an independent measure of C02 concentration and humidity; however, they do not currently use a uniform standard for calibrating C 0 2 . But many use C02 gas standards that are traceable to the standards at the Climate Monitoring and Diagnostics Laboratory (httix//www.cmdl.noaa.nov/index.html) of the National Oceanic and Atmospheric Administration standards for the global flask network.
To ensure intercomparability, the AmeriFlux project circulates a set of reference sensors to members in the network (http://public.ornl.nov/ameriflux/Standards/roving- svstem/roving svstem.cfm) and the FLUXNET project sponsors the circulation of this set of instruments to sites in Europe, Asia, and Australia. C02 fluxes measured by the two systems agree within 5% of one another on an hour-by-hour basis. A similar level of agreement has been found by comparing open and closed-path C02 sensors. Side-by-side comparisons between open- and closed-path water vapor sensors, on the other hand, are not as good. The absorption and desorption of water vapor on tubing walls can cause estimates of water uptake to have an uncertainty of up to 20%.
11

FLUXNET-DIS provides quality-assured, qualified flux data to scientists and policymakers dealing with global change issues, and modelers interested in regional scaling or validation of soil-vegetation transfer models and biogeochemical cycling models (Running et al. 1999). These users have identified the need to have estimates of net ecosystem exchange (NEE) for monthly and annual time periods from a variety of ecosystems. Data from eddy covariance towers are usually reported by half-hour with the objective to collect data 24 hours a day and 365 days a year. However, the average data coverage during a year is only 65% due to system failures or data rejection (Falge et al. 2001 a,b). Therefore, gap-filling procedures have been developed for providing complete data sets (Falge et al. 200 1 a,b)? and development of more robust methods is under way, Community acceptance of standard gap-filling procedures will allow the creation of comparable data sets, thereby enabling intersite comparisons,
1.4 Progress to Date
There are over 200 towers registered in FLUXNET-DIS associated with 1 1 active regional networks (Tables 1 and 2). The number of networks and sites continues to expand (Fig. 2 and Table 3). Other collections of towers with common interests are forming thematic networks such as LBA flux towers and TropiFlux.
Site characteristics for the flux towers are organized in a relational database management system (RDBMS) that has component tables to organize information on investigators, projects, flux towers, and associated measurement sites, measurement methods, supporting literature, and data. The ancillary or ecological data are stored in the RDBMS so that each value can be documented as to its source and methods used. Flux tower measurements are available from the ORNL, DAAC FTP area (ftp://daac.oml.gov/data/fluxnet/) - either one-hour or half-hour products containing daily, weekly, monthly or annual values. In addition, selected MODIS products are available for many of the flux tower sites (http://public.ornl.gov/fluxnet/rnodis.cfm).
A bibliography of key papers has been compiled by the FLUXNET-DIS project in part to document the source of ancillary site information. Often information such as leaf area index (LAI), net primary productivity (NPP), soil properties, etc., is published in papers by ecologists at the site and extracted for the FLUXNET database.
12

Table 2. FLUXNET database statistics as of July 2003
FLUXNET statistics Count
Regional Networks: AmeriFlux, CARBOEUROFLUX, AsiaFlux, KoFlux, Fluxnet-
Towers registered 216
Active towers (that have submitted data or defined start year)
11 Canada, OzNet, CARBOMONT, TropiFlux, TCOS-Siberia, Safari2000, LBA
197
880
300
11
Sites with gap-filled, aggregated data available from FLUXNET 36
Site-years of gap-filled, aggregated data available fiom FLUXNET 150
Site ancillary data records (climate, vegetation, LAI, NPP, etc.) 3,300
Number of parameters reported 183
Years of observations for towers
Site-years of data submitted to FLUXNET or regional networks
Maximum years of record at a tower (Harvard)
Flux related bibliographic citations 5,000
Flux scientists on FLUXNET email server 555
Table 3. Number of operating flux tower sites within regional networks by year
Year
Network 87 89 94 95 96 97 98 99 00 01 02 03
AmeriFlux
ElJROFLUXiMede Flu/CARBOEURO FLUX
OzNet
AmazodBA
JapanNet I AsiaFlux
KoFlux
Safari2000
CARBOMONT
TropiFlux
Fluxnet-Canada
TCOS-Siberia
Other
Inactive
All towers
Cumulative site- years of data
1 3 8
1
1
4
1 3 14
1 2 10
10
2
1
1
7
21
24
14
17
1
2 2
11 47 45
20
20
2
3
2
1
13
61
86
32
26
4
1
4 5
2
18
92
138
37
29
13
11
2 1
6 5
3
18 125
196
52
34
1
14
11
6
2
7
5
4
18
154
3 13
62
36
6
14
14
1
6
3
2
11
6
4
19
184
458
66
39
6
14
14 4
6
3
2
13
8
9
19
203
61 1
71
39
6
14
14 4
6
3
2
21
8
9
19
216
800
Note: A total of 216 towers were registered as of July 2003. Towers may be included in more than one network; e.g., towers in Canada that have been part of AmeriFlux also became part of FLUXNET-Canada in 2002.
13

2. FLUXNET DATA AND INFORMATION SYSTEM DESIGN
Data are gathered at research sites on variables chosen to help answer specific questions posed by researchers operating the sites.
The FLUXNET-DIS can be viewed as information to
0 understand the site observations, 0
0
allow sets of sites to be analyzed together, and support the flux community (methodology descriptions, parameter definitions, gap-filling algorithms, meeting announcements, and meeting summaries).
The FLUXNET-DIS is designed to provide these diverse types of information in a way to understand processes at a site or patterns associated with groups of sites. The underlying information tool is a relational database management system (RDBMS). The RDBMS is especially appropriate to storing, retrieving, and manipulating diverse types of data. That is, an LA1 value for a site can be stored with detailed metadata documenting the source of the value, measurement method, date of measurement, and units of measure; however, the LA1 value can be extracted from the RDBMS and inserted into summary tables or cross-site queries to enable comparing multiple sites.
2.1 Data and Information Strategy
Before FLUXNET-DIS receives the data, scientists at the individual sites compile, quality assure, analyze, and document the half-hour or hourly flux and micrometeorology data based on the unique focus of each site. Typically an entire year's worth of data is processed as a unit so that the annual pattern can be reviewed. These data are submitted to regional networks [e.g., AmeriFlux, CARBOEUROFLUX, etc. (Fig. l)], some of which review the data and metadata, convert to common formats, and distribute to the user community through an FTP or Web server. Often members of the flu community will assemble collections of flux data to perform cross-site studies. Synthesis and modeling projects (often associated with FLUXNET) may process a set of flux data to produce a standardized gap-filled, aggregated flux product (e.g., Falge et al. 2001q&).
Flux data typically flow from individual sites to regional networks and synthesis projects to FLUXNET-DIS and eventually to a long-term data archive. FLUXNET-DIS compiles site characteristics (Chapter 3), conducts quality assurance checks (Chapter 4), distributes value- added products (Chapter 5), and provides access to the data. FLUXNET-DIS distributes flux data and ancillary information through the ORNL DAAC (httu://daac.ornl.g.ov/FLUXNET/) and the final data sets are currently being archived there.
Given this sequence of processing, the flux data sets are assigned levels by FLUXNET-DIS as they are processed as defined below:
1. collected and reviewed by site investigators, 2. submitted to a regional network or to FLUXNET, 3. harmonized into common formats and units of measure,
15

4. night-time adjustments and gap filling performed, 5. publication of annual sums by flux investigators, and 6. submitted to long term archive.
Value-added role. Value-added functions are carried out at several levels of the data processing scheme. For example, site investigators and networks, (e.g.? ArneriFlux) may develop data products associated with their research interests, such as estimates of annual net ecosystem productivity (Baldocchi et al. 200 1) or validity of MODIS products. FLUXNET-DIS distributes consistent data products across all the networks and sites, Participation in FLUXNET adds to the value and use of data and information obtained from individual networks by providing complementary information from the other networks on the principle that two bits of related data have more information value when they are considered together than when they are apart. Integration of networks within the FLUXNET framework also enables protocols and standards to be more widely applied thus greatly facilitating intercomparisons and synthesis studies. Linking networks together within FLUXNET, for example, widens the range of studies possible (e.g.? climate, soils, and plant functional types), fosters multidisciplinary research, extends spatial and temporal coverage, and, through inter-comparison exercises and model testing, greatly improves predictive power.
Data distribution policy. In general, data and information generated or supplied through FLUXNET are readily available to potential users with no restrictions and at no cost within two years after the date of collection. Checked and verified data are placed in the public domain and made readily accessible through direct access to the FLUXNET-DIS through the World Wide Web (http://www.daac.ornl.e;ov/FLUXNET/). FLUXNET also has a data policy that governs use of FLUXNET data, as shown in the box.
FLUXNET Data Policy
Kindly inform the appropriate the Principal Investigator of the flux tower how you are using site data and of any publication plans. If the Principal Investigator feels that they should be acknowledged or offered participation as authors, they will let you know and we assume that an agreement on such matters will be reached prior to publishing andor use of the data for publication. If your work directly competes with the Principal Investigator's analysis, he or she may ask that they have the opportunity to submit a manuscript before you submit the one that uses their data. In addition, when publishing a paper using flux data, please acknowledge the I agency that supported the flux tower research. (http://www.fluxnet.ornl.~ov/flwnet/fairuse.ciin) 1
2.2 Flux Community Data and Information
To support the flux community, the FLUXNET Web site (http://www.daac.ornl.gov/FLUXNET/) provides the following types of information:
e
o site characteristics, e flux and ancillary data, e 0
0
general information on the FLUXNET project,
contact list associated with an email server, new publications and searchable bibliography of flux related citations, announcements of meetings and meeting reports,
16

job announcements, and community news and opportunities for collaborative research.
The FLUXNET Web Site has a menu bar that provides further access to General information, information on Sites, Maps, Map Server, Data, the FLUXNET Mailing List, publications (Pubs), and Contacts. Tables 1 and 2 in Appendix A provide more specific information on the content of each Webpage and links to additional levels of information. A secondary menu bar provides access to the Web sites of regional networks which are part of FLUXNET such as AmeriFlux, CARBOEUROFLUX, AsiaFlux, KoFlux, OzFlux, and Fluxnet-Canada.
0 The General information page provides access to overviews of the FLUXNET Project, as well as presentations, reports, news, registration of new sites, and job, meeting, and workshop announcements. New publications, a publication search tool, parameter definitions, journals, and other links are also provided.
The Sites information page provides access to a pick list and table of FLUDET sites. When the chosen site is selected, a web page is displayed dynamically from the RDBMS which then summarizes all the ancillary data for that site, presents a picture of the site if available, lists the personnel associated with the site, tabulates any instrumentation that has been registered for the site, and summarizes the publications that have been identified as being applicable to the site.
0 The Maps page provides access to various maps of the FLUXNET tower sites, such as the Bailey ecoregions. Maps are provided in several formats (e.g., .jpg and .tiff) and resolutions appropriate for use in Web pages, PowerPoint applications, or publications.
0 The Map Server page allows users to select from inore than 200 sites in the FLUXNET global network and to retrieve information about site characteristics as well as retrieve flux data, if available. To access the map server, see http://wvw.daac.ornl.rrov/FLUXNET/fluxnet.html and click on “Map Server” in the bar at the top.
0 The Data page provides access to cross tabulations of the FLUXNET ancillary data, such as average air temperature and precipitation, stand characteristics, vegetation parameters, carbon and nitrogen content, terrain, flux and productivity data, and radiation parameters. Links to network data for the EUROFLIJX and AmeriFlux programs are provided. Other related data such as long-term climate data (Thornton and Running 1999), the Arctic Tundra Flux Study (Chapin et al. 2002), Net Carbon Flw Data (Buchmann and Schulze 1999), and can be found here. Data from the relational database can be queried by site or by parameter. Published NEE estimates are presented in tabular fashion. Links are also provided to gapfilled flux data products, the field-image-model intercomparisons pages, and the MODI§ ASCII (American Standard Code for Information Interchange) subset data. A web form and an excel spreadsheet are provided for users to submit data. A subheader provides links to the FLUXNET data use policy and data updates. The user can also access the “Best Practices for Preparing Data” (Cook et al. 2001).
0 The publications page (Pubs) provides access to an index of publications related to carbon flux science and publications which have been authored by network scientists. The main publication file is maintained in Endnote.
17

e The FEUXNET listserver on the Mailing List page is a mailing list of people in the FLUXNET community ([email protected]). The list currently serves over 500 participants around the world. The FLUXNET mailing list is for use by people interested in long-term measurements of carbon dioxide, water vapor, and energy exchange from a variety of worldwide ecosystems. The contact list includes site affiliation, address, email, and phone numbers for individuals associated with flux activities. Individuals can distribute information or ask for assistance using the FLUXNET email server that is based on the contact list. Information, such as upcoming meetings or position openings, distributed through the email sewer or other sources, is also added to the FLUXNET web page of announcements.
0 The Contacts page provides access information to the FLUXNET science leader, steering committee members, programmatic committee members, network contacts and data, and information system members.
The flux and meteorology measurements are available via anonymous (File Transfer Protocol FTP) from the DAAC FTP site, ftp://daac.ornl.rzov/fluxnet/. Data are typically formatted as ASCII space or tab delimited (.at), or comma delimited (.csv). The FLUXNET-DIS FTP area is divided into seven subdirectories (Table 4) according to the source of data and level of processing.
Table 4. Description of the FLUX.NET FTP sewer (Ap://daac.ornl.~ov/fluxnet/) subdirectories
FTP subdirectory Descriptioii
Arctic-flux
Climate
Gap-filledEUROFLUX
Gap-filled-fluxnet
Gap-filledmarconi
Harmonized data
Net carbon data
Preliminary data
Collection of flux data from roving towers in the Arctic region (Chapin et al.
Monthly climate data for U.S. sites from the DayMet data set
EUROFLUX Gap-Filled Flux and Meteorology Data
Gap-filled data submitted to the FLUXNET project
Marconi Gap-Filled Flux and Meteorology Data
Harmonized flux data files containing a subset of 30 parameters
Net C02 and H20 fluxes (Buchmann and Schulze 1999)
Flux data sets available as contributed to FLUXNET without additional harmonization or QA checks,
2002)
~
2.3 FLUXNET Database Considerations
Flux parameters. An underlying basis of FLUXNET is that data are compiled and presented with comprehensive parameter definitions developed in collaboration with the participating networks and scientists. Current definitions are presented in Table 5 for the core flux tower measurements and in Table 6 for the site characteristics parameters. The tables include parameters and definitions found in the AmeriFlux Science Plan, the EUROFLUX parameter files, the Large Scale Biosphere Atmosphere Experiment in Amazonia (LBA) list, and the International Geosphere-Biosphere Programme (IGBP) Global Analysis, Interpretation and
18
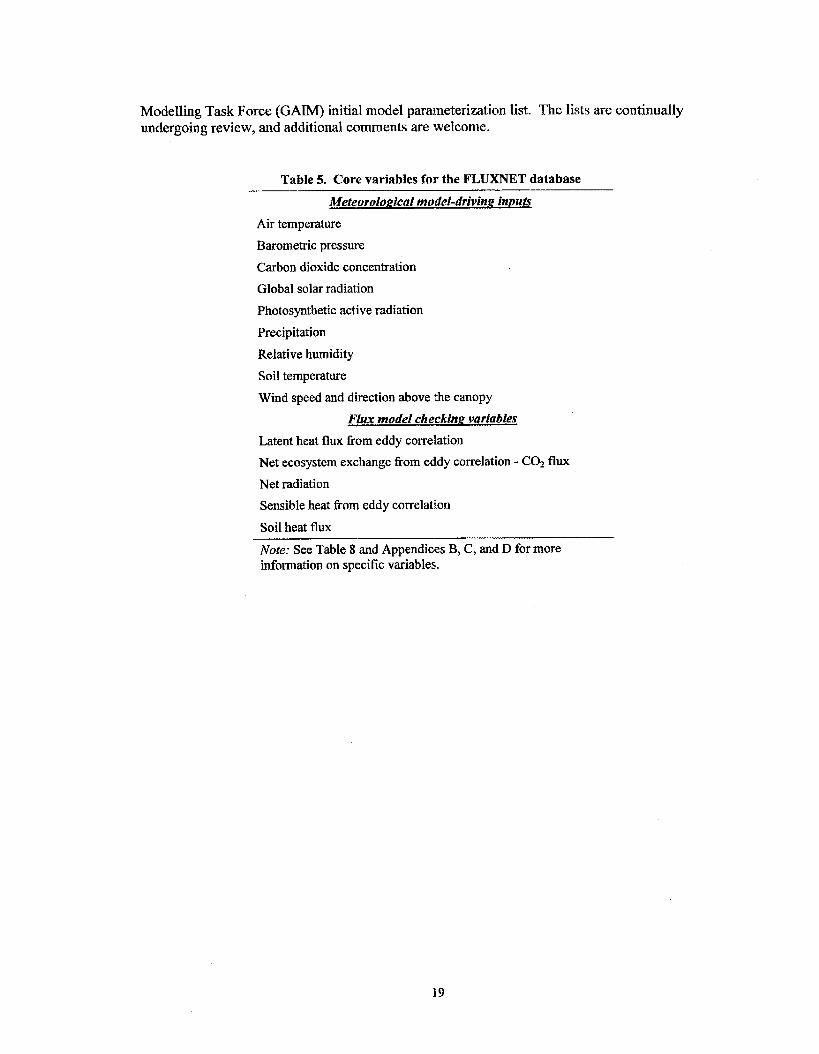
Modelling Task Force (GAM) initial model parameterization list. The lists are continually undergoing review, and additional comments are welcome.
Table 5. Core variables for the FLUXNET database
Meteorological model-drivinp inputs
Air temperature
Barometric pressure
Carbon dioxide concentration
Global solar radiation
Photosynthetic active radiation
Precipitation
Relative humidity
Soil temperature
Wind speed and direction above the canopy
F l u model checking variables
Latent heat flux fiom eddy correlation
Net ecosystem exchange fiom eddy correlation - CCh flux
Net radiation
Sensible heat from eddy correlation
Soil heat flux
Note: See Table 8 and Appendices €3, C, and D for more information on specific variables.
19

Table 6. Site characteristics information, usually representing long-term status (information
_I_-
Limitations Good for process studies, Good for daytime measurements, Challenged by complex terrain,
20

Table 6 (continued)
VEGETATION Dominant species Biome
IGBP class Vegetation type Stand age, years Stand age, year began Typical start of the growing season Typical end of the growing season Typical length of the growing season
CLIMATE Climate class
LONG-TERM NORMAL
Average air temperature, OC Average annual precipitation, mm SOIL Soil type STAND Stand area description Leaf area index ANPP CONTACTS Primary investigator Function Address Address Street City State Country Zip code E-mail Phone Fax
Afftliation Comments
Crops, Pasture, Plantation, Wetland, Deciduous broad-leaf forest / boreal, Deciduous broad-leaf forest / temperate, Deciduous broad-leaf forest / tropical, Desert, Deciduous needle-leaf forest / boreal, Evergreen broad-leaf forest / temperate, Evergreen broad-leaf forest / tropical, Evergreen needle-leaf forest / boreal, Evergreen needle-leaf forest /temperate, Grassland / C3, Grassland / C4 temperate, Grassland / C4 tropical, Mediterranean, Mixed forest, Savanna / temperate, Savanna / tropical, Tundra
Tropical wet, Topical wet/dry, TropicaVsubtropical semi-arid, TropicaVsubtropical arid, Temperate arid, Subtropical dry summer, Humid subtropical, Temperate, oceanic, Temperate, continental, warm summer, Temperate, continental, cool summer, SubArctic- Boreal, Polar-Tundra
g c m-' yr-'
21

Parameter tables. Appendix B includes definition tables with names, acronyms/short names, formats, and definitions for approximately 1 00 parameterdvariables. Literature references provide additional information about the parameters. The parameters are organized by logical groups within tables for the flux, meteorology, and soil efflux (Appendix B, Table B.l), site stand information (Appendix B, Table B.2), and calculated annual estimates (Appendix B, Table €3.3). Customized information for each flux tower site is included in the FLUXNET database to indicate which parameters are measured and which instruments are used at the site. The expected range for each parameter may be revised for specific sites and comments may be added as needed to further define how parameters are being measured at that site,
NEE flux sign convention. Eddy covariance observations in the FLUXNET database are represented using the atmospheric scientist’s sign convention with a negative flux indicating a net downward transport of COz. This is the opposite of the sign convention used by many ecologists, where photosynthesis is considered a positive flux. Using the atmospheric scientist’s convention, a site that is a C 0 2 sink in a specific year have a negative NEE and those that are a C 0 2 source have positive NEE.
Temporal scales. Aggregating flux data temporally is difficult because of inherent problems in acquiring continuous flux measurements. Typically, the site investigators calculate hourly or %- hourly flux values from the instantaneous raw flux data. Instrument problems and complying with quality control criteria may result in data gaps. Currently there are no standard methods for estimating missing data that would allow aggregating data into daily, monthly, and annual time periods. FLUXNET-DIS strives to reflect a consensus of the flux community on how to produce temporal data aggregations.
Spatial scales. Flux observations are made at towers that measure exchanges for a range of footprint areas. Thus flux data may represent areas ranging from square meters to square kilometers. The in situ site measurements of ecological parameters are made at finer resolutions still. No single scale is adequate for all FLTJXNET activities and it is likely that studies may require extrapolation across spatial scales. Integrated models that can be used at multiple scales are unlikely to be developed so that, for example, in global analyses it is more probable that layered models will be used to provide inputs into other models in a hierarchical approach.
2.4 FLUXNET Data and Information System
The FLUXNET-DIS encompasses several areas of data integration:
e
* * e
0
e
ancillary data collection and storage in a relational database, Web-based interface to the relational database, user input through Web interfaces, web site management and data presentation, flux and meteorological data files, and organization of data files in an FTP site.
22

FLUXNET relational database. The FLUXNET ancillary data and information system is based on a relational database management system (RDBMS) using Microsoft Access. The Webpages are dynamically produced from the RDBMS through use of Macromedia’s ColdFusion server- side web technology and the ColdFusion Markup Language.
The FLUXNET RDBMS consists of interrelated tables of information, some that contain measurements and others that contain World Wide Web links to independent data sets, imagery, or external Web sites. For example, each new site is registered in a site table that includes site name, location (latitude, longitude, elevation, and country), flux tower description (type of instrument, height of tower), site investigator, climate, biome type, and vegetation. World Wide Web addresses are included to provide direct links to an investigator’s Web site containing additional information for the tower site. Complete investigator information of institutional address, phone, and email is included in the investigator table. Additional site characteristics are added to the data table, including source of the observation and other metadata. The RDBMS is then used to provide a description of data for a site or to generate summary tables for groups of sites or to allow users to query the database. To maintain a workable size of the RDBMS, most of the large data files (including the 0.5-hr flux and meteorology data sets of 17,520 values per year per site and large images) are stored outside of the RDBMS in individual files in an FTP area.
The RDBMS (FLUXNET-DEV) contains five tables of data associated with the flux sites, two tables associated with the MODIS subsetting activity, seven lookup tables for standard values of climate and biome classes, etc., a parameter definitions table, and five tables used to control web site programming. Table 7 lists the tables, and Appendix C provides a more complete description. The data dictionary listing field names, field descriptions, valid values, constraints, and data types is included in Appendix C.
23
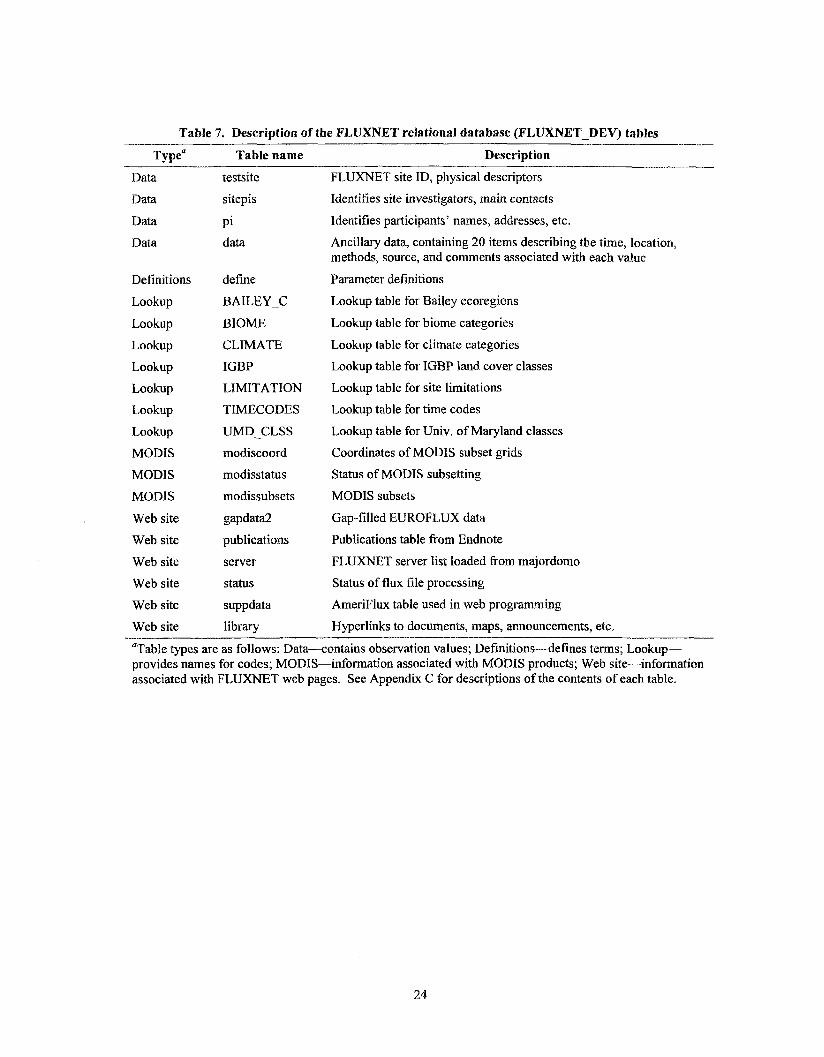
Table 7. Description of the FLUXNET relational database (FLUXNET-DEV) tables
Type“ Table name Description
Data
Data
Data
Data
Definitions
Lookup
Lookup
Lookup
Lookup
Lookup
Lookup
Lookup
MODIS
MODIS
MODIS
Web site
Web site
Web site
Web site
Web site
Web site
testsite
sitepis
Pi data
define
BAILEY-C
BIOME
CLIMATE
IGBP
LIMITATION
TIMECODES
UMD-CLSS
modiscoord
modisstatus
modissubsets
gapdata2
publications
server
status
suppdata
library
FLUXNET site ID, physical descriptors
Identifies site investigators, main contacts
Identifies participants’ names, addresses, etc.
Ancillary data, containing 20 items describing the time, location, methods, source, and comments associated with each value
Parameter definitions
Lookup table for Bailey ecoregions
Lookup table for biome categories
Lookup table for climate categories
Lookup table for IGBP land cover classes
Lookup table for site limitations
Lookup table for time codes
Lookup table for Univ. of Maryland classes
Coordinates of MODIS subset grids
Status of MODIS subsetting
MODIS subsets
Gap-filled EUROFEUX data
Publications table from Endnote
FLUXNET server list loaded from majordomo
Status of flux file processing
ArneriFlux table used in web programming
Hyperlinks to documents, maps, announcements, etc. -__ “Table types are as follows: Data-contains observation values; Definitions--defines terms; Lookup- provides names for codes; MODIS--information associated with MODIS products; Web site-information associated with FLUXNET web pages. See Appendix C for descriptions of the contents of each table.
24

FLUXNET user input. A second relational database accumulates user input and statistical information from the Web site. Fluxnet-input contains five tables which collect information from user input that is added to the main relational database after review by the FLIJXNET-DIS staff. These are as follows:
NE WSITEINFO Collects information input from htta,://~~~.fluxnet.ornl.aov/fluxnet/allrev3 .cfm and littp://www.fluxnet.ornl.~ov/fluxnet/allrev2.cfm?KEYID=?
TEMPDATA Collects information input fiom http://www . fluxnet .om1 .gov/fl uxnet/dataform2 .cfm
VISITOR Collects information input from http://www.fluxnet.ornl.rrov/fluxnet/westform.cfin
TEMPINSTR Collects information input from http://www . fluxnet.ornl. gov/fluxnet/instrumentform . c h
Collects user information such as P (Internet Protocol) address, web page URL (Uniform Resource Locator), datehime
Statistics
FLUXNET data and imagery files. In addition to the flux data and site measurements taken at or near the flux tower, the following data are provided from the ORNL DAAC FTP site as files for downloading:
MODIS imagery files - Many of the flux tower sites are included in a set of sites for which NASA extracts products generated fiom images from the MODIS sensor on the Terra satellite. FLUXNET provides access to these data for selected sites. Other imagery/photos/DEM, etc. - Often TM, IKONOS, or other images, photos, and digital elevation models (DEM) are available for sites. FLUXNET provides links to these data sets. Climate for sites - Many of the flux towers are located at sites with a long history of ecological or atmospheric research. When available, these data are compiled in a common format for either daily or monthly periods and provided. Climate for U.S. sites -the Daymet program (Thornton et al. 1997, Thornton and Running 1999) was used to estimate daily temperature and precipitation for the 18-yr period, 1980-1 997. Model development and validation - Many of the flux tower sites are ideal for model development and validation using flux measurements, meteorology observations, and site characteristics as model inputs.
Data archive. Finalized flux data and documentation will be archived (i.e., stored at permanent data center for long-term storage and maintenance). Regional networks (e.g., AmeriFlux) may assume this responsibility or FLUXNET-DIS may ensure that data are placed in a long-term archive. For example, periodically copies of finalized data will be submitted to an archive (e.g.3 ORNL DAAC for FLUXNET data or the ORNL Carbon Dioxide Information Analysis Center for Ameriflux data). The archives provide long-term data and metadata storage, open and free data access, and user support.
25


3. FLUX TOWER SITE CHARACTERIZATION
The Flux Community has identified information that is necessary to charactmize the location and environmental context for each tower. Information includes the tower's identification, contact person, location, operation, site, vegetation, long-term climate, and average soil, vegetation, and stand properties (Table 6). This information is useful for individuals doing synthesis or modeling activities who want to look at the distribution of towers in environmental space. It can be used to promote the scope and scientific value of the flux networks.
The FLUXNET-DIS Web site provides a Site Registration Tool to either enter information for a new flux tower site into the FLUXNET-DIS relational database or to update information for an exiting site. Entries, either new or edits, are identified as to the date and person entering the information. Entries are placed in a temporary data set to be reviewed for consistency prior to replacing current site information with the new values. The tool is designed to capture static information or long-term averages. However, measurements, such as leaf area index or litter fall, for a specific year must be entered into the relational database as new data with specific dates, locations, methods, units of measure, notes, and citation.
Pick-lists are provided for several of the items in the Site Registration Tool (Table 6) to encourage consistency across the networks. Descriptions ofthe items are provided in an online glossary. Often a site may experience an unusual event within a year, such as a nearby fire, insect infestation, unusual weather, etc. The tool provides a way to add comments describing these specific events. Each set of notes or comments are stored and displayed with the site information.
Assigning site names and ID. The site ID is used internally within FLUXNET-DIS to identify sites and link tables within the relational database. In 2002, the following scheme was implemented to make sure the site IDS were concise and consistent.
Flux Site NameRdentifier Scheme: Country. site-abbreviation.tower-code (e.g., US.WALK.01)
Rules for assigning the site abbreviations are based on the need for a concise and unique site ID that can be recognized by the flux community. Therefore, the rules are flexible and can be applied as needed:
1. Use an existing convention, if it is concise (e.g., HARVARD). 2. If there are multiple words that make up a long common site name (Walker Branch
Watershed), use first letters of each word (e.g., WBW). 3. If there are multiple words that make up a long common site name (Tomakomai National
Forest), select the most descriptive and unique word (Tomakomai National Forest - TOMAKOMAI).
4. If there are single or multiple words that make up a long common site name, use either the first four letters (e.g., Fedorovskoje - FEDO) or use the first letter plus the next three consonants, exeept use only one of a double consonant. (e.g.g Fedorovskoje - FDRV).
27
Examples of sites and towers that may need special consideration when assigning site names and IDS. Some towers may be close to each other (e.g., similar climatic and atmospheric conditions and similar tower instrumentation) such that towers can be considered either treatments or separate towers (e.g., Sky Oaks or Metolius).
Sites with replicate towers at a site 0 Howland * NiwotRidge
Towers with multiple sets of sensors e WLEF tall tower 0 Wind River (advection studies) rn Instruments on an LBA tower that moves up and down
Sites with multiple treatments or land surface studies 0 Bondville (soybeans and corn) e Sky Oaks (old and young) e Slashpine FL (clearcut, old) e Metolius (old and young pine) 0 Howland (fertilizerharvest) e Ione (savanndgrassland)
Sites with roving towers a CARBOEUROFLUX: CarboAge - 7 sites
Sites with unique studies e
0
Planetary Boundary Layer (PBL) studies (WLEF, WBW, Florida, etc.) Understory Flux Studies (Wind River, Walker Branch, Ione, Metolius, etc.)
Site table. Site identifier information is stored within the site table (Table 6). The site table includes
0
0
0
Site ID - concise identifier, unique for site, tower, and treatment Site name - up to 80-character expanded name Site code - 2- to 3-character code used in graphics, tables, dataset names, etc., that may be combined with 2-digit year for specific year of measurement
28

4. FLUX QA AND DATA PROCESSING
FLUXNET-DIS is responsible for storing and distributing flux data in consistent and documented formats (Section 1.2). Currently, flux sites may measure a variety of parameters to meet their specific research objectives; however, most sites measure a basic set of parameters. FLUXNET- DIS receives the preliminary flux measurements from regional networks or individual sites in a variety of forms. This chapter discusses the steps that FLUXNET-DTS undertakes to create consistent data files of the basic flux measurements. This process, called harmonization, includes assigning standard variable names, converting to common units of measure, assigning standard missing values, storing in a common file format, performing basic QA checks, and assembling documentation. The 30- or 60-minute measurement step is maintained and no gap-filling (see Chapter 5 ) is performed.
Significant effort has been devoted by the flux community to defining flux parameters to achieve consistency within the database. A FLUXNET-DIS parameter list (Appendix B) was compiled from lists developed by regional networks associated with measuring the fluxes and characterizing the surrounding area in 1999 and more recently. Parameter names, definitions, units of measure, typical methods and instruments, and ranges were defined. Lists have been distributed at the FLUXNET, AmeriFlux and the EUROFLUX meetings €or review and confirmation of site-specific parameters. However, as the flux measurement technology evolves, new parameters or revisions to the original parameter definitions may be needed.
Caveat: The FLUXNET-DIS summary tables provide a list of site characteristics from a variety of sources. We suggest that users check site-specific sources to determine the appropriateness of this information for specific applications. For example, annual climate values or growing season length may represent observations for different years and leaf area index may not be measured by methods that allow intercomparisons among sites. The FLUXNET database is constantly being expanded and updated. Please let the FLUXNET-DIS project know if you see questionable values or if you have suggestions as to the content of the summary table.
Quality assurance and quality control (QNQC). Data quality assurance programs, including quality control, are applied at different levels in the data gathering process by the site PIS, the regional networks, synthesis activities, and FLUXNET-DIS. These include statistical and graphical evaluations to check the validity and representativeness of the acquired data (Aubinet et al. 2000). For example, site investigators and the network (e.g., AmeriFlux Science Team) are responsible for quality of primary measurements and data products. The regional network (AmeriFlux) has responsibility for assuring quality of data sets as they are made available to the science community and other users. FLUXNET-DIS reviews cross-network data conventions for consistency. Application of QA/QC procedures to flux data give international and scientific credibility, indicate their reliability, and ensure their acceptance by users in both the scientific research and assessment communities.
29

The data processing strategy for sites is that the 30- or 60-minute flux and micrometeorology data are compiled, processed, and reviewed prior to being submitted to regional networks. FLUXNET-DIS acquires copies of the processed data from regional networks and occasionally directly from individual flux towers. FLUXNET-DIS processes the data to produce standard set of flux parameters that were selected by the flux community (‘Table 8). The data are distributed on the ORNL DAAC FTP site. The following describes the QA checks that FLUXNET-DIS performs.
Quality assurance checks. FLUXNET-DIS gets data and metadata from regional networks, compiles site characteristics if needed, reviews datdmetadata, standardizes datdmetadata if needed, generates value-added products, links to more detailed data in regional networks, and makes the data available to the community. FLUXNET-DIS compiles site information from that entered using the online Site Registration Tool, from published papers or from site Web pages. FLUXNET-DIS uses the information to create tables of site characteristics and adds the data to the RDBMS. Some non-network sites may submit their data directly to FLUXNET-DIS and the processing and distribution equivalent to the regional networks will be provided. At each step, data and metadata are reviewed and processed in cooperation with the site PIS and according to the principles outlined above. The initial processing uses routines written in SAS to perform the following steps.
e Read data from each site in site-specific format: e check for NEENEP, C02 storage signs, e convert to standard units of measure, e check for missing values and convert to -9999, e check and adjust time stamp to include solar time, e convert to standard variable names, e check that Ustar values are reasonable and whether fluxes with low IJstar values were
adjusted, and e check that energy balance is reasonable for the site. Examine x-y time series plots and other special plots of key parameters to check for unusual patterns or missing values, Calculate percentage of data missing for each parameter by 30- or 60-minute periods and entire 14-day periods, Compare individual values with typical minimum and maximum values for each parameter (Table 8); if values are outside the normal range, check for correct units of measure or other causes, Document all the conversions and changes made by FLUXNET-DLS, usually by saving a copy of the batch SAS code, or assembling a text file. Output data in standard ASCII, .csv, or .at-formatted file.
e
e
e
L
Additional quality checks are described for the time-stamp, integrity of the file, and frequently confused units and parameter names.
30

,
QA checks of time stamp: Plots of measures of radiation energy against time can help to confirm that the time stamp that is provided correctly relates to solar noon (solar elevation max at 12 noon). The goals of this check are to (1) make sure time of day is local time (not daylight savings/summer time or UTC) and (2) provide a solar time variable.
0
0
0 Visually inspect plot.
Calculate solar elevation and solar time for Iat/long/day/tirne, Calculate global solar radiation - top of the atmosphere, Calculate plot ratio (measured Rdpotential Rg) vs. solar elevation.
QA checks andplots: The following checks provide a way to quickly check for corruption of incoming data during transfer, switched or mislabeled columns, or other problems.
Start and stop dates 0
0
0
0 QA plots:
Percentage of % hr gaps, by month, annual Percentage of 14-day gaps by month, annual Statistics - mean, standard deviation, skewness, kurtosis for all variables
0 x-y for selected pairs of variables, including 0 NEEvsPPFD 0 NEE vs wind direction 0 Cumulative precipitation vs time 0
0
fingerprint plot for NEE, LE, temperature, radiation energy index; a “fingerprint plot” provides a quick view of an entire year of data (1 7,520 %-hr values) by producing a plot parameter of interest classified into 4-6 classes and displayed as hours (y axis) vs. days (x axis) for full year
Energy balance [(= (H+LE) - (Rn+G (+other storage terms)))] vs time VPD (or RH) vs time
0
Checkfrequent unitshame mix-ups: Based on processing flux data, the following variables are examined to ensure that they are reported in the correct units.
0
0
0
0
0
0
Carbon equivalent, g C -convert g C02 to g C Relative humidity - convert “fraction” to percentage Vapor pressure deficit -convert hPa to kilopascals (kPa) Air pressure - convert millibars to kilopascals Radiation - cheek possible mixing of incoming, outgoing, and net radiation variables Precipitation - convert inches to millimeters
31

Table 8. FLUXNET variables, units of measure, and typical minimum and maximum values
Parameter Name Units Min Max
Air temperature
Atmospheric stability
Barometric pressure
Bole temperature
COz concentration
coz flux Friction velocity
Global solar radiation
Latent heat flux
Latent heat flux inside the canopy
Momentum flux
NEE
NEE+FC
Net radiation
Photosynthetic active radiation
Precipitation
Relative humidity
Sensible heat flux
Sensible heat storage in canopy
Soil COz efflux
Soil HzO emlax
Soil heat flux
Soil moisture, HzO 0-30 crn
Soil temperature
Solar elevation
Vapor pressure deficit
Water vapor flux
Wind direction
Wind speed
TA
ZI
Pa
Tbole
Ca
Fc
Ustar
Rg LE
sw
Tau
NEE
NEE
Rn
PPFD
P
RH H
Sa
Fcsoil
Esoil
G
swc TS
Solel
VPD
ee-mes
Wd
ws
-50
- 1000000
70
-50
220
-40
0
0
-100
-60
-100
-60
-60
-200
0
0
10
-300
-160
0
-1
-1 10
50
1000000
120
50
770
40
6
1200
700
60
100
30
30
1000
2200
50
100
700
160
10
4
220
mg mg-' (or VOI %) o 0.6
"C -20 50
deg -9 1 91
kPa -0.2 7
mm01 m-'s-' -2 14
deg N 0 360
rn s-I 0 40
Note: With the extension of sites into less temperate regions, some ofthe limits may need to be revised (e& air temperature, precipitation, soil C02 efflux, soil moisture, wind speed, and COz concentration).
32

5. GAP-FILLING, NIGHTTIME FLUX CORRECTION, AND AGGREGATION
One of the goals of FLUXNET is to provide uninterrupted time series and annual estimates of NEE. Estimating annual NEE for a site involves adjusting nighttime fluxes for site-specific micrometeorology conditions, filling gaps in the record, and aggregating the 30- or 60-minute flux estimates into daily, weekly, monthly, and annual time periods. A set of common gap-filling algorithms based on response functions (to temperature and radiation) and mean diurnal patterns have been applied to the harmonized data for many of the sites (Falge et al. 2001a,b; Falge et al. in press).
The development of robust methods for producing flux products is an ongoing research area within the flux community. For example, the GLOFLUX project (http://www.fluxnet.ornl.tzovlfluxnetl,doflux.cfm) is using an artificial neural network system approach to perform gap-filling and examine carbon and energy flux patterns at global scales. This approach has the advantage of being able to preserve temporal variability in flux data. The following section describes some of the issues and products. FLUXNET-DIS stores and distributes additional gap-filled flux products when new collections are contributed by the flux community.
It is the intent of the micrometeorological community to collect eddy covariance data continuously throughout the year. However, missing data are a common feature of the measurements. The average data coverage during a year is between 65 % and 75%, that is 25- 35% gaps due to system failures or data screening (Falge et al. 2001a). Tests show that this observed level of data acquisition and acceptance provides a statistically robust and over-sampled estimate of the ensemble mean. The filling of missing data does not provide a significant source of bias for estimating annual values, if there are no large gaps (>2 months) (Falge et al. 2001a).
Gaps in the data record are attributed to system or sensor breakdown, periods when instruments are off-scale, when the wind direction is such that the tower itself influences the measurements, when spikes occur in the raw data if the vertical angle of the wind vector at the tower is too severe, or are due to calibration and maintenance operations. Data might be rejected when stationary tests or integral turbulence characteristics fail (Foken and Wichura 1995) or when precipitation limits the performance of open-path sensors. If the wind is coming from a non- preferred direction as may occur over patchy stands, a certain portion of the data may be screened and flagged. In addition, rejection probability for some sites is higher during nighttime because of calm wind conditions. Other criteria used to reject data include applications of biological or physical constraints. Missing data may arise fiom farming operations and other management activities (e.g., prescribed burn of grasslands). Rejection criteria applied to the data vary among the flux tower groups.
Although flux scientists may perform gap-filling for their site, the FLUXNET community acknowledges the need to also use common approaches for processing data when flux data fiom multiple sites are to be compared (Falge et al. 2001 a, b). Four gap-filling algorithms were programmed in PV-Wave0 based on Falge et al. (2001 a, b) and have been used to fill gaps less than 14 days in length. Gap-filled data are archived and available from the ORNL DAAC for the EUROFLUX collection of 54 site-years covering 15 sites and the period 1996-2000 (Falge et al. in press). A second collection of gap-filled data called the Marconi data set was compiled for a series of synthesis papers (see Gu and Baldocclii 2002 and others). This collection of 100 site- years for 33 sites covers the period 1996-1999. There is some overlap ofthe same site-years of flux data between the EUROFLUX and Marconi collections. In addition, gap-filled fluxes
33

provided by sites are maintained. Additional research is needed to perform night-time corrections and gap-filling that addresses unique conditions at sites.
A description of the variable names, descriptions, and units of measure for the gap-filled data products (both, EUROFLUX and Marconi data sets) are provided in Appendix D.
The gap-filling algorithms described by Falge et al. (200 1 a, b) typically require key parameters to successfully process a year of flux data. Some of the meteorological parameters are strongly correlated such that the gap filling routines need only a subset of them. Specific pairs of alternative parameters include Ta and Ts and Rg and PPFD. The mean diurnal course algorithm for gap filling does not need any meteorological drivers. Parameters needed for the other algorithms (Falge et al. 200 1 a, b) include
Short-wave global radiation - Rg Photosynthetic photon flux density -PPFD (photosynthetically active radiation) Ambient air temperature - Ta Ambient relative humidity - RH Soil temperature at 5 cm depth - Ts Momentum flux - Tau Net ecosystem 6 0 2 flux - Fc Latent heat flux - LE Sensible heat flux - H
Eddy covariance system typically underestimates C 0 2 fluxes during nighttime under stable atmospheric conditions. Most researchers screen their nighttime data by examining scatter plots of NEE vs. friction velocity (Ustar). A cutoff friction velocity is selected, above which there is no clear pattern between NEE and Ustar. A statistical approach i s now being developed to determine the cutoff friction velocity.
After gaps have been filled and nighttime adjustments applied, estimates for annual NEE for a site can be determined. Typically the 30- or 60-minute flux estimates are aggregating into daily, weekly, monthly, and annual time periods. NEE estimates have been published for over 40 sites by individual investigators and are available from FLUXNET-DIS (h~://www.fluxnet.oml.~ov/fluxnet/nee.cfm). In addition, gap-filled flux products and aggregation sums based on the gap-filling procedures developed by Falge et al. (200la, b) are available from FLUXNET-DIS h ~ u : / / ~ . f l u x n e t . o r n ~ . ~ o v / f l u x n e t / ~ a p ~ i ~ s . c ~ ) .
34

6. REMOTE SENSING
The FLUXNET-DIS project provides remote sensing products for sites, or links to site Web pages that contain such imagery. The ORNL DAAC provides access to MODIS products as they become available from NASA. The goal of the MODIS ASCII Subset activity is to prepare summaries of selected MODIS Land Products for the community to use for validation in conjunction with FLUXNET and other field data. The Subsets include pixel values of selected land products for a 7 x 7-km area around the flux towers or field sites. Data are available from the ORNL DAAC's FTP area.
Nine MODIS products (Table 9) are available for many flux sites, primarily as 8-day composites for 7x7-km subsets around the flux towers (ht tp: / /www.f luxnet .or i i I .gov/ f luxne~.
Table 9. MODIS products currently available in ASCII format and subsetted (7 x 7 km) for selected sites
Product Acronym Spatial
resolution
Surface reflectance
Land surface temperature and emissivity
Land cover
Normalized Difference Vegetation Index (NDVI) and Enhanced Vegetation Index CEVI)
Leaf Area Index and Fraction of Photosynthetically Absorbed Radiation (FPAR)
Photosynthesis (PSN)
Net urimary uroductivitv (NPP)
MODIS/Terra BRDFIAlbedo Model- 1 16- Day L3 Global lkm ISIN Grid
Reflectance Nadir BRDF-Ad-iusted INBAR1
SREF
TEMP
LC
NDVI I EVI
LA1 t FPAR
PSN
NPP
NBAR
500 m
1 km
l k m
l h
lkm
I k m
l k m
l k m
l k m
Temporal Product frequency number
8-day MOD09A 1 composites
8-day MOD1 1A2 composites
96-day MOD12Q 1
16-day MOD13A2 composites
8-day MOD 15A2 composites
8-day MOD 1 7A2 composites
Yearly MOD 1 7A3
1 H a y MOD43B 1 composites
16-day MOD43B4 composites
ORNL posts these subsets (7x7 km) in a single expanding ASClI table for each site-product with rows representing dates and columns values for the pixels surrounding flux towers (http://public.ornl.gov/fluxnet/modis.cfin).
The Field Data-Image-Model Intercomparison Activity (http://public.ornl.Pov/ameriflux/Analvsis/Model Evaluatiodindex.htm1) is a task in which MODIS products are being compared to field measurements, flux tower observations, and model simulations.
35


7. ACKNOWLEDGMENTS
The Terrestrial Ecology Pro.grarn within NASA’s Office of Earth Science (U.S. National Aeronautics and Space Administration, Office of Earth Science, Terrestrial Ecology Program, Activity No. 46WM16401) supported the FLUXNET-DIS project. We especially appreciate Dr. Diane Wickland’s support during this project.
We thank Mac Post for helpful review comments.
This data compilation depended on the contributions of many individuals. We are gratelid to the following individuals and others who are willing to not only share their data but also to provide the documentation to ensure that others can use the data: P. Bakwin, R. Ceulemans, H. J. Dolman, J. Fuentes, H. L. Gholz, A. Grelle, D. Hollinger, P. Jarvis, N. 0. Jensen, G. Katul, B. E. Law, G. Matteucci, W. Munger, W. Oechel, K. Pilegaard, R. Valentini, S. Verma, T. Vesala, K. Wilson, and S. Wofsy,
37


8. REFERENCES
Aubinet, M., A. Grelle, A. Ibrom, U. Rannik, J. Moncrieff, T. Foken, A. Kowalski, P. Martin, P. Berbigier, Ch. Bernhofer, R. Clement, J. Elbers, A. Granier, T. Grunwald, K. Morgenster, K. Pilegaard, C. Rebmann, W. Snijders, R. Valentini and T. Vesala. 2000. Estimates of the annual net carbon and water exchange of European forests: The EUROFLUX methodology. Advances of Ecological Research 30: 1 13-1 75.
exchanges of biologically related gases with micrometeorological methods. Ecology 69: 133 1- 1340.
measuring and modelling carbon dioxide and water vapour fluxes over terrestrial ecosystems. Global Change Biology 2: 159-168.
Baldocchi, D. D., Falge, E., Guy L., R. Olson, D. Hollinger, S. Running, P. Anthoni, Ch. Bernhofer, K. Davis, J. Fuentes, A. Goldstein, G. Katul, B. Law, X. Lee, Y. Malhi, T. Meyers, J. W. Munger, W. Oechel, K. Pilegaard, H. P. Schmid, R. Valentini, S. Verma, T. Vesala, K. Wilson and S. Wofsy. 2001. FLUXNET: A new tool to study the temporal and spatial variability of ecosystem-scale carbon dioxide, water vapor and energy flux densities. Bulletin of the American Meteorological Society 82( 1 1): 24 15-2434.
Buchmann, N. and E. D. Schulze. 1999. Net CO;! and H20 fluxes of terrestrial ecosystems. Global Biogeochemical Cycles 13(3):75 1-760.
Chapin, F. S., 111, W. Eugster, and J. P. McFadden. 2002. Arctic tundra flux study in the Kuparuk River Basin (Alaska), 1994-1996. Data set. Available online at &ttd/www.daac.ornl.pov ] from Oak Ridge National Laboratory Distributed Active Archive Center, Oak Ridge, Tenn.
ecological data sets to share and archive. Bulletin of the Ecological Society of America 82(2): 138-141.
Version 2.1 (Cramer and Leemans). Available online [http://www.daac.arnl.govJ from Oak Ridge National Laboratory Distributed Active Archive Center, Oak Ridge, Tenn.
Falge, E., D. Baldocchi, R. Olson, P. Anthoni, M. Aubinet, C. Bernhofer, G. Burba, R. Ceulemans, R. Clement, H. Dolman, A. Granier, P. Gross, T. Grunwald, D. Hollinger, M. 0. Jensen, G. Katul, P. Keronen, A. Kowalski, C. T. Lai, €3. E. Law, T. Meyers, H. Moncrieff, E. Moors, J. Munger, K. Pilegaard, U. Rannik, C. Rebmann, A. Suyker, J. Tenhunen, K. Tu, S. Verma, T. Vesala, K. Wilson, and S. Wofsy. 2001a. Gap-filling strategies for defensible annual sums of net ecosystem exchange. Agricultural and Forest Meteorology 107( 1):43-69.
R. Clement, H. Dolman, A. Granier, P. Gross, T. Grunwald, D. Hollinger, N. 0. Jensen, G. Katul, P. Keronen, A. Kowalski, C. T. Lai, €3. E. Law, T. Meyers, H. Moncrieff, E. Moors, J. Munger, K. Pilegaard, U. Rannik, C. Rebmann, A. Suyker, J. Tenhunen, K. Tu, S. Verma, T. Vesala, K. Wilson, and S. Wofsy. 2001b. Gap-filling strategies for long-term energy flux data sets. Agricultural and Forest Meteorology 1Q7( 1):71-77.
Baldocchi, D. D., B. B. Hicks, and T. P. Meyers. 1988. Measuring biosphere-atmosphere
Baldocchi, D., R. Valentini, S. Running, W. Oechels, and R. Dahlman. 1996. Strategies for
Cook, R. B., R. J. Olson, L. A. Hook, and P. Kancurik. 2001. Best practices for preparing
Cramer, W. P. and R. Leemans. 2001. Global 30-Year Mean Monthly Climatology, 1930-1960,
Falge, E., D. Baldocchi, R. Olson, P. Anthoni, M. Aubinet, C. Bernhofer, G. Burba, R. Ceulemans,
39

Falge, E., R. Valentini , G. Matteucci, R. Valentini, A. Granier, P. Berbigier, B. Loustau, N. 0. Jensen, K. Pilegaard, A. Lindroth, C. Rebmann, Ch. Bernhofer, A. J. Dolman, E. J. Moors, J. Moncrieff, Paul Jarvis, M. Aubinet, R. Cedemans, 1-1. Thorgeirsson, and T. Vesala. In press. EUROFLUX Gap-Filled Flux and Meteorology Data, 1996-2000. CD- ROM. CARBODATA Product, University of Bayreuth, Bayreuth, Germany. Available from Oak Ridge National Laboratory Distributed Active Archive Center, Oak Ridge, Tenn. at [ http://www . daac ornl.govl.
Foken, Th. and B. Wichura. 1995. Tools for quality assessment of surface-based flux measurements. Agricultural and Forest Meteorology 78183-105.
Gu, L., D. Baldocchi, and N. Kiang. 2000. FLUXNE’T 2000 Synthesis Workshop Report. Available online at [http://www.daac .ornl.aov/FLUXNET/news.html].
Gu, L. H. and D. Baldocchi. 2002. FLUXNET 2000 Synthesis-Foreword. Agricultural and Forest Meteorology 113:l-2.
Running, S. W., D. D. Baldocchi, D. P. Turner, S. T. Gower, P. S. Bakwin, and K. A. Hibbard. 1 999. A global terrestrial monitoring network integrating tower fluxes, flask sampling, ecosystem modeling and EOS satellite data. Remote Sensing Environment 70: 108-1 27.
Thornton, P. E. and S. W. Running. 1999. An improved algorithm for estimating incident daily solar radiation from measurements of temperature, humidity, and precipitation. Agriculture and Forest Meteorology 93:211-228.
meteorology variables over large regions of complex terrain. Journal of Hydrology 1902 14- 251.
Valentini, R., P. de Angelis, G. Matteucci, R. Monaco, S. Dore, and G. E. Scarascia-Mugnozza. 1996. Seasonal net carbon dioxide exchange of a beech forest with the atmosphere. Global Change Biology 2: 199-208.
Valentini, R., D. Baldocchi, and R. Olson. 1999. FLUXNET: A challenge that is becoming reality. Global Change Newsletter, IGBP 37: 15-17.
Valentini, R., G. Matteucsi, A. J. Dolman, E.-D. Schulze, C. Rebmann, E. J. Moors, A. Granier, P. Gross, N. 0. Jensen, K. Pilegaard, A. Lindroth, A. Grelle, C . Bernhofer, T. Gr.Dcnwdld, M. Aubinet, R. Ceulernans, A. S. Kowalski, T. Vesala, Dc. Rannik, P. Berbigier, D. Loustau, J. Guethmundsson, H. Thorgeirsson, A. Ibrom, K. Morgenstern, R. Clement, J. Moncrieff, L. Montagnani, S. Minerbi, and P. G. Jarvis. 2000. Respiration as the main determinant of carbon balance in European forests. Nature 4Q4:861-865.
Studies 163:300.
Thornton, P. E., S. W. Running, and M. A. White. 1997. Generating surfaces of daily
Valentini, R., ed. 2003. Fluxes of carbon, water and energy of European forests. Ecological
40

APPENDIX, A
FLUXNET Web Site Descriptions


Table A.1. FLUXNET Web Pages
Links AmeriFlux
CarboEURQFLUX
AsiaFIux
KoFlux
OZFIUX
FLUXNET-Canada
FLUXNET Architecture FLUXNET Components FLUXNET Overview FLUXNET Diversity Why a coordinated, long-term flux network?
Presentations
Reports
News
Registration of new sites
FLUXNET Data Analysis Opportunities
Job announcements
Meeting and workshop announcements
Page Home
Description Regional Network
Regional Network Regional Network
Regional Network
Regional Network
Regional Network
Overview material compiled during the initial planning and organization of the FLUXNET project
Presentations and posters from various flux meetings
Annual project reports and workshop proceedings
Items submitted by the flux community
Online tool to enter basic information for a new site or to update site information
Links to synthesis and modeling activities
Job descriptions as submitted by the flux community
Announcements
General
Description Brief description and goals df the FLUXNET Project with links to regional networks
Overviews of the FLUXNET project and links to dynamic information for the flux community

Table A.1 (continued)
? P
Page
Sites
Maps
Data
Description
Pick list and table of all sites registered in FLUXNET with links to site information
~~
Maps oftlie FLUXNET tower locations with various background maps, such as the Bailey ecoreaions
Variety of links information about data and links to flux data
Description List offlux pubiications for past 12 months
Search the FLUXNET bibliographic database of over 5,000 citations
List of major journals containing flux papers
Descriptions of parameters, units of measure, suggested names
Links to useful Web sites
Links
New Publications
Search the List of FLUXNET Publications
Journals
Parameter Definitions
Other links
Summary of the ancillary data, including site location, picture of the site, personnel, instrumentation, publications, and field measurements.
Low resolution files for use on the Web or in PowerPoint presentation and higher resolution versions for publications
Parameter Definitions
Data Use Policy
Data Updates
Best Practices for Preparing Data FLUXNET Data See Table A.2 Site Information See Table A.2
Network Data See Table A.2
Other Data See Table A.2
Other Activities

Table A.l (continued)
Page Mailing List
Pubs
Contacts
Description
List of names, mail, and email addresses for over 500 individuals in the flux community
Search screen of over 5,000 citations by author, title, or keywords in title. Individuals associated with the FLUXNET project, funding agencies, and Science Steering Committee
Description
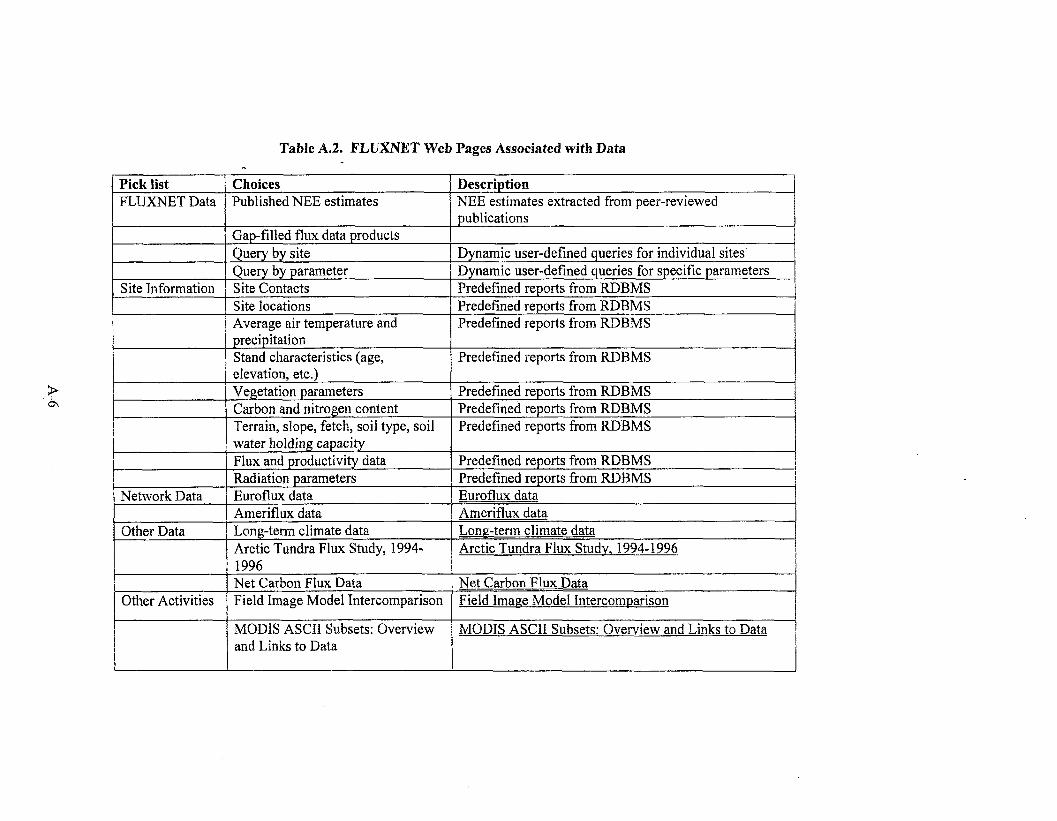
Table 8.2. FLUXNET Web Pages Associated with Data
MODIS ASCII Subsets: Overview and Links to Data
Site Information I====
MODIS ASCII Subsets: Overview and Links to Data
I NehvorkData
Other Data
~ 1996 _. . .
Net Carbon Flux Data Field Image Model Intercomparison
Net Carbon Flux Data Field Image Model Intercomparison

APPENDIX B
FLUXNET Parameter Definitions


Table B.l. Ftux, Meterological, and Soil Measurements
c02 flux
Sensible heat flux
-2 -1 Fc
H
k##.## &###.##
Rate of vertical transfer of C02 calculated from measurements above the canopy in pmol m s Rate of vertical transfer of heat (energy) in units of W m-2 from measurements above the canopy (NOTE sensible heat is the heat absorbed or transmitted by a substance during a change of temtlerature that is not accomDanied bv a change of state)
Latent heat flux 7- I E I Water vapor flux
rt###.##
+#.###
(Footnote 1) Rate of vertical transfer of water vapor (water vapor is the density of water molecules in vapor phase to the density of dry air at the same temperature and pressure) Rate of vertical transfer of latent heat (heat (energy) released by evapotranspiration or absorbed by the condensation or frost of water)) in units of W m-2 from measurements above the canopy (NOTE latent heat is the heat released or absorbed per unit mass by a system in a reversible isobaric-isothermal phase change) Rate of vertical transfer of momentum in units of ka m-1s-2 (ecor.htm1) NOTE momentum defined at Harvard Forest in units of cm2 s-2 from measurements above the canotlv I TA
Momentum flux
Air temperature
Relative humidity
Net radiation
Ta
Rh
*##.##
+###.##
Measure of the thermal energy of the atmosphere measured above the canopy Degrees C Relative humidity describes the degree of water saturation of the air, and is the ratio of the quantity of water vapor actually present to the saturation vapor pressure, the greatest amount possible at the given temperature. It is expressed in %. Net radiation is the difference between the incoming and outgoing total radiation. Total radiation includes both the global radiation as well as the long-wave radiation emitted by the atmosphere, the earth’s surface, the vegetation, etc. Net radiation is expressed in units of W m-’. (Pearcy 1991)
Rn +###.##

Table B.1 (continued)
Global Solar Radiation
Short-wave Radiation i Long-wave Radiation
Reflected Radiation Rr
Diffuse Radiation Rd
UV Radiation Ru30 01-
Ru60
Format +###.#
*###.#
+###.#
*###.#
*###.#
+###.#
+##.##
Definition Global (solar) radiation is the amount of solar radiation received on a horizontal plane at the earth’s surface. It includes both the direct radiation from the sun and the indirect or diffuse radiation from the sky, which is due to scattering by molecules in the atmosphere and scattering and reflection from clouds and pArcticulates. It is given in units of W m-2. (Pearcy 1991) NOTE solar radiation is the total electromagnetic radiation emitted by the sun with 99% ofthe total found between wavelengths of 0.2 and 4.0 pm, the part of the spectrum, which includes UV, PAR, and near-IR radiation. NOTE during scatter there is no change in wavelength and no energy transformation NOTE Pearcy (1991) give 0.3-3.0 pin as range for total short-wave radiation. Radiation of wave-lengths between 0.285 and 2.800 um (in the visible and near ultraviolet wavelengths) in units of W m-2. In general flux measurements don’t distinguish between global solar radiation and shortwave radiation. NOTE Pearcy (1991) give 8.3-3.0 ym as range for total short-wave radiation. Radiation emitted by the earth’s surface due to thermal emission. It includes wavelengths between 4 and 100 pin, the far-IR radiation expressed in units of W m-2. (Pearcy 1991)
Part of the incident global radiation, which is reflected by the surface. The flux is defined going backward in the atmosphere. It is expressed in units of W m-2. (Pearcy 1991) NOTE The reflection coefficient for solar radiation of natural surfaces is called albedo. - Part of global radiation, which is due to the relatively unmodified parallel radiation in the direct beam W (Pearcy 199 1) Part of global radiation, which includes reflected and scattered radiation from all portions of the sky in units of W m-*. (Pearcy 1991)
Radiation of wave-lengths between 0.1 and 0.4 pm. In units ofmW m-2 nm-’.

Table B.l (continued)
Photosynthetic Active Radiation
(Photosynthetic active Photon Flux Density, Incident PAR)
Absorbed PPFD
Percent (Fraction) Intercepted Radiation
Wind speed
Wind direction
Friction Velocity
Atmospheric stability parameter
Barometric pressure
Precipitation
Throughfall
Stem flow
Name
PPFD
MAR
FIPAR
ws
WD
UStar ZL
Pa
P
TF
SF
Format *####A
*####.#
+###.## (+#.####)
+##.##
+##.##
*#.#### *######.# #
+##.##
+##.##
+##.##
+##.##
~~ ~ ~~
Definition PAR is the radiation in the 0.4-0.7 pm waveband. Photosynthetic active Photon Flux Density (PPFD) PPFD is the incident photon flux density of PAR: the number of photons (0.4-0.7 pm) incident per unit time on a unit surface. It is expressed in units of pmol photons (quanta) m s . Incident PAR (PAR) is considered as a synonym for PPFD. (Footnote 2) (Pearcy 199 1)
-2 -1
Part of PPFD, that is absorbed by the vegetation during the observation time in units of pmol m-2s-3
Percent of PPFD, that is absorbed by the vegetation during the observation time in %
Speed of wind in the direction of the wind in m sei
Wind direction in degrees clockwise from the North
Calculated (Footnote 3) (Footnote 4) Calculated, provides information about atmospheric stability, which in needed to compute footprints Averaged barometric pressure (the pressure exerted by the weight of air above a given point) during the observation period in units of kPa
Total precipitation during the observed time period in mdtime period
Precipitation reaching the ground level during the observed time period in mdtime period
Precipitation collected in bottles around the tree trunk in mdtime period

Table B.1 (continued)
Within canopy data
C02 concentration profile
Canopy air temperature profile
Bole temperature
Relative humidity profile
Humidity
Dew-point temperature
Eight profilehrani data
Soil Albedo
Litter Albedo
Canopy Albedo
e.g. prof
C S
Tbole
H O
Tdew
Rprof
SAlb
LAlb
CAlb
Format Definition +####.
+#.### -
Depth of the snow at the ground, averaged over the observed time period in mm
A measure of the wetness of surfaces in the canopy. It helps to diagnose, whether sensors are wet and measures questionable, and affects interpretation of canopy evaporation.
S
*###.##
+##.##
*##.##
+###.##
+###.## *##.##
-t###.# *####.# +###.#
+###.#
+###.#
C O ~ concentration profile in units of pmol moil
Temperature profile in degrees C
Temperature of the tree trunk (measured usually in several depths) averaged over the observed time period in Degrees C Relative humidity profile in YO
€ 3 2 0 concentration of the air in units of mmol mol-]
Dewpoint temperature or wetbulb temperature; in deg K The temperature to which air must be cooled for saturation to occur (given a constant pressure and water vapor content). The temperature at which dew begins to form. in w m-2
Soil albedo is the reflection coefficient for solar radiation of the soil, the fraction of the solar radiation (in %I) reflected by the soil. NOTE Albedo is the ratio of the amount of electromagnetic radiation reflected by a body to the amount incident upon it OR the reflectivity of a body compared to that of a perfectly diffusing surface at the same distance from the sun, and normal to the incident radiation. Reflection coefficient for solar radiation of litter, the fraction of the solar radiation (in %) reflected by litter. Reflection coefficient for solar radiation of the canopy, the fraction of the solar radiation (in %) reflected by the canopy.

Table B.l (continued)
Name Gs
Psat
RLD
Stomatal conductance
Format Definition (minimum, spring) (vpd response, vpd in kPa at stomatal closure) The gas exchange measurement systems usually provide temperature, humidity, and light.
(maximum photosynthetic rate at light saturation, N C i curves) The gas exchange measurement systems usually provide temperature, humidity, and light.
111 units of wmol m-’ leaf area i1
&##.## Light response curves
*##.##
Leafnet .
photosynthesis
~~
Bole respiration
Xylem sapflow
Foliar resDiration
RB *##.## In units of pmol m-’ bole area TR +#.###ft (transpiration) in units ofmm hi’
C02 storage in canopy air layer
COz Drift
Heat storage in canopy air layer
Heat storage in canopy biomass
Latent heat in canopy air layer
sc *##.## ~n units of pmol moils-’
FcD *##.##
Calculated by integrating changes in C02 profiles
In units of W m-2 Calculated by converting changes in air temperature into heat transfer by multiplying with the specific heat of air and the canopy volume (layer volume when profile data are used) In units of W m-2 Calculated by converting changes in bole temperature into heat transfer by multiplying with the specific heat of canopy biomass and the biomass volume In units of W m-2 Calculated by converting changes in air humidity into heat transfer by multiplying with the specific heat of water and the canopy volume (layer volume when profile data are used)
f###.## Sa
+.###.## Sb
*###.## sw
I I I
Derived variables: C02, water vapor and energy storage
Soil c02 flux, Soil respiration
FCSQI +##.## L pmol m-2s-1
The averaged soil COZ efflux (root respiration and heterotrophic respiration) in
Soil heat flux G
ESOIL Soil water vapor
&##.##
*# .###
The averaged soil heat flux density in W m”
The averaged soil water vapor flux in mmol m-2s-1

Table €3.1 (continued)
Soil temperature (profile) (5/10/20 etc cm)
Soil moisture (0- 30crnI etc)
1 soil water Potential
(Rundel and Jarrell 1991 give an overview of measurement systems for both, soil water content and soil water potential)

Table B.2. Stand data: Vegetation, Litter and Soils
biomass
Standing led biomass
Crop/grass increment
Wood biomass .
increment
BrancWTwig biomass increment
BL
BCGI
WI
BI
(Note time period or maximum) Leaf biomass is the total quantity, at a given time, of leaf of one or more species per unit area
Leaf biomass increment (conifers)
Stem density (#/ha) by species
Canopy height
LBI
N
H

Table B.2 (continued)
Woody tissue carbon content
~- ~
Parameted
WTCC
Variable
Crown length
Stand age (add year of investigation)
Diameter at Breast Height
Stand basal area
Sapwood area by species
Leaf Area Index (LAI) (canopy I understory)
LA1 arofile
Clumping index
Leaf area density
Stein area index
Specific leaf area SLA (canopy / understory) (profile) Specific leaf weight SLW (canopy 1 understory) (profile)
~~
Name
c1
DBH
SBA
SAAsp
LA1
LA1PRcm
CI
LAD SA1
SLA
SLW
Definition
Crown can be defined as the upper part of a tree or shrub, including the branches and foliage, above the level of the lowest branch (add year of investigation)
(Footnote 7)
Calculated from DBH by species
(cm from soil surface) The clumping index of a canopy describes the relative gap frequency in the canopy. The basic exponential light extinction theory for a canopy assumes random distribution of the leaves. As this is normally not the case for (tree) canopies, the clumping index is introduced as an additional factor i n the exponent of the extinction equation. A clumping index of 1 indicates random distribution, values less than 1 indicate various degrees of clumping, and values greater than 1 regular distribution of the
SLW = Specific leaf weight = IISLA
c1n2 g" d.w. (SLA) g d.w. cm5 (SLW)

F c Y
Parameter/ Variable
Woody tissue nitrogen
Table B.2 (continued)
Name Definition
WTNC content
structural carbohydrate content
Woody tissue non- WTNS
Leaf carbon content
Leaf nitrogen content
Leaf nitrogen pool
Leaf tissue non- structural carbohydrate content
Leaf ligninhitrogen ratio
Leaf lignin content
Leaf phosphorus
Sap wood carbon content
Sap wood nitrogen content
Tissue 13C/'2C ratios, or 613c, or discrimination A
Tissue 15N/14N ratios, or 6I5N Tissue 'sO/'60 ratios
LCC
LNC
Nleaf
LNCCC
LLC LLNRC
LPC
swcc
SWNC
TCIS
TNIS
TOIS
Litter fall (seasonal)
Litter carbon content
LL
LiCC

Table B.2 (continued)
4;' c N
Soil characteristics
Soil type
Soil depth (depth to bedrock)
Humus layer depth
Depth to water table
Bulk density
SoilTy
TotDB SoilDAOl SoilDAO2 SoilDAO3 SoilDAl SoilDA2 SoilDB
SoilDC SoilDAl (see above)
TotDW
BDSOIL (DSOIL)
The F A 0 soil classification system arranges the soil units in 26 primary classes based on inherent soil profile properties. (Footnote 7) The ISSS soil classification system defines 1 1 soil orders (entisols, inceptisols, andisols, spodosols, mollisols, alfisols, ultisols, oxisols, aridisols, vertisols, histosols j. Soil depth (TotDB) is the sum of the depths of the soil horizons A, B, and C. Soil horizons are defined as the topsoil layer or humidification zone A, (subdivided into A01 litter, A02 duff, A03 leaf mold, Al humus, A2 leached zone), mineralization zone By and the parent material zone C (http://~.cs~.noaa.aov/otter/htmls/ecosys/physical/soil def.HTM
Depth of the A horizon of the soil.
Deoth to seeDaee in in The dry bulk density pb is obtained from the mass of solids in the soil sample (oven dry soil, in kg) ms, and the volume of the undisturbed soil cylinder (V): pb = ms / V. Soils with high bulk density have limited water holding capacity and often restricted drainage. The parameter is required for converting between soil data based on weight or volume.

Table B.2 (continued)
Soil carbon
Soil nitrogen
Soil m+ Soil N03-
Parameter/ Variable
Porosity
Ctot
Ntot
NH4s
N03S
Soil texture (percent of sand, silt, and clay)
Soil organic matter
Soil water capacity or Field Capacity
Hydraulic conductivity or Unsaturated Hydraulic conductivity
I Thermal conductivity
Name
SPOR
SOILT (SOIL- PROP)
HYDC
THERC
Definition
The ratio between the total pore space (space between the soil pArcticles or soil interstices) of the soil to the total volume of the soil. The volumetric soil water content at saturation indicates the fraction of total pore space.
The relative proportions of sand, silt, and clay separates in a soil, which are defined by the pArcticle size. (?h clay, silt, fine sand, coarse sand; Classification of soil separates < 2.0mm according to ISSS, International Society of Soil Science)
Soil organic matter contributes to soil structure and improves the drainage of soil.
The pressure head (in cm) in a soil after a few days of free drainage, following a period of thorough wetting. It is the moisture content of the soil after gravitational water has been drained from the soil, and capillary pores are still filled with water. More information on the soil water dynamics is provided by the soil-water retention curve, which describes the relationship between pressure head and soil water content.
HYDC* is the most important parameter affecting water movement in the unsaturated zone. During unsaturated flow part of the pores are filled with air and do not pArcticipate in the flow. HYDC* should be measured as a function of h, the soil-water retention, or 0, the volumetric soil water content (see Rundel and Jarrell 1991; Van Genuchten et al. 1989; Wijsten and Van Geiiuchten 1988; Van Genuchten 1980)
An important parameter affecting soil heat exchange. One way for the heat flow is by thermal conduction due to molecular exchange of energy in the direction of decreasing temperature. It can vary considerably, predominantly with water content and soil structure. (see Beneke and Van der Ploeg 1981)

Table B.2 (continued)
Parameter/
Variable
Soil organic P
Soil isotones
Soil nitrogen mineralization rate
Cation exchange capacity (CEC)
Soil Aluminum
Soil pH
Name I Definition I i
PsrgS
Siso
SnminR
CEC Total negative charge of a soil, that attracts and holds cations dissolved in the soil solution, expressed as meq/lOOg or cmol(+)/kg of soil. Assuming equal molar concentrations in the initial soil solution cations are held and displace one another in the sequence AI3+> H' > Ca2" > Mg2' > K' > NH4' > Na' on cation exchange sites. As long as there is sufficient base saturation CEC acts to buffer soil acidity. Acid soils with low CEC, as in the humid tropics, are buffered by various geochemical reactions involving aluminum. (Schlesinger 1991)
AIS
PhS For measuring the soil pH a soil sample is mixed with a solution of water or dilute salt in a ratio of one part soil weight to one part solution. After stirring and 10 minutes equilibration, the pF1 is
oil high in organic matter often need ratios of I :5
increment
Pollution and trace eas data
Rain fall chemistry, PChem (Ca2', Mg2', K', Na', rr', NH;, N03-, C1,
Atmospheric N AtNdep
SO:-)
deposition
0 3 I ppb (nmol mol-')
NO2 I ppb (nmoll mol-')

Table B.2 (continued)
Variable
NO
N20
SF6
so2 CH4 co voc C2-C6 hydrocarbons
Halocarbons
Parameter/ I Name
ppb (nmol mor')
ppb (nmol mol-') ppb (nmol mor') ppb (nmol mol-')
ppm (mmol mol-') / nmol m-2 ground area 5.'
ppb (nmol mor')
I Definition
~
Atmospheric 13C/12C ratios, or 813c
AtCIs unitless / %o (per mil)
Site History SHIST
Geographic LOG
Atmospheric '%4/'4N AtNIs ratio I
(Footnote 9)
(Footnote 10)
1 unitless / %o (per mil)
ELV
SIP
Exp ADR
ZLDH
Atmospheric 'e0/'60 I AtOIs
The degree of deviation of a surface from horizontal that is measured as a percentage, a numerical ratio, or in degrees.
(see Footnote 4)
I unitless / %o (per mil)
Elevation
Slope
Exposure
Aerodynamic roughness length
Zero plane displacemelit height

B-16

Table B.3. Annual calculated Flux Data
Name AC02F
AC02NF
Annual summed day-
Annual summed night- time CO? flux
Definition
Annual summed respiration (COZ flux) Annual Net Ecosystem Carbon Exchange
Annual Above-ground Net Primary Production
Annual Evapo- transpiration Total Annual precipitation
Annual mean air temoerature
(NEE)
ACOZR
ANEE
ANPP
AET
APT
AMT
Annual mean bole temperature ,
Annual mean soil temperature
Annual net radiation
Annual solar radiation
Max IPAR(Annua1)
The loss of water by evaporation from the soil and by transpiration from plants
~ -~
AMBT
AMST
ANR
ASR
MaxAPAR

Footnote 1. E (water vapor) is the measured variable, multiplied by I. (specific heat of vaporization, 9 k g i ) and MWmo (molecular weight of water, 6
g mol-'), and divided by 10 mg kg' gives LE (in W m-')
Footnote 2. PAR = incident PAR
HPAR == intercepted PAR, FIPAR == Fraction intercepted PAR
P A R = FIPAR*PAR
FIPAR=l -fraction of incident PAR (PAR) that was transmitted through the canopy
Footnote 3. is Friction velocity, calculated as the square root of momentum
Footnote 4, is calculated, and equals Z / E, where Z is the measurement height, and L the ,,Monin-Obukhov"-le~~gth, E = - (u*)~ / (k l3 Ho), where u" is
the friction velocity, k is the von Karinan constant, 13 is g / Tg (gravity divided by surface temperanire To), and Ho is the surface heat flux. Over tall
vegetation in stead of Z, (Z - zero plane displacement height) is more appropriate.
Footnote 5. ecological functional types: Mixed forest Temperate broad-leaved forest Temperate conifer forest Boreal broad-leaved forest Boreal conifer Semi-arid woodland Alpine Arctic Grassland Crop Tropical forest Wetland
Footnote 6. Phenology descriptions may include (some of these are from Harvard Forest publications): time perioc. of initial bud break (begin and end date), date when leaves are at 75% and 95% of full expansion, period (begin and end date) of shoot elongation, period (begin and end date) of flowering, date of first observation of autumn color, dates of leaves-off (for deciduous, begin and end date), dates when 10-25% and 98% of leaves have been shed, dates for insect attacks, high mast (Le. indicate a year of high seed production), and all other usual or unusual events (as shoot drops due to drought, etc.)
m c-. 00

Footnote 7. Tree diameter at breast height is measured at 1.35 m, indicate mean and standard deviation.
Footnote 8. The FA0 soil classification has two levels: the upper level with 26 soil classes, and a lower with 106. The 26 primary soil classes are
Fluvisols, Arenosols, Solonchaks, Kastanozems, Gleysols, Rendzinas, Solonetz, Chernozems, Rankers, Regosols, Andosois, Y errnosols, Phaeozems, Lithosols, Vertisols, Xerosols, Greyzems, Cambisols, Podzoluvisols, Acrisols, Histosols, Podzols, Nitosols, Luvisols, Planosols, Ferralsols. (httD://w.fao .or~waicent/FaoInfo/Agricult/AGL/a~ls/key2soils .€ITMI.
etc.) if applicable, date of planting, thinning, fertilization if applicable Footnote 9. Using text description including: site type (natural or plantation, management goal), indicate disturbances (date of fires, storms, flooding,
Footnote 10. Example: 50° 09’ 30” N, 1l0 52’ 47” E

Literature Cited in Appendix B
Beneke, P., and R. R. Van der Ploeg. 1981. The soil environment. In: 0. L. Lange, P. S. Nobel, C. B. Osmond, and H. Ziegler (eds.), Physiological Plant Ecology, Part I: Responses to the Physical Environment. Springer, Berlin; Heidelberg? New York.
Binkley, D., and P. Vitousek. 1991. Soil nutrient availability. In: R. W. Pearcy, J. Ehleringer, €1. A. Mooney, and P. W. Rundel (eds.), Plant Physiological Ecology: Field Methods and Instrumentation. Chapman and Hall, London. Pp. 75-96.
Pearcy, R. W. 1991. Radiation and light measurements. In: R. W. Pearcy, J. Ehleringer, H. A. Mooney, and P. W. Rundel (eds.), Plant Physiological Ecology: Field Methods and Instrumentation. Chapman and Hall, London. Pp. 97-1 16.
Rundel, P. W., and W. M. Jarrell. 1991. Water in the environment. In: R. W. Pearcy, J. Ehleringer, H. A. Mooney, and P. W. Rundel (eds.). Plant Physiological Ecology: Field Methods and Instrumentation. Chapman and Hall, London. Pp. 29-56.
Schlesinger, W. H. 1991. Biogeochemistry: h Analysis of Global Change. Academic Press, San Diego. P. 83.
Van Genuchten, M. T. 1980. A closed-form equation for predicting the oil hydraulic conductivity of unsaturated soils. Soil Sci. Soc. Am. J. 44:892-898.
Van Genuchten, M. T., F. Kaveh, W. 13. Russel, and S. R. Yaks. 1989. Direct and indirect methods for estimating the hydraulic properties of unsaturated soils. In: J. Bouma and A. K. Bregt (eds.), Land qualities in space and time. PUDOC, Wageningen. Pp. 61-73.
Wosten, J. H. M., and M. T. Van Genuchten. 1988. Using texture and other soil properties to predict the unsaturated soil hydraulic functions. Soil Sci. Soc, Am. J. 52:1762-1770.
B-20

APPENDIX C
FLUXNET Relational Database Management System Description


Table C.1
Field Name
B ai 1 ey-c
Description Data Type Field Valid Values Comments
Bailey-c as defined fiom Text 50 Lookup list Primary Key Bailey's Ecoregions
Size
Field Name Description -
Biome categories as defined at the EMDI I Workshop and based on IGBP Land Cover and Models needs
Biome
Data Type
Text
0
VlE Field Size 50
Size Climate Climate - based on Text 50 Lookup list Primary Key
Koppen, 24 subclassifications from six major climate regions
Valid Values
Field Name
OLDKEYID
SUBSITE KEY ID
Lookup list
Description Data Type Field Valid Values Comments
Site identifier prior to Text 255 Lookup list January 22,2002 Identifies site partition Text 255 Site identifier (assigned by Text 255 Lookup list
Size
Comments
DATEADDED
Primary Key
FLUXNET) Date value was entered Date/Time 8 1 Any valid datehime
CLIMATE I Field Name I Description I Data Type I Field I Valid Values I Comments 1
PARAMETER CHECK
into table Measured variable Text 255 Marker for identi@ing Text 255
ADDEDBY values that require review Initials of person entering Text 50 Initials
VALUE the data I Measured variable result Text 255

Table C.1 (continued)
Field Name I Description 1 DataType Field
UNITS 1 Units for measured Text 255 variable
SOURCE Source of the data, such as Text 255 a publication, web page, email
i 1 Size '
FLAG Flag assigned 1 Text 1 255 VALUESTATUS Status of value, "yes" Text
means use the value, I'iio"
means the value has been I determined to be unusable 1
SUM If sum=yes, then value is Text 50 used in summary tables
COMPUTE If compute=yes, then this 1 Text 50 is an artificial entry created to summarize other
!
i
Valid Values Comments
*, ?, -, +, <, >, >=
I !
Max, mean, min, range, sum total
I
5 rnin, 1 km
subcanopy, canopy, above crown closure, * my * cm, AI for soil horizon
May be I negative if a
subsurface
etc .

Field Name Description
YearIMonthDay measurement was made (Combines year, month, and day fields) Indicates any temporal constraints for the value such as length of sampling or averaging time Comment field
TIMEPERIOD
Data Type
Text
Text
Memo
TEMPORAL
Year measurement was made Month measurement was made Day measurement was made Estimate of measurement error or uncertainty
COMMENTS YEAR Text
Text
Text
Text
MONTH
A reference to document how the measurement was made
DAY
Text
ERROR
ERRTYPE
METHOD
NSTRUMENT
CATEGORY
Table C.1 (cot
I Text
Instrumentation used to obtain the measurement value AmeriFlux program classification variable for use in web programming
Field Size
50
255
50
50
50
25 5
25 5
255
255
255
inued)
Valid Values Comments
season, month, year or range of months or years
Day(s), month, old, seasonal, single, summer, winter, year, young
I Confidence interval, standard error, standard deviation
STD, Range, Max, SE=standard error, SD=standard deviation, 95CI=95% confidence interval, CV=coefficient of variation
Statistical model, tower flux data, open- path, chamber, radius plots
Examples are LI6200, minirhizotron, open-path, soil cores

Field Name
Table C.1 (continued) DEFINE
DataType 1 Field
ID CATEGORY
SORTCAT
MODEL
PARAMDEF PARAMETER
UNITS
COMMENTS
RANGE
FORMAT
DEFINE
DATE
SOURCE
>ASTUPDATE
Description
Record number Category of variable
Secondary variable category
Identifies model that us& variable Parameter definition Measured variable
Units for measured variable Zomnient field I’iniesteo [nstrumentation used to nake measurement Range ofvalues for 3arameter ;ormat of value, such as tl- ##.## letailed parameter lefinition late value was entered nto table 3ource ofthe data, such as L publication, web page, :mail
I
Size
I
Text 50
Text 50
Text 255 Text 255
Text 255 !
Text 7 Wems
rext “-t- late of last update Text 255
Valid Values Comments
1,2, 3 ... Annual flux data, meteorological data, site characteristics, soil characteristics, soil chemistry, vegetation, etc.
Carbon, flux, gas, inst, met, productivity, radiation, site, soil, vegetation
Examples: PAR, ELEV, FETCH.. . Primary Key I
hourly, half-hourly

Table C.l (continued) I
GAPDATAZ
ID SITECODE YEAR LETTER METHOD
USTAR
I
Record number Long Integer Site two letter code Text Year data was collected Text Indicates - e or n Text Indicates method of Text gapfilling Indicates USTAR Text
~~
Field Size
4
TIMEPEIUOD FILETYPE
Field Name
correction Indicates timeperiod Text File type - Text
Description I DataType
DATEADDED
ADDEDBY
Valid Values
Date value was entered Date/Time into table Initials of person entering Text the data
1 Comments
Lookup list Primary Key
I 1
Fietd Size
4 50
255 255
Valid Values Comments
1,2, 3 ... ID ORIGINATOR
Record number Long Integer Person who submitted the Text
1, 2, 3 ... BV. Hv. . . . 255
255 1992- I I 50 e or n I I
I I re, dc, lu 255
255 1 u0 or u l 1
min, yy, hh, dd, ww flx, met, zip AB97-dc-uO-dd.flx, AB97.zip, AB97 ddmet
255 255 255 1 Filename Text
STATUS 1 Indicates status of data Text 255 New, removed at request of PI, old
Any valid datehime 8
Initials 255
jP Field Size 50
Field Name ~~
Valid Values rcomments ~ I Description
Land cover cIass, based on 1 GBP (In tern at ional Geosphere Biosphere Programme) Land Cover Classification
Data Type
Text IGBPclss
Field Name Description Data Type
I information I ORIGEMAIL 1 Email of submitter I Text CONTACT1 I Contact Derson I Text


Table C.1 (continued)
Field Name
Limitations
Description Data Type Field Size
Limitations of flux site Text 255
MODISCOORD Field Name 1 Description I DataType I Field
- ID KEY ID
I
Record number Site identifier (assigned by
LAT FLUXNET) Latitude, decimal degrees
LON
VTILE 1 Vertical tile - A tile is the 1 smallest unit of MODIS Land data processed at any one time for Levels 2G, 3
~ and 4. Each tile has fixed Earth-locations covering an area of approximately
Horizontal tile - A tile is the smallest unit of MODIS Land data processed at any one time for Levels 2G, 3 and 4. Each tile has fixed Earth- locations covering an area of approximately 1200 x 1200 km.
' 1200 x 1200 kin.
Longitude, decimal denrees
I Size
Text
Double T
Double 8 I
Valid Values I Comments 1
Good for annual sums, good for process studies, good for daytime measurements, challenged by coinplex terrain, influenced by nearby disturbances
Primary Key
I I
Valid Values
1 , 2. 3 ... Lookup list
-90 to 90 decimal degrees
-180 to 180 decimal degrees
The range of vertical tiles depends on the projection and the tile size.
The range of horizontal tiles depends on the projection and the tile size.
Comments

Field Name Description I Data Type Pield Valid Values Comments
SAMP Double 8
point Location of point Text 255 NE, NW, SE, SW, tower, center
I Size
LINE Double ! 8
I __
I Fie'dName Description 1 Data Type 1 Field I Valid Values 1 Comments
MODIS-PENDING
MODISCUT2
I
FILENAME-ORIG
1
the data Indicates filename for
jADDWBY I
Text 255 1 1 GRAPHlCS
MODIS sites MODIS Cutouts Text 255 site/filename identifier MODIS Cutouts Text 255 site/filename identifier- 1 Collection 3 I Initials of person entering 1 Text 1 255
'MODISKEYID
i
Initials 1
addition graphics

Table C.l (continued)
Data Type Field Valid Values Comments Size
Field Name
1 MODl3A2
Description
1 Indicates file name for this
Text
Text
! 255 I 255
255
Text
COMMENTS product Comment field Memo I I I
1 Description Comments Field
Size Long
Valid Values
1,2,3 ...
Data Type
AutoNuinber
Field Name
Record number ID
FSERVER Integer
5 Designates people associated with FLUXNET listserver - YesNo
Text Yes or No
(? Y AMERLISTl Designates people
associated with Ameriflux network - Yes/No
5 Yes or No Text c
PlFIRST Investigator's first name Investigator's last name Investigator's middle initial FLUXNET contact FLUXNET role
25 5 255 255
Text Text Text
PILAST PIMlD
Text Yes or No Co-Principal Investigator, Data and Information System, Former Project Scientist, Programmatic Steering Committee, Scieiice Component Leader, Science Steering Committee
255 255
FLUX CONTACT FLUX-ROLE Text
Investigator's email address
255 Text TEMAU,

Table C.1 (continued)
Field Name
EMATLORG
COUNTRY
ADD 1 ADD2 STREET CITY STATE
ZIP PHONE
DATEADDED
DROPPED
Einail address after the @ sign- helps identify individuals of same organization - Country where pi is located Address Address Street City State
Zip code Phone number Fax number Assocation Title Job title Comment field Investigator's homepage Date entry last changed Person's intials who made the last change Date individual was added to the FLUXNET listserver for the first time Indicates date when person has been dropped from the FLUXNET Listserver
Size
Text
Te,xt Text 255
I 255-- Text
Date/Tirne rext 255
Date/Tirne --I+
I I
Valid Values
Yes or No
Any valid datehime [nitials
4ny valid datehime
Restricted to 2 characters because of Ameriflux java applets
------I

Table C.1 (continued)
Field Name
UNSUBSCRIBED
Description Data Type Field Size
Indicates date and/or Text 255 reason individual
Field Name I Description
Valid Values
ID
Comments
I number
Valid Values Comments
ENDNOTENO REFTYPE
YEAR I Year of publication TITLE I Job title
Endnote reference number Reference type E journal, book
VOLUME I Volume of iournal
HAVEPAPER
KEYID
AUTHORS
Arcticle is located
Indicates whether paper is in FLUXNET library Site identifier (assigned by FLUXNET) Publication authors
use
publication has been CUSTOM4 Indicates whether
Text
Memo Text Text Memo
reviewed for data CUSTOM5 Custom variable for later
255
- 255 255 -
CUSTOM6 Indicates program, such as AineriFlux or FLUXNET
Size
Integer
Text 255
Text 255
1, 2, 3 ...
journal, book
Yes or No
Lookup list
Used in web site programming to generate publication lists for AmeriFlux, FLUXNET
I I

Table C.11 (continued)
SITEINSTRUMENTATION Data Type I Field 1 Valid Values 1 Comments i I Field Name I Description
KEYTB . Site identifier (assigned by 1 FLUXNET)
ORIGPARAMETER 1 Original parameter description
INSTRUMENTATION Instrumentation type MODEL Instrument model NOUNITS Number of instrument
units measuring this parameter
information DATASOURCE Source of instrumentation
DATEADDED Date information added to i table
ADDEDBY Initials of person iitering the data
I WITS I Units for measured variable
LEVEL Height at which measurement is taken
measurement was made (Combines year, month,
TIMEPERTOD Y ear/Month/Day
and day fields) FREQUENCY Frequency of
measurements
instrumentation
I 1 Size I j
i I I
Text 1 255 Lookuplist I I I
i Text 255
Text I I Text 1 255 ! I I Long Integer 4 1
1 I I I
1 ! Text 255
I Text 255 Text 255 _ _ - 1 255 Eddy correlation method, gradient
method, heat balance method, micrometeorology, etc.
I Text

Table C.1 (continued)
Field Name
RANGE
Description Data Type Field Valid Values Comments
Range of values measured Text 255 Example: 0-360 degrees or 400-700 nm by instrumentation
Size
Field Name
- PRIMARY
SITECONTACT
KEY ID
PIFIRST PILAST FUNCTION
DATEADDED
ADDEDBY
OLDKEYID
USERLOGIN USERPASSWORD
SITEPIS
Description - Data Type Field Valid Values Comments
Indicates primary Text 50 Yes/No, inultiples per site are possible investigator
Text 255 YesorNo Must choose Indicates primary site
contact only one per
Site identifier (assigned by Text 255 Lookup list FLUXNET) Investigator's first name Text Investigator's last name Text Function Text 255 Collaborator, Primary Investigator, Site
Size
site
255 255
Scientist, etc.
Date value was entered Date/Time 8 Any valid datehime into table Initials of person entering Text 255 Initials the data Site identifier prior to January 22,2002 User login for site changes User password for site changes
Text 255 Lookup list
50 Text Text 50
SUPP Field Name
PARAMETER PARAMDEF SUPP
-
Data Type Field Valid Values Comments Description
Measured variable Parameter definition Supplemental variable - Text 50 YesorNo used by AmeriFlux in web programming
Size Text 255 Text 255

Table C.1 (continued)
1 Comments 1 Field I Valid Values Description Data Type
AmeriFlux in web
-___
Size 50 Yes or No
I I
rus Field
ST. Data Type Valid Values
I , 2 , 3 ...
Lookup list
Description - Field Name
ID Size
AutoNuinber Long Record iiuinber
Site identifier (assigned by FLUXNET) Network
Status of file processing
Text KEYID
NETWORK Ameriflux, AsiaFlux, CarboEurope, FLUXNET, Fluxnet-Canada, KoFIux, LBA, OzNet, Safari2000, TCBS-Siberia, TropiFlux
1-Collected, 2-Submitted, 3-QA Review, 1 4-Processed, 5-GapFilled, 6-Regrocess, 9-Inactive
25 5
255
Text
STATUS Text
Double 8 1989 through present - EURQFLUX, Marconi, rjolOO4, rjol204
Year data generated Source of data
YEAR SOURCE -
Text 255
Date data file was received 25 5 255
Text Text
RECEIVED INGROUP EUROFLUX, EUROFLUX CD Falge, 1
Falge Marconi, MA96.csv, Marconi, RJO-Dec2OO 1, RJO-Oct2002
Group
Location of data file Text 255 j Example: /data/fluxnet/gap_~lled_marconi/data/ZIP '
i
1 LOCATION
FILENAME COMMENTS
Filename Coininelits
Text Text
255 25 5

Table C.l (continued)
Data Type Field Name TESTSITE
Field Valid Values
ID
Comments
USE
NetworkComments
KEYID
STTENAMEA COUNTRY
STATE
FLUXNET
AMERIFLUX
3AFAIU2000
SYNCOBE
5 Y NCODE2
ZOSLANDVAL
Description
Record number Designates whether site is tobeused Network comments
Site identifier (assigned by FLUXNET) Site descriptive name Country where site is located State where site is located.
Designates towers that are part of the FLUXNET network Designates towers that are part of the AmeriFlux network
~
Designates towers that are part of SAFARI2000 Designates two letter synthesis code Designates two letter synthesis code- alternate Designates sites that are part of EOS Land Validation
Long Integer Text
Text
Text
Text Text
Text
Text
Text
Text
Text
Text
Text
Size 4 5
255
255
255 255
' 2
5
5
5
5
5
5
1,2,3 ... Yes or No
Aerocarb, AmeriFlux, AsiaFIux, CARBOEUROFLUX, etc. This field contains all the networks that a site may be associated with that we know about.
Lookup list 3 Restricted to 2 characters because of AmeriFlux java applets
Yes or No
Yes or No
Yes or No

Field Name
OZFLUX
FLUXNET-CANADA
KOFLUX
ASIAFLIJX
SAVAFLUX
C ARBOEUROFLUX
TROPIFLIJX
LOCLAT LOCLG DATECOORDINATES
STATUS
YEARBEGAN
MONTHBEGAN
YEAREND
Tab
Description Data Type
Designates towers that are Text part of the OzFlux network Designates towers that are Text part of the FLUXNET- Canada network Designates towers that are Text part of the KoFlux network Designates towers that are Text part of the AsiaFlux network Designates towers that are Text part of the SavaFlux network
part of the CARBOEUROFLUX network
part of the TropiFlux network Latitude in degrees Text Longitude in degrees Text Date that the coordinates Text last changed (field added January 7,2003) Status of flux Text measurements 1 Year flux measurements Text began Month flux measurements Text began Year flux measurements Text ended
C.1 (continued) Field 1 Valid Values ' Comments
5 Yes orNo I
5 Yes orNo
I
255 -90tO+90 255 50
0 to 180 degrees -180 to +180
255 Continuous, intermittent summer operation only, roving, inactive, retired from use
I
255
255
255 I

Field Name I Description
NETWORKNODE CLUSTER
MONTHEWD Month flux measurements
INSTRUMENTS Flux tower instrumentation
non-unique) Network site node Text Cluster name - identifies Text
Tabie C.l (cor
SITETYPE BIOME
Data Type
stations Site type - Text Biome - based on Text
Text
Text
Text
a publication, web page,
I towers in collocated I
I modelers input, see lookup I list
BIOMESOURCE Source of biome
. ~~
Field Size
255
255
255
255
255
~~ -
50
255 255
255 255
255
255
:Rued) Valid Values
Open-path, closed-path, multiple instruments Good for annual sums, good for process studies, good for daytime measurements, challenged by complex terrain, influenced by nearby disturbances
Comments
halfi’hourly, hourly
FLUXNET, OzNet, LBA, . . .
Lookup list

Table C.1 (continued)
Field Name Description Data Type Valid Values Comments
Lookup list
Field Size
Text 255
255
Climate - based on Moppen, 24 subclassifications from six major climatekegions Source of IGBP, Bailey, UMD classes - may be determined by geographical programming or assigned by investigators Land cover class, based in IGBP types/MODIS Bailey C
Funding Sponsors Research topics Date value was entered into table Initials of person entering the data Coordinate type provided as degrees or decimal degrees
CLIMATE
Text CLASS SOURCE
~
IGBPclss Text Lookup list 25 5
2 Lookup list I
Lookup list I Text
Text Text
BAILEY C UMD CLSS FUNDING SPONSORS RESEARCHTOPICS DATEADDED
255 255
Any valid dateltime
Memo Memo DateITime 8
Text Initials I 255
255
ADDEDBY
COORD-TY PE-PROV IDED
Text
Latitude, direction Latitude, degrees Latitude, minutes Latitude, seconds Longitude, direction Longitude, degrees Longitude, minutes Longitude, seconds Applicable link to site information
Text Double Double Double Text Double Double Double
LATDIR LATDEGR LATMIN LATSEC LONGDIR LONGDEG LONGMIN
2 E o r W I 0 to 180 degrees I
8 8
255
0 to 60 0 to 60 Hyperlink
LONGSEC Link1 Text

Table C.l (continued)
Field Name Description
Link2 Applicable link to site information -
Data Type Field Valid Values Comments
Text 255 Hyperlink Size
1 Applicable link to site 1 Text 1 255 1 Hyperlink
Datal Data2
Link3
/imagedimage 1 .gif Data link Text 255 Data link Text 255
TIMECODE Size
Monthly, daily, halfhourly, Text 255 Monthly, daily, halfhourly, weekly, weekly, yearly yearly
TIMEPERIOD mm,dd,hh,ww, yy Text 255 mm, dd, 1111, ww, yy Primary Key
Field Name
UMD-CLS S
Description Data Type Field Valid Values Comments
University of Maryland ,Text 255 Lookup list Priniary Key land cover classification system
Size


APPENDIX D
FL-T File Content


Table D.l. Variables in meteorology data files for monthly gapfilled, aggregated flux data
R H g RHmi RHnix R H S
P w
top) of time period Percent gaps filled for period
Minimum relative humidity of time period Maximum relative humidity of time period
% % %
S.D. %
R H g RHmi RHnix R H S
top) of time period Percent gaps filled for period
Minimum relative humidity of time period Maximum relative humidity of time period
% % %
S.D. % VPD I Average vapor pressure deficit (height of instruments- 1 kPa
VPD g VPDmi VPDmx
tower top) of time period
Minimum vapor pressure deficit of time period Maximum vapor pressure deficit of time period
Percent gaps filled for period % kPa kPa

Table D.1 (continued)
Variable" VPD s
Description Units** S.D. kPa
lj! P
*This column defines order of variables (Le., the header row) for the data sets (csv files). **Units for the ''tot'' (daytime plus nighttime) are as given. Units for daytime and nighttime separately are per "time period", Le. the values added give the "total").

Table D.2. Variables in flux data files for monthly gap-filled, aggregated flux data
*This column defines order of variables (i.e., the header row) for the data sets (csv files). **Units for the "tot" (daytime plus nighttime) are as given. Units for daytime and nighttime separately are per ''time pe give the "total").
:riod", i.e. the values added


ORNL/TM-2003/204
INTERNAL DISTRLBUTION
1-20. R. B. Cook 21. T. A. Boden 22. D. E. Fowler 23. L. Gu 24. S. K. Holladay 25. G. K. Jacobs 26. A.King
39
40
41
42
43
44
45
46
47
27. R.C.Mann 28-32. R. J. Olson 33. W. M. Post 34. L. D. Voorhees 35. S. Wullschleger 36-37. ESD Library 3 8. ORNL Laboratory Records-RC
EXTERNAL DISTRIBUTION
Dennis Baldocchi, Ecosystem Science Division and Berkeley Atmospheric Science Center Department of Environmental Science, Policy and Management, 15 1 Hilgard Hall, University of California, Berkeley, Berkeley, CA 94720
Roger C. Dahlman, U.S. Department of Energy, SC-74,19901 Germantown Road, Germantown, MD 20874-1290
Jerry Elwood, Acting Director, Environmental Sciences Division, ER-74, Department of Energy, 19901 Gemantown Road, Germantown, MD 20874
E. Falge, Universitat Bayreuth, 95440 Bayreuth, Germany
Beverly E. Law 328 Richardson Hall College of Forestry Oregon State University Corvallis, OR 9733 1
Ofice of Assistant Manager for Energy Research and Development, Department of Energy, Oak Ridge Operations, P.O. Box 2001, Oak Ridge, TN 3783 1-8600
Office of Scientific and Technical Information, P.O. Box 62, Oak Ridge, TN 3783 1
Steve Running, School of Forestry, University of Montana, Missoula, MT 598 12
Diane E. Wickland, Manager, Terrestrial Ecology Program, NASA Code YS, 300 E Street, SW, Washington, DC 20546