flux35bookv2_2may2011
TRANSCRIPT

8/6/2019 flux35bookv2_2May2011
http://slidepdf.com/reader/full/flux35bookv22may2011 1/40
flux

8/6/2019 flux35bookv2_2May2011
http://slidepdf.com/reader/full/flux35bookv22may2011 2/40
8/6/2019 flux35bookv2_2May2011
http://slidepdf.com/reader/full/flux35bookv22may2011 3/40
flux
Table of Contents
Mission statement
Objectives
Keys to success
Executive summary
Venture history
Venture description
Venture organization
Venture market
Venture operations
Industry Financial ProleUS Market Research
Branding
8/6/2019 flux35bookv2_2May2011
http://slidepdf.com/reader/full/flux35bookv22may2011 4/40
4 business
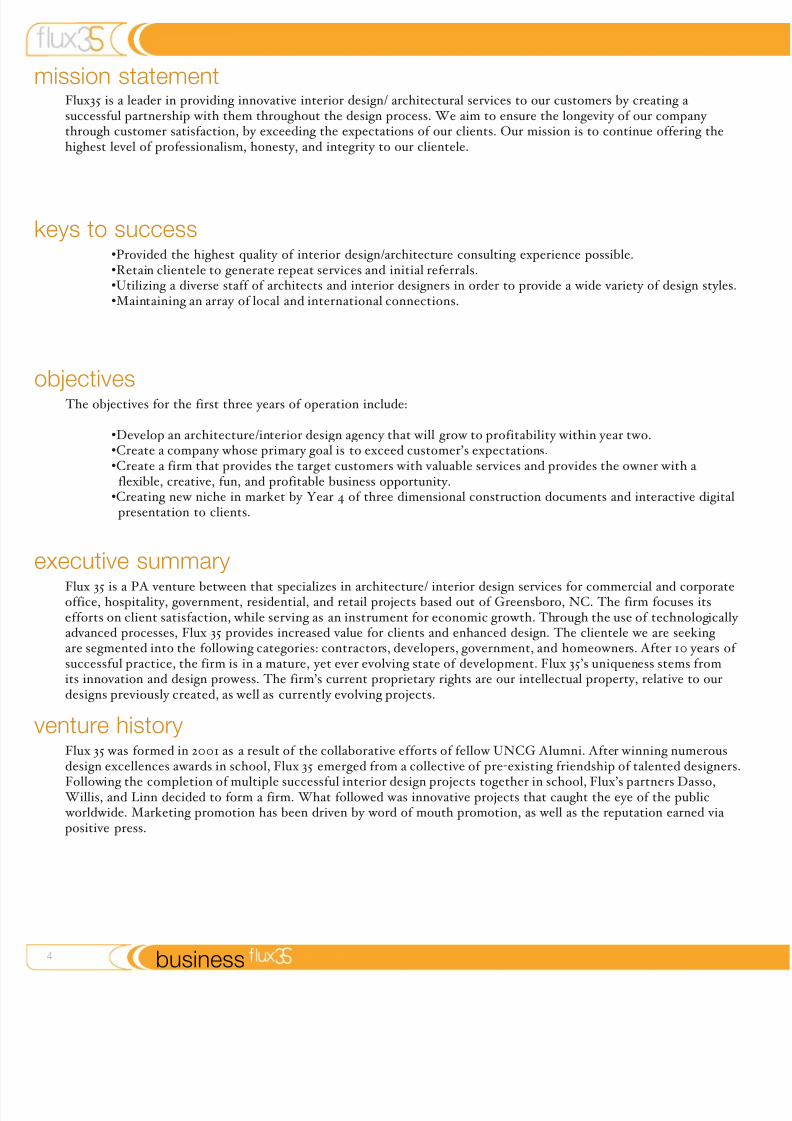
Flux35 is a leader in providing innovative interior design/ architectural services to our customers by creating a successful partnership with them throughout the design process. We aim to ensure the longevity of our company through customer satisfaction, by exceeding the expectations of our clients. Our mission is to continue offering thehighest level of professionalism, honesty, and integrity to our clientele.
mission statement
keys to success
objectives
executive summary
venture history
•Provided the highest quality of interior design/architecture consulting experience possible.•Retain clientele to generate repeat services and initial referrals.•Utilizing a diverse staff of architects and interior designers in order to provide a wide variety of design styles.•Maintaining an array of local and international connections.
The objectives for the first three years of operation include:
•Develop an architecture/interior design agency that will grow to profitability within year two.•Create a company whose primary goal is to exceed customer’s expectations.•Create a firm that provides the target customers with valuable services and provides the owner with a
flexible, creative, fun, and profitable business opportunity.•Creating new niche in market by Year 4 of three dimensional construction documents and interactive digital
presentation to clients.
Flux 35 is a PA venture between that specializes in architecture/ interior design services for commercial and corporateoffice, hospitality, government, residential, and retail projects based out of Greensboro, NC. The firm focuses itsefforts on client satisfaction, while serving as an instrument for economic growth. Through the use of technologically advanced processes, Flux 35 provides increased value for clients and enhanced design. The clientele we are seeking are segmented into the following categories: contractors, developers, government, and homeowners. After 10 years of successful practice, the firm is in a mature, yet ever evolving state of development. Flux 35’s uniqueness stems fromits innovation and design prowess. The firm’s current proprietary rights are our intellectual property, relative to ourdesigns previously created, as well as currently evolving projects.
Flux 35 was formed in 2001 as a result of the collaborative efforts of fellow UNCG Alumni. After winning numerousdesign excellences awards in school, Flux 35 emerged from a collective of pre-existing friendship of talented designers.
Following the completion of multiple successful interior design projects together in school, Flux’s partners Dasso,Willis, and Linn decided to form a firm. What followed was innovative projects that caught the eye of the public worldwide. Marketing promotion has been driven by word of mouth promotion, as well as the reputation earned via positive press.

8/6/2019 flux35bookv2_2May2011
http://slidepdf.com/reader/full/flux35bookv22may2011 5/40
business
Flux 35 is in the business of designing buildings, interiors, and everything that falls under the category of builtenvironment. After 10 years of successful practice, the firm is in a mature, yet ever evolving state of development.Flux 35’s uniqueness stems from its innovation and design prowess. The firm’s current proprietary rights are ourintellectual property, relative to our designs previously created, as well as currently evolving projects.
venture description
venture organisationFlux Thirty-five is an Architecture and Interior Architectural Design Firm established as a PA, (professionalassociation). Principal designers are: Brittany Dasso, Tiffany Garber, Kurt Huizenga, Jeff Linn, and Kristen Willis.
Principal’s biographies and credentials are as follows:
Brittany Dasso principal
Brittany Dassograduated from UNCG with a degree in Interior Architecture in 2012. Sheis a partner in the firm FLUX 35. When working on the project for Stockholm, Sweden sheprimarily focused on model making and form making. She worked in furniture and product
design, and also focused on residential interior design. She has a focus on sustainability andbiomimicry.
Tiffany Garber partner
Tiffany Garber has 10+ years of professional experience in the design field. Starting as a college graduate from the University of North Carolina at Greensboro in Interior
Architecture. From there she went straight into Haute Design located in Charleston, SC.Over the course of her next 3 years there she had much experience working with not only residential interior design, but commercial including small local banks, health care and retaildesign. She also specialized in hospitality design during her time there. After leaving HauteDesign she transferred to Archer and Buchanan Architecture Firm where she worked forthe next 5 years on many Historical preservation projects for private residences as well as
commercial work on higher education projects and continued her specialty in hospitality design. During her time at Archer and Buchanan she received her NCIDQ as well as LEED accreditation. She has now been at Flux 35 for thepast 2 years and has continued to show exceptional work for our team in not only her specialty of hospitality design,but all over the spectrum as well.
Kurt Huizenga partner
Kurt Huizenga specializes in GSA projects and has been a practicing architect for the pastten years. He has been a member of the Flux 35 team heading up the GSA division for thepast two. Previously working for the Bjarke Ingels Group, he was a principal member of their team developing experimental architectural solutions for environmental design. Thisexperience allows him to bring a new, innovative approach to GSA services and is reshaping the direction of Flux 35’s sustainability programs. Kurt graduated from the University of North Carolina at Greensboro in 2011 with an undergraduate degree in interior architecture,
and has continued his education at The Catholic University of America earning masters degrees in architecture andurban planning in 2016.

8/6/2019 flux35bookv2_2May2011
http://slidepdf.com/reader/full/flux35bookv22may2011 6/40
6 business
Jeff Linn principal
With 15 years of practice, Principal Jeff Linn brings award winning ideas to Flux 35.Inspired by the natural world and how humans relate to it, Linn has an eye for innovation.Blurring the boundaries between interior and exterior, and daring to question the statusquo, Linn’s work for Flux 35 is driven by his ability to build on precedents set by the pastin order to design for the future. Linn has dedicated his work with the Flux 35 designteam to creating iconic monuments of architecture that stand the test of time.
Kristen Willis principal
Kristen Willis received her Bachelor’s Degree in Interior Design from UNCG where she graduated Magna Cum Laude. As an undergrad, she served on the Interior ArchitectureProfessional Advisory Board [1999-2003] She then went on to receive her Master’s in
Architecture at NC State University. Upon graduation, she was offered a job at HMC
Architects in Los Angeles, CA where she worked for 5 years. In her last two year’s at thefirm she served as a project manager of the interiors studios. In 2007 she was awardedDesigner of the Year when she entered into and won the Mecklenburg Pro-DesignCompetition amongst 500 other talented designers. In 2008, she received the National
Interior Design Award for “exceptional and exemplary work in interior design.” She is currently a practicing interior designer at architectural/interior design firm FLUX35 in, Greensboro, NC where she is one of 4 principals.She has adapted to many aspects of design as her range of expertise varies from interiors to landscapes. She is a member of AIA, ASID, IIDA, and is LEED Accredited.
Key support groups for the Flux 35 design team include the following Junior Designers: Charese Allen, Young Moon, Katie O’Boyle, Tristan Olarti, and Brittany Styles.
Marketing and branding services for Flux 35 are handled exclusively by global firm, EYE ARC 451. Accountmanagers and creative directors for Eye Arc 451 include: Michelle Bodon, Brianna Cerame, Hannah Daugherty,Kevin Lahti, Alyssa Thrower, and Missy Wicker.

8/6/2019 flux35bookv2_2May2011
http://slidepdf.com/reader/full/flux35bookv22may2011 7/40
business
Market competition analysis - see attached US MARKET RESEARCH document.
Major competitors include but are not limited to: Tertia Design Studios, Trace Ink, Helix Design, as well as a variety of other firms from Austria, Denmark and the United Kingdom. Some of these firm’s strengths come fromtheir background in interiors as well as their global perspective of design. Flux 35 distinguishes itself from the
competition via its innovative approaches to merging interior and exterior environments.
Flux 35 operates on an annual budget of $500,000. Ten percent of annual gross profits are dedicated toreinvestment in bidding on new projects, marketing and promotional opportunities, as well as market research anddevelopment.
Within the next three years, we expect to reach $102,000 on the first year and increase to $500,000 by the third year of operation. We will be profitable within three years of starting. The most significant challenges ahead include securing a suitable location, establishing the initial client base, andultimately positioning the firm to be able to have a presence in a larger, global market.
This business plan outlines the objective, focus, and implementation of this start-up firm.
venture market
venture operations
Flux 35’s startup costs were initially financed by each of the firm’s founding principals in 2001 when the firm wascreated. The five founding partners each brought an equal investment of $100,000 to finance the company’s firstthree years of operation. Since the start-up costs have been recovered, Flux 35 operates on a 6 equal shareholdermodel for any annual net profits. Each partner receives a full share, while the remaining sixth share is dividedamong the firm’s junior designers on a seniority basis.
Architectural Services Industry Analysis - see attached INDUSTRY FINANCIAL DOCUMENT.
venture nancing

8/6/2019 flux35bookv2_2May2011
http://slidepdf.com/reader/full/flux35bookv22may2011 8/40

8/6/2019 flux35bookv2_2May2011
http://slidepdf.com/reader/full/flux35bookv22may2011 9/40
flux
Industry Financial Prole

8/6/2019 flux35bookv2_2May2011
http://slidepdf.com/reader/full/flux35bookv22may2011 10/40

8/6/2019 flux35bookv2_2May2011
http://slidepdf.com/reader/full/flux35bookv22may2011 11/40
1business
Income and Expense- Prot and Loss ($)
2005 2006 2007 2008 2009 QII-10
Business Revenue 4,544,386 4,676,372 4,766,174 4,728,041 4,861,270 4,912,175
Cost of Sales 1,556,907 1,506,727 1,546,147 1,596,659 1,756,377 1,794,418
Gross Margin 2,987,479 3,169,645 3,220,027 3,131,382 3,104,893 3,117,757
Officers Comp 239,489 222,128 219,721 217,963 183,756 187,645
Salary-Wages 1,019,306 1,134,488 1,153,414 1,075,157 1,084,063 1,109,660
Rent 121,790 106,154 102,949 93,142 87,989 89,893
Taxes Paid 179,958 183,781 181,115 181,557 166,255 169,961
Advertising 18,632 21,511 23,831 32,151 25,279 26,03
Benefits-Pensions 135,877 131,874 139,649 139,477 143,407 146,874
Repairs 14,088 15,432 15,252 15,130 17,501 17,684
Bad Debt 10,907 8,417 6,673 8,510 6,806 6,877Other SG&A Exp. 867,523 858,582 960,861 969,248 951,837 972,119
EBITDA 379,909 487,278 416,562 399,047 438,000 391,009
Amort-Deprec-Depl 152,237 138,888 111,052 95,979 99,656 101,682
Operating Expenses 2,759,807 2,821,255 2,914,517 2,828,314 2,766,549 2,828,430
Operating Income 227,672 348,390 305,510 303,068 338,344 289,327
Interest Income 28,175 35,073 34,793 26,477 17,014 5,403
Interest Expense 51,806 62,196 59,577 87,942 80,697 39,789
Other Income 127,697 107,089 161,573 82,268 147,296 187,645
Pre-Tax Net Profit 331,738 428,356 442,299 323,871 421,957 442,586Income Tax 112,628 145,641 150,382 109,560 143,465 150,479
After Tax Net Profit 219,110 282,715 291,917 214,311 278,492 292,107

8/6/2019 flux35bookv2_2May2011
http://slidepdf.com/reader/full/flux35bookv22may2011 12/40
12 business
Income and Expense- Prot and Loss %
2005 2006 2007 2008 2009 QII-10
Business Revenue 100.0% 100.0% 100.0% 100.0% 100.0% 100.0%
Cost of Sales 34.26% 32.22% 32.44% 33.77% 36.13% 36.53%
Gross Margin 65.74% 67.78% 67.56% 66.23% 63.87% 63.47%
Officers Comp 5.27% 4.75% 4.61% 4.61% 3.78% 3.82%
Salary-Wages 22.43% 24.26% 24.20% 22.74% 22.30% 22.59%
Rent 2.68% 2.27% 2.16% 1.97% 1.81% 1.83%
Taxes Paid 3.96% 3.93% 3.80% 3.84% 3.42% 3.46%
Advertising 0.41% 0.46% 0.50% 0.68% 0.52% 0.53%
Benefits-Pensions 2.99% 2.82% 2.93% 2.95% 2.95% 2.99%
Repairs 0.31% 0.33% 0.32% 0.32% 0.36% 0.36%
Bad Debt 0.24% 0.18% 0.14% 0.18% 0.14% 0.14%Other SG&A Exp. 19.09% 18.36% 20.16% 20.50% 19.58% 19.79%
EBITDA 8.37% 10.41% 8.73% 8.44% 9.01% 7.97%
Amort-Deprec-Depl 3.35% 2.97% 2.33% 2.03% 2.05% 2.07%
Operating Expenses 60.73% 60.33% 61.15% 59.82% 56.91% 57.58%
Operating Income 5.01% 7.45% 6.41% 6.41% 6.96% 5.89%
Interest Income 0.62% 0.75% 0.73% 0.56% 0.35% 0.11%
Interest Expense 1.14% 1.33% 1.25% 1.86% 1.66% 0.81%
Other Income 2.81% 2.29% 3.39% 1.74% 3.03% 3.82%
Pre-Tax Net Profit 7.30% 9.16% 9.28% 6.85% 8.68% 9.01%Income Tax 2.48% 3.11% 3.16% 2.32% 2.95% 3.06%
After Tax Net Profit 4.82% 6.05% 6.12% 4.53% 5.73% 5.95%
Business Revenue
Includes receipts from core business operations. Interest Income and Other income (such as rents and royalties) are generally detailed separately below Operating Income. While Business Revenue is separated from Interest Income formost classifications,Business Revenue includes interest income from the private sector where it is central to financial industry operations,including Depository Institutions (60xx); Non-Depository Credit Institutions (61xx); Holding and Other Investment Offices (67xx except6794).
Cost of Sales
Includes materials and labor involved in the direct delivery of a product or service. Other costs are included in the costof salesto the extent that they are involved in bringing goods to their location and condition ready to be sold. Non-production
8/6/2019 flux35bookv2_2May2011
http://slidepdf.com/reader/full/flux35bookv22may2011 13/40
1business
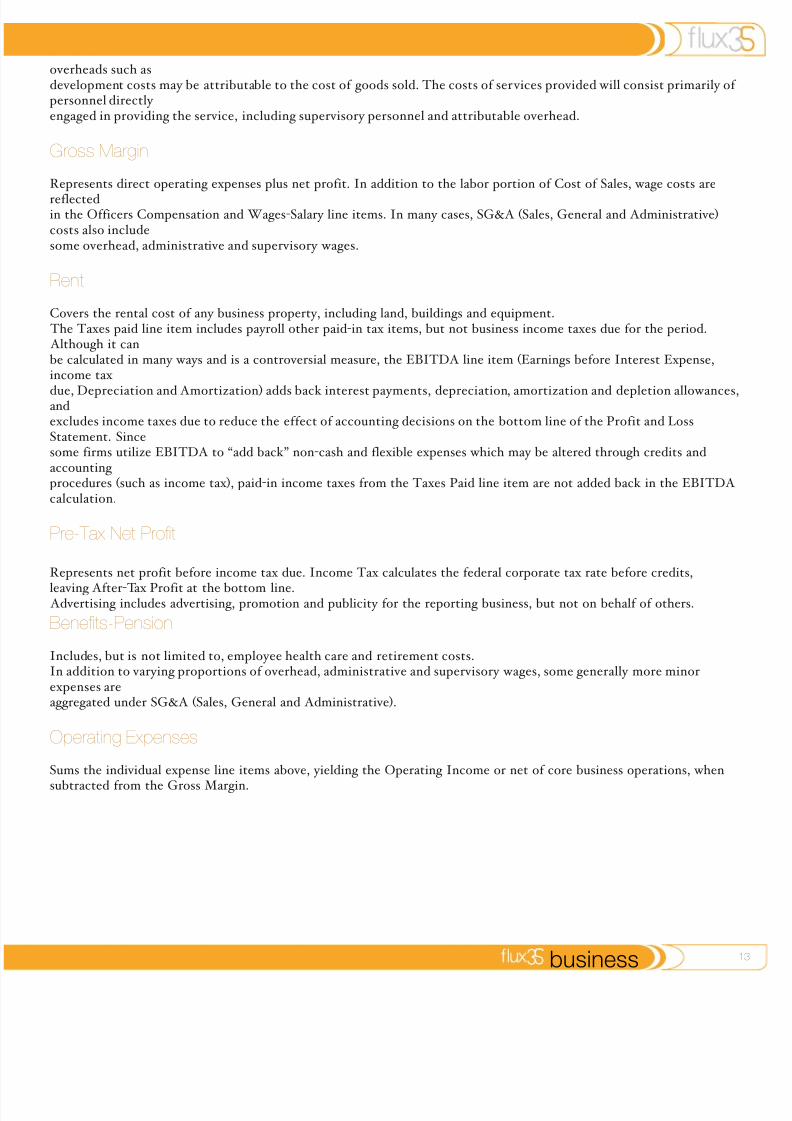
overheads such asdevelopment costs may be attributable to the cost of goods sold. The costs of services provided will consist primarily of personnel directly engaged in providing the service, including supervisory personnel and attributable overhead.
Gross Margin
Represents direct operating expenses plus net profit. In addition to the labor portion of Cost of Sales, wage costs are
reflectedin the Officers Compensation and Wages-Salary line items. In many cases, SG&A (Sales, General and Administrative)costs also includesome overhead, administrative and supervisory wages.
Rent
Covers the rental cost of any business property, including land, buildings and equipment. The Taxes paid line item includes payroll other paid-in tax items, but not business income taxes due for the period. Although it canbe calculated in many ways and is a controversial measure, the EBITDA line item (Earnings before Interest Expense,income tax
due, Depreciation and Amortization) adds back interest payments, depreciation, amortization and depletion allowances,andexcludes income taxes due to reduce the effect of accounting decisions on the bottom line of the Profit and LossStatement. Sincesome firms utilize EBITDA to “add back” non-cash and flexible expenses which may be altered through credits andaccounting procedures (such as income tax), paid-in income taxes from the Taxes Paid line item are not added back in the EBITDAcalculation.
Pre-Tax Net Proft
Represents net profit before income tax due. Income Tax calculates the federal corporate tax rate before credits,
leaving After-Tax Profit at the bottom line. Advertising includes advertising, promotion and publicity for the reporting business, but not on behalf of others.
Benefts-Pension
Includes, but is not limited to, employee health care and retirement costs.In addition to varying proportions of overhead, administrative and supervisory wages, some generally more minorexpenses areaggregated under SG&A (Sales, General and Administrative).
Operating Expenses
Sums the individual expense line items above, yielding the Operating Income or net of core business operations, when
subtracted from the Gross Margin.

8/6/2019 flux35bookv2_2May2011
http://slidepdf.com/reader/full/flux35bookv22may2011 14/40
14 business
Balance Sheet - dollar-based
Assets 2005 2006 2007 2008 2009 QII-10
Cash 451,806 524,875 530,411 494,350 635,224 572,169
Receivables 1,058,902 881,186 972,126 1,151,078 1,155,231 1,211,020Inventory 44,630 36,619 36,956 44,022 44,247 41,299
Other Current Assets
194,112 200,824 271,365 254,753 344,773 305,014
Total Current Assets
1,749,450 1,643,504 1,810,858 1,944,203 2,179,475 2,129,502
Gross Fixed Assets
1,222,879 1 ,217,316 1 ,551,637 1 ,422,388 1 ,915,530 1,893,971
AccumulatedDepreciation-
Amortization-
Depl
535,868 501,248 481,542 434,619 527,465 522,593
Net Fixed Assets
686,880 716,109 1,069,972 987,617 1,387,855 1,371,378
Other Non-Current Assets
620,547 546,672 638,816 676,574 813,524 801,145
Total Assets 3,056,877 2,906,285 3,519,646 3,608,394 4,380,854 4,302,025
Liabilities
AccountsPayable
306,910 206,637 247,431 315,734 1,041,767 424,610
Loans/NotesPayable 382,415 146,767 120,020 267,382 38,113 144,548
Other CurrentLiabilities
457,920 524,875 573,350 496,515 617,262 644,013
Total CurrentLiabilities
1,147,245 878,279 940,801 1 ,079,631 1 ,697,142 1 ,213,171
Total Long TermLiabilities
552,378 549,288 902,085 877,201 1,323,456 1,209,299
TotalLiabilities
1,699,623 1 ,427,567 1 ,842,886 1,956,832 3 ,020,598 2,422,470
Net Worth 1,357,254 1,478,718 1,676,760 1,651,562 1,360,256 1,879,555
TotalLiabilities &Net Worth
3,056,877 2,906,285 3,519,646 3,608,394 4,380,854 4,302,025
CashMoney on hand in checking, savings or redeemable certificate accounts.

8/6/2019 flux35bookv2_2May2011
http://slidepdf.com/reader/full/flux35bookv22may2011 15/40
1business
Receivables
A short-term asset (to be collected within one year) in the form of accounts or notes receivable, and usually representing a credit for a completed sale or loan.
Inventory
The stockpile of unsold products.
Current Assets
The sum of a firm’s cash, accounts and notes receivable, inventory, prepaid expenses and marketable securities which canbe converted to cash within a single operating cycle.
Fixed Assets
Long-term assets such as building and machinery, net of accumulated amortization-depreciation-depletion.
Total Assets
The sum of current assets and fixed assets such as plant and equipment.
Accounts Payable
Invoices due to suppliers within the current business cycle.
Loans/Notes Payable
Loan amounts due to suppliers within the current business cycle.
Current LiabilitiesMeasurable debt owed within one year, including accounts, loans and notes payable, accrued liabilities and taxes due.
Long Term Liabilities
Debt which is due in more than one year, including the portion of loans and mortgages that become due after thecurrent business cycle.
Total Liabilities
Current Liabilities plus Long Term Liabilities such as notes and mortgages due over more than one year.
Net Worth: Current assets plus fixed assets minus current and long-term liabilities.

8/6/2019 flux35bookv2_2May2011
http://slidepdf.com/reader/full/flux35bookv22may2011 16/40
16 business
Balance Sheet - percentage-based
Assets 2005 2006 2007 2008 2009 QII
Cash 14.78% 18.06% 15.07% 13.70% 14.50% 13.30%
Receivables 34.64% 30.32% 27.62% 31.90% 26.37% 28.15%Inventory 1.46% 1.26% 1.05% 1.22% 1.01% 0.96%
Other Current Assets
6.35% 6.91% 7.71% 7.06% 7.87% 7.09%
Total Current Assets
57.23% 56.55% 51.45% 53.88% 49.75% 49.50%
Gross Fixed Assets
40.00% 41.89% 44.09% 39.42% 43.73% 44.03%
AccumulatedDepreciation-
Amortization-Depletion
17.53% 17.25% 13.68% 12.04% 12.04% 12.15%
Net Fixed Assets
22.47% 24.64% 30.40% 27.37% 31.68% 31.88%
Other Non-Current Assets
20.30% 18.81% 18.15% 18.75% 18.57% 18.62%
Total Assets 100.00% 100.00% 100.00% 100.00% 100.00% 100.00%
Liabilities
AccountsPayable
10.04% 7.11% 7.03% 8.75% 23.78% 9.87%
Loans/NotesPayable
12.51% 5.05% 3.41% 7.41% 0.87% 3.36%
Other CurrentLiabilities
14.98% 18.06% 16.29% 13.76% 14.09% 14.97%
Total CurrentLiabilities
37.53% 30.22% 26.73% 29.92% 38.74% 28.20%
Total Long TermLiabilities
18.07% 18.90% 25.63% 24.31% 30.21% 28.11%
TotalLiabilities
55.60% 49.12% 52.36% 54.23% 68.95% 56.31%
Net Worth 44.40% 50.88% 47.64% 45.77% 31.05% 43.69% TotalLiabilities &Net Worth
100.00% 100.00% 100.00% 100.00% 100.00% 100.00%

8/6/2019 flux35bookv2_2May2011
http://slidepdf.com/reader/full/flux35bookv22may2011 17/40
1business
The Balance Sheet reflects average balance sheet percentages and dollars for the industry segment analyzed. Liabilities,net worth and ratiosare calculated for each industry segment and class, while asset line items are blended with the closest four digit industry segment.
Sources & Uses of Funds
Change in: 2006 2007 2008 2009 Jan 2010-June2010
Cash and cashequivalents
73,069 5,536 -36,061 140,874 -63,055
Worksheet:
Accountsreceivable
177,716 -90,940 -178,952 -4,153 -55,789
Inventory 8,011 -337 -7,066 -225 2,948
Other Curr Assets -6,712 -70,541 16,612 -90,020 39,759
Net Fixed Assets -29,229 -353,863 82,355 -400,238 16,688
Other Non-Curr Assets
73,875 -92,144 -37,758 -136,950 12,168
Accounts payable -98,745 40,504 68,303 726,754 -618,909
Loans/NotesPayable
-233,814 -27,038 147,362 -228,547 106,435
Other CurrentLiabilities
69,400 47,894 -76,835 121,830 25,436
Long-term debt -338 351,925 -24,532 448,420 -116,786
Net Worth 112,905 200,076 -25,550 -295,997 524,995
Total Sources &Uses
73,069 5,536 -36,061 140,874 -63,055
Cash: Beginning period
451,806 524,875 530,411 494,350 635,224
Cash: End period 524,875 530,411 494,350 635,224 572,169
Change in Cash &Cash equivalents
73,069 5,536 -36,061 140,874 -63,055
Sources and Uses
The Sources and Uses of Funds table tests the accuracy of the balance sheet and distinguishes the sources of funds from their use. It is the basic worksheet preliminary to a formal cash flow statement examining the liquidity of a business. A multi-year industry benchmark common size balance sheet, which includes overlapped but not identical setsof firms in each year, is not well-suited for the presentation of a formal cash flow analysis.
8/6/2019 flux35bookv2_2May2011
http://slidepdf.com/reader/full/flux35bookv22may2011 18/40
18 business
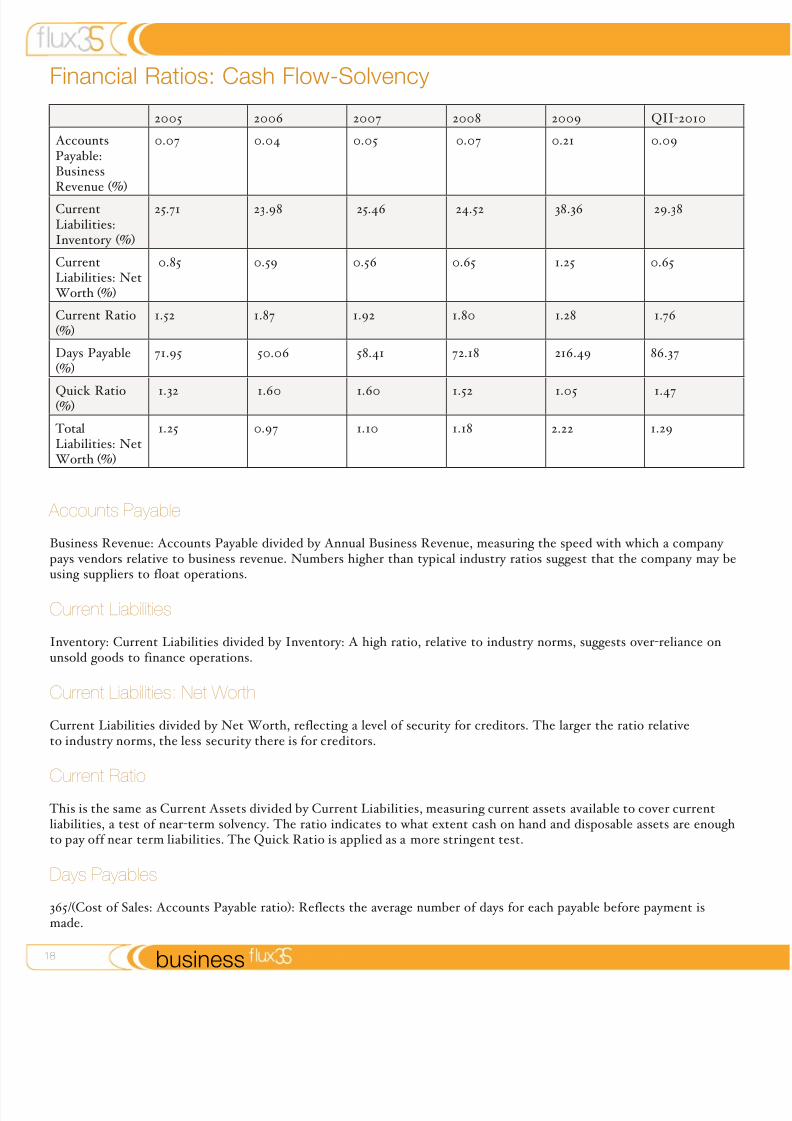
Financial Ratios: Cash Flow-Solvency
2005 2006 2007 2008 2009 QII-2010
AccountsPayable:BusinessRevenue (%)
0.07 0.04 0.05 0.07 0.21 0.09
CurrentLiabilities:Inventory (%)
25.71 23.98 25.46 24.52 38.36 29.38
CurrentLiabilities: NetWorth (%)
0.85 0.59 0.56 0.65 1.25 0.65
Current Ratio(%)
1.52 1.87 1.92 1.80 1.28 1.76
Days Payable(%)
71.95 50.06 58.41 72.18 216.49 86.37
Quick Ratio(%)
1.32 1.60 1.60 1.52 1.05 1.47
TotalLiabilities: NetWorth (%)
1.25 0.97 1.10 1.18 2.22 1.29
Accounts Payable
Business Revenue: Accounts Payable divided by Annual Business Revenue, measuring the speed with which a company pays vendors relative to business revenue. Numbers higher than typical industry ratios suggest that the company may beusing suppliers to float operations.
Current Liabilities
Inventory: Current Liabilities divided by Inventory: A high ratio, relative to industry norms, suggests over-reliance onunsold goods to finance operations.
Current Liabilities: Net Worth
Current Liabilities divided by Net Worth, reflecting a level of security for creditors. The larger the ratio relativeto industry norms, the less security there is for creditors.
Current Ratio
This is the same as Current Assets divided by Current Liabilities, measuring current assets available to cover currentliabilities, a test of near-term solvency. The ratio indicates to what extent cash on hand and disposable assets are enoughto pay off near term liabilities. The Quick Ratio is applied as a more stringent test.
Days Payables
365/(Cost of Sales: Accounts Payable ratio): Reflects the average number of days for each payable before payment ismade.
8/6/2019 flux35bookv2_2May2011
http://slidepdf.com/reader/full/flux35bookv22may2011 19/40
1business
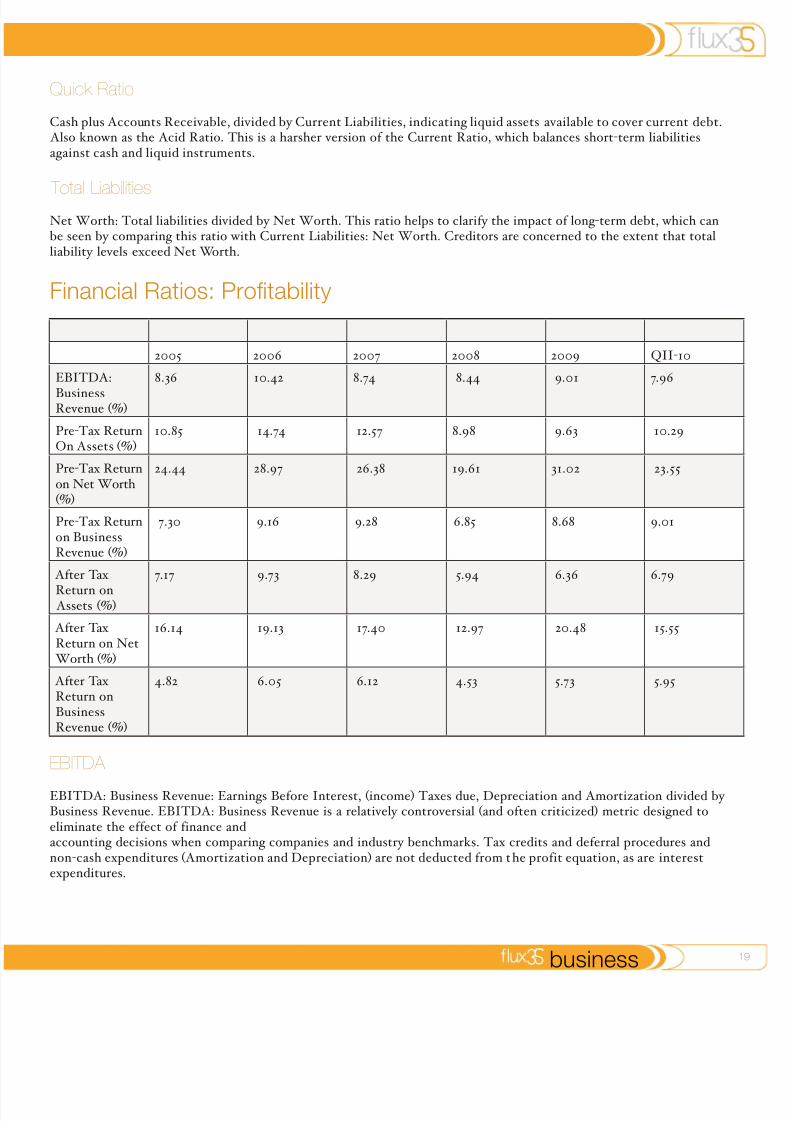
Quick Ratio
Cash plus Accounts Receivable, divided by Current Liabilities, indicating liquid assets available to cover current debt. Also known as the Acid Ratio. This is a harsher version of the Current Ratio, which balances short-term liabilitiesagainst cash and liquid instruments.
Total LiabilitiesNet Worth: Total liabilities divided by Net Worth. This ratio helps to clarify the impact of long-term debt, which canbe seen by comparing this ratio with Current Liabilities: Net Worth. Creditors are concerned to the extent that totalliability levels exceed Net Worth.
Financial Ratios: Protability
2005 2006 2007 2008 2009 QII-10
EBITDA:
BusinessRevenue (%)
8.36 10.42 8.74 8.44 9.01 7.96
Pre-Tax ReturnOn Assets (%)
10.85 14.74 12.57 8.98 9.63 10.29
Pre-Tax Returnon Net Worth(%)
24.44 28.97 26.38 19.61 31.02 23.55
Pre-Tax Returnon BusinessRevenue (%)
7.30 9.16 9.28 6.85 8.68 9.01
After Tax
Return on Assets (%)
7.17 9.73 8.29 5.94 6.36 6.79
After Tax Return on NetWorth (%)
16.14 19.13 17.40 12.97 20.48 15.55
After Tax Return onBusinessRevenue (%)
4.82 6.05 6.12 4.53 5.73 5.95
EBITDA
EBITDA: Business Revenue: Earnings Before Interest, (income) Taxes due, Depreciation and Amortization divided by Business Revenue. EBITDA: Business Revenue is a relatively controversial (and often criticized) metric designed toeliminate the effect of finance andaccounting decisions when comparing companies and industry benchmarks. Tax credits and deferral procedures andnon-cash expenditures (Amortization and Depreciation) are not deducted from the profit equation, as are interestexpenditures.

8/6/2019 flux35bookv2_2May2011
http://slidepdf.com/reader/full/flux35bookv22may2011 20/40
20 business
Return on Assets
Pre-Tax or After Tax Net Profit divided by Total Assets, a critical indicator of profitability. Companies which usetheir assets efficiently will tend to show a ratio higher than the industry norm. The ratio may appear higher for smallbusinesses due to owner compensation draws accounted as net profit.
Return on Net WorthPre-Tax or After Tax Net Profit divided by Net Worth. This is the ‘final measure’ of profitabi lity to evaluate overallreturn. This ratio measures return relative to investment, how well a company leverages the investment in it. May appearhigher for small businesses due to owner compensation draws accounted as net profit.
Return on Business Revenue
Pre-Tax or After Tax Net Profit Net Profit divided by Annual Business Revenue, indicating the level of profit from eachdollar of business revenue. This ratio can be used as a predictor of the company’s ability to withstand changes in pricesor market conditions. May appear higher for small businesses due to owner compensation draws accounted as net profit.
Financial Ratios: Efciency-Debt-Risk
2005 2006 2007 2008 2009 QII-10
Assets:BusinessRevenue
0.67 0.62 0.74 0.76 0.90 0.88
Cost of Sales: AccountsPayable
5.07 7.29 6.25 5.06 1.69 4.23
Cost of Sales:Inventory
34.88 41.15 41.84 36.27 39.69 43.45
Days Inventory 10.46 8.87 8.72 10.06 9.20 8.40
DaysReceivables
85.05 68.78 74.45 88.86 86.74 89.99
Days Working Capital
48.37 59.73 66.63 66.74 36.22 68.09
EBITDA:InterestExpense
7.33 7.83 6.99 4.54 5.43 9.83
Fixed Assets:Net Worth
0.51 0.48 0.64 0.60 1.02 0.73
Gross Margin:Business
Revenue
0.66 0.68 0.68 0.66 0.64 0.63
Net Working Capital:BusinessRevenue
0.13 0.16 0.18 0.18 0.10 0.19

8/6/2019 flux35bookv2_2May2011
http://slidepdf.com/reader/full/flux35bookv22may2011 21/40
2business
Assets:Business Revenue
Total Assets divided by Net Business Revenue, indicating whether a company is handling too high a volume of businessrevenue in relation to investment. Very low percentages relative to industry norms might indicate overly conservativesales efforts or poor sales management.
Cost of Sales
Accounts Payable: Measures the number of times payables turn over in the course of the year. High measures may indicate cash flow concerns. Cost of Sales: Inventory: Reflects the number of times inventory is turned over during thecourse of the year. High levels can mean good liquidity or business revenue, or shortages requiring better management.Low levels may indicate poor cash flow or overstocking.
Days Inventory
365/(Cost of Sales: Inventory): The average number of days of items in inventory.
Days Receivables
365/ (Receivables Turnover): Reflects the number of days that receivables are outstanding. Target average or lower.
Days Working Capital
365/ (Working Capital Turnover): Expresses the coverage in number of days of available working capital.
EBITDA: interest expense
Earnings before Interest, (income) Taxes due, Depreciation and Amortization divided by Interest expense. Assessesfinancial stability by examining whether a company is at least profitable enough to pay interest expense. A ratio >1.00indicates it is.See cautions in the listing for EBITDA.
Fixed Assets: Net Worth
Fixed Assets divided by Net Worth. High ratios relative to the industry can indicate low working capital or high levels of debt.
Gross Margin: Business Revenue
Pre-tax profits divided by Annual Business Revenue. This is the profit ratio before product and business revenue costs,
as well as taxes. This ratio can indicate the “play” in other expenses which could be adjusted to increase the Net Profitmargin.
Net Working Capital
Business Revenue: Net Working Capital divided by Business Revenue. Indicates if a company is maintaining a reasonablelevel of liquidity relative to its business revenue volume. A high ratio indicate an overly conservative reliance on liquidassets, while low ratios suggests the opposite.
8/6/2019 flux35bookv2_2May2011
http://slidepdf.com/reader/full/flux35bookv22may2011 22/40
22 business
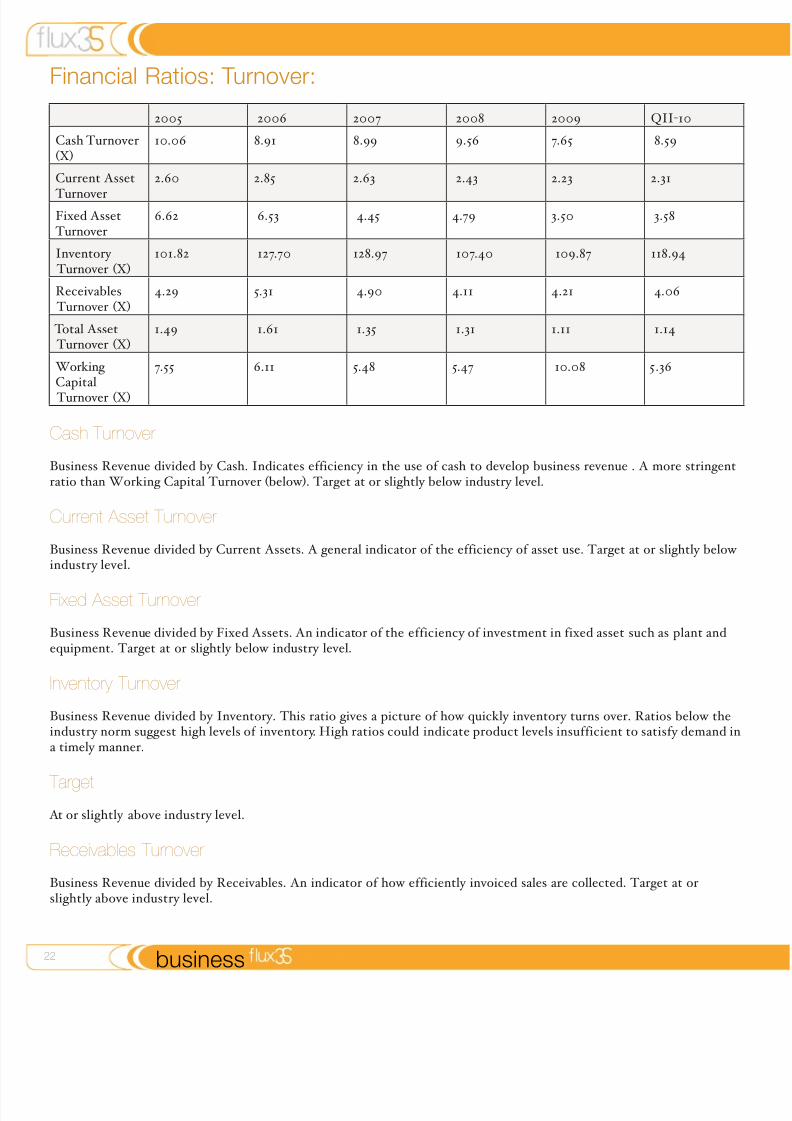
Financial Ratios: Turnover:
2005 2006 2007 2008 2009 QII-10
Cash Turnover(X)
10.06 8.91 8.99 9.56 7.65 8.59
Current Asset
Turnover
2.60 2.85 2.63 2.43 2.23 2.31
Fixed Asset Turnover
6.62 6.53 4.45 4.79 3.50 3.58
Inventory Turnover (X)
101.82 127.70 128.97 107.40 109.87 118.94
Receivables Turnover (X)
4.29 5.31 4.90 4.11 4.21 4.06
Total Asset Turnover (X)
1.49 1.61 1.35 1.31 1.11 1.14
Working Capital
Turnover (X)
7.55 6.11 5.48 5.47 10.08 5.36
Cash Turnover
Business Revenue divided by Cash. Indicates efficiency in the use of cash to develop business revenue . A more stringentratio than Working Capital Turnover (below). Target at or slightly below industry level.
Current Asset Turnover
Business Revenue divided by Current Assets. A general indicator of the efficiency of asset use. Target at or slightly below industry level.
Fixed Asset Turnover
Business Revenue divided by Fixed Assets. An indicator of the efficiency of investment in fixed asset such as plant andequipment. Target at or slightly below industry level.
Inventory Turnover
Business Revenue divided by Inventory. This ratio gives a picture of how quickly inventory turns over. Ratios below theindustry norm suggest high levels of inventory. High ratios could indicate product levels insufficient to satisfy demand ina timely manner.
Target At or slightly above industry level.
Receivables Turnover
Business Revenue divided by Receivables. An indicator of how efficiently invoiced sales are collected. Target at orslightly above industry level.

8/6/2019 flux35bookv2_2May2011
http://slidepdf.com/reader/full/flux35bookv22may2011 23/40
2business
Total Asset Turnover
Business Revenue divided by Total Assets. Target: at or slightly below industry level.
Working Capital Turnover
Business Revenue divided by Net Working Capital (current assets minus current liabilities). Ratios higher than industry norms may indicate a strain on available liquid assets, while low ratios may suggest too much liquidity. Target: at or aboveindustry level.

8/6/2019 flux35bookv2_2May2011
http://slidepdf.com/reader/full/flux35bookv22may2011 24/40

8/6/2019 flux35bookv2_2May2011
http://slidepdf.com/reader/full/flux35bookv22may2011 25/40
flux
US Market Research

8/6/2019 flux35bookv2_2May2011
http://slidepdf.com/reader/full/flux35bookv22may2011 26/40
8/6/2019 flux35bookv2_2May2011
http://slidepdf.com/reader/full/flux35bookv22may2011 27/40
2business
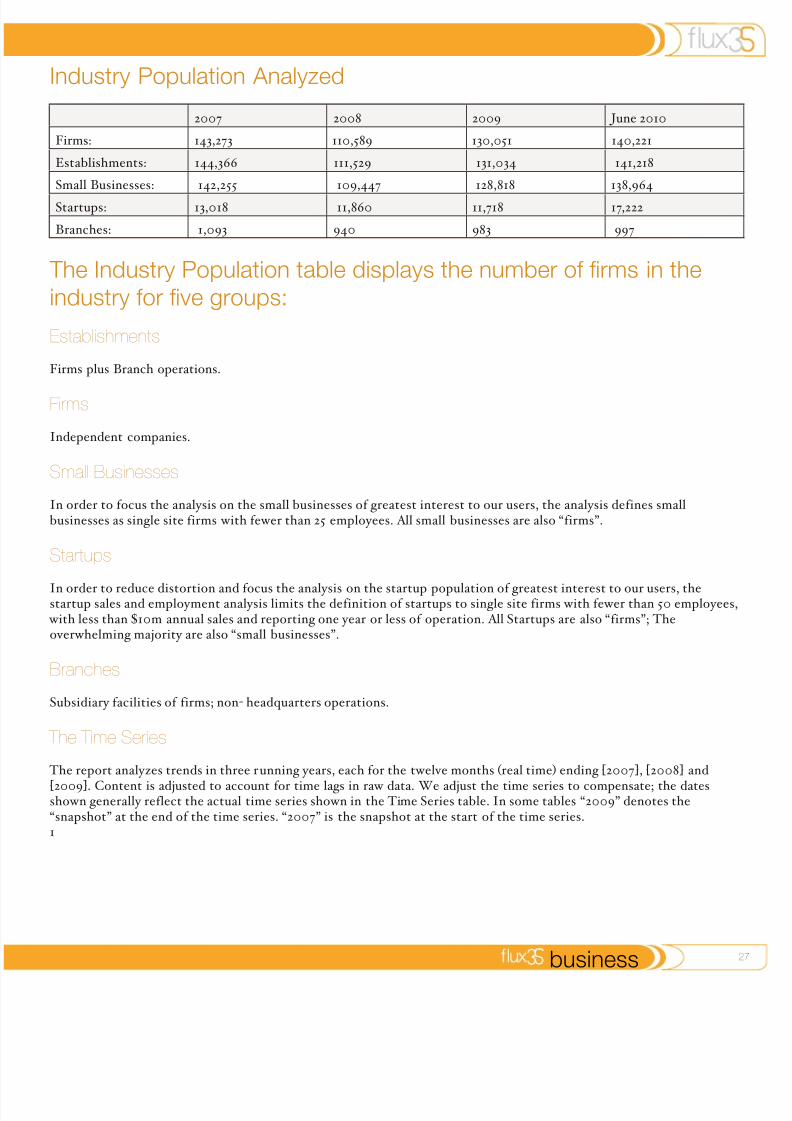
Industry Population Analyzed
2007 2008 2009 June 2010
Firms: 143,273 110,589 130,051 140,221
Establishments: 144,366 111,529 131,034 141,218
Small Businesses: 142,255 109,447 128,818 138,964
Startups: 13,018 11,860 11,718 17,222
Branches: 1,093 940 983 997
The Industry Population table displays the number of rms in theindustry for ve groups:
Establishments
Firms plus Branch operations.
Firms
Independent companies.
Small Businesses
In order to focus the analysis on the small businesses of greatest interest to our users, the analysis defines smallbusinesses as single site firms with fewer than 25 employees. All small businesses are also “firms”.
Startups
In order to reduce distortion and focus the analysis on the startup population of greatest interest to our users, thestartup sales and employment analysis limits the definition of startups to single site firms with fewer than 50 employees,
with less than $10m annual sales and reporting one year or less of operation. All Startups are also “firms”; Theoverwhelming majority are also “small businesses”.
Branches
Subsidiary facilities of firms; non- headquarters operations.
The Time Series
The report analyzes trends in three running years, each for the twelve months (real time) ending [2007], [2008] and
[2009]. Content is adjusted to account for time lags in raw data. We adjust the time series to compensate; the datesshown generally reflect the actual time series shown in the Time Series table. In some tables “2009” denotes the“snapshot” at the end of the time series. “2007” is the snapshot at the start of the time series.1
8/6/2019 flux35bookv2_2May2011
http://slidepdf.com/reader/full/flux35bookv22may2011 28/40
28 business
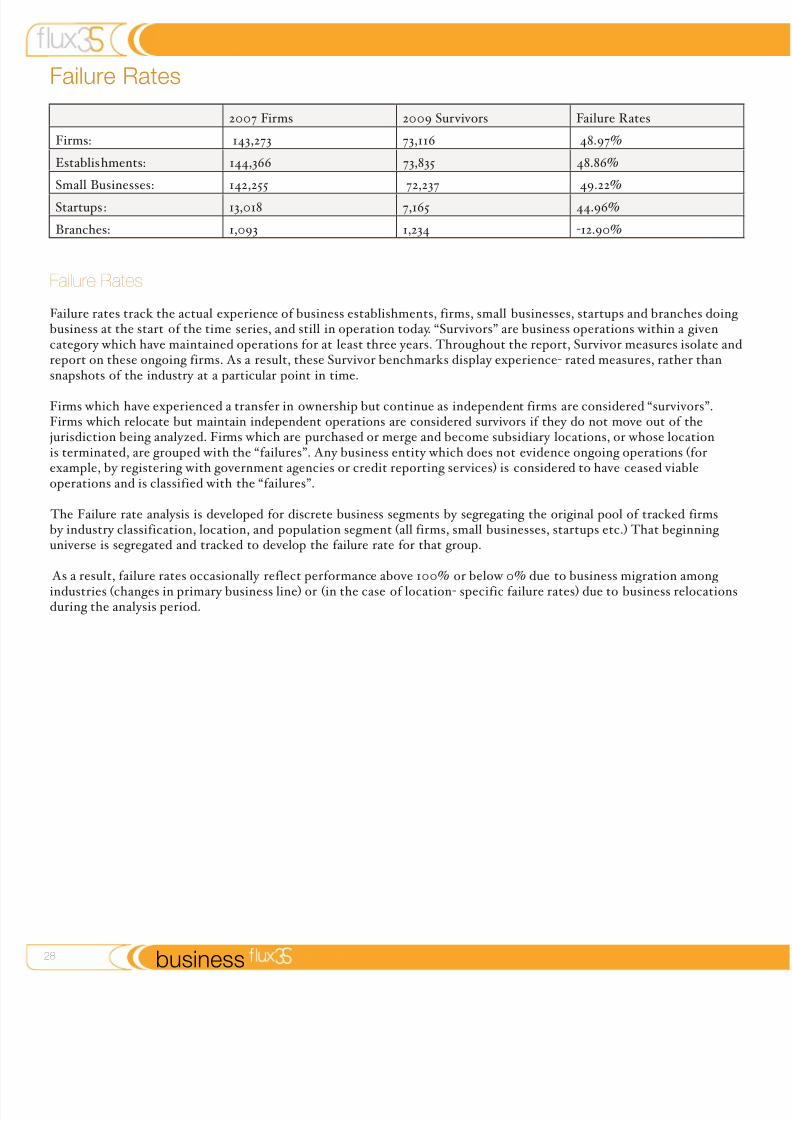
Failure Rates
2007 Firms 2009 Survivors Failure Rates
Firms: 143,273 73,116 48.97%
Establishments: 144,366 73,835 48.86%
Small Businesses: 142,255 72,237 49.22%
Startups: 13,018 7,165 44.96%
Branches: 1,093 1,234 -12.90%
Failure Rates
Failure rates track the actual experience of business establishments, firms, small businesses, startups and branches doing business at the start of the time series, and still in operation today. “Survivors” are business operations within a givencategory which have maintained operations for at least three years. Throughout the report, Survivor measures isolate andreport on these ongoing firms. As a result, these Survivor benchmarks display experience- rated measures, rather thansnapshots of the industry at a particular point in time.
Firms which have experienced a transfer in ownership but continue as independent firms are considered “survivors”.Firms which relocate but maintain independent operations are considered survivors if they do not move out of thejurisdiction being analyzed. Firms which are purchased or merge and become subsidiary locations, or whose locationis terminated, are grouped with the “failures”. Any business entity which does not evidence ongoing operations (forexample, by registering with government agencies or credit reporting services) is considered to have ceased viableoperations and is classified with the “failures”.
The Failure rate analysis is developed for discrete business segments by segregating the original pool of tracked firmsby industry classification, location, and population segment (all firms, small businesses, startups etc.) That beginning universe is segregated and tracked to develop the failure rate for that group.
As a result, failure rates occasionally reflect performance above 100% or below 0% due to business migration among
industries (changes in primary business line) or (in the case of location- specific failure rates) due to business relocationsduring the analysis period.

8/6/2019 flux35bookv2_2May2011
http://slidepdf.com/reader/full/flux35bookv22may2011 29/40
2business
Industry Market Volume, Average Sales and Sales Class Trends
QII-10 data refers to the 12- months ending June 30.
Annual Market Volume ($)
as of 2007: 26,404,765,732
2008: 22,043,769,197
2009: 25,446,894,255
June 2010: 25,484,909,253
Industry Market Volume
Reported Annual Market Volume includes industry sales figures from multi- site firms classified in the selected industry, generally including branch revenues. The Market Volume figures include sales of US firms and US- reporting subsidiariesof firms headquartered outside the US. The volume figures are for the industry (firms identifying this as their primary
classification) not the product or ser vice. As an example, a report for retail furniture stores analyzes sales of stores whosepredominant revenue stream is furniture sales; That data would not include furniture sold at a general department store,for example. Consequently, more detailed industry segments may under- report volume due to the choice of companiesto identify a higher level “parent classification as their primary line of business.
Average Annual Sales
as of Site Sales Firms Small Business Startups
2007 Avg Sales: 182,902 184,297 169,135 156,314
2008 Avg Sales: 197,651 199,331 179,512 156,231
2009 Avg Sales: 194,201 195,669 180,203 152,142Change: 6.2% 6.2% 6.5% -2.7%
June 2010: 180,465 181,748 167,296 152,834
Average Annual Sales
The Average Annual Sales table displays “snapshot” average dollar sales for all industry sites (including branches), firms,small businesses and startups in each of the three years in the time series. The Change rows express the growth ordecline of these snapshots in percentage terms. Sales will often fluctuate most radically in the startup category (bothsnapshot and survivor), in part because startup operations are less numerous and differ dramatically in size, growth and,in many cases, failure.
While there is significant overlap of firms in each category between years, results can be affected by business failures,mergers and the migration of companies between the three categories. Migration between business classifications has a much lesser impact in most cases.

8/6/2019 flux35bookv2_2May2011
http://slidepdf.com/reader/full/flux35bookv22may2011 30/40
30 business
Company Sales Class Trends
as of 2007 firms 2008 firms 2009 firms 2007 % 2008 % 2009 %
$1 - $500k 140,630 106,956 125,804 98.16% 96.71% 96.73%
$500k - $999k 1,749 2,317 2,830 1.22% 2.10% 2.18%
$1m - $2.49m 628 691 734 0.44% 0.62% 0.56%
$2.5m - $4.99m 130 136 166 0.09% 0.12% 0.13%
$5m - $9.99m 60 67 66 0.04% 0.06% 0.05%
$10m -$24.99m
25 32 41 0.02% 0.03% 0.03%
$25m -$49.99m
7 12 10 0.00% 0.01% 0.01%
$50m -$99.99m
3 3 3 0.00% 0.00% 0.00%
$100m -
$249.99m
2 2 1 0.00% 0.00% 0.00%
$250m -$499.99m
2 0 0 0.00% 0.00% 0.00%
$500m-$999.99m
0 0 0 0.00% 0.00% 0.00%
> $1b 0 0 0 0.00% 0.00% 0.00%
unknown 37 373 396 0.03% 0.34% 0.30%
Total 143,273 110,589 130,051 100% 100% 100%
Company Sales Class Trends
This large table classifies the number of industry firms which fall into each of thirteen sales classes. Data isdisplayed as the number of firms in each of the three years of the time series. The fourth column displays thedistribution of Survivor firms (only those tracked from Yr1 and still in operation) through the same sales classes.Each of the final four columns corresponds to the first four by year, and displays the distribution as a percentage of allfirms for that year. Firms which do not report sales are noted in the unknown row, while the final row sums the total
number of firms in the industry in each of the years and for the survivor category. The analysis in the Company Sales Class Trends table is deepened by reading it in conjunction with the Market Share by Sales Classand Average Annual Company Sales by Class tables on the following page.
8/6/2019 flux35bookv2_2May2011
http://slidepdf.com/reader/full/flux35bookv22may2011 31/40
3business
Market Share by Sales Class ($ million)
as of 2007 2008 2009 2007 % 2008 % 2009 %
$1 - $500k 21,803.8 16,862.5 19,750.4 82.58% 76.50% 77.61%
$500k - $999k 1,219.0 1,659.3 2,055.3 4.62% 7.53% 8.08%
$1m - $2.49m 907.2 976.0 1,043.7 3.43% 4.43% 4.10%
$2.5m - $4.99m 442.5 451.5 552.2 1.68% 2.05% 2.17%
$5m - $9.99m 401.8 435.6 413.9 1.52% 1.98% 1.63%
$10m -$24.99m
370.4 483.8 646.2 1.40% 2.20% 2.54%
$25m -$49.99m
235.3 399.6 340.7 0.89% 1.81% 1.34%
$50m -$99.99m
195.1 194.2 189.3 0.74% 0.88% 0.74%
$100m -$249.99m
206.3 220.1 100.1 0.78% 1.00% 0.39%
$250m -$499.99m
617.2 0.0 0.0 2.34% 0.00% 0.00%
$500m-$999.99m
0.0 0.0 0.0 0.00% 0.00% 0.00%
> $1b 0.0 0.0 0.0 0.00% 0.00% 0.00%
unknown 6.2 361.2 355.1 0.02% 1.64% 1.40%
Total 26,404.8 22,043.8 25,446.9 100% 100% 100%
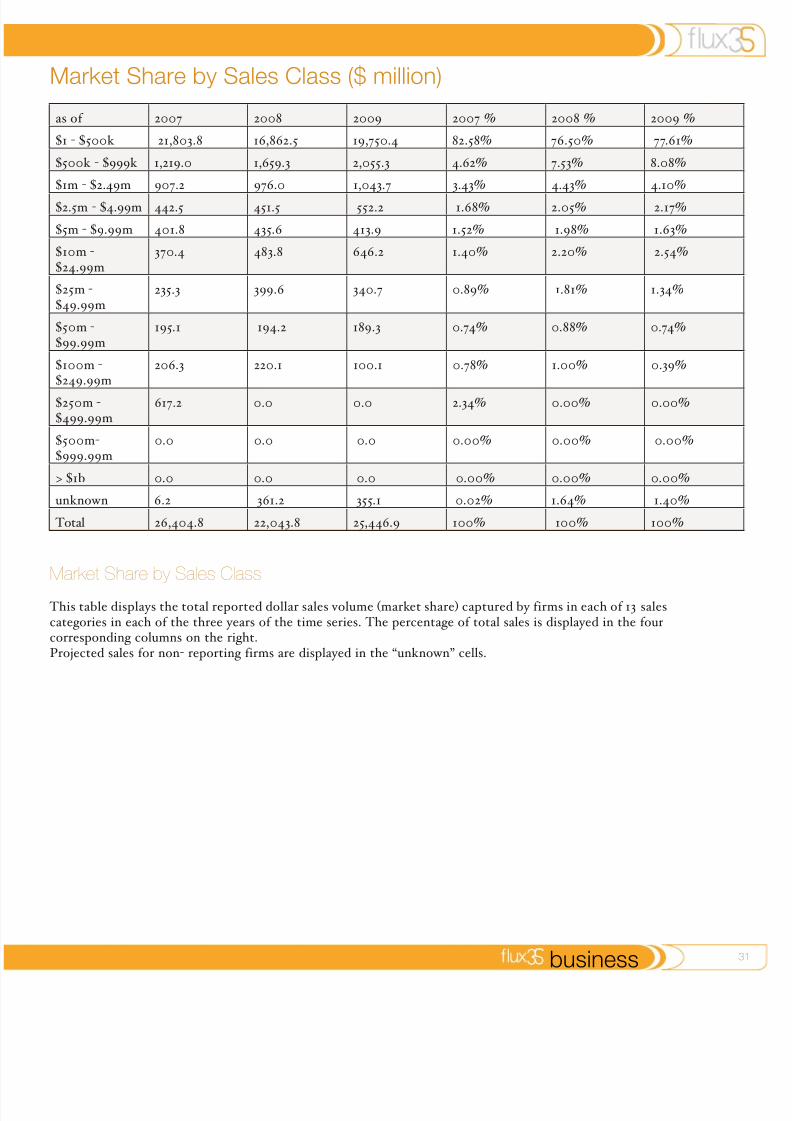
Market Share by Sales Class
This table displays the total reported dollar sales volume (market share) captured by firms in each of 13 salescategories in each of the three years of the time series. The percentage of total sales is displayed in the fourcorresponding columns on the right.Projected sales for non- reporting firms are displayed in the “unknown” cells.

8/6/2019 flux35bookv2_2May2011
http://slidepdf.com/reader/full/flux35bookv22may2011 32/40
32 business
Average Annual Company Sales by Class
as of 2007 2008 2009
$1 - $500k 155,044 157,658 156,993
$500k - $999k 696,970 716,142 726,254
$1m - $2.49m 1,444,586 1,412,446 1,421,935
$2.5m - $4.99m 3,403,846 3,319,853 3,326,506
$5m - $9.99m 6,696,667 6,501,493 6,271,212
$10m - $24.99m 14,816,000 15,118,750 15,760,976
$25m - $49.99m 33,614,286 33,300,000 34,070,000
$50m - $99.99m 65,033,333 64,733,333 63,100,000
$100m - $249.99m 103,150,000 110,050,000 100,100,000
$250m - $499.99m 308,600,000 0 0
$500m- $999.99m 0 0 0
> $1b 0 0 0unknown 167,568 968,365 896,717
Average Annual Company Sales by Class
This table displays the average firm sales within each industry sales class, indicating a benchmark within that peer group The average sales figure is derived by dividing the total market share within each sales class by the number of firms inthe class. Reported sales are utilized, capturing revenue from all headquarters and branch operations of multi- site firms.
Market Share by Segment (% total industry sales)
as of Firms Small Business Startups2007: 100.00% 91.12% 7.71%
2008: 100.00% 89.13% 8.41%
2009: 100.00% 91.22% 7.01%
Market Share by Segment
The share of total industry market volume captured by each category of firms is displayed as a percentage for each year of the time series. Naturally, the (all)Firms category captures 100% of the snapshot sales in each year. To the right,the Small Business and Startup shares of total market volume is displayed.
8/6/2019 flux35bookv2_2May2011
http://slidepdf.com/reader/full/flux35bookv22may2011 33/40
3business
Facility Employment Class
as of 1 emp 2-4emps
5-9emps
10-24emps
25-49emps
50-99emps
100-249emps
250-499emps
500-999emps
> 1000emps
N/A
2007 117,726 18,491 4,674 2,173 618 200 51 14 4 0 415
2008 80,898 21,052 5,777 2,515 699 224 53 15 4 0 292
2009 98,590 21,670 6,558 2,784 750 220 58 13 5 0 386
June2010
107,014 22,925 6,919 2,878 760 224 54 13 4 0 427
%
2007 81.55% 12.81% 3.24% 1.51% 0.43% 0.14% 0.04% 0.01% 0.00% 0.00% 0.29%
2008 72.54% 18.88% 5.18% 2.26% 0.63% 0.20% 0.05% 0.01% 0.00% 0.00% 0.26%
2009 75.24% 16.54% 5.00% 2.12% 0.57% 0.17% 0.04% 0.01% 0.00% 0.00% 0.29%
June
2010
75.78% 16.23% 4.90% 2.04% 0.54% 0.16% 0.04% 0.01% 0.00% 0.00% 0.30%
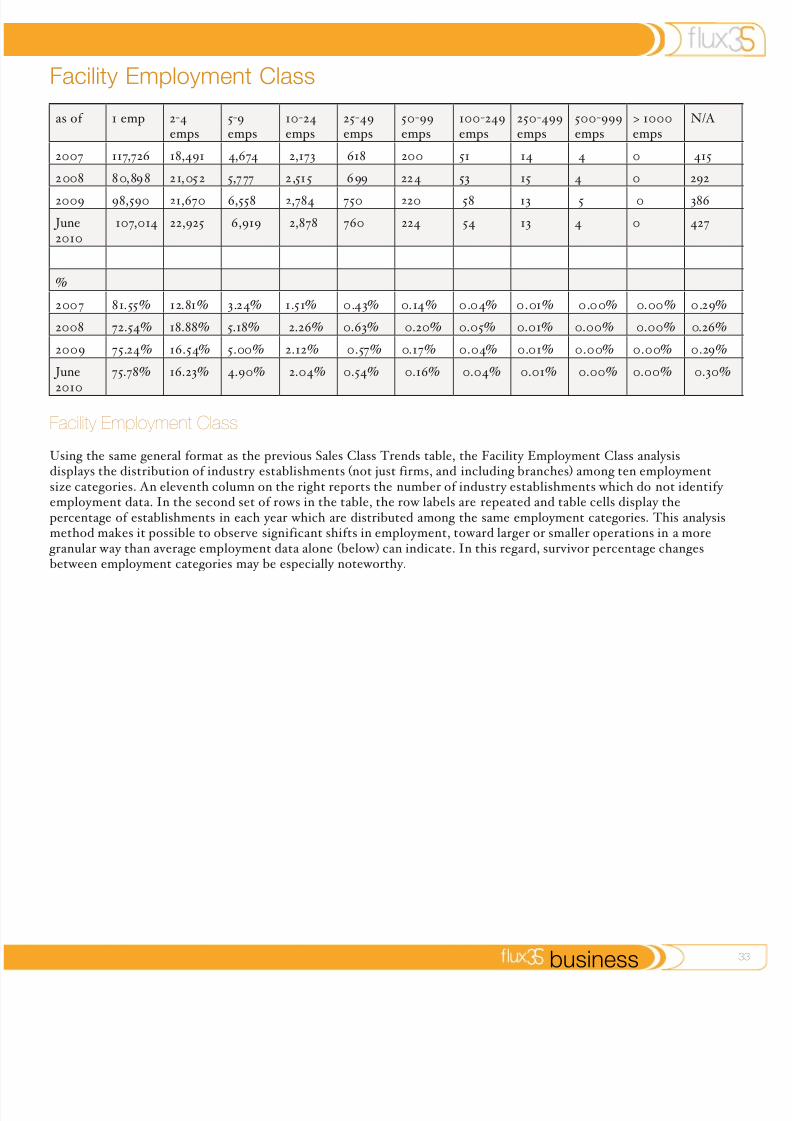
Facility Employment Class
Using the same general format as the previous Sales Class Trends table, the Facility Employment Class analysisdisplays the distribution of industry establishments (not just firms, and including branches) among ten employmentsize categories. An eleventh column on the right reports the number of industry establishments which do not identify employment data. In the second set of rows in the table, the row labels are repeated and table cells display thepercentage of establishments in each year which are distributed among the same employment categories. This analysismethod makes it possible to observe significant shifts in employment, toward larger or smaller operations in a more
granular way than average employment data alone (below) can indicate. In this regard, survivor percentage changesbetween employment categories may be especially noteworthy.

8/6/2019 flux35bookv2_2May2011
http://slidepdf.com/reader/full/flux35bookv22may2011 34/40

8/6/2019 flux35bookv2_2May2011
http://slidepdf.com/reader/full/flux35bookv22may2011 35/40
flux
Branding Guidelines

8/6/2019 flux35bookv2_2May2011
http://slidepdf.com/reader/full/flux35bookv22may2011 36/40
36 branding
corporate signature
colour palettes
The ux 35 corporate brandis simple and easy to read.Consistency of the signature isparamount to keeping ux 35 a recognisable name. The number35 features overlapping characters
to represent the companies uiddesign.
The colour palette represents
core identiability of thecompany.
In print, or online materials,colour codes should be usedin order to ensure precision of colour consistency.
Orange Grey Black
tint: 100% - 75%
cmyk: 0,35,87,0
rgb: 251,176,60hex:FBB03C
tint: 80%cmyk: 0, 0, 0, 80rgb: 51, 51, 51
hex:333333
tint: 100%
cmyk: 0,0,0,100
rgb: 35,31,32hex:231F20
text graphic

8/6/2019 flux35bookv2_2May2011
http://slidepdf.com/reader/full/flux35bookv22may2011 37/40
3branding
headings
footers
For all documents of correspondence branding is tobe used in the fullest. Withalternatives for black and white,personal stationary, and any otheraspects in which colour is not
availiable or cost eective.
On the footers of any page thestandard footer should be used, if there are multiple pages, a pagenumber should be issued to thedesignated area.
1. standard header
1. standard header
2. personal stationary
2. personal stationary
3. black and white header
3. black and white header
1
1
1
page numbebranding

8/6/2019 flux35bookv2_2May2011
http://slidepdf.com/reader/full/flux35bookv22may2011 38/40
38 branding
typography
helvetica neue ultralight
helvetica neue light
ABCDEFGHIJKLMNOPQRSTUVWXYZ
abcdefghijklmnopqrstuvwxyz0123456789!@£$%#^&*()
ABCDEFGHIJKLMNOPQRSTUVWXYZ
abcdefghijklmnopqrstuvwxyz
0123456789!@£$%#^&*()
This is a Sample of Headline Text
This Sample of Headline Text
this is a sample of annotation/subtext
this is a sample of annotation/subtext
headline option 1
all lesser case
helvetica neue ultralight18
headline option 2
normal title case
helvetica neue ultralight14
annotation/subtextoption 1
lower case
helvetica neue ultralight10
annotation/subtextoption 2
lower case
helvetica neue ultralight 8
For titles andheaders helvetica neue has beenselected due to itsmodern style andease to read. In
all cases kerning should be set to+5 to improvelegibility at smallersizes.
Helvetica neueultralight has alsobeen selected for intext annotations.In these casesthe graphic style
should still befollowed.

8/6/2019 flux35bookv2_2May2011
http://slidepdf.com/reader/full/flux35bookv22may2011 39/40
3branding
typography
hoeer text
ABCDEFGHIJKLMNOPQRSTU-
VWXYZabcdefghijklmnopqrstuvwxyz
0123456789!@£$%#^&*()
Lorem ipsum dolor sit amet, consectetur adipiscing elit. Integer quis eratturpis. Proin et fringilla tellus. Sed scelerisque sodales nulla quis iaculis.Vivamus turpis orci, congue vitae adipiscing in, bibendum sodales nisi.Maecenas neque diam, aliquam id eleifend sed, tincidunt facilisis nibh.Pellentesque habitant morbi tristique senectus et netus et malesuada fames ac turpis egestas. In varius sagittis augue, ut mollis nisl consecteturnec. Proin consectetur est sed nisl dictum placerat. Proin convallis rutrumdignissim. Maecenas rhoncus ornare lectus ac iaculis. Morbi luctus nulla id est aliquam sodales. Aenean sed aliquam eros. Aliquam auctor sagittissapien, in faucibus turpis molestie sed. Etiam tristique facilisis turpis id
vestibulum. Curabitur eu dui in nisl ullamcorper placerat. Nam semperrisus justo, vel dignissim elit. Duis eu ante et leo volutpat consectetur necnon dui. Phasellus fringilla pulvinar congue.
Lorem ipsum dolor sit amet, consectetur adipiscing elit. Integer quis erat turpis. Proin etfringilla tellus. Sed scelerisque sodales nulla quis iaculis. Vivamus turpis orci, congue vitaeadipiscing in, bibendum sodales nisi. Maecenas neque diam, aliquam id eleifend sed, tincid-unt facilisis nibh. Pellentesque habitant morbi tristique senectus et netus et malesuada famesac turpis egestas. In varius sagittis augue, ut mollis nisl consectetur nec. Proin consectetur estsed nisl dictum placerat. Proin convallis rutrum dignissim. Maecenas rhoncus ornare lectusac iaculis. Morbi luctus nulla id est aliquam sodales. Aenean sed aliquam eros. Aliquam auctorsagittis sapien, in faucibus turpis molestie sed. Etiam tristique facilisis turpis id vestibulum.Curabitur eu dui in nisl ullamcorper placerat. Nam semper risus justo, vel dignissim elit. Duiseu ante et leo volutpat consectetur nec non dui. Phasellus fringilla pulvinar congue.
body text option 1
normal case
hoeer text 10
body text option 2
normal case
hoeer text 8
For body typehoeer text hasbeen selected forits, serifed fontgiving excellentcontrast of shape
style to helvetica neue.
It has beenreserved for body text of phamphletsor letters, orother text basedapplications.
8/6/2019 flux35bookv2_2May2011
http://slidepdf.com/reader/full/flux35bookv22may2011 40/40
fluxjohn smith | principle
business cards
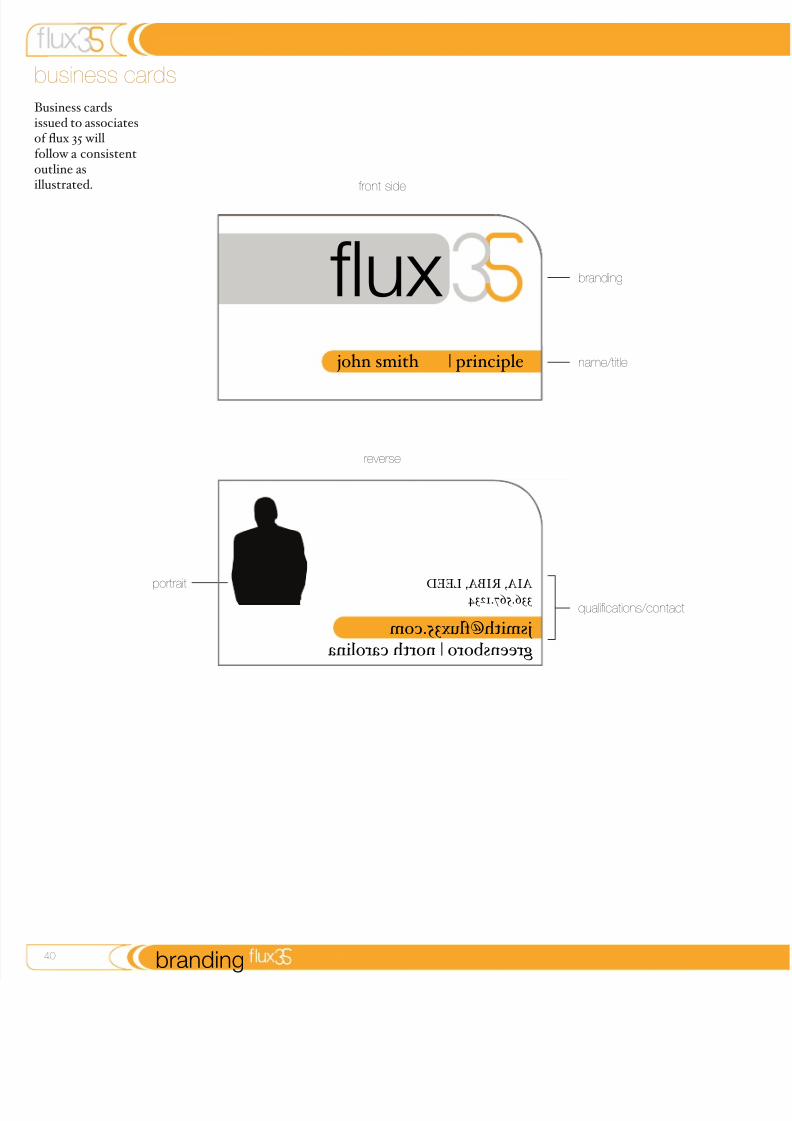
Business cardsissued to associatesof ux 35 willfollow a consistentoutline asillustrated. front side
reverse
name/title
portrait
branding
qualifcations/contact
j s m i t h @ f l u x 3 5 . c o m g r e e n s b o r o | n o r t h c a r o l i n a
A I A , R I B A , L E E D 3 3 6 . 5 6 7 . 1 2 3 4