fluorescence spectrometer4 5 fs5 fs5 – outstanding instrument sensitivity the fs5 is designed to...
TRANSCRIPT

FS5Fluorescence Spectrometer
from Single Photonsto a Multitude of Measurements

2 3
FS5 APPLICATIONS
Photochemistry
Biochemistry
Material Research
Cell Biology
Pharmaceutical Industry
Analytical Chemistry
Medicine
Environmental Science
Manufacturing
Food Science and Agriculture
A modern fluorescence spectrometer,developed and manufactured by Edinburgh Instruments in the UK
Edinburgh Instruments announces the new integrated, purpose built fluorescence spectrometer FS5. The instrument is built to the highest standards of sensitivity, speed of acquisition, ease of use and flexibility in the use of sample holders.
The FS5 provides everything users have come to expect from Edinburgh Instruments, the company with over 35 years of experience in fluorescence spectroscopy. The FS5 sets new standards for a mid-price range fluorescence spectrometer in the global analytical and research market with the added option of easy upgrades using interchangeable Measurement Modules for a broad range of applications.
• Ultra High Sensitivity – Single Photon Counting
• High Dynamic Range and Speed of Acquisition
• Unique Software, tailored for Fluorescence Spectroscopy
• Unique Range in Upgrade Routes, including
º NIR – Extension of Spectral Coverage up to 1650nm
º POL – For Measurements of Polarisation and Anisotropy
º MCS – Lifetime Measurements in Microsecond to Second Range
º TCSPC – Lifetime Measurements in Picosecond to Microsecond Range
• Unmatched Range of Measurement Modules

4 5
FS5
FS5 – Outstanding Instrument SensitivityThe FS5 is designed to meet the highest specifications in the research and analytical markets. From an air-sealed excitation path to enhance the signal in the UV, to performance selected photomultipliers in temperature stabilised housings, from an optical design that includes plane, spherical, toroidal, and ellipsoidal mirrors to fully optimised mirror coatings, the instrument is unique in its spectral performance and sensitivity.
Furthermore, the optical design does not only guarantee highest sensitivity and unique wavelength coverage, it has also been optimised for a small bright focus at the sample position. This is important for measuring small sample volumes and benefits many sample holder attachments like plate reader, fibre launch optics, titrators and sample positioners.
FS5 – Unique Optical DesignThe FS5 has an optical design that is superior to all known instruments of this class and it uses optical components that are specially selected.
The embedded monochromators are of a large focal length (225mm), which ensures better imaging quality and higher optical throughput. The instrument uses a minimum of optical reflections; all optical coatings are of highest reflectivity and lowest scatter. We use gratings from the source with the best reputation (Richardson Gratings) and have selected those with highest efficiency and best wavelength coverage.
This figure shows typical pulses from a single photon counting photomultiplier.Only photon pulses above a certain threshold value are counted; this eliminates unstable background and associated noise. The amplitude of each accepted pulse is not relevant, a feature of digital data processing.
FS5 – Photon CountingSingle Photon Counting is detection at the quantum limit. This detection method is intrinsically digital and therefore less susceptible to noise interference than other methods. As a true counting technique each measured count-value comes with a known statistical accuracy. Therefore the technique is not only the most sensitive, it also offers unique ways in the analysis of your data.
Single Photon Counting is employed for all measurement modes, not only for standard spectral scanning and kinetic measurements but also for the optional fluorescence and phosphorescence lifetime measurements.
Efficiency curves of the excitation and emission gratings of the FS5.
The Raman spectrum of water, exited at 350nm, with a spectral band width of 5nm in excitation and emission, measured with an integration time of 1s, is generally used as a means to specify sensitivity.The FS5 guarantees a signal-to-noise ratio of 4000:1 for these measurement conditions, calculated from the signals taken at the peak at 397nm (b) and the background at 450nm (a) using SNRSQRT = (b-a)/SQRT(a). We can also provide alternative figures which are based on alternative estimates for the noise at 450nm.
FS5 – Unique SoftwareThe operating software for the Spectrofluorometer FS5 is Fluoracle, a unique software package specifically written to handle data and instrumentation in fluorescence spectroscopy.
Fluoracle is the successor of the proven F980 software. The new Fluoracle controls all Edinburgh Instruments steady state and time resolved spectrometers.
The design concept of Fluoracle is straight forward: Focus on all modern photoluminescence spectroscopy applications, while at the same time provide a user friendly interface with ‘ready to publish’ outputs.
Whether you select a basic spectral scanning version of the FS5 or you go for an advanced version that includes TCSPC lifetime measurements, the software will include all instrument options, including data acquisition, analysis and presentation.
FS5 – Reliability and AccuracyThorough calibration procedures are used for spectral calibration (wavelength accuracy and repeatability) and photometric calibration (presentation of true spectra without distortion of instrumental throughput functions).
We use traceable standards for calibration throughout the full wavelength coverage. We will verify calibration, in photons per unit bandwidth, by NIST and BAM standards. The FS5 delivers data you can trust.
NIST standards (top) and BAM standards (bottom), as measured with the FS5 under recommended measurement conditions.
Load / Save Measurement Settings ✓
Batch Measurements ✓
Detailed Measurement Properties ✓
Higher Order Removal ✓
ASCII Input / Output ✓
Recognition of Sample Holders / Accessories ✓
Chromaticity Analysis ✓
Quantum Yield Analysis ✓
Reflection / Absorption ✓
6 7
Measurement Examples
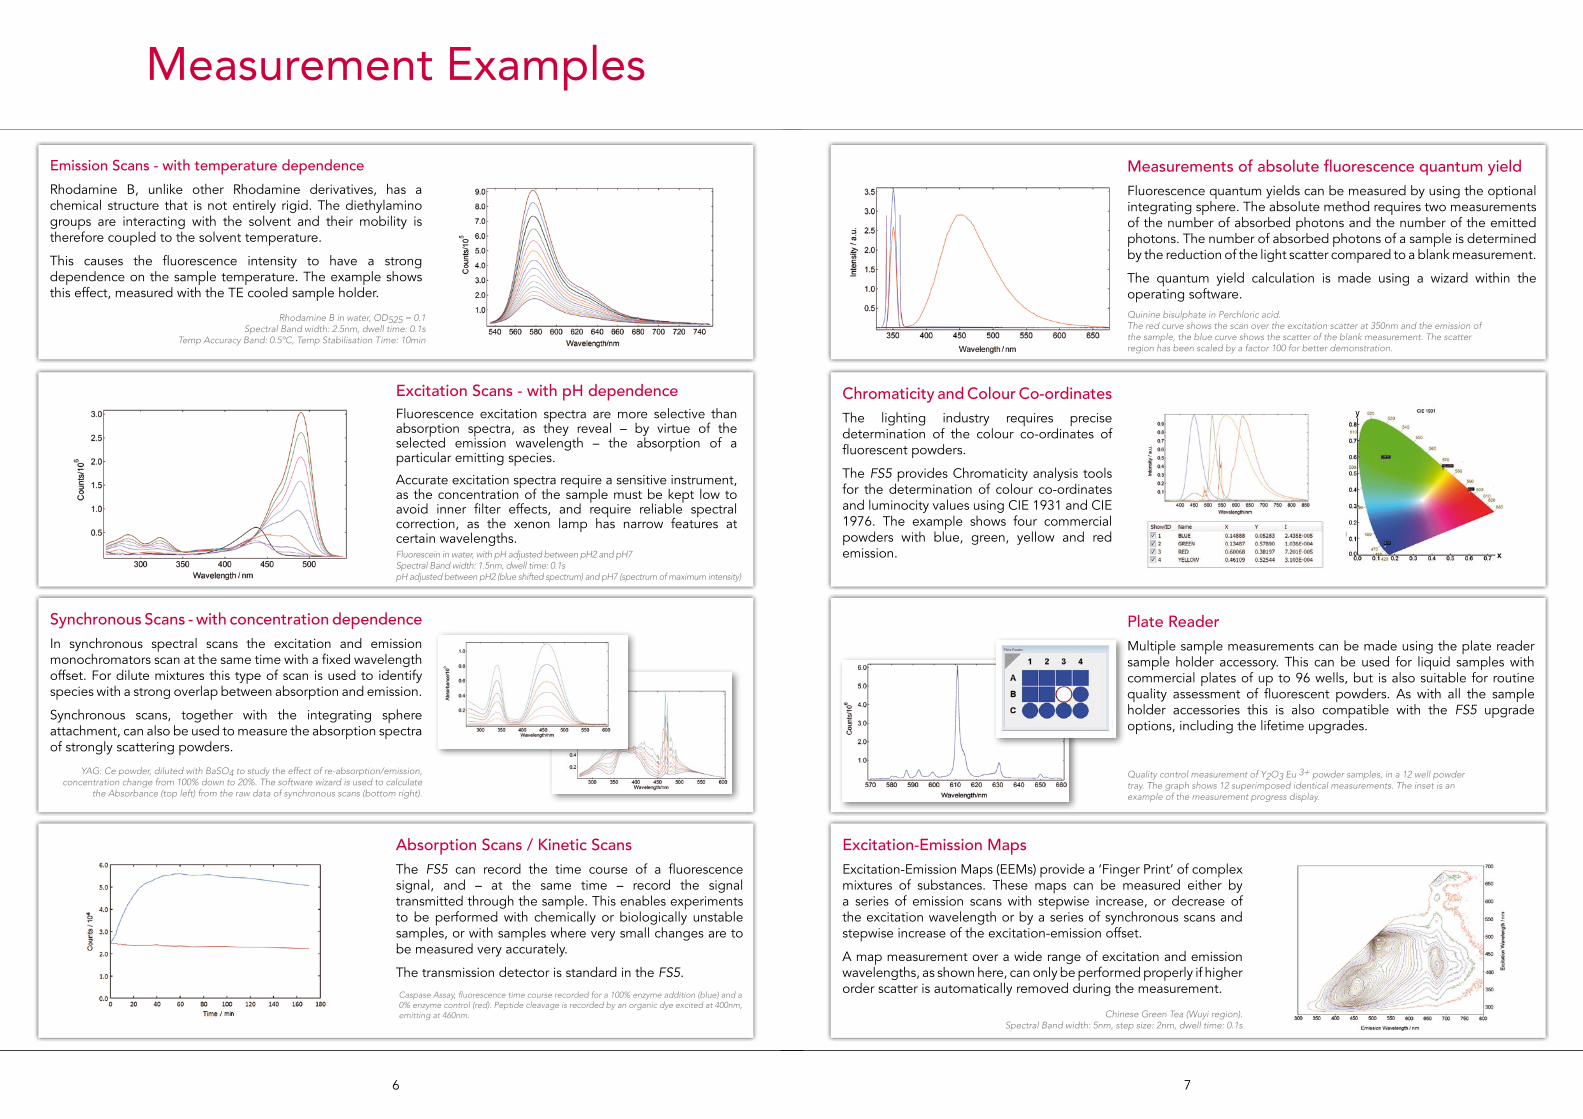
Emission Scans - with temperature dependenceRhodamine B, unlike other Rhodamine derivatives, has a chemical structure that is not entirely rigid. The diethylamino groups are interacting with the solvent and their mobility is therefore coupled to the solvent temperature.
This causes the fluorescence intensity to have a strong dependence on the sample temperature. The example shows this effect, measured with the TE cooled sample holder.
Rhodamine B in water, OD525 = 0.1Spectral Band width: 2.5nm, dwell time: 0.1s
Temp Accuracy Band: 0.5ºC, Temp Stabilisation Time: 10min
Synchronous Scans - with concentration dependenceIn synchronous spectral scans the excitation and emission monochromators scan at the same time with a fixed wavelength offset. For dilute mixtures this type of scan is used to identify species with a strong overlap between absorption and emission.
Synchronous scans, together with the integrating sphere attachment, can also be used to measure the absorption spectra of strongly scattering powders.
YAG: Ce powder, diluted with BaSO4 to study the effect of re-absorption/emission, concentration change from 100% down to 20%. The software wizard is used to calculate
the Absorbance (top left) from the raw data of synchronous scans (bottom right).
Absorption Scans / Kinetic ScansThe FS5 can record the time course of a fluorescence signal, and – at the same time – record the signal transmitted through the sample. This enables experiments to be performed with chemically or biologically unstable samples, or with samples where very small changes are to be measured very accurately.
The transmission detector is standard in the FS5.
Caspase Assay, fluorescence time course recorded for a 100% enzyme addition (blue) and a 0% enzyme control (red). Peptide cleavage is recorded by an organic dye excited at 400nm, emitting at 460nm.
Excitation Scans - with pH dependenceFluorescence excitation spectra are more selective than absorption spectra, as they reveal – by virtue of the selected emission wavelength – the absorption of a particular emitting species.
Accurate excitation spectra require a sensitive instrument, as the concentration of the sample must be kept low to avoid inner filter effects, and require reliable spectral correction, as the xenon lamp has narrow features at certain wavelengths.Fluorescein in water, with pH adjusted between pH2 and pH7Spectral Band width: 1.5nm, dwell time: 0.1spH adjusted between pH2 (blue shifted spectrum) and pH7 (spectrum of maximum intensity)
Measurements of absolute fluorescence quantum yieldFluorescence quantum yields can be measured by using the optional integrating sphere. The absolute method requires two measurements of the number of absorbed photons and the number of the emitted photons. The number of absorbed photons of a sample is determined by the reduction of the light scatter compared to a blank measurement.
The quantum yield calculation is made using a wizard within the operating software.
Plate ReaderMultiple sample measurements can be made using the plate reader sample holder accessory. This can be used for liquid samples with commercial plates of up to 96 wells, but is also suitable for routine quality assessment of fluorescent powders. As with all the sample holder accessories this is also compatible with the FS5 upgrade options, including the lifetime upgrades.
Excitation-Emission MapsExcitation-Emission Maps (EEMs) provide a ‘Finger Print’ of complex mixtures of substances. These maps can be measured either by a series of emission scans with stepwise increase, or decrease of the excitation wavelength or by a series of synchronous scans and stepwise increase of the excitation-emission offset.
A map measurement over a wide range of excitation and emission wavelengths, as shown here, can only be performed properly if higher order scatter is automatically removed during the measurement.
Chinese Green Tea (Wuyi region).Spectral Band width: 5nm, step size: 2nm, dwell time: 0.1s
Chromaticity and Colour Co-ordinatesThe lighting industry requires precise determination of the colour co-ordinates of fluorescent powders.
The FS5 provides Chromaticity analysis tools for the determination of colour co-ordinates and luminocity values using CIE 1931 and CIE 1976. The example shows four commercial powders with blue, green, yellow and red emission.
Quinine bisulphate in Perchloric acid.The red curve shows the scan over the excitation scatter at 350nm and the emission of the sample, the blue curve shows the scatter of the blank measurement. The scatter region has been scaled by a factor 100 for better demonstration.
Quality control measurement of Y2O3 Eu 3+ powder samples, in a 12 well powder tray. The graph shows 12 superimposed identical measurements. The inset is an example of the measurement progress display.

8 9
Upgrade Options
FS5 – NIR Extension of the Spectral Coverage into the Near Infrared
This is a unique upgrade route that is only available to the FS5. The FS5-NIR has a SECOND detector fitted to expand the operating spectral range without sacrificing the performance of the standard instrument.
There are two NIR versions available: FS5-NIR is fitted with an extra cooled side window PMT and selected grating for sensitivity up to 1100nm; FS5-NIR+ is fitted with a TE cooled NIR-PMT and NIR-grating for sensitivity up to 1650nm.
Both options are based on single photon counting for maximum sensitivity and compatibility with any of the lifetime options, should they be added.
FS5 – POL Measurements of Fluorescence Polarisation and Anisotropy
This upgrade comprises the standard FS5 with fully computerised polarisers in both excitation and emission arms. The polarisers enable polarised fluorescence and fluorescence anisotropy studies.
Automated measurements and generation of anisotropy curves, both raw and G-factor corrected, are supported by the software. If combined with the TCSPC option, time resolved fluorescence anisotropy measurements and analysis will also be possible.
FS5-POL uses aBBO polarising prisms with an operational range of 250nm-900nm for both excitation and emission. This version is therefore compatible with the standard detector of the FS5. An option is available to replace the polarising prism of the emission beam path by a Calcite prism with an operational range 300nm to >1650nm. This ensures compatibility with the NIR options FS5-NIR and FS5-NIR+.
The Upgrade Options are modifications or additions to the main body of the FS5. All upgrades are best installed at the time of manufacture, but they can also be retro-fitted by a qualified service engineer during an on-site visit.All the standard features of the FS5 are retained when an Upgrade Option has been added. Many of the options can be combined.This offers outstanding flexibility for an instrument of this class.
Fluorescence Anisotropy
measurement of Rhodamin
6G in glycerol at room tem-
perature.
Raw data for vertical (red)
and horizontal (green) emis-sion polarisa-
tion plane.
Steady state anisotropy of
excitation (blue) and emission
(magenta)
Measurement of the emission spectrum from an infrared laser dye with standard FS5 photomultiplier (blue) and with the FS5-NIR (brown)
The emission spectrum of Nd:YAG, meas-ured with the FS5-NIR+
FS5 – MCS Measurement of Lifetimes in Microsecond to Second Range
The instrument has all the features of the standard FS5, plus the capability of long lifetime (>10ms) measurements for the time resolved measurement of strong phosphors and rare earth emissions.
The changeover between the standard continuous light source and the pulsed xenon flash lamp is software controlled and the acquisition mode automatically changes from standard photon counting to time resolved photon counting. The software incorporates fitting and reconvolution analysis for lifetime evaluation.
For longer working sessions in lifetime mode, the continuous lamp can be switched off via the spectrometer software as it is not required. This saves energy and increases the lifespan of this lamp.
The instrumental response width of this instrument is 2ms. Lifetimes from below 10ms to above 10s can be accurately measured.
FS5 – TCSPC Measurement of Lifetimes in Picosecond to Microsecond Range
The instrument has all the features of the standard FS5, plus the capability of fluorescence lifetime measurements in the picosecond, nanosecond and the lower microsecond (<10ms) time range. The FS5-TCSPC version requires picosecond pulsed diode lasers and LEDs for excitation, which are simply attached to the special FS5-TCSPC housing and are compatible to all sample holder options.
There is no stand-alone laser driver or data acquisition module! The software is fully compatible with all measurement options and offers numerical reconvolution and curve fitting.
Note that the picosecond diode lasers (EPL series) and the picosecond pulsed LEDs (EPLED series) come with different output wavelengths. More than one of these picosecond pulsed light sources may be required to cover your range of applications.
TCSPC lifetime measurements with the standard FS5 detector will have an instrumental response width of ~800ps (FS5-TCSPC). The exact value depends on which EPL or EPLED model is used. For challenging applications the instrumental response width can be improved by fitting a SECOND, faster detector (FS5-TCSPC+). Using an EPL as an excitation source in this configuration will result in an instrumental response width of ~250ps.
MCS measurements in the microsecond and millisecond time scale on an example immune-assay.
In this assay, the FRET rate of the donor-acceptor pair (Europium cryptate-APC) used to label the antibodies depends on the concentration of the antigen. Very low antigen concentrations can be measured due to the discrimination by lifetimes.
Measurement example for the FS5-TCSPC upgrade, using an EPLED 280 and the standard detector. (Sample: Norharmane in ethanol, at different emission wavelengths.)
Measurement example for the FS5-TCSPC+ upgrade, with EPL 405 and faster detector. (Sample: Hematoporphyrine in PBS, at different emission wavelength.)
The FS5-TCSPC, with EPL / EPLED sources.

10 11
Measurement Modules
SC-80 Cryostat CassetteSC-60 Calibration Kit
SC-25 TE Cooled Sample Holder
SC-05 Standard Cuvette Holder
SC-20 Cuvette Holder with Temp Sensor for Coolant Circulation
SC-10 FF Holder for Cuvettes, Powders and Films
SC-15 FF Holder (Vertical) for Powders and FilmsMeasurement modules are
available for practically all applications.
These accessories can be purchased at any time and can be easily installed by the user. The installation takes no more than a few seconds for most of the modules.
The software recognises which of the measurement modules is in use. This reduces complexity in the user interface and ensures ease of operation.
SC-50 Remote Fibre Interface
SC-40 Plate Reader
SC-30 Integrating Sphere
SC-70 Liquid Nitrogen Dewar
Optics:
Source:
Monochromators:
Spectral Coverage – Excitation:
Spectral Coverage – Emission:
Bandpass – Excitation/Emission:
Wavelength Accuracy – Excitation/Emission:
Scan Speed – Excitation/Emission:
Integration Time:
Emission Detector:
Reference Detector:
Transmission Detector:
Water Raman Signal:
Signal-Noise Ratio ofWater Raman Signal:
Dimensions:
Weight:
All-reflective for a wavelength independent focus with high brightness (small focus) at the sample150W ozone generating xenon lamp in hermetically sealed excitation path for best UV performanceCzerny-Turner design with plane gratings for accurate focus at all wavelength and minimum stray light230nm – 1000nm230nm – 870nm0.1nm to 30nm, continuously adjustable± 0.5nm80nm/s1ms – 200sPhotomultiplier R928P, spectral coverage 200nm – 870nm, cooled and stabilisedUV enhanced silicon photodiodeUV enhanced silicon photodiode≥ 400,000cps at 397nm emission, excitation 350nm, 5nm bandpass, 1s integration time
SNR ≥ 4000:1104cm (w) x 59cm (d) x 32cm (h)55kg
Specifications
Source:
Lifetime Range:
Sources:
Lifetime Range:
Lifetime Range of TCSPC+ version:
Computer Control:
Spectral coverage:
Spectral coverage of NIR+ version:
Computer Control:
Spectral Coverage:
Also available:
5W microsecond xenon flashlamp <10ms to >10s
Picosecond diode lasers (EPL series)Picosecond pulsed LEDs (EPLED series)<150ps to >10ms (EPL excitation)<50ps to >10ms
Change-over of detectors, associated gratings and spectral correction files230nm-870nm plus 600nm-1000nm
230nm-1000nm plus 950nm-1650nmNote: This version will have reduced sensitivity in the visible spectral range.
In/Out of beam, polarisation angle 0º-90º250nm-900nm (excitation and emission)250nm-900nm (exc.), 300nm->1650nm (em.)
Upgrade SpecificationsFS5 - MCS
FS5 - TCSPC
FS5 - NIR
FS5 - POL

FS5Fluorescence Spectrometer
For more information contact: Edinburgh Instruments Ltd 2 Bain Square Kirkton Campus Livingston EH54 7DQ United Kingdom
T: +44 (0) 1506 425 300F: +44 (0) 1506 425 320E: [email protected]: www.edinst.com
Registered Office: Lake House, Market Hill, Royston, Herts SG8 9JN Reg No: 962331 England VAT No GB 271 7379 37 January 2014