floyd county comprehensive plan - demographic data report floyd county comprehensive plan steering...
TRANSCRIPT

Floyd County Comprehensive Plan - Demographic Data Report
FLOYD COUNTY COMPREHENSIVE PLAN STEERING COMMITTEE

Floyd County Comprehensive Plan – Data Demographic Report

Floyd County Comprehensive Plan – Data Demographic Report

Floyd County Comprehensive Plan – Data Demographic Report

Floyd County Comprehensive Plan – Data Demographic Report

Floyd County Comprehensive Plan – Data Demographic Report

Floyd County Comprehensive Plan – Data Demographic Report

Floyd County Comprehensive Plan – Data Demographic Report

Floyd County Comprehensive Plan – Data Demographic Report
Demographic Characteristics for Floyd County – BY THE NUMBERS
Population: 76,244
Households: 29,807
Median Age: 39.7 average
Household Size: 2.55 average
Household Ownership: 65.2 Owner Occupied Source * 2013 American Community Survey Estimate and Stats Indiana

Floyd County Comprehensive Plan – Data Demographic Report
Demographic Characteristics for Floyd County – BY THE NUMBERS
Educational Attainment: 88.0 percent with High School Diploma or higher
Educational Attainment: 22.6 percent with Bachelor’s Degree or higher
Median Household Income: $53,961
Poverty Rate: 13.4 percent Source * 2013 American Community Survey Estimate and Stats Indiana
Floyd County Comprehensive Plan – Data Demographic Report
Demographic Characteristics for Floyd County – BY THE NUMBERS
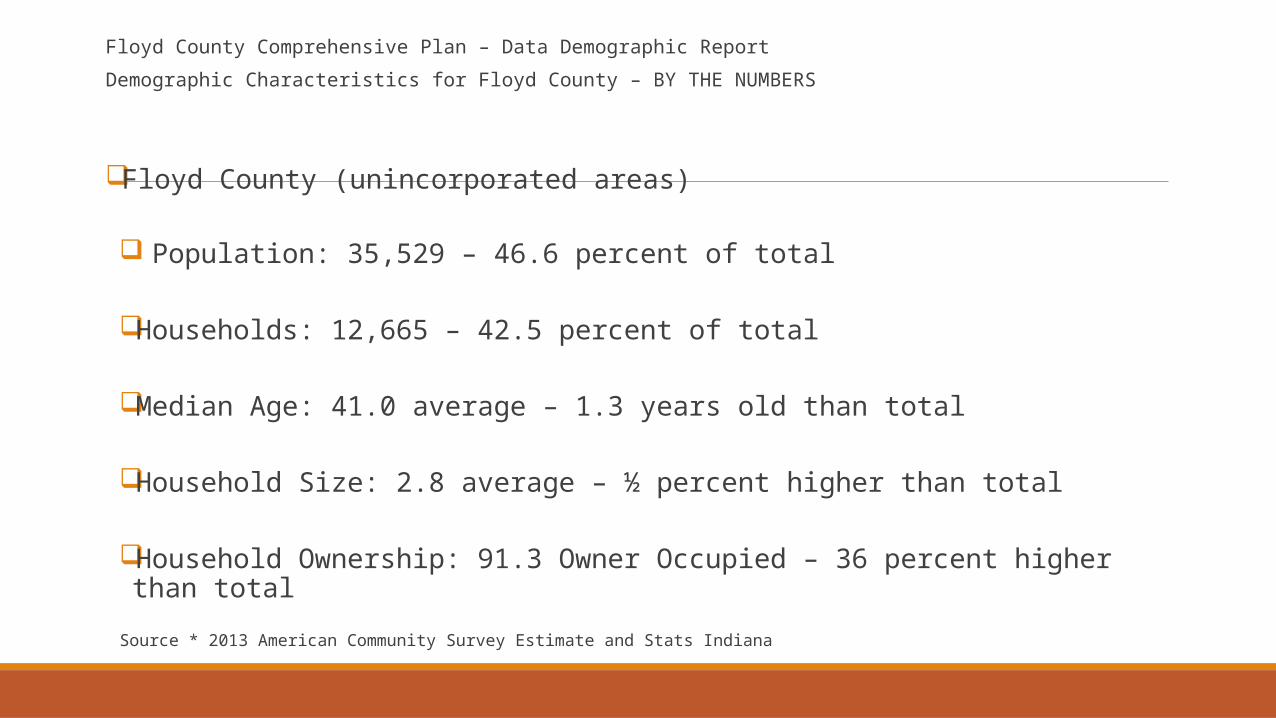
Floyd County (unincorporated areas)
Population: 35,529 – 46.6 percent of total
Households: 12,665 – 42.5 percent of total
Median Age: 41.0 average – 1.3 years old than total
Household Size: 2.8 average – ½ percent higher than total
Household Ownership: 91.3 Owner Occupied – 36 percent higher than total
Source * 2013 American Community Survey Estimate and Stats Indiana

Floyd County Comprehensive Plan – Data Demographic Report
Demographic Characteristics for Floyd County Planning Area – BY THE NUMBERS
Floyd County (unincorporated areas)
Educational Attainment: 91.5 percent with High School Diploma or higher – 3 percent higher than total
Educational Attainment: 25.7 percent with Bachelor’s Degree or higher -3 percent higher than total
Median Household Income: $73,140 - 35 percent higher income than total
Poverty Rate: 4.0 percent – 9.4 percent lower
Source * 2013 American Community Survey Estimate and Stats Indiana

Floyd County Comprehensive Plan – Data Demographic Report
Income – More affluent than County and State as a whole
Education – More educated in terms of high school graduates, bachelor’s and advance degrees than County and State as a whole
Home Ownership – High percentage of home ownership among residents
Staying Put – More likely to have lived in same home for a long period of time
Larger Households – More likely to have larger households
Older – More likely to be older than County as whole and State

Floyd County Comprehensive Plan – Data Demographic Report Trends
Population Growth has lagged near bottom of Metro Area for past twenty years in comparison Population is getting older faster than State and Metro areas
Housing stock is getting older – median housing unit now – 30 years old School Age population projects through Stats Indiana indicate a flat to slight reduction in school age
children
Limited traditional industrial opportunities 2030 and beyond aging population will dramatically increase
Area is gaining in terms of residents with college and advanced degrees
Area is gaining in terms of residents income levels

Floyd County Comprehensive Plan – Data Demographic Report
Demographic Characteristics for Floyd County Planning Area – BY THE NUMBERS
So who are we?

Floyd County Comprehensive Plan – Data Demographic Report
So who are we really … a descriptive approach
ERSI – Geographic Data and Analytics
Describes 67 unique demographic characteristics that make the population of United States
For our area – Five unique demographic groups emerged from their research Green Acres Salt of the Earth Savy Surbanities Soccer Moms Middleburgs

Floyd County Comprehensive Plan – Data Demographic Report

Floyd County Comprehensive Plan – Data Demographic Report

Floyd County Comprehensive Plan – Data Demographic Report

Floyd County Comprehensive Plan – Data Demographic Report

Floyd County Comprehensive Plan – Data Demographic Report

Floyd County Comprehensive Plan – Data Demographic Report
2025 Population and Housing Projections
Community will need to plan for between a 5.9 to 9.8 percent anticipated population growth Stats Indiana has 5.9 percent growth rate IUPUI Planning Model has 9.8 percent growth rate
Middle ground analysis – 8.0 percent population growth or 80,452 by 2025
New residents – 4,208 new residents by 2025 Housing units – 1,650 needed to accommodate growth of new residents
Floyd County Comprehensive Plan – Data Demographic Report
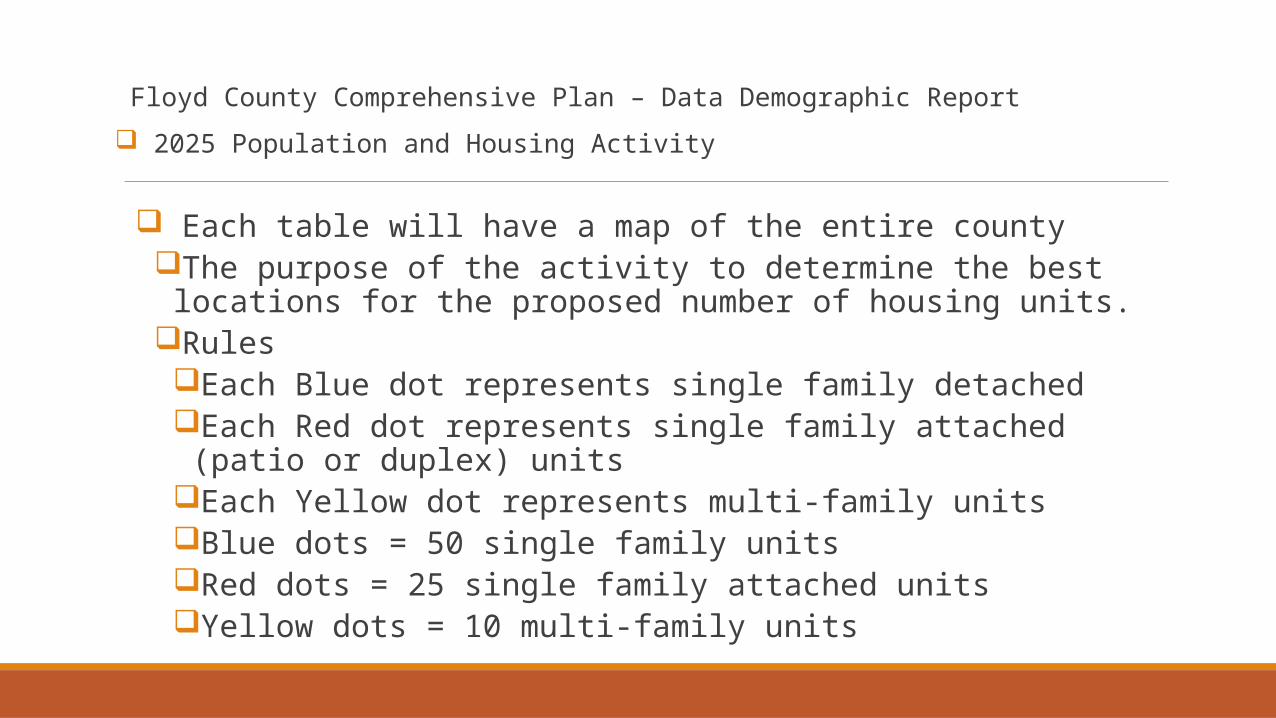
2025 Population and Housing Activity
Each table will have a map of the entire countyThe purpose of the activity to determine the best locations for the
proposed number of housing units. RulesEach Blue dot represents single family detachedEach Red dot represents single family attached (patio or duplex) unitsEach Yellow dot represents multi-family units Blue dots = 50 single family unitsRed dots = 25 single family attached unitsYellow dots = 10 multi-family units

Floyd County Comprehensive Plan – Data Demographic Report
2025 Population and Housing Activity
Rules
At least fifty percent of the housing units must be located in the unincorporated areas
Red and Yellow dots for higher density must be located near to commercial areas and transportation corridors
Can not be placed inside flood plain or steep slope areas
