flow pattern, pressure drop and void fraction of two-phase gas
TRANSCRIPT

www.elsevier.com/locate/etfs
Experimental Thermal and Fluid Science 30 (2006) 345–354
Flow pattern, pressure drop and void fraction of two-phasegas–liquid flow in an inclined narrow annular channel
Somchai Wongwises *, Manop Pipathattakul
Fluid Mechanics, Thermal Engineering and Multiphase Flow Research Lab (FUTURE), Department of Mechanical Engineering,
King Mongkut’s University of Technology Thonburi, Bangmod, Bangkok 10140, Thailand
Received 1 July 2005; accepted 16 August 2005
Abstract
Two-phase flow pattern, pressure drop and void fraction in horizontal and inclined upward air–water two-phase flow in a mini-gapannular channel are experimentally studied. A concentric annular test section at the length of 880 mm with an outer diameter of 12.5 mmand inner diameter of 8 mm is used in the experiments. The flow phenomena, which are plug flow, slug flow, annular flow, annular/slugflow, bubbly/plug flow, bubbly/slug–plug flow, churn flow, dispersed bubbly flow and slug/bubbly flow, are observed and recorded byhigh-speed camera. A slug flow pattern is found only in the horizontal channel while slug/bubbly flow patterns are observed only ininclined channels. When the inclination angle is increased, the onset of transition from the plug flow region to the slug flow region(for the horizontal channel) and from the plug flow region to slug/bubbly flow region (for inclined channels) shift to a lower value ofsuperficial air velocity. Small shifts are found for the transition line between the dispersed bubbly flow and the bubbly/plug flow, thebubbly/plug flow and the bubbly/slug–plug flow, and the bubbly/plug flow and the plug flow. The rest of the transition lines shift toa higher value of superficial air velocity. Considering the effect of flow pattern on the pressure drop in the horizontal tube at low liquidvelocity, the occurrence of slug flow stops the rise of pressure drop for a short while, before rising again after the air velocity hasincreased. However, the pressure does not rise abruptly in the tubes with h = 30� and 60� when the slug/bubbly flow occurs. At lowgas and liquid velocity, the pressure drop increases, when the inclination angles changes from horizontal to 30� and 60�. Void fractionincreases with increasing gas velocity and decreases with increasing liquid velocity. After increasing the inclination angle from horizontalto h = 30� and 60�, the void fraction appears to be similar, with a decreasing trend when the inclination angle increases.� 2005 Elsevier Inc. All rights reserved.
Keywords: Two-phase flow; Mini-channel; Narrow annular channel; Flow pattern; Pressure drop; Void fraction
1. Introduction
Two-phase gas–liquid flow through a confined gap isencountered in several engineering applications includingboiling behavior in minichannels, cooling systems of vari-ous types of equipment such as high performance micro-electronics, supercomputers, high-powered lasers, medicaldevices, high heat-flux compact heat exchangers in space-craft and satellites etc. It can be expected that the restric-
0894-1777/$ - see front matter � 2005 Elsevier Inc. All rights reserved.
doi:10.1016/j.expthermflusci.2005.08.002
* Corresponding author. Tel.: +662 470 9115; fax: +662 470 9111.E-mail address: [email protected] (S. Wongwises).
tion of the bubble space in the minichannel is the causeof the differences in the two-phase flow characteristics fromthose in conventional channel geometries. This may alsoaffect heat-mass transfer characteristics during the changeof phase.
It is not possible to understand the two-phase flow phe-nomena without a clear understanding of the flow patternsencountered. It is expected that the flow patterns will influ-ence the two-phase pressure drop, holdup, system stability,exchange rates of momentum, heat and mass during thephase-change heat transfer processes. The ability to accu-rately predict the type of flow is necessary before relevantcalculation techniques can be developed.

346 S. Wongwises, M. Pipathattakul / Experimental Thermal and Fluid Science 30 (2006) 345–354
Two-phase flow patterns in small circular tubes havebeen studied by a number of researchers while those in mininon-circular channels have received comparatively littleattention in literature.
Zhao and Rezkallah [1] proposed the phasic Weber assystem parameters to elucidate the effects of inertia andsurface tension in micro-channels at micro-gravity. Theirflow regime map was divided into three zones: surfacetension-dominated zone (bubbly and slug flow regimes),inertia-dominated zone (annular flow regime), and thetransition zone.
Wilmarth and Ishii [2,3] observed the flow patterns andmeasured the void fraction and the interfacial area concen-tration of adiabatic co-current vertical and horizontal air–water flow in narrow rectangular channels with gaps of 1and 2 mm. The developed flow regime maps were com-pared with those obtained for a round pipe.
Bonjour and Lallemand [4] performed experiments toelucidate the flow regimes of natural convective boiling ofR113 in upward two-phase flow in vertical narrow rectan-gular channels with gap sizes ranging between 0.5 and2 mm. Three flow boiling regimes, namely nucleate boilingwith isolated deformed bubbles, nucleate boiling with coa-lesced bubbles, and partial dry out, were observed. A newflow regime map based on the Bond number and a ratio ofthe heat flux to the critical heat flux was developed toconfine the boiling.
Xu et al. [5,6] investigated an adiabatic co-current verti-cal two-phase flow of air and water in vertical rectangularchannels (12 · 260 mm) with narrow gaps of 0.3, 0.6 and1.0 mm. Flow patterns for gaps of 0.6 and 1.0 mm weresimilar to those reported in the literature. By decreasingthe channel gaps, the transition from one flow regime toanother appeared at a lower gas velocity. However, forthe gaps of 0.3 mm, even at very low gas flow rates, bubblyflow was never found.
Hibiki and Mishima [7] developed a mathematicalmodel to predict the flow regime transition for vertical up-ward flows in narrow rectangular channels. The model wasbased on that of Mishima and Ishii [8] for vertical upwardtwo-phase flows in round tubes. The developed model wascompared with the measured data of air–water flows inrectangular channels with gaps of 0.3–17 mm.
Zhao and Bi [9] conducted experiments to visualize theco-current upward air–water two-phase flow patterns invertical equilateral triangular channels with hydraulicdiameters of 0.866 mm, 1.443 mm and 2.886 mm. The ob-served flow patterns obtained from the larger hydraulicdiameters (1.443 mm and 2.886 mm) were found to be sim-ilar to those obtained from conventional, large-sized verti-cal circular tubes. For the smallest channel (0.866 mm), thedispersed bubbly flow pattern was not found.
Akbar et al. [10] compared the measured data reportedin open literature with a Weber number-based two-phaseflow regime map which was previously developed by Zhaoand Rezkallah [1], and Rezkallah [11]. Balasubramanianand Kandlikar [12] used high speed photography for the
observation of flow behaviors (nucleate boiling, slug for-mation, dryout, reverse flow and flow at the exit manifold)during flow boiling of water in a single rectangular mini-channel. Satitchaicharoen and Wongwises [13] studied theflow patterns of vertical upward gas–liquid two-phase flowin mini-gap rectangular channels. The effects of gap size,channel width and liquid viscosity on the flow pattern tran-sitions were examined.
There are some studies dealing with two-phase flow inannuli. Lahey and Ohkawa [14] used the gamma-ray atten-uation technique to determine local void fractions of differ-ent kinds of gas–liquid flow patterns in vertical annularchannels. Kelessidis and Dukler [15] performed vertical up-ward air–water two-phase flow experiments in a verticalannuli (Di = 50.8 mm, Do = 76.2 mm). Bubbly, slug,churn, annular and annular-with-lumps flow patterns wereobserved in their experiments. Osamasali and Chang [16]conducted air–water two-phase flow experiments in hori-zontal annuli with Di = 50.8 mm at various outer diameters(Do = 135.4, 101.6 and 81.9 mm). They could identify fivecommon flow patterns: smooth, wavy, plug, slug and annu-lar. In their experiment, Di/Do ratios slightly affected theflow regime transition.
Ekberg et al. [17] conducted an experiment on two-phase flow in narrow channels of horizontal 430 mm-longconcentric annular tubes, with inner diameter of outer tubeand outer diameter of inner tube of 8.6–6.6 mm and 35.2–33.2 mm, respectively. Air–water was used as the testedfluid, with superficial velocity of air and water within theranges of 0.02–57 m/s and 0.1–6.1 m/s, respectively. Flowpattern, void fraction and pressure drop within the250 mm range were investigated. The flow patterns foundwere slug/plug, stratified-slug, stratified, annular-slug, bub-bly-plug, dispersed bubbly, and churn. The stratified flowpattern was not evident in small tube, but it was believedto occur at low air and water flow rates which was not cov-ered in this experiment. A quick valve-closing method wasused to find the value of void fraction occurred in the chan-nel from the level of water stored between two valves. Thepressure drop was measured within the length of 250 mmusing differential pressure transducer.
Up to now, there has been only one work, carried out byEkberg et al. dealing with two-phase flow in narrow annuli.However, it can be noted that their study concentrated onhorizontal flow and no attention was paid to the effects ofinclination angles. In the present study, the main objectiveis to obtain and clarify the characteristics of flow pattern,pressure drop and void fraction in inclined upward co-cur-rent gas–liquid two-phase flow in a narrow annular channel.The effect of inclination angle on the flow patterns, flow pat-tern maps, pressure drop and void fraction, which havenever before appeared in open literature, are presented.
2. Experimental apparatus and procedure
The schematic diagram of the experimental apparatus isshown in Fig. 1. The main components of the system con-

= Pressure transducer
= Differential pressure transducer
P
Air pressureregulator
= Pressure gaugeP
= Valve
DT
PT
Temperaturedigital display
Air tankAir compressor
Air flowmeter
321
Water pump
Todrain
Water
Water flow meter
Mixing chamber
P
DT
Test sectionθ
PT
Fig. 1. Schematic diagram of the experimental apparatus.
.
150 mm.
Air
45o
Water
Plastic tube ∅18 mm.
Plastic tube∅ 6 mm.
Fig. 3. Schematic diagram of mixing section.
S. Wongwises, M. Pipathattakul / Experimental Thermal and Fluid Science 30 (2006) 345–354 347
sisted of a test section (Fig. 2), an air supply, and a watersupply. The annular test section with an inner diameter(Di) of 8 mm, outer diameter (Do) of 12.5 mm (Hydraulicdiameter (DH) is 4.5 mm) and overall length of 880 mm,made of transparent acrylic glass were used in the presentstudy. Other parts were constructed accurately by machin-ing an ingot of acrylic glass. The ability of wetting/dewett-ing due to different surface tensions was, therefore,minimized. The inclination angles of the test section are0�, 30� and 60�. It should be noted that the test sectionwas accurately constructed and is our latest development.It was designed and employed after problems were encoun-tered from several test sections used in previous experi-ments. The connections of the piping system weredesigned such that parts could be changed very easily.The water at room temperature and atmospheric pressurefrom the water tank was pumped through the rotameter,the air–water mixer and the test section. The surplus waterwas sent back to storage tank through the control valve.Water in the system was controlled by water flowmeter withdifferent measure range. The air at room temperature andatmospheric pressure from the air compressor was pumpedto the air tank with high pressure. The high-pressured airwas sent into the system through the air pressure regulatorin order to control the stability of pressure. Air was suppliedfrom a compressor to pass through the reservoir, the regu-lator, the flow meter, the mixer and the test section.
The air–water mixer was constructed of many small-diameter tubes with 6 mm inside diameter (Fig. 3). Boththe air and water were brought together in a mixer andthen passed through the test section co-currently. The flowrates of air were measured by five sets of rotameters within
420 mm.
Inner glass
Outer glass
Tap 3mm.
PVC tubeBall valve Cover Coupling
30 mm. 220 mm.
Special plug to support theinner tube and reduce theexit effect.
Gap
Fig. 2. Schematic diagr
the range of 0.1–1, 1–10, 10–100, 100–500, 600–3000SCFH, respectively. The flow rates of water were measuredby four sets of rotameters within the range of 0.063–0.315,0.3–1.5, 1–4, 4–36 LPM, respectively. The accuracy of theair and water volumetric flow rates is ±2%. The air–watermixing section served to introduce water smoothly alongthe test section. The water from the mixer flowed togetherwith air, and then flowed back to the storage tank. Type Tthermocouples were used to measure fluid temperatures.The uncertainty of temperature measurements is ±0.1 �C.Air and water pressures at the inlet of the mixer were mea-sured by precision Bourdon tube pressure gauges. Thepressure was measured through a tap with a 1.5 mm holedrilled into the tube in which the fluids flow. Two-phasepressure at the inlet of the test section was measured bythe pressure transducer calibrated from 0 to 10 bar with a±20 mbar accuracy. A differential pressure transducerwas installed in the test section within the length of420 mm, to measure the pressure drop across the test sec-tion. The range of the transducer was 5–500 kPa. Thetransducer has an accuracy of ±0.1% of its calibrated span.The averaging time of pressure drop measurements wasaround 5 s. All pressure taps were mounted flush in thetube wall. Liquid hold-up was measured by using twoquickly-closing valves. The uncertainty in the measured li-quid hold-up was estimated to be 0.2%. These valves weresimultaneously closed to determine the relative volume ofair and water trapped. Three samples were taken to obtainthe average value. The process of each flow pattern forma-tion was registered in detail by high-speed camera anddigital camera.
Experiments were conducted at various air and waterflow rates, various inclination angles of the channel. Inthe experiments, the air flow rate was increased by smallincrements while the water flow rate was kept constant ata pre-selected value. The system was allowed to approachsteady conditions before the air and water flow rates, flowpattern, pressure drop and void fraction were recorded.
tube
tube
Flowdirection
O-ring seal
30 mm. 220 mm.
Special plug to support theinner tube and reduce theentrance effect.
am of test section.

348 S. Wongwises, M. Pipathattakul / Experimental Thermal and Fluid Science 30 (2006) 345–354
3. Results and discussion
3.1. Flow patterns
Visual observations were obtained using a high-speedcamera, digital camera and video recorder. Typical photo-graphs and sketches of the observed flow patterns, ob-tained at the middle of the test section, are shown inFigs. 4–6. These observed flow patterns can be describedas follows.
a. Plug flow (P): This flow pattern occurs at a relativelylow air velocity. The flow pattern is characterized by acontinuous stream of elongated bubbles flowing along theupperside of the tube.
b. Slug flow (S): At a certain air flow rate, the air–waterinterface becomes more wavy and unstable. Waves withhigher amplitudes grow and block the whole tube sectionand are then pushed strongly by the air with a very highvelocity. Water slugs occasionally pass through the tubewith a higher velocity than the bulk of the water. The up-stream and downstream portions of water slug are similarto stratified wavy flow.
c. Annular flow (A): This flow pattern is characterizedby the complete separation of the water and air, with flow-
Fig. 4. Sketches of flow patterns.
Fig. 5. Flow patterns for Do = 12.5 mm, Do = 8.0 mm, h = 0�.
ing of the water film on the outer and inner tube walls andair in the core.
d. Annular/slug flow (A/S): Formation of the annular/slug flow is similar to that of the annular flow, except forsome frequent appearances of water slug.
e. Bubbly/plug flow (B/P): With increasing air flow rate,many small bubbles are combined to form ‘‘bullet shaped’’bubbles. The train of these bubbles follows the channel linein the continuous liquid phase which contains a dispersionof smaller bubbles.
f. Bubbly/slug–plug flow (B/S–P): This is similar to thebubbly/plug flow, however due to higher air velocity, largerbubbles are formed through combination of smaller ones.In this flow pattern, slug and plug flow take place by turnsand is difficult to be identified.
g. Churn flow (C): Churn flow is formed by a break-down of the slug flow bubbles. This leads to an oscillatorymotion, for example, of the liquid downward and upwardflows in the inclined tube.
h. Dispersed bubbly flow (Db): The flowing liquid phaseis continuous and contains a dispersion of small circular-shaped bubbles of various sizes.
i. Slug/bubbly flow (S/B): Similar to slug flow, but theliquid slug contains a dispersion of smaller bubbles.
It should be noted that slug flow was found only in thehorizontal channel whereas slug/bubbly flow was found

Fig. 6. Flow patterns for Do = 12.5 mm, Do = 8.0 mm, h = 30�.
SUPERFICIAL GAS VELOCITY (m/s).01 .1 1 10 100
SU
PE
RF
ICIA
L LI
QU
ID V
ELO
CIT
Y (
m/s
)
.01
.1
1
10
Do = 12.5 mm.Di = 8.0 mm.
AirWater
o= 30
Plug flow (P)Slug/Bubbly flow (S/B)Annular/Slug flow (A/S)Annular flow (A)
Bubbly/Slug-Plug flow (B/S-P)Bubbly/Plug flow (B/P)
Churn flow (C)Dispersed bubbly flow (Db)
CDb
B/S-PB/P
P S/B A/S A
θθ
Fig. 8. Present flow pattern map for Do = 12.5 mm, Di = 8.0 mm, h = 30�.
SUPERFICIAL GAS VELOCITY (m/s)
.01 .1 1 10 100
SU
PE
RF
ICIA
L LI
QU
ID V
ELO
CIT
Y (
m/s
)
.01
.1
1
10
Do = 12.5 mm.Di = 8.0 mm.Horizontal pipe o(θ = 0 )
AirWater
Plug flow (P)Slug flow (S)Annular/Slug flow (A/S)Annular flow (A)
Bubbly/Plug flow (B/P)Bubbly/Slug-Plug flow (B/S-P)Churn flow (C)Dispersed bubbly flow (Db)
CDb
B/S-P
B/P
P S A/S A
Fig. 7. Present flow pattern map for Do = 12.5 mm, Do = 8.0 mm, h = 0�.
S. Wongwises, M. Pipathattakul / Experimental Thermal and Fluid Science 30 (2006) 345–354 349
only in the inclined channel. The usual method in the pre-sentation of flow pattern data, is to classify the flow patternby visual observation and plot the data as a flow patternmap in terms of system parameters. Parameters used inthe present study are the phase superficial velocities. Thesuperficial velocity of gas (USG) and of liquid (USL) referto the situation where the designated phase flows alone inthe pipe. In the present study, both superficial velocitiesrefer to average ambient conditions (1.013 bar, 30 �C).
Figs. 7–9 show two-phase flow data and flow patternmaps for a test section having Di = 8 mm, Do = 12.5 mm,at h = 0�, 30� and 60�, respectively. The solid lines in thisfigure represent the boundary of the flow patterns and tran-sition from one flow pattern to another. Actually, due to theuncertainty at the vicinity of the transitions between flowpatterns, the flow patterns do not change suddenly. There-fore, the transition lines should be represented as broadtransition bands. The flow pattern map is valid in the rangeof 0.02–65.50 m/s for USG, and 0.07–6.10 for USL.
In Fig. 10, a comparison is shown of our present flowpattern transitions obtained from the horizontal channelwith the measured data of Ekberg et al. [17] obtained fromthe air–water experiment using horizontal annuli withDi = 6.6 mm and Do = 8.6 mm. The region of plug flow ob-tained from the present study is in good agreement with theslug/plug flow region obtained from Ekberg et al. All theirstratified-slug flow data are in the slug flow region of thepresent flow pattern map. The annular-slug flow dataagrees very well with that of our annular/slug flow region.Most of the annular flow data of Ekberg et al. is located inour annular flow region. The churn flow data of Ekberget al. also shows significant agreements with respect toour transition lines. Some churn flow data is located in

SUPERFICIAL GAS VELOCITY (m/s)
.01 .1 1 10 100
SU
PE
RF
ICIA
L LI
QU
ID V
ELO
CIT
Y (
m/s
)
.01
.1
1
10
AirWater
o= 60Do = 12.5 mm.Di = 8.0 mm.
Plug flow (P)Slug/Bubbly flow (S/B)Annular/Slug flow (A/S)Annular flow (A)
Bubbly/Slug-Plug flow (B/S-P)Bubbly/Plug flow (B/P)
Churn flow (C)Dispersed bubbly flow (Db)
CDb
B/S-PB/P
S/B A/S AP
θθ
Fig. 9. Present flow pattern map for Do = 12.5 mm, Di = 8.0 mm, h = 60�.
SUPERFICIAL GAS VELOCITY (m/s).01 .1 1 10 100
SU
PE
RF
ICIA
L LI
QU
ID V
ELO
CIT
Y (
m/s
)
.01
.1
1
10
Slug/Plug flowStratified-Slug flowAnnular-Slug flowAnnular flowBubbly-Plug flowChurn flowDispersed bubbly flow
P S A/S A
C
B/S-P
B/P
Db
Do Di
12.5 mm. 8.0 mm.
= 8.6 mm. , = 6.6 mm.Data of Ekberg (1999)
Present transition lines
Do Di
( = 0º)θ
Fig. 10. Present flow pattern map compared with the experimental data ofEkberg et al. [17].
Fig. 11. Effect of inclination angle on the air–water flow pattern map foran annular channel with Do = 12.5 mm, Di = 8.0 mm.
350 S. Wongwises, M. Pipathattakul / Experimental Thermal and Fluid Science 30 (2006) 345–354
the region of bubbly/slug–plug flow and annular/slug flowin our map. The bubbly–plug flow region of Ekberg et al. isin good agreement with respect to our bubbly/slug–plugflow region. Some dispersed bubbly flow data of Ekberget al. appear in the bubbly/plug flow region of our flow re-gime map. Some discrepancies in the comparisons dependmainly on the identification of flow pattern according totheir definitions and also the configurations of inlet andoutlet sections. However, in general, some parts of theresults agree qualitatively.
Fig. 11 shows the flow pattern maps for air–water at dif-ferent inclination angles. The effect of the inclination angleon the transition lines between the plug flow (P) and theslug flow (S) for h = 0�, and between the plug flow (P)and the slug/bubbly flow (S/B) for h = 30� and 60� are veryinteresting. At the same superficial water velocity, as achannel with a higher inclination angle was used, theP! S transition line (for h = 0�) and the P ! S/B transi-tion line (for h = 30�, 60�) shifts to a lower value of super-ficial air velocity. As the inclination angle increases, thegravitational force increases. As a result, a channel with ahigher inclination angle enables the bubbles to be formedat lower air velocity. This is different from the S ! A/S(for h = 0�) and the S/B ! A/S (for h = 30�, 60�), the A/
S ! A and B/S–P ! C transition line, which tend to shiftto a higher value of superficial air velocity at the samesuperficial liquid velocity. In these flow regions, the gravitydominates the flow mechanism. The increase of the airvelocity enables the flow pattern to be maintained. Itshould be noted that, as the inclination angle increases,there are only small shifts of the transition line betweenthe dispersed bubbly flow (Db) and the bubbly/plug flow(B/P), the bubbly/plug flow (B/P) and the bubbly/slug–plug flow (B/S–P), and the bubbly/plug flow (B/P) andthe plug flow (P). The plug flow region becomes smaller,while the slug flow region (for h = 0�) and the slug/bubblyflow region for h = 30� and 60� become larger.
3.2. Pressure drop
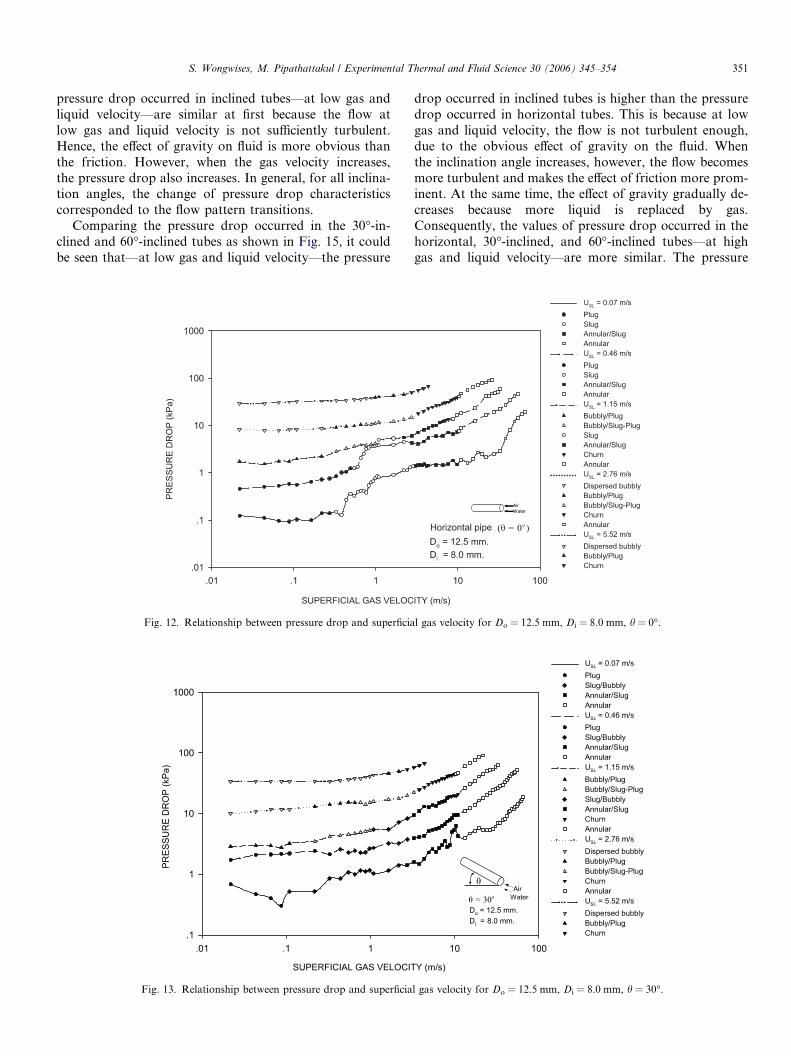
Considering the pressure drop in the horizontal tubes(h = 0�), it could be seen from Fig. 12 that the pressuredrop depends on flow pattern and velocity of gas and li-quid. At low liquid velocity, the increase of gas veloc-ity—until the flow pattern changed from plug flow toslug flow—makes the pressure drop increase quickly. Thisis because when the gas velocity increases, the liquid slugis pushed by the high speed gas to move rapidly, and causesthe pressure drop to increase abruptly. When the gas veloc-ity further increases until the flow pattern changes fromslug flow to annular/slug flow, the liquid is more replacedby gas and the rise of pressure drop stops. When the gasvelocity is high enough to induce sufficient turbulence inthe fluid, the pressure drop begins to rise again, due to fric-tion. At higher liquid velocity, on the other hand, the pres-sure drop rises slowly at first, due to low gas velocity. Thisis similar to a single-phase flow—i.e., liquid. However,when the gas velocity increases until the flow is sufficientlyturbulent, the pressure drop is also risen.
Considering the pressure drop in the tubes with h = 30�and 60� as shown in Figs. 13 and 14, it could be seen that atlow gas and liquid velocity, the pressure drop during theslug/bubbly flow pattern is not risen abruptly as in the hor-izontal tubes, because of the effect of gravity. The values of
S. Wongwises, M. Pipathattakul / Experimental Thermal and Fluid Science 30 (2006) 345–354 351
pressure drop occurred in inclined tubes—at low gas andliquid velocity—are similar at first because the flow atlow gas and liquid velocity is not sufficiently turbulent.Hence, the effect of gravity on fluid is more obvious thanthe friction. However, when the gas velocity increases,the pressure drop also increases. In general, for all inclina-tion angles, the change of pressure drop characteristicscorresponded to the flow pattern transitions.
Comparing the pressure drop occurred in the 30�-in-clined and 60�-inclined tubes as shown in Fig. 15, it couldbe seen that—at low gas and liquid velocity—the pressure
Fig. 12. Relationship between pressure drop and superficia
Fig. 13. Relationship between pressure drop and superficia
drop occurred in inclined tubes is higher than the pressuredrop occurred in horizontal tubes. This is because at lowgas and liquid velocity, the flow is not turbulent enough,due to the obvious effect of gravity on the fluid. Whenthe inclination angle increases, however, the flow becomesmore turbulent and makes the effect of friction more prom-inent. At the same time, the effect of gravity gradually de-creases because more liquid is replaced by gas.Consequently, the values of pressure drop occurred in thehorizontal, 30�-inclined, and 60�-inclined tubes—at highgas and liquid velocity—are more similar. The pressure
AirWater
l gas velocity for Do = 12.5 mm, Di = 8.0 mm, h = 0�.
l gas velocity for Do = 12.5 mm, Di = 8.0 mm, h = 30�.

Fig. 14. Relationship between pressure drop and superficial gas velocity for Do = 12.5 mm, Di = 8.0 mm, h = 60�.
352 S. Wongwises, M. Pipathattakul / Experimental Thermal and Fluid Science 30 (2006) 345–354
drop in inclined tubes tends to be slightly higher, due to theeffect of gravity on fluid inside the inclined tube. The two-phase frictional pressure gradient can be obtained by sub-tracting the gravitational and accelerational terms fromthe total experimental pressure gradient. Fig. 16 showsthe plot of Martinelli parameter against the two-phase fric-tional multiplier. In this figure, comparison of experimentaldata with the Lockhart–Martinelli correlation is shown.The correlation with C = 5 and 20 are shown by a solidline. Fig. 17 shows the comparison of the homogeneousflow model (HEM) with experimental data for h = 0�.There is an overall agreement between the results obtainedfrom the experiment and those obtained from the model.
Fig. 15. Relationship between pressure drop and superficial gas velocityfor Do = 12.5 mm, Di = 8.0 mm, h = 0�, 30� and 60�.
3.3. Void fraction
From Figs. 18–20, values of void fraction found in thehorizontal, 30�-, and 60�-inclined tubes tend to go in thesame direction—that is, varied by the values of superficialvelocity of both gas and liquid. In other words, void frac-tion increases when the gas velocity increases. For example,when the fluid changes its flow pattern from annular/slugflow to annular flow (A/S ! A), it has to increase its veloc-ity in order to form a liquid film at the tube surface.According to the definition of annular flow, when the gasvelocity increases, the liquid part would be increasingly re-placed with gas. This causes the increase of void fraction.On the other hand, when the liquid velocity increases, thevalue of void fraction decrease, due to more replacementof gas with liquid.
Fig. 16. Martinelli parameter versus the two-phase frictional multiplier.

Fig. 17. Comparison of the present data with the prediction.
Fig. 18. Relationship between void fraction and superficial gas velocityfor Do = 12.5 mm, Di = 8.0 mm, h = 0�.
Fig. 19. Relationship between void fraction and superficial gas velocityfor Do = 12.5 mm, Di = 8.0 mm, h = 30�.
Fig. 20. Relationship between void fraction and superficial gas velocityfor Do = 12.5 mm, Di = 8.0 mm, h = 60�.
S. Wongwises, M. Pipathattakul / Experimental Thermal and Fluid Science 30 (2006) 345–354 353
From Figs. 18–20, values of void fraction occurred inthe tube with h = 0�, 30� and 60� were similar. However,the value of void fraction seems to decrease when the incli-nation angle increase, because the liquid was naturallypulled to the bottom by gravity when the inclination angleincreases. Some part of liquid may be able to resist the gasflow, which increases amount of water stored in the in-clined tubes. Hence, the value of void fraction tends to de-crease when the inclination angle increases. Fig. 21 showsthe plot of Martinelli parameter against the measured voidfraction. It can be clearly seen that void fraction ap-proaches 1 when Martinelli parameter is decreased.Fig. 22 shows the comparison of the correlation proposedby the CISE group (Premoli et al. [18]) with the presentmeasured data. The results obtained from the model showreasonable agreement with the experimental data at highsuperficial velocity of water. It should be noted that severalmathematical models were evaluated in our study. How-ever, only the best one is presented.
Fig. 21. Martinelli parameter versus void fraction.

Fig. 22. Comparison of the present data with the prediction.
354 S. Wongwises, M. Pipathattakul / Experimental Thermal and Fluid Science 30 (2006) 345–354
4. Conclusion
The experimental results of flow pattern, void fractionand pressure drop of gas–liquid flow in a narrow concentricannular channel were presented. The annular transparenttest section with an inner diameter of 8 mm, outer diameterof 12.5 mm, and overall length of 880 mm was used. Theinclination angles of the test section (h) were 0�, 30� and60�. Air and water were used as working fluids. The gassuperficial velocity and liquid superficial velocity were var-ied in a range of 0.0218–65.4 m/s and 0.069–6.02 m/s,respectively. The plug, slug, annular/slug, annular, bub-bly/plug, bubbly/slug–plug, churn, slug/bubbly and dis-persed bubbly two-phase flow patterns were observed inthe experiments. The slug/bubbly flow pattern was foundonly in the case of h = 30� and 60�, while the slug flow pat-tern was found only in the horizontal channel. The exper-imental results showed that the inclination angle has asignificant effect on the flow pattern transition, pressuredrop and void fraction. Several existing models were usedto compare calculations with the experimental data. How-ever, in the present paper, the best ones were proposed. Forh = 0�, the homogeneous flow model (HEM) gave the over-all agreement with the measured pressure drop data whilethe CISE correlation gave reasonable agreement with thevoid fraction data.
Acknowledgement
The present study was financially supported by the Thai-land Research Fund (TRF) whose guidance and assistanceare gratefully acknowledged.
References
[1] L. Zhao, K.S. Rezkallah, Gas–liquid flow patterns at micro-gravity condition, International Journal Multiphase Flow 19 (1993)751–763.
[2] T. Wilmarth, M. Ishii, Two-phase flow regime in narrow rectangularvertical and horizontal channels, International Journal of Heat andMass Transfer 37 (1994) 1749–1758.
[3] T. Wilmarth, M. Ishii, Interfacial area concentration and voidfraction of two-phase flow in narrow rectangular vertical channels,Journal of Fluid Engineering 19 (1997) 916–922.
[4] J. Bonjour, M. Lallemand, Flow patterns during boiling in a narrowspace between two vertical surfaces, International Journal of Multi-phase Flow 24 (1998) 947–960.
[5] J. Xu, Experimental study on gas–liquid two-phase flow regimes inrectangular channels with mini gaps, International Journal of Heatand Fluid Flow 20 (1999) 422–428.
[6] J. Xu, P. Cheng, T.S. Zhao, Gas–liquid two-phase flow regimes inrectangular channels with mini/micro gaps, International Journal ofMultiphase Flow 25 (1999) 411–432.
[7] T. Hibiki, K. Mishima, Flow regime transition criteria for upwardtwo-phase flow in vertical narrow rectangular channels, NuclearEngineering and Design 203 (2001) 117–131.
[8] K. Mishima, M. Ishii, Flow regime transition criteria for upward two-phase flow in vertical tubes, International Journal of Heat and MassTransfer 27 (1984) 723–737.
[9] T.S. Zhao, Q.C. Bi, Co-current air–water two-phase flow patterns invertical triangular micro-channels, International Journal of Multi-phase Flow 27 (2001) 765–782.
[10] M.K. Akbar, D.A. Plummer, S.M. Ghiaasiaan, On gas–liquid two-phase flow regimes in micro-channels, International Journal ofMultiphase Flow 29 (2003) 855–865.
[11] K.S. Rezkallah, Weber number based flow pattern maps for liquid–gas flows at microgravity, International Journal of Multiphase Flow22 (1996) 1265–1270.
[12] P. Balasubramanian, S.G. Kandlikar, High speed photographicobservation of flow patterns during flow boiling in single rectangularminichannel, ASME Summer Heat Transfer Conference July 21–23,2003, Las Vegas, Nevada, USA.
[13] P. Satitchaicharoen, S. Wongwises, Two-phase flow pattern maps forvertical upward gas–liquid flow in mini-gap channels, InternationalJournal of Multiphase Flow 30 (2004) 225–236.
[14] R.T. Lahey, K. Ohkawa, An experimental investigation of phasedistribution in an eccentric annulus, International Journal of Multi-phase flow 15 (1989) 447–457.
[15] V.C. Kelessidis, A.E. Dukler, Modeling flow pattern transitionsfor upward gas–liquid flow in vertical concentric annuli, InternationalJournal of Multiphase Flow 15 (1989) 173–191.
[16] S.I. Osamasali, J.S. Chang, Two-phase flow regime transition in ahorizontal pipe and annulus flow under gas–liquid two-phase flow,ASME FED 72 (1988) 63–69.
[17] N.P. Ekberg, S.M. Ghiaasiaan, S.I. Abdel-Khalik, M. Yoda, S.M.Jeter, Gas–liquid two-phase flow in narrow horizontal annuli,Nuclear Engineering and Design 192 (1999) 59–80.
[18] A. Premoli, D. Francesco, A. Prina, A dimensionless correlation fordetermining the density of two-phase mixtures, Lo Termotecnica 25(1971) 17–26.