flow control on helicopter rotor blades via active gurney …€¦ · the active gurney flap (agf)...
TRANSCRIPT

1
Abstract
The Active Gurney Flap (AGF) is a small, flat
tab cyclically deployed and retracted at lower
surface of the rotor blade near its trailing edge.
It is expected that the device may improve
performance of modern helicopters. The main
goal of presented investigations was to develop
research methodology and next to use it in
studies on phenomena occurring in the flow
around helicopter-rotor blades equipped with
AGF. Conducted CFD simulations aimed at
validation of the developed methodology as well
as at significant supplementing and extension of
results of experimental research. Simplified
sensitivity analysis has been conducted aiming
at determination of geometric and motion-
control parameters of the AGF, optimal from
point of view of helicopter-performance
improvement.
1 Introduction
Active flow control on helicopter-rotor blades is
one of promising directions of development in
Rotorcraft Engineering, aiming at improvement
both the performance and environmental impact
of modern helicopters.
Flow on rotor blades may be controlled by
different means, including: fluidic devices [1],
vortex generators [2] or mechanical devices
mounted in proximity of blade trailing edge [3].
The solution presented in this paper belongs to
the third of above groups and is named Active
Gurney Flap (AGF).
The classic Gurney Flap [4] is a small, flat
tab located at a pressure side of lifting surface
near its trailing edge. The tab deflects the air
stream behind the trailing edge downwards,
leading to lift increase. In helicopter
applications, instead of static tab, the
dynamically deployed and retracted Gurney flap
is more useful, because of strong dynamic
effects in flow during rotorcraft flight.
In Rotorcraft Engineering, the Active
Gurney Flap is a small, flat tab located at lower
surface of the blade near its trailing edge. The
tab is cyclically deployed and retracted
perpendicularly to the blade surface. When
deployed, the tab deflects air stream behind the
trailing edge downwards, leading to lift
increase, which is especially important on the
retreating blade of the rotor. On the advancing
blade, the AGF is retracted to minimise rotor
torque. Such performance-enhancement
application of the AGF is realised in one
deployment-retreatment cycle per one
revolution of the rotor. Higher frequencies of
AGF motion are considered for vibration-
control purposes. Due to technical limitations,
the deployable tab is usually located at certain
distance from the trailing edge of the blade, as
shown in Fig. 1.
Fig. 1 Vortex structures around a trailing edge
of the blade with fully deployed Active Gurney Flap.
The AGF-type device, through active control of
the flow on the blades may significantly
improve aerodynamic properties of the rotor.
However, to take full advantage of potential
benefits of AGF applications it is necessary to
gain knowledge about physical phenomena that
FLOW CONTROL ON HELICOPTER-ROTOR BLADES VIA ACTIVE GURNEY FLAP
Wienczyslaw Stalewski*
*Institute of Aviation, Poland
Keywords: helicopter rotor blades, flow control, Active Gurney Flap, rotorcraft performance
AGF

W.STALEWSKI
2
occur in the flow around such configurations.
Eventually, the knowledge should help to
answer the question: how to design, implement
and control the AGF-type devices so as to gain
maximum profits, e.g. significant improvement
of helicopter performance.
Investigations presented in the paper have
focused on the topics formulated above and
have been conducted based on computational-
research methodology within the EU 7th FWP
Project COMROTAG ("Development and
Testing of Computational Methods to Simulate
Helicopter Rotors with Active Gurney Flap")
realised for the Clean Sky Joint Technology
Initiative.
2 Methodology
The general scheme of developed methodology
of simulation of forward flight of helicopter
main rotor is shown in Fig. 2. In the presented
approach, the simulation of rotor flight consists
in the solution of unsteady Navier-Stokes
Equations in time-varying domain surrounding
the rotating rotor. The Navier-Stokes Equations
are solved using the commercial code ANSYS
FLUENT [6]. All computational activities
concerning specific rotorcraft aspects, including
the AGF motion, are performed by the
developed code Virtual-Rotor-3D which is
compiled module of User Defined Functions,
linked with essential code of ANSYS FLUENT.
Among others, the module Virtual-Rotor-3D is
responsible for modelling of:
rotor forward flight and rotational motion
feathering of the rotor blade, resulting from
assumed collective and cyclic pitch controls
and pitch-flap coupling
flap and lag motion of the blades around flap
and lag hinges
cyclic motion of the AGF
Coupled equations of flap and lag motion of the
blades are solved simultaneously with the
solution of Navier-Stokes Equations, taking into
account effects of dampers and springs, if any.
The flap-and-lag motion is described by the
system of four ordinary differential equations of
the first order on four unknown functions:
β(t), (t), β(t), (t) , where is the flap
angle, is the lag angle, =d/dt, =d/dt.
The blade pitch controls may be changed
during the simulation which is used when
trimming the rotor so as to obtain required
thrust and moments. Alternative trimming
procedure, so called "zero-flapping" consists in
establishing the cyclic pitch controls so as to
obtain zero 1st-harmonics of blade flapping.
The input data consist of computational
mesh and three data sets describing: flight
conditions, flight controls and rotor data.
Fig. 2 The general scheme of developed methodology of
simulation of flight of helicopter main rotor with blades
equipped with AGF.
In the presented approach, the computational
mesh is divided into several sub-domains.
Around each blade, the cylinder-conical volume
zone is defined, as it is shown in Fig. 3. Such
zones are embedded in a cylinder-volume zone
which is embedded in a far-field, cuboid zone.
The overall topological structure of the mesh is
presented in Fig. 4. During the rotor flight
simulation, the mesh surrounding each blade is
moving together with the blade. This motion is a
combination of feathering, flapping and lead-lag
motion. Additionally the mesh surrounding each
blade is rotating together with the cylindrical
zone, around the rotor-rotation axis. The motion
of meshes surrounding the blades, relative to the
cylindrical zone, is realised by the use of
Dynamic Mesh and Sliding Mesh techniques
implemented in the ANSYS FLUENT solver.
The rotational motion of the cylindrical zone
inside the far-field zone is also realised based on
the Sliding Mesh technique.
Flight ConditionsMach Number
Pressure
Temperature
Rotor DataGeometry
Mass
Structure
Flight ControlRotor Rot. Speed
Blade-Pitch Control
AGF-Motion Control
Boundary
Conditions
Motion &
Deformation of
Computational
Mesh
ANSYS FLUENT(URANS Solver)
VIRTUAL ROTOR 3D(in-house UDF module)
Static Pressure & Wall Shear Stress
Distribution on Rotor Blades

3
FLOW CONTROL ON HELICOPTER-ROTOR BLADES
VIA ACTIVE GURNEY FLAP
Fig. 3. The cylinder-conical zone surrounding
each of the rotor blades.
Fig. 4. Overall topology of computational mesh.
The mesh inside a separate volume zone
surrounding the AGF is locally deformed so as
to model the AGF motion, as shown in Fig. 5.
The developed method of the AGF motion
ensures high quality of deformed mesh as well
as full repeatability of deformations. The
method is an alternative to the Overlapping Grid
Methods [5], usually used to model the flow
around the AGF.
3 Computational Studies on Flow Control
on Rotor Blades via Active Gurney Flap
Computational studies conducted in the program
COMROTAG have been aiming at:
validation of developed and implemented
CFD codes against results of WTT,
significant gain of knowledge about flow
control through Active Gurney Flap in
rotorcraft applications,
conduction of computer simulations prior to
flight tests of real rotor/helicopter (so called
"blind tests"), in order to define the optimal
scope of flight tests as well as to identify
potentially dangerous phases of flight.
Computational studies have been conducted for
both the 2D and 3D configurations.
Fig. 5. 3D-mesh in proximity of fully retracted AGF
(upper graph) and fully deployed AGF (lower graph).
3.1 Two-Dimensional Studies
on Flow Control via AGF
3.1.1 Computational Simulations of 2D WTT
of Blade Segment Equipped with AGF
The subject of conducted two-dimensional
experimental studies on AGF was the blade
segment NACA0012 with thickened trailing
edge and equipped with AGF. The angle of
attack of the segment was fixed during every
run, while the AGF was cyclically deployed and
retracted. The same conditions were modelled in
CFD simulations, including modelling of the
three-dimensional space of the test-chamber
inside. For these quasi-2D simulations,

W.STALEWSKI
4
simplified version of the developed software
(Virtual-Rotor-2.5D) intended to solve such
problems has been used. Presented results refer
to WTT conducted for flow velocity V=60m/s,
5Hz frequency of AGF oscillations and ramp
schedule of AGF motion shown in Fig. 6.
Fig. 6. Momentary height of the AGF (hagf) vs. time (t)
during one period of AGF deployment-retraction cycle.
For the case of angle of attack =4deg, Fig. 7
compares the CFD and WTT results in respect
to time-variable lift coefficient CL measured
during one period of AGF deployment-
retraction cycle. While the time averaged
computational and experimental values of CL
are similar, the computational result indicates
strong oscillations, especially in the phase when
the AGF is fully deployed. Such phenomenon is
not observed in experimental results.
Presented in Fig. 8 frequency-domain
analysis of time-varying pitching-moment
coefficient (Cm) shows, that for CFD results the
dominant frequency of oscillations of global
aerodynamic coefficients is approximately
545 Hz, which is close to 566 Hz - the
dominant frequency of unsteady vortex
shedding observed in other CFD results related
to the static case with fully deployed AGF and
=0deg. Fig. 8 shows also dominant, but much
weaker frequency 1100 Hz, which is close to
1123 Hz - the dominant frequency of unsteady
vortex shedding observed in another CFD
results concerning the static case with retracted
AGF and =0deg. Unfortunately, the
frequency-domain analysis of the experimental
results does not indicate any dominant
frequencies neither in proximity 592 Hz nor in
proximity 1075 Hz, despite that these dominant
frequencies were observed previously in WTT
results in the static cases for both the AGF fully
deployed and fully retracted (=0deg).
This is all the more surprising since the
PIV results confirm the occurrence of unsteady
vortex shedding in the discussed experimental
case. One of possible explanation of this
incoherence of WTT results is that the pressure-
measuring signals were filtered, so the higher
frequencies have been cut.
Fig. 7. Momentary lift coefficient (CL) vs. time (t).
Comparison of CFD and WTT results.
Test case: =4deg, V=60m/s.
Fig. 8. Frequency-domain analysis of pitching moment
coefficient Cm. Comparison of CFD and WTT results.
Test case: =4deg, V=60m/s.
Exemplary comparison of PIV results obtained
in WTT and results of CFD concerning
Q-criterion contours is presented in Fig. 9.
t [s]
ha
gf/C
0.00 0.02 0.04 0.06 0.08 0.10 0.12 0.14 0.16 0.18 0.20-0.005
0.000
0.005
0.010
0.015
0.020
0.025
Time [s]
CL
0.00 0.02 0.04 0.06 0.08 0.10 0.12 0.14 0.16 0.18 0.200.40
0.50
0.60
0.70
0.80
0.90
1.00
1.10
1.20
1.30
1.40
Virtual-Rotor-2.5D
WTT (U.Twente)
= 4 deg, V = 60 m/s
t [s]
Frequency [Hz]
Cm
-A
mp
litu
de
0 200 400 600 800 1000 1200
0.000
0.002
0.004
0.006
0.008
0.010
WTT (U.Twente)
Frequency [Hz]
Cm
-A
mp
litu
de
0 200 400 600 800 1000 1200
0.000
0.002
0.004
0.006
0.008
0.010
Virtual-Rotor-2.5D
= 4 deg, V = 60 m/s
5
FLOW CONTROL ON HELICOPTER-ROTOR BLADES
VIA ACTIVE GURNEY FLAP
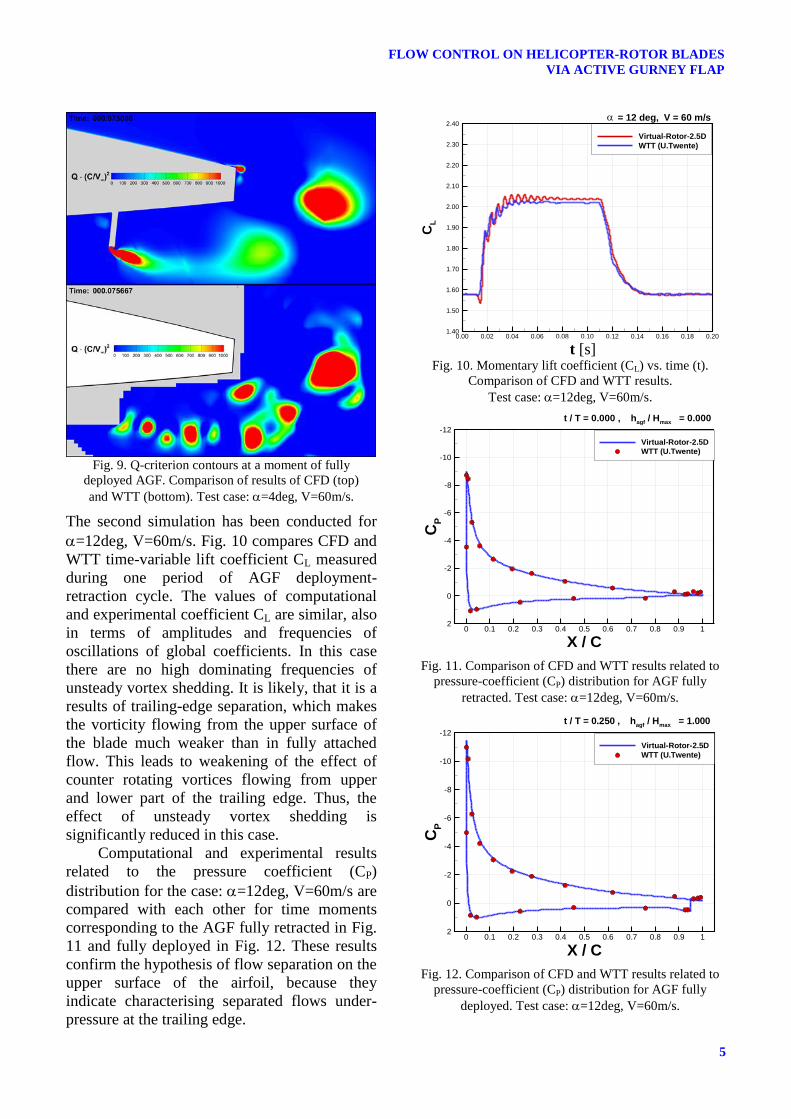
Fig. 9. Q-criterion contours at a moment of fully
deployed AGF. Comparison of results of CFD (top)
and WTT (bottom). Test case: =4deg, V=60m/s.
The second simulation has been conducted for
=12deg, V=60m/s. Fig. 10 compares CFD and
WTT time-variable lift coefficient CL measured
during one period of AGF deployment-
retraction cycle. The values of computational
and experimental coefficient CL are similar, also
in terms of amplitudes and frequencies of
oscillations of global coefficients. In this case
there are no high dominating frequencies of
unsteady vortex shedding. It is likely, that it is a
results of trailing-edge separation, which makes
the vorticity flowing from the upper surface of
the blade much weaker than in fully attached
flow. This leads to weakening of the effect of
counter rotating vortices flowing from upper
and lower part of the trailing edge. Thus, the
effect of unsteady vortex shedding is
significantly reduced in this case.
Computational and experimental results
related to the pressure coefficient (CP)
distribution for the case: =12deg, V=60m/s are
compared with each other for time moments
corresponding to the AGF fully retracted in Fig.
11 and fully deployed in Fig. 12. These results
confirm the hypothesis of flow separation on the
upper surface of the airfoil, because they
indicate characterising separated flows under-
pressure at the trailing edge.
Fig. 10. Momentary lift coefficient (CL) vs. time (t).
Comparison of CFD and WTT results.
Test case: =12deg, V=60m/s.
Fig. 11. Comparison of CFD and WTT results related to
pressure-coefficient (CP) distribution for AGF fully
retracted. Test case: =12deg, V=60m/s.
Fig. 12. Comparison of CFD and WTT results related to
pressure-coefficient (CP) distribution for AGF fully
deployed. Test case: =12deg, V=60m/s.
Time [s]
CL
0.00 0.02 0.04 0.06 0.08 0.10 0.12 0.14 0.16 0.18 0.201.40
1.50
1.60
1.70
1.80
1.90
2.00
2.10
2.20
2.30
2.40
Virtual-Rotor-2.5D
WTT (U.Twente)
= 12 deg, V = 60 m/s
t [s]
X / C
CP
0 0.1 0.2 0.3 0.4 0.5 0.6 0.7 0.8 0.9 1
-12
-10
-8
-6
-4
-2
0
2
Virtual-Rotor-2.5D
WTT (U.Twente)
t / T = 0.000 , hagf
/ Hmax
= 0.000
= 12 deg, V = 60 m/s
X / C
CP
0 0.1 0.2 0.3 0.4 0.5 0.6 0.7 0.8 0.9 1
-12
-10
-8
-6
-4
-2
0
2
Virtual-Rotor-2.5D
WTT (U.Twente)
t / T = 0.250 , hagf
/ Hmax
= 1.000
= 12 deg, V = 60 m/s

W.STALEWSKI
6
3.1.2 Sensitivity Analysis
Based on 2D version of the developed software
a sensitivity analysis has been conducted. The
investigations were focused on searching for
chordwise position and maximum height of the
AGF, optimal from point of view of increase of
lift force generated by a retreating blade.
The subject of conducted simulations was
airfoil NACA0012 with thickened trailing edge.
As it is shown in Fig. 13, angle of attack () of
the airfoil was changed harmonically with
frequency 5Hz, within the range: 1deg ÷ 10deg.
Simultaneously the free-stream Mach number
(M) was changing within the range: from 0.15
for maximum angle of attack (retreating-blade-
flow conditions) to 0.55 for minimum angle of
attack (advancing-blade-flow conditions). The
oscillating airfoil was equipped with the AGF
deployed/retracted according to the sinusoidal
schedule shown in Fig. 13. In the conducted
sensitivity analysis three chordwise positions of
the AGF (Xagf) at 96%, 98% and 100% of airfoil
chord (C) were considered and four maximum
deployments of the AGF (Hmax): 0.5%, 1%,
1.5% and 2% of airfoil chord. The
investigations aimed at determination of
correlations between parameters Xagf, Hmax and
the airfoil lift coefficient CL (defined based on
average dynamic pressure).
Fig. 13 Harmonic changes of angle of attack (a), free
stream Mach number (M) and deployment of AGF (hagf)
assumed in conducted 2D sensitivity analysis.
Fig. 14 presents time-variable lift coefficient
captured during one period of oscillations, for
the clean airfoil and for twelve configurations of
airfoil equipped with AGF. The oscillations of
CL visible in the presented graphs are the result
of unsteady vortex shedding. Intensity and
frequency of this phenomenon depends on
parameters Xagf, Hmax as well as on the phase of
the airfoil motion. Generally it may be
concluded that intensity and frequency of
unsteady vortex shedding tends to decrease
within retreating-blade phase (the highest angles
of attack) which results from possible flow
separations (which was discussed in previous
sub-section), the highest deployment of AGF,
which gives the effect of "the thickest trailing
edge" of the airfoil and from the lowest flow
velocities occurring on the retreating blade.
Fig. 14. Time-variable lift coefficient CL captured during
one period of oscillations, for the clean airfoil and for
twelve configurations of airfoil equipped with AGF.
As opposed to the results discussed in the
previous sub-section, where the ramp schedule
of AGF deployment was applied, in the
discussed simulations expressly dominant
frequencies of unsteady vortex shedding have
not been observed. This is the effect of
continuous, harmonic changes of AGF height -
one of the factors determining the unsteady
t
M
ha
gf/H
ma
x
0.00 0.05 0.10 0.15 0.20-2
0
2
4
6
8
10
12
14
0
0.1
0.2
0.3
0.4
0.5
0.6
0.7
0.8
0.0
0.2
0.4
0.6
0.8
1.0
1.2
1.4
1.6
M
hagf
/ Hmax
[de
g]
[s]
t
CL
0.00 0.05 0.10 0.15 0.20.2
0.3
0.4
0.5
0.6
0.7
0.8
0.9
1.0 Clean Airfoil
Xagf
/C=1.00, Hmax
/C=0.020
Xagf
/C=1.00, Hmax
/C=0.015
Xagf
/C=1.00, Hmax
/C=0.010
Xagf
/C=1.00, Hmax
/C=0.005
[s]
t
CL
0.00 0.05 0.10 0.15 0.20.2
0.3
0.4
0.5
0.6
0.7
0.8
0.9
1.0 Clean Airfoil
Xagf
/C=0.98, Hmax
/C=0.020
Xagf
/C=0.98, Hmax
/C=0.015
Xagf
/C=0.98, Hmax
/C=0.010
Xagf
/C=0.98, Hmax
/C=0.005
[s]
t
CL
0.00 0.05 0.10 0.15 0.20.2
0.3
0.4
0.5
0.6
0.7
0.8
0.9
1.0 Clean Airfoil
Xagf
/C=0.96, Hmax
/C=0.020
Xagf
/C=0.96, Hmax
/C=0.015
Xagf
/C=0.96, Hmax
/C=0.010
Xagf
/C=0.96, Hmax
/C=0.005
[s]

7
FLOW CONTROL ON HELICOPTER-ROTOR BLADES
VIA ACTIVE GURNEY FLAP
vortex-shedding frequency. As the result, in the
presented simulations, for the cases with active
AGF, whole spectrum of frequencies of
unsteady vortex shedding was observed.
Visualisations of vortex shedding for selected
AGF configurations are presented in Fig. 15.
Fig. 16 presents lift-growth coefficient
CL(t) as a function of AGF maximum height for
three chordwise positions of the AGF. The
coefficient CL(t) expresses difference of
momentary lift coefficients CL(t) (defined based
on momentary dynamic pressure) measured for
the retreating-blade moment (t=0.10s), for given
AGF configuration and for the clean airfoil.
Usually, the closer the AGF is placed to
trailing edge, the smaller may be its maximum
height. Therefore, the graph presented in Fig.
16, should help to find optimal compromise
between position and height of designed AGF.
Fig. 15.Unsteady vortex shedding visualised through vorticity-
magnitude contours, for maximum AGF deployment
Hmax/C=0.015 and for three chordwise positions of the AGF.
Fig. 16. Lift-growth coefficient (CL(t)) measured on
retreating-blade, as a function of the AGF max. height,
for three chordwise positions of AGF.
3.2 Three-Dimensional Studies on Flow
Control on Rotor Blades via AGF
Three-dimensional, computational studies on
flow control on rotor blades via AGF, have been
conducted for the case of the 4-blade, fully
articulated model rotor of radius 1.1m. Rotor
rectangular blades of chord 0.09m were
equipped with AGF in spanwise position from
53.5% to 68.5% of rotor radius. The maximum
deployment of AGF was 2.78% of blade chord.
The preliminary computational tests were
conducted for two reference configurations:
1) rotor with Clean-Blades, 2) rotor with blades
equipped with fixed, Passive Gurney Flap
(PGF). The essential tests have been conducted
for three configurations of AGF, differing in
presented in Fig. 17 schedules of AGF motion:
1) sinusoidal (hagf = Hmax: = 270deg),
2) ramp-1 (hagf = Hmax: 198deg ≤ ≤ 342deg)
3) ramp-2 (hagf = Hmax: 243deg ≤ ≤ 297deg)
Fig. 17. Considered variants of AGF-motion schedules.
Rotor forward-flight tests were conducted for
flight conditions: velocity 48m/s, rotor
rotational speed 1600 rpm, zero pitch and bank
angles of the rotor shaft, atmosphere: Sea Level
ISA. For each configuration the forward-flight
simulations have been conducted for several
commanded angles of collective pitch: 0 = 4,
6, 8, 10 and 12 deg. In each single simulation,
the components of commanded cyclic pitch:
θ = (θS, θC) were established so as to fulfil the
"zero-flapping-trimming" requirements:
β1 = (β1S, β1C) = ( 0 , 0 ) (1)
where 1S, 1C are 1st-harmonic components of
blade flapping. According to applied iterative
trimming procedure, corrected cyclic pitch
θ𝑛 was evaluated according to the formula:
θ𝑛 = θ𝑝 − [𝜕𝛽1
𝜕��]
−1
∙ ��1𝑝 (2)
Hmax
/ C
C
L(t
)
0.005 0.010 0.015 0.0200.00
0.10
0.20
0.30
0.40
0.50
0.60
Xagf
/ C = 0.96
Xagf
/ C = 0.98
Xagf
/ C = 1.00
ha
gf/C
0 90 180 270 360-0.005
0.000
0.005
0.010
0.015
0.020
0.025
0.030
Ramp - 1
Ramp - 2
Sinusoidal
[deg]

W.STALEWSKI
8
where θ𝑝 is the current cyclic pitch, β1𝑝 is the
current vector β1 and [𝜕𝛽1
𝜕��] is a gradient matrix.
Selected results of CFD simulations conducted
for two reference configurations: Clean-Blades
and PGF, have been compared with analogous
results of WTT [7]. Fig. 18 compares CFD and
WTT results concerning dependency of torque
coefficient (CQUS) vs. thrust coefficient (CTUS)
(referenced to rotor solidity ) for the Clean-
Blades configuration. In this case the
computational end experimental results agree
with each other quite well. Differences are
visible for the highest values of thrust
coefficient where it is likely that significant
retreating-blade stall occurs. Similar agreement
of CFD and WTT results is visible in Fig. 19,
where computational and experimental
dependencies: torque coefficient (CQUS) vs.
thrust coefficient (CTUS) are compared for the
Passive-Gurney-Flap configuration.
Fig. 18. Forward flight of Model Rotor at V=48m/s.
Dependency (CQUS/) vs. (CTUS/). Results of CFD and
WTT [7]. Clean-Blades configuration.
Fig. 19. Forward flight of Model Rotor at V=48m/s.
Dependency (CQUS/) vs. (CTUS/). Results of CFD and
WTT [7]. Passive-Gurney-Flap configuration.
Fig. 20 shows that application of PGF gives
some performance benefits (i.e. generation of
higher thrust for given torque) in comparison to
Clean-Blades configuration but only above
certain level of thrust coefficient (approx.
CTUS/>0.084). Analysing presented in Fig. 20
results for the configuration AGF(sinusoidal), it
may be concluded, that for higher values of
thrust, this configuration gives similar
performance benefits as PGF configuration. For
lower values of thrust the AGF(sinusoidal)
configuration does not indicate power penalty,
observed for the PGF configuration. The above
conclusions concern also the AGF(ramp-1)
configuration which is shown in Fig. 21.
However, as it is shown in Fig. 22, the
AGF(ramp-2) configuration does not indicate
any significant performance benefits.
Fig. 20. Forward flight of Model Rotor at V=48m/s.
Configurations: Clean-Blades, PGF and AGF(Sinusoidal).
Dependency (CQUS/) vs. (CTUS/).
Fig. 21. Forward flight of Model Rotor at V=48m/s.
Configurations: Clean-Blades, PGF and AGF(Ramp-1).
Dependency (CQUS/) vs. (CTUS/).
Fig. 23 and Fig. 24 compare vortex structures
(Q-criterion iso-surfaces) generated by Clean-
Blades and AGF(sinusoidal) configurations, for
two collective-pitch angles 0= 6 and 10 deg.
As opposed to the case 0=6deg, for the case
0=10deg the strong retreating-blade stall is well
visible for both compared configurations.
CTUS
/
CQ
US/
0.02 0.03 0.04 0.05 0.06 0.07 0.08 0.09 0.10 0.110.000
0.002
0.004
0.006
0.008
0.010
0.012
0.014
WTT
CFDClean Blades
CTUS
/
CQ
US/
0.02 0.03 0.04 0.05 0.06 0.07 0.08 0.09 0.10 0.110.000
0.002
0.004
0.006
0.008
0.010
0.012
0.014
WTT
CFD Passive Gurney Flap
CTUS
/
CQ
US/
0.04 0.05 0.06 0.07 0.08 0.09 0.10 0.110.002
0.004
0.006
0.008
0.010
0.012
0.014
CFD - Clean Blades
CFD - Passive Gurney Flap
CFD - Active Gurney Flap (Sinusoidal)
CTUS
/
CQ
US/
0.04 0.05 0.06 0.07 0.08 0.09 0.10 0.110.002
0.004
0.006
0.008
0.010
0.012
0.014
CFD - Clean Blades
CFD - Passive Gurney Flap
CFD - Active Gurney Flap (Ramp-1)

9
FLOW CONTROL ON HELICOPTER-ROTOR BLADES
VIA ACTIVE GURNEY FLAP
Fig. 22. Forward flight of Model Rotor at V=48m/s.
Configurations: Clean-Blades, PGF and AGF(Ramp-2).
Dependency (CQUS/) vs. (CTUS/).
Fig. 23. Comparison of vortex structures for Clean-Blades
and AGF(Sinusoidal) configurations. 0=6deg.
Moreover, the AGF configurations are
characterised by significant vortex shedding at
end-tips of deployed AGF, which is similar to
formation of classic blade-tip vortices and
which may be additional source of noise
(however, this unfavourable phenomenon in
case of Active Gurney Flap is significantly
reduced compared to Passive-Gurney-Flap
configuration). In the case of Clean-Blades
configuration, at ends of the AGF zone the local
thickening of the trailing edge may cause weak
vortex shedding.
Fig. 24. Comparison of vortex structures for Clean-Blades
and AGF(Sinusoidal) configurations. 0=10deg.
4 Conclusions
The investigations discussed in the paper
focused on phenomena occurring in the flow
around helicopter-rotor blades equipped with
Active Gurney Flaps (AGF).
Validation of the developed CFD codes
confirmed good agreement of computational
and experimental results, concerning both the
quasi-2D and 3D test cases.
Conducted simplified sensitivity analysis
has aimed at determination of geometric and
motion-control parameters of the AGF, optimal
from point of view of helicopter-performance
improvement.
Truly 3D studies on investigated
phenomena have been conducted for the case of
forward flight of model rotor, considering:
two reference configurations: Clean-Blades
and Passive Gurney Flap (PGF),
three configurations with Active Gurney
Flaps, differing in schedules of AGF motion:
"sinusoidal", "ramp-1" and "ramp-2"
Performance benefits have been evaluated based
on analysis of dependency: torque vs. thrust,
favouring these configurations, which for given
torque have generated the highest thrust.
CTUS
/
CQ
US/
0.04 0.05 0.06 0.07 0.08 0.09 0.10 0.110.002
0.004
0.006
0.008
0.010
0.012
0.014
CFD - Clean Blades
CFD - Passive Gurney Flap
CFD - Active Gurney Flap (Ramp-2)

W.STALEWSKI
10
Based on obtained computational results, it may
be concluded that:
For higher values of thrust (likely in presence
of retreating-blade stall), the configurations
with AGF give certain performance benefits
in comparison to the Clean-Blades
configuration, similar to the benefits of the
PGF configuration.
For lower values of thrust, the configurations
with AGF, do not indicate the power penalty,
observed for the PGF configuration.
Above advantages of the AGF concern
configurations of both the "sinusoidal" and
"ramp-1" schedules of motion, but they do
not concern the schedule "ramp-2" which has
not indicated any performance benefits.
Compared to the Clean-Blades configuration,
the AGF configurations are characterised by
significant vortex shedding at end-tips of
deployed AGF.
Nomenclature
C blade chord
CL lift coefficient
CL(t) lift coefficient based on moment. dyn. pressure
CL(t) coefficient of growth of CL(t)
CP pressure coefficient
CQUS torque coefficient (US convention)
CTUS thrust coefficient (US convention)
hagf momentary height of AGF
Hmax maximum height of AGF
M Mach number
Q Q-criterion factor
t time
V velocity
Xagf chordwise position of the AGF
angle of attack
1S, 1C 1st-harmonic components of blade flapping
θ0 commanded collective pitch
θS , θC components of commanded cyclic pitch
rotor solidity
blade azimuthal position
AGF Active Gurney Flap
CFD Computational Fluid Dynamic
PGF Passive Gurney Flap
PIV Particle Image Velocimetry
WTT Wind Tunnel Tests
Acknowledgements
The research leading to these results was financed by the
European Union’s Seventh Framework Programme
(FP7/2007-2013) for the Clean Sky Joint Technology
Initiative under grant agreement No.CSJ-GA-2013-
619627 and by the Ministry of Science of Poland from
funds directed to supporting scientific research, under
agreement No.3129/CLEANSKY/2014/2.
Computational support was obtained from
University of Warsaw Interdisciplinary Centre for
Mathematical and Computational Modelling, in the
Computational Grant No.G52-4.
References
[1] Gardner A.D., Richter K., Rosemann H., Numerical
Investigation of Air Jets for Dynamic Stall Control
on the OA209 Airfoil, Proceedings of ERF 2010,
Paris, 7-9 September 2010.
[2] Heine, B., Mulleners, K., Gardner, A., Mai, H., On
the effects of leading edge vortex generators on an
OA209 airfoil, ODAS2009, 2009.
[3] Feszty D., Gillies E.A., Vezza M., "Alleviation of
Airfoil Dynamic Stall Moments via Trailing-Edge
Flap Flow Control", AIAA Journal, Vol. 42, No. 1
(2004), pp. 17-25.
[4] Wang, J.J., Li Y.C., Choi K-S., Gurney flap - Life
enhancement, mechanisms and applications, Progress
in Aerospace Sciences 44 (2008), pp.22-47.
[5] Kinzel M.P., Maughmer M.D., Duque E.P.N,
Numerical Investigation on the Aerodynamics
of Oscillating Airfoils with Deployable Gurney
Flaps, AIAA Journal Vol.48, No.7, July 2010.
[6] ANSYS, Inc., ANSYS FLUENT User's Guide.
Release 15.0, November 2013. Available from:
http://www.ansys.com.
[7] Gibertini G., Zanotti A., New Technique Implemen-
tation in GVPM, Deliverable Report of CleanSky
Project GUM, GUM/WP2/D2.3, July 2015.
Copyright Statement
The authors confirm that they, and/or their company or
organization, hold copyright on all of the original material
included in this paper. The authors also confirm that they
have obtained permission, from the copyright holder of
any third party material included in this paper, to publish
it as part of their paper. The authors confirm that they
give permission, or have obtained permission from the
copyright holder of this paper, for the publication and
distribution of this paper as part of the ICAS proceedings
or as individual off-prints from the proceedings.