flow and water quality assessment of the jordan creek … · 2019-08-29 · jordan creek is located...
TRANSCRIPT
1
Ozarks Environmental and Water Resources Institute (OEWRI)
Missouri State University (MSU)
Flow and Water Quality Assessment of the
Jordan Creek Underground, Springfield,
Missouri
FINAL REPORT
Prepared by:
Marc R. Owen, M.S., Assistant Director
Sarah LeTarte, Graduate Assistant
Robert T. Pavlowsky, Ph.D., Director
Field work completed by:
Hannah Adams, Kayla Coonen, and Triston Rice, Graduate Assistants
Laboratory work completed by
Kelly Rose, Graduate Assistant and Olivia Johnson, Undergraduate Research Assistant
Prepared for:
The City of Springfield
840 Boonville Ave.
Springfield, MO 65802
February 28, 2019
OEWRI EDR-19-002
2
SCOPE AND OBJECTIVES
The City of Springfield has contracted the Ozarks Environmental and Water Resources Institute
at Missouri State University to measure stream flow and sample water quality parameters in the
Jordan Creek Underground to determine potential inputs from leaking sewer lines and other
shallow groundwater sources. Exfiltration losses from leaking sanitary sewer systems can cause
pollution problems in receiving streams and water quality surveys have been used to locate
wastewater exfiltration from sanitary sewers into local streams (Dove et al., 2013, Owen et al.
2017, Owen et al. 2018). Jordan Creek is located in central Springfield, Missouri and flows
through an underground box culvert that was built in 1928 within the old industrial area of
downtown Springfield. The purpose of this study is to quantify variations in water quality at
base flow along a 4,400 ft reach of the Jordan Creek that includes the portion that flows through
the underground box culvert between Grant Ave. and Sherman Parkway in downtown
Springfield.
The specific objectives of this assessment are to:
1. Perform a source risk assessment using GIS analysis of the segment to locate sewer line
crossings, inflowing tributaries, local springs, faults and other geologic features, and
permitted point discharges;
2. Collect stream discharge information to quantify flow changes within the box culvert;
3. Collect field-based temperature, dissolved oxygen, pH, and specific conductivity and water
quality samples to be analyzed in the laboratory for total phosphorus, total nitrogen, chloride,
and E. coli concentrations at equally spaced stream locations throughout the study reach and;
4. Make specific recommendations to the City of Springfield and its engineers regarding site
prioritization based on results from this exfiltration risk assessment.
STUDY AREA
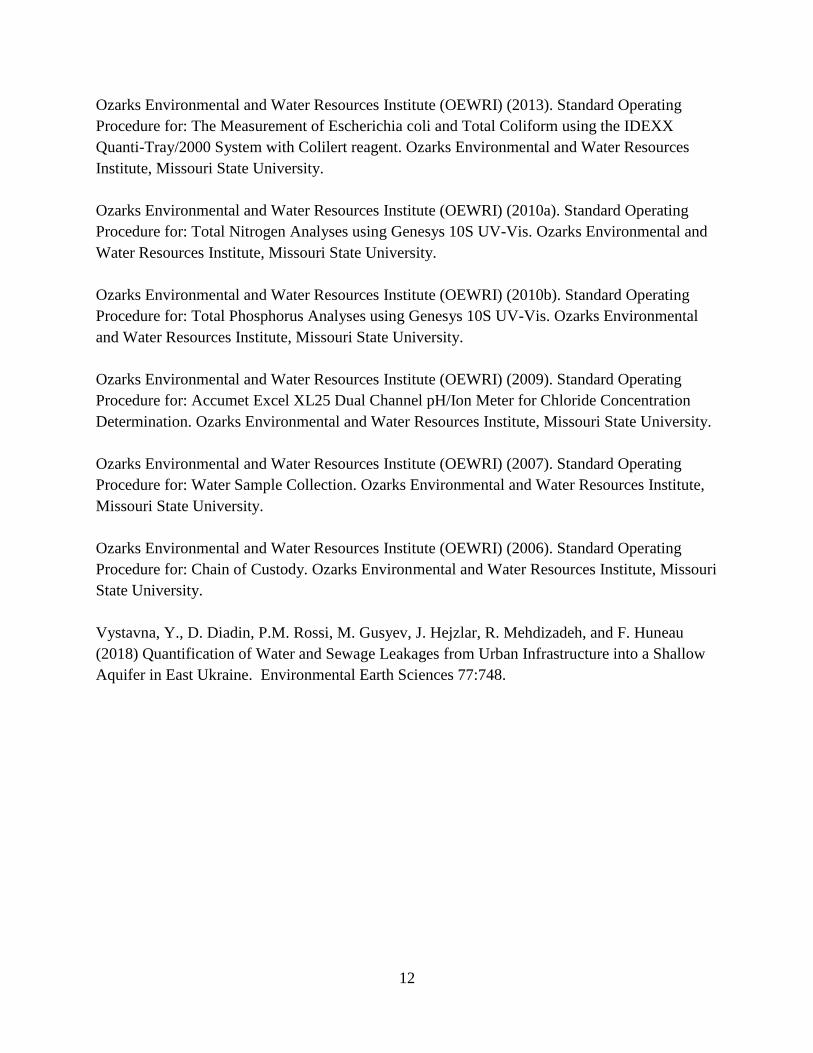
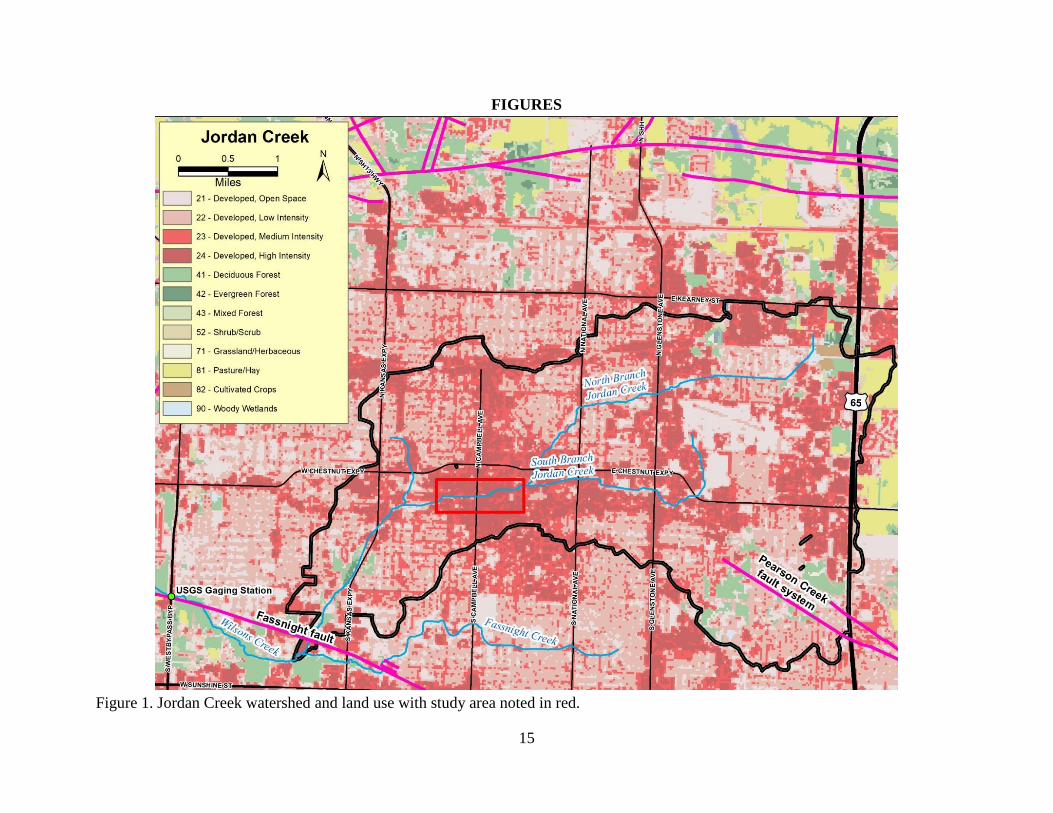
The Jordan Creek watershed (13.5 mi2) drains the City of Springfield and is a main tributary to
Wilson Creek within the James River Basin in southwest Missouri. The North and South
branches of Jordan Creek begin along the city limit of Springfield a few miles east of Glenstone
Avenue and flow west to the upstream end of the underground culvert of the stream near Phelps
St. and Washington Ave. (Figure 1). The stream continues flowing west and resurfaces from the
underground culvert at Main Avenue, continuing southwest to its confluence with Fassnight
Creek just upstream of Scenic Ave. Land use within the watershed is a mix of high-medium
density urban and low density residential land use. The underlying geology of the watershed is
Mississippian age limestone within which a karst landscape has formed where sinkholes, losing
streams, and springs are common (Bullard et al. 2001). The Pearson Creek fault system in the
3
southeast portion of the watershed is connected via karst to Jones Spring that redirects water
across drainage divides.
This study focused on an approximately 4,400 ft reach of Jordan Creek between Sherman
Parkway and Grant Ave. including the approximately 3,300 ft box culvert known as the Jordan
Creek Underground (Figure 2). The original culvert was built to alleviate flooding between
Boonville and Main Avenues in 1928 and was expanded upstream to Washington Ave. in 1934
(Oliver, 1939). The structure includes two separate culverts (north and south) that generally
separates inflows from the two branches during low flow conditions. However, the two culverts
do join together in two reaches where the middle partition wall is absent between Robberson and
Boonville Avenues and again at Campbell Ave. In addition, several holes and archways (<4 ft
wide) also occur in the partition wall allowing water to mix locally between the north and south
culverts. Therefore, low flow discharges that enter the culvert upstream in separate culverts can
mix to varying degrees at different points along the underground culvert.
METHODS
Source Risk Assessment & Infrastructure Identification
Prior to sampling, GIS analysis of the Jordan Creek Underground was used to locate sewer lines,
springs, and faults. This was accomplished using geospatial data from Missouri Spatial Data
Information Service (MSDIS) and The City of Springfield.
Field Sampling
All sampling occurred during fair-weather, base flow conditions to try to isolate potential inflows
of ground water or leaking sewer lines. Field sampling protocols followed previously tested
procedures used for exfiltration assessment sampling in the area (Owen et al. 2017, Owen et al.
2018). Phase-one field sampling was conducted on December 11, 2018 when water samples
were collected along with metered-physical water parameters every 200 ft for the entire length of
the underground culvert, upstream of the culvert in the North and South Branches, and
downstream of the culvert to Grant Avenue along Jordan Creek. Additional field sampling
occurred on January 25, 2019 to verify trends in discharge and water quality. Field workers
walked upstream from site to site to ensure that sampling occurred in the undisturbed water
column in the middle of the channel. Care was taken to insure that any bottom sediment was not
disturbed during measurement collection or sampling.
Field Measurements
In-stream field measurements of specific conductivity (SC), pH, dissolved oxygen (DO), and
temperature (T) were collected using an YSI multiprobe environmental meter (Pro Plus Model;
YSI, Inc. Yellow Springs, OH, USA) (OEWRI 2015). Instrument accuracy was maintained by
4
using the auto-calibration procedure before each sampling day and by re-conditioning and
manually calibrating each sensor prior to each sampling day.
Discharge Measurements
Discharge measurements were collected on December 11, 2018 at Grant, Main, and Washington
Avenues along the study segment outside of the box culvert using a SonTek FlowTracker
Acoustic Doppler velocity meter to verify downstream variability of flow (OEWRI 2007b). A
second round of discharge measurements were collected on January 25, 2019 again at Grant,
Main, and Washington Avenues. However, additional measurements were collected inside the
culvert near Campbell, Boonville, and Robberson avenues to verify changes in flow observed in
the initial sampling. There is also an USGS gaging station located downstream of the confluence
of Fassnight and Jordan creeks on Wilson Creek at Scenic Ave. (#07052000). This station has
been in continuous operation since 1998.
Water Sample Collection
Surface water grab samples were collected for analysis of nutrients, chloride (Cl), and E. coli
bacteria using two different plastic bottles. Samples for total phosphorus (TP), total nitrogen
(TN), Cl analysis were collected using 500 mL polypropylene (NalgeneTM) open-mouth bottles
(OEWRI 2007). Sample bottles were triple rinsed with ambient water prior to sampling and
water was collected in the deepest part of the channel. Samples were collected by inverting the
bottle to approximately 0.6 of the water depth from the surface and then turning up the opening
to allow water to enter. At the laboratory each 500 mL sample was split into two 250 mL
samples. One 250 mL sample was preserved for nutrient analysis by adding 1 ml of
concentrated sulfuric acid (H2SO4) to lower the pH below 2 standard units to stop all biological
processes and preserve nutrient concentrations. The remaining 250 mL was used for Cl analysis
and was not preserved. All samples were stored at ~ 4°C prior to further analysis. Additional
surface water grab samples were collected in pre-sterilized 100 mL bottles and placed in a cooler
to be analyzed for E.coli bacteria (OEWRI 2013).
Laboratory Analysis
Sample processing and analysis was performed at OEWRI’s Water Quality Laboratory located
on the campus of Missouri State University. Surface water grab samples were analyzed for TN
and TP using a Genesys 10S UV-Vis Spectrophotometer using EPA standard method 365.2 and
methods outlined by Crumpton et al. (1992) (OEWRI 2010a, OEWRI 2010b). Laboratory Cl
was measured using an Accumet Excel XL25 Dual Channel pH/Ion Meter (OEWRI 2009). As
determined by in-house QA/QC procedures, acceptable detection limits for these procedures are
≤ 0.1 mg/L TN, ≤ 0.005 mg/L TP, and 0.1 mg/L Cl- with all accuracy and precision checks
within the range of + or – 20%. Samples were analyzed for the presence of E. Coli using the
IDEXX Colilert® and Quanti-Tray® method for detection and enumeration (OEWRI 2013). The
detection limit of this method is 1 MPN/100 mL with accuracy of + or – 20%. IDEXX MPN

5
Generator 3.2 software was used for confirming MPN of sample results, as well as calculation of
95% confidence intervals.
RESULTS AND DISCUSSION
Channel Distance Locations
On December 4, 2018, 100 ft stations were marked along the south wall of the underground
starting just upstream of Main Ave. (station 0 ft). Stations were located by pulling a tape every
100 ft and marking the wall with yellow paint and spray-painting the station number. This was
used during sampling to know where in the culvert the sample was collected from in relationship
to the infrastructure maps in GIS. The total length of the culvert is approximately 3,350 ft.
Source Risk Assessment
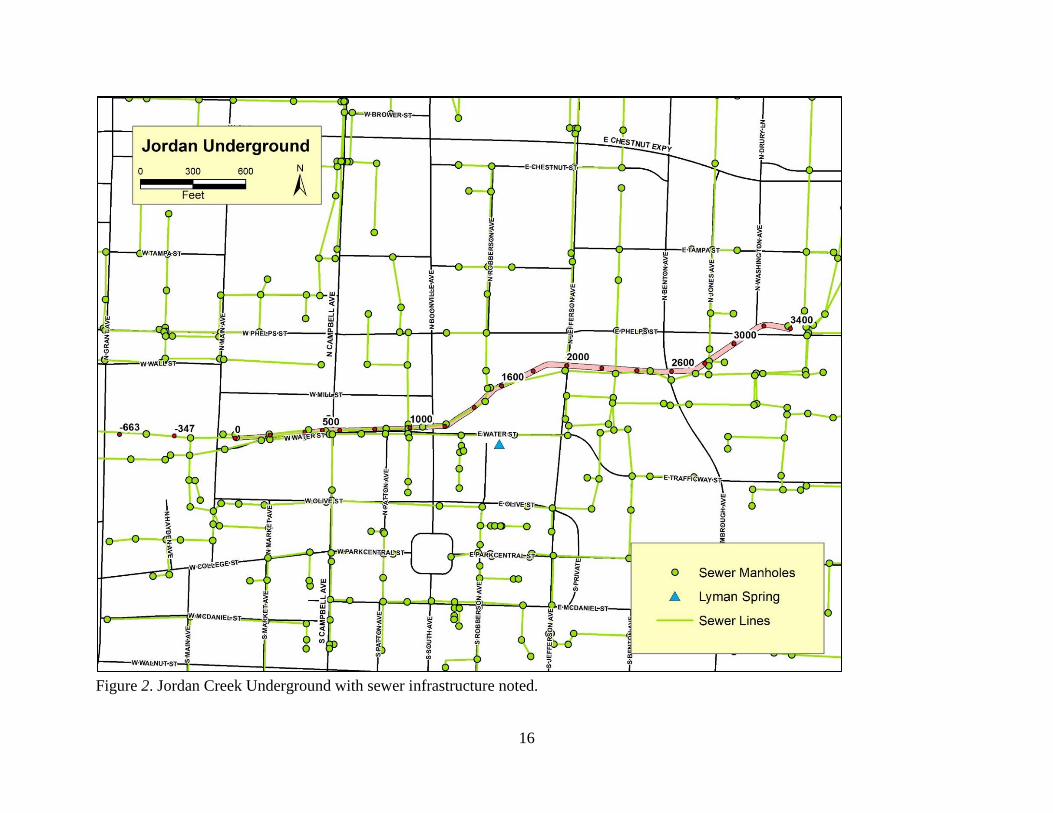
The source risk assessment identified multiple potential exfiltration source locations along the
study reach using GIS data provided by the City of Springfield. A sewer line is mapped directly
below the floor of the box culvert from Robberson Avenue near station 1,500 ft to Main Avenue
downstream of the outlet at station -100 ft (Figure 2). Through this reach sewer lines join the
main trunk line in five places, at stations 0 ft, 200 ft, 510 ft, 990 ft, and 1,500 ft. Additionally, a
sewer line runs parallel to the box culvert along Water St. from station 1,200 ft to the end of the
box culvert at 0 ft. Lyman Spring is located near the corner of Robberson Ave. and Water St.
approximately 200-300 ft south of the culvert. Upstream of Robberson Ave. the main sewer line
generally runs along the south side of the box and sewers cross the culvert at five locations at
stations 1,600 ft, 2,000 ft, 2,300 ft, 2,475 ft, and 2,825 ft.
Discharge Trends
Discharge measurements were collected at both the upstream and downstream ends of the culvert
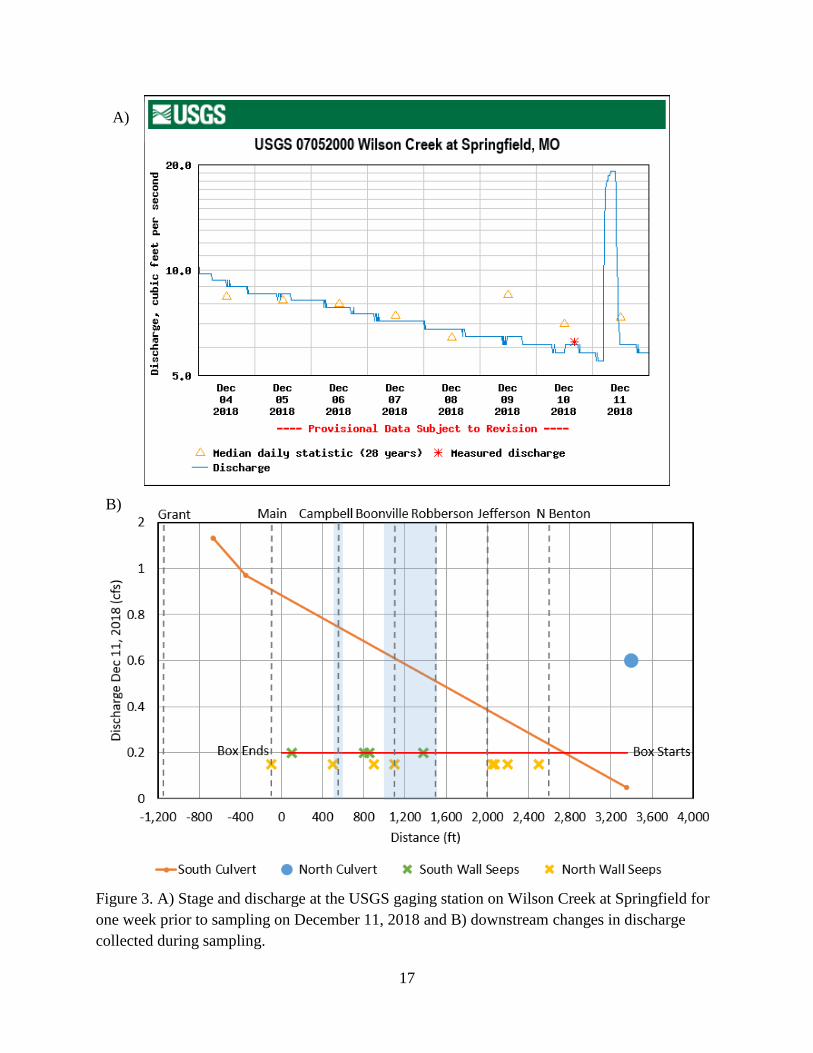
and at Grant St. on December 11th (Table 1). The December 11th sampling was during a period
of very low base flow conditions with no rainfall during the week prior to sampling. Discharge
at the USGS gaging station on Wilson Creek at Scenic Ave during this sampling period was
around 5.8 ft3/s with no high flows being recorded the week prior (Figure 3). The discharge
entering the culvert was 0.65 ft3/s with the majority of the flow entering in the north culvert. At
Main Ave., discharge was 0.97 ft3/s, which is about a 50% increase in flow. Since flow was
measured during base flow conditions, the increase in discharge in the box is likely due to
seepage into the box culvert at some point along its length. Discharge at Grant Ave. increases to
1.13 ft3/s which is in a section where the bed is natural downstream open culvert, which is about
19.5% of the flow at the USGS age downstream. Observations of flow through the culvert
6
during sampling suggests discharge increased near Robberson Ave. where the north and south
culverts come together.
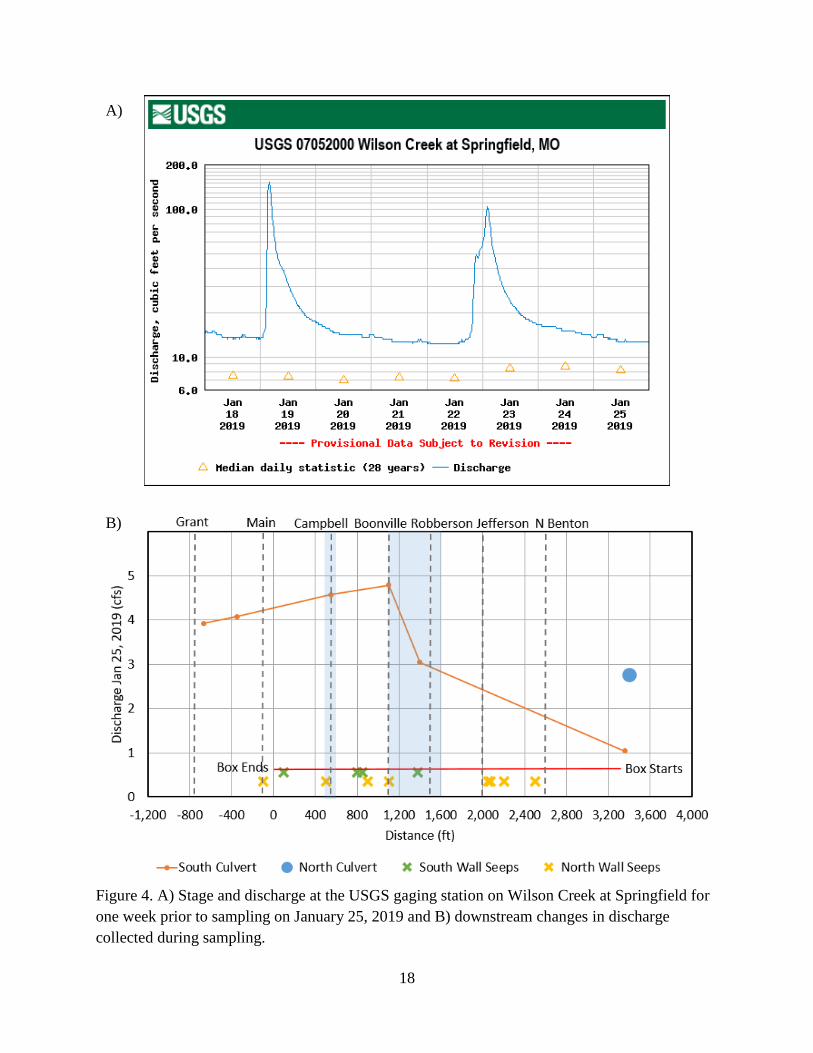
A second round of discharge measurements were collected on January 25th inside the culvert to
try and quantify the observed increase within this section of the culvert. This sampling was
conducted during a relatively high base flow period after a series of small rain events occurred a
week prior to collection (Figure 4). There was a total of 0.79” of rainfall the week prior to
sampling, with 0.32” of rainfall recorded three days prior to sampling. Discharge at the USGS
gaging station during this sampling period was around 13.0 ft3/s. The observed increase in flow
in the larger combined culvert from the initial sampling was verified. Discharge increased about
60% in the large combined culvert going from 3.04 ft3/s at station 1,400 ft near Robberson to
4.79 ft3/s at station 1,100 ft near Boonville (Table 1). While the source of this additional water is
unknown it could be connected to the spring located just south of the culvert near Robberson
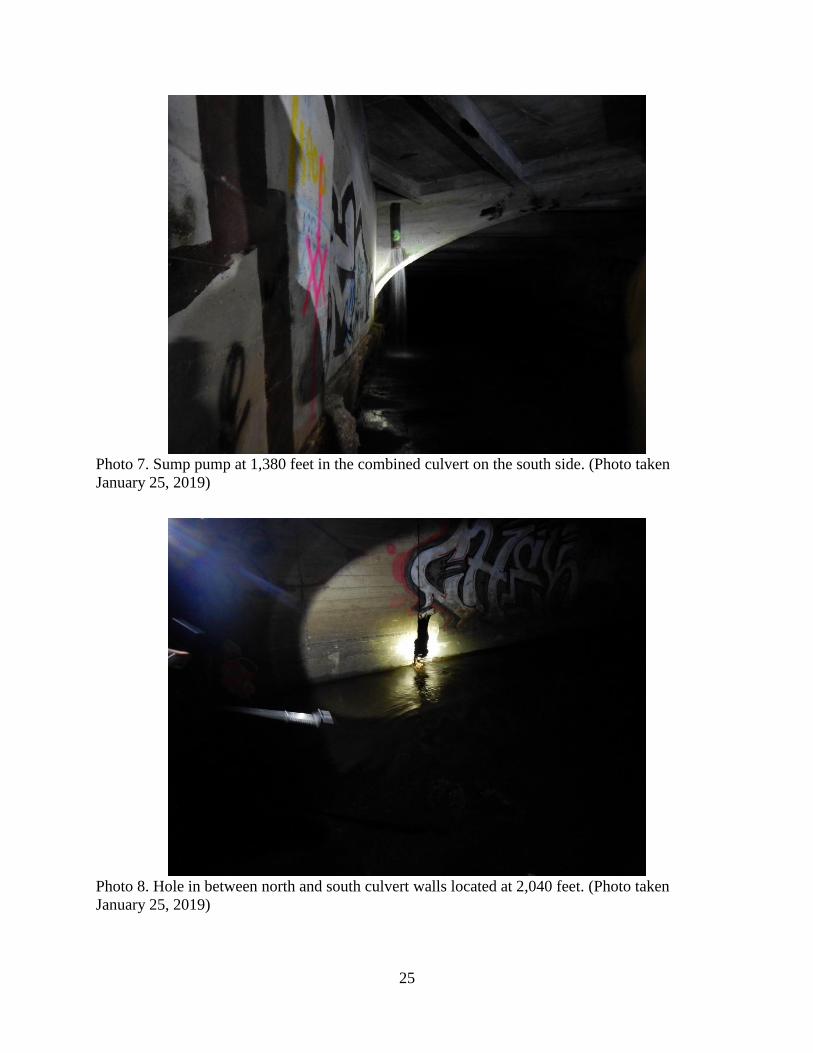
Ave. and Water St. Furthermore, a “flush pipe” was identified at 1,380 ft and likely supplies
water to the stream from a sump pump from an overhead building but the volume is unknown.
The 4.79 ft3/s measured inside the culvert is about 37% of the flow at the USGS gage
downstream.
Water Quality Trends
A total of 28 field measurements by meter and 28 water bottle samples were collected on
December 11th. There were 20 samples collected along the south culvert and in the portions of
the culvert where the two culverts combine between Robberson and Boonville, and again at
Campbell Ave. An additional eight samples were collected in the north culvert where the culvert
was separated as a check. Depth of the water, or stage, in the south culvert and combined rooms
varied from 0.1-0.4 ft with an average of 0.3 ft (Table 2). Stage in the north culvert varied less,
but had a similar average depth. The highest stage (0.8 ft) was recorded downstream of the
culvert at Grant Ave. A second round of sampling was conducted on January 25th to verify
trends, 12 samples were collected for E. coli analysis. A total of 8 samples were collected in the
south/combined culvert and four were collected in the north culvert. Major seeps were also
noted along both the north and south walls of the culvert on January 25, 2019 when base flow
was a little higher than the initial sampling and are plotted with sample parameters below. In
general, seeps only occurred along the north wall from station 1,600-3,350 ft. They are found
along both outside walls of the culvert from stations 0-1,600 ft.
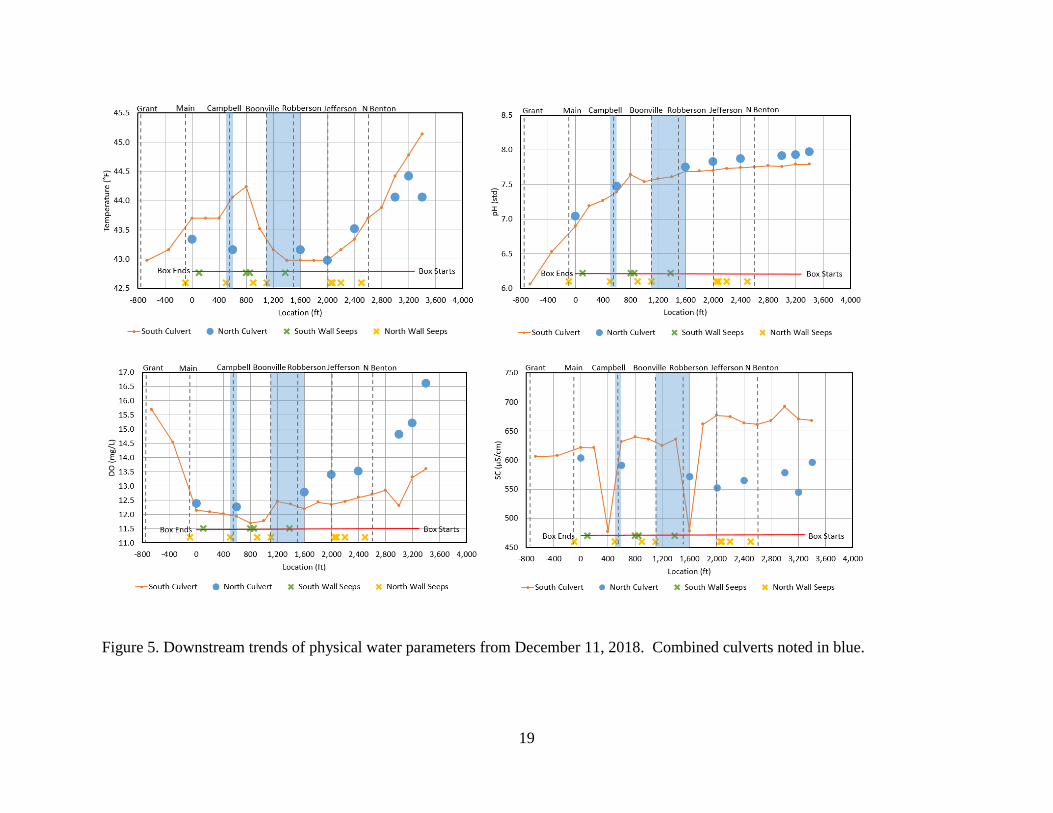
Physical Water Parameters
Measurements of DO, pH, and SC decreased downstream through the culvert, while T also
decreased downstream to station 1,600 ft, it then increased to the outlet. The pH decreased
downstream in both north and south culverts (Table 2, Figure 5). Readings of DO were higher in
the north culvert compared to the south culvert, but after flow mixes in the single culvert room
7
near Robberson, DO concentration in both culverts remains similar. SC in the north culvert is
lower than the south culvert where flow enters the culvert and mix in the combined culvert.
Values for T were similar in both culverts upstream of the culvert and decrease until station
1,600 ft, here the two culverts mix and start to warm as flow moves downstream. This is an
indication that there may be an influx of warmer groundwater entering the culvert near
Robberson at station 1,600 ft. Some of the outliers in the dataset, such as the very low SC
numbers, are likely the result of poor readings due shallow water depth. Therefore, any odd
extreme values were taken into consideration in the analysis.
Nutrients
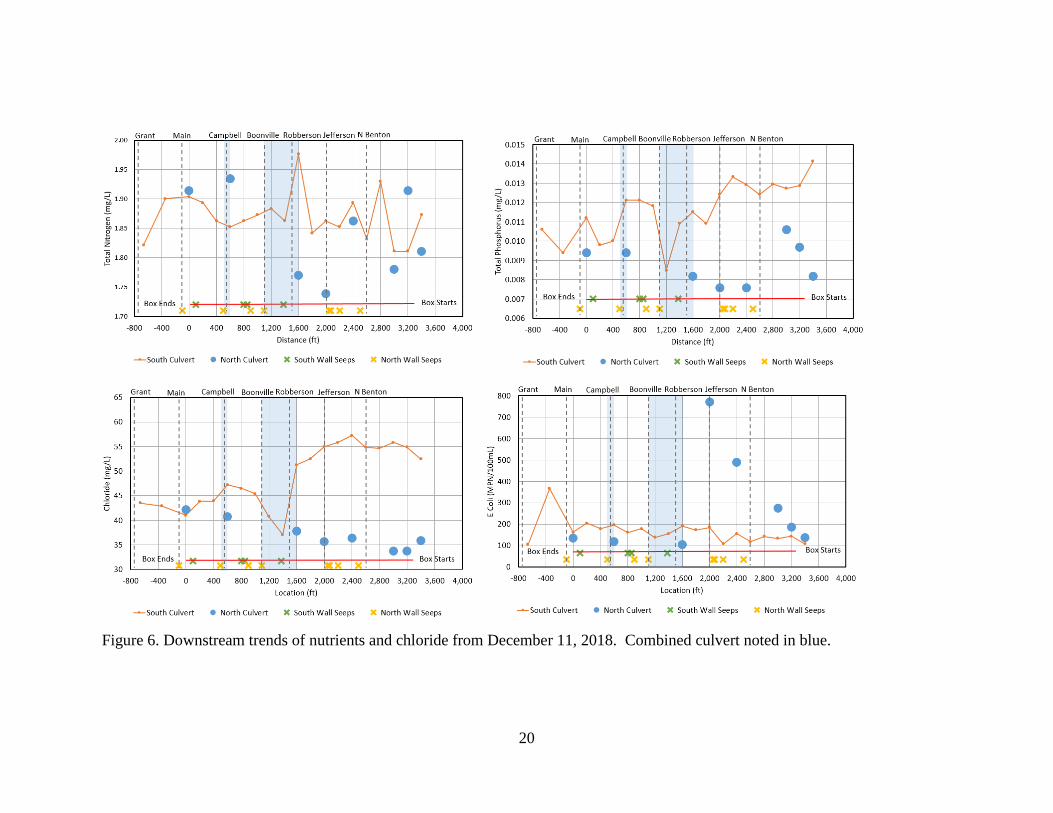
Total nitrogen concentrations increase and total phosphorus concentration decrease downstream
through the study reach. At base flow, sources of nutrients to the underground would likely be
from sewer exfiltration or other types of point sources (Vystavana et. al 2018). However, TN
concentrations have been known to be high at base flow in urban streams within Springfield
(Miller 2006, Owen and Pavlowsky 2014, Owen et al. 2015). Nutrient concentrations from this
study were relatively low compared to a previous water quality study in the mid-2000s (Miller,
2006). In the present study, TN concentrations ranged from 1.74-1.98 mg/L in both culverts
with average concentrations of 1.87 mg/L in the south culvert and 1.84 mg/L in the north culvert
(Table 2). In general, TN concentrations increase through the box culvert with a spike near
station 1,600 ft suggesting perhaps an influx of groundwater in the vicinity near Robberson Ave.
(Figure 6). Total phosphorus concentrations ranged from 0.008-0.014 mg/L in the two culverts
with an average of 0.009 mg/L in the north culvert and 0.012 mg/L in the south culvert. In 2004-
2005, base flow TN in December and January ranged from 2.55-3.35 mg/L and 0.017-0.023
mg/L for TP at Main Ave. (Miller, 2006). Nutrient concentrations from this study are low
compared to winter base flow nutrient concentrations from other area urban streams. In recent
studies of other urban streams in Springfield, winter base flow concentrations of TN ranged from
1.54-3.53 mg/L and TP concentrations ranged from 0.009-0.023 mg/L (Owen and Pavlowsky
2014, Owen et al. 2015).
Chloride
Chloride concentrations decrease downstream through the underground with the south culvert
having higher concentrations than the north culvert until they mix together near Robberson Ave.
At base flow, sources of chloride to the underground would likely be from either sewer
exfiltration, application of road salt in the winter, and from treated water in the distribution
system (Vystavana et. al 2018). Concentrations of Cl range from 37.0-57.2 mg/L in the south
culvert with an average of 48.8 mg/L (Table 2). In the north culvert, concentrations range from
33.7-42.1 mg/L with an average of 37.0 mg/L. In general, concentrations are >50 mg/L in the
south culvert and <40 mg/L in the north culvert until they mix in the large room near Robberson
Ave. and stay in the 40-50 mg/L range to the end of the study reach (Figure 6). The abrupt
8
decrease in Cl at station 1,600 ft near Robberson suggests dilution from water in the south
culvert but also may indicate an influx of relatively “clean” groundwater at this location.
Bacteria
Concentrations of E. coli in the south culvert gradually increase from about 100 MPN/100 mL at
the inlet to 200 MPN/100 mL at the outlet. At base flow, sources of E. coli to the underground
would likely be from sewer exfiltration or possibly from wildlife, such as waterfowl (Dove et al.
2013, Mira et al. 2018). Bacteria concentrations then peak about 400 ft below the outlet at 400
MPN/100 mL, just downstream of the MS4 tributary west of Main Avenue, suggesting possible
sewer exfiltration between Main and Grant (Figure 6). Overall, E. coli concentrations in the
south culvert range from 105.4-365.4 MPN/100 mL with an average of 165.0 MPN/100 mL
(Table 2). There was a different trend in the north culvert, with higher E. coli concentrations
ranging from 105.0-770.1 MPN/100 mL with an average of 277.4 MPN/100 mL. Concentrations
of E. coli in the north culvert increased from about 150 MPN/100 mL at the inlet to almost 800
MPN/100 mL at station 2,000 ft near Jefferson Avenue. There is a junction of several sewer lines
at Jefferson Avenue suggesting that sewer exfiltration may be entering the north culvert
upstream from station 1,800 ft. to station 3,200 ft.
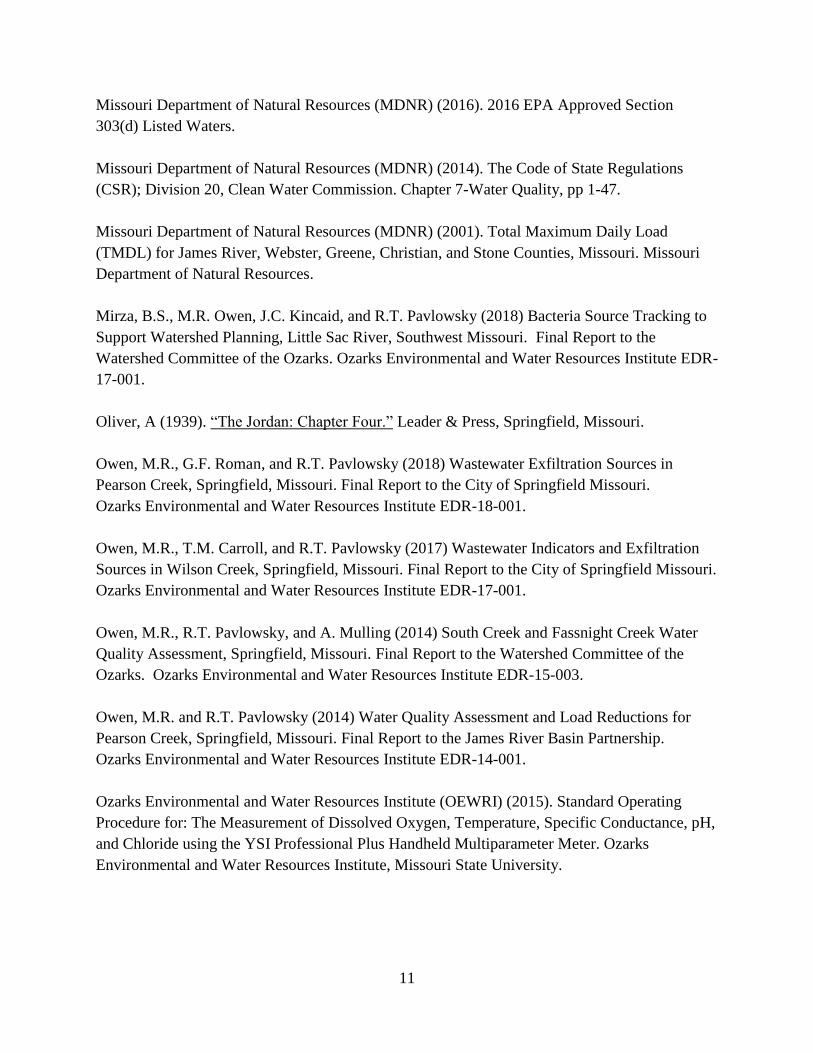
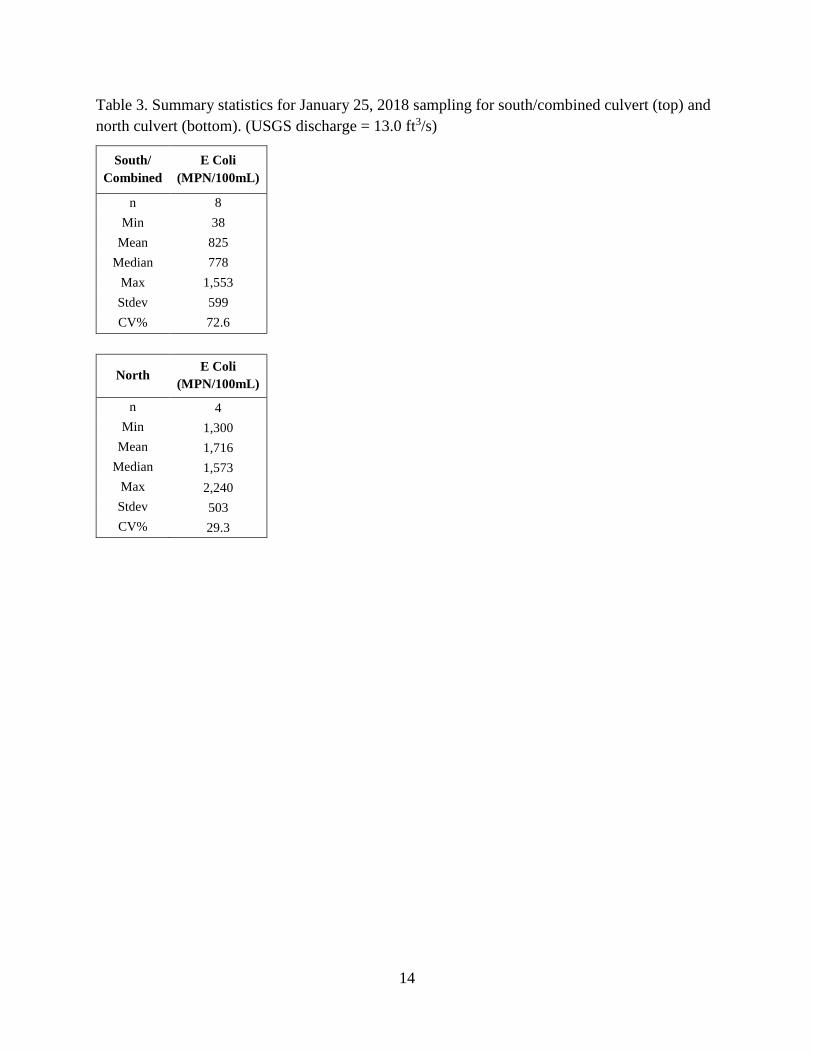
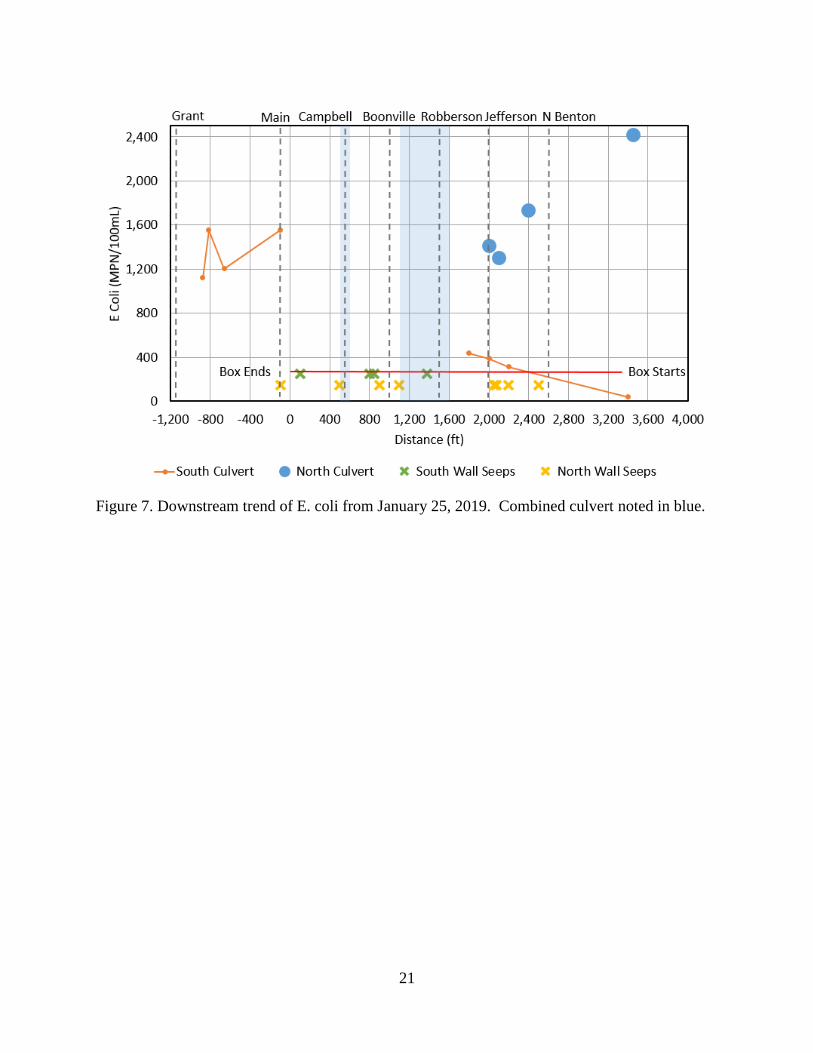
During the second sampling event on January 25, 2019, E. coli concentrations were much higher
overall and exhibited different trends, particularly for the North Branch and culvert samples,
compared to those previously observed during low flow conditions in December. E. coli
concentrations along the south/combined culvert ranged from 38-1,553 MPN/100 mL with an
average of 825 MPN/100 mL (Table 3). Peak concentrations were again measured downstream
stream of the underground outlet near Main and Grant Avenues at levels near 1,600 MPN/100
mL (Figure 7). In contrast, North Branch and culvert E. coli concentrations ranged from 1,300-
2,240 MPN/100 mL with an average of 1,716 MPN/100 mL. Peak concentrations at 2,400
MPN/100 mL were measured in North Branch above the underground inlet and then decreased to
to about 1,400 MPN/100 mL at station 2,000 ft. near Jefferson Avenue (Figure 7). Results from
this second round of sampling were considerably higher than the December 11, 2018 sampling.
Since the concentrations were 5-6x higher than the first sampling, downstream peaks are not
apparent in the dataset. Furthermore, these trends show the North Branch of Jordan Creek
delivering relatively high E. coli concentrations almost two orders of magnitude higher than from
the South Branch of Jordan Creek at the time of sampling. There results suggest that bacteria
transport and flow concentration in Jordan Creek may be highly variable over discharge/stage
and potentially between the rising and falling limbs for runoff hydrographs.
9
CONCLUSIONS
An assessment of the Jordan Creek Underground was performed on December 11, 2018 that
included field measurements of discharge, dissolved oxygen, pH, specific conductivity, and
temperature along with water sampling for laboratory analysis of nutrients, chloride and bacteria.
A second bacteria sampling and discharge measurements were collected on January 25, 2019 to
verify initial trends. The purpose of this study is to quantify variations in water quality at base
flow along a 4,400 ft reach of the Jordan Creek that includes a reach that flows through the
underground box culvert between Grant Ave and Sherman Parkway in downtown Springfield.
There are three main conclusions from this assessment:
1. Nutrients coming into the culvert during base flow are low compared to monitoring in
the mid-2000s. Average TN concentrations in the culvert were around 1.87 mg/L and
average TP concentrations were about 0.012 mg/L. These are nearly half that of the
concentrations of samples collected in December and January of 2004-2005 at Main Ave.
during base flow. Nutrient concentrations from this study are low compared to winter base
flow nutrient concentrations from other area urban streams.
2. There is a possible influx of groundwater from stations 1,400 ft to 1,100 ft within the
large single culvert between Robberson and Boonville Ave. Observations of discharge in
this area show a 60% increase in flow between stations 1,100 ft and 1,400 ft in the combined
culvert between Robberson and Boonville. Temperature increased and chloride
concentrations decreased within this area indicating a groundwater source here rather than an
exfiltration source. Possible sources may be Lyman Spring located just south of this location
and the “flush pipe” observed at station 1,380 ft.
3. E. coli concentrations appear to be much higher in the North Branch of Jordan
compared to the South and downstream peaks suggest possible wastewater exfiltration
in the north culvert near station 2,000 ft and near Grant Ave. During the December 11,
2018 sampling the highest concentrations of E coli inside the underground were found in the
north culvert at station 2,000 ft and downstream of the outlet near Grant Ave. This suggests
a possible exfiltration source along the north culvert near Jefferson and downstream of the
MS4 channel west of Main Ave. The attempt to replicate these findings during a January 25,
2019 sample collection were unsuccessful as very high E. coli concentrations coming down
the N. Branch of Jordan Creek which were 5-6 times higher than the December 11, 2018
samples overwhelmed the downstream trends. However, concentrations coming into the
culvert from the S. Branch of Jordan Creek were only 38 MPN/100 mL.

10
SUMMARY AND RECOMMENDATIONS
1) Jordan Creek has losing/gaining sections within the underground and downstream of Main in
the uncovered reaches of the channel. However, there was a 60% increase in flow between
Robberson and Boonville avenues within the large combined culvert between 1,100 and
1,400 ft that should be accounted for if the stream is to be rerouted outside of the
underground. Seeps were identified along the north wall from station 1,600-3,350 ft.
However, they are found along both outside walls of the culvert from stations 0-1,600 ft.
2) There is potential sewer exfiltration at the sewer line on the north side of the underground at
Jefferson Ave. Additionally, N. Branch Jordan Creek had much higher E. coli concentrations
entering the culvert than the S. Branch on January 25, 2019.
3) A stage gage should be installed in the underground to collect continuous flow data to help
understand the range of base flow that likely change seasonally. Gages are already installed
at the N. Branch at Division, S. Branch at Fremont, and Jordan Creek at Fort.
4) Well data near underground should be reviewed to correlate with locations of flow inputs
identified from this study.
5) Concentrations are variable with flow conditions/source pulses that makes spatial assessment
of source points difficult with only 1-2 sampling events.
REFERENCES
Bullard, L., K.C. Thomson, and J.E. Vandike (2001). The Springs of Greene County Missouri.
Missouri Department of Natural Resources Geological Survey and Resource Assessment
Division. Water Resources Report No. 68.
Crumpton, W.G., T.M. Isenhart, and P.D. Mitchell (1992). Nitrate and Organic N Analysis with
Second-Derivative Spectroscopy. Limnol. Oceanogr., 37(4), 907-913.
Dove, E., J. Denlinger, and A. Leipard (2015). Technical Memorandum; Line Creek Phase II
Water Quality Sampling. HDR, Inc. 17 pp.
Miller, R. B. (2006) Nutrient Loads in an Urban Ozark Watershed: Jordan, Fassnight and Upper
Wilson Creeks, Springfield, Missouri. Unpublished Master’s Thesis, Department of Geography,
Geology, and Planning, Missouri State University.
11
Missouri Department of Natural Resources (MDNR) (2016). 2016 EPA Approved Section
303(d) Listed Waters.
Missouri Department of Natural Resources (MDNR) (2014). The Code of State Regulations
(CSR); Division 20, Clean Water Commission. Chapter 7-Water Quality, pp 1-47.
Missouri Department of Natural Resources (MDNR) (2001). Total Maximum Daily Load
(TMDL) for James River, Webster, Greene, Christian, and Stone Counties, Missouri. Missouri
Department of Natural Resources.
Mirza, B.S., M.R. Owen, J.C. Kincaid, and R.T. Pavlowsky (2018) Bacteria Source Tracking to
Support Watershed Planning, Little Sac River, Southwest Missouri. Final Report to the
Watershed Committee of the Ozarks. Ozarks Environmental and Water Resources Institute EDR-
17-001.
Oliver, A (1939). “The Jordan: Chapter Four.” Leader & Press, Springfield, Missouri.
Owen, M.R., G.F. Roman, and R.T. Pavlowsky (2018) Wastewater Exfiltration Sources in
Pearson Creek, Springfield, Missouri. Final Report to the City of Springfield Missouri.
Ozarks Environmental and Water Resources Institute EDR-18-001.
Owen, M.R., T.M. Carroll, and R.T. Pavlowsky (2017) Wastewater Indicators and Exfiltration
Sources in Wilson Creek, Springfield, Missouri. Final Report to the City of Springfield Missouri.
Ozarks Environmental and Water Resources Institute EDR-17-001.
Owen, M.R., R.T. Pavlowsky, and A. Mulling (2014) South Creek and Fassnight Creek Water
Quality Assessment, Springfield, Missouri. Final Report to the Watershed Committee of the
Ozarks. Ozarks Environmental and Water Resources Institute EDR-15-003.
Owen, M.R. and R.T. Pavlowsky (2014) Water Quality Assessment and Load Reductions for
Pearson Creek, Springfield, Missouri. Final Report to the James River Basin Partnership.
Ozarks Environmental and Water Resources Institute EDR-14-001.
Ozarks Environmental and Water Resources Institute (OEWRI) (2015). Standard Operating
Procedure for: The Measurement of Dissolved Oxygen, Temperature, Specific Conductance, pH,
and Chloride using the YSI Professional Plus Handheld Multiparameter Meter. Ozarks
Environmental and Water Resources Institute, Missouri State University.
12
Ozarks Environmental and Water Resources Institute (OEWRI) (2013). Standard Operating
Procedure for: The Measurement of Escherichia coli and Total Coliform using the IDEXX
Quanti-Tray/2000 System with Colilert reagent. Ozarks Environmental and Water Resources
Institute, Missouri State University.
Ozarks Environmental and Water Resources Institute (OEWRI) (2010a). Standard Operating
Procedure for: Total Nitrogen Analyses using Genesys 10S UV-Vis. Ozarks Environmental and
Water Resources Institute, Missouri State University.
Ozarks Environmental and Water Resources Institute (OEWRI) (2010b). Standard Operating
Procedure for: Total Phosphorus Analyses using Genesys 10S UV-Vis. Ozarks Environmental
and Water Resources Institute, Missouri State University.
Ozarks Environmental and Water Resources Institute (OEWRI) (2009). Standard Operating
Procedure for: Accumet Excel XL25 Dual Channel pH/Ion Meter for Chloride Concentration
Determination. Ozarks Environmental and Water Resources Institute, Missouri State University.
Ozarks Environmental and Water Resources Institute (OEWRI) (2007). Standard Operating
Procedure for: Water Sample Collection. Ozarks Environmental and Water Resources Institute,
Missouri State University.
Ozarks Environmental and Water Resources Institute (OEWRI) (2006). Standard Operating
Procedure for: Chain of Custody. Ozarks Environmental and Water Resources Institute, Missouri
State University.
Vystavna, Y., D. Diadin, P.M. Rossi, M. Gusyev, J. Hejzlar, R. Mehdizadeh, and F. Huneau
(2018) Quantification of Water and Sewage Leakages from Urban Infrastructure into a Shallow
Aquifer in East Ukraine. Environmental Earth Sciences 77:748.

13
TABLES
Table 1. Discharge summary for December 11, 2018 and January 25, 2019.
Street
Location Station (ft) Culvert
Dec 11, 2018
Discharge (ft3/s)
Jan 25, 2019
Discharge (ft3/s)
Grant -675 combined 1.13 3.93
Main -100 combined 0.97 4.08
Campbell 550 combined - 4.57
Boonville 1,100 combined - 4.79
Robberson 1,400 combined - 3.04
Washington 3,400 north 0.60 2.75
Washington 3,400 south 0.05 1.04
Table 2. Summary statistics for December 11, 2018 surveying for south/combined culvert (top)
and north culvert (bottom). (USGS discharge = 5.8 ft3/s)
South/
Combined
Stage
(ft)
Temp
(°F)
pH
(std.)
SC
(μS/cm)
DO
(mg/L)
Cl
(mg/L)
TN
(mg/L)
TP
(mg/L)
E Coli
(MPN/100mL)
n 20 20 20 20 20 20 20 20 20
Min 0.1 43.0 6.1 477 11.7 37.0 1.81 0.008 105.4
Mean 0.3 43.6 7.5 631 12.7 48.8 1.87 0.012 165.0
Median 0.2 43.6 7.7 638 12.4 49.2 1.86 0.012 158.0
Max 0.8 45.1 7.8 692 15.7 57.2 1.98 0.014 365.4
Stdev 0.2 0.6 0.5 57.9 1.0 6.3 0.04 0.001 55.9
CV% 57.1 1.5 6.3 9.2 7.7 12.8 2.1 12.5 33.9
North Stage
(ft)
Temp
(°F)
pH
(std.)
SC
(μS/cm)
DO
(mg/L)
Cl
(mg/L)
TN
(mg/L)
TP
(mg/L)
E Coli
(MPN/100mL)
n 8 8 8 8 8 8 8 8 8
Min 0.2 43.0 7.0 546 12.3 33.7 1.74 0.008 105.0
Mean 0.3 43.6 7.7 576 13.9 37.0 1.84 0.009 277.4
Median 0.2 43.4 7.9 575 13.5 36.1 1.84 0.009 162.4
Max 0.4 44.4 8.0 605 16.6 42.1 1.94 0.011 770.1
Stdev 0.09 0.5 0.3 21.0 1.5 3.1 0.08 0.001 235.9
CV% 33.6 1.2 4.1 3.7 11.1 8.3 4.1 12.5 85.1
14
Table 3. Summary statistics for January 25, 2018 sampling for south/combined culvert (top) and
north culvert (bottom). (USGS discharge = 13.0 ft3/s)
South/
Combined
E Coli
(MPN/100mL)
n 8
Min 38
Mean 825
Median 778
Max 1,553
Stdev 599
CV% 72.6
North E Coli
(MPN/100mL)
n 4
Min 1,300
Mean 1,716
Median 1,573
Max 2,240
Stdev 503
CV% 29.3
15
FIGURES
Figure 1. Jordan Creek watershed and land use with study area noted in red.
16
Figure 2. Jordan Creek Underground with sewer infrastructure noted.
17
Figure 3. A) Stage and discharge at the USGS gaging station on Wilson Creek at Springfield for
one week prior to sampling on December 11, 2018 and B) downstream changes in discharge
collected during sampling.
A)
B)
18
Figure 4. A) Stage and discharge at the USGS gaging station on Wilson Creek at Springfield for
one week prior to sampling on January 25, 2019 and B) downstream changes in discharge
collected during sampling.
A)
B)
19
Figure 5. Downstream trends of physical water parameters from December 11, 2018. Combined culverts noted in blue.
20
Figure 6. Downstream trends of nutrients and chloride from December 11, 2018. Combined culvert noted in blue.
21
Figure 7. Downstream trend of E. coli from January 25, 2019. Combined culvert noted in blue.

22
PHOTOS
Photo 1. Two sewer manholes and a large culvert located at 876 feet downstream of the
underground along the north bank. (Photo taken January 25, 2019)
Photo 2. Building over creek located 816 feet downstream of the underground looking upstream.
(Photo taken January 25, 2019)

23
Photo 3. Grant Ave Bridge located 663 feet downstream of the underground looking upstream.
(Photo taken January 25, 2019)
Photo 4. MS4 channel near Main Ave. located 256 ft downstream of the underground on south
bank. (Photo taken January 25, 2019)

24
Photo 5. Storm drain under Main Ave Bridge 100 ft downstream of the underground along north
bank. (Photo taken January 25, 2019)
Photo 6. Larger drain at 800 ft in the south culvert along south exterior wall. Several other
drains and seeps enter the south culvert downstream of Campbell Ave. (Photo taken January 25,
2019)
25
Photo 7. Sump pump at 1,380 feet in the combined culvert on the south side. (Photo taken
January 25, 2019)
Photo 8. Hole in between north and south culvert walls located at 2,040 feet. (Photo taken
January 25, 2019)
26
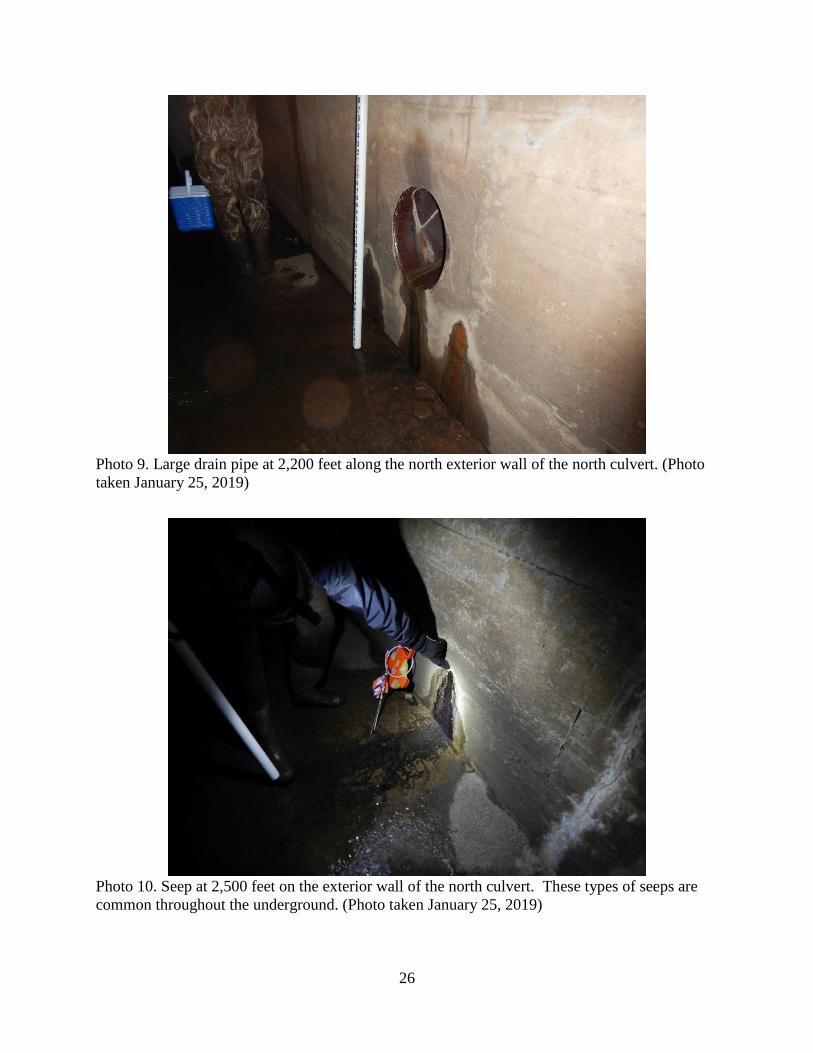
Photo 9. Large drain pipe at 2,200 feet along the north exterior wall of the north culvert. (Photo
taken January 25, 2019)
Photo 10. Seep at 2,500 feet on the exterior wall of the north culvert. These types of seeps are
common throughout the underground. (Photo taken January 25, 2019)

27
APPENDIX
December 11, 2018 Database
Location Culvert Stage
(ft)
Temp
F
pH
(std)
SC
(uS/cm)
DO
(mg/L)
Cl
(mg/L)
TN
(mg/L)
TP
(mg/L)
E coli.
(MPN/100mL)
-663 S/C 0.8 43.0 6.1 605.9 15.7 43.5 1.82 0.011 105.4
-347 S/C 0.4 43.2 6.5 607.9 14.5 42.9 1.90 0.009 365.4
0 S/C 0.3 43.7 6.9 621.9 12.1 41.0 1.90 0.011 162.4
200 S/C 0.3 43.7 7.2 621.3 12.1 43.9 1.89 0.010 204.6
400 S/C 0.2 43.7 7.3 477.4 12.0 43.9 1.86 0.010 178.2
600 S/C 0.3 44.1 7.4 631.9 11.9 47.2 1.85 0.012 195.6
800 S/C 0.3 44.2 7.6 640.0 11.7 46.5 1.86 0.012 160.7
1,000 S/C 0.2 43.5 7.5 636.0 11.8 45.4 1.87 0.012 178.5
1,200 S/C 0.3 43.2 7.6 625.2 12.5 40.8 1.88 0.008 137.6
1,400 S/C 0.2 43.0 7.6 636.1 12.4 37.0 1.86 0.011 155.3
1,600 S/C 0.2 43.0 7.7 478.0 12.2 51.2 1.98 0.012 191.8
1,800 S/C 0.1 43.0 7.7 662.0 12.4 52.5 1.84 0.011 172.5
2,000 S/C 0.2 43.0 7.7 677.1 12.4 55.0 1.86 0.012 184.2
2,200 S/C 0.2 43.2 7.7 674.9 12.5 55.8 1.85 0.013 108.1
2,400 S/C 0.2 43.3 7.7 664.0 12.6 57.2 1.89 0.013 155.3
2,600 S/C 0.2 43.7 7.8 661.2 12.7 54.9 1.83 0.012 117.8
2,800 S/C 0.2 43.9 7.8 668.0 12.9 54.7 1.93 0.013 142.1
3,000 S/C 0.2 44.4 7.8 692.2 12.3 55.8 1.81 0.013 133.4
3,200 S/C 0.2 44.8 7.8 670.6 13.3 54.9 1.81 0.013 143.9
3,400 S/C 0.3 45.1 7.8 668.2 13.6 52.4 1.87 0.014 107.1
0 N 0.4 43.3 7.0 604.5 12.4 42.1 1.91 0.009 135.4
600 N 0.4 43.2 7.5 591.7 12.3 40.7 1.94 0.009 119.8
1,600 N 0.2 43.2 7.8 571.9 12.8 37.8 1.77 0.008 105.0
2,000 N 0.2 43.0 7.8 552.5 13.4 35.7 1.74 0.008 770.1
2,400 N 0.2 43.5 7.9 565.6 13.5 36.4 1.86 0.008 488.4
3,000 N 0.2 44.1 7.9 578.8 14.8 33.7 1.78 0.011 275.5
3,200 N 0.3 44.4 7.9 545.5 15.2 33.7 1.91 0.010 187.2
3,400 N 0.2 44.1 8.0 596.6 16.6 35.9 1.81 0.008 137.6
28
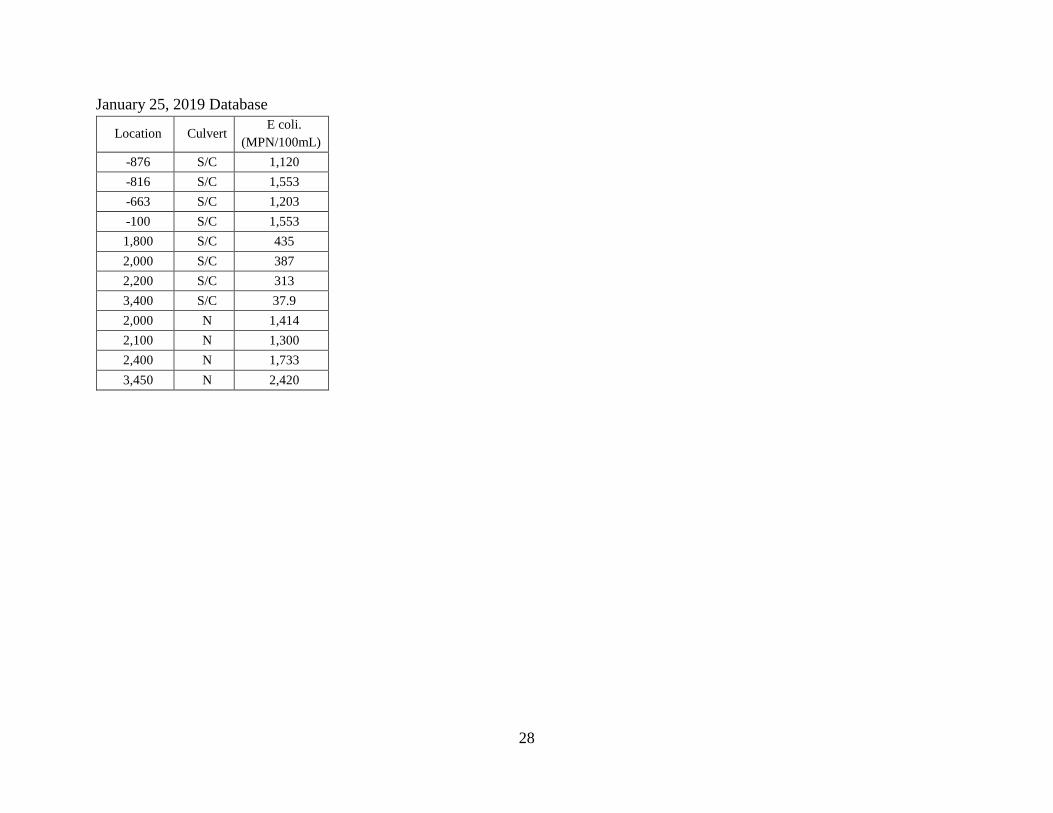
January 25, 2019 Database
Location Culvert E coli.
(MPN/100mL)
-876 S/C 1,120
-816 S/C 1,553
-663 S/C 1,203
-100 S/C 1,553
1,800 S/C 435
2,000 S/C 387
2,200 S/C 313
3,400 S/C 37.9
2,000 N 1,414
2,100 N 1,300
2,400 N 1,733
3,450 N 2,420