florida economic outlook for fy 2004-05 & 2005-06
TRANSCRIPT
FLORIDA ECONOMIC OUTLOOK FOR FY 2004-05 & 2005-06
The Florida Economic Estimating Conference (FEEC) met October 22nd to
revise the forecast of the state’s economy. The latest forecast expects the
economy to continue to expand at a modest pace—faster than the past few years
albeit slower than during the 1990s. Population growth will continue to be the
engine of economic growth for the state.
Since the last forecast in February there have been employment and
income revisions that showed the state growing at a slower pace than was
originally reported. The two principal measures of economic growth for states
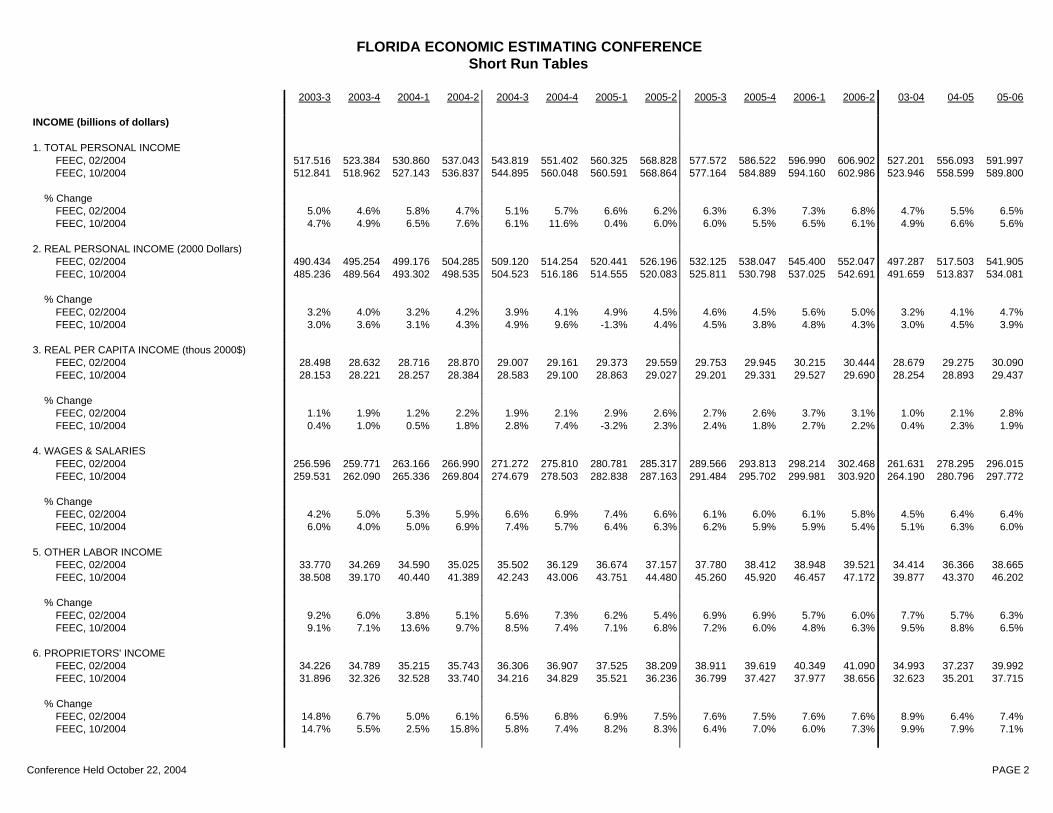
are income and employment growth. In FY 2002-03 personal income grew just
2.8%, down from the originally reported 4.0%, and nonfarm payroll growth was
revised down to 0.8% from 1.1%. And while in FY 2003-04 both income and
employment grew faster than was projected in February (4.9% and 1.9% for
income and jobs, respectively), neither grew fast enough to reach the levels
projected for the year. Income was $3.2 billion, or 0.6%, below the forecast,
while nonfarm jobs were 9,500 jobs, or 0.1%, below the forecast.
Population growth and residential construction are the two areas where
we surpassed the forecast for last fiscal year. In FY 2003-04 the state’s
population grew b 2.6% compared to a projected 2.2%. By the end of the fiscal
year the state had almost 100,000 more residents than the FEEC projected in
February. This population growth, along with mortgage rates that continue to
hover near 6.0%--about 40 basis points below where the National Economic
Estimating Conference (NEEC) expected them to be in February—have
continued to fuel new residential construction activity. In February the FEEC was
expecting private housing starts to begin a gradual decline in the spring. In fact
new activity began to accelerate. For FY 2003-04 there were 230,800 starts, a
19.7% increase over the prior year—the fastest pace of new starts since FY
1972-73. Much of this activity was in single family starts which were up 22.9%
over the prior year to a level of 163,100 units—the highest level ever.
1

Nominal personal income, bolstered by the expected Microsoft dividend of
$3.00 per share on December 2nd, is projected to grow 6.6% this fiscal year,
revised up from the 5.5% projected in the spring. Next year income growth is
expected to slow slightly to 6.0%.1 Per capita income adjusted for inflation is
expected to grow 2.3% this year and 1.9% next fiscal year. This year’s growth is
projected to be the fastest since FY 1998-99 when real per capita income grew
3.4%. Much of the faster growth in personal income can be attributed to faster
growth in labor income (both earnings and proprietors’ income). However,
property income (dividends, interest payments, rental income) also contributes to
the faster pace of growth. After two years of declines in property income
associated with low interest rates and a stock market that has been moving
sideways, property income grew 1.3% in FY 2003-04. It is projected to grow
6.7% this fiscal year, and then it slows to 2.7% in FY 2005-06.2
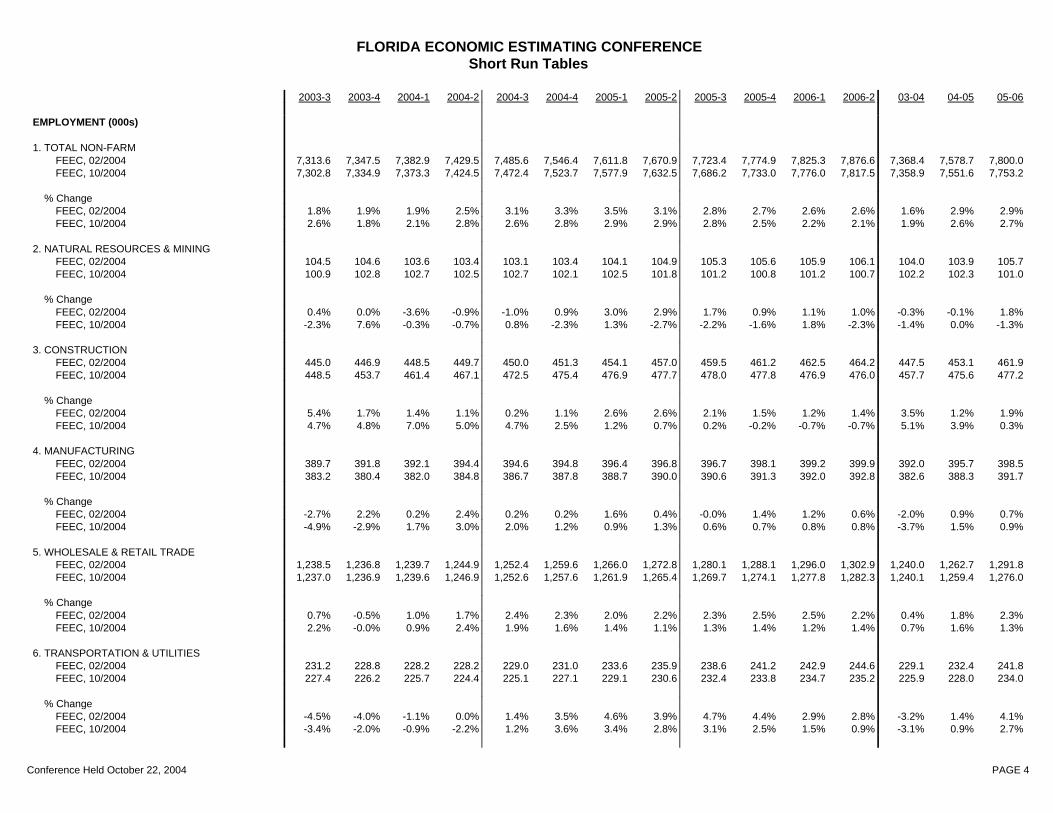
Nonfarm business payrolls are projected to grow 2.6% this fiscal year.
Unlike the nation Florida surpassed its previous peak in jobs soon after the
recession ended. Jobs peaked in June 2001 (three months after the peak in the
business cycle) at 7,185,400 jobs. The economy shed jobs through the end of
the year with payrolls falling to 7,140,300 jobs. By September of 2002 payrolls
had reached their prior peak. In the most recent report Florida nonfarm payrolls
were 257,000 jobs, or 3.6%, above their June 2001 peak. By the end of the
current fiscal year payrolls are projected to be 447,000, or 6.2%, above their prior
peak. For the four quarters ending in 2005Q2 the state’s economy is projected to
add 208,000 jobs to business payrolls. Next fiscal year job growth is expected to
moderate some with payrolls expanding by a respectable 185,000 jobs, or 2.4%
(2006Q2-over-2005Q2). About a quarter of the job growth is concentrated in the
professional and business services super sector. After growing 4.8% last year
this sector is projected to expand 4.6% this year. Next year growth accelerates
to 5.6%. Over fifty percent of the growth in this sector is concentrated in 1 The Microsoft dividend payment is expected to add $1.85 billion to Florida personal income in fiscal year 2004-05—about $7.4 billion (seasonally adjusted annual rate) to 2004Q4. The impact of the payment is to raise income growth 0.4% this fiscal year and lower it by 0.4% next year. 2 Absent the Microsoft dividend payment property income would have projected growth of 5.1% this fiscal year and 4.2% next year.
2

employment services (NAICS 5613) and services to buildings and dwellings
(NAICS 5617). The second fastest growing industry in percentage growth terms
is construction. Employment growth in the industry is expected to slow to 3.9%
from its heated rate of 5.1% last fiscal year. As residential construction slows
later this fiscal year construction employment growth slows as well. In 2005-06
job growth is projected at just 0.3%.
Almost all industry payrolls are expected to expand this fiscal year. The
lone two exceptions are mining and information services. The mining industry
has continued to shed jobs since 1996-97 and it is projected to continue that
trend through the end of the short-run forecast period. The information services
sector has lost jobs since FY 2001-02. The forecast calls for employment to drop
0.1% this year then expand 2.2% in 2005-06. Employment growth in retail trade
is expected to remain weak through 2005-06 with business payrolls expanding
1.3% this fiscal year and just 1.1% next year. The unemployment rate is
expected to have reached a low of 4.5% in the third quarter. From there it
gradually rises to 4.7% as the labor force expands faster than the economy can
absorb the new entrants. For all of 2004-05 the unemployment rate averages
4.6%, down from 4.8% last year. Then in 2005-06 it rises slightly to an average of
4.7%.
As mentioned above construction remains robust within the state. This
fiscal year is projected to be another banner year for residential construction.
Housing starts are projected to grow 1.4% to 234,000 units. Single-family starts
are expected to reach 163,600 units surpassing last year’s historical high. As
mortgage rates begin to rise at a faster pace residential starts are expected to
fall, both single-family and multi-family starts. Starts are projected to decline
10.7% in 2005-06 to 146,200 units. Total construction expenditures fall 4.4% in
2005-06 after growing 9.1% in the prior year. This occurs despite the fact that
nonresidential and public expenditures are expected to grow—residential
construction activity accounts for over fifty percent of all construction activity.
Growth in private nonresidential construction is projected to accelerate to 13.9%
this fiscal year from growing 6.1% last year. It then slows slightly to 9.5% in
3

2005-06. Meanwhile, after contracting 6.7% last year public construction activity
is projected to expand 1.3% this fiscal year and then it accelerates to 5.2%
growth next year.
4

05-0604-0503-042006-22006-12005-42005-32005-22005-12004-42004-32004-22004-12003-42003-3
EXECUTIVE SUMMARY
1. TOTAL PERSONAL INCOME (Billions of $)591.997556.093527.201606.902596.990586.522577.572568.828560.325551.402543.819537.043530.860523.384517.516 FEEC, 02/2004589.800558.599523.946602.986594.160584.889577.164568.864560.591560.048544.895536.837527.143518.962512.841 FEEC, 10/2004
% Change6.5%5.5%4.7%6.8%7.3%6.3%6.3%6.2%6.6%5.7%5.1%4.7%5.8%4.6%5.0% FEEC, 02/20045.6%6.6%4.9%6.1%6.5%5.5%6.0%6.0%0.4%11.6%6.1%7.6%6.5%4.9%4.7% FEEC, 10/2004
2. REAL PER CAPITA INCOME (Thous 2000$)30.09029.27528.67930.44430.21529.94529.75329.55929.37329.16129.00728.87028.71628.63228.498 FEEC, 02/200429.43728.89328.25429.69029.52729.33129.20129.02728.86329.10028.58328.38428.25728.22128.153 FEEC, 10/2004
% Change2.8%2.1%1.0%3.1%3.7%2.6%2.7%2.6%2.9%2.1%1.9%2.2%1.2%1.9%1.1% FEEC, 02/20041.9%2.3%0.4%2.2%2.7%1.8%2.4%2.3%-3.2%7.4%2.8%1.8%0.5%1.0%0.4% FEEC, 10/2004
3. TOTAL NON-FARM EMPLOYMENT (000s)7,800.07,578.77,368.47,876.67,825.37,774.97,723.47,670.97,611.87,546.47,485.67,429.57,382.97,347.57,313.6 FEEC, 02/20047,753.27,551.67,358.97,817.57,776.07,733.07,686.27,632.57,577.97,523.77,472.47,424.57,373.37,334.97,302.8 FEEC, 10/2004
% Change2.9%2.9%1.6%2.6%2.6%2.7%2.8%3.1%3.5%3.3%3.1%2.5%1.9%1.9%1.8% FEEC, 02/20042.7%2.6%1.9%2.1%2.2%2.5%2.8%2.9%2.9%2.8%2.6%2.8%2.1%1.8%2.6% FEEC, 10/2004
4. PRIVATE HOUSING STARTS (000s, saar)184.0200.8213.0179.7181.7185.2189.5194.4199.8203.2205.8207.9212.9206.8224.2 FEEC, 02/2004208.1234.0230.8201.0205.4210.4215.9221.4228.1237.2249.4244.9231.5221.3225.5 FEEC, 10/2004
% Change-8.4%-5.7%11.0%-4.4%-7.3%-8.9%-9.7%-10.4%-6.4%-5.0%-3.9%-9.1%12.4%-27.7%68.8% FEEC, 02/2004
-11.1%1.4%19.7%-8.2%-9.2%-9.8%-9.6%-11.2%-14.6%-18.1%7.7%25.1%19.7%-7.2%58.6% FEEC, 10/2004
5. POPULATION (millions)18.00917.67717.33918.13318.05017.96817.88517.80217.71817.63517.55217.46717.38317.29717.209 FEEC, 02/200418.14217.78417.40118.27918.18718.09718.00717.91717.82717.73917.65117.56417.45817.34717.236 FEEC, 10/2004
% Change1.88%1.95%2.17%1.84%1.86%1.87%1.88%1.89%1.90%1.92%1.94%1.96%1.99%2.06%2.15% FEEC, 02/20042.02%2.20%2.55%2.02%2.01%2.02%2.02%2.03%2.02%2.00%2.00%2.46%2.57%2.61%2.60% FEEC, 10/2004
6. TOTAL NEW LIGHT VEHICLE REGISTRATIONS (000s)
1,431.91,424.41,398.2360.0358.2356.5357.3359.0358.5355.8351.1348.7348.2354.7346.6 FEEC, 02/20041,393.01,382.81,384.8351.6347.3345.8348.3349.9343.2342.3347.3336.4350.3351.4346.7 FEEC, 10/2004
% Change0.5%1.9%3.5%2.0%1.9%-0.8%-1.9%0.6%3.0%5.4%2.8%0.6%-7.2%9.7%52.0% FEEC, 02/20040.7%-0.1%3.5%5.0%1.7%-2.8%-1.8%8.1%1.0%-5.6%13.7%-15.0%-1.1%5.5%22.8% FEEC, 10/2004
FLORIDA ECONOMIC ESTIMATING CONFERENCEShort Run Tables
Conference Held October 22, 2004 PAGE 1
05-0604-0503-042006-22006-12005-42005-32005-22005-12004-42004-32004-22004-12003-42003-3
INCOME (billions of dollars)
1. TOTAL PERSONAL INCOME591.997556.093527.201606.902596.990586.522577.572568.828560.325551.402543.819537.043530.860523.384517.516 FEEC, 02/2004589.800558.599523.946602.986594.160584.889577.164568.864560.591560.048544.895536.837527.143518.962512.841 FEEC, 10/2004
% Change6.5%5.5%4.7%6.8%7.3%6.3%6.3%6.2%6.6%5.7%5.1%4.7%5.8%4.6%5.0% FEEC, 02/20045.6%6.6%4.9%6.1%6.5%5.5%6.0%6.0%0.4%11.6%6.1%7.6%6.5%4.9%4.7% FEEC, 10/2004
2. REAL PERSONAL INCOME (2000 Dollars)541.905517.503497.287552.047545.400538.047532.125526.196520.441514.254509.120504.285499.176495.254490.434 FEEC, 02/2004534.081513.837491.659542.691537.025530.798525.811520.083514.555516.186504.523498.535493.302489.564485.236 FEEC, 10/2004
% Change4.7%4.1%3.2%5.0%5.6%4.5%4.6%4.5%4.9%4.1%3.9%4.2%3.2%4.0%3.2% FEEC, 02/20043.9%4.5%3.0%4.3%4.8%3.8%4.5%4.4%-1.3%9.6%4.9%4.3%3.1%3.6%3.0% FEEC, 10/2004
3. REAL PER CAPITA INCOME (thous 2000$)30.09029.27528.67930.44430.21529.94529.75329.55929.37329.16129.00728.87028.71628.63228.498 FEEC, 02/200429.43728.89328.25429.69029.52729.33129.20129.02728.86329.10028.58328.38428.25728.22128.153 FEEC, 10/2004
% Change2.8%2.1%1.0%3.1%3.7%2.6%2.7%2.6%2.9%2.1%1.9%2.2%1.2%1.9%1.1% FEEC, 02/20041.9%2.3%0.4%2.2%2.7%1.8%2.4%2.3%-3.2%7.4%2.8%1.8%0.5%1.0%0.4% FEEC, 10/2004
4. WAGES & SALARIES296.015278.295261.631302.468298.214293.813289.566285.317280.781275.810271.272266.990263.166259.771256.596 FEEC, 02/2004297.772280.796264.190303.920299.981295.702291.484287.163282.838278.503274.679269.804265.336262.090259.531 FEEC, 10/2004
% Change6.4%6.4%4.5%5.8%6.1%6.0%6.1%6.6%7.4%6.9%6.6%5.9%5.3%5.0%4.2% FEEC, 02/20046.0%6.3%5.1%5.4%5.9%5.9%6.2%6.3%6.4%5.7%7.4%6.9%5.0%4.0%6.0% FEEC, 10/2004
5. OTHER LABOR INCOME38.66536.36634.41439.52138.94838.41237.78037.15736.67436.12935.50235.02534.59034.26933.770 FEEC, 02/200446.20243.37039.87747.17246.45745.92045.26044.48043.75143.00642.24341.38940.44039.17038.508 FEEC, 10/2004
% Change6.3%5.7%7.7%6.0%5.7%6.9%6.9%5.4%6.2%7.3%5.6%5.1%3.8%6.0%9.2% FEEC, 02/20046.5%8.8%9.5%6.3%4.8%6.0%7.2%6.8%7.1%7.4%8.5%9.7%13.6%7.1%9.1% FEEC, 10/2004
6. PROPRIETORS' INCOME39.99237.23734.99341.09040.34939.61938.91138.20937.52536.90736.30635.74335.21534.78934.226 FEEC, 02/200437.71535.20132.62338.65637.97737.42736.79936.23635.52134.82934.21633.74032.52832.32631.896 FEEC, 10/2004
% Change7.4%6.4%8.9%7.6%7.6%7.5%7.6%7.5%6.9%6.8%6.5%6.1%5.0%6.7%14.8% FEEC, 02/20047.1%7.9%9.9%7.3%6.0%7.0%6.4%8.3%8.2%7.4%5.8%15.8%2.5%5.5%14.7% FEEC, 10/2004
FLORIDA ECONOMIC ESTIMATING CONFERENCEShort Run Tables
Conference Held October 22, 2004 PAGE 2

05-0604-0503-042006-22006-12005-42005-32005-22005-12004-42004-32004-22004-12003-42003-3
7. PROPERTY INCOME142.960133.055127.674147.381144.408141.400138.651136.035133.731131.817130.637129.760129.000126.570125.365 FEEC, 02/2004131.516128.074120.047133.640132.093130.713129.618128.161126.626133.393124.115122.670121.006119.351117.162 FEEC, 10/2004
% Change7.4%4.2%1.8%8.5%8.8%8.2%7.9%7.1%5.9%3.7%2.7%2.4%7.9%3.9%0.7% FEEC, 02/20042.7%6.7%1.3%4.8%4.3%3.4%4.6%4.9%-18.8%33.4%4.8%5.6%5.7%7.7%-1.7% FEEC, 10/2004
8. TRANSFER PAYMENTS96.70192.05788.28299.32097.60995.40994.46593.58092.74191.43890.47189.63588.83087.65287.010 FEEC, 02/200499.43992.42687.009103.208100.97597.50996.06494.64493.43191.27190.35689.58087.83685.53785.082 FEEC, 10/2004
% Change5.0%4.3%6.8%7.2%9.6%4.1%3.8%3.7%5.8%4.3%3.8%3.7%5.5%3.0%8.5% FEEC, 02/20047.6%6.2%5.9%9.1%15.0%6.1%6.1%5.3%9.8%4.1%3.5%8.2%11.2%2.2%4.5% FEEC, 10/2004
FLORIDA ECONOMIC ESTIMATING CONFERENCEShort Run Tables
Conference Held October 22, 2004 PAGE 3
05-0604-0503-042006-22006-12005-42005-32005-22005-12004-42004-32004-22004-12003-42003-3
EMPLOYMENT (000s)
1. TOTAL NON-FARM7,800.07,578.77,368.47,876.67,825.37,774.97,723.47,670.97,611.87,546.47,485.67,429.57,382.97,347.57,313.6 FEEC, 02/20047,753.27,551.67,358.97,817.57,776.07,733.07,686.27,632.57,577.97,523.77,472.47,424.57,373.37,334.97,302.8 FEEC, 10/2004
% Change2.9%2.9%1.6%2.6%2.6%2.7%2.8%3.1%3.5%3.3%3.1%2.5%1.9%1.9%1.8% FEEC, 02/20042.7%2.6%1.9%2.1%2.2%2.5%2.8%2.9%2.9%2.8%2.6%2.8%2.1%1.8%2.6% FEEC, 10/2004
2. NATURAL RESOURCES & MINING105.7103.9104.0106.1105.9105.6105.3104.9104.1103.4103.1103.4103.6104.6104.5 FEEC, 02/2004101.0102.3102.2100.7101.2100.8101.2101.8102.5102.1102.7102.5102.7102.8100.9 FEEC, 10/2004
% Change1.8%-0.1%-0.3%1.0%1.1%0.9%1.7%2.9%3.0%0.9%-1.0%-0.9%-3.6%0.0%0.4% FEEC, 02/2004
-1.3%0.0%-1.4%-2.3%1.8%-1.6%-2.2%-2.7%1.3%-2.3%0.8%-0.7%-0.3%7.6%-2.3% FEEC, 10/2004
3. CONSTRUCTION461.9453.1447.5464.2462.5461.2459.5457.0454.1451.3450.0449.7448.5446.9445.0 FEEC, 02/2004477.2475.6457.7476.0476.9477.8478.0477.7476.9475.4472.5467.1461.4453.7448.5 FEEC, 10/2004
% Change1.9%1.2%3.5%1.4%1.2%1.5%2.1%2.6%2.6%1.1%0.2%1.1%1.4%1.7%5.4% FEEC, 02/20040.3%3.9%5.1%-0.7%-0.7%-0.2%0.2%0.7%1.2%2.5%4.7%5.0%7.0%4.8%4.7% FEEC, 10/2004
4. MANUFACTURING398.5395.7392.0399.9399.2398.1396.7396.8396.4394.8394.6394.4392.1391.8389.7 FEEC, 02/2004391.7388.3382.6392.8392.0391.3390.6390.0388.7387.8386.7384.8382.0380.4383.2 FEEC, 10/2004
% Change0.7%0.9%-2.0%0.6%1.2%1.4%-0.0%0.4%1.6%0.2%0.2%2.4%0.2%2.2%-2.7% FEEC, 02/20040.9%1.5%-3.7%0.8%0.8%0.7%0.6%1.3%0.9%1.2%2.0%3.0%1.7%-2.9%-4.9% FEEC, 10/2004
5. WHOLESALE & RETAIL TRADE1,291.81,262.71,240.01,302.91,296.01,288.11,280.11,272.81,266.01,259.61,252.41,244.91,239.71,236.81,238.5 FEEC, 02/20041,276.01,259.41,240.11,282.31,277.81,274.11,269.71,265.41,261.91,257.61,252.61,246.91,239.61,236.91,237.0 FEEC, 10/2004
% Change2.3%1.8%0.4%2.2%2.5%2.5%2.3%2.2%2.0%2.3%2.4%1.7%1.0%-0.5%0.7% FEEC, 02/20041.3%1.6%0.7%1.4%1.2%1.4%1.3%1.1%1.4%1.6%1.9%2.4%0.9%-0.0%2.2% FEEC, 10/2004
6. TRANSPORTATION & UTILITIES241.8232.4229.1244.6242.9241.2238.6235.9233.6231.0229.0228.2228.2228.8231.2 FEEC, 02/2004234.0228.0225.9235.2234.7233.8232.4230.6229.1227.1225.1224.4225.7226.2227.4 FEEC, 10/2004
% Change4.1%1.4%-3.2%2.8%2.9%4.4%4.7%3.9%4.6%3.5%1.4%0.0%-1.1%-4.0%-4.5% FEEC, 02/20042.7%0.9%-3.1%0.9%1.5%2.5%3.1%2.8%3.4%3.6%1.2%-2.2%-0.9%-2.0%-3.4% FEEC, 10/2004
FLORIDA ECONOMIC ESTIMATING CONFERENCEShort Run Tables
Conference Held October 22, 2004 PAGE 4

05-0604-0503-042006-22006-12005-42005-32005-22005-12004-42004-32004-22004-12003-42003-3
7. INFORMATION170.8169.6166.8170.6170.9171.0170.7170.7170.3169.4168.0165.7166.0167.0168.6 FEEC, 02/2004174.8171.1171.3174.6175.1175.3174.4172.6171.4170.9169.4170.2171.1171.9171.8 FEEC, 10/2004
% Change0.7%1.7%-2.9%-0.7%-0.3%0.6%0.1%0.9%2.0%3.4%5.7%-0.6%-2.5%-3.6%-3.6% FEEC, 02/20042.2%-0.1%-1.4%-1.3%-0.4%2.2%4.2%2.8%1.2%3.6%-1.9%-2.1%-1.8%0.3%2.0% FEEC, 10/2004
8. FINANCIAL ACTIVITIES508.2496.0485.1512.5509.7506.8503.9500.8497.8494.5491.0487.8485.5483.5483.6 FEEC, 02/2004526.0505.4489.6532.3528.4524.0519.1513.8508.3502.7496.9494.0489.9487.4487.0 FEEC, 10/2004
% Change2.5%2.3%1.6%2.2%2.3%2.3%2.5%2.5%2.6%2.9%2.6%2.0%1.7%-0.1%1.2% FEEC, 02/20044.1%3.2%2.2%3.0%3.4%3.8%4.2%4.4%4.5%4.7%2.4%3.4%2.0%0.4%3.2% FEEC, 10/2004
9. PROFESSIONAL & BUSINESS SERVICES1,441.81,367.01,280.71,467.11,448.91,432.91,418.41,403.41,381.61,354.11,328.91,305.91,285.41,270.41,261.0 FEEC, 02/20041,421.51,346.11,286.41,446.71,430.21,413.41,395.81,375.91,354.51,334.81,319.31,304.61,290.61,282.01,268.5 FEEC, 10/2004
% Change5.5%6.7%3.6%5.1%4.5%4.1%4.4%6.5%8.3%7.8%7.2%6.5%4.8%3.0%5.9% FEEC, 02/20045.6%4.6%4.8%4.7%4.8%5.1%5.9%6.5%6.0%4.8%4.6%4.4%2.7%4.3%7.1% FEEC, 10/2004
10. EDUCATION & HEALTH SERVICES932.9906.8884.3942.9936.2929.5923.0916.4910.0903.7897.3890.8885.9882.0878.5 FEEC, 02/2004948.6921.2896.6958.1951.8945.4939.2932.1924.5916.9911.3906.3898.5891.9889.7 FEEC, 10/2004
% Change2.9%2.5%1.6%2.9%2.9%2.9%2.9%2.8%2.8%2.9%2.9%2.2%1.8%1.6%1.1% FEEC, 02/20043.0%2.7%2.9%2.7%2.7%2.7%3.1%3.3%3.3%2.5%2.3%3.5%3.0%1.0%2.7% FEEC, 10/2004
11. LEISURE & HOSPITALITY885.2857.2834.3894.1888.3882.5875.9867.9860.1853.2847.5842.4838.0833.0823.8 FEEC, 02/2004861.3839.4818.3867.7863.8859.1854.6847.9842.3836.4831.0827.1822.1816.2807.7 FEEC, 10/2004
% Change3.3%2.7%2.8%2.6%2.7%3.1%3.7%3.7%3.2%2.7%2.4%2.1%2.4%4.5%3.5% FEEC, 02/20042.6%2.6%1.8%1.8%2.2%2.1%3.2%2.7%2.9%2.6%1.9%2.4%2.9%4.3%2.1% FEEC, 10/2004
12. OTHER SERVICES333.4325.0317.3336.3334.5332.4330.4328.4326.3324.0321.2319.0318.1317.4314.6 FEEC, 02/2004336.4329.3320.9339.4337.3335.3333.5331.9330.3328.4326.7323.5321.6320.6317.8 FEEC, 10/2004
% Change2.6%2.4%1.0%2.2%2.5%2.4%2.5%2.6%2.8%3.5%2.9%1.1%0.8%3.6%-0.6% FEEC, 02/20042.1%2.6%2.1%2.5%2.4%2.2%1.9%1.9%2.4%2.1%4.0%2.3%1.3%3.5%1.5% FEEC, 10/2004
FLORIDA ECONOMIC ESTIMATING CONFERENCEShort Run Tables
Conference Held October 22, 2004 PAGE 5

05-0604-0503-042006-22006-12005-42005-32005-22005-12004-42004-32004-22004-12003-42003-3
13. GOVERNMENT1,126.31,105.81,084.11,133.91,128.81,123.71,118.61,113.41,108.31,103.31,098.31,093.31,088.31,082.61,072.2 FEEC, 02/20041,099.01,080.81,062.51,105.81,101.21,096.71,092.21,087.71,083.11,078.51,073.81,068.41,063.51,060.61,057.4 FEEC, 10/2004
% Change1.8%2.0%2.4%1.8%1.8%1.8%1.9%1.9%1.8%1.8%1.8%1.8%2.1%3.9%1.3% FEEC, 02/20041.7%1.7%1.4%1.6%1.7%1.7%1.7%1.7%1.7%1.8%2.1%1.8%1.1%1.2%1.3% FEEC, 10/2004
14. LABOR FORCE8,478.18,272.68,107.98,554.78,503.18,453.78,401.18,348.58,298.48,246.58,197.18,150.18,110.68,080.88,090.0 FEEC, 02/20048,611.18,451.88,262.18,667.08,630.88,593.28,553.38,512.28,470.98,430.68,393.78,355.98,304.78,201.08,186.7 FEEC, 10/2004
% Change2.5%2.0%0.2%2.4%2.4%2.5%2.5%2.4%2.5%2.4%2.3%2.0%1.5%-0.5%0.6% FEEC, 02/20041.9%2.3%1.8%1.7%1.8%1.9%1.9%2.0%1.9%1.8%1.8%2.5%5.2%0.7%2.0% FEEC, 10/2004
15. CIVILIAN EMPLOYED8,095.67,898.07,711.58,165.58,118.18,073.48,025.37,975.17,924.47,871.67,821.07,771.87,729.07,691.77,653.5 FEEC, 02/20048,208.78,059.57,861.68,266.78,228.68,189.48,149.98,111.38,074.38,039.98,012.67,963.87,917.77,800.47,764.7 FEEC, 10/2004
% Change2.5%2.4%0.7%2.4%2.2%2.4%2.5%2.6%2.7%2.6%2.6%2.2%2.0%2.0%0.4% FEEC, 02/20041.9%2.5%2.3%1.9%1.9%2.0%1.9%1.8%1.7%1.4%2.5%2.4%6.2%1.9%2.5% FEEC, 10/2004
16. NUMBER UNEMPLOYED382.5374.6396.4389.1385.0380.3375.7373.3374.0374.9376.1378.3381.6389.0436.5 FEEC, 02/2004402.4392.3400.4400.3402.2403.7403.4400.9396.6390.7381.1392.1387.0400.6422.0 FEEC, 10/2004
% Change2.1%-5.5%-8.6%4.3%5.0%5.0%2.6%-0.7%-0.9%-1.3%-2.4%-3.4%-7.4%-36.9%4.6% FEEC, 02/20042.6%-2.0%-7.4%-1.9%-1.5%0.4%2.4%4.5%6.1%10.5%-10.8%5.4%-13.0%-18.8%-6.7% FEEC, 10/2004
17. UNEMPLOYMENT RATE (%)4.514.534.894.554.534.504.474.474.514.554.594.644.714.815.40 FEEC, 02/20044.674.644.854.624.664.704.724.714.684.634.544.694.664.895.15 FEEC, 10/2004
FLORIDA ECONOMIC ESTIMATING CONFERENCEShort Run Tables
Conference Held October 22, 2004 PAGE 6

05-0604-0503-042006-22006-12005-42005-32005-22005-12004-42004-32004-22004-12003-42003-3
CONSTRUCTION (billions of $)
1. PRIVATE HOUSING STARTS (000s, saar)184.0200.8213.0179.7181.7185.2189.5194.4199.8203.2205.8207.9212.9206.8224.2 FEEC, 02/2004208.1234.0230.8201.0205.4210.4215.9221.4228.1237.2249.4244.9231.5221.3225.5 FEEC, 10/2004
% Change-8.4%-5.7%11.0%-4.4%-7.3%-8.9%-9.7%-10.4%-6.4%-5.0%-3.9%-9.1%12.4%-27.7%68.8% FEEC, 02/2004
-11.1%1.4%19.7%-8.2%-9.2%-9.8%-9.6%-11.2%-14.6%-18.1%7.7%25.1%19.7%-7.2%58.6% FEEC, 10/2004
2. SINGLE FAMILY STARTS (000s, saar)127.5138.1154.1125.9126.2127.9130.2133.1136.8139.9142.6148.0156.7159.4152.2 FEEC, 02/2004146.2163.6163.1140.9144.1147.9151.8155.5159.6165.7173.7180.1161.3159.2151.7 FEEC, 10/2004
% Change-7.6%-10.4%16.2%-1.1%-5.2%-6.8%-8.6%-10.1%-8.7%-7.4%-13.7%-20.4%-6.5%20.1%31.5% FEEC, 02/2004
-10.7%0.3%22.9%-8.7%-9.7%-9.9%-9.2%-10.0%-13.8%-17.2%-13.6%55.7%5.3%21.4%29.0% FEEC, 10/2004
3. MULTI FAMILY STARTS (000s, saar)56.562.758.953.855.557.359.361.363.163.363.259.956.247.472.0 FEEC, 02/200462.070.467.760.161.262.564.165.968.471.675.864.770.262.173.8 FEEC, 10/2004
% Change-9.9%6.5%-0.7%-11.4%-11.9%-13.2%-12.2%-11.0%-1.0%0.5%23.8%29.1%97.1%-81.2%203.0% FEEC, 02/2004
-12.0%3.9%12.6%-7.1%-8.1%-9.4%-10.5%-14.2%-16.3%-20.4%87.5%-27.9%63.5%-49.9%151.7% FEEC, 10/2004
4. TOTAL CONSTRUCTION EXPENDITURES50.77950.79352.06312.78312.67912.66712.64912.66812.67712.71112.73713.05813.00613.43112.568 FEEC, 02/200456.88259.47954.51014.02614.12314.30414.42914.55014.67815.03015.22214.55813.59313.66412.695 FEEC, 10/2004
% Change-0.0%-2.4%13.9%3.3%0.4%0.6%-0.6%-0.3%-1.1%-0.8%-9.5%1.6%-12.1%30.4%35.0% FEEC, 02/2004-4.4%9.1%19.1%-2.7%-5.0%-3.4%-3.3%-3.5%-9.0%-5.0%19.5%31.6%-2.0%34.2%37.3% FEEC, 10/2004
5. RESIDENTIAL EXPENDITURES29.63331.53834.0717.3257.3347.4347.5397.6867.8227.9658.0658.4598.4829.0318.100 FEEC, 02/200435.89339.96936.4278.6518.8319.0979.3149.5249.74210.20410.49910.0369.0229.1808.189 FEEC, 10/2004
% Change-6.0%-7.4%23.8%-0.5%-5.2%-5.5%-7.4%-6.8%-7.0%-4.8%-17.4%-1.1%-22.2%54.5%53.0% FEEC, 02/2004
-10.2%9.7%32.0%-7.9%-11.2%-9.0%-8.6%-8.6%-16.9%-10.8%19.7%53.2%-6.7%57.9%53.8% FEEC, 10/2004
6. PRIVATE NON-RESIDENTIAL EXPENDITURES11.5829.9978.8853.0332.9442.8552.7492.6382.5292.4412.3892.3332.2742.1892.089 FEEC, 02/200411.75010.7279.4153.0222.9672.9112.8502.7892.7272.6432.5682.5152.4802.2772.144 FEEC, 10/2004
% Change15.9%12.5%0.2%12.6%13.2%16.2%17.9%18.5%15.1%9.1%9.9%10.7%16.6%20.4%-12.8% FEEC, 02/2004
9.5%13.9%6.1%7.5%8.0%8.8%9.1%9.3%13.4%12.3%8.7%5.7%40.8%27.3%-3.4% FEEC, 10/2004
FLORIDA ECONOMIC ESTIMATING CONFERENCEShort Run Tables
Conference Held October 22, 2004 PAGE 7

05-0604-0503-042006-22006-12005-42005-32005-22005-12004-42004-32004-22004-12003-42003-3
7. TOTAL PUBLIC EXPENDITURES9.5649.2589.1062.4242.4002.3792.3602.3442.3262.3052.2842.2662.2502.2122.378 FEEC, 02/20049.2388.7838.6692.3532.3252.2952.2652.2362.2092.1822.1562.0072.0922.2082.363 FEEC, 10/2004
% Change3.3%1.7%-2.0%4.0%3.6%3.2%2.9%3.0%3.7%3.8%3.1%2.9%7.1%-25.2%33.3% FEEC, 02/20045.2%1.3%-6.7%4.9%5.2%5.5%5.2%5.1%4.9%5.1%33.1%-15.3%-19.4%-23.8%29.9% FEEC, 10/2004
FLORIDA ECONOMIC ESTIMATING CONFERENCEShort Run Tables
Conference Held October 22, 2004 PAGE 8

05-0604-0503-042006-22006-12005-42005-32005-22005-12004-42004-32004-22004-12003-42003-3
POPULATION & OTHER
1. POPULATION (millions)18.00917.67717.33918.13318.05017.96817.88517.80217.71817.63517.55217.46717.38317.29717.209 FEEC, 02/200418.14217.78417.40118.27918.18718.09718.00717.91717.82717.73917.65117.56417.45817.34717.236 FEEC, 10/2004
% Change1.88%1.95%2.17%1.84%1.86%1.87%1.88%1.89%1.90%1.92%1.94%1.96%1.99%2.06%2.15% FEEC, 02/20042.02%2.20%2.55%2.02%2.01%2.02%2.02%2.03%2.02%2.00%2.00%2.46%2.57%2.61%2.60% FEEC, 10/2004
2. CHANGE IN POPULATION (000s)331.4334.1349.482.682.882.983.183.283.283.784.184.585.688.091.3 FEEC, 02/2004361.5353.2438.191.390.590.189.789.888.887.687.0106.2110.3111.5110.1 FEEC, 10/2004
3. HOUSEHOLDS (millions)7.1547.0216.8867.2047.1717.1387.1047.0717.0387.0046.9716.9376.9036.8696.834 FEEC, 02/20047.2027.0606.9107.2567.2207.1847.1487.1137.0777.0427.0086.9756.9326.8886.844 FEEC, 10/2004
% Change1.90%1.96%2.17%1.86%1.87%1.89%1.90%1.91%1.92%1.94%1.96%1.98%2.01%2.06%2.14% FEEC, 02/20042.01%2.17%2.53%2.01%2.01%2.01%2.01%2.02%2.01%1.98%1.91%2.48%2.58%2.62%2.58% FEEC, 10/2004
4. CHANGE IN HOUSEHOLDS (000s)133.0133.9139.333.233.233.333.333.333.333.533.733.934.235.036.1 FEEC, 02/2004143.1138.0174.436.135.835.735.535.535.134.433.042.544.144.343.5 FEEC, 10/2004
5. HOUSEHOLD SIZE (persons)2.5172.5182.5182.5172.5172.5172.5172.5182.5182.5182.5182.5182.5182.5182.518 FEEC, 02/20042.5192.5192.5182.5192.5192.5192.5192.5192.5192.5192.5192.5182.5182.5182.518 FEEC, 10/2004
% Change-0.02%-0.02%0.00%-0.02%-0.02%-0.02%-0.02%-0.02%-0.02%-0.02%-0.02%-0.02%-0.01%-0.00%0.01% FEEC, 02/20040.01%0.02%0.01%0.01%0.01%0.01%0.00%0.01%0.01%0.02%0.09%-0.02%-0.01%-0.00%0.01% FEEC, 10/2004
6. TOTAL NEW LIGHT VEHICLE REGISTRATIONS (000s)
1,431.91,424.41,398.2360.0358.2356.5357.3359.0358.5355.8351.1348.7348.2354.7346.6 FEEC, 02/20041,393.01,382.81,384.8351.6347.3345.8348.3349.9343.2342.3347.3336.4350.3351.4346.7 FEEC, 10/2004
% Change0.5%1.9%3.5%2.0%1.9%-0.8%-1.9%0.6%3.0%5.4%2.8%0.6%-7.2%9.7%52.0% FEEC, 02/20040.7%-0.1%3.5%5.0%1.7%-2.8%-1.8%8.1%1.0%-5.6%13.7%-15.0%-1.1%5.5%22.8% FEEC, 10/2004
FLORIDA ECONOMIC ESTIMATING CONFERENCEShort Run Tables
Conference Held October 22, 2004 PAGE 9

05-0604-0503-042006-22006-12005-42005-32005-22005-12004-42004-32004-22004-12003-42003-3
7. NEW AUTOMOBILE REGISTRATIONS (000s)
762.6756.7740.7191.6191.0190.2189.8191.0190.8189.2185.7184.5183.0183.2190.0 FEEC, 02/2004729.2720.7730.5182.3181.6182.5182.8183.7179.1179.7178.2171.7184.7180.0194.0 FEEC, 10/2004
% Change0.8%2.2%-0.9%1.2%1.9%0.7%-2.5%0.4%3.4%7.9%2.6%3.3%-0.3%-13.6%84.9% FEEC, 02/20041.2%-1.3%-1.8%1.6%-2.1%-0.6%-1.8%10.6%-1.4%3.4%16.0%-25.3%10.9%-25.9%53.6% FEEC, 10/2004
8. NEW LIGHT TRUCK REGISTRATIONS (000s)
669.3667.6657.6168.4167.1166.4167.5168.0167.7166.6165.4164.2165.1171.6156.7 FEEC, 02/2004663.9662.1654.3169.3165.8163.3165.5166.2164.1162.6169.1164.7165.6171.3152.7 FEEC, 10/2004
% Change0.3%1.5%9.0%2.9%1.9%-2.6%-1.3%0.8%2.6%2.8%3.0%-2.2%-14.2%43.9%21.3% FEEC, 02/20040.3%1.2%10.1%8.9%6.2%-5.2%-1.8%5.4%3.6%-14.5%11.3%-2.3%-12.7%58.5%-6.0% FEEC, 10/2004
FLORIDA ECONOMIC ESTIMATING CONFERENCEShort Run Tables
Conference Held October 22, 2004 PAGE 10

13-1412-1311-1210-1109-1008-0907-0806-0705-0604-0503-0402-0301-02
EXECUTIVE SUMMARY
1. TOTAL PERSONAL INCOME (Billions of $)975.858914.121859.056808.994760.274714.209672.418632.265591.997556.093527.201503.506483.912 FEEC, 02/2004
1001.991936.967875.969818.222763.368711.955666.140625.850589.800558.599523.946499.529485.700 FEEC, 10/2004
% Change6.8%6.4%6.2%6.4%6.4%6.2%6.4%6.8%6.5%5.5%4.7%4.0%3.5% FEEC, 02/20046.9%7.0%7.1%7.2%7.2%6.9%6.4%6.1%5.6%6.6%4.9%2.8%3.4% FEEC, 10/2004
2. REAL PER CAPITA INCOME (Thous 2000$)35.32834.62033.99833.47732.87832.21531.59130.95130.09029.27528.67928.39428.439 FEEC, 02/200436.20135.25734.35633.48432.56231.60830.76830.07629.43728.89328.25428.13728.511 FEEC, 10/2004
% Change2.0%1.8%1.6%1.8%2.1%2.0%2.1%2.9%2.8%2.1%1.0%-0.2%-0.1% FEEC, 02/20042.7%2.6%2.6%2.8%3.0%2.7%2.3%2.2%1.9%2.3%0.4%-1.3%-0.3% FEEC, 10/2004
3. TOTAL NON-FARM EMPLOYMENT (000s)9,390.39,175.08,971.48,773.08,576.38,389.48,215.38,017.47,800.07,578.77,368.47,251.87,170.4 FEEC, 02/20049,370.39,138.68,910.78,690.28,486.28,293.68,107.17,925.47,753.27,551.67,358.97,223.27,164.4 FEEC, 10/2004
% Change2.3%2.3%2.3%2.3%2.2%2.1%2.5%2.8%2.9%2.9%1.6%1.1%0.2% FEEC, 02/20042.5%2.6%2.5%2.4%2.3%2.3%2.3%2.2%2.7%2.6%1.9%0.8%0.1% FEEC, 10/2004
4. PRIVATE HOUSING STARTS (000s, saar)176.6173.3172.6172.3173.3184.3190.3182.0184.0200.8213.0191.9176.1 FEEC, 02/2004187.9184.0182.2179.6178.9184.5189.9193.8208.1234.0230.8192.8176.2 FEEC, 10/2004
% Change1.9%0.4%0.2%-0.5%-6.0%-3.2%4.6%-1.1%-8.4%-5.7%11.0%9.0%8.2% FEEC, 02/20042.2%1.0%1.4%0.4%-3.1%-2.8%-2.0%-6.9%-11.1%1.4%19.7%9.4%8.2% FEEC, 10/2004
5. POPULATION (millions)20.60120.28019.96019.63919.31718.99318.66818.33918.00917.67717.33916.97116.587 FEEC, 02/200420.88120.56120.23919.90919.56819.22118.86918.50718.14217.78417.40116.96916.588 FEEC, 10/2004
% Change1.58%1.60%1.63%1.67%1.70%1.74%1.79%1.83%1.88%1.95%2.17%2.31%2.09% FEEC, 02/20041.56%1.59%1.66%1.74%1.81%1.87%1.95%2.01%2.02%2.20%2.55%2.29%2.10% FEEC, 10/2004
FLORIDA ECONOMIC ESTIMATING CONFERENCELong Run Tables
Conference Held October 22, 2004 PAGE 1

13-1412-1311-1210-1109-1008-0907-0806-0705-0604-0503-0402-0301-02
6. TOTAL NEW LIGHT VEHICLE REGISTRATIONS (000s)
1,610.91,592.91,577.61,559.71,539.01,515.71,495.71,467.31,431.91,424.41,398.21,350.51,327.3 FEEC, 02/20041,607.71,577.41,555.31,527.01,501.91,470.91,450.91,428.61,393.01,382.81,384.81,337.81,327.5 FEEC, 10/2004
% Change1.1%1.0%1.1%1.3%1.5%1.3%1.9%2.5%0.5%1.9%3.5%1.7%-5.0% FEEC, 02/20041.9%1.4%1.9%1.7%2.1%1.4%1.6%2.6%0.7%-0.1%3.5%0.8%-5.1% FEEC, 10/2004
FLORIDA ECONOMIC ESTIMATING CONFERENCELong Run Tables
Conference Held October 22, 2004 PAGE 2

13-1412-1311-1210-1109-1008-0907-0806-0705-0604-0503-0402-0301-02
INCOME (billions of dollars)
1. TOTAL PERSONAL INCOME975.858914.121859.056808.994760.274714.209672.418632.265591.997556.093527.201503.506483.912 FEEC, 02/2004
1001.991936.967875.969818.222763.368711.955666.140625.850589.800558.599523.946499.529485.700 FEEC, 10/2004
% Change6.8%6.4%6.2%6.4%6.4%6.2%6.4%6.8%6.5%5.5%4.7%4.0%3.5% FEEC, 02/20046.9%7.0%7.1%7.2%7.2%6.9%6.4%6.1%5.6%6.6%4.9%2.8%3.4% FEEC, 10/2004
2. REAL PERSONAL INCOME (2000 Dollars)727.810702.120678.611657.468635.117611.884589.760567.634541.905517.503497.287481.861471.729 FEEC, 02/2004755.927724.938695.354666.667637.220607.557580.577556.651534.081513.837491.659477.442472.950 FEEC, 10/2004
% Change3.7%3.5%3.2%3.5%3.8%3.8%3.9%4.7%4.7%4.1%3.2%2.1%2.0% FEEC, 02/20044.3%4.3%4.3%4.6%4.9%4.6%4.3%4.2%3.9%4.5%3.0%0.9%1.8% FEEC, 10/2004
3. REAL PER CAPITA INCOME (thous 2000$)35.32834.62033.99833.47732.87832.21531.59130.95130.09029.27528.67928.39428.439 FEEC, 02/200436.20135.25734.35633.48432.56231.60830.76830.07629.43728.89328.25428.13728.511 FEEC, 10/2004
% Change2.0%1.8%1.6%1.8%2.1%2.0%2.1%2.9%2.8%2.1%1.0%-0.2%-0.1% FEEC, 02/20042.7%2.6%2.6%2.8%3.0%2.7%2.3%2.2%1.9%2.3%0.4%-1.3%-0.3% FEEC, 10/2004
4. WAGES & SALARIES462.749435.753411.670389.622369.137350.127332.241313.888296.015278.295261.631250.277242.212 FEEC, 02/2004466.194440.067415.359392.088370.802350.952332.154314.351297.772280.796264.190251.400242.951 FEEC, 10/2004
% Change6.2%5.9%5.7%5.5%5.4%5.4%5.8%6.0%6.4%6.4%4.5%3.3%3.0% FEEC, 02/20045.9%5.9%5.9%5.7%5.7%5.7%5.7%5.6%6.0%6.3%5.1%3.5%3.5% FEEC, 10/2004
5. OTHER LABOR INCOME58.80556.06453.25050.46147.86245.36742.93140.74938.66536.36634.41431.96328.902 FEEC, 02/200472.28767.91363.70660.14156.75553.94851.37048.83346.20243.37039.87736.42832.645 FEEC, 10/2004
% Change4.9%5.3%5.5%5.4%5.5%5.7%5.4%5.4%6.3%5.7%7.7%10.6%5.5% FEEC, 02/20046.4%6.6%5.9%6.0%5.2%5.0%5.2%5.7%6.5%8.8%9.5%11.6%8.7% FEEC, 10/2004
6. PROPRIETORS' INCOME70.23665.39660.91256.79052.94249.32445.96342.93639.99237.23734.99332.14130.093 FEEC, 02/200463.13258.90254.99451.33348.26645.77243.15740.31637.71535.20132.62329.69228.971 FEEC, 10/2004
% Change7.4%7.4%7.3%7.3%7.3%7.3%7.0%7.4%7.4%6.4%8.9%6.8%3.8% FEEC, 02/20047.2%7.1%7.1%6.4%5.4%6.1%7.0%6.9%7.1%7.9%9.9%2.5%-0.4% FEEC, 10/2004
FLORIDA ECONOMIC ESTIMATING CONFERENCELong Run Tables
Conference Held October 22, 2004 PAGE 3

13-1412-1311-1210-1109-1008-0907-0806-0705-0604-0503-0402-0301-02
7. PROPERTY INCOME255.735237.054220.606206.743192.793178.316165.694154.143142.960133.055127.674125.359123.941 FEEC, 02/2004265.153243.644223.315203.778184.629165.440149.657138.301131.516128.074120.047118.506121.302 FEEC, 10/2004
% Change7.9%7.5%6.7%7.2%8.1%7.6%7.5%7.8%7.4%4.2%1.8%1.1%1.1% FEEC, 02/20048.8%9.1%9.6%10.4%11.6%10.5%8.2%5.2%2.7%6.7%1.3%-2.3%-0.3% FEEC, 10/2004
8. TRANSFER PAYMENTS164.648153.917144.665135.579126.008117.908110.896104.34896.70192.05788.28282.69176.750 FEEC, 02/2004172.932161.839151.756142.041132.124123.415115.758108.56599.43992.42687.00982.16477.655 FEEC, 10/2004
% Change7.0%6.4%6.7%7.6%6.9%6.3%6.3%7.9%5.0%4.3%6.8%7.7%9.1% FEEC, 02/20046.9%6.6%6.8%7.5%7.1%6.6%6.6%9.2%7.6%6.2%5.9%5.8%9.3% FEEC, 10/2004
FLORIDA ECONOMIC ESTIMATING CONFERENCELong Run Tables
Conference Held October 22, 2004 PAGE 4

13-1412-1311-1210-1109-1008-0907-0806-0705-0604-0503-0402-0301-02
EMPLOYMENT (000s)
1. TOTAL NON-FARM9,390.39,175.08,971.48,773.08,576.38,389.48,215.38,017.47,800.07,578.77,368.47,251.87,170.4 FEEC, 02/20049,370.39,138.68,910.78,690.28,486.28,293.68,107.17,925.47,753.27,551.67,358.97,223.27,164.4 FEEC, 10/2004
% Change2.3%2.3%2.3%2.3%2.2%2.1%2.5%2.8%2.9%2.9%1.6%1.1%0.2% FEEC, 02/20042.5%2.6%2.5%2.4%2.3%2.3%2.3%2.2%2.7%2.6%1.9%0.8%0.1% FEEC, 10/2004
2. NATURAL RESOURCES & MINING109.4108.9108.5108.0107.9107.5107.2106.4105.7103.9104.0104.3104.5 FEEC, 02/2004
96.396.997.598.198.298.899.4100.1101.0102.3102.2103.7104.5 FEEC, 10/2004
% Change0.4%0.4%0.4%0.1%0.4%0.3%0.7%0.7%1.8%-0.1%-0.3%-0.2%-2.7% FEEC, 02/2004
-0.6%-0.6%-0.6%-0.2%-0.6%-0.6%-0.7%-0.9%-1.3%0.0%-1.4%-0.7%-2.8% FEEC, 10/2004
3. CONSTRUCTION554.4537.6525.6513.6504.8501.0491.1473.2461.9453.1447.5432.4425.5 FEEC, 02/2004543.9526.3511.1496.5485.5479.5475.0473.9477.2475.6457.7435.6425.1 FEEC, 10/2004
% Change3.1%2.3%2.3%1.7%0.8%2.0%3.8%2.5%1.9%1.2%3.5%1.6%2.6% FEEC, 02/20043.3%3.0%2.9%2.2%1.3%0.9%0.2%-0.7%0.3%3.9%5.1%2.5%2.5% FEEC, 10/2004
4. MANUFACTURING383.5387.1390.4392.7395.1398.3400.2400.5398.5395.7392.0399.8416.9 FEEC, 02/2004367.9372.0376.6380.6384.5388.5391.6393.4391.7388.3382.6397.5416.6 FEEC, 10/2004
% Change-0.9%-0.8%-0.6%-0.6%-0.8%-0.5%-0.1%0.5%0.7%0.9%-2.0%-4.1%-7.0% FEEC, 02/2004-1.1%-1.2%-1.1%-1.0%-1.0%-0.8%-0.5%0.5%0.9%1.5%-3.7%-4.6%-6.9% FEEC, 10/2004
5. WHOLESALE & RETAIL TRADE1,520.91,487.01,455.31,425.11,393.91,365.31,342.71,319.51,291.81,262.71,240.01,235.41,240.6 FEEC, 02/20041,437.81,420.91,398.61,374.81,352.41,331.11,311.81,293.21,276.01,259.41,240.11,231.51,239.5 FEEC, 10/2004
% Change2.3%2.2%2.1%2.2%2.1%1.7%1.8%2.1%2.3%1.8%0.4%-0.4%-1.2% FEEC, 02/20041.2%1.6%1.7%1.7%1.6%1.5%1.4%1.3%1.3%1.6%0.7%-0.6%-1.2% FEEC, 10/2004
6. TRANSPORTATION & UTILITIES297.1291.5285.2278.1271.2264.8258.7250.2241.8232.4229.1236.6240.6 FEEC, 02/2004265.0260.8256.9252.9248.5244.3240.3237.1234.0228.0225.9233.1240.4 FEEC, 10/2004
% Change1.9%2.2%2.6%2.6%2.4%2.3%3.4%3.5%4.1%1.4%-3.2%-1.7%-2.1% FEEC, 02/20041.6%1.5%1.6%1.8%1.7%1.6%1.4%1.3%2.7%0.9%-3.1%-3.0%-2.2% FEEC, 10/2004
FLORIDA ECONOMIC ESTIMATING CONFERENCELong Run Tables
Conference Held October 22, 2004 PAGE 5

13-1412-1311-1210-1109-1008-0907-0806-0705-0604-0503-0402-0301-02
7. INFORMATION196.0192.8189.0184.9182.0179.7175.2170.7170.8169.6166.8171.8182.5 FEEC, 02/2004206.5201.9196.5191.9188.5184.7179.4175.7174.8171.1171.3173.7182.5 FEEC, 10/2004
% Change1.6%2.0%2.2%1.6%1.2%2.6%2.6%-0.1%0.7%1.7%-2.9%-5.9%-4.8% FEEC, 02/20042.3%2.7%2.4%1.8%2.0%3.0%2.1%0.5%2.2%-0.1%-1.4%-4.8%-4.8% FEEC, 10/2004
8. FINANCIAL ACTIVITIES595.6586.0576.0565.4554.3543.2532.7520.2508.2496.0485.1477.2472.4 FEEC, 02/2004633.3619.3605.3590.9576.6563.5551.8540.4526.0505.4489.6479.1472.0 FEEC, 10/2004
% Change1.6%1.7%1.9%2.0%2.1%2.0%2.4%2.3%2.5%2.3%1.6%1.0%1.3% FEEC, 02/20042.3%2.3%2.4%2.5%2.3%2.1%2.1%2.7%4.1%3.2%2.2%1.5%1.2% FEEC, 10/2004
9. PROFESSIONAL & BUSINESS SERVICES1,977.41,894.11,820.31,751.01,679.21,620.51,575.41,520.21,441.81,367.01,280.71,236.21,211.8 FEEC, 02/20042,019.11,933.11,852.41,773.61,700.81,635.31,566.51,491.41,421.51,346.11,286.41,228.01,210.3 FEEC, 10/2004
% Change4.4%4.1%4.0%4.3%3.6%2.9%3.6%5.4%5.5%6.7%3.6%2.0%0.6% FEEC, 02/20044.4%4.4%4.4%4.3%4.0%4.4%5.0%4.9%5.6%4.6%4.8%1.5%0.5% FEEC, 10/2004
10. EDUCATION & HEALTH SERVICES1,152.01,126.01,098.21,071.11,045.41,018.6989.6960.3932.9906.8884.3870.4845.5 FEEC, 02/20041,231.11,184.51,140.61,101.31,065.11,031.5999.7973.6948.6921.2896.6871.0844.5 FEEC, 10/2004
% Change2.3%2.5%2.5%2.5%2.6%2.9%3.1%2.9%2.9%2.5%1.6%2.9%3.1% FEEC, 02/20043.9%3.9%3.6%3.4%3.2%3.2%2.7%2.6%3.0%2.7%2.9%3.1%3.0% FEEC, 10/2004
11. LEISURE & HOSPITALITY1,042.11,024.11,005.2986.2965.7944.4924.3906.6885.2857.2834.3811.6791.9 FEEC, 02/20041,006.0988.0969.4951.1932.6913.8895.8878.6861.3839.4818.3804.0791.3 FEEC, 10/2004
% Change1.8%1.9%1.9%2.1%2.3%2.2%1.9%2.4%3.3%2.7%2.8%2.5%-0.2% FEEC, 02/20041.8%1.9%1.9%2.0%2.1%2.0%2.0%2.0%2.6%2.6%1.8%1.6%-0.2% FEEC, 10/2004
12. OTHER SERVICES397.8391.1384.3377.0369.6361.1351.2341.5333.4325.0317.3314.2304.2 FEEC, 02/2004416.7405.8394.8384.4374.2364.3354.3344.8336.4329.3320.9314.3303.4 FEEC, 10/2004
% Change1.7%1.8%1.9%2.0%2.3%2.8%2.8%2.4%2.6%2.4%1.0%3.3%2.8% FEEC, 02/20042.7%2.8%2.7%2.7%2.7%2.8%2.8%2.5%2.1%2.6%2.1%3.6%2.5% FEEC, 10/2004
FLORIDA ECONOMIC ESTIMATING CONFERENCELong Run Tables
Conference Held October 22, 2004 PAGE 6

13-1412-1311-1210-1109-1008-0907-0806-0705-0604-0503-0402-0301-02
13. GOVERNMENT1,266.31,250.21,234.41,220.21,207.71,184.91,166.71,146.91,126.31,105.81,084.11,059.01,030.9 FEEC, 02/20041,236.51,219.31,202.01,185.71,170.81,150.51,134.01,116.91,099.01,080.81,062.51,048.31,031.0 FEEC, 10/2004
% Change1.3%1.3%1.2%1.0%1.9%1.6%1.7%1.8%1.8%2.0%2.4%2.7%1.9% FEEC, 02/20041.4%1.4%1.4%1.3%1.8%1.5%1.5%1.6%1.7%1.7%1.4%1.7%1.9% FEEC, 10/2004
14. LABOR FORCE10,094.79,904.09,702.89,504.29,298.09,091.28,894.98,691.08,478.18,272.68,107.98,092.98,071.4 FEEC, 02/2004
9,807.59,651.39,496.89,345.29,196.39,049.48,902.18,756.38,611.18,451.88,262.18,117.38,075.9 FEEC, 10/2004
% Change1.9%2.1%2.1%2.2%2.3%2.2%2.3%2.5%2.5%2.0%0.2%0.3%1.9% FEEC, 02/20041.6%1.6%1.6%1.6%1.6%1.7%1.7%1.7%1.9%2.3%1.8%0.5%2.0% FEEC, 10/2004
15. CIVILIAN EMPLOYED9,661.49,464.59,260.89,062.08,860.48,669.98,492.08,298.18,095.67,898.07,711.57,659.17,635.9 FEEC, 02/20049,360.39,218.99,075.58,932.58,790.78,649.18,505.08,359.18,208.78,059.57,861.67,684.97,639.6 FEEC, 10/2004
% Change2.1%2.2%2.2%2.3%2.2%2.1%2.3%2.5%2.5%2.4%0.7%0.3%0.4% FEEC, 02/20041.5%1.6%1.6%1.6%1.6%1.7%1.7%1.8%1.9%2.5%2.3%0.6%0.4% FEEC, 10/2004
16. NUMBER UNEMPLOYED433.3439.5442.0442.2437.6421.3403.0392.9382.5374.6396.4433.8435.5 FEEC, 02/2004447.2432.4421.3412.7405.6400.3397.2397.2402.4392.3400.4432.4436.4 FEEC, 10/2004
% Change-1.4%-0.6%-0.0%1.1%3.9%4.6%2.6%2.7%2.1%-5.5%-8.6%-0.4%39.0% FEEC, 02/20043.4%2.6%2.1%1.8%1.3%0.8%-0.0%-1.3%2.6%-2.0%-7.4%-0.9%39.3% FEEC, 10/2004
17. UNEMPLOYMENT RATE (%)4.294.444.564.654.714.634.534.524.514.534.895.365.40 FEEC, 02/20044.564.484.444.424.414.424.464.544.674.644.855.335.40 FEEC, 10/2004
FLORIDA ECONOMIC ESTIMATING CONFERENCELong Run Tables
Conference Held October 22, 2004 PAGE 7

13-1412-1311-1210-1109-1008-0907-0806-0705-0604-0503-0402-0301-02
CONSTRUCTION (billions of $)
1. PRIVATE HOUSING STARTS (000s, saar)176.6173.3172.6172.3173.3184.3190.3182.0184.0200.8213.0191.9176.1 FEEC, 02/2004187.9184.0182.2179.6178.9184.5189.9193.8208.1234.0230.8192.8176.2 FEEC, 10/2004
% Change1.9%0.4%0.2%-0.5%-6.0%-3.2%4.6%-1.1%-8.4%-5.7%11.0%9.0%8.2% FEEC, 02/20042.2%1.0%1.4%0.4%-3.1%-2.8%-2.0%-6.9%-11.1%1.4%19.7%9.4%8.2% FEEC, 10/2004
2. SINGLE FAMILY STARTS (000s, saar)109.8111.8114.2115.5117.2124.4129.3127.1127.5138.1154.1132.6114.7 FEEC, 02/2004114.9115.8118.3119.0119.8124.1129.1134.9146.2163.6163.1132.6114.8 FEEC, 10/2004
% Change-1.8%-2.1%-1.2%-1.4%-5.8%-3.8%1.7%-0.3%-7.6%-10.4%16.2%15.6%14.6% FEEC, 02/2004-0.8%-2.1%-0.6%-0.6%-3.5%-3.9%-4.3%-7.7%-10.7%0.3%22.9%15.5%14.6% FEEC, 10/2004
3. MULTI FAMILY STARTS (000s, saar)66.861.558.456.856.159.961.054.956.562.758.959.361.4 FEEC, 02/200473.168.163.860.559.160.460.858.962.070.467.760.261.4 FEEC, 10/2004
% Change8.6%5.3%2.9%1.3%-6.4%-1.8%11.1%-2.8%-9.9%6.5%-0.7%-3.4%-2.0% FEEC, 02/20047.3%6.7%5.5%2.4%-2.2%-0.6%3.1%-4.9%-12.0%3.9%12.6%-1.9%-2.1% FEEC, 10/2004
4. TOTAL CONSTRUCTION EXPENDITURES76.75671.65467.74163.84060.79259.95358.02053.52450.77950.79352.06345.69442.890 FEEC, 02/200475.32570.57966.58362.50059.42157.98656.79155.81156.88259.47954.51045.76942.879 FEEC, 10/2004
% Change7.1%5.8%6.1%5.0%1.4%3.3%8.4%5.4%-0.0%-2.4%13.9%6.5%14.4% FEEC, 02/20046.7%6.0%6.5%5.2%2.5%2.1%1.8%-1.9%-4.4%9.1%19.1%6.7%14.4% FEEC, 10/2004
5. RESIDENTIAL EXPENDITURES38.70436.70535.23633.62232.53433.36033.01730.44129.63331.53834.07127.53123.202 FEEC, 02/200439.84337.90036.41834.56733.37033.45733.48833.60935.89339.96936.42727.60523.194 FEEC, 10/2004
% Change5.4%4.2%4.8%3.3%-2.5%1.0%8.5%2.7%-6.0%-7.4%23.8%18.7%17.8% FEEC, 02/20045.1%4.1%5.4%3.6%-0.3%-0.1%-0.4%-6.4%-10.2%9.7%32.0%19.0%17.7% FEEC, 10/2004
6. PRIVATE NON-RESIDENTIAL EXPENDITURES24.70822.11220.12518.27416.76415.60614.55813.12211.5829.9978.8858.87110.358 FEEC, 02/200423.09420.76418.68616.84815.33614.17213.29412.54511.75010.7279.4158.87510.354 FEEC, 10/2004
% Change11.7%9.9%10.1%9.0%7.4%7.2%10.9%13.3%15.9%12.5%0.2%-14.4%4.3% FEEC, 02/200411.2%11.1%10.9%9.9%8.2%6.6%6.0%6.8%9.5%13.9%6.1%-14.3%4.3% FEEC, 10/2004
FLORIDA ECONOMIC ESTIMATING CONFERENCELong Run Tables
Conference Held October 22, 2004 PAGE 8

13-1412-1311-1210-1109-1008-0907-0806-0705-0604-0503-0402-0301-02
7. TOTAL PUBLIC EXPENDITURES13.34412.83712.38011.94411.49410.98810.4469.9619.5649.2589.1069.2919.330 FEEC, 02/200412.38811.91411.47911.08510.71410.35710.0099.6579.2388.7838.6699.2889.331 FEEC, 10/2004
% Change3.9%3.7%3.7%3.9%4.6%5.2%4.9%4.1%3.3%1.7%-2.0%-0.4%18.8% FEEC, 02/20044.0%3.8%3.6%3.5%3.5%3.5%3.6%4.5%5.2%1.3%-6.7%-0.5%18.7% FEEC, 10/2004
FLORIDA ECONOMIC ESTIMATING CONFERENCELong Run Tables
Conference Held October 22, 2004 PAGE 9

13-1412-1311-1210-1109-1008-0907-0806-0705-0604-0503-0402-0301-02
POPULATION & OTHER
1. POPULATION (millions)20.60120.28019.96019.63919.31718.99318.66818.33918.00917.67717.33916.97116.587 FEEC, 02/200420.88120.56120.23919.90919.56819.22118.86918.50718.14217.78417.40116.96916.588 FEEC, 10/2004
% Change1.58%1.60%1.63%1.67%1.70%1.74%1.79%1.83%1.88%1.95%2.17%2.31%2.09% FEEC, 02/20041.56%1.59%1.66%1.74%1.81%1.87%1.95%2.01%2.02%2.20%2.55%2.29%2.10% FEEC, 10/2004
2. CHANGE IN POPULATION (000s)320.4320.4320.4321.8323.2323.8328.1329.6331.4334.1349.4395.4349.4 FEEC, 02/2004319.8320.6325.6336.4346.4348.8359.8364.6361.5353.2438.1404.8347.2 FEEC, 10/2004
3. HOUSEHOLDS (millions)8.1998.0707.9407.8107.6807.5507.4197.2877.1547.0216.8866.7396.586 FEEC, 02/20048.2888.1618.0347.9037.7677.6307.4907.3467.2027.0606.9106.7396.586 FEEC, 10/2004
% Change1.61%1.63%1.66%1.69%1.72%1.76%1.82%1.85%1.90%1.96%2.17%2.33%2.14% FEEC, 02/20041.55%1.59%1.66%1.74%1.81%1.87%1.95%2.01%2.01%2.17%2.53%2.32%2.15% FEEC, 10/2004
4. CHANGE IN HOUSEHOLDS (000s)129.7129.5129.6130.0130.2130.4132.0132.5133.0133.9139.3157.7140.0 FEEC, 02/2004126.8127.0129.2133.5137.4138.5142.8144.5143.1138.0174.4160.8139.3 FEEC, 10/2004
5. HOUSEHOLD SIZE (persons)2.5132.5132.5142.5152.5152.5162.5162.5172.5172.5182.5182.5182.519 FEEC, 02/20042.5192.5192.5192.5192.5192.5192.5192.5192.5192.5192.5182.5182.519 FEEC, 10/2004
% Change-0.03%-0.03%-0.03%-0.02%-0.02%-0.02%-0.02%-0.02%-0.02%-0.02%0.00%-0.02%-0.05% FEEC, 02/20040.00%0.00%0.00%0.00%0.00%-0.00%0.00%0.00%0.01%0.02%0.01%-0.02%-0.05% FEEC, 10/2004
6. TOTAL NEW LIGHT VEHICLE REGISTRATIONS (000s)
1,610.91,592.91,577.61,559.71,539.01,515.71,495.71,467.31,431.91,424.41,398.21,350.51,327.3 FEEC, 02/2004ERRERRERRERRERRERRERRERRERRERRERRERRERR FEEC, 10/2004
% Change1.1%1.0%1.1%1.3%1.5%1.3%1.9%2.5%0.5%1.9%3.5%1.7%-5.0% FEEC, 02/2004ERRERRERRERRERRERRERRERRERRERRERRERRERR FEEC, 10/2004
FLORIDA ECONOMIC ESTIMATING CONFERENCELong Run Tables
Conference Held October 22, 2004 PAGE 10

13-1412-1311-1210-1109-1008-0907-0806-0705-0604-0503-0402-0301-02
7. NEW AUTOMOBILE REGISTRATIONS (000s)
820.5809.0798.9792.1784.7779.8775.0771.3762.6756.7740.7747.3738.8 FEEC, 02/2004827.2801.2776.5758.7745.2729.7723.1726.4729.2720.7730.5743.5739.0 FEEC, 10/2004
% Change1.4%1.3%0.9%0.9%0.6%0.6%0.5%1.1%0.8%2.2%-0.9%1.2%-9.5% FEEC, 02/20043.3%3.2%2.3%1.8%2.1%0.9%-0.5%-0.4%1.2%-1.3%-1.8%0.6%-9.6% FEEC, 10/2004
8. NEW LIGHT TRUCK REGISTRATIONS (000s)
790.4784.0778.7767.5754.3735.9720.7696.0669.3667.6657.6603.2588.5 FEEC, 02/2004780.5776.2778.8768.3756.7741.3727.8702.2663.9662.1654.3594.3588.5 FEEC, 10/2004
% Change0.8%0.7%1.5%1.8%2.5%2.1%3.5%4.0%0.3%1.5%9.0%2.5%1.3% FEEC, 02/20040.6%-0.3%1.4%1.5%2.1%1.8%3.7%5.8%0.3%1.2%10.1%1.0%1.2% FEEC, 10/2004
FLORIDA ECONOMIC ESTIMATING CONFERENCELong Run Tables
Conference Held October 22, 2004 PAGE 11