floriculture and nursery crops yearbook
TRANSCRIPT
United StatesDepartmentof Agriculture
www.ers.usda.gov
Electronic Outlook Report from the Economic Research Service
Despite higher energy and fuel costs in 2005, sales of floriculture crops managed a 1.5-percent increase as the U.S. economy expanded at a healthy pace. All floriculture crop groups boosted sales, except cut flowers as competition from imports continues to rise. Even as the number of growers declined for the fourth year in a row, average floriculture sales per grower and per acre of total production area rose for the third consecutive year. Keywords: Nursery, floriculture, nursery, greenhouse, horticulture, cut flowers, flowering plants, foliage plants, bedding and garden plants, annuals, perennials, ornamental crops, trees, shrubs.
Floriculture and Nursery Crops Yearbook Andy Jerardo Abstract
FLO-2006 June 2006
ii Floriculture and Nursery Crops Yearbook/FLO-2006/June 2006
Economic Research Service, USDA
Floriculture and Nursery Crops Yearbook. Market and Trade Economics Division, Economic Research Service, U.S. Department of Agriculture, June 2006, FLO-2006.
Contents Summary …………………………………………………………………. iii Compilation of Sales and Trade Data…………………………………… 1 Definitions.………………………………………………………………… 3 List of Tables……………………………………………………………… 5
Report Coordinator Andy Jerardo
(202) 694-5266 E-mail: [email protected]
Principal Contributor Andy Jerardo
Editor Martha Evans
(202) 694-5118
Table Design & Layout Mae Dean Johnson
(202) 694-5245
Approved by the World Agricultural Outlook Board. Summary released June 23, 2006. Floriculture and Nursery Crops Yearbook may be accessed electronically via the ERS website at www.ers.usda.gov.
Summary
iii Floriculture and Nursery Crops Yearbook/FLO-2006/June 2006
Economic Research Service, USDA
Positive Growth for Floriculture Sales in 2005 Floriculture crop sales increased by a modest 1.5 percent to $5.4 billion in 2005. All floriculture crop groups expanded in sales, except cut flowers. Grower sales of cut flowers declined for the third year in a row, as cut flower imports grew for the third consecutive year. And as imports of other floriculture crops continued their upward trend, domestic consumption reached $6.2 billion in 2005. This translates to an average $56 of floriculture crops sold at wholesale to each U.S. household. The share of imports in floriculture consumption remains at 14.1 percent, which is lower than the 16.2 percent a decade ago. The fastest growing crop group was potted foliage plants for indoor or patio use, increasing over 5 percent in 2005 and has averaged 5 percent since 2003. Herbaceous perennial plants and propagative material also grew more than 5 percent on average in the past 3 years. Quantity sold of domestic-grown floriculture crops was higher for bedding and garden plants in 2005, but lower for potted flowering plants and cut flowers. Unit prices increased 2 percent for potted flowering plants, 1.3 percent for herbaceous perennials, and less than 1 percent for annual bedding plants. Prices of cut flowers fell 2 percent, and are only marginally higher than prices in 2000. The total number of U.S. floriculture crop growers (in the 36 surveyed States) declined for the third consecutive year. The number of large growers with annual floriculture sales of $100,000 or more were 4,412 in 2005, the fewest since the survey of 36 major States began in 1992. Sales per large grower exceeded $1.15 million on average in 2005, almost twice the revenue in 1992. California still leads the industry in floriculture sales with $1 billion, followed closely by Florida with $976 million in 2005. However, the number of growers in Florida was 907, more than California’s 820 in 2005. Average sales of large U.S. growers of floriculture crops expanded in 2005, including growers of cut flowers. The crop group with the highest average sales was bedding and garden plants at $859,614 per grower, followed closely by cut flower growers at $796,572. The average size of large operations in the Western and Southern States--$1.6 and $1.4 million in 2005 sales, respectively—are twice those in the Midwest and Northeast. All large floriculture operations in the 36 surveyed States hired more than 127,000 workers in 2005, down 2.5 percent from 130,320 in 2004. Average sales per hired worker approached $45,000 for large growers in 2005, up more than $10,000 since 1999. Floriculture Production Area Edge Down 1 Percent As the production area of small floriculture growers continues to shrink, the production area of large growers continues to expand. The greenhouse-covered area of large floriculture operations increased to 11,119 acres in 2005 from 10,990 acres in 2004. Since their open-field production area also rose, the total growing area of larger growers in the 36 surveyed States reached a record 53,344 acres in 2005. Of total area, 21 percent was under greenhouse cover and 14 percent was under shade or temporary cover. Average sales per acre of large growers were $95,300 in 2005, and $31,000 for small growers. The average production area of
iv Floriculture and Nursery Crops Yearbook/FLO-2006/June 2006
Economic Research Service, USDA
large growers was more than 12 acres in 2005, another record. Of this area, 4.3 acres were covered and 7.8 acres were open-field on average. Large growers in Florida had the largest floriculture area of the 36 States with 15,900 acres in 2005, of which 1,487 acres were under permanent greenhouses. California had 10,500 acres in production, of which 2,138 acres were under greenhouses. Average sales per acre were highest in Maryland, however, at more than $325,700 in 2005. The next highest were large growers in Colorado with $307,000 per acre on average. Despite average sales that are half those in the West and South, large floriculture operations in the Northeast States had the highest average sales per acre of the four U.S. regions at $108,000, followed by Midwest States at $105,776 per acre. Higher sales per acre in the Northeast and the Midwest are attributed to the larger share of production area under greenhouses—27 and 30 percent, respectively—compared to 17 and 20 percent in the South and West. Cut Flowers Fresh cut flower sales dropped 4 percent to $396.7 million in 2005, the lowest level since 1986. Except for gerbera daisies, lilies, tulips, and carnations, all other major cut flowers experienced lower sales. Nevertheless, sales of leatherleaf ferns were up in 2005. Among the major cut flowers still grown in the U.S., roses remain the highest earners with an average $660,271 of sales per large grower. The second highest earners are lilies at $541,387 sales per grower. Gerbera daisies come in third with $529,738 sales per grower on average in 2005. While most major cut flowers grown in the U.S. have suffered declining sales since 1992 (start of survey of 36 States), average annual sales of cut flower growers have been rising steadily. From $492,000 per grower in 1992, average cut flower sales reached close to $797,000 in 2005. As cheaper imports have discouraged domestic cut flower production over the past 2 decades, the number of U.S. growers has fallen. Nevertheless, these fewer growers focused their production on high-value cut flowers, and produced less where import competition is strongest. As a result, despite declining total annual sales, cut flower sales per grower have continued their upward trend. California leads the country with 73 percent of total cut flower sales in 2005. The State of Washington comes in a far second with 5 percent and then Hawaii and Florida with 4 percent each. Almost two-thirds of the more than $1 billion in domestic sales of cut flowers were from imports in 2005, the highest share on record. The U.S. imported more than $709 million of cut flowers in 2005, another record amount. About $9.75 on average were spent by each U.S. household for cut flowers in 2005, down from $9.92 in 2004 and $10.20 in 1997. Of imported cut flowers, roses were by far the largest in value at $274.7 million in 2005, or nearly 40 percent of total cut flower imports. The most expensive imports are cut anthuriums and cut orchids at an average 84 cents per stem in 2005. Almost 88 percent of U.S. consumption of fresh cut roses were imported in 2005, the highest level ever. Similarly, import shares were high for carnations at 95 percent, chrysanthemums at 76 percent, alstroemeria at 95 percent, and orchids at 53 percent of consumption. Consequently, U.S. growers reduced their production of most cut
v Floriculture and Nursery Crops Yearbook/FLO-2006/June 2006
Economic Research Service, USDA
flower varieties except orchids, gerbera daisies, irises, lilies, and tulips. These high-value flowers have been U.S. growers’ answer to fierce competition from imports. Potted Flowering and Foliage Plants Sales of flowering plants in pots climbed 1 percent in 2005 to almost $809 million. Potted foliage plants expanded 7 percent in sales to $652.1 million, but foliage hanging baskets dropped 10 percent in sales to $68.9 million. Potted flowering plant sales’ gains in 2005 are attributed largely to orchids, which closed in on $144 million in sales, up from $129 million in 2004. Orchids are the fastest-growing potted flowering plant, more than tripling sales of $47 million a decade ago. While poinsettias remain the biggest seller at $242.3 million in 2005, sales are down 2 percent from 2004 and fell farther below their peak of $255.3 million in 2001. Imports of poinsettias, largely shipped from Canada, were more than $6 million in 2005, but are down from $10.4 million in 2002. Potted orchids are the most expensive major potted flowering plant at $8 per pot on average (wholesale value) in 2005. Poinsettia prices are about half at $4.10 per pot (all sizes). Similarly priced potted flowering plants are Easter lilies at $4.24 and florist azaleas at $4.14 per pot in 2005. Prices of all major potted flowering plants averaged a record $3.66 per pot in 2005, up 2 percent from $3.60 in 2004. Again, California leads in sales of potted flowering plants with $199.3 million in 2005. Florida’s sales of $94.6 million amount to less than half of California’s. California grows the most poinsettias and orchids, but Florida is a fast-growing source of potted orchids. Average sales per grower are highest for orchids at $663,447 in 2005. For all potted flowering plants, average sales were $384,660 per large grower, up 6.5 percent from $360,927 in 2004. Average sales of poinsettias were $160,467 per grower, up 3 percent from 2004, and the next highest after orchids. Similar sales per grower were recorded for florist chrysanthemums, which were up 7 percent from 2004. Nevertheless, average sales per grower for potted foliage plants were $706,507 in 2005, up sharply by 13 percent. All these sales are record amounts, attesting to the strong domestic market for potted flowering and foliage plants. Although competition from imports is rising for orchids and other flowering plants, the share of imports in consumption remains at a low 3 percent compared to cut flowers’ 66 percent. Potted foliage plants for indoor or patio use have the third largest sales among floriculture crops at $721 million, coming after bedding annuals and potted flowering plants. Nearly 70 percent of sales of U.S. foliage plants are earned by Florida growers, with California earning a distant 15 percent. Most foliage plants are marketed in metropolitan areas and face minimal competition from imports except fake plastic plants. Bedding and Garden Plants and Propagative Material Although sales of bedding/garden annual and perennial plants are up again in 2005, growth is much slower than in 2004, particularly herbaceous perennials. Sales per grower of annuals were $626,619 on average in 2005, up 7 percent from 2004. For perennials, sales per grower of $265,581 were up by a moderate 3 percent. The

vi Floriculture and Nursery Crops Yearbook/FLO-2006/June 2006
Economic Research Service, USDA
average price of annuals was $2.66 in 2005, and $2.46 for perennials (in all container types). Average sales of annuals were $17.15 per U.S. household in 2005, while sales of herbaceous perennials were $6.38, for a total of $23.53 per U.S. household (at wholesale value). While California boasts the largest sales of bedding and garden annuals and perennials, Michigan, Florida, and Texas also sell sizable amounts. Southern States have close to $1 billion in total sales of bedding and garden plants in 2005, a significant gain of 9 percent from 2004. In fact, bedding/garden sales in the other 3 regions—the Midwest, the West, and the Northeast—were all down in 2005 as sales of annuals fell. Sales of propagative material or unfinished plants are now larger than sales of cut flowers. Three-quarters of total propagative sales are from bedding and garden annual and perennial material. Average sales of propagative material for annuals were $885,669 per grower in 2005, up 8 percent from 2004. More impressive is the 24-percent growth of propagatives for perennials to $881,313 on average per grower. Florida leads Michigan and California in production of propagative material. These 3 States produce 56 percent of total U.S. propagative material in 2005. Market competition comes from imports of unrooted cuttings and slips of plants, which amounted to $60.1 million in 2005, or 12 percent of total U.S. propagative sales.
Compilation of Sales and Trade Data
1 Floriculture and Nursery Crops Yearbook/FLO-2006/June 2006
Economic Research Service, USDA
The statistics in Floriculture Crops are collected from annual surveys of all known growers of floriculture crops in 36 major States. The survey by the National Agricultural Statistics Service (NASS) covers grower sales at wholesale by crop or product type and by State. Statistics for each crop include the number of producers, quantity of units sold, the percent of sales at wholesale, the wholesale price, and the value of sales. Only growers with at least $100,000 in gross value of floriculture sales are asked to provide detailed crop sales statistics. Selected crop data for Hawaii are also reported. Additional crop sales statistics are collected for various plant container sizes or types (e.g., flats, pots less than 5 inches tall, pots 5 inches or taller, 1-gallon pots or larger, and hanging baskets). Annuals are also distinguished from perennials and finished plants from propagative material. Growers are asked to provide data about the area used for crop production�i.e., the size of growing area, the type of protective cover, and the area under cover. The number of hired workers on the payroll on any one day of the year is also reported. Excluded workers are those employed only for the retail operation, landscapers, and nonpaid family members. Data for States with a small number of operations are not reported to avoid disclosing individual business information, but their statistics are aggregated under “Undisclosed.” Data from Nursery Crops, based on the Nursery Production Survey of 17 States by NASS in 2000 and 2003, are available in the 2005 Yearbook. Surveys of nursery crops are conducted every 2 years by NASS. Sales estimates for nursery crops in all 50 States are included under “nursery and other greenhouse crops”, which cover all non-floriculture crops such as greenhouse vegetables, vegetable transplants, and ornamental grasses. ERS and NASS collaborate in estimating annual cash receipts of greenhouse and nursery crops in all 50 States with assistance from NASS State offices. Sales estimates for “nursery and other greenhouse crops” are computed as the difference between greenhouse/nursery cash receipts from all 50 States and floriculture sales from 36 States. Thus, the difference includes floriculture sales by growers located in the 14 smaller States that are excluded from the annual Floriculture Crops survey by NASS. (These 14 States have no floriculture sales in Table A-5 of the Yearbook.) Most of these States are sparsely populated or not conducive to floriculture production, and local growers generally have small operations whose collective sales are comparatively less than operations in the 36 larger States. U.S. trade—The source of aggregate import and export data for floriculture and nursery crops is the Foreign Agricultural Trade of the United States (FATUS), and more detailed trade data can be accessed on the internet at fas.usda.gov/ustrade. The U.S. Census Bureau compiles the trade data from U.S. Customs Service records. Imports are reported as customs value, defined as the price actually paid or payable for merchandise at the first port of arrival in the United States. Customs value excludes U.S. import duties, freight, insurance, and other charges incurred in exporting the merchandise to the United States. U.S. export values are “free alongside ship” (f.a.s.), representing the transaction price, including inland freight, insurance, and other charges incurred in placing the
2 Floriculture and Nursery Crops Yearbook/FLO-2006/June 2006
Economic Research Service, USDA
merchandise alongside the carrier at the U.S. port of exportation. F.a.s. values exclude the cost of loading the merchandise aboard the exporting carrier and also exclude freight, insurance, and any charges or transportation costs beyond the U.S. port of shipment. The floriculture and nursery trade data are divided into four groups, each classified by a 4-digit U.S. Harmonized System (HS) code--0601 (bulbs, tubers), 0602 (live plants, cuttings), 0603 (cut flowers, buds), and 0604 (foliage, branches, Christmas trees). Each group is further classified into 10-digit-coded products. FATUS imports are aggregated as “cut flowers” and “nursery stock,” while exports are aggregated as “nursery and greenhouse products.” All import and export values and quantities by HS codes and by countries are available starting in 1989, in monthly and annual frequency. The number of U.S. households by State and total U.S. resident population are obtained from the U.S. Census Bureau (census.gov). Population estimates in 1999 and 2001 through 2005 are projections based on the Census 2000 survey. Supplemental Information The 2002 Census of Agriculture provides the sales value and number of farms that produce nursery and greenhouse crops, floriculture crops, and cut Christmas trees in each of the 50 States. The 2002 Census also provides covered and open-field production areas by floriculture crop group and for greenhouse and nursery crops. The next survey of horticultural specialties will be in 2007. The sequence of tables in this Yearbook is unchanged from last year’s. All data are annual and represent calendar year estimates. The floriculture crop survey by NASS includes small growers with $10,000 to $100,000 in annual floriculture sales. However, only total crop sales, hired labor, and growing area statistics are collected from small growers since they collectively represent only 5 to 6 percent of total sales of larger producers with more than $100,000 in annual floriculture sales. Some sales statistics of large growers are not revealed in Floriculture Crops to avoid disclosure of individual operations. These statistics, however, are aggregated and recorded in “Undisclosed,” which is included in the total for the United States. As such, the sum of data in the four U.S. regions may not equal the U.S. total. The Yearbook is published online annually in June. Floriculture and Nursery Crops Outlook is also published online by ERS in September each year. The Outlook provides one-year-ahead forecasts of key floriculture sales and price statistics for the United States and the four U.S. regions—Northeast, Midwest, South, and West. An analysis of recent trends and the outlook for the industry is the focus of the report. This Yearbook and the Floriculture and Nursery Crops Outlook can be accessed, downloaded, and printed from the ERS website (www.ers.usda.gov/publications/flo). The ERS Floriculture Briefing Room provides a description of the U.S. ornamental crop industry as well as links to related informational publications, resources, and websites.
Definitions: Floriculture Crops
3 Floriculture and Nursery Crops Yearbook/FLO-2006/June 2006
Economic Research Service, USDA
Bedding and garden plants: Annual or biennial finished flowering plants intended for seasonal outdoor use. Among the major annuals are begonias, geraniums, impatiens, marigolds, pansy/viola, and petunias. Also include vegetable-type ornamental plants, vegetable transplants for garden use, and herbaceous perennials, but exclude commercial vegetable plants. The plants are marketed as flats, pots, or hanging baskets. Cut foliage or greens: Cultivated ornamental stems, branches, or leaves grown as filler and foliage for cut flower arrangements and bouquets. Leatherleaf ferns, largely grown in Florida, are a major cut green. Cut flowers: Blossoms from flowering plants sold as stems, bunches, or arrangements; the flowers may be fresh, dried, or preserved. The major commercial varieties include standard carnations, roses, pompon chrysanthemums, gladioli, tulips, orchids, lilies, alstroemeria, delphinium and larkspur, gerbera daisies, iris, lisianthus, and snapdragons. Floriculture crops: Ornamental plants without woody stems, including annual and perennial bedding and garden plants, cut flowers, cut cultivated greens, potted flowering plants, indoor foliage plants, and unfinished propagative material. All other ornamental plants are classified as nursery crops. Foliage plants: Finished plants in pots or hanging baskets for indoor or patio use; they are classified as floriculture crops. Woody foliage plants intended for outdoor or landscape use are classified as nursery crops. Include ficus, ivy, cacti, ferns, palms, succulents, and indoor/patio shrubs, trees, and vines. Greenhouse crops: Crops grown under covered protection, including floral, foliage, and vegetable plants (largely tomatoes), unfinished plants, transplant seedlings, bulbs, turfgrass sod, aquatic and hydroponic plants, cultivated mushrooms, herbs, and seeds. Grower sales receipts from greenhouse crops include vegetable and fruit transplants for commercial production. Some nursery crops are grown in greenhouses before sale or transplant. Herbaceous perennials: Field and container-grown plants intended for outdoor use, including hardy/garden chrysanthemums, hosta, and other herbaceous perennials. Unlike annuals, perennials live and bloom for many years; they are dormant in the winter. Unfinished plants are excluded. Nursery crops: Finished ornamental plants and trees with woody stems, including broadleaf evergreens, coniferous evergreens, deciduous shade trees, deciduous flowering trees, deciduous shrubs and other ornamentals, fruit and nut plants intended for outdoor and landscape use, cut and live Christmas trees, and propagation material or lining-out stock. Also include ornamental vines, and turfgrass sod and other groundcovers. Crops are sold as “balled in burlap,” bare root, or are container-grown. Ornamental crops: Also known as environmental horticulture or green crops. All floriculture and nursery plants, shrubs, trees, and grasses for outdoor and indoor use are classified as ornamental. Their purpose is to beautify, decorate, or enhance the
4 Floriculture and Nursery Crops Yearbook/FLO-2006/June 2006
Economic Research Service, USDA
environment, but are not cultivated for food. They include nursery stock and propagative material such as bulbs, cuttings and slips of plants, seedlings, and seed plants grown in greenhouses, but exclude plants intended for commercial food production such as vegetables. Potted flowering plants: Plants intended for indoor or patio use only, including plants grown from bulbs. Plants intended for landscape use are excluded. Include African violets, florist azaleas, florist chrysanthemums, Easter lilies, orchids, poinsettias, roses, and spring bulbs (tulips, hyacinths, daffodils/narcissus, other lilies). Other potted plants include anthurium, begonia, carnation, hibiscus, hydrangea, cyclamen, kalanchoe, gardenia. Production area: The gross physical space used for commercial propagation of floriculture plants, including aisles and walkways, in open ground (field) or covered by greenhouses made of glass, fiberglass, film plastic, or shade and temporary cover. Excludes non-ornamental crop growing areas, such as fruit and vegetable farms, sod, or tree and shrub nurseries. Propagative material: Includes cuttings, liners, plug seedlings, prefinished plants, or tissue cultured plantlets, and unfinished plants sold to other growers for further growing. Excludes seeds, bulbs, tubers, rhizomes, or corms grown for sale to bulb forcers and gardeners. Also excludes transplants for commercial production such as vegetable, strawberry, and tobacco plants. Wholesale value of sales: The value of all crops grown then sold by their growers on a gross wholesale basis before deductions for sales commissions, transportation costs, and other similar charges. The percentage of sales at wholesale is the crop portion not sold at retail or marketed directly to the final consumer. It is computed as the product of the average wholesale price and the total quantity of crops sold by the producer at wholesale.
List of Tables
5 Floriculture and Nursery Crops Yearbook/FLO-2006/June 2006
Economic Research Service, USDA
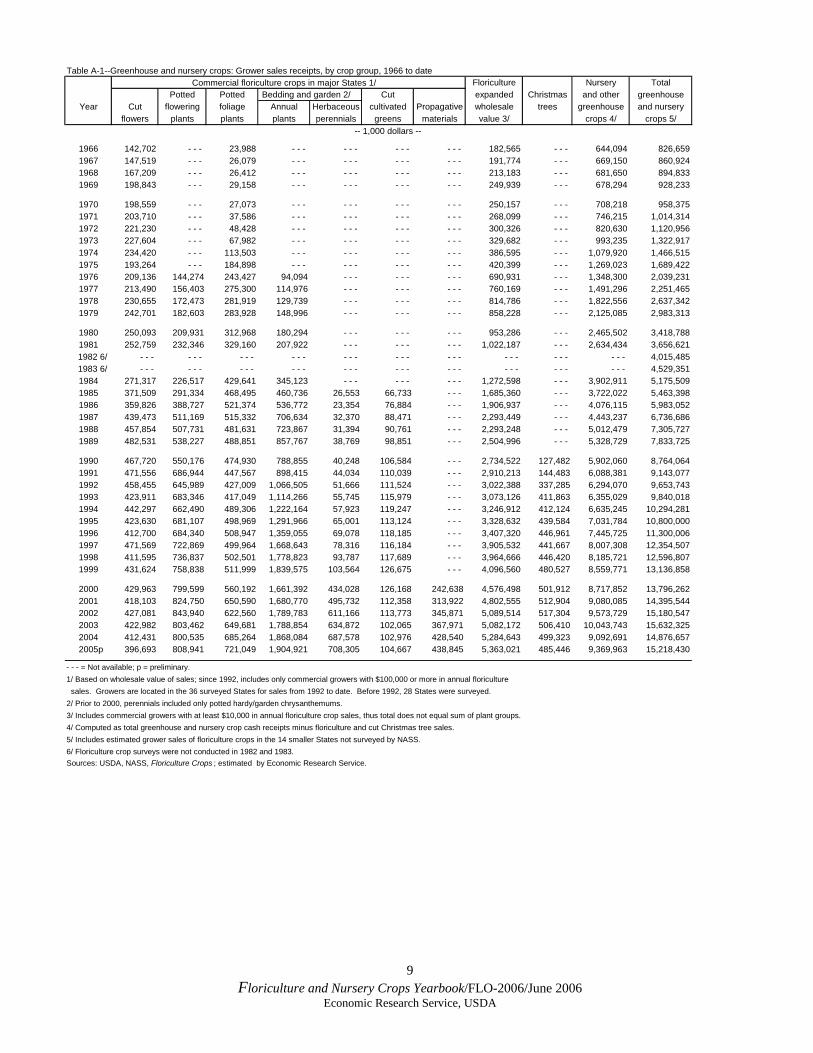
Greenhouse and Nursery Crops A-1. Greenhouse and nursery crops: Grower sales receipts, by crop
group, 1966 to date ………………..………………………….. ……. 9 A-2. Greenhouse and nursery crops: Supply and use, by crop group,
1976 to date ………………………………………………….............. 10 A-3. Greenhouse and nursery crops: Grower sales receipts, by State,
1996 to date …………………………………………….…………… 12 A-4. Greenhouse and nursery crops: State shares of total U.S. sales
receipts, 1996 to date…………………………………………………. 13 A-5. Greenhouse and nursery crops: Grower sales receipts, by crop
group, region, and State, 1996 to date………………………… ……. 14 A-6. Nursery and other greenhouse crops: Grower sales receipts, by State, 1996 to date…………………………………………………. 24 Floriculture Crops B-1. Floriculture crops: Value of sales at wholesale, large operations,
by crop group, 1985 to date…………………………………………. 25 B-2. Floriculture crops: Supply and use, large operations,
1990 to date …………………………………………………………. 25 B-3. Floriculture crops: Quantity sold and unit prices at wholesale,
by crop group, 1985 to date ………………………………………… 26 B-4. Floriculture crops: Growers, sales, and average sales per grower
at wholesale, by size of operation, 1987 to date……………………… 27 B-5. Floriculture crops: Expanded wholesale value of sales, all
operations, by State, 1996 to date ………………………………….. 28 B-6. Floriculture crops: Wholesale value of sales, large operations,
by State, 1996 to date………………………………………………… 29 B-7. Floriculture crops: Number of large growers, by crop group,
1992 to date ………………………………………………................ 30 B-8. Floriculture crops: Average sales per large grower, by crop group,
1992 to date …………………………………………………………. 30 B-9. Floriculture crops: Number of growers, by gross value of sales,
1992 to date ……………………………………………………….. 31 B-10. Floriculture crops: Number of operations with hired workers,
by gross value of sales, 1992 to date ……………………………….. 31 B-11. Floriculture crops: Average number of hired workers per operation,
by gross value of sales, 1992 to date ……………………………….. 32 B-12. Floriculture crops: Estimated number of hired workers, by gross
value of sales, 1992 to date ………………….…………………….. 32 B-13. Floriculture crops: Production area, by type of cover and size
of operation, 1987 to date ………………………………………… 33 B-14. Floriculture crops: Average production area, number of hired workers,
and sales per grower, 1987 to date …………………………………. 34 B-15. Floriculture crops: Total production area, large operations, by State,
1996 to date …………………………………………..…………….. 35 B-16. Floriculture crops: Greenhouse production area, large operations,
by State, 1996 to date ……………………………………………….. 36
6 Floriculture and Nursery Crops Yearbook/FLO-2006/June 2006
Economic Research Service, USDA
B-17. Floriculture crops: Average sales per acre of total production area, large operations, by State, 1996 to date………………………… 37 B-18. Floriculture crops: Production area by type of cover, by State, 1996 to date ………………………………………………. 38 B-19. Floriculture crops: Average sales per large operation,
by State, 1996 to date……………………………………………….. 48 B-20. Floriculture crops: Number of large growers, by State, 1996 to date.. 49 Cut Flowers C-1. Cut flowers and cut greens: Value of sales at wholesale, by flower type
1996 to date ………………………………………………………….. 50 C-2. Cut flowers and cut greens: Quantity sold at wholesale, by flower type
1996 to date …………………………………………………………. 50 C-3. Cut flowers and cut greens: Average unit values at wholesale, by
flower type, 1996 to date…………………………………………… 51 C-4. Cut flowers and cut greens: Number of growers, by flower type,
1996 to date …………………………………………………….… 51 C-5. Cut flowers and cut greens: Average sales per grower, by flower
type, 1996 to date ………………………………………………… 51 C-6. Cut flowers: Value of sales at wholesale, by State, 1996 to date … 52 C-7. Cut flowers: Quantity sold at wholesale, by State, 1996 to date…. 53 C-8. Cut flowers: Supply and use, large operations, 1996 to date………… 54 C-9. Cut flowers: Value of U.S. imports, by flower variety,
1996 to date ………………………………………………………….. 54 C-10. Cut flowers: Quantity of U.S. imports, by flower variety,
1996 to date …………………………………………………………. 55 C-11. Cut flowers: Unit value of U.S. imports, by flower variety,
1996 to date ………………………………………………………….. 55 C-12. Cut flowers: Supply and use, by flower variety, 1992 to date………… 56 C-13. Other cut flowers: Supply and use, by flower variety,
2000 to date ………………………………………………………….. 58 C-14. Tropical cut flowers: Production and sales, by flower variety,
Hawaii, 1994 to date ………………………………………………… 59 C-15. Cut orchids: Production and sales, by orchid species, Hawaii,
1994 to date …………………………………………………………. 61 C-16. Cut cultivated greens: Production and sales, 1992 to date ………….. 62 Flowering and Foliage Plants, Potted D-1. Potted flowering and foliage plants: Value of sales at wholesale,
by plant type, 1985 to date…………………………………………… 63 D-2. Potted flowering and foliage plants: Quantity sold at wholesale,
by plant type, 1985 to date……………………………………………. 63 D-3. Potted flowering and foliage plants: Unit values prices at wholesale,
by plant type, 1985 to date……………………………………………. 64 D-4. Potted flowering plants: Value of sales at wholesale, by State,
1996 to date…………………………………………………………… 65 D-5. Potted flowering plants: Quantity sold at wholesale, by State,
1996 to date…………………………………………………………… 66
7 Floriculture and Nursery Crops Yearbook/FLO-2006/June 2006
Economic Research Service, USDA
D-6. Potted flowering and foliage plants: Number of producers, by plant type, 1992 to date ………………………………………….. 67
D-7. Potted flowering and foliage plants: Average sales per producer, by plant type, 1992 to date ………………………………. 67
D-8. Potted flowering plants: Production and sales, by plant type, 1992 to date ………………………………………………………… 68
D-9. Potted orchids: Production and sales, by orchid species, Hawaii, 1992 to date ………………………………………………... 70
D-10. Poinsettias in pots: Value of sales at wholesale, by State 1996 to date ………………………………………………………. 71
D-11. Poinsettias in pots: Quantity sold at wholesale, by State, 1996 to date……………………………………………..………… 72
D-12. Orchids in pots: Value of sales at wholesale, by State, 1996 to date ………………………………………………………. 73
D-13. Foliage plants for indoor or patio use: Production and sales at wholesale, 1992 to date ………………………………………... 74
D-14. Foliage plants for indoor or patio use: Value of sales at wholesale, by State, 1996 to date………………………………………………. 75 Bedding and Garden Plants E-1. Bedding and garden plants: Production, prices, and sales at wholesale, annuals and perennials, 1992 to date ………………………………… 76 E-2. Bedding and garden plants: Average sales and quantity sold per
grower, annuals and perennials, 1992 to date ………………………. 76 E-3. Bedding and garden annuals: Production, prices, and sales at wholesale,
by container type, 1992 to date ……………………………………... 77 E-4. Bedding and garden annuals: Average sales per grower and
per U.S. household, by container type, 1992 to date ……………….. 77 E-5. Bedding and garden annuals: Grower sales at wholesale, by plant
species and container, 1992 to date ………………………………… 78 E-6. Bedding and garden annuals: Quantity sold at wholesale, by plant
species and container, 1992 to date ………………………………… 79 E-7. Bedding and garden annuals: Average unit prices at wholesale,
by plant species and container, 1992 to date………………………… 80 E-8. Bedding and garden plants: Sales value at wholesale, annuals and
perennials, by State, 1996 to date ………………………………...... 81 E-9. Bedding and garden plants: Quantity sold at wholesale, annuals
and perennials, by State, 1996 to date ……………………………… 82 E-10. Herbaceous perennials in pots: Production and sales, by
plant type, 1992 to date …………………………………………… 83 E-11. Flowering bedding annuals in flats: Production and sales,
by plant type, 1992 to date ………………………………………… 84 E-12. Flowering bedding annuals in pots: Production and sales,
by plant type, 1992 to date ………………………………………… 88 E-13. Flowering plants in hanging baskets: Production and sales,
by plant type, 1994 to date ………………………………………….. 92 E-14. Bedding and garden annuals: Number of large producers,
by plant species and container, 1992 to date ………………………… 95 E-15. Bedding and garden annuals: Average sales per producer,
by plant species and container, 1992 to date ………………………… 96
8 Floriculture and Nursery Crops Yearbook/FLO-2006/June 2006
Economic Research Service, USDA
E-16. Bedding and garden annuals: Value of sales at wholesale, by State,
1996 to date ………………………………………………………….. 97 E-17. Herbaceous perennials in pots: Value of sales at wholesale, by State,
1996 to date ………………………………………………………….. 98 E-18. Propagative material: Value of sales at wholesale, by floriculture sector,
1996 to date ……………………………………………………… .. 99 E-19. Propagative material: Number of growers, by floriculture
sector, 2000 to date ……………………………………………….. 99 E-20. Propagative material: Average sales per grower, by floriculture
sector, 2000 to date …………………………………………….... 100 E-21. Propagative material: Value of sales at wholesale, by State,
2000 to date ………………………………………………………… 101 U.S. Trade F-1. Floriculture and nursery products: Value of U.S. imports and
exports, 1976 to date ………………………………………………. 102 F-2. Cut flowers: Value of U.S. imports, by region and country,
1996 to date ……………………………………………………… 103 F-3. Nursery stock: Value of U.S. imports, by region and country,
1996 to date ……………………………………………………… 104 F-4. Cut flowers and nursery stock: Value of U.S. imports,
by region and country, 1996 to date ……………………………… 105 F-5. Floriculture and nursery products: Value of U.S. exports,
by region and country, 1996 to date ……………………………… 106 F-6. Floriculture and nursery products: Value of U.S. imports,
by product, 1998 to date ………………………………………….. 107 F-7. Floriculture and nursery products: Quantity of U.S. imports,
by product, 1998 to date ………………………………………….. 108 F-8. Floriculture and nursery products: Unit values of U.S. imports,
by product, 1998 to date ………………………………….………. 109 F-9. Cut flowers: Quantity and value of U.S. imports, by
product and country, 2001 to date ……………………………….. 110 F-10. Live plants and trees: Quantity and value of U.S. imports,
by product and country, 2001 to date ……………………………. 111 F-11. Bulbs and tubers: Quantity and value of U.S. imports,
by product and country, 2001 to date ……………………………. 112 F-12. Foliage and branches: Quantity and value of U.S. imports,
by product and country, 2001 to date ……………………………. 112 F-13. Floriculture and nursery products: Value of U.S. exports,
by product, 1998 to date ….……………………………………. 113 F-14. Floriculture and nursery products: Quantity of U.S. exports,
by product, 1998 to date …………………………………………. 114 F-15. Number of U.S. households, by region and State,
1996 to date ……..……………………………………………....... 115
9 Floriculture and Nursery Crops Yearbook/FLO-2006/June 2006
Economic Research Service, USDA
Table A-1--Greenhouse and nursery crops: Grower sales receipts, by crop group, 1966 to dateCommercial floriculture crops in major States 1/ Floriculture Nursery Total
Potted Potted Bedding and garden 2/ Cut expanded Christmas and other greenhouseYear Cut flowering foliage Annual Herbaceous cultivated Propagative wholesale trees greenhouse and nursery
flowers plants plants plants perennials greens materials value 3/ crops 4/ crops 5/-- 1,000 dollars --
1966 142,702 - - - 23,988 - - - - - - - - - - - - 182,565 - - - 644,094 826,6591967 147,519 - - - 26,079 - - - - - - - - - - - - 191,774 - - - 669,150 860,9241968 167,209 - - - 26,412 - - - - - - - - - - - - 213,183 - - - 681,650 894,8331969 198,843 - - - 29,158 - - - - - - - - - - - - 249,939 - - - 678,294 928,233
1970 198,559 - - - 27,073 - - - - - - - - - - - - 250,157 - - - 708,218 958,3751971 203,710 - - - 37,586 - - - - - - - - - - - - 268,099 - - - 746,215 1,014,3141972 221,230 - - - 48,428 - - - - - - - - - - - - 300,326 - - - 820,630 1,120,9561973 227,604 - - - 67,982 - - - - - - - - - - - - 329,682 - - - 993,235 1,322,9171974 234,420 - - - 113,503 - - - - - - - - - - - - 386,595 - - - 1,079,920 1,466,5151975 193,264 - - - 184,898 - - - - - - - - - - - - 420,399 - - - 1,269,023 1,689,4221976 209,136 144,274 243,427 94,094 - - - - - - - - - 690,931 - - - 1,348,300 2,039,2311977 213,490 156,403 275,300 114,976 - - - - - - - - - 760,169 - - - 1,491,296 2,251,4651978 230,655 172,473 281,919 129,739 - - - - - - - - - 814,786 - - - 1,822,556 2,637,3421979 242,701 182,603 283,928 148,996 - - - - - - - - - 858,228 - - - 2,125,085 2,983,313
1980 250,093 209,931 312,968 180,294 - - - - - - - - - 953,286 - - - 2,465,502 3,418,7881981 252,759 232,346 329,160 207,922 - - - - - - - - - 1,022,187 - - - 2,634,434 3,656,6211982 6/ - - - - - - - - - - - - - - - - - - - - - - - - - - - - - - 4,015,4851983 6/ - - - - - - - - - - - - - - - - - - - - - - - - - - - - - - 4,529,3511984 271,317 226,517 429,641 345,123 - - - - - - - - - 1,272,598 - - - 3,902,911 5,175,5091985 371,509 291,334 468,495 460,736 26,553 66,733 - - - 1,685,360 - - - 3,722,022 5,463,3981986 359,826 388,727 521,374 536,772 23,354 76,884 - - - 1,906,937 - - - 4,076,115 5,983,0521987 439,473 511,169 515,332 706,634 32,370 88,471 - - - 2,293,449 - - - 4,443,237 6,736,6861988 457,854 507,731 481,631 723,867 31,394 90,761 - - - 2,293,248 - - - 5,012,479 7,305,7271989 482,531 538,227 488,851 857,767 38,769 98,851 - - - 2,504,996 - - - 5,328,729 7,833,725
1990 467,720 550,176 474,930 788,855 40,248 106,584 - - - 2,734,522 127,482 5,902,060 8,764,0641991 471,556 686,944 447,567 898,415 44,034 110,039 - - - 2,910,213 144,483 6,088,381 9,143,0771992 458,455 645,989 427,009 1,066,505 51,666 111,524 - - - 3,022,388 337,285 6,294,070 9,653,7431993 423,911 683,346 417,049 1,114,266 55,745 115,979 - - - 3,073,126 411,863 6,355,029 9,840,0181994 442,297 662,490 489,306 1,222,164 57,923 119,247 - - - 3,246,912 412,124 6,635,245 10,294,2811995 423,630 681,107 498,969 1,291,966 65,001 113,124 - - - 3,328,632 439,584 7,031,784 10,800,0001996 412,700 684,340 508,947 1,359,055 69,078 118,185 - - - 3,407,320 446,961 7,445,725 11,300,0061997 471,569 722,869 499,964 1,668,643 78,316 116,184 - - - 3,905,532 441,667 8,007,308 12,354,5071998 411,595 736,837 502,501 1,778,823 93,787 117,689 - - - 3,964,666 446,420 8,185,721 12,596,8071999 431,624 758,838 511,999 1,839,575 103,564 126,675 - - - 4,096,560 480,527 8,559,771 13,136,858
2000 429,963 799,599 560,192 1,661,392 434,028 126,168 242,638 4,576,498 501,912 8,717,852 13,796,2622001 418,103 824,750 650,590 1,680,770 495,732 112,358 313,922 4,802,555 512,904 9,080,085 14,395,5442002 427,081 843,940 622,560 1,789,783 611,166 113,773 345,871 5,089,514 517,304 9,573,729 15,180,5472003 422,982 803,462 649,681 1,788,854 634,872 102,065 367,971 5,082,172 506,410 10,043,743 15,632,3252004 412,431 800,535 685,264 1,868,084 687,578 102,976 428,540 5,284,643 499,323 9,092,691 14,876,657
2005p 396,693 808,941 721,049 1,904,921 708,305 104,667 438,845 5,363,021 485,446 9,369,963 15,218,430
- - - = Not available; p = preliminary.1/ Based on wholesale value of sales; since 1992, includes only commercial growers with $100,000 or more in annual floriculture sales. Growers are located in the 36 surveyed States for sales from 1992 to date. Before 1992, 28 States were surveyed.2/ Prior to 2000, perennials included only potted hardy/garden chrysanthemums.3/ Includes commercial growers with at least $10,000 in annual floriculture crop sales, thus total does not equal sum of plant groups.4/ Computed as total greenhouse and nursery crop cash receipts minus floriculture and cut Christmas tree sales.5/ Includes estimated grower sales of floriculture crops in the 14 smaller States not surveyed by NASS.6/ Floriculture crop surveys were not conducted in 1982 and 1983.Sources: USDA, NASS, Floriculture Crops ; estimated by Economic Research Service.
10 Floriculture and Nursery Crops Yearbook/FLO-2006/June 2006
Economic Research Service, USDA
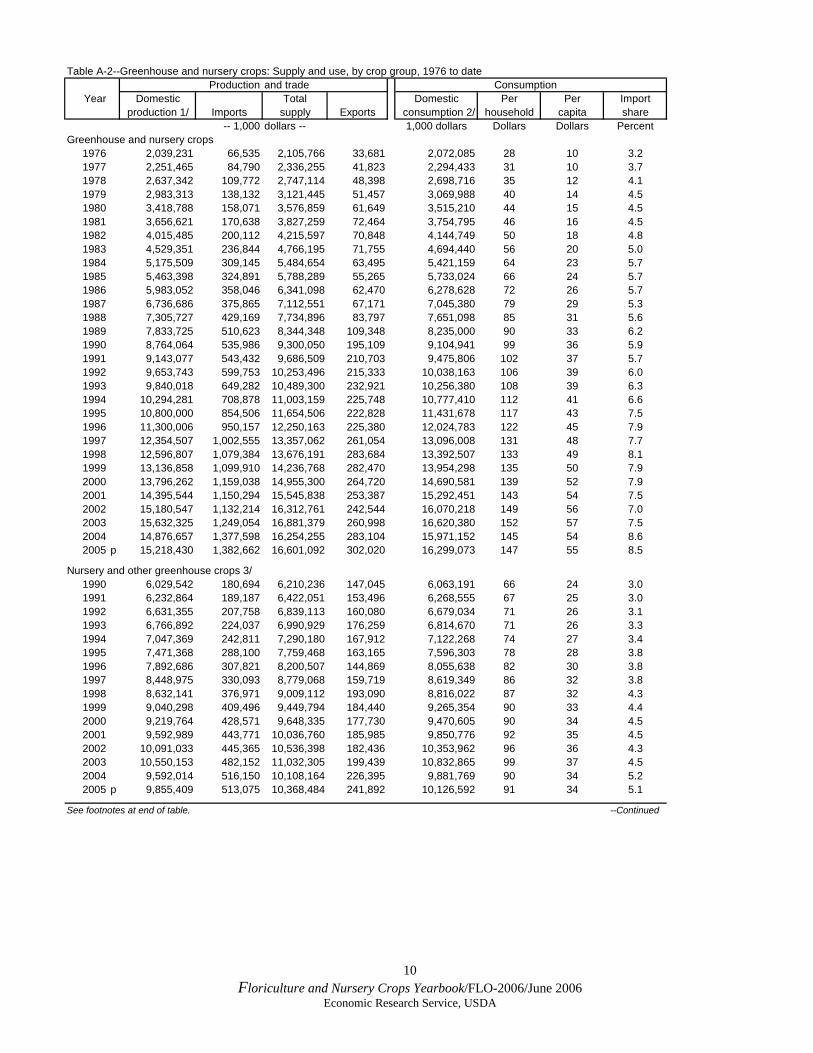
Table A-2--Greenhouse and nursery crops: Supply and use, by crop group, 1976 to dateProduction and trade Consumption
Year Domestic Total Domestic Per Per Importproduction 1/ Imports supply Exports consumption 2/ household capita share
-- 1,000 dollars -- 1,000 dollars Dollars Dollars PercentGreenhouse and nursery crops
1976 2,039,231 66,535 2,105,766 33,681 2,072,085 28 10 3.21977 2,251,465 84,790 2,336,255 41,823 2,294,433 31 10 3.71978 2,637,342 109,772 2,747,114 48,398 2,698,716 35 12 4.11979 2,983,313 138,132 3,121,445 51,457 3,069,988 40 14 4.51980 3,418,788 158,071 3,576,859 61,649 3,515,210 44 15 4.51981 3,656,621 170,638 3,827,259 72,464 3,754,795 46 16 4.51982 4,015,485 200,112 4,215,597 70,848 4,144,749 50 18 4.81983 4,529,351 236,844 4,766,195 71,755 4,694,440 56 20 5.01984 5,175,509 309,145 5,484,654 63,495 5,421,159 64 23 5.71985 5,463,398 324,891 5,788,289 55,265 5,733,024 66 24 5.71986 5,983,052 358,046 6,341,098 62,470 6,278,628 72 26 5.71987 6,736,686 375,865 7,112,551 67,171 7,045,380 79 29 5.31988 7,305,727 429,169 7,734,896 83,797 7,651,098 85 31 5.61989 7,833,725 510,623 8,344,348 109,348 8,235,000 90 33 6.21990 8,764,064 535,986 9,300,050 195,109 9,104,941 99 36 5.91991 9,143,077 543,432 9,686,509 210,703 9,475,806 102 37 5.71992 9,653,743 599,753 10,253,496 215,333 10,038,163 106 39 6.01993 9,840,018 649,282 10,489,300 232,921 10,256,380 108 39 6.31994 10,294,281 708,878 11,003,159 225,748 10,777,410 112 41 6.61995 10,800,000 854,506 11,654,506 222,828 11,431,678 117 43 7.51996 11,300,006 950,157 12,250,163 225,380 12,024,783 122 45 7.91997 12,354,507 1,002,555 13,357,062 261,054 13,096,008 131 48 7.71998 12,596,807 1,079,384 13,676,191 283,684 13,392,507 133 49 8.11999 13,136,858 1,099,910 14,236,768 282,470 13,954,298 135 50 7.92000 13,796,262 1,159,038 14,955,300 264,720 14,690,581 139 52 7.92001 14,395,544 1,150,294 15,545,838 253,387 15,292,451 143 54 7.52002 15,180,547 1,132,214 16,312,761 242,544 16,070,218 149 56 7.02003 15,632,325 1,249,054 16,881,379 260,998 16,620,380 152 57 7.52004 14,876,657 1,377,598 16,254,255 283,104 15,971,152 145 54 8.62005 p 15,218,430 1,382,662 16,601,092 302,020 16,299,073 147 55 8.5
Nursery and other greenhouse crops 3/1990 6,029,542 180,694 6,210,236 147,045 6,063,191 66 24 3.01991 6,232,864 189,187 6,422,051 153,496 6,268,555 67 25 3.01992 6,631,355 207,758 6,839,113 160,080 6,679,034 71 26 3.11993 6,766,892 224,037 6,990,929 176,259 6,814,670 71 26 3.31994 7,047,369 242,811 7,290,180 167,912 7,122,268 74 27 3.41995 7,471,368 288,100 7,759,468 163,165 7,596,303 78 28 3.81996 7,892,686 307,821 8,200,507 144,869 8,055,638 82 30 3.81997 8,448,975 330,093 8,779,068 159,719 8,619,349 86 32 3.81998 8,632,141 376,971 9,009,112 193,090 8,816,022 87 32 4.31999 9,040,298 409,496 9,449,794 184,440 9,265,354 90 33 4.42000 9,219,764 428,571 9,648,335 177,730 9,470,605 90 34 4.52001 9,592,989 443,771 10,036,760 185,985 9,850,776 92 35 4.52002 10,091,033 445,365 10,536,398 182,436 10,353,962 96 36 4.32003 10,550,153 482,152 11,032,305 199,439 10,832,865 99 37 4.52004 9,592,014 516,150 10,108,164 226,395 9,881,769 90 34 5.22005 p 9,855,409 513,075 10,368,484 241,892 10,126,592 91 34 5.1
See footnotes at end of table. --Continued
11 Floriculture and Nursery Crops Yearbook/FLO-2006/June 2006
Economic Research Service, USDA
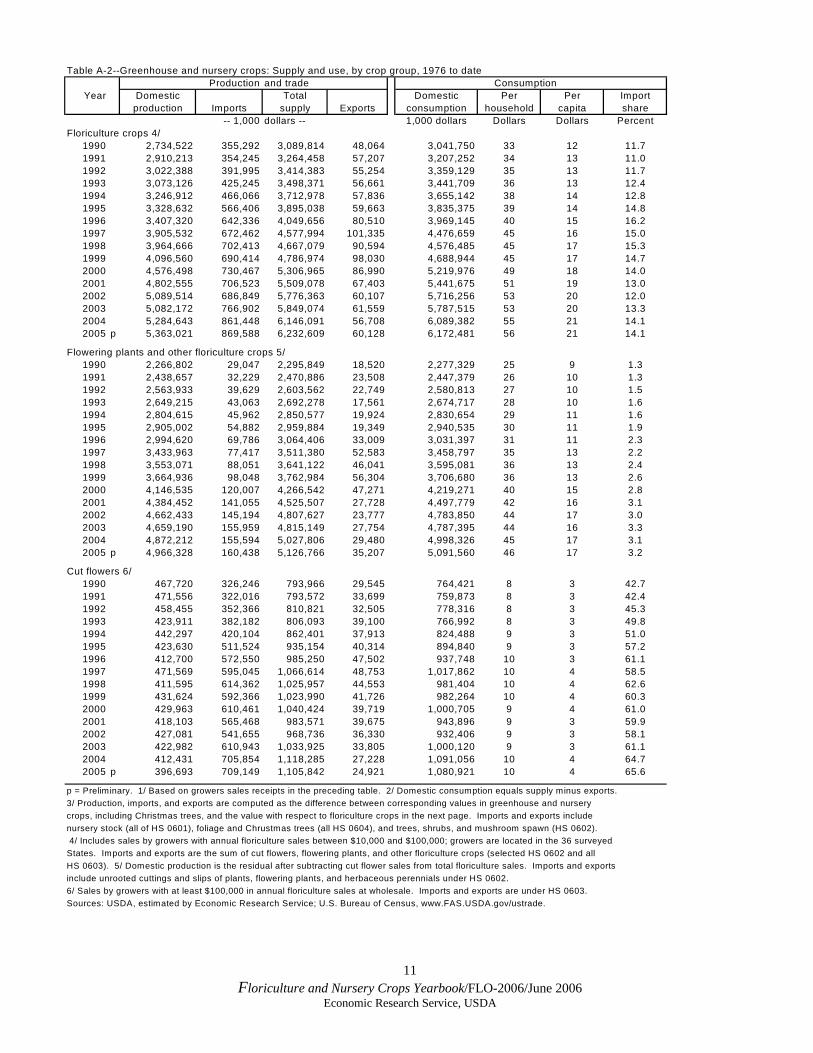
Table A-2--Greenhouse and nursery crops: Supply and use, by crop group, 1976 to date Production and trade Consumption
Year Domestic Total Domestic Per Per Importproduction Imports supply Exports consumption household capita share
-- 1,000 dollars -- 1,000 dollars Dollars Dollars PercentFloriculture crops 4/
1990 2,734,522 355,292 3,089,814 48,064 3,041,750 33 12 11.71991 2,910,213 354,245 3,264,458 57,207 3,207,252 34 13 11.01992 3,022,388 391,995 3,414,383 55,254 3,359,129 35 13 11.71993 3,073,126 425,245 3,498,371 56,661 3,441,709 36 13 12.41994 3,246,912 466,066 3,712,978 57,836 3,655,142 38 14 12.81995 3,328,632 566,406 3,895,038 59,663 3,835,375 39 14 14.81996 3,407,320 642,336 4,049,656 80,510 3,969,145 40 15 16.21997 3,905,532 672,462 4,577,994 101,335 4,476,659 45 16 15.01998 3,964,666 702,413 4,667,079 90,594 4,576,485 45 17 15.31999 4,096,560 690,414 4,786,974 98,030 4,688,944 45 17 14.72000 4,576,498 730,467 5,306,965 86,990 5,219,976 49 18 14.02001 4,802,555 706,523 5,509,078 67,403 5,441,675 51 19 13.02002 5,089,514 686,849 5,776,363 60,107 5,716,256 53 20 12.02003 5,082,172 766,902 5,849,074 61,559 5,787,515 53 20 13.32004 5,284,643 861,448 6,146,091 56,708 6,089,382 55 21 14.12005 p 5,363,021 869,588 6,232,609 60,128 6,172,481 56 21 14.1
Flowering plants and other floriculture crops 5/1990 2,266,802 29,047 2,295,849 18,520 2,277,329 25 9 1.31991 2,438,657 32,229 2,470,886 23,508 2,447,379 26 10 1.31992 2,563,933 39,629 2,603,562 22,749 2,580,813 27 10 1.51993 2,649,215 43,063 2,692,278 17,561 2,674,717 28 10 1.61994 2,804,615 45,962 2,850,577 19,924 2,830,654 29 11 1.61995 2,905,002 54,882 2,959,884 19,349 2,940,535 30 11 1.91996 2,994,620 69,786 3,064,406 33,009 3,031,397 31 11 2.31997 3,433,963 77,417 3,511,380 52,583 3,458,797 35 13 2.21998 3,553,071 88,051 3,641,122 46,041 3,595,081 36 13 2.41999 3,664,936 98,048 3,762,984 56,304 3,706,680 36 13 2.62000 4,146,535 120,007 4,266,542 47,271 4,219,271 40 15 2.82001 4,384,452 141,055 4,525,507 27,728 4,497,779 42 16 3.12002 4,662,433 145,194 4,807,627 23,777 4,783,850 44 17 3.02003 4,659,190 155,959 4,815,149 27,754 4,787,395 44 16 3.32004 4,872,212 155,594 5,027,806 29,480 4,998,326 45 17 3.12005 p 4,966,328 160,438 5,126,766 35,207 5,091,560 46 17 3.2
Cut flowers 6/1990 467,720 326,246 793,966 29,545 764,421 8 3 42.71991 471,556 322,016 793,572 33,699 759,873 8 3 42.41992 458,455 352,366 810,821 32,505 778,316 8 3 45.31993 423,911 382,182 806,093 39,100 766,992 8 3 49.81994 442,297 420,104 862,401 37,913 824,488 9 3 51.01995 423,630 511,524 935,154 40,314 894,840 9 3 57.21996 412,700 572,550 985,250 47,502 937,748 10 3 61.11997 471,569 595,045 1,066,614 48,753 1,017,862 10 4 58.51998 411,595 614,362 1,025,957 44,553 981,404 10 4 62.61999 431,624 592,366 1,023,990 41,726 982,264 10 4 60.32000 429,963 610,461 1,040,424 39,719 1,000,705 9 4 61.02001 418,103 565,468 983,571 39,675 943,896 9 3 59.92002 427,081 541,655 968,736 36,330 932,406 9 3 58.12003 422,982 610,943 1,033,925 33,805 1,000,120 9 3 61.12004 412,431 705,854 1,118,285 27,228 1,091,056 10 4 64.72005 p 396,693 709,149 1,105,842 24,921 1,080,921 10 4 65.6
p = Preliminary. 1/ Based on growers sales receipts in the preceding table. 2/ Domestic consumption equals supply minus exports.3/ Production, imports, and exports are computed as the difference between corresponding values in greenhouse and nurserycrops, including Christmas trees, and the value with respect to floriculture crops in the next page. Imports and exports includenursery stock (all of HS 0601), foliage and Chrustmas trees (all HS 0604), and trees, shrubs, and mushroom spawn (HS 0602). 4/ Includes sales by growers with annual floriculture sales between $10,000 and $100,000; growers are located in the 36 surveyedStates. Imports and exports are the sum of cut flowers, flowering plants, and other floriculture crops (selected HS 0602 and allHS 0603). 5/ Domestic production is the residual after subtracting cut flower sales from total floriculture sales. Imports and exportsinclude unrooted cuttings and slips of plants, flowering plants, and herbaceous perennials under HS 0602.6/ Sales by growers with at least $100,000 in annual floriculture sales at wholesale. Imports and exports are under HS 0603.Sources: USDA, estimated by Economic Research Service; U.S. Bureau of Census, www.FAS.USDA.gov/ustrade.
12 Floriculture and Nursery Crops Yearbook/FLO-2006/June 2006
Economic Research Service, USDA
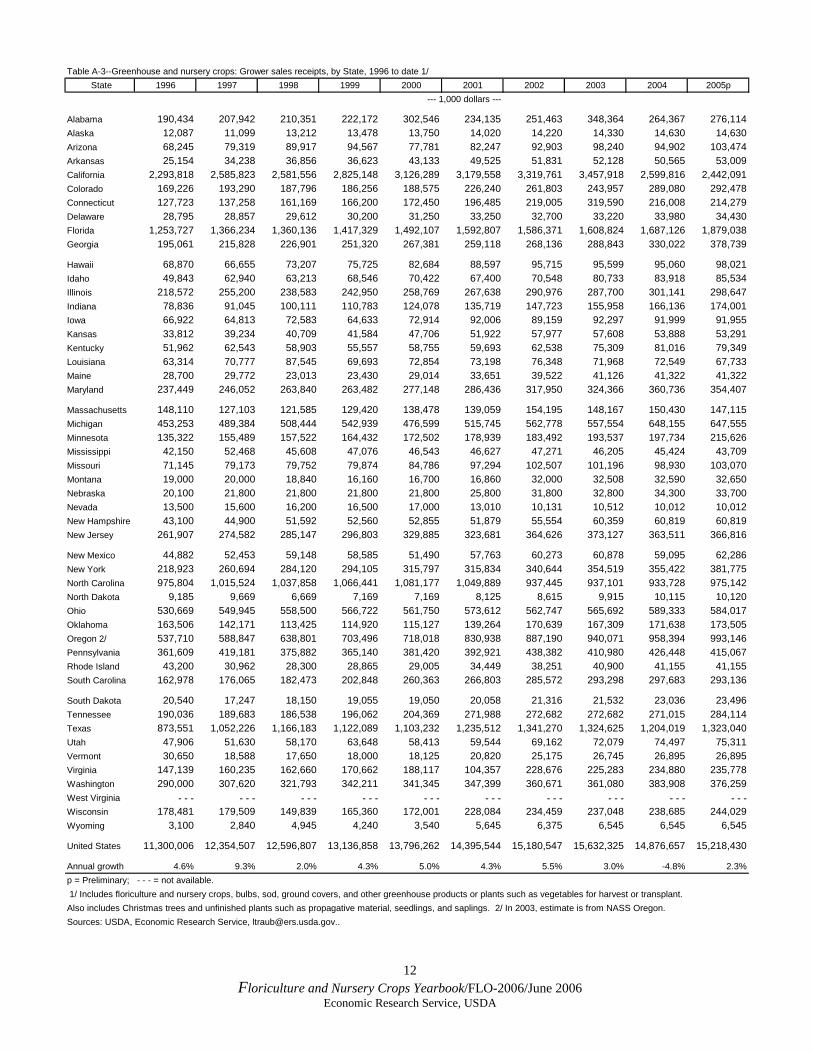
Table A-3--Greenhouse and nursery crops: Grower sales receipts, by State, 1996 to date 1/ State 1996 1997 1998 1999 2000 2001 2002 2003 2004 2005p
--- 1,000 dollars ---
Alabama 190,434 207,942 210,351 222,172 302,546 234,135 251,463 348,364 264,367 276,114Alaska 12,087 11,099 13,212 13,478 13,750 14,020 14,220 14,330 14,630 14,630Arizona 68,245 79,319 89,917 94,567 77,781 82,247 92,903 98,240 94,902 103,474Arkansas 25,154 34,238 36,856 36,623 43,133 49,525 51,831 52,128 50,565 53,009California 2,293,818 2,585,823 2,581,556 2,825,148 3,126,289 3,179,558 3,319,761 3,457,918 2,599,816 2,442,091Colorado 169,226 193,290 187,796 186,256 188,575 226,240 261,803 243,957 289,080 292,478Connecticut 127,723 137,258 161,169 166,200 172,450 196,485 219,005 319,590 216,008 214,279Delaware 28,795 28,857 29,612 30,200 31,250 33,250 32,700 33,220 33,980 34,430Florida 1,253,727 1,366,234 1,360,136 1,417,329 1,492,107 1,592,807 1,586,371 1,608,824 1,687,126 1,879,038Georgia 195,061 215,828 226,901 251,320 267,381 259,118 268,136 288,843 330,022 378,739
Hawaii 68,870 66,655 73,207 75,725 82,684 88,597 95,715 95,599 95,060 98,021Idaho 49,843 62,940 63,213 68,546 70,422 67,400 70,548 80,733 83,918 85,534Illinois 218,572 255,200 238,583 242,950 258,769 267,638 290,976 287,700 301,141 298,647Indiana 78,836 91,045 100,111 110,783 124,078 135,719 147,723 155,958 166,136 174,001Iowa 66,922 64,813 72,583 64,633 72,914 92,006 89,159 92,297 91,999 91,955Kansas 33,812 39,234 40,709 41,584 47,706 51,922 57,977 57,608 53,888 53,291Kentucky 51,962 62,543 58,903 55,557 58,755 59,693 62,538 75,309 81,016 79,349Louisiana 63,314 70,777 87,545 69,693 72,854 73,198 76,348 71,968 72,549 67,733Maine 28,700 29,772 23,013 23,430 29,014 33,651 39,522 41,126 41,322 41,322Maryland 237,449 246,052 263,840 263,482 277,148 286,436 317,950 324,366 360,736 354,407
Massachusetts 148,110 127,103 121,585 129,420 138,478 139,059 154,195 148,167 150,430 147,115Michigan 453,253 489,384 508,444 542,939 476,599 515,745 562,778 557,554 648,155 647,555Minnesota 135,322 155,489 157,522 164,432 172,502 178,939 183,492 193,537 197,734 215,626Mississippi 42,150 52,468 45,608 47,076 46,543 46,627 47,271 46,205 45,424 43,709Missouri 71,145 79,173 79,752 79,874 84,786 97,294 102,507 101,196 98,930 103,070Montana 19,000 20,000 18,840 16,160 16,700 16,860 32,000 32,508 32,590 32,650Nebraska 20,100 21,800 21,800 21,800 21,800 25,800 31,800 32,800 34,300 33,700Nevada 13,500 15,600 16,200 16,500 17,000 13,010 10,131 10,512 10,012 10,012New Hampshire 43,100 44,900 51,592 52,560 52,855 51,879 55,554 60,359 60,819 60,819New Jersey 261,907 274,582 285,147 296,803 329,885 323,681 364,626 373,127 363,511 366,816
New Mexico 44,882 52,453 59,148 58,585 51,490 57,763 60,273 60,878 59,095 62,286New York 218,923 260,694 284,120 294,105 315,797 315,834 340,644 354,519 355,422 381,775North Carolina 975,804 1,015,524 1,037,858 1,066,441 1,081,177 1,049,889 937,445 937,101 933,728 975,142North Dakota 9,185 9,669 6,669 7,169 7,169 8,125 8,615 9,915 10,115 10,120Ohio 530,669 549,945 558,500 566,722 561,750 573,612 562,747 565,692 589,333 584,017Oklahoma 163,506 142,171 113,425 114,920 115,127 139,264 170,639 167,309 171,638 173,505Oregon 2/ 537,710 588,847 638,801 703,496 718,018 830,938 887,190 940,071 958,394 993,146Pennsylvania 361,609 419,181 375,882 365,140 381,420 392,921 438,382 410,980 426,448 415,067Rhode Island 43,200 30,962 28,300 28,865 29,005 34,449 38,251 40,900 41,155 41,155South Carolina 162,978 176,065 182,473 202,848 260,363 266,803 285,572 293,298 297,683 293,136
South Dakota 20,540 17,247 18,150 19,055 19,050 20,058 21,316 21,532 23,036 23,496Tennessee 190,036 189,683 186,538 196,062 204,369 271,988 272,682 272,682 271,015 284,114Texas 873,551 1,052,226 1,166,183 1,122,089 1,103,232 1,235,512 1,341,270 1,324,625 1,204,019 1,323,040Utah 47,906 51,630 58,170 63,648 58,413 59,544 69,162 72,079 74,497 75,311Vermont 30,650 18,588 17,650 18,000 18,125 20,820 25,175 26,745 26,895 26,895Virginia 147,139 160,235 162,660 170,662 188,117 104,357 228,676 225,283 234,880 235,778Washington 290,000 307,620 321,793 342,211 341,345 347,399 360,671 361,080 383,908 376,259West Virginia - - - - - - - - - - - - - - - - - - - - - - - - - - - - - -Wisconsin 178,481 179,509 149,839 165,360 172,001 228,084 234,459 237,048 238,685 244,029Wyoming 3,100 2,840 4,945 4,240 3,540 5,645 6,375 6,545 6,545 6,545
United States 11,300,006 12,354,507 12,596,807 13,136,858 13,796,262 14,395,544 15,180,547 15,632,325 14,876,657 15,218,430
Annual growth 4.6% 9.3% 2.0% 4.3% 5.0% 4.3% 5.5% 3.0% -4.8% 2.3%p = Preliminary; - - - = not available. 1/ Includes floriculture and nursery crops, bulbs, sod, ground covers, and other greenhouse products or plants such as vegetables for harvest or transplant.Also includes Christmas trees and unfinished plants such as propagative material, seedlings, and saplings. 2/ In 2003, estimate is from NASS Oregon.Sources: USDA, Economic Research Service, [email protected]..

13 Floriculture and Nursery Crops Yearbook/FLO-2006/June 2006
Economic Research Service, USDA
Table A-4--Greenhouse and nursery crops: State shares of total U.S. sales receipts, 1996 to date 1/ State 1996 1997 1998 1999 2000 2001 2002 2003 2004 2005p
Percent
Alabama 1.7 1.7 1.7 1.7 2.2 1.6 1.7 2.2 1.8 1.8Alaska 0.1 0.1 0.1 0.1 0.1 0.1 0.1 0.1 0.1 0.1Arizona 0.6 0.6 0.7 0.7 0.6 0.6 0.6 0.6 0.6 0.7Arkansas 0.2 0.3 0.3 0.3 0.3 0.3 0.3 0.3 0.3 0.3California 20.3 20.9 20.5 21.5 22.7 22.1 21.9 22.1 17.5 16.0Colorado 1.5 1.6 1.5 1.4 1.4 1.6 1.7 1.6 1.9 1.9Connecticut 1.1 1.1 1.3 1.3 1.2 1.4 1.4 2.0 1.5 1.4Delaware 0.3 0.2 0.2 0.2 0.2 0.2 0.2 0.2 0.2 0.2Florida 11.1 11.1 10.8 10.8 10.8 11.1 10.5 10.3 11.3 12.3Georgia 1.7 1.7 1.8 1.9 1.9 1.8 1.8 1.8 2.2 2.5
Hawaii 0.6 0.5 0.6 0.6 0.6 0.6 0.6 0.6 0.6 0.6Idaho 0.4 0.5 0.5 0.5 0.5 0.5 0.5 0.5 0.6 0.6Illinois 1.9 2.1 1.9 1.8 1.9 1.9 1.9 1.8 2.0 2.0Indiana 0.7 0.7 0.8 0.8 0.9 0.9 1.0 1.0 1.1 1.1Iowa 0.6 0.5 0.6 0.5 0.5 0.6 0.6 0.6 0.6 0.6Kansas 0.3 0.3 0.3 0.3 0.3 0.4 0.4 0.4 0.4 0.4Kentucky 0.5 0.5 0.5 0.4 0.4 0.4 0.4 0.5 0.5 0.5Louisiana 0.6 0.6 0.7 0.5 0.5 0.5 0.5 0.5 0.5 0.4Maine 0.3 0.2 0.2 0.2 0.2 0.2 0.3 0.3 0.3 0.3Maryland 2.1 2.0 2.1 2.0 2.0 2.0 2.1 2.1 2.4 2.3
Massachusetts 1.3 1.0 1.0 1.0 1.0 1.0 1.0 0.9 1.0 1.0Michigan 4.0 4.0 4.0 4.1 3.5 3.6 3.7 3.6 4.4 4.3Minnesota 1.2 1.3 1.3 1.3 1.3 1.2 1.2 1.2 1.3 1.4Mississippi 0.4 0.4 0.4 0.4 0.3 0.3 0.3 0.3 0.3 0.3Missouri 0.6 0.6 0.6 0.6 0.6 0.7 0.7 0.6 0.7 0.7Montana 0.2 0.2 0.1 0.1 0.1 0.1 0.2 0.2 0.2 0.2Nebraska 0.2 0.2 0.2 0.2 0.2 0.2 0.2 0.2 0.2 0.2Nevada 0.1 0.1 0.1 0.1 0.1 0.1 0.1 0.1 0.1 0.1New Hampshire 0.4 0.4 0.4 0.4 0.4 0.4 0.4 0.4 0.4 0.4New Jersey 2.3 2.2 2.3 2.3 2.4 2.2 2.4 2.4 2.4 2.4
New Mexico 0.4 0.4 0.5 0.4 0.4 0.4 0.4 0.4 0.4 0.4New York 1.9 2.1 2.3 2.2 2.3 2.2 2.2 2.3 2.4 2.5North Carolina 8.6 8.2 8.2 8.1 7.8 7.3 6.2 6.0 6.3 6.4North Dakota 0.1 0.1 0.1 0.1 0.1 0.1 0.1 0.1 0.1 0.1Ohio 4.7 4.5 4.4 4.3 4.1 4.0 3.7 3.6 4.0 3.8Oklahoma 1.4 1.2 0.9 0.9 0.8 1.0 1.1 1.1 1.2 1.1Oregon 4.8 4.8 5.1 5.4 5.2 5.8 5.8 6.0 6.4 6.5Pennsylvania 3.2 3.4 3.0 2.8 2.8 2.7 2.9 2.6 2.9 2.7Rhode Island 0.4 0.3 0.2 0.2 0.2 0.2 0.3 0.3 0.3 0.3South Carolina 1.4 1.4 1.4 1.5 1.9 1.9 1.9 1.9 2.0 1.9
South Dakota 0.2 0.1 0.1 0.1 0.1 0.1 0.1 0.1 0.2 0.2Tennessee 1.7 1.5 1.5 1.5 1.5 1.9 1.8 1.7 1.8 1.9Texas 7.7 8.5 9.3 8.5 8.0 8.6 8.8 8.5 8.1 8.7Utah 0.4 0.4 0.5 0.5 0.4 0.4 0.5 0.5 0.5 0.5Vermont 0.3 0.2 0.1 0.1 0.1 0.1 0.2 0.2 0.2 0.2Virginia 1.3 1.3 1.3 1.3 1.4 0.7 1.5 1.4 1.6 1.5Washington 2.6 2.5 2.6 2.6 2.5 2.4 2.4 2.3 2.6 2.5West Virginia - - - - - - - - - - - - - - - - - - - - - - - - - - - - - -Wisconsin 1.6 1.5 1.2 1.3 1.2 1.6 1.5 1.5 1.6 1.6Wyoming 0.0 0.0 0.0 0.0 0.0 0.0 0.0 0.0 0.0 0.0
United States 100.0 100.0 100.0 100.0 100.0 100.0 100.0 100.0 100.0 100.0p = Preliminary; - - - = not available.1/ Shares of sales by State are calculated from table A-3.Sources: USDA, Economic Research Service, [email protected].
14 Floriculture and Nursery Crops Yearbook/FLO-2006/June 2006
Economic Research Service, USDA
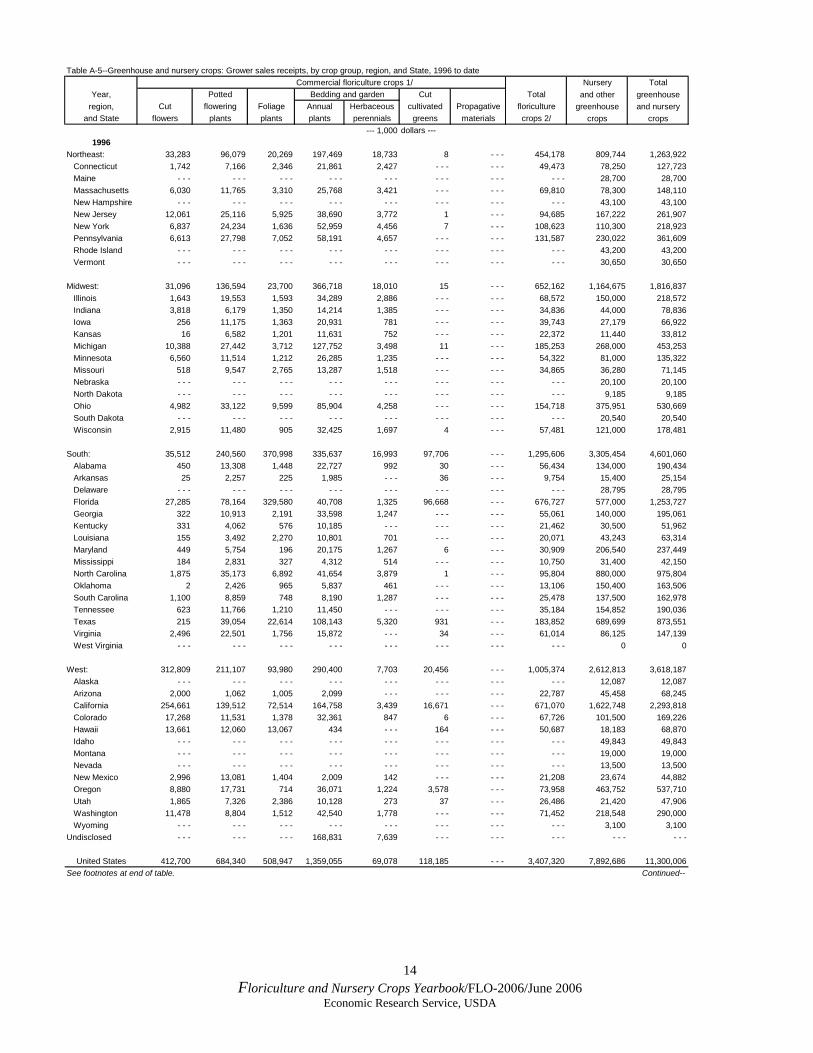
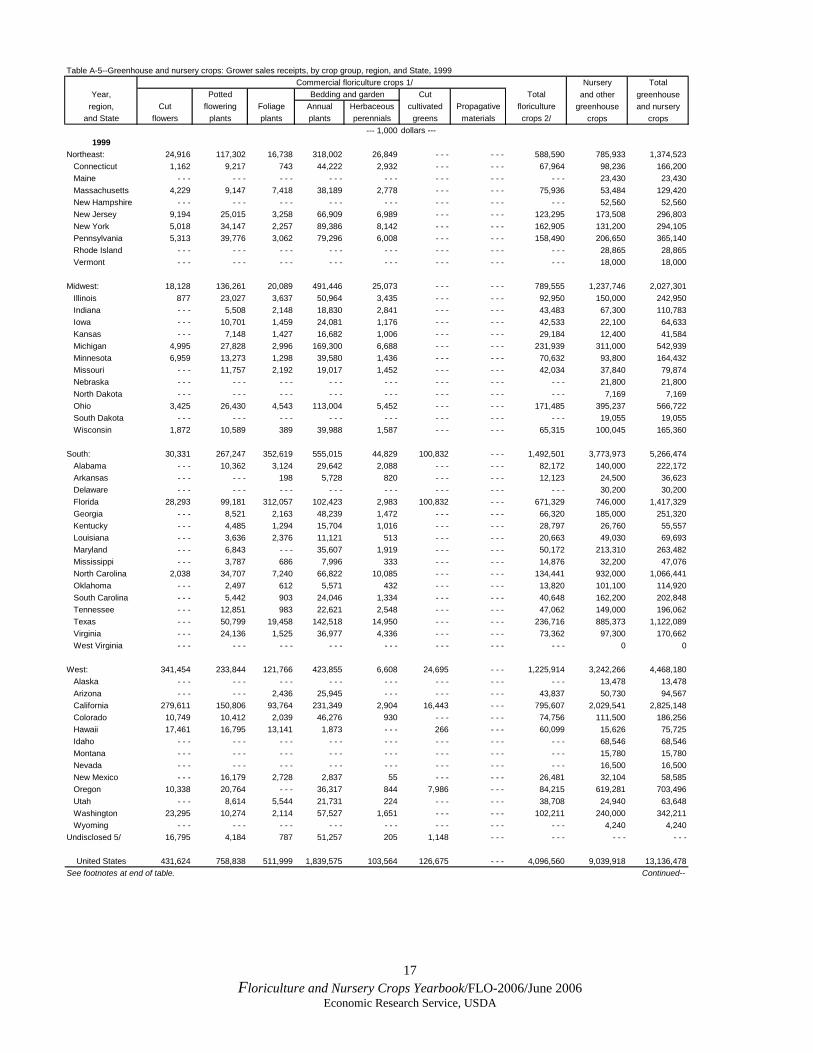
Table A-5--Greenhouse and nursery crops: Grower sales receipts, by crop group, region, and State, 1996 to dateCommercial floriculture crops 1/ Nursery Total
Year, Potted Bedding and garden Cut Total and other greenhouseregion, Cut flowering Foliage Annual Herbaceous cultivated Propagative floriculture greenhouse and nursery
and State flowers plants plants plants perennials greens materials crops 2/ crops crops--- 1,000 dollars ---
1996Northeast: 33,283 96,079 20,269 197,469 18,733 8 - - - 454,178 809,744 1,263,922 Connecticut 1,742 7,166 2,346 21,861 2,427 - - - - - - 49,473 78,250 127,723 Maine - - - - - - - - - - - - - - - - - - - - - - - - 28,700 28,700 Massachusetts 6,030 11,765 3,310 25,768 3,421 - - - - - - 69,810 78,300 148,110 New Hampshire - - - - - - - - - - - - - - - - - - - - - - - - 43,100 43,100 New Jersey 12,061 25,116 5,925 38,690 3,772 1 - - - 94,685 167,222 261,907 New York 6,837 24,234 1,636 52,959 4,456 7 - - - 108,623 110,300 218,923 Pennsylvania 6,613 27,798 7,052 58,191 4,657 - - - - - - 131,587 230,022 361,609 Rhode Island - - - - - - - - - - - - - - - - - - - - - - - - 43,200 43,200 Vermont - - - - - - - - - - - - - - - - - - - - - - - - 30,650 30,650
Midwest: 31,096 136,594 23,700 366,718 18,010 15 - - - 652,162 1,164,675 1,816,837 Illinois 1,643 19,553 1,593 34,289 2,886 - - - - - - 68,572 150,000 218,572 Indiana 3,818 6,179 1,350 14,214 1,385 - - - - - - 34,836 44,000 78,836 Iowa 256 11,175 1,363 20,931 781 - - - - - - 39,743 27,179 66,922 Kansas 16 6,582 1,201 11,631 752 - - - - - - 22,372 11,440 33,812 Michigan 10,388 27,442 3,712 127,752 3,498 11 - - - 185,253 268,000 453,253 Minnesota 6,560 11,514 1,212 26,285 1,235 - - - - - - 54,322 81,000 135,322 Missouri 518 9,547 2,765 13,287 1,518 - - - - - - 34,865 36,280 71,145 Nebraska - - - - - - - - - - - - - - - - - - - - - - - - 20,100 20,100 North Dakota - - - - - - - - - - - - - - - - - - - - - - - - 9,185 9,185 Ohio 4,982 33,122 9,599 85,904 4,258 - - - - - - 154,718 375,951 530,669 South Dakota - - - - - - - - - - - - - - - - - - - - - - - - 20,540 20,540 Wisconsin 2,915 11,480 905 32,425 1,697 4 - - - 57,481 121,000 178,481
South: 35,512 240,560 370,998 335,637 16,993 97,706 - - - 1,295,606 3,305,454 4,601,060 Alabama 450 13,308 1,448 22,727 992 30 - - - 56,434 134,000 190,434 Arkansas 25 2,257 225 1,985 - - - 36 - - - 9,754 15,400 25,154 Delaware - - - - - - - - - - - - - - - - - - - - - - - - 28,795 28,795 Florida 27,285 78,164 329,580 40,708 1,325 96,668 - - - 676,727 577,000 1,253,727 Georgia 322 10,913 2,191 33,598 1,247 - - - - - - 55,061 140,000 195,061 Kentucky 331 4,062 576 10,185 - - - - - - - - - 21,462 30,500 51,962 Louisiana 155 3,492 2,270 10,801 701 - - - - - - 20,071 43,243 63,314 Maryland 449 5,754 196 20,175 1,267 6 - - - 30,909 206,540 237,449 Mississippi 184 2,831 327 4,312 514 - - - - - - 10,750 31,400 42,150 North Carolina 1,875 35,173 6,892 41,654 3,879 1 - - - 95,804 880,000 975,804 Oklahoma 2 2,426 965 5,837 461 - - - - - - 13,106 150,400 163,506 South Carolina 1,100 8,859 748 8,190 1,287 - - - - - - 25,478 137,500 162,978 Tennessee 623 11,766 1,210 11,450 - - - - - - - - - 35,184 154,852 190,036 Texas 215 39,054 22,614 108,143 5,320 931 - - - 183,852 689,699 873,551 Virginia 2,496 22,501 1,756 15,872 - - - 34 - - - 61,014 86,125 147,139 West Virginia - - - - - - - - - - - - - - - - - - - - - - - - 0 0
West: 312,809 211,107 93,980 290,400 7,703 20,456 - - - 1,005,374 2,612,813 3,618,187 Alaska - - - - - - - - - - - - - - - - - - - - - - - - 12,087 12,087 Arizona 2,000 1,062 1,005 2,099 - - - - - - - - - 22,787 45,458 68,245 California 254,661 139,512 72,514 164,758 3,439 16,671 - - - 671,070 1,622,748 2,293,818 Colorado 17,268 11,531 1,378 32,361 847 6 - - - 67,726 101,500 169,226 Hawaii 13,661 12,060 13,067 434 - - - 164 - - - 50,687 18,183 68,870 Idaho - - - - - - - - - - - - - - - - - - - - - - - - 49,843 49,843 Montana - - - - - - - - - - - - - - - - - - - - - - - - 19,000 19,000 Nevada - - - - - - - - - - - - - - - - - - - - - - - - 13,500 13,500 New Mexico 2,996 13,081 1,404 2,009 142 - - - - - - 21,208 23,674 44,882 Oregon 8,880 17,731 714 36,071 1,224 3,578 - - - 73,958 463,752 537,710 Utah 1,865 7,326 2,386 10,128 273 37 - - - 26,486 21,420 47,906 Washington 11,478 8,804 1,512 42,540 1,778 - - - - - - 71,452 218,548 290,000 Wyoming - - - - - - - - - - - - - - - - - - - - - - - - 3,100 3,100Undisclosed - - - - - - - - - 168,831 7,639 - - - - - - - - - - - - - - -
United States 412,700 684,340 508,947 1,359,055 69,078 118,185 - - - 3,407,320 7,892,686 11,300,006See footnotes at end of table. Continued--
15 Floriculture and Nursery Crops Yearbook/FLO-2006/June 2006
Economic Research Service, USDA
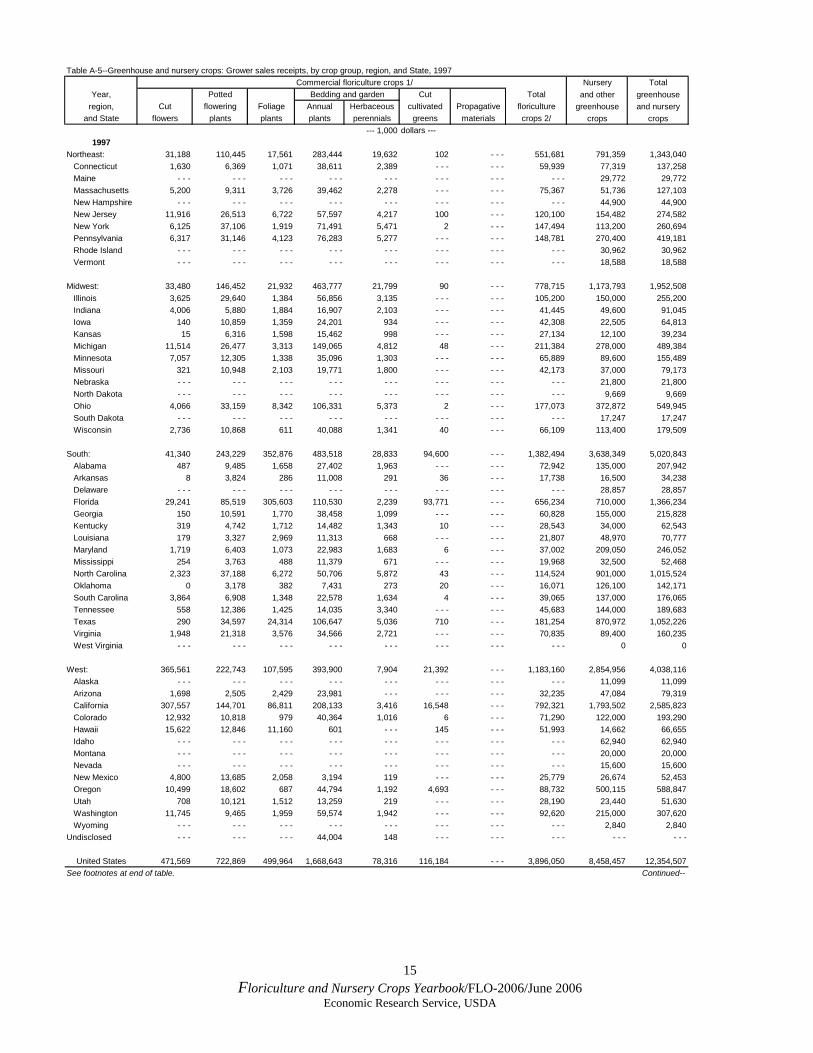
Table A-5--Greenhouse and nursery crops: Grower sales receipts, by crop group, region, and State, 1997 Commercial floriculture crops 1/ Nursery Total
Year, Potted Bedding and garden Cut Total and other greenhouseregion, Cut flowering Foliage Annual Herbaceous cultivated Propagative floriculture greenhouse and nursery
and State flowers plants plants plants perennials greens materials crops 2/ crops crops--- 1,000 dollars ---
1997Northeast: 31,188 110,445 17,561 283,444 19,632 102 - - - 551,681 791,359 1,343,040 Connecticut 1,630 6,369 1,071 38,611 2,389 - - - - - - 59,939 77,319 137,258 Maine - - - - - - - - - - - - - - - - - - - - - - - - 29,772 29,772 Massachusetts 5,200 9,311 3,726 39,462 2,278 - - - - - - 75,367 51,736 127,103 New Hampshire - - - - - - - - - - - - - - - - - - - - - - - - 44,900 44,900 New Jersey 11,916 26,513 6,722 57,597 4,217 100 - - - 120,100 154,482 274,582 New York 6,125 37,106 1,919 71,491 5,471 2 - - - 147,494 113,200 260,694 Pennsylvania 6,317 31,146 4,123 76,283 5,277 - - - - - - 148,781 270,400 419,181 Rhode Island - - - - - - - - - - - - - - - - - - - - - - - - 30,962 30,962 Vermont - - - - - - - - - - - - - - - - - - - - - - - - 18,588 18,588
Midwest: 33,480 146,452 21,932 463,777 21,799 90 - - - 778,715 1,173,793 1,952,508 Illinois 3,625 29,640 1,384 56,856 3,135 - - - - - - 105,200 150,000 255,200 Indiana 4,006 5,880 1,884 16,907 2,103 - - - - - - 41,445 49,600 91,045 Iowa 140 10,859 1,359 24,201 934 - - - - - - 42,308 22,505 64,813 Kansas 15 6,316 1,598 15,462 998 - - - - - - 27,134 12,100 39,234 Michigan 11,514 26,477 3,313 149,065 4,812 48 - - - 211,384 278,000 489,384 Minnesota 7,057 12,305 1,338 35,096 1,303 - - - - - - 65,889 89,600 155,489 Missouri 321 10,948 2,103 19,771 1,800 - - - - - - 42,173 37,000 79,173 Nebraska - - - - - - - - - - - - - - - - - - - - - - - - 21,800 21,800 North Dakota - - - - - - - - - - - - - - - - - - - - - - - - 9,669 9,669 Ohio 4,066 33,159 8,342 106,331 5,373 2 - - - 177,073 372,872 549,945 South Dakota - - - - - - - - - - - - - - - - - - - - - - - - 17,247 17,247 Wisconsin 2,736 10,868 611 40,088 1,341 40 - - - 66,109 113,400 179,509
South: 41,340 243,229 352,876 483,518 28,833 94,600 - - - 1,382,494 3,638,349 5,020,843 Alabama 487 9,485 1,658 27,402 1,963 - - - - - - 72,942 135,000 207,942 Arkansas 8 3,824 286 11,008 291 36 - - - 17,738 16,500 34,238 Delaware - - - - - - - - - - - - - - - - - - - - - - - - 28,857 28,857 Florida 29,241 85,519 305,603 110,530 2,239 93,771 - - - 656,234 710,000 1,366,234 Georgia 150 10,591 1,770 38,458 1,099 - - - - - - 60,828 155,000 215,828 Kentucky 319 4,742 1,712 14,482 1,343 10 - - - 28,543 34,000 62,543 Louisiana 179 3,327 2,969 11,313 668 - - - - - - 21,807 48,970 70,777 Maryland 1,719 6,403 1,073 22,983 1,683 6 - - - 37,002 209,050 246,052 Mississippi 254 3,763 488 11,379 671 - - - - - - 19,968 32,500 52,468 North Carolina 2,323 37,188 6,272 50,706 5,872 43 - - - 114,524 901,000 1,015,524 Oklahoma 0 3,178 382 7,431 273 20 - - - 16,071 126,100 142,171 South Carolina 3,864 6,908 1,348 22,578 1,634 4 - - - 39,065 137,000 176,065 Tennessee 558 12,386 1,425 14,035 3,340 - - - - - - 45,683 144,000 189,683 Texas 290 34,597 24,314 106,647 5,036 710 - - - 181,254 870,972 1,052,226 Virginia 1,948 21,318 3,576 34,566 2,721 - - - - - - 70,835 89,400 160,235 West Virginia - - - - - - - - - - - - - - - - - - - - - - - - 0 0
West: 365,561 222,743 107,595 393,900 7,904 21,392 - - - 1,183,160 2,854,956 4,038,116 Alaska - - - - - - - - - - - - - - - - - - - - - - - - 11,099 11,099 Arizona 1,698 2,505 2,429 23,981 - - - - - - - - - 32,235 47,084 79,319 California 307,557 144,701 86,811 208,133 3,416 16,548 - - - 792,321 1,793,502 2,585,823 Colorado 12,932 10,818 979 40,364 1,016 6 - - - 71,290 122,000 193,290 Hawaii 15,622 12,846 11,160 601 - - - 145 - - - 51,993 14,662 66,655 Idaho - - - - - - - - - - - - - - - - - - - - - - - - 62,940 62,940 Montana - - - - - - - - - - - - - - - - - - - - - - - - 20,000 20,000 Nevada - - - - - - - - - - - - - - - - - - - - - - - - 15,600 15,600 New Mexico 4,800 13,685 2,058 3,194 119 - - - - - - 25,779 26,674 52,453 Oregon 10,499 18,602 687 44,794 1,192 4,693 - - - 88,732 500,115 588,847 Utah 708 10,121 1,512 13,259 219 - - - - - - 28,190 23,440 51,630 Washington 11,745 9,465 1,959 59,574 1,942 - - - - - - 92,620 215,000 307,620 Wyoming - - - - - - - - - - - - - - - - - - - - - - - - 2,840 2,840Undisclosed - - - - - - - - - 44,004 148 - - - - - - - - - - - - - - -
United States 471,569 722,869 499,964 1,668,643 78,316 116,184 - - - 3,896,050 8,458,457 12,354,507See footnotes at end of table. Continued--
16 Floriculture and Nursery Crops Yearbook/FLO-2006/June 2006
Economic Research Service, USDA
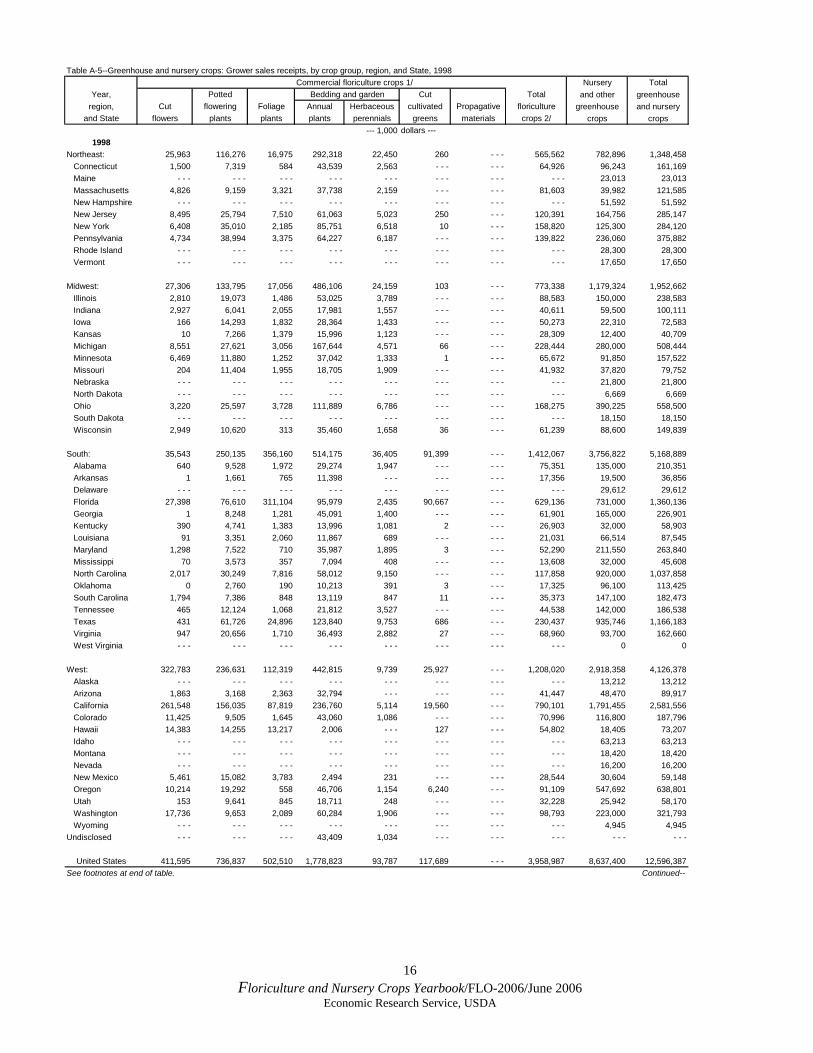
Table A-5--Greenhouse and nursery crops: Grower sales receipts, by crop group, region, and State, 1998 Commercial floriculture crops 1/ Nursery Total
Year, Potted Bedding and garden Cut Total and other greenhouseregion, Cut flowering Foliage Annual Herbaceous cultivated Propagative floriculture greenhouse and nursery
and State flowers plants plants plants perennials greens materials crops 2/ crops crops--- 1,000 dollars ---
1998Northeast: 25,963 116,276 16,975 292,318 22,450 260 - - - 565,562 782,896 1,348,458 Connecticut 1,500 7,319 584 43,539 2,563 - - - - - - 64,926 96,243 161,169 Maine - - - - - - - - - - - - - - - - - - - - - - - - 23,013 23,013 Massachusetts 4,826 9,159 3,321 37,738 2,159 - - - - - - 81,603 39,982 121,585 New Hampshire - - - - - - - - - - - - - - - - - - - - - - - - 51,592 51,592 New Jersey 8,495 25,794 7,510 61,063 5,023 250 - - - 120,391 164,756 285,147 New York 6,408 35,010 2,185 85,751 6,518 10 - - - 158,820 125,300 284,120 Pennsylvania 4,734 38,994 3,375 64,227 6,187 - - - - - - 139,822 236,060 375,882 Rhode Island - - - - - - - - - - - - - - - - - - - - - - - - 28,300 28,300 Vermont - - - - - - - - - - - - - - - - - - - - - - - - 17,650 17,650
Midwest: 27,306 133,795 17,056 486,106 24,159 103 - - - 773,338 1,179,324 1,952,662 Illinois 2,810 19,073 1,486 53,025 3,789 - - - - - - 88,583 150,000 238,583 Indiana 2,927 6,041 2,055 17,981 1,557 - - - - - - 40,611 59,500 100,111 Iowa 166 14,293 1,832 28,364 1,433 - - - - - - 50,273 22,310 72,583 Kansas 10 7,266 1,379 15,996 1,123 - - - - - - 28,309 12,400 40,709 Michigan 8,551 27,621 3,056 167,644 4,571 66 - - - 228,444 280,000 508,444 Minnesota 6,469 11,880 1,252 37,042 1,333 1 - - - 65,672 91,850 157,522 Missouri 204 11,404 1,955 18,705 1,909 - - - - - - 41,932 37,820 79,752 Nebraska - - - - - - - - - - - - - - - - - - - - - - - - 21,800 21,800 North Dakota - - - - - - - - - - - - - - - - - - - - - - - - 6,669 6,669 Ohio 3,220 25,597 3,728 111,889 6,786 - - - - - - 168,275 390,225 558,500 South Dakota - - - - - - - - - - - - - - - - - - - - - - - - 18,150 18,150 Wisconsin 2,949 10,620 313 35,460 1,658 36 - - - 61,239 88,600 149,839
South: 35,543 250,135 356,160 514,175 36,405 91,399 - - - 1,412,067 3,756,822 5,168,889 Alabama 640 9,528 1,972 29,274 1,947 - - - - - - 75,351 135,000 210,351 Arkansas 1 1,661 765 11,398 - - - - - - - - - 17,356 19,500 36,856 Delaware - - - - - - - - - - - - - - - - - - - - - - - - 29,612 29,612 Florida 27,398 76,610 311,104 95,979 2,435 90,667 - - - 629,136 731,000 1,360,136 Georgia 1 8,248 1,281 45,091 1,400 - - - - - - 61,901 165,000 226,901 Kentucky 390 4,741 1,383 13,996 1,081 2 - - - 26,903 32,000 58,903 Louisiana 91 3,351 2,060 11,867 689 - - - - - - 21,031 66,514 87,545 Maryland 1,298 7,522 710 35,987 1,895 3 - - - 52,290 211,550 263,840 Mississippi 70 3,573 357 7,094 408 - - - - - - 13,608 32,000 45,608 North Carolina 2,017 30,249 7,816 58,012 9,150 - - - - - - 117,858 920,000 1,037,858 Oklahoma 0 2,760 190 10,213 391 3 - - - 17,325 96,100 113,425 South Carolina 1,794 7,386 848 13,119 847 11 - - - 35,373 147,100 182,473 Tennessee 465 12,124 1,068 21,812 3,527 - - - - - - 44,538 142,000 186,538 Texas 431 61,726 24,896 123,840 9,753 686 - - - 230,437 935,746 1,166,183 Virginia 947 20,656 1,710 36,493 2,882 27 - - - 68,960 93,700 162,660 West Virginia - - - - - - - - - - - - - - - - - - - - - - - - 0 0
West: 322,783 236,631 112,319 442,815 9,739 25,927 - - - 1,208,020 2,918,358 4,126,378 Alaska - - - - - - - - - - - - - - - - - - - - - - - - 13,212 13,212 Arizona 1,863 3,168 2,363 32,794 - - - - - - - - - 41,447 48,470 89,917 California 261,548 156,035 87,819 236,760 5,114 19,560 - - - 790,101 1,791,455 2,581,556 Colorado 11,425 9,505 1,645 43,060 1,086 - - - - - - 70,996 116,800 187,796 Hawaii 14,383 14,255 13,217 2,006 - - - 127 - - - 54,802 18,405 73,207 Idaho - - - - - - - - - - - - - - - - - - - - - - - - 63,213 63,213 Montana - - - - - - - - - - - - - - - - - - - - - - - - 18,420 18,420 Nevada - - - - - - - - - - - - - - - - - - - - - - - - 16,200 16,200 New Mexico 5,461 15,082 3,783 2,494 231 - - - - - - 28,544 30,604 59,148 Oregon 10,214 19,292 558 46,706 1,154 6,240 - - - 91,109 547,692 638,801 Utah 153 9,641 845 18,711 248 - - - - - - 32,228 25,942 58,170 Washington 17,736 9,653 2,089 60,284 1,906 - - - - - - 98,793 223,000 321,793 Wyoming - - - - - - - - - - - - - - - - - - - - - - - - 4,945 4,945Undisclosed - - - - - - - - - 43,409 1,034 - - - - - - - - - - - - - - -
United States 411,595 736,837 502,510 1,778,823 93,787 117,689 - - - 3,958,987 8,637,400 12,596,387See footnotes at end of table. Continued--
17 Floriculture and Nursery Crops Yearbook/FLO-2006/June 2006
Economic Research Service, USDA
Table A-5--Greenhouse and nursery crops: Grower sales receipts, by crop group, region, and State, 1999 Commercial floriculture crops 1/ Nursery Total
Year, Potted Bedding and garden Cut Total and other greenhouseregion, Cut flowering Foliage Annual Herbaceous cultivated Propagative floriculture greenhouse and nursery
and State flowers plants plants plants perennials greens materials crops 2/ crops crops--- 1,000 dollars ---
1999Northeast: 24,916 117,302 16,738 318,002 26,849 - - - - - - 588,590 785,933 1,374,523 Connecticut 1,162 9,217 743 44,222 2,932 - - - - - - 67,964 98,236 166,200 Maine - - - - - - - - - - - - - - - - - - - - - - - - 23,430 23,430 Massachusetts 4,229 9,147 7,418 38,189 2,778 - - - - - - 75,936 53,484 129,420 New Hampshire - - - - - - - - - - - - - - - - - - - - - - - - 52,560 52,560 New Jersey 9,194 25,015 3,258 66,909 6,989 - - - - - - 123,295 173,508 296,803 New York 5,018 34,147 2,257 89,386 8,142 - - - - - - 162,905 131,200 294,105 Pennsylvania 5,313 39,776 3,062 79,296 6,008 - - - - - - 158,490 206,650 365,140 Rhode Island - - - - - - - - - - - - - - - - - - - - - - - - 28,865 28,865 Vermont - - - - - - - - - - - - - - - - - - - - - - - - 18,000 18,000
Midwest: 18,128 136,261 20,089 491,446 25,073 - - - - - - 789,555 1,237,746 2,027,301 Illinois 877 23,027 3,637 50,964 3,435 - - - - - - 92,950 150,000 242,950 Indiana - - - 5,508 2,148 18,830 2,841 - - - - - - 43,483 67,300 110,783 Iowa - - - 10,701 1,459 24,081 1,176 - - - - - - 42,533 22,100 64,633 Kansas - - - 7,148 1,427 16,682 1,006 - - - - - - 29,184 12,400 41,584 Michigan 4,995 27,828 2,996 169,300 6,688 - - - - - - 231,939 311,000 542,939 Minnesota 6,959 13,273 1,298 39,580 1,436 - - - - - - 70,632 93,800 164,432 Missouri - - - 11,757 2,192 19,017 1,452 - - - - - - 42,034 37,840 79,874 Nebraska - - - - - - - - - - - - - - - - - - - - - - - - 21,800 21,800 North Dakota - - - - - - - - - - - - - - - - - - - - - - - - 7,169 7,169 Ohio 3,425 26,430 4,543 113,004 5,452 - - - - - - 171,485 395,237 566,722 South Dakota - - - - - - - - - - - - - - - - - - - - - - - - 19,055 19,055 Wisconsin 1,872 10,589 389 39,988 1,587 - - - - - - 65,315 100,045 165,360
South: 30,331 267,247 352,619 555,015 44,829 100,832 - - - 1,492,501 3,773,973 5,266,474 Alabama - - - 10,362 3,124 29,642 2,088 - - - - - - 82,172 140,000 222,172 Arkansas - - - - - - 198 5,728 820 - - - - - - 12,123 24,500 36,623 Delaware - - - - - - - - - - - - - - - - - - - - - - - - 30,200 30,200 Florida 28,293 99,181 312,057 102,423 2,983 100,832 - - - 671,329 746,000 1,417,329 Georgia - - - 8,521 2,163 48,239 1,472 - - - - - - 66,320 185,000 251,320 Kentucky - - - 4,485 1,294 15,704 1,016 - - - - - - 28,797 26,760 55,557 Louisiana - - - 3,636 2,376 11,121 513 - - - - - - 20,663 49,030 69,693 Maryland - - - 6,843 - - - 35,607 1,919 - - - - - - 50,172 213,310 263,482 Mississippi - - - 3,787 686 7,996 333 - - - - - - 14,876 32,200 47,076 North Carolina 2,038 34,707 7,240 66,822 10,085 - - - - - - 134,441 932,000 1,066,441 Oklahoma - - - 2,497 612 5,571 432 - - - - - - 13,820 101,100 114,920 South Carolina - - - 5,442 903 24,046 1,334 - - - - - - 40,648 162,200 202,848 Tennessee - - - 12,851 983 22,621 2,548 - - - - - - 47,062 149,000 196,062 Texas - - - 50,799 19,458 142,518 14,950 - - - - - - 236,716 885,373 1,122,089 Virginia - - - 24,136 1,525 36,977 4,336 - - - - - - 73,362 97,300 170,662 West Virginia - - - - - - - - - - - - - - - - - - - - - - - - 0 0
West: 341,454 233,844 121,766 423,855 6,608 24,695 - - - 1,225,914 3,242,266 4,468,180 Alaska - - - - - - - - - - - - - - - - - - - - - - - - 13,478 13,478 Arizona - - - - - - 2,436 25,945 - - - - - - - - - 43,837 50,730 94,567 California 279,611 150,806 93,764 231,349 2,904 16,443 - - - 795,607 2,029,541 2,825,148 Colorado 10,749 10,412 2,039 46,276 930 - - - - - - 74,756 111,500 186,256 Hawaii 17,461 16,795 13,141 1,873 - - - 266 - - - 60,099 15,626 75,725 Idaho - - - - - - - - - - - - - - - - - - - - - - - - 68,546 68,546 Montana - - - - - - - - - - - - - - - - - - - - - - - - 15,780 15,780 Nevada - - - - - - - - - - - - - - - - - - - - - - - - 16,500 16,500 New Mexico - - - 16,179 2,728 2,837 55 - - - - - - 26,481 32,104 58,585 Oregon 10,338 20,764 - - - 36,317 844 7,986 - - - 84,215 619,281 703,496 Utah - - - 8,614 5,544 21,731 224 - - - - - - 38,708 24,940 63,648 Washington 23,295 10,274 2,114 57,527 1,651 - - - - - - 102,211 240,000 342,211 Wyoming - - - - - - - - - - - - - - - - - - - - - - - - 4,240 4,240Undisclosed 5/ 16,795 4,184 787 51,257 205 1,148 - - - - - - - - - - - -
United States 431,624 758,838 511,999 1,839,575 103,564 126,675 - - - 4,096,560 9,039,918 13,136,478See footnotes at end of table. Continued--
18 Floriculture and Nursery Crops Yearbook/FLO-2006/June 2006
Economic Research Service, USDA
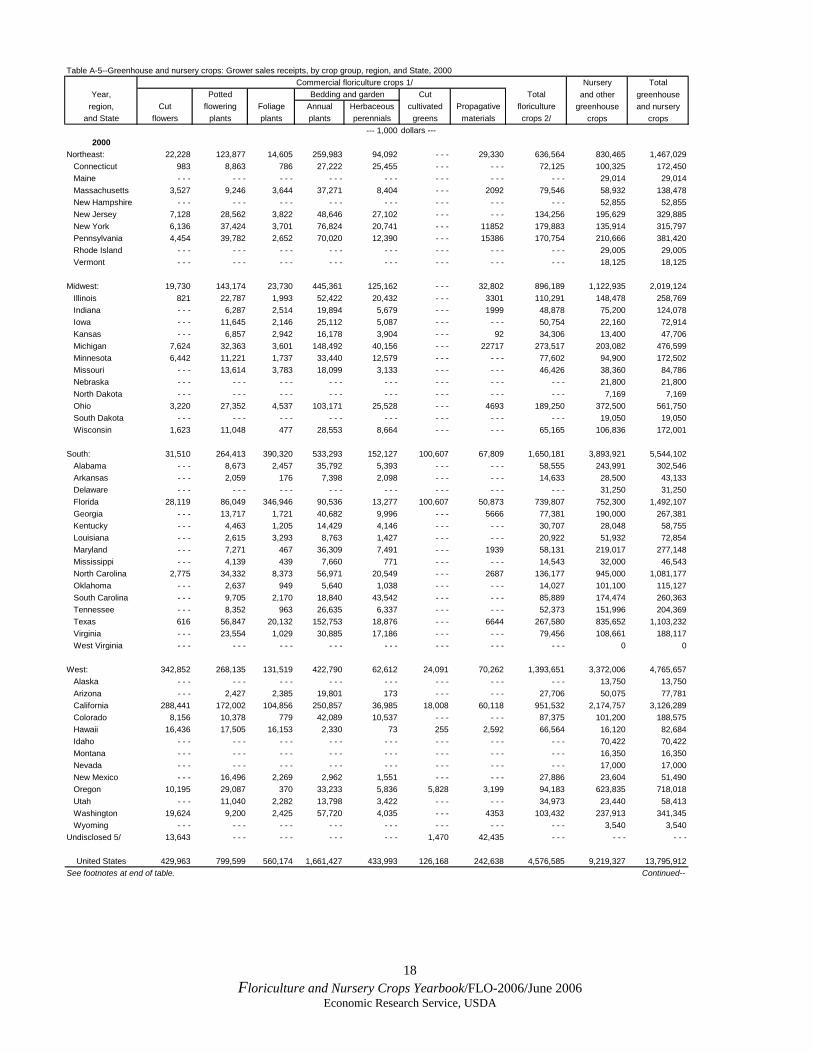
Table A-5--Greenhouse and nursery crops: Grower sales receipts, by crop group, region, and State, 2000 Commercial floriculture crops 1/ Nursery Total
Year, Potted Bedding and garden Cut Total and other greenhouseregion, Cut flowering Foliage Annual Herbaceous cultivated Propagative floriculture greenhouse and nursery
and State flowers plants plants plants perennials greens materials crops 2/ crops crops--- 1,000 dollars ---
2000Northeast: 22,228 123,877 14,605 259,983 94,092 - - - 29,330 636,564 830,465 1,467,029 Connecticut 983 8,863 786 27,222 25,455 - - - - - - 72,125 100,325 172,450 Maine - - - - - - - - - - - - - - - - - - - - - - - - 29,014 29,014 Massachusetts 3,527 9,246 3,644 37,271 8,404 - - - 2092 79,546 58,932 138,478 New Hampshire - - - - - - - - - - - - - - - - - - - - - - - - 52,855 52,855 New Jersey 7,128 28,562 3,822 48,646 27,102 - - - - - - 134,256 195,629 329,885 New York 6,136 37,424 3,701 76,824 20,741 - - - 11852 179,883 135,914 315,797 Pennsylvania 4,454 39,782 2,652 70,020 12,390 - - - 15386 170,754 210,666 381,420 Rhode Island - - - - - - - - - - - - - - - - - - - - - - - - 29,005 29,005 Vermont - - - - - - - - - - - - - - - - - - - - - - - - 18,125 18,125
Midwest: 19,730 143,174 23,730 445,361 125,162 - - - 32,802 896,189 1,122,935 2,019,124 Illinois 821 22,787 1,993 52,422 20,432 - - - 3301 110,291 148,478 258,769 Indiana - - - 6,287 2,514 19,894 5,679 - - - 1999 48,878 75,200 124,078 Iowa - - - 11,645 2,146 25,112 5,087 - - - - - - 50,754 22,160 72,914 Kansas - - - 6,857 2,942 16,178 3,904 - - - 92 34,306 13,400 47,706 Michigan 7,624 32,363 3,601 148,492 40,156 - - - 22717 273,517 203,082 476,599 Minnesota 6,442 11,221 1,737 33,440 12,579 - - - - - - 77,602 94,900 172,502 Missouri - - - 13,614 3,783 18,099 3,133 - - - - - - 46,426 38,360 84,786 Nebraska - - - - - - - - - - - - - - - - - - - - - - - - 21,800 21,800 North Dakota - - - - - - - - - - - - - - - - - - - - - - - - 7,169 7,169 Ohio 3,220 27,352 4,537 103,171 25,528 - - - 4693 189,250 372,500 561,750 South Dakota - - - - - - - - - - - - - - - - - - - - - - - - 19,050 19,050 Wisconsin 1,623 11,048 477 28,553 8,664 - - - - - - 65,165 106,836 172,001
South: 31,510 264,413 390,320 533,293 152,127 100,607 67,809 1,650,181 3,893,921 5,544,102 Alabama - - - 8,673 2,457 35,792 5,393 - - - - - - 58,555 243,991 302,546 Arkansas - - - 2,059 176 7,398 2,098 - - - - - - 14,633 28,500 43,133 Delaware - - - - - - - - - - - - - - - - - - - - - - - - 31,250 31,250 Florida 28,119 86,049 346,946 90,536 13,277 100,607 50,873 739,807 752,300 1,492,107 Georgia - - - 13,717 1,721 40,682 9,996 - - - 5666 77,381 190,000 267,381 Kentucky - - - 4,463 1,205 14,429 4,146 - - - - - - 30,707 28,048 58,755 Louisiana - - - 2,615 3,293 8,763 1,427 - - - - - - 20,922 51,932 72,854 Maryland - - - 7,271 467 36,309 7,491 - - - 1939 58,131 219,017 277,148 Mississippi - - - 4,139 439 7,660 771 - - - - - - 14,543 32,000 46,543 North Carolina 2,775 34,332 8,373 56,971 20,549 - - - 2687 136,177 945,000 1,081,177 Oklahoma - - - 2,637 949 5,640 1,038 - - - - - - 14,027 101,100 115,127 South Carolina - - - 9,705 2,170 18,840 43,542 - - - - - - 85,889 174,474 260,363 Tennessee - - - 8,352 963 26,635 6,337 - - - - - - 52,373 151,996 204,369 Texas 616 56,847 20,132 152,753 18,876 - - - 6644 267,580 835,652 1,103,232 Virginia - - - 23,554 1,029 30,885 17,186 - - - - - - 79,456 108,661 188,117 West Virginia - - - - - - - - - - - - - - - - - - - - - - - - 0 0
West: 342,852 268,135 131,519 422,790 62,612 24,091 70,262 1,393,651 3,372,006 4,765,657 Alaska - - - - - - - - - - - - - - - - - - - - - - - - 13,750 13,750 Arizona - - - 2,427 2,385 19,801 173 - - - - - - 27,706 50,075 77,781 California 288,441 172,002 104,856 250,857 36,985 18,008 60,118 951,532 2,174,757 3,126,289 Colorado 8,156 10,378 779 42,089 10,537 - - - - - - 87,375 101,200 188,575 Hawaii 16,436 17,505 16,153 2,330 73 255 2,592 66,564 16,120 82,684 Idaho - - - - - - - - - - - - - - - - - - - - - - - - 70,422 70,422 Montana - - - - - - - - - - - - - - - - - - - - - - - - 16,350 16,350 Nevada - - - - - - - - - - - - - - - - - - - - - - - - 17,000 17,000 New Mexico - - - 16,496 2,269 2,962 1,551 - - - - - - 27,886 23,604 51,490 Oregon 10,195 29,087 370 33,233 5,836 5,828 3,199 94,183 623,835 718,018 Utah - - - 11,040 2,282 13,798 3,422 - - - - - - 34,973 23,440 58,413 Washington 19,624 9,200 2,425 57,720 4,035 - - - 4353 103,432 237,913 341,345 Wyoming - - - - - - - - - - - - - - - - - - - - - - - - 3,540 3,540Undisclosed 5/ 13,643 - - - - - - - - - - - - 1,470 42,435 - - - - - - - - -
United States 429,963 799,599 560,174 1,661,427 433,993 126,168 242,638 4,576,585 9,219,327 13,795,912See footnotes at end of table. Continued--

19 Floriculture and Nursery Crops Yearbook/FLO-2006/June 2006
Economic Research Service, USDA
Table A-5--Greenhouse and nursery crops: Grower sales receipts, by crop group, region, and State, 2001 Commercial floriculture crops 1/ Nursery Total
Year, Potted Bedding and garden Cut Total and other greenhouseregion, Cut flowering Foliage Annual Herbaceous cultivated Propagative floriculture greenhouse and nursery
and State flowers plants plants plants perennials greens materials crops 2/ crops crops--- 1,000 dollars ---
2001Northeast: 21,692 133,127 16,218 249,124 102,240 - - - 51,783 656,116 852,663 1,508,779 Connecticut 990 11,954 1,356 30,466 26,486 - - - 1,048 80,175 116,310 196,485 Maine - - - - - - - - - - - - - - - - - - - - - - - - 33,651 33,651 Massachusetts 3,076 9,646 3,450 34,424 10,385 - - - 2,100 78,083 60,976 139,059 New Hampshire - - - - - - - - - - - - - - - - - - - - - - - - 51,879 51,879 New Jersey 8,533 28,789 5,552 51,094 23,896 - - - 11,520 139,003 184,678 323,681 New York 4,506 40,167 2,466 72,027 25,340 - - - 5,993 172,934 142,900 315,834 Pennsylvania 4,587 42,571 3,394 61,113 16,133 - - - 31,122 185,921 207,000 392,921 Rhode Island - - - - - - - - - - - - - - - - - - - - - - - - 34,449 34,449 Vermont - - - - - - - - - - - - - - - - - - - - - - - - 20,820 20,820
Midwest: 19,248 139,117 24,881 462,021 141,245 - - - 44,929 933,296 1,261,646 2,194,942 Illinois 1,127 26,421 3,114 56,250 19,249 - - - 2,777 117,638 150,000 267,638 Indiana - - - 5,300 2,048 25,135 5,335 - - - 3,111 52,219 83,500 135,719 Iowa - - - 11,118 2,328 27,202 6,751 - - - - - - 54,375 37,631 92,006 Kansas - - - 7,084 290 17,968 3,656 - - - 226 33,422 18,500 51,922 Michigan 8,119 29,447 3,531 143,330 44,886 - - - 33,845 280,745 235,000 515,745 Minnesota 5,193 11,868 1,825 36,492 9,899 - - - - - - 77,539 101,400 178,939 Missouri - - - 10,985 3,819 17,201 7,870 - - - - - - 47,404 49,890 97,294 Nebraska - - - - - - - - - - - - - - - - - - - - - - - - 25,800 25,800 North Dakota - - - - - - - - - - - - - - - - - - - - - - - - 8,125 8,125 Ohio 2,894 26,112 6,292 104,254 31,483 - - - 4,970 195,370 378,242 573,612 South Dakota - - - - - - - - - - - - - - - - - - - - - - - - 20,058 20,058 Wisconsin 1,915 10,782 1,634 34,189 12,116 - - - - - - 74,584 153,500 228,084
South: 27,297 245,402 479,960 554,318 171,692 87,836 94,131 1,765,716 3,936,886 5,702,602 Alabama - - - 10,004 2,044 37,453 3,485 - - - - - - 59,135 175,000 234,135 Arkansas - - - 1,845 287 11,091 - - - - - - - - - 17,025 32,500 49,525 Delaware - - - - - - - - - - - - - - - - - - - - - - - - 33,250 33,250 Florida 23,611 88,448 439,698 91,386 14,917 87,836 72,806 839,807 753,000 1,592,807 Georgia - - - 9,090 1,812 40,609 8,523 - - - 4,148 69,118 190,000 259,118 Kentucky - - - 4,827 1,691 14,467 4,799 - - - - - - 31,503 28,190 59,693 Louisiana - - - 2,538 4,336 9,502 2,380 - - - 1,519 24,003 49,195 73,198 Maryland - - - 8,417 371 38,749 7,982 - - - - - - 61,691 224,745 286,436 Mississippi - - - 3,452 576 7,565 1,760 - - - - - - 15,427 31,200 46,627 North Carolina 2,994 36,273 8,673 78,044 23,709 - - - 2,821 161,889 888,000 1,049,889 Oklahoma - - - 2,690 905 5,885 5,557 - - - - - - 18,164 121,100 139,264 South Carolina - - - 8,014 1,122 14,254 53,399 - - - - - - 88,703 178,100 266,803 Tennessee - - - 8,363 882 19,329 4,937 - - - - - - 42,649 229,339 271,988 Texas 692 37,712 16,637 154,901 23,985 - - - 12,837 257,145 978,367 1,235,512 Virginia - - - 23,729 926 31,083 16,259 - - - - - - 79,457 24,900 104,357 West Virginia - - - - - - - - - - - - - - - - - - - - - - - - 0 0
West: 337,958 307,104 129,531 415,307 77,969 21,884 76,623 1,447,427 3,541,794 4,989,221 Alaska - - - - - - - - - - - - - - - - - - - - - - - - 14,020 14,020 Arizona - - - 1,846 2,021 22,593 - - - - - - - - - 30,430 51,817 82,247 California 286,755 213,163 96,613 254,102 49,006 17,375 68,781 1,003,795 2,175,763 3,179,558 Colorado 6,442 10,056 546 39,872 8,335 - - - - - - 86,240 140,000 226,240 Hawaii 15,206 18,869 18,381 2,472 54 347 2,679 69,183 19,414 88,597 Idaho - - - - - - - - - - - - - - - - - - - - - - - - 67,400 67,400 Montana - - - - - - - - - - - - - - - - - - - - - - - - 16,860 16,860 Nevada - - - - - - - - - - - - - - - - - - - - - - - - 13,010 13,010 New Mexico - - - 17,786 4,732 3,187 2,038 - - - - - - 32,159 25,604 57,763 Oregon 10,698 28,409 1,297 25,787 9,688 4,162 - - - 91,617 739,321 830,938 Utah - - - 8,379 4,165 14,384 3,676 - - - - - - 35,604 23,940 59,544 Washington 18,857 8,596 1,776 52,910 5,172 - - - 5,163 98,399 249,000 347,399 Wyoming - - - - - - - - - - - - - - - - - - - - - - - - 5,645 5,645Undisclosed 11,908 - - - - - - - - - 2,586 2,638 46,456 - - - - - - - - -
United States 418,103 824,750 650,590 1,680,770 495,732 112,358 313,922 4,802,555 9,592,989 14,395,544See footnotes at end of table. Continued--
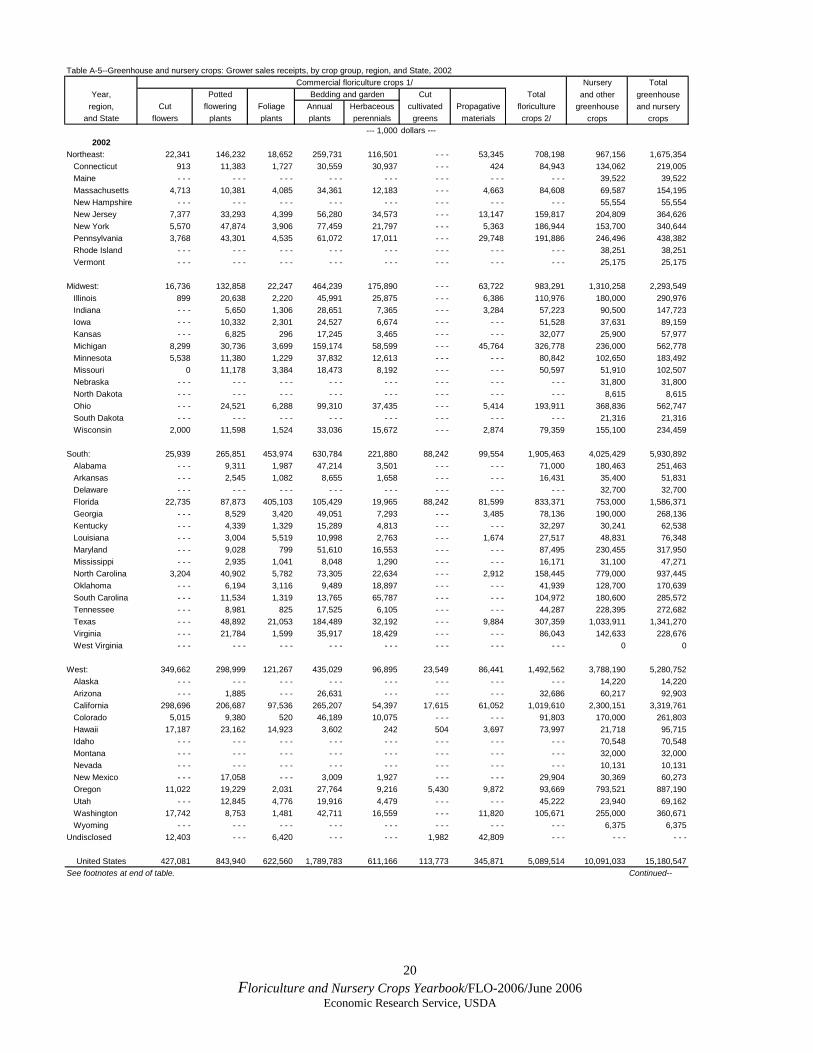
20 Floriculture and Nursery Crops Yearbook/FLO-2006/June 2006
Economic Research Service, USDA
Table A-5--Greenhouse and nursery crops: Grower sales receipts, by crop group, region, and State, 2002 Commercial floriculture crops 1/ Nursery Total
Year, Potted Bedding and garden Cut Total and other greenhouseregion, Cut flowering Foliage Annual Herbaceous cultivated Propagative floriculture greenhouse and nursery
and State flowers plants plants plants perennials greens materials crops 2/ crops crops--- 1,000 dollars ---
2002Northeast: 22,341 146,232 18,652 259,731 116,501 - - - 53,345 708,198 967,156 1,675,354 Connecticut 913 11,383 1,727 30,559 30,937 - - - 424 84,943 134,062 219,005 Maine - - - - - - - - - - - - - - - - - - - - - - - - 39,522 39,522 Massachusetts 4,713 10,381 4,085 34,361 12,183 - - - 4,663 84,608 69,587 154,195 New Hampshire - - - - - - - - - - - - - - - - - - - - - - - - 55,554 55,554 New Jersey 7,377 33,293 4,399 56,280 34,573 - - - 13,147 159,817 204,809 364,626 New York 5,570 47,874 3,906 77,459 21,797 - - - 5,363 186,944 153,700 340,644 Pennsylvania 3,768 43,301 4,535 61,072 17,011 - - - 29,748 191,886 246,496 438,382 Rhode Island - - - - - - - - - - - - - - - - - - - - - - - - 38,251 38,251 Vermont - - - - - - - - - - - - - - - - - - - - - - - - 25,175 25,175
Midwest: 16,736 132,858 22,247 464,239 175,890 - - - 63,722 983,291 1,310,258 2,293,549 Illinois 899 20,638 2,220 45,991 25,875 - - - 6,386 110,976 180,000 290,976 Indiana - - - 5,650 1,306 28,651 7,365 - - - 3,284 57,223 90,500 147,723 Iowa - - - 10,332 2,301 24,527 6,674 - - - - - - 51,528 37,631 89,159 Kansas - - - 6,825 296 17,245 3,465 - - - - - - 32,077 25,900 57,977 Michigan 8,299 30,736 3,699 159,174 58,599 - - - 45,764 326,778 236,000 562,778 Minnesota 5,538 11,380 1,229 37,832 12,613 - - - - - - 80,842 102,650 183,492 Missouri 0 11,178 3,384 18,473 8,192 - - - - - - 50,597 51,910 102,507 Nebraska - - - - - - - - - - - - - - - - - - - - - - - - 31,800 31,800 North Dakota - - - - - - - - - - - - - - - - - - - - - - - - 8,615 8,615 Ohio - - - 24,521 6,288 99,310 37,435 - - - 5,414 193,911 368,836 562,747 South Dakota - - - - - - - - - - - - - - - - - - - - - - - - 21,316 21,316 Wisconsin 2,000 11,598 1,524 33,036 15,672 - - - 2,874 79,359 155,100 234,459
South: 25,939 265,851 453,974 630,784 221,880 88,242 99,554 1,905,463 4,025,429 5,930,892 Alabama - - - 9,311 1,987 47,214 3,501 - - - - - - 71,000 180,463 251,463 Arkansas - - - 2,545 1,082 8,655 1,658 - - - - - - 16,431 35,400 51,831 Delaware - - - - - - - - - - - - - - - - - - - - - - - - 32,700 32,700 Florida 22,735 87,873 405,103 105,429 19,965 88,242 81,599 833,371 753,000 1,586,371 Georgia - - - 8,529 3,420 49,051 7,293 - - - 3,485 78,136 190,000 268,136 Kentucky - - - 4,339 1,329 15,289 4,813 - - - - - - 32,297 30,241 62,538 Louisiana - - - 3,004 5,519 10,998 2,763 - - - 1,674 27,517 48,831 76,348 Maryland - - - 9,028 799 51,610 16,553 - - - - - - 87,495 230,455 317,950 Mississippi - - - 2,935 1,041 8,048 1,290 - - - - - - 16,171 31,100 47,271 North Carolina 3,204 40,902 5,782 73,305 22,634 - - - 2,912 158,445 779,000 937,445 Oklahoma - - - 6,194 3,116 9,489 18,897 - - - - - - 41,939 128,700 170,639 South Carolina - - - 11,534 1,319 13,765 65,787 - - - - - - 104,972 180,600 285,572 Tennessee - - - 8,981 825 17,525 6,105 - - - - - - 44,287 228,395 272,682 Texas - - - 48,892 21,053 184,489 32,192 - - - 9,884 307,359 1,033,911 1,341,270 Virginia - - - 21,784 1,599 35,917 18,429 - - - - - - 86,043 142,633 228,676 West Virginia - - - - - - - - - - - - - - - - - - - - - - - - 0 0
West: 349,662 298,999 121,267 435,029 96,895 23,549 86,441 1,492,562 3,788,190 5,280,752 Alaska - - - - - - - - - - - - - - - - - - - - - - - - 14,220 14,220 Arizona - - - 1,885 - - - 26,631 - - - - - - - - - 32,686 60,217 92,903 California 298,696 206,687 97,536 265,207 54,397 17,615 61,052 1,019,610 2,300,151 3,319,761 Colorado 5,015 9,380 520 46,189 10,075 - - - - - - 91,803 170,000 261,803 Hawaii 17,187 23,162 14,923 3,602 242 504 3,697 73,997 21,718 95,715 Idaho - - - - - - - - - - - - - - - - - - - - - - - - 70,548 70,548 Montana - - - - - - - - - - - - - - - - - - - - - - - - 32,000 32,000 Nevada - - - - - - - - - - - - - - - - - - - - - - - - 10,131 10,131 New Mexico - - - 17,058 - - - 3,009 1,927 - - - - - - 29,904 30,369 60,273 Oregon 11,022 19,229 2,031 27,764 9,216 5,430 9,872 93,669 793,521 887,190 Utah - - - 12,845 4,776 19,916 4,479 - - - - - - 45,222 23,940 69,162 Washington 17,742 8,753 1,481 42,711 16,559 - - - 11,820 105,671 255,000 360,671 Wyoming - - - - - - - - - - - - - - - - - - - - - - - - 6,375 6,375Undisclosed 12,403 - - - 6,420 - - - - - - 1,982 42,809 - - - - - - - - -
United States 427,081 843,940 622,560 1,789,783 611,166 113,773 345,871 5,089,514 10,091,033 15,180,547See footnotes at end of table. Continued--
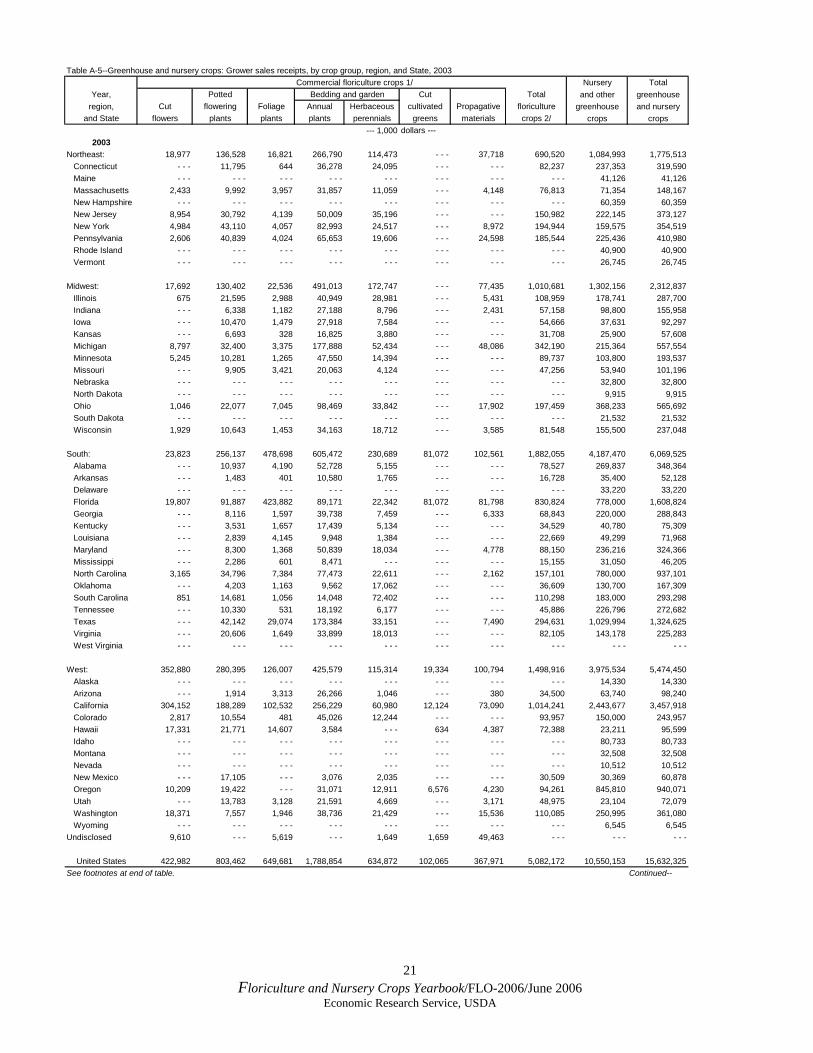
21 Floriculture and Nursery Crops Yearbook/FLO-2006/June 2006
Economic Research Service, USDA
Table A-5--Greenhouse and nursery crops: Grower sales receipts, by crop group, region, and State, 2003 Commercial floriculture crops 1/ Nursery Total
Year, Potted Bedding and garden Cut Total and other greenhouseregion, Cut flowering Foliage Annual Herbaceous cultivated Propagative floriculture greenhouse and nursery
and State flowers plants plants plants perennials greens materials crops 2/ crops crops--- 1,000 dollars ---
2003Northeast: 18,977 136,528 16,821 266,790 114,473 - - - 37,718 690,520 1,084,993 1,775,513 Connecticut - - - 11,795 644 36,278 24,095 - - - - - - 82,237 237,353 319,590 Maine - - - - - - - - - - - - - - - - - - - - - - - - 41,126 41,126 Massachusetts 2,433 9,992 3,957 31,857 11,059 - - - 4,148 76,813 71,354 148,167 New Hampshire - - - - - - - - - - - - - - - - - - - - - - - - 60,359 60,359 New Jersey 8,954 30,792 4,139 50,009 35,196 - - - - - - 150,982 222,145 373,127 New York 4,984 43,110 4,057 82,993 24,517 - - - 8,972 194,944 159,575 354,519 Pennsylvania 2,606 40,839 4,024 65,653 19,606 - - - 24,598 185,544 225,436 410,980 Rhode Island - - - - - - - - - - - - - - - - - - - - - - - - 40,900 40,900 Vermont - - - - - - - - - - - - - - - - - - - - - - - - 26,745 26,745
Midwest: 17,692 130,402 22,536 491,013 172,747 - - - 77,435 1,010,681 1,302,156 2,312,837 Illinois 675 21,595 2,988 40,949 28,981 - - - 5,431 108,959 178,741 287,700 Indiana - - - 6,338 1,182 27,188 8,796 - - - 2,431 57,158 98,800 155,958 Iowa - - - 10,470 1,479 27,918 7,584 - - - - - - 54,666 37,631 92,297 Kansas - - - 6,693 328 16,825 3,880 - - - - - - 31,708 25,900 57,608 Michigan 8,797 32,400 3,375 177,888 52,434 - - - 48,086 342,190 215,364 557,554 Minnesota 5,245 10,281 1,265 47,550 14,394 - - - - - - 89,737 103,800 193,537 Missouri - - - 9,905 3,421 20,063 4,124 - - - - - - 47,256 53,940 101,196 Nebraska - - - - - - - - - - - - - - - - - - - - - - - - 32,800 32,800 North Dakota - - - - - - - - - - - - - - - - - - - - - - - - 9,915 9,915 Ohio 1,046 22,077 7,045 98,469 33,842 - - - 17,902 197,459 368,233 565,692 South Dakota - - - - - - - - - - - - - - - - - - - - - - - - 21,532 21,532 Wisconsin 1,929 10,643 1,453 34,163 18,712 - - - 3,585 81,548 155,500 237,048
South: 23,823 256,137 478,698 605,472 230,689 81,072 102,561 1,882,055 4,187,470 6,069,525 Alabama - - - 10,937 4,190 52,728 5,155 - - - - - - 78,527 269,837 348,364 Arkansas - - - 1,483 401 10,580 1,765 - - - - - - 16,728 35,400 52,128 Delaware - - - - - - - - - - - - - - - - - - - - - - - - 33,220 33,220 Florida 19,807 91,887 423,882 89,171 22,342 81,072 81,798 830,824 778,000 1,608,824 Georgia - - - 8,116 1,597 39,738 7,459 - - - 6,333 68,843 220,000 288,843 Kentucky - - - 3,531 1,657 17,439 5,134 - - - - - - 34,529 40,780 75,309 Louisiana - - - 2,839 4,145 9,948 1,384 - - - - - - 22,669 49,299 71,968 Maryland - - - 8,300 1,368 50,839 18,034 - - - 4,778 88,150 236,216 324,366 Mississippi - - - 2,286 601 8,471 - - - - - - - - - 15,155 31,050 46,205 North Carolina 3,165 34,796 7,384 77,473 22,611 - - - 2,162 157,101 780,000 937,101 Oklahoma - - - 4,203 1,163 9,562 17,062 - - - - - - 36,609 130,700 167,309 South Carolina 851 14,681 1,056 14,048 72,402 - - - - - - 110,298 183,000 293,298 Tennessee - - - 10,330 531 18,192 6,177 - - - - - - 45,886 226,796 272,682 Texas - - - 42,142 29,074 173,384 33,151 - - - 7,490 294,631 1,029,994 1,324,625 Virginia - - - 20,606 1,649 33,899 18,013 - - - - - - 82,105 143,178 225,283 West Virginia - - - - - - - - - - - - - - - - - - - - - - - - - - - - - -
West: 352,880 280,395 126,007 425,579 115,314 19,334 100,794 1,498,916 3,975,534 5,474,450 Alaska - - - - - - - - - - - - - - - - - - - - - - - - 14,330 14,330 Arizona - - - 1,914 3,313 26,266 1,046 - - - 380 34,500 63,740 98,240 California 304,152 188,289 102,532 256,229 60,980 12,124 73,090 1,014,241 2,443,677 3,457,918 Colorado 2,817 10,554 481 45,026 12,244 - - - - - - 93,957 150,000 243,957 Hawaii 17,331 21,771 14,607 3,584 - - - 634 4,387 72,388 23,211 95,599 Idaho - - - - - - - - - - - - - - - - - - - - - - - - 80,733 80,733 Montana - - - - - - - - - - - - - - - - - - - - - - - - 32,508 32,508 Nevada - - - - - - - - - - - - - - - - - - - - - - - - 10,512 10,512 New Mexico - - - 17,105 - - - 3,076 2,035 - - - - - - 30,509 30,369 60,878 Oregon 10,209 19,422 - - - 31,071 12,911 6,576 4,230 94,261 845,810 940,071 Utah - - - 13,783 3,128 21,591 4,669 - - - 3,171 48,975 23,104 72,079 Washington 18,371 7,557 1,946 38,736 21,429 - - - 15,536 110,085 250,995 361,080 Wyoming - - - - - - - - - - - - - - - - - - - - - - - - 6,545 6,545Undisclosed 9,610 - - - 5,619 - - - 1,649 1,659 49,463 - - - - - - - - -
United States 422,982 803,462 649,681 1,788,854 634,872 102,065 367,971 5,082,172 10,550,153 15,632,325See footnotes at end of table. Continued--
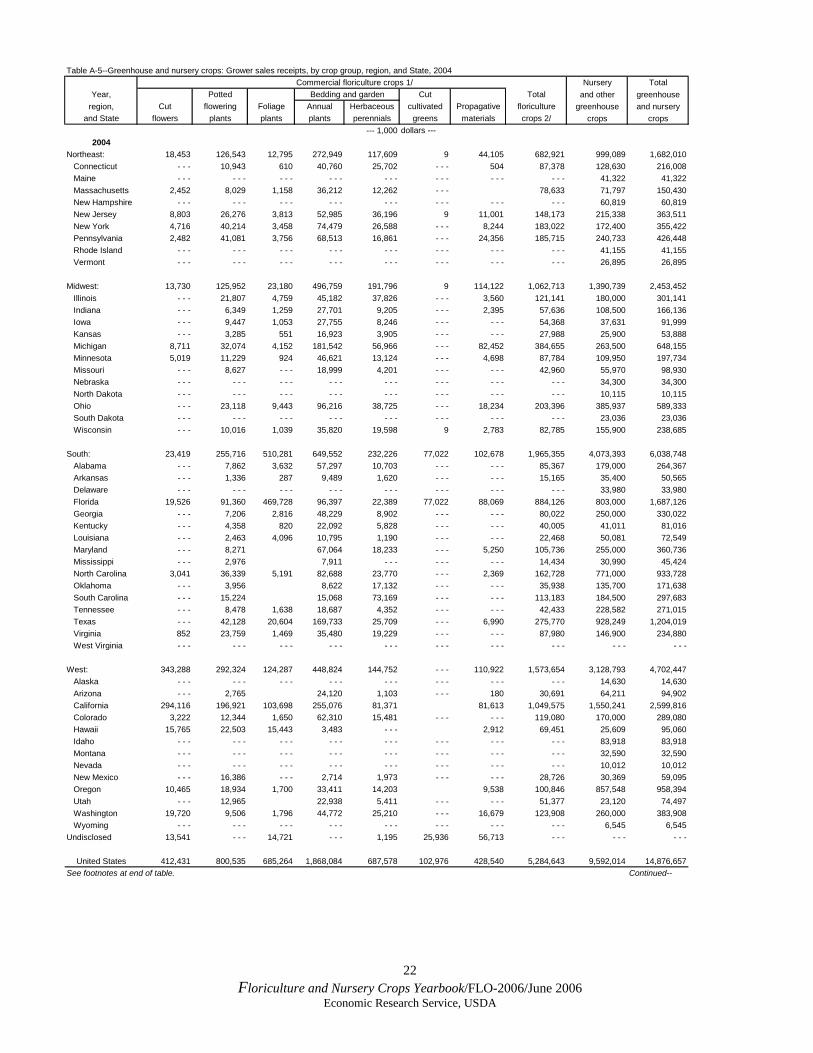
22 Floriculture and Nursery Crops Yearbook/FLO-2006/June 2006
Economic Research Service, USDA
Table A-5--Greenhouse and nursery crops: Grower sales receipts, by crop group, region, and State, 2004Commercial floriculture crops 1/ Nursery Total
Year, Potted Bedding and garden Cut Total and other greenhouseregion, Cut flowering Foliage Annual Herbaceous cultivated Propagative floriculture greenhouse and nursery
and State flowers plants plants plants perennials greens materials crops 2/ crops crops--- 1,000 dollars ---
2004Northeast: 18,453 126,543 12,795 272,949 117,609 9 44,105 682,921 999,089 1,682,010 Connecticut - - - 10,943 610 40,760 25,702 - - - 504 87,378 128,630 216,008 Maine - - - - - - - - - - - - - - - - - - - - - - - - 41,322 41,322 Massachusetts 2,452 8,029 1,158 36,212 12,262 - - - 78,633 71,797 150,430 New Hampshire - - - - - - - - - - - - - - - - - - - - - - - - 60,819 60,819 New Jersey 8,803 26,276 3,813 52,985 36,196 9 11,001 148,173 215,338 363,511 New York 4,716 40,214 3,458 74,479 26,588 - - - 8,244 183,022 172,400 355,422 Pennsylvania 2,482 41,081 3,756 68,513 16,861 - - - 24,356 185,715 240,733 426,448 Rhode Island - - - - - - - - - - - - - - - - - - - - - - - - 41,155 41,155 Vermont - - - - - - - - - - - - - - - - - - - - - - - - 26,895 26,895
Midwest: 13,730 125,952 23,180 496,759 191,796 9 114,122 1,062,713 1,390,739 2,453,452 Illinois - - - 21,807 4,759 45,182 37,826 - - - 3,560 121,141 180,000 301,141 Indiana - - - 6,349 1,259 27,701 9,205 - - - 2,395 57,636 108,500 166,136 Iowa - - - 9,447 1,053 27,755 8,246 - - - - - - 54,368 37,631 91,999 Kansas - - - 3,285 551 16,923 3,905 - - - - - - 27,988 25,900 53,888 Michigan 8,711 32,074 4,152 181,542 56,966 - - - 82,452 384,655 263,500 648,155 Minnesota 5,019 11,229 924 46,621 13,124 - - - 4,698 87,784 109,950 197,734 Missouri - - - 8,627 - - - 18,999 4,201 - - - - - - 42,960 55,970 98,930 Nebraska - - - - - - - - - - - - - - - - - - - - - - - - 34,300 34,300 North Dakota - - - - - - - - - - - - - - - - - - - - - - - - 10,115 10,115 Ohio - - - 23,118 9,443 96,216 38,725 - - - 18,234 203,396 385,937 589,333 South Dakota - - - - - - - - - - - - - - - - - - - - - - - - 23,036 23,036 Wisconsin - - - 10,016 1,039 35,820 19,598 9 2,783 82,785 155,900 238,685
South: 23,419 255,716 510,281 649,552 232,226 77,022 102,678 1,965,355 4,073,393 6,038,748 Alabama - - - 7,862 3,632 57,297 10,703 - - - - - - 85,367 179,000 264,367 Arkansas - - - 1,336 287 9,489 1,620 - - - - - - 15,165 35,400 50,565 Delaware - - - - - - - - - - - - - - - - - - - - - - - - 33,980 33,980 Florida 19,526 91,360 469,728 96,397 22,389 77,022 88,069 884,126 803,000 1,687,126 Georgia - - - 7,206 2,816 48,229 8,902 - - - - - - 80,022 250,000 330,022 Kentucky - - - 4,358 820 22,092 5,828 - - - - - - 40,005 41,011 81,016 Louisiana - - - 2,463 4,096 10,795 1,190 - - - - - - 22,468 50,081 72,549 Maryland - - - 8,271 67,064 18,233 - - - 5,250 105,736 255,000 360,736 Mississippi - - - 2,976 7,911 - - - - - - - - - 14,434 30,990 45,424 North Carolina 3,041 36,339 5,191 82,688 23,770 - - - 2,369 162,728 771,000 933,728 Oklahoma - - - 3,956 8,622 17,132 - - - - - - 35,938 135,700 171,638 South Carolina - - - 15,224 15,068 73,169 - - - - - - 113,183 184,500 297,683 Tennessee - - - 8,478 1,638 18,687 4,352 - - - - - - 42,433 228,582 271,015 Texas - - - 42,128 20,604 169,733 25,709 - - - 6,990 275,770 928,249 1,204,019 Virginia 852 23,759 1,469 35,480 19,229 - - - - - - 87,980 146,900 234,880 West Virginia - - - - - - - - - - - - - - - - - - - - - - - - - - - - - -
West: 343,288 292,324 124,287 448,824 144,752 - - - 110,922 1,573,654 3,128,793 4,702,447 Alaska - - - - - - - - - - - - - - - - - - - - - - - - 14,630 14,630 Arizona - - - 2,765 24,120 1,103 - - - 180 30,691 64,211 94,902 California 294,116 196,921 103,698 255,076 81,371 81,613 1,049,575 1,550,241 2,599,816 Colorado 3,222 12,344 1,650 62,310 15,481 - - - - - - 119,080 170,000 289,080 Hawaii 15,765 22,503 15,443 3,483 - - - 2,912 69,451 25,609 95,060 Idaho - - - - - - - - - - - - - - - - - - - - - - - - 83,918 83,918 Montana - - - - - - - - - - - - - - - - - - - - - - - - 32,590 32,590 Nevada - - - - - - - - - - - - - - - - - - - - - - - - 10,012 10,012 New Mexico - - - 16,386 - - - 2,714 1,973 - - - - - - 28,726 30,369 59,095 Oregon 10,465 18,934 1,700 33,411 14,203 9,538 100,846 857,548 958,394 Utah - - - 12,965 22,938 5,411 - - - - - - 51,377 23,120 74,497 Washington 19,720 9,506 1,796 44,772 25,210 - - - 16,679 123,908 260,000 383,908 Wyoming - - - - - - - - - - - - - - - - - - - - - - - - 6,545 6,545Undisclosed 13,541 - - - 14,721 - - - 1,195 25,936 56,713 - - - - - - - - -
United States 412,431 800,535 685,264 1,868,084 687,578 102,976 428,540 5,284,643 9,592,014 14,876,657See footnotes at end of table. Continued--
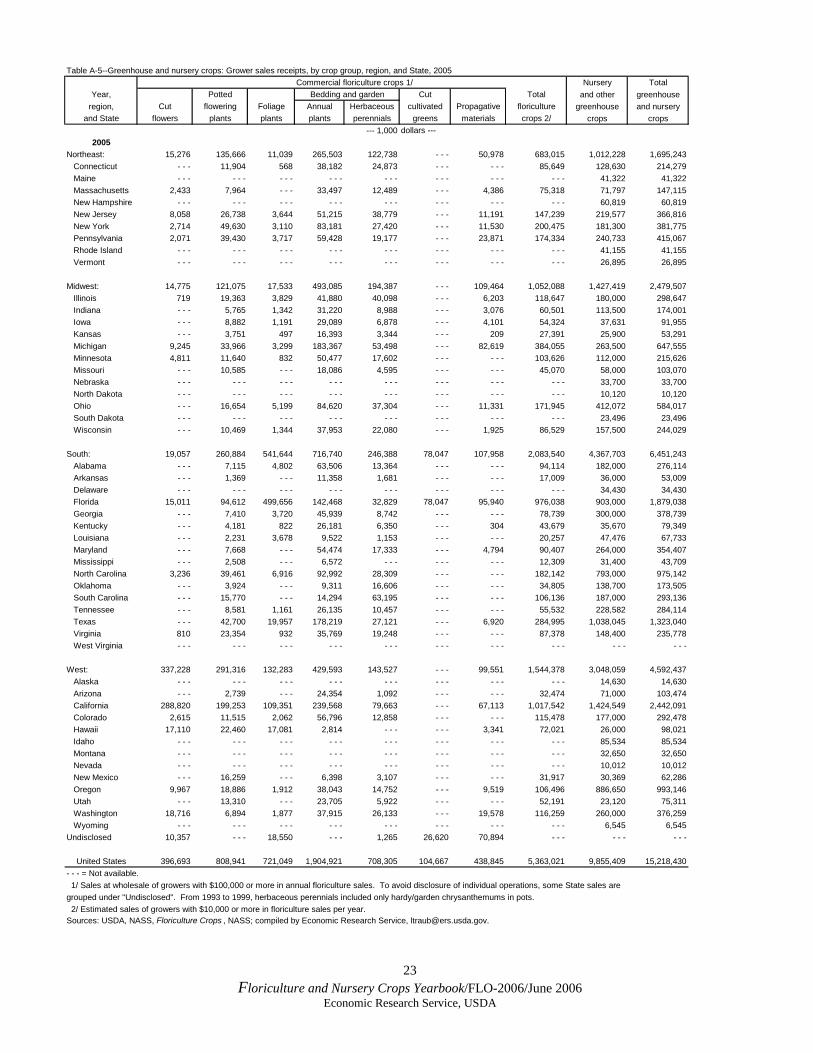
23 Floriculture and Nursery Crops Yearbook/FLO-2006/June 2006
Economic Research Service, USDA
Table A-5--Greenhouse and nursery crops: Grower sales receipts, by crop group, region, and State, 2005 Commercial floriculture crops 1/ Nursery Total
Year, Potted Bedding and garden Cut Total and other greenhouseregion, Cut flowering Foliage Annual Herbaceous cultivated Propagative floriculture greenhouse and nursery
and State flowers plants plants plants perennials greens materials crops 2/ crops crops--- 1,000 dollars ---
2005Northeast: 15,276 135,666 11,039 265,503 122,738 - - - 50,978 683,015 1,012,228 1,695,243 Connecticut - - - 11,904 568 38,182 24,873 - - - - - - 85,649 128,630 214,279 Maine - - - - - - - - - - - - - - - - - - - - - - - - 41,322 41,322 Massachusetts 2,433 7,964 - - - 33,497 12,489 - - - 4,386 75,318 71,797 147,115 New Hampshire - - - - - - - - - - - - - - - - - - - - - - - - 60,819 60,819 New Jersey 8,058 26,738 3,644 51,215 38,779 - - - 11,191 147,239 219,577 366,816 New York 2,714 49,630 3,110 83,181 27,420 - - - 11,530 200,475 181,300 381,775 Pennsylvania 2,071 39,430 3,717 59,428 19,177 - - - 23,871 174,334 240,733 415,067 Rhode Island - - - - - - - - - - - - - - - - - - - - - - - - 41,155 41,155 Vermont - - - - - - - - - - - - - - - - - - - - - - - - 26,895 26,895
Midwest: 14,775 121,075 17,533 493,085 194,387 - - - 109,464 1,052,088 1,427,419 2,479,507 Illinois 719 19,363 3,829 41,880 40,098 - - - 6,203 118,647 180,000 298,647 Indiana - - - 5,765 1,342 31,220 8,988 - - - 3,076 60,501 113,500 174,001 Iowa - - - 8,882 1,191 29,089 6,878 - - - 4,101 54,324 37,631 91,955 Kansas - - - 3,751 497 16,393 3,344 - - - 209 27,391 25,900 53,291 Michigan 9,245 33,966 3,299 183,367 53,498 - - - 82,619 384,055 263,500 647,555 Minnesota 4,811 11,640 832 50,477 17,602 - - - - - - 103,626 112,000 215,626 Missouri - - - 10,585 - - - 18,086 4,595 - - - - - - 45,070 58,000 103,070 Nebraska - - - - - - - - - - - - - - - - - - - - - - - - 33,700 33,700 North Dakota - - - - - - - - - - - - - - - - - - - - - - - - 10,120 10,120 Ohio - - - 16,654 5,199 84,620 37,304 - - - 11,331 171,945 412,072 584,017 South Dakota - - - - - - - - - - - - - - - - - - - - - - - - 23,496 23,496 Wisconsin - - - 10,469 1,344 37,953 22,080 - - - 1,925 86,529 157,500 244,029
South: 19,057 260,884 541,644 716,740 246,388 78,047 107,958 2,083,540 4,367,703 6,451,243 Alabama - - - 7,115 4,802 63,506 13,364 - - - - - - 94,114 182,000 276,114 Arkansas - - - 1,369 - - - 11,358 1,681 - - - - - - 17,009 36,000 53,009 Delaware - - - - - - - - - - - - - - - - - - - - - - - - 34,430 34,430 Florida 15,011 94,612 499,656 142,468 32,829 78,047 95,940 976,038 903,000 1,879,038 Georgia - - - 7,410 3,720 45,939 8,742 - - - - - - 78,739 300,000 378,739 Kentucky - - - 4,181 822 26,181 6,350 - - - 304 43,679 35,670 79,349 Louisiana - - - 2,231 3,678 9,522 1,153 - - - - - - 20,257 47,476 67,733 Maryland - - - 7,668 - - - 54,474 17,333 - - - 4,794 90,407 264,000 354,407 Mississippi - - - 2,508 - - - 6,572 - - - - - - - - - 12,309 31,400 43,709 North Carolina 3,236 39,461 6,916 92,992 28,309 - - - - - - 182,142 793,000 975,142 Oklahoma - - - 3,924 - - - 9,311 16,606 - - - - - - 34,805 138,700 173,505 South Carolina - - - 15,770 - - - 14,294 63,195 - - - - - - 106,136 187,000 293,136 Tennessee - - - 8,581 1,161 26,135 10,457 - - - - - - 55,532 228,582 284,114 Texas - - - 42,700 19,957 178,219 27,121 - - - 6,920 284,995 1,038,045 1,323,040 Virginia 810 23,354 932 35,769 19,248 - - - - - - 87,378 148,400 235,778 West Virginia - - - - - - - - - - - - - - - - - - - - - - - - - - - - - -
West: 337,228 291,316 132,283 429,593 143,527 - - - 99,551 1,544,378 3,048,059 4,592,437 Alaska - - - - - - - - - - - - - - - - - - - - - - - - 14,630 14,630 Arizona - - - 2,739 - - - 24,354 1,092 - - - - - - 32,474 71,000 103,474 California 288,820 199,253 109,351 239,568 79,663 - - - 67,113 1,017,542 1,424,549 2,442,091 Colorado 2,615 11,515 2,062 56,796 12,858 - - - - - - 115,478 177,000 292,478 Hawaii 17,110 22,460 17,081 2,814 - - - - - - 3,341 72,021 26,000 98,021 Idaho - - - - - - - - - - - - - - - - - - - - - - - - 85,534 85,534 Montana - - - - - - - - - - - - - - - - - - - - - - - - 32,650 32,650 Nevada - - - - - - - - - - - - - - - - - - - - - - - - 10,012 10,012 New Mexico - - - 16,259 - - - 6,398 3,107 - - - - - - 31,917 30,369 62,286 Oregon 9,967 18,886 1,912 38,043 14,752 - - - 9,519 106,496 886,650 993,146 Utah - - - 13,310 - - - 23,705 5,922 - - - - - - 52,191 23,120 75,311 Washington 18,716 6,894 1,877 37,915 26,133 - - - 19,578 116,259 260,000 376,259 Wyoming - - - - - - - - - - - - - - - - - - - - - - - - 6,545 6,545Undisclosed 10,357 - - - 18,550 - - - 1,265 26,620 70,894 - - - - - - - - -
United States 396,693 808,941 721,049 1,904,921 708,305 104,667 438,845 5,363,021 9,855,409 15,218,430- - - = Not available. 1/ Sales at wholesale of growers with $100,000 or more in annual floriculture sales. To avoid disclosure of individual operations, some State sales aregrouped under "Undisclosed". From 1993 to 1999, herbaceous perennials included only hardy/garden chrysanthemums in pots. 2/ Estimated sales of growers with $10,000 or more in floriculture sales per year.Sources: USDA, NASS, Floriculture Crops , NASS; compiled by Economic Research Service, [email protected].

24 Floriculture and Nursery Crops Yearbook/FLO-2006/June 2006
Economic Research Service, USDA
Table A-6--Nursery and other greenhouse crops: Grower sales receipts, by State, 1996 to date 1/ State 1996 1997 1998 1999 2000 2001 2002 2003 2004 2005p
--- 1,000 dollars ---
Alabama 134,000 135,000 135,000 140,000 243,991 175,000 180,463 269,837 179,000 182,000 Alaska 12,087 11,099 13,212 13,478 13,750 14,020 14,220 14,330 14,630 14,630 Arizona 45,458 47,084 48,470 50,730 50,103 51,817 60,217 63,740 64,211 71,000 Arkansas 15,400 16,500 19,500 24,500 28,500 32,500 35,400 35,400 35,400 36,000 California 1,622,748 1,793,502 1,791,455 2,029,541 2,174,757 2,175,763 2,300,151 2,443,677 1,550,241 1,424,549 Colorado 101,500 122,000 116,800 111,500 101,200 140,000 170,000 150,000 170,000 177,000 Connecticut 78,250 77,683 96,243 98,236 100,325 116,310 134,062 237,353 128,630 128,630 Delaware 28,795 28,857 29,612 30,200 31,250 33,250 32,700 33,220 33,980 34,430 Florida 577,000 710,000 731,000 746,000 752,300 753,000 753,000 778,000 803,000 903,000 Georgia 140,000 155,000 165,000 185,000 190,000 190,000 190,000 220,000 250,000 300,000
Hawaii 18,183 14,662 18,405 15,626 16,120 19,414 21,718 23,211 25,609 26,000 Idaho 49,843 62,940 63,213 68,546 70,422 67,400 70,548 80,733 83,918 85,534 Illinois 150,000 150,000 150,000 150,000 148,478 150,000 180,000 178,741 180,000 180,000 Indiana 44,000 49,600 59,500 67,300 75,200 83,500 90,500 98,800 108,500 113,500 Iowa 27,179 22,505 22,310 22,100 22,160 37,631 37,631 37,631 37,631 37,631 Kansas 11,440 12,100 12,400 12,400 13,400 18,500 25,900 25,900 25,900 25,900 Kentucky 30,500 34,000 32,000 26,760 28,040 28,190 30,241 40,780 41,011 35,670 Louisiana 43,243 48,970 66,514 49,030 51,936 49,195 48,831 49,299 50,081 47,476 Maine 28,700 29,772 23,013 23,430 29,014 33,651 39,522 41,126 41,322 41,322 Maryland 206,540 209,050 211,550 213,310 219,015 224,745 230,455 236,216 255,000 264,000
Massachusetts 78,300 41,890 39,982 53,484 58,932 60,976 69,587 71,354 71,797 71,797 Michigan 268,000 278,000 280,000 311,000 203,095 235,000 236,000 215,364 263,500 263,500 Minnesota 81,000 89,600 91,850 93,800 94,900 101,400 102,650 103,800 109,950 112,000 Mississippi 31,400 32,500 32,000 32,200 32,000 31,200 31,100 31,050 30,990 31,400 Missouri 36,280 37,000 37,820 37,840 38,360 49,890 51,910 53,940 55,970 58,000 Montana 19,000 20,000 18,840 16,160 16,700 16,860 32,000 32,508 32,590 32,650 Nebraska 20,100 21,800 21,800 21,800 21,800 25,800 31,800 32,800 34,300 33,700 Nevada 13,500 15,600 16,200 16,500 17,000 13,010 10,131 10,512 10,012 10,012 New Hampshire 43,100 44,900 51,592 52,560 52,855 51,879 55,554 60,359 60,819 60,819 New Jersey 167,222 154,482 164,756 173,508 195,629 184,678 204,809 222,145 215,338 219,577
New Mexico 23,674 26,674 30,604 32,104 23,604 25,604 30,369 30,369 30,369 30,369 New York 110,300 113,200 125,300 131,200 135,914 142,900 153,700 159,575 172,400 181,300 North Carolina 880,000 901,000 920,000 932,000 945,000 888,000 779,000 780,000 771,000 793,000 North Dakota 9,185 9,669 6,669 7,169 7,169 8,125 8,615 9,915 10,115 10,120 Ohio 375,951 372,872 390,225 395,237 372,500 378,242 368,836 368,233 385,937 412,072 Oklahoma 150,400 126,100 96,100 101,100 101,100 121,100 128,700 130,700 135,700 138,700 Oregon 463,752 500,115 547,692 619,281 623,833 739,321 793,521 845,810 857,548 886,650 Pennsylvania 230,022 270,400 236,060 206,650 210,668 207,000 246,496 225,436 240,733 240,733 Rhode Island 43,200 30,962 28,300 28,865 29,005 34,449 38,251 40,900 41,155 41,155 South Carolina 137,500 137,000 147,100 162,200 174,474 178,100 180,600 183,000 184,500 187,000
South Dakota 20,540 17,247 18,150 19,055 19,050 20,058 21,316 21,532 23,036 23,496 Tennessee 154,852 144,000 142,000 149,000 152,000 229,339 228,395 226,796 228,582 228,582 Texas 689,699 870,972 935,746 885,373 835,652 978,367 1,033,911 1,029,994 928,249 1,038,045 Utah 21,420 23,440 25,942 24,940 23,440 23,940 23,940 23,104 23,120 23,120 Vermont 30,650 18,588 17,650 18,000 18,125 20,820 25,175 26,745 26,895 26,895 Virginia 86,125 89,400 93,700 97,300 108,700 24,900 142,633 143,178 146,900 148,400 Washington 218,548 215,000 223,000 240,000 237,913 249,000 255,000 250,995 260,000 260,000 West Virginia - - - - - - - - - - - - - - - - - - - - - - - - - - - - - - Wisconsin 121,000 113,400 88,600 100,045 106,845 153,500 155,100 155,500 155,900 157,500 Wyoming 3,100 2,840 4,945 4,240 3,540 5,645 6,375 6,545 6,545 6,545
United States 7,892,686 8,448,975 8,637,820 9,040,298 9,219,764 9,592,989 10,091,033 10,550,153 9,592,014 9,855,409
Northeast 809,744 781,877 782,896 785,933 830,467 852,663 967,156 1,084,993 999,089 1,012,228Midwest 1,164,675 1,173,793 1,179,324 1,237,746 1,122,957 1,261,646 1,310,258 1,302,156 1,390,739 1,427,419South 3,290,054 3,621,849 3,737,322 3,749,473 3,865,458 3,904,386 3,990,029 4,152,070 4,037,993 4,331,703West 2,628,213 2,871,456 2,938,278 3,267,146 3,400,882 3,574,294 3,823,590 4,010,934 3,164,193 3,084,059- - - = Not available or not released; p = preliminary.1/ Estimated as the difference between total cash receipts from greenhouse and nursery crops in table 1 and wholesale floriculture sales in table 9. May include Christmas trees, vegetables for commercial harvest or transplant, turfgrass sod, dried bulbs, mushrooms, seeds, food crops, aquatic plants, and unfinished plants.Source: USDA, compiled by Economic Research Service, [email protected].
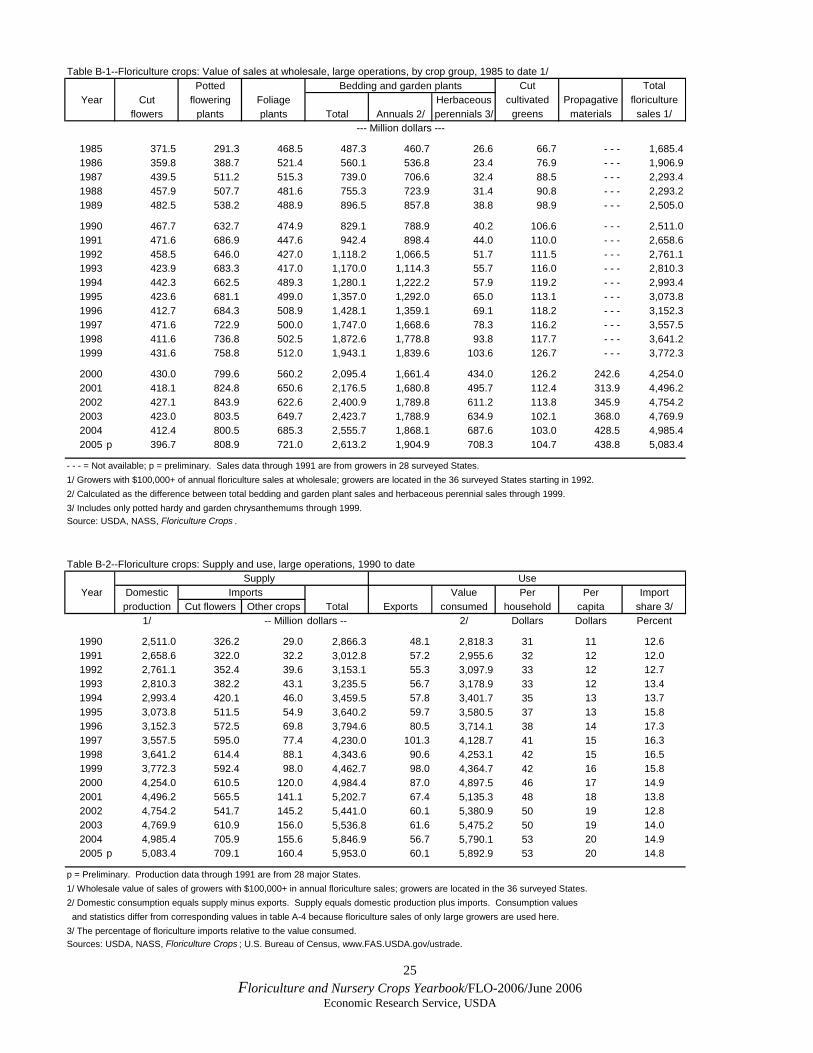
25 Floriculture and Nursery Crops Yearbook/FLO-2006/June 2006
Economic Research Service, USDA
Table B-1--Floriculture crops: Value of sales at wholesale, large operations, by crop group, 1985 to date 1/Potted Bedding and garden plants Cut Total
Year Cut flowering Foliage Herbaceous cultivated Propagative floricultureflowers plants plants Total Annuals 2/ perennials 3/ greens materials sales 1/
--- Million dollars ---
1985 371.5 291.3 468.5 487.3 460.7 26.6 66.7 - - - 1,685.41986 359.8 388.7 521.4 560.1 536.8 23.4 76.9 - - - 1,906.91987 439.5 511.2 515.3 739.0 706.6 32.4 88.5 - - - 2,293.41988 457.9 507.7 481.6 755.3 723.9 31.4 90.8 - - - 2,293.21989 482.5 538.2 488.9 896.5 857.8 38.8 98.9 - - - 2,505.0
1990 467.7 632.7 474.9 829.1 788.9 40.2 106.6 - - - 2,511.01991 471.6 686.9 447.6 942.4 898.4 44.0 110.0 - - - 2,658.61992 458.5 646.0 427.0 1,118.2 1,066.5 51.7 111.5 - - - 2,761.11993 423.9 683.3 417.0 1,170.0 1,114.3 55.7 116.0 - - - 2,810.31994 442.3 662.5 489.3 1,280.1 1,222.2 57.9 119.2 - - - 2,993.41995 423.6 681.1 499.0 1,357.0 1,292.0 65.0 113.1 - - - 3,073.81996 412.7 684.3 508.9 1,428.1 1,359.1 69.1 118.2 - - - 3,152.31997 471.6 722.9 500.0 1,747.0 1,668.6 78.3 116.2 - - - 3,557.51998 411.6 736.8 502.5 1,872.6 1,778.8 93.8 117.7 - - - 3,641.21999 431.6 758.8 512.0 1,943.1 1,839.6 103.6 126.7 - - - 3,772.3
2000 430.0 799.6 560.2 2,095.4 1,661.4 434.0 126.2 242.6 4,254.02001 418.1 824.8 650.6 2,176.5 1,680.8 495.7 112.4 313.9 4,496.22002 427.1 843.9 622.6 2,400.9 1,789.8 611.2 113.8 345.9 4,754.22003 423.0 803.5 649.7 2,423.7 1,788.9 634.9 102.1 368.0 4,769.92004 412.4 800.5 685.3 2,555.7 1,868.1 687.6 103.0 428.5 4,985.42005 p 396.7 808.9 721.0 2,613.2 1,904.9 708.3 104.7 438.8 5,083.4
- - - = Not available; p = preliminary. Sales data through 1991 are from growers in 28 surveyed States.1/ Growers with $100,000+ of annual floriculture sales at wholesale; growers are located in the 36 surveyed States starting in 1992.2/ Calculated as the difference between total bedding and garden plant sales and herbaceous perennial sales through 1999.3/ Includes only potted hardy and garden chrysanthemums through 1999.Source: USDA, NASS, Floriculture Crops .
Table B-2--Floriculture crops: Supply and use, large operations, 1990 to dateSupply Use
Year Domestic Imports Value Per Per Importproduction Cut flowers Other crops Total Exports consumed household capita share 3/
1/ -- Million dollars -- 2/ Dollars Dollars Percent
1990 2,511.0 326.2 29.0 2,866.3 48.1 2,818.3 31 11 12.61991 2,658.6 322.0 32.2 3,012.8 57.2 2,955.6 32 12 12.01992 2,761.1 352.4 39.6 3,153.1 55.3 3,097.9 33 12 12.71993 2,810.3 382.2 43.1 3,235.5 56.7 3,178.9 33 12 13.41994 2,993.4 420.1 46.0 3,459.5 57.8 3,401.7 35 13 13.71995 3,073.8 511.5 54.9 3,640.2 59.7 3,580.5 37 13 15.81996 3,152.3 572.5 69.8 3,794.6 80.5 3,714.1 38 14 17.31997 3,557.5 595.0 77.4 4,230.0 101.3 4,128.7 41 15 16.31998 3,641.2 614.4 88.1 4,343.6 90.6 4,253.1 42 15 16.51999 3,772.3 592.4 98.0 4,462.7 98.0 4,364.7 42 16 15.82000 4,254.0 610.5 120.0 4,984.4 87.0 4,897.5 46 17 14.92001 4,496.2 565.5 141.1 5,202.7 67.4 5,135.3 48 18 13.82002 4,754.2 541.7 145.2 5,441.0 60.1 5,380.9 50 19 12.82003 4,769.9 610.9 156.0 5,536.8 61.6 5,475.2 50 19 14.02004 4,985.4 705.9 155.6 5,846.9 56.7 5,790.1 53 20 14.92005 p 5,083.4 709.1 160.4 5,953.0 60.1 5,892.9 53 20 14.8
p = Preliminary. Production data through 1991 are from 28 major States.1/ Wholesale value of sales of growers with $100,000+ in annual floriculture sales; growers are located in the 36 surveyed States.2/ Domestic consumption equals supply minus exports. Supply equals domestic production plus imports. Consumption values and statistics differ from corresponding values in table A-4 because floriculture sales of only large growers are used here.3/ The percentage of floriculture imports relative to the value consumed.Sources: USDA, NASS, Floriculture Crops ; U.S. Bureau of Census, www.FAS.USDA.gov/ustrade.
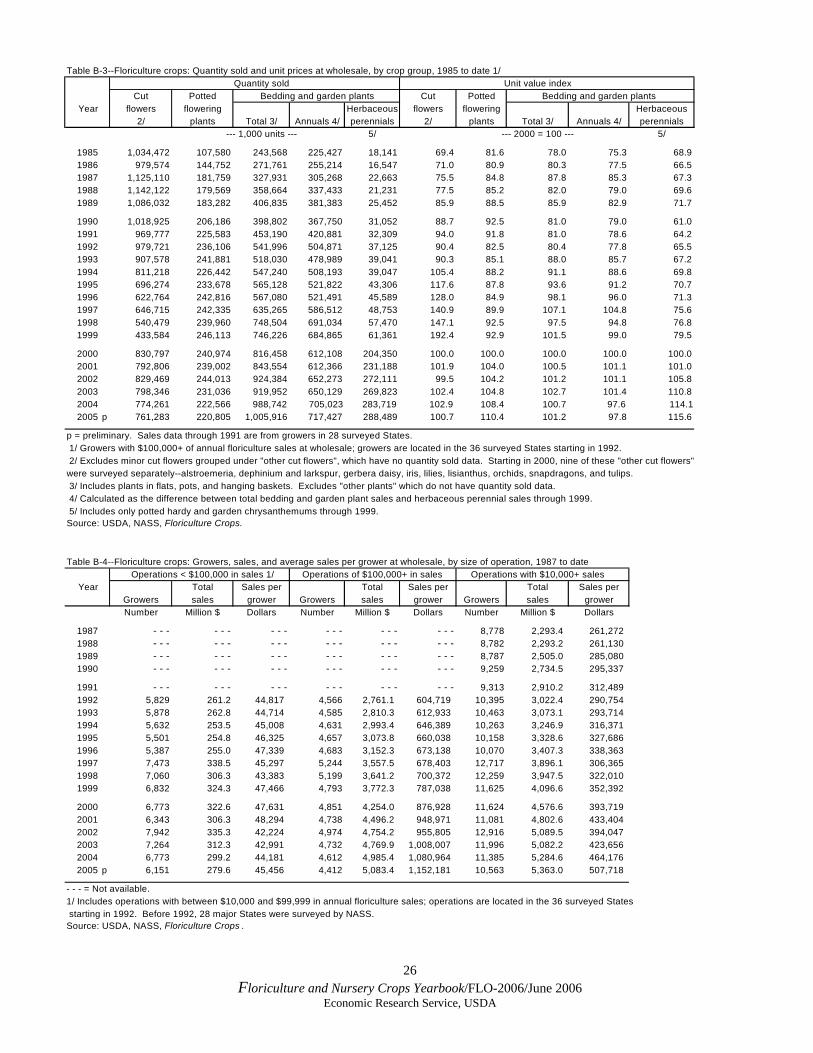
26 Floriculture and Nursery Crops Yearbook/FLO-2006/June 2006
Economic Research Service, USDA
Table B-3--Floriculture crops: Quantity sold and unit prices at wholesale, by crop group, 1985 to date 1/Quantity sold Unit value index
Cut Potted Bedding and garden plants Cut Potted Bedding and garden plantsYear flowers flowering Herbaceous flowers flowering Herbaceous
2/ plants Total 3/ Annuals 4/ perennials 2/ plants Total 3/ Annuals 4/ perennials--- 1,000 units --- 5/ --- 2000 = 100 --- 5/
1985 1,034,472 107,580 243,568 225,427 18,141 69.4 81.6 78.0 75.3 68.91986 979,574 144,752 271,761 255,214 16,547 71.0 80.9 80.3 77.5 66.51987 1,125,110 181,759 327,931 305,268 22,663 75.5 84.8 87.8 85.3 67.31988 1,142,122 179,569 358,664 337,433 21,231 77.5 85.2 82.0 79.0 69.61989 1,086,032 183,282 406,835 381,383 25,452 85.9 88.5 85.9 82.9 71.7
1990 1,018,925 206,186 398,802 367,750 31,052 88.7 92.5 81.0 79.0 61.01991 969,777 225,583 453,190 420,881 32,309 94.0 91.8 81.0 78.6 64.21992 979,721 236,106 541,996 504,871 37,125 90.4 82.5 80.4 77.8 65.51993 907,578 241,881 518,030 478,989 39,041 90.3 85.1 88.0 85.7 67.21994 811,218 226,442 547,240 508,193 39,047 105.4 88.2 91.1 88.6 69.81995 696,274 233,678 565,128 521,822 43,306 117.6 87.8 93.6 91.2 70.71996 622,764 242,816 567,080 521,491 45,589 128.0 84.9 98.1 96.0 71.31997 646,715 242,335 635,265 586,512 48,753 140.9 89.9 107.1 104.8 75.61998 540,479 239,960 748,504 691,034 57,470 147.1 92.5 97.5 94.8 76.81999 433,584 246,113 746,226 684,865 61,361 192.4 92.9 101.5 99.0 79.5
2000 830,797 240,974 816,458 612,108 204,350 100.0 100.0 100.0 100.0 100.02001 792,806 239,002 843,554 612,366 231,188 101.9 104.0 100.5 101.1 101.02002 829,469 244,013 924,384 652,273 272,111 99.5 104.2 101.2 101.1 105.82003 798,346 231,036 919,952 650,129 269,823 102.4 104.8 102.7 101.4 110.82004 774,261 222,566 988,742 705,023 283,719 102.9 108.4 100.7 97.6 114.12005 p 761,283 220,805 1,005,916 717,427 288,489 100.7 110.4 101.2 97.8 115.6
p = preliminary. Sales data through 1991 are from growers in 28 surveyed States. 1/ Growers with $100,000+ of annual floriculture sales at wholesale; growers are located in the 36 surveyed States starting in 1992. 2/ Excludes minor cut flowers grouped under "other cut flowers", which have no quantity sold data. Starting in 2000, nine of these "other cut flowers"were surveyed separately--alstroemeria, dephinium and larkspur, gerbera daisy, iris, lilies, lisianthus, orchids, snapdragons, and tulips. 3/ Includes plants in flats, pots, and hanging baskets. Excludes "other plants" which do not have quantity sold data. 4/ Calculated as the difference between total bedding and garden plant sales and herbaceous perennial sales through 1999. 5/ Includes only potted hardy and garden chrysanthemums through 1999.Source: USDA, NASS, Floriculture Crops.
Table B-4--Floriculture crops: Growers, sales, and average sales per grower at wholesale, by size of operation, 1987 to dateOperations < $100,000 in sales 1/ Operations of $100,000+ in sales Operations with $10,000+ sales
Year Total Sales per Total Sales per Total Sales perGrowers sales grower Growers sales grower Growers sales growerNumber Million $ Dollars Number Million $ Dollars Number Million $ Dollars
1987 - - - - - - - - - - - - - - - - - - 8,778 2,293.4 261,272 1988 - - - - - - - - - - - - - - - - - - 8,782 2,293.2 261,130 1989 - - - - - - - - - - - - - - - - - - 8,787 2,505.0 285,080 1990 - - - - - - - - - - - - - - - - - - 9,259 2,734.5 295,337
1991 - - - - - - - - - - - - - - - - - - 9,313 2,910.2 312,489 1992 5,829 261.2 44,817 4,566 2,761.1 604,719 10,395 3,022.4 290,754 1993 5,878 262.8 44,714 4,585 2,810.3 612,933 10,463 3,073.1 293,714 1994 5,632 253.5 45,008 4,631 2,993.4 646,389 10,263 3,246.9 316,371 1995 5,501 254.8 46,325 4,657 3,073.8 660,038 10,158 3,328.6 327,686 1996 5,387 255.0 47,339 4,683 3,152.3 673,138 10,070 3,407.3 338,363 1997 7,473 338.5 45,297 5,244 3,557.5 678,403 12,717 3,896.1 306,365 1998 7,060 306.3 43,383 5,199 3,641.2 700,372 12,259 3,947.5 322,010 1999 6,832 324.3 47,466 4,793 3,772.3 787,038 11,625 4,096.6 352,392
2000 6,773 322.6 47,631 4,851 4,254.0 876,928 11,624 4,576.6 393,719 2001 6,343 306.3 48,294 4,738 4,496.2 948,971 11,081 4,802.6 433,404 2002 7,942 335.3 42,224 4,974 4,754.2 955,805 12,916 5,089.5 394,047 2003 7,264 312.3 42,991 4,732 4,769.9 1,008,007 11,996 5,082.2 423,656 2004 6,773 299.2 44,181 4,612 4,985.4 1,080,964 11,385 5,284.6 464,176 2005 p 6,151 279.6 45,456 4,412 5,083.4 1,152,181 10,563 5,363.0 507,718
- - - = Not available.1/ Includes operations with between $10,000 and $99,999 in annual floriculture sales; operations are located in the 36 surveyed States starting in 1992. Before 1992, 28 major States were surveyed by NASS.Source: USDA, NASS, Floriculture Crops .

27 Floriculture and Nursery Crops Yearbook/FLO-2006/June 2006
Economic Research Service, USDA
Table B-5--Floriculture crops: Expanded wholesale value of sales, all operations, by State, 1996 to date 1/State 1996 1997 1998 1999 2000 2001 2002 2003 2004 2005p
--- 1,000 dollars ---
Alabama 56,434 72,942 75,351 82,172 58,555 59,135 71,000 78,527 85,367 94,114 Alaska - - - - - - - - - - - - - - - - - - - - - - - - - - - - - - Arizona 22,787 32,235 41,447 43,837 27,706 30,430 32,686 34,500 30,691 32,474 Arkansas 9,754 17,738 17,356 12,123 14,633 17,025 16,431 16,728 15,165 17,009 California 671,070 792,321 790,101 795,607 951,532 1,003,795 1,019,610 1,014,241 1,049,575 1,017,542 Colorado 67,726 71,290 70,996 74,756 87,375 86,240 91,803 93,957 119,080 115,478 Connecticut 49,473 59,939 64,926 67,964 72,125 80,175 84,943 82,237 87,378 85,649 Delaware - - - - - - - - - - - - - - - - - - - - - - - - - - - - - - Florida 676,727 656,234 629,136 671,329 739,807 839,807 833,371 830,824 884,126 976,038 Georgia 55,061 60,828 61,901 66,320 77,381 69,118 78,136 68,843 80,022 78,739
Hawaii 50,687 51,993 54,802 60,099 66,564 69,183 73,997 72,388 69,451 72,021 Idaho - - - - - - - - - - - - - - - - - - - - - - - - - - - - - - Illinois 68,572 105,200 88,583 92,950 110,291 117,638 110,976 108,959 121,141 118,647 Indiana 34,836 41,445 40,611 43,483 48,878 52,219 57,223 57,158 57,636 60,501 Iowa 39,743 42,308 50,273 42,533 50,754 54,375 51,528 54,666 54,368 54,324 Kansas 22,372 27,134 28,309 29,184 34,306 33,422 32,077 31,708 27,988 27,391 Kentucky 21,462 28,543 26,903 28,797 30,707 31,503 32,297 34,529 40,005 43,679 Louisiana 20,071 21,807 21,031 20,663 20,922 24,003 27,517 22,669 22,468 20,257 Maine - - - - - - - - - - - - - - - - - - - - - - - - - - - - - - Maryland 30,909 37,002 52,290 50,172 58,131 61,691 87,495 88,150 105,736 90,407
Massachusetts 69,810 75,367 70,133 75,936 79,546 78,083 84,608 76,813 78,633 75,318 Michigan 185,253 211,384 228,444 231,939 273,517 280,745 326,778 342,190 384,655 384,055 Minnesota 54,322 65,889 65,672 70,632 77,602 77,539 80,842 89,737 87,784 103,626 Mississippi 10,750 19,968 13,608 14,876 14,543 15,427 16,171 15,155 14,434 12,309 Missouri 34,865 42,173 41,932 42,034 46,426 47,404 50,597 47,256 42,960 45,070 Montana - - - - - - - - - - - - - - - - - - - - - - - - - - - - - - Nebraska - - - - - - - - - - - - - - - - - - - - - - - - - - - - - - Nevada - - - - - - - - - - - - - - - - - - - - - - - - - - - - - - New Hampshire - - - - - - - - - - - - - - - - - - - - - - - - - - - - - - New Jersey 94,685 120,100 120,391 123,295 134,256 139,003 159,817 150,982 148,173 147,239
New Mexico 21,208 25,779 28,544 26,481 27,886 32,159 29,904 30,509 28,726 31,917 New York 108,623 147,494 158,820 162,905 179,883 172,934 186,944 194,944 183,022 200,475 North Carolina 95,804 114,524 117,858 134,441 136,177 161,889 158,445 157,101 162,728 182,142 North Dakota - - - - - - - - - - - - - - - - - - - - - - - - - - - - - - Ohio 154,718 177,073 168,275 171,485 189,250 195,370 193,911 197,459 203,396 171,945 Oklahoma 13,106 16,071 17,325 13,820 14,027 18,164 41,939 36,609 35,938 34,805 Oregon 73,958 88,732 91,109 84,215 94,183 91,617 93,669 94,261 100,846 106,496 Pennsylvania 131,587 148,781 139,822 158,490 170,754 185,921 191,886 185,544 185,715 174,334 Rhode Island - - - - - - - - - - - - - - - - - - - - - - - - - - - - - - South Carolina 25,478 39,065 35,373 40,648 85,889 88,703 104,972 110,298 113,183 106,136
South Dakota - - - - - - - - - - - - - - - - - - - - - - - - - - - - - - Tennessee 35,184 45,683 44,538 47,062 52,373 42,649 44,287 45,886 42,433 55,532 Texas 183,852 181,254 230,437 236,716 267,580 257,145 307,359 294,631 275,770 284,995 Utah 26,486 28,190 32,228 38,708 34,973 35,604 45,222 48,975 51,377 52,191 Vermont - - - - - - - - - - - - - - - - - - - - - - - - - - - - - - Virginia 61,014 70,835 68,960 73,362 79,456 79,457 86,043 82,105 87,980 87,378 W ashington 71,452 92,620 98,793 102,211 103,432 98,399 105,671 110,085 123,908 116,259 W est Virginia - - - - - - - - - - - - - - - - - - - - - - - - - - - - - - W isconsin 57,481 66,109 61,239 65,315 65,165 74,584 79,359 81,548 82,785 86,529 W yoming - - - - - - - - - - - - - - - - - - - - - - - - - - - - - -
Total 3,407,320 3,896,050 3,947,517 4,096,560 4,576,585 4,802,555 5,089,514 5,082,172 5,284,643 5,363,021
Northeast 454,178 551,681 554,092 588,590 636,564 656,116 708,198 690,520 682,921 683,015Midwest 652,162 778,715 773,338 789,555 896,189 933,296 983,291 1,010,681 1,062,713 1,052,088South 1,295,606 1,382,494 1,412,067 1,492,501 1,650,181 1,765,716 1,905,463 1,882,055 1,965,355 2,083,540W est 1,005,374 1,183,160 1,208,020 1,225,914 1,393,651 1,447,427 1,492,562 1,498,916 1,573,654 1,544,378- - - = Not available; p = preliminary.1/ W holesale value of sales of growers with at least $10,000 in annual floriculture sales. Growers are located in the 36 surveyed States. Crops include cut flowers, cut cultivated greens, potted flowering plants, potted foliage plants, bedding and garden plants, and propagatives.Source: USDA, NASS, Floriculture Crops.

28 Floriculture and Nursery Crops Yearbook/FLO-2006/June 2006
Economic Research Service, USDA
Table B-6--Floriculture crops: W holesale value of sales, large operations, by State, 1996 to date 1/State 1996 1997 1998 1999 2000 2001 2002 2003 2004 2005p
--- 1,000 dollars ---
Alabama 52,564 68,577 70,971 77,340 52,333 52,986 62,013 73,010 79,494 88,787 Alaska - - - - - - - - - - - - - - - - - - - - - - - - - - - - - - Arizona 22,337 31,170 40,502 38,167 24,786 26,460 28,516 32,919 28,168 28,185 Arkansas 7,549 15,668 15,196 8,732 11,731 13,223 13,940 14,229 12,732 14,408 California 651,555 767,166 766,836 774,877 931,267 985,795 1,001,190 997,396 1,012,795 983,768 Colorado 63,391 66,115 66,721 70,406 71,939 65,251 71,179 71,122 95,007 85,846 Connecticut 42,693 52,154 57,501 60,764 63,309 72,300 75,943 72,812 78,519 75,527 Delaware - - - - - - - - - - - - - - - - - - - - - - - - - - - - - - Florida 658,997 627,809 605,706 645,769 716,407 818,702 810,946 809,959 864,491 958,563 Georgia 50,171 54,168 56,021 60,395 71,782 64,182 71,778 63,243 67,153 65,811
Hawaii 41,252 41,853 44,182 49,802 55,344 58,008 63,317 62,314 60,106 62,806 Idaho - - - - - - - - - - - - - - - - - - - - - - - - - - - - - - Illinois 61,462 94,640 80,183 81,940 101,756 108,938 102,009 100,619 113,134 112,092 Indiana 26,946 30,780 30,561 29,327 36,373 40,929 46,256 45,935 46,909 50,391 Iowa 34,733 37,493 46,088 37,417 43,990 47,399 43,834 47,451 46,501 50,141 Kansas 20,752 24,389 25,774 26,263 29,973 29,224 27,831 27,726 24,664 24,194 Kentucky 16,977 23,278 21,593 22,499 24,243 25,784 25,770 27,761 33,098 37,838 Louisiana 17,581 18,582 18,241 17,783 16,098 20,275 23,958 18,316 18,544 16,584 Maine - - - - - - - - - - - - - - - - - - - - - - - - - - - - - - Maryland 27,939 33,867 47,415 44,988 53,477 55,519 77,990 83,319 98,818 84,269
Massachusetts 56,760 59,977 57,203 61,761 64,184 63,081 70,386 63,446 60,113 60,769 Michigan 172,803 195,229 211,509 211,807 254,953 263,158 306,271 322,980 365,897 365,994 Minnesota 48,082 57,099 57,977 62,546 65,419 65,277 68,592 78,735 81,615 85,362 Mississippi 8,485 16,638 11,568 12,941 13,009 13,353 13,314 11,358 10,887 9,080 Missouri 29,705 34,943 34,177 34,418 38,629 39,875 41,227 37,513 31,827 33,266 Montana - - - - - - - - - - - - - - - - - - - - - - - - - - - - - - Nebraska - - - - - - - - - - - - - - - - - - - - - - - - - - - - - - Nevada - - - - - - - - - - - - - - - - - - - - - - - - - - - - - - New Hampshire - - - - - - - - - - - - - - - - - - - - - - - - - - - - - - New Jersey 85,565 107,065 108,796 111,365 115,260 129,384 149,069 129,090 139,083 139,625
New Mexico 19,963 24,099 27,434 22,311 23,278 27,743 21,994 22,216 21,073 25,764 New York 93,008 122,114 137,010 138,950 156,678 150,499 161,969 168,633 157,699 177,585 North Carolina 89,474 102,404 108,018 122,141 125,687 152,514 148,739 147,591 153,398 170,914 North Dakota - - - - - - - - - - - - - - - - - - - - - - - - - - - - - - Ohio 140,513 157,273 151,220 152,854 168,501 176,005 172,968 180,381 185,736 155,108 Oklahoma 9,956 11,391 13,680 9,230 10,264 15,037 37,696 31,990 29,710 29,841 Oregon 68,198 80,467 84,164 76,249 87,748 80,041 84,564 84,419 88,251 93,079 Pennsylvania 107,032 123,146 117,517 133,455 144,684 158,920 159,435 157,326 157,049 147,694 Rhode Island - - - - - - - - - - - - - - - - - - - - - - - - - - - - - - South Carolina 22,793 36,365 31,398 32,630 74,257 76,789 92,405 103,038 103,461 93,259
South Dakota - - - - - - - - - - - - - - - - - - - - - - - - - - - - - - Tennessee 30,399 39,203 39,333 39,560 42,287 33,511 33,436 35,230 33,155 46,334 Texas 176,277 171,594 221,332 227,725 255,868 246,764 296,510 285,241 265,164 274,917 Utah 24,146 25,985 29,693 36,263 30,542 30,604 42,016 46,342 41,314 42,937 Vermont - - - - - - - - - - - - - - - - - - - - - - - - - - - - - - Virginia 56,709 64,475 62,960 67,195 72,654 71,997 77,729 74,167 80,789 80,113 W ashington 66,112 84,685 91,668 94,861 97,357 92,474 99,066 103,575 117,683 111,113 W est Virginia - - - - - - - - - - - - - - - - - - - - - - - - - - - - - - W isconsin 49,426 55,684 51,084 54,425 50,365 60,636 66,704 70,485 69,265 73,771 W yoming - - - - - - - - - - - - - - - - - - - - - - - - - - - - - -
Undisclosed - - - - - - - - - 23,119 57,548 63,588 63,614 68,000 112,106 127,686
Total 3,152,305 3,557,545 3,641,232 3,772,275 4,253,980 4,496,225 4,754,174 4,769,887 4,985,408 5,083,421
Northeast 385,058 464,456 478,027 506,295 544,115 574,184 616,802 591,307 592,463 1,162,948Midwest 584,422 687,530 688,573 690,997 789,959 831,441 875,692 911,825 965,548 264,182South 1,225,871 1,284,019 1,323,432 1,388,928 1,540,097 1,660,636 1,786,224 1,778,452 1,850,894 667,614W est 956,954 1,121,540 1,151,200 1,162,936 1,322,261 1,366,376 1,411,842 1,420,303 1,464,397 1,496,185- - - = Not available; p = preliminary.1/ W holesale value of sales of growers with at least $100,000 in annual floriculture sales. Growers are located in the 36 surveyed States. Crops include cut flowers, cut cultivated greens, potted flowering plants, potted foliage plants, bedding and garden plants, and propagatives.Source: USDA, NASS, Floriculture Crops .
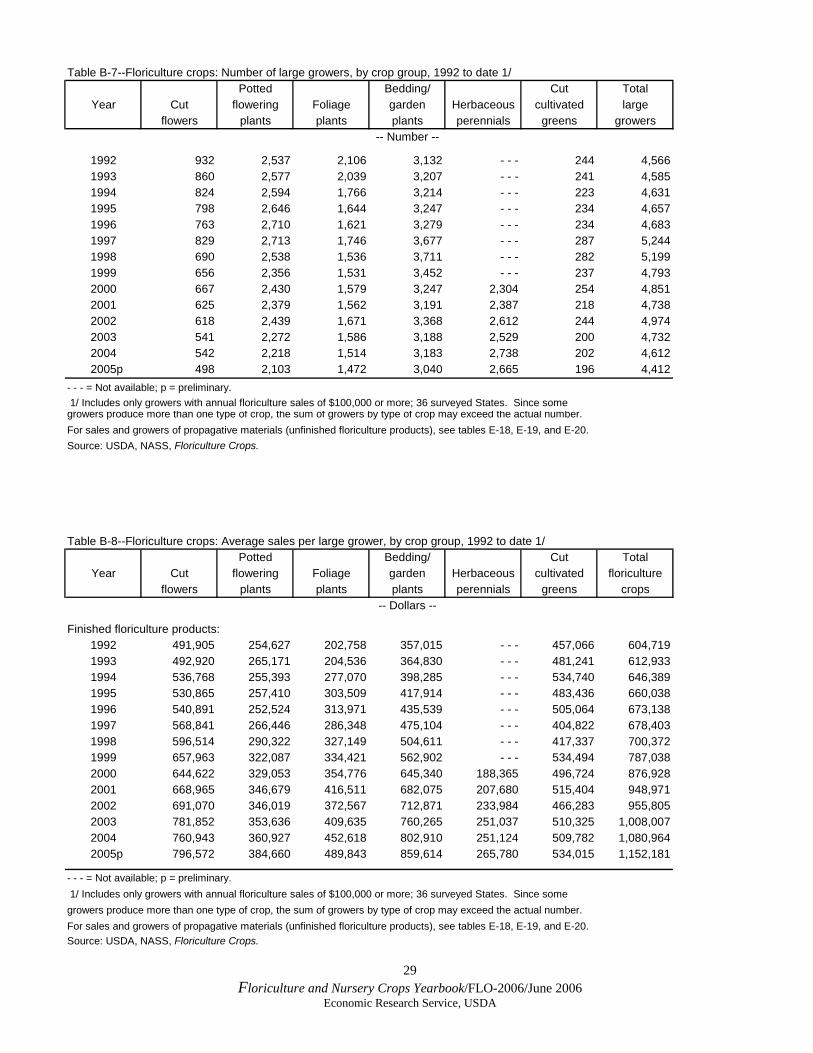
29 Floriculture and Nursery Crops Yearbook/FLO-2006/June 2006
Economic Research Service, USDA
Table B-7--Floriculture crops: Number of large growers, by crop group, 1992 to date 1/Potted Bedding/ Cut Total
Year Cut flowering Foliage garden Herbaceous cultivated largeflowers plants plants plants perennials greens growers
-- Number --
1992 932 2,537 2,106 3,132 - - - 244 4,5661993 860 2,577 2,039 3,207 - - - 241 4,5851994 824 2,594 1,766 3,214 - - - 223 4,6311995 798 2,646 1,644 3,247 - - - 234 4,6571996 763 2,710 1,621 3,279 - - - 234 4,6831997 829 2,713 1,746 3,677 - - - 287 5,2441998 690 2,538 1,536 3,711 - - - 282 5,1991999 656 2,356 1,531 3,452 - - - 237 4,7932000 667 2,430 1,579 3,247 2,304 254 4,8512001 625 2,379 1,562 3,191 2,387 218 4,7382002 618 2,439 1,671 3,368 2,612 244 4,9742003 541 2,272 1,586 3,188 2,529 200 4,7322004 542 2,218 1,514 3,183 2,738 202 4,612
2005p 498 2,103 1,472 3,040 2,665 196 4,412- - - = Not available; p = preliminary. 1/ Includes only growers with annual floriculture sales of $100,000 or more; 36 surveyed States. Since somegrowers produce more than one type of crop, the sum of growers by type of crop may exceed the actual number.For sales and growers of propagative materials (unfinished floriculture products), see tables E-18, E-19, and E-20.Source: USDA, NASS, Floriculture Crops.
Table B-8--Floriculture crops: Average sales per large grower, by crop group, 1992 to date 1/Potted Bedding/ Cut Total
Year Cut flowering Foliage garden Herbaceous cultivated floricultureflowers plants plants plants perennials greens crops
-- Dollars --
Finished floriculture products:1992 491,905 254,627 202,758 357,015 - - - 457,066 604,7191993 492,920 265,171 204,536 364,830 - - - 481,241 612,9331994 536,768 255,393 277,070 398,285 - - - 534,740 646,3891995 530,865 257,410 303,509 417,914 - - - 483,436 660,0381996 540,891 252,524 313,971 435,539 - - - 505,064 673,1381997 568,841 266,446 286,348 475,104 - - - 404,822 678,4031998 596,514 290,322 327,149 504,611 - - - 417,337 700,3721999 657,963 322,087 334,421 562,902 - - - 534,494 787,0382000 644,622 329,053 354,776 645,340 188,365 496,724 876,9282001 668,965 346,679 416,511 682,075 207,680 515,404 948,9712002 691,070 346,019 372,567 712,871 233,984 466,283 955,8052003 781,852 353,636 409,635 760,265 251,037 510,325 1,008,0072004 760,943 360,927 452,618 802,910 251,124 509,782 1,080,964
2005p 796,572 384,660 489,843 859,614 265,780 534,015 1,152,181
- - - = Not available; p = preliminary. 1/ Includes only growers with annual floriculture sales of $100,000 or more; 36 surveyed States. Since somegrowers produce more than one type of crop, the sum of growers by type of crop may exceed the actual number.For sales and growers of propagative materials (unfinished floriculture products), see tables E-18, E-19, and E-20.Source: USDA, NASS, Floriculture Crops.
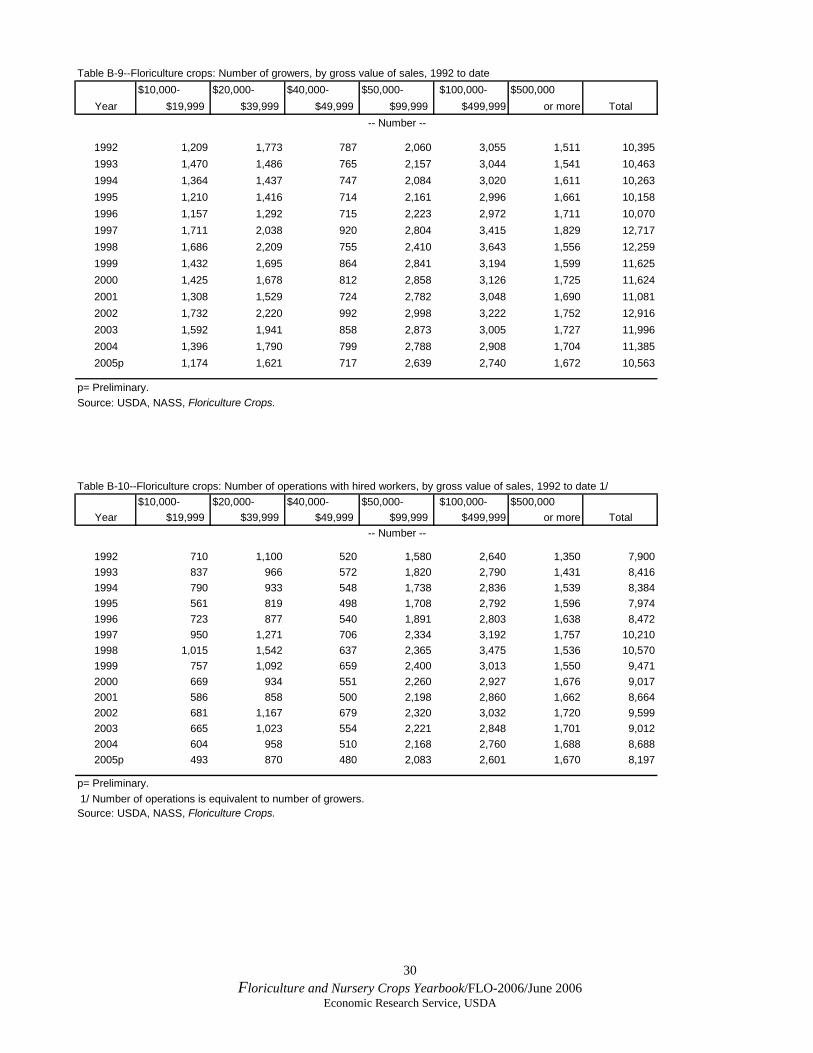
30 Floriculture and Nursery Crops Yearbook/FLO-2006/June 2006
Economic Research Service, USDA
Table B-9--Floriculture crops: Number of growers, by gross value of sales, 1992 to date$10,000- $20,000- $40,000- $50,000- $100,000- $500,000
Year $19,999 $39,999 $49,999 $99,999 $499,999 or more Total-- Number --
1992 1,209 1,773 787 2,060 3,055 1,511 10,3951993 1,470 1,486 765 2,157 3,044 1,541 10,4631994 1,364 1,437 747 2,084 3,020 1,611 10,2631995 1,210 1,416 714 2,161 2,996 1,661 10,1581996 1,157 1,292 715 2,223 2,972 1,711 10,0701997 1,711 2,038 920 2,804 3,415 1,829 12,7171998 1,686 2,209 755 2,410 3,643 1,556 12,2591999 1,432 1,695 864 2,841 3,194 1,599 11,6252000 1,425 1,678 812 2,858 3,126 1,725 11,6242001 1,308 1,529 724 2,782 3,048 1,690 11,0812002 1,732 2,220 992 2,998 3,222 1,752 12,9162003 1,592 1,941 858 2,873 3,005 1,727 11,9962004 1,396 1,790 799 2,788 2,908 1,704 11,385
2005p 1,174 1,621 717 2,639 2,740 1,672 10,563
p= Preliminary.Source: USDA, NASS, Floriculture Crops.
Table B-10--Floriculture crops: Number of operations with hired workers, by gross value of sales, 1992 to date 1/$10,000- $20,000- $40,000- $50,000- $100,000- $500,000
Year $19,999 $39,999 $49,999 $99,999 $499,999 or more Total-- Number --
1992 710 1,100 520 1,580 2,640 1,350 7,9001993 837 966 572 1,820 2,790 1,431 8,4161994 790 933 548 1,738 2,836 1,539 8,3841995 561 819 498 1,708 2,792 1,596 7,9741996 723 877 540 1,891 2,803 1,638 8,4721997 950 1,271 706 2,334 3,192 1,757 10,2101998 1,015 1,542 637 2,365 3,475 1,536 10,5701999 757 1,092 659 2,400 3,013 1,550 9,4712000 669 934 551 2,260 2,927 1,676 9,0172001 586 858 500 2,198 2,860 1,662 8,6642002 681 1,167 679 2,320 3,032 1,720 9,5992003 665 1,023 554 2,221 2,848 1,701 9,0122004 604 958 510 2,168 2,760 1,688 8,688
2005p 493 870 480 2,083 2,601 1,670 8,197
p= Preliminary. 1/ Number of operations is equivalent to number of growers.Source: USDA, NASS, Floriculture Crops.
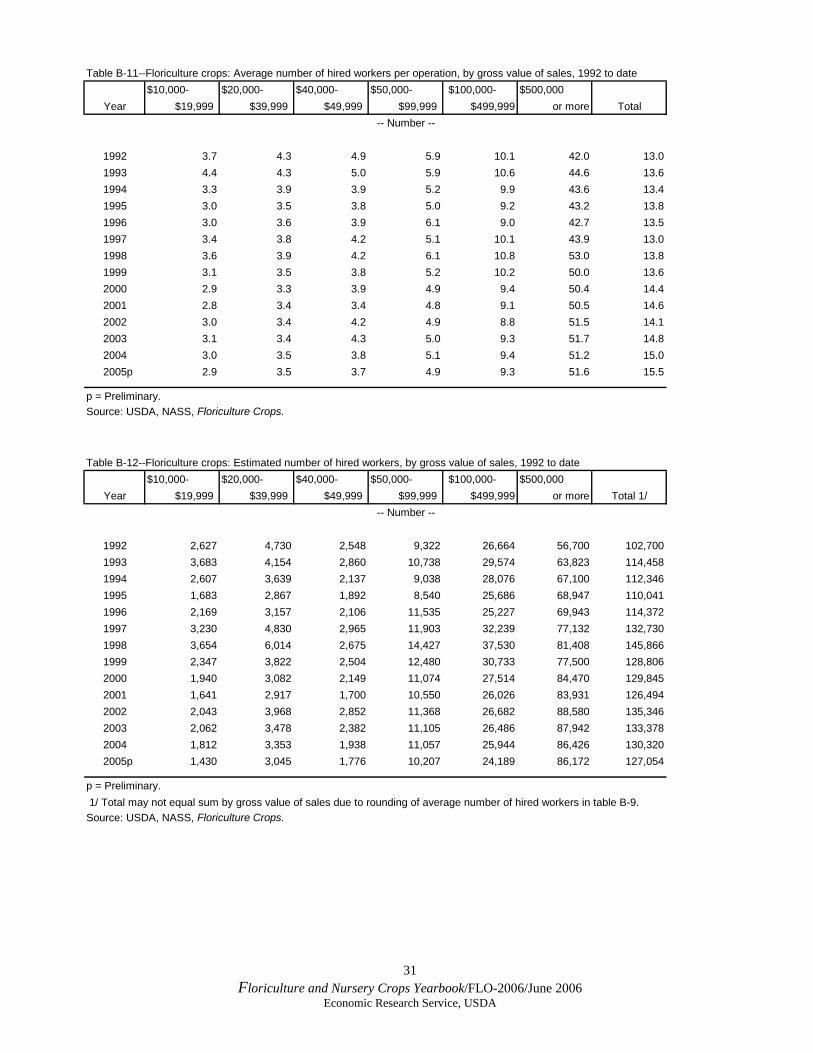
31 Floriculture and Nursery Crops Yearbook/FLO-2006/June 2006
Economic Research Service, USDA
Table B-11--Floriculture crops: Average number of hired workers per operation, by gross value of sales, 1992 to date$10,000- $20,000- $40,000- $50,000- $100,000- $500,000
Year $19,999 $39,999 $49,999 $99,999 $499,999 or more Total-- Number --
1992 3.7 4.3 4.9 5.9 10.1 42.0 13.01993 4.4 4.3 5.0 5.9 10.6 44.6 13.61994 3.3 3.9 3.9 5.2 9.9 43.6 13.41995 3.0 3.5 3.8 5.0 9.2 43.2 13.81996 3.0 3.6 3.9 6.1 9.0 42.7 13.51997 3.4 3.8 4.2 5.1 10.1 43.9 13.01998 3.6 3.9 4.2 6.1 10.8 53.0 13.81999 3.1 3.5 3.8 5.2 10.2 50.0 13.62000 2.9 3.3 3.9 4.9 9.4 50.4 14.42001 2.8 3.4 3.4 4.8 9.1 50.5 14.62002 3.0 3.4 4.2 4.9 8.8 51.5 14.12003 3.1 3.4 4.3 5.0 9.3 51.7 14.82004 3.0 3.5 3.8 5.1 9.4 51.2 15.0
2005p 2.9 3.5 3.7 4.9 9.3 51.6 15.5
p = Preliminary.Source: USDA, NASS, Floriculture Crops.
Table B-12--Floriculture crops: Estimated number of hired workers, by gross value of sales, 1992 to date$10,000- $20,000- $40,000- $50,000- $100,000- $500,000
Year $19,999 $39,999 $49,999 $99,999 $499,999 or more Total 1/-- Number --
1992 2,627 4,730 2,548 9,322 26,664 56,700 102,7001993 3,683 4,154 2,860 10,738 29,574 63,823 114,4581994 2,607 3,639 2,137 9,038 28,076 67,100 112,3461995 1,683 2,867 1,892 8,540 25,686 68,947 110,0411996 2,169 3,157 2,106 11,535 25,227 69,943 114,3721997 3,230 4,830 2,965 11,903 32,239 77,132 132,7301998 3,654 6,014 2,675 14,427 37,530 81,408 145,8661999 2,347 3,822 2,504 12,480 30,733 77,500 128,8062000 1,940 3,082 2,149 11,074 27,514 84,470 129,8452001 1,641 2,917 1,700 10,550 26,026 83,931 126,4942002 2,043 3,968 2,852 11,368 26,682 88,580 135,3462003 2,062 3,478 2,382 11,105 26,486 87,942 133,3782004 1,812 3,353 1,938 11,057 25,944 86,426 130,320
2005p 1,430 3,045 1,776 10,207 24,189 86,172 127,054
p = Preliminary. 1/ Total may not equal sum by gross value of sales due to rounding of average number of hired workers in table B-9.Source: USDA, NASS, Floriculture Crops.
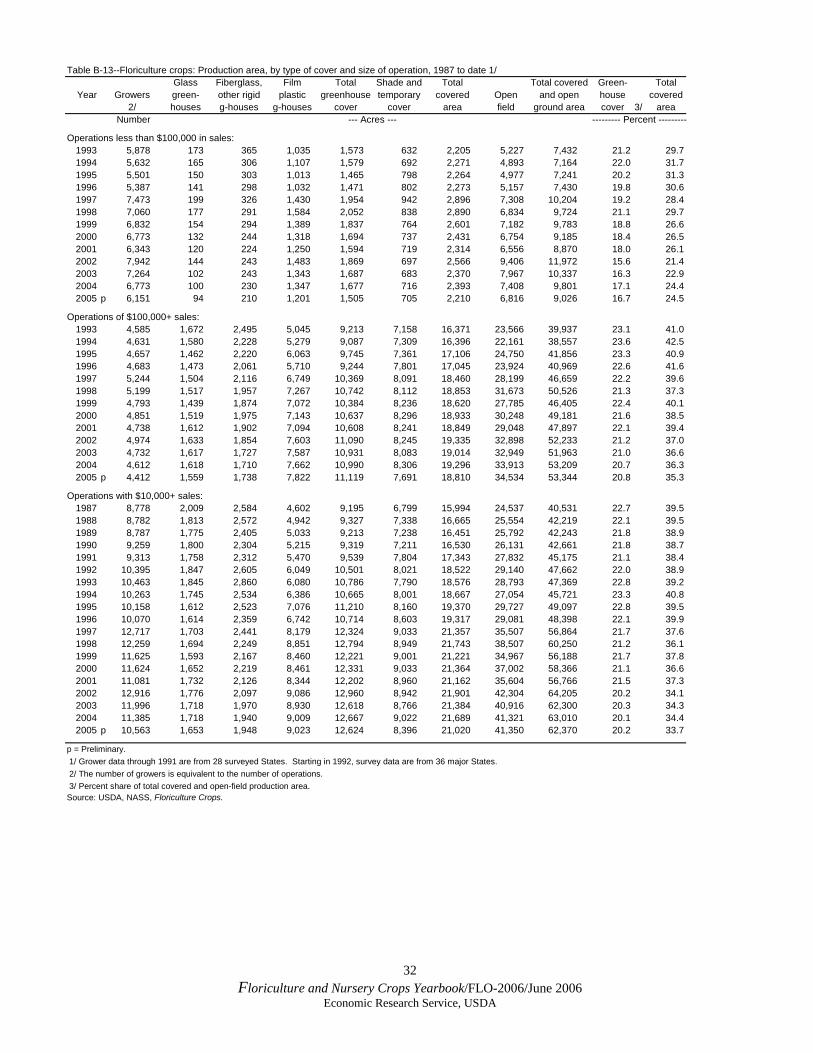
32 Floriculture and Nursery Crops Yearbook/FLO-2006/June 2006
Economic Research Service, USDA
Table B-13--Floriculture crops: Production area, by type of cover and size of operation, 1987 to date 1/Glass Fiberglass, Film Total Shade and Total Total covered Green- Total
Year Growers green- other rigid plastic greenhouse temporary covered Open and open house covered2/ houses g-houses g-houses cover cover area field ground area cover 3/ area
Number --- Acres --- --------- Percent ---------
Operations less than $100,000 in sales:1993 5,878 173 365 1,035 1,573 632 2,205 5,227 7,432 21.2 29.71994 5,632 165 306 1,107 1,579 692 2,271 4,893 7,164 22.0 31.71995 5,501 150 303 1,013 1,465 798 2,264 4,977 7,241 20.2 31.31996 5,387 141 298 1,032 1,471 802 2,273 5,157 7,430 19.8 30.61997 7,473 199 326 1,430 1,954 942 2,896 7,308 10,204 19.2 28.41998 7,060 177 291 1,584 2,052 838 2,890 6,834 9,724 21.1 29.71999 6,832 154 294 1,389 1,837 764 2,601 7,182 9,783 18.8 26.62000 6,773 132 244 1,318 1,694 737 2,431 6,754 9,185 18.4 26.52001 6,343 120 224 1,250 1,594 719 2,314 6,556 8,870 18.0 26.12002 7,942 144 243 1,483 1,869 697 2,566 9,406 11,972 15.6 21.42003 7,264 102 243 1,343 1,687 683 2,370 7,967 10,337 16.3 22.92004 6,773 100 230 1,347 1,677 716 2,393 7,408 9,801 17.1 24.42005 p 6,151 94 210 1,201 1,505 705 2,210 6,816 9,026 16.7 24.5
Operations of $100,000+ sales:1993 4,585 1,672 2,495 5,045 9,213 7,158 16,371 23,566 39,937 23.1 41.01994 4,631 1,580 2,228 5,279 9,087 7,309 16,396 22,161 38,557 23.6 42.51995 4,657 1,462 2,220 6,063 9,745 7,361 17,106 24,750 41,856 23.3 40.91996 4,683 1,473 2,061 5,710 9,244 7,801 17,045 23,924 40,969 22.6 41.61997 5,244 1,504 2,116 6,749 10,369 8,091 18,460 28,199 46,659 22.2 39.61998 5,199 1,517 1,957 7,267 10,742 8,112 18,853 31,673 50,526 21.3 37.31999 4,793 1,439 1,874 7,072 10,384 8,236 18,620 27,785 46,405 22.4 40.12000 4,851 1,519 1,975 7,143 10,637 8,296 18,933 30,248 49,181 21.6 38.52001 4,738 1,612 1,902 7,094 10,608 8,241 18,849 29,048 47,897 22.1 39.42002 4,974 1,633 1,854 7,603 11,090 8,245 19,335 32,898 52,233 21.2 37.02003 4,732 1,617 1,727 7,587 10,931 8,083 19,014 32,949 51,963 21.0 36.62004 4,612 1,618 1,710 7,662 10,990 8,306 19,296 33,913 53,209 20.7 36.32005 p 4,412 1,559 1,738 7,822 11,119 7,691 18,810 34,534 53,344 20.8 35.3
Operations with $10,000+ sales:1987 8,778 2,009 2,584 4,602 9,195 6,799 15,994 24,537 40,531 22.7 39.51988 8,782 1,813 2,572 4,942 9,327 7,338 16,665 25,554 42,219 22.1 39.51989 8,787 1,775 2,405 5,033 9,213 7,238 16,451 25,792 42,243 21.8 38.91990 9,259 1,800 2,304 5,215 9,319 7,211 16,530 26,131 42,661 21.8 38.71991 9,313 1,758 2,312 5,470 9,539 7,804 17,343 27,832 45,175 21.1 38.41992 10,395 1,847 2,605 6,049 10,501 8,021 18,522 29,140 47,662 22.0 38.91993 10,463 1,845 2,860 6,080 10,786 7,790 18,576 28,793 47,369 22.8 39.21994 10,263 1,745 2,534 6,386 10,665 8,001 18,667 27,054 45,721 23.3 40.81995 10,158 1,612 2,523 7,076 11,210 8,160 19,370 29,727 49,097 22.8 39.51996 10,070 1,614 2,359 6,742 10,714 8,603 19,317 29,081 48,398 22.1 39.91997 12,717 1,703 2,441 8,179 12,324 9,033 21,357 35,507 56,864 21.7 37.61998 12,259 1,694 2,249 8,851 12,794 8,949 21,743 38,507 60,250 21.2 36.11999 11,625 1,593 2,167 8,460 12,221 9,001 21,221 34,967 56,188 21.7 37.82000 11,624 1,652 2,219 8,461 12,331 9,033 21,364 37,002 58,366 21.1 36.62001 11,081 1,732 2,126 8,344 12,202 8,960 21,162 35,604 56,766 21.5 37.32002 12,916 1,776 2,097 9,086 12,960 8,942 21,901 42,304 64,205 20.2 34.12003 11,996 1,718 1,970 8,930 12,618 8,766 21,384 40,916 62,300 20.3 34.32004 11,385 1,718 1,940 9,009 12,667 9,022 21,689 41,321 63,010 20.1 34.42005 p 10,563 1,653 1,948 9,023 12,624 8,396 21,020 41,350 62,370 20.2 33.7
p = Preliminary. 1/ Grower data through 1991 are from 28 surveyed States. Starting in 1992, survey data are from 36 major States. 2/ The number of growers is equivalent to the number of operations. 3/ Percent share of total covered and open-field production area.Source: USDA, NASS, Floriculture Crops.

33 Floriculture and Nursery Crops Yearbook/FLO-2006/June 2006
Economic Research Service, USDA
Table B-14--Floriculture crops: Production area, number of hired workers, and sales per grower, 1992 to date 1/Average Open Average Number Average Estimated Average Average Averagecovered field covered & of growers no. of hired number sales sales sales
Year Growers area per area per open area with hired workers of hired per per per hired2/ grower grower per grower workers per grower workers 3/ acre grower worker
Number --- Acres --- --- Number --- --- Dollars ---
Operations less than $100,000 in sales:1992 5,829 - - - - - - - - - 3,910 4.9 19,336 - - - 44,817 13,5111993 5,878 0.4 0.9 1.3 4,195 5.0 21,061 35,366 44,714 12,4801994 5,632 0.4 0.9 1.3 4,009 4.3 17,170 35,384 45,008 14,7641995 5,501 0.4 0.9 1.3 3,586 4.3 15,408 35,195 46,325 16,5391996 5,387 0.4 1.0 1.4 4,031 4.8 19,202 34,324 47,339 13,2811997 7,473 0.4 1.0 1.4 5,261 4.4 23,359 33,173 45,297 14,4911998 7,060 0.4 1.0 1.4 5,559 4.8 26,928 31,499 43,383 11,3741999 6,832 0.4 1.1 1.4 4,908 4.2 20,573 33,148 47,466 15,7632000 6,773 0.4 1.0 1.4 4,414 4.0 17,861 35,123 47,631 18,0622001 6,343 0.4 1.0 1.4 4,142 4.0 16,537 34,537 48,294 18,5232002 7,942 0.3 1.2 1.5 4,847 4.0 19,577 28,010 42,224 17,1292003 7,264 0.3 1.1 1.4 4,463 4.2 18,950 30,210 42,991 16,4802004 6,773 0.4 1.1 1.4 4,280 4.0 17,193 30,531 44,181 17,4042005 p 6,151 0.4 1.1 1.5 3,788 3.7 13,926 30,975 45,456 20,078
Operations with $100,000+ sales:1992 4,566 - - - - - - - - - 3,990 20.9 83,364 - - - 604,719 33,1221993 4,585 3.6 5.1 8.7 4,221 22.1 93,397 70,368 612,933 30,0901994 4,631 3.5 4.8 8.3 4,375 21.8 95,176 77,637 646,389 31,4511995 4,657 3.7 5.3 9.0 4,388 21.6 94,633 73,437 660,038 32,4811996 4,683 3.6 5.1 8.7 4,441 21.4 95,170 76,944 673,138 33,1231997 5,244 3.5 5.4 8.9 4,949 22.1 109,371 76,245 678,403 32,5271998 5,199 3.6 6.1 9.7 5,011 23.7 118,938 72,066 700,372 30,6151999 4,793 3.9 5.8 9.7 4,563 23.7 108,233 81,290 787,038 34,8532000 4,851 3.9 6.2 10.1 4,603 24.3 111,984 86,496 876,928 37,9872001 4,738 4.0 6.1 10.1 4,522 24.3 109,957 93,873 948,971 40,8912002 4,974 3.9 6.6 10.5 4,752 24.4 115,769 91,018 955,805 41,0662003 4,732 4.0 7.0 11.0 4,549 25.2 114,428 91,794 1,008,007 41,6852004 4,612 4.2 7.4 11.5 4,408 25.7 113,127 93,696 1,080,964 44,0692005 p 4,412 4.3 7.8 12.1 4,409 25.7 113,128 95,295 1,152,181 44,935
Operations of $10,000+ sales:1987 8,778 1.8 2.8 4.6 - - - - - - - - - 56,585 261,272 - - -1988 8,782 1.9 2.9 4.8 - - - - - - - - - 54,318 261,130 - - -1989 8,787 1.9 2.9 4.8 - - - - - - - - - 59,299 285,080 - - -1990 9,259 1.8 2.8 4.6 - - - - - - - - - 64,099 295,337 - - -1991 9,313 1.9 3.0 4.9 - - - - - - - - - 64,421 312,489 - - -1992 10,395 1.8 2.8 4.6 7,900 13.0 102,700 63,413 290,754 29,4291993 10,463 1.8 2.8 4.5 8,416 13.6 114,458 64,876 293,714 26,8491994 10,263 1.8 2.6 4.5 8,384 13.4 112,346 71,016 316,371 28,9011995 10,158 1.9 2.9 4.8 7,974 13.8 110,041 67,797 327,686 30,2491996 10,070 1.9 2.9 4.8 8,472 13.5 114,372 70,402 338,363 29,7921997 12,717 1.7 2.8 4.5 10,210 13.0 132,730 68,516 306,365 29,3531998 12,259 1.8 3.1 4.9 10,570 13.8 145,866 65,519 322,010 27,0631999 11,625 1.8 3.0 4.8 9,471 13.6 128,806 72,908 352,392 31,8042000 11,624 1.8 3.2 5.0 9,017 14.4 129,845 78,411 393,719 35,2472001 11,081 1.9 3.2 5.1 8,664 14.6 126,494 84,602 433,404 37,9672002 12,916 1.7 3.3 5.0 9,599 14.1 135,346 79,269 394,047 37,6042003 11,996 1.8 3.4 5.2 9,012 14.8 133,378 81,575 423,656 38,1042004 11,385 1.9 3.6 5.5 8,688 15.0 130,320 83,870 464,176 40,5512005 p 10,563 2.0 3.9 5.9 8,197 15.5 127,054 85,987 507,718 42,211
- - - = Not available; p = preliminary.1/ Grower data through 1991 are from 28 surveyed States. Starting in 1992, survey data are from growers located in 36 major States.2/ The number of growers is assumed equal to the number of operations.3/ Estimated by average number of workers multiplied by number of operations (growers) with hired workers.Source: USDA, NASS, Floriculture Crops .
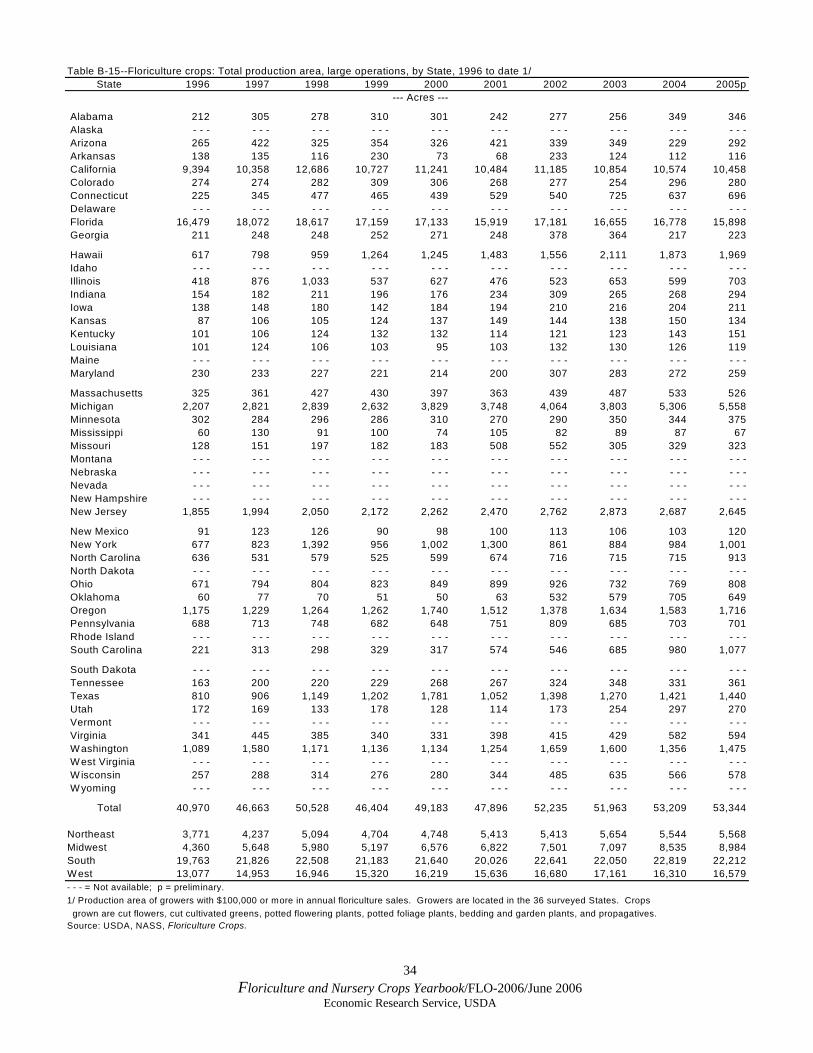
34 Floriculture and Nursery Crops Yearbook/FLO-2006/June 2006
Economic Research Service, USDA
Table B-15--Floriculture crops: Total production area, large operations, by State, 1996 to date 1/State 1996 1997 1998 1999 2000 2001 2002 2003 2004 2005p
--- Acres ---
Alabama 212 305 278 310 301 242 277 256 349 346 Alaska - - - - - - - - - - - - - - - - - - - - - - - - - - - - - - Arizona 265 422 325 354 326 421 339 349 229 292 Arkansas 138 135 116 230 73 68 233 124 112 116 California 9,394 10,358 12,686 10,727 11,241 10,484 11,185 10,854 10,574 10,458 Colorado 274 274 282 309 306 268 277 254 296 280 Connecticut 225 345 477 465 439 529 540 725 637 696 Delaware - - - - - - - - - - - - - - - - - - - - - - - - - - - - - - Florida 16,479 18,072 18,617 17,159 17,133 15,919 17,181 16,655 16,778 15,898 Georgia 211 248 248 252 271 248 378 364 217 223
Hawaii 617 798 959 1,264 1,245 1,483 1,556 2,111 1,873 1,969 Idaho - - - - - - - - - - - - - - - - - - - - - - - - - - - - - - Illinois 418 876 1,033 537 627 476 523 653 599 703 Indiana 154 182 211 196 176 234 309 265 268 294 Iowa 138 148 180 142 184 194 210 216 204 211 Kansas 87 106 105 124 137 149 144 138 150 134 Kentucky 101 106 124 132 132 114 121 123 143 151 Louisiana 101 124 106 103 95 103 132 130 126 119 Maine - - - - - - - - - - - - - - - - - - - - - - - - - - - - - - Maryland 230 233 227 221 214 200 307 283 272 259
Massachusetts 325 361 427 430 397 363 439 487 533 526 Michigan 2,207 2,821 2,839 2,632 3,829 3,748 4,064 3,803 5,306 5,558 Minnesota 302 284 296 286 310 270 290 350 344 375 Mississippi 60 130 91 100 74 105 82 89 87 67 Missouri 128 151 197 182 183 508 552 305 329 323 Montana - - - - - - - - - - - - - - - - - - - - - - - - - - - - - - Nebraska - - - - - - - - - - - - - - - - - - - - - - - - - - - - - - Nevada - - - - - - - - - - - - - - - - - - - - - - - - - - - - - - New Hampshire - - - - - - - - - - - - - - - - - - - - - - - - - - - - - - New Jersey 1,855 1,994 2,050 2,172 2,262 2,470 2,762 2,873 2,687 2,645
New Mexico 91 123 126 90 98 100 113 106 103 120 New York 677 823 1,392 956 1,002 1,300 861 884 984 1,001 North Carolina 636 531 579 525 599 674 716 715 715 913 North Dakota - - - - - - - - - - - - - - - - - - - - - - - - - - - - - - Ohio 671 794 804 823 849 899 926 732 769 808 Oklahoma 60 77 70 51 50 63 532 579 705 649 Oregon 1,175 1,229 1,264 1,262 1,740 1,512 1,378 1,634 1,583 1,716 Pennsylvania 688 713 748 682 648 751 809 685 703 701 Rhode Island - - - - - - - - - - - - - - - - - - - - - - - - - - - - - - South Carolina 221 313 298 329 317 574 546 685 980 1,077
South Dakota - - - - - - - - - - - - - - - - - - - - - - - - - - - - - - Tennessee 163 200 220 229 268 267 324 348 331 361 Texas 810 906 1,149 1,202 1,781 1,052 1,398 1,270 1,421 1,440 Utah 172 169 133 178 128 114 173 254 297 270 Vermont - - - - - - - - - - - - - - - - - - - - - - - - - - - - - - Virginia 341 445 385 340 331 398 415 429 582 594 Washington 1,089 1,580 1,171 1,136 1,134 1,254 1,659 1,600 1,356 1,475 West Virginia - - - - - - - - - - - - - - - - - - - - - - - - - - - - - - W isconsin 257 288 314 276 280 344 485 635 566 578 Wyoming - - - - - - - - - - - - - - - - - - - - - - - - - - - - - -
Total 40,970 46,663 50,528 46,404 49,183 47,896 52,235 51,963 53,209 53,344
Northeast 3,771 4,237 5,094 4,704 4,748 5,413 5,413 5,654 5,544 5,568Midwest 4,360 5,648 5,980 5,197 6,576 6,822 7,501 7,097 8,535 8,984South 19,763 21,826 22,508 21,183 21,640 20,026 22,641 22,050 22,819 22,212West 13,077 14,953 16,946 15,320 16,219 15,636 16,680 17,161 16,310 16,579- - - = Not available; p = preliminary.1/ Production area of growers with $100,000 or more in annual floriculture sales. Growers are located in the 36 surveyed States. Crops grown are cut flowers, cut cultivated greens, potted flowering plants, potted foliage plants, bedding and garden plants, and propagatives.Source: USDA, NASS, Floriculture Crops.

35 Floriculture and Nursery Crops Yearbook/FLO-2006/June 2006
Economic Research Service, USDA
Table B-16--Floriculture crops: Greenhouse production area, large operations, by State, 1996 to date 1/State 1996 1997 1998 1999 2000 2001 2002 2003 2004 2005p
--- 1,000 square feet --- 2/
Alabama 6,617 6,918 6,840 7,800 7,216 7,817 7,831 7,685 6,675 6,443 Alaska - - - - - - - - - - - - - - - - - - - - - - - - - - - - - - Arizona 993 1,860 2,011 2,178 2,087 2,255 2,538 2,529 2,416 2,254 Arkansas 1,494 1,517 2,120 3,444 1,868 1,682 2,342 2,461 2,175 2,218 California 103,236 109,638 110,425 100,258 100,152 102,314 103,780 96,014 91,548 92,941 Colorado 9,604 10,010 10,221 10,207 10,139 9,435 9,810 9,462 10,091 9,371 Connecticut 4,473 5,774 7,329 6,661 6,652 7,388 7,439 7,169 7,300 7,443 Delaware - - - - - - - - - - - - - - - - - - - - - - - - - - - - - - Florida 46,286 52,228 51,957 51,619 54,278 53,588 58,540 56,617 57,380 64,637 Georgia 5,745 6,183 7,052 7,097 7,111 6,533 6,443 6,574 6,176 5,828
Hawaii 2,696 2,654 3,417 4,018 3,883 3,689 4,118 3,684 3,617 3,601 Idaho - - - - - - - - - - - - - - - - - - - - - - - - - - - - - - Illinois 7,534 9,574 10,320 10,205 10,780 10,439 10,965 11,237 12,230 12,720 Indiana 4,249 4,295 4,959 5,148 4,822 5,691 6,430 6,150 5,952 5,881 Iowa 4,568 5,161 4,970 4,860 5,656 5,611 4,878 5,204 4,964 6,014 Kansas 3,060 3,511 3,691 3,760 3,951 4,061 3,844 3,870 3,916 3,896 Kentucky 2,924 3,483 3,503 3,524 3,570 3,798 3,894 3,479 3,970 4,144 Louisiana 2,416 2,324 2,515 2,598 2,257 2,126 2,644 2,444 2,232 2,240 Maine - - - - - - - - - - - - - - - - - - - - - - - - - - - - - - Maryland 3,324 3,740 5,093 5,451 3,709 4,054 6,362 5,757 5,702 5,481
Massachusetts 6,953 6,667 7,470 7,031 6,884 6,541 6,711 7,102 7,031 6,599 Michigan 28,694 33,209 36,658 33,999 36,529 36,116 38,552 41,512 42,906 41,145 Minnesota 7,351 7,364 8,112 8,513 8,723 9,361 9,892 9,993 10,096 10,356 Mississippi 1,095 1,417 2,609 3,019 2,262 2,849 1,867 1,759 1,775 1,403 Missouri 4,000 5,067 5,320 5,092 5,214 5,386 5,350 4,997 5,157 5,150 Montana - - - - - - - - - - - - - - - - - - - - - - - - - - - - - - Nebraska - - - - - - - - - - - - - - - - - - - - - - - - - - - - - - Nevada - - - - - - - - - - - - - - - - - - - - - - - - - - - - - - New Hampshire - - - - - - - - - - - - - - - - - - - - - - - - - - - - - - New Jersey 10,559 16,074 16,375 14,861 15,532 16,358 15,227 16,667 16,266 15,819
New Mexico 3,454 3,614 3,751 3,622 3,895 3,812 3,925 3,866 3,813 4,507 New York 15,711 17,142 17,120 17,136 21,062 18,649 17,279 18,065 19,767 19,488 North Carolina 10,976 12,672 14,430 14,882 14,721 15,447 16,554 16,867 17,503 17,773 North Dakota - - - - - - - - - - - - - - - - - - - - - - - - - - - - - - Ohio 23,011 27,802 26,172 25,562 23,844 24,652 23,429 22,571 22,416 22,822 Oklahoma 2,188 2,609 2,213 1,517 1,611 1,641 2,888 3,152 3,341 3,659 Oregon 10,595 11,934 15,338 11,560 12,213 12,245 12,945 13,875 13,979 14,378 Pennsylvania 15,691 16,653 17,264 17,684 17,063 18,187 18,186 16,798 17,164 16,511 Rhode Island - - - - - - - - - - - - - - - - - - - - - - - - - - - - - - South Carolina 2,247 3,274 3,029 3,238 4,241 3,961 3,656 3,685 6,553 6,416
South Dakota - - - - - - - - - - - - - - - - - - - - - - - - - - - - - - Tennessee 4,252 5,082 4,868 5,267 4,675 4,783 4,217 5,367 5,584 5,524 Texas 22,825 25,310 24,328 24,214 30,655 25,214 31,415 29,009 29,007 29,037 Utah 3,814 5,159 4,201 4,500 4,088 3,989 5,555 5,493 5,254 5,066 Vermont - - - - - - - - - - - - - - - - - - - - - - - - - - - - - - Virginia 6,631 7,089 6,643 6,381 6,863 7,743 6,843 8,439 7,692 6,809 Washington 6,489 7,297 7,826 7,738 7,865 7,268 8,957 8,696 9,015 8,866 West Virginia - - - - - - - - - - - - - - - - - - - - - - - - - - - - - - Wisconsin 6,898 7,377 7,741 7,669 7,277 7,386 7,769 7,899 8,042 7,889 Wyoming - - - - - - - - - - - - - - - - - - - - - - - - - - - - - -
Total 402,653 451,682 467,891 452,313 463,348 462,069 483,075 476,148 478,705 484,329
Northeast 53,387 62,310 65,558 63,373 67,193 67,123 64,842 65,801 67,528 65,860Midwest 89,365 103,360 107,943 104,808 106,796 108,703 111,109 113,433 115,679 115,873South 119,020 133,846 137,200 140,051 145,037 141,236 155,496 153,295 155,765 161,612West 140,881 152,166 157,190 144,081 144,322 145,007 151,628 143,619 139,733 140,984- - - = Not available; p = preliminary.1/ Production area of growers with $100,000 or more in annual floriculture sales. Growers are located in the 36 surveyed States. Crops grown are cut flowers, cut cultivated greens, potted flowering plants, potted foliage plants, bedding and garden plants, and propagatives.2/ To convert 1,000 square feet to acres, multiply by 0.023.Source: USDA, NASS, Floriculture Crops .
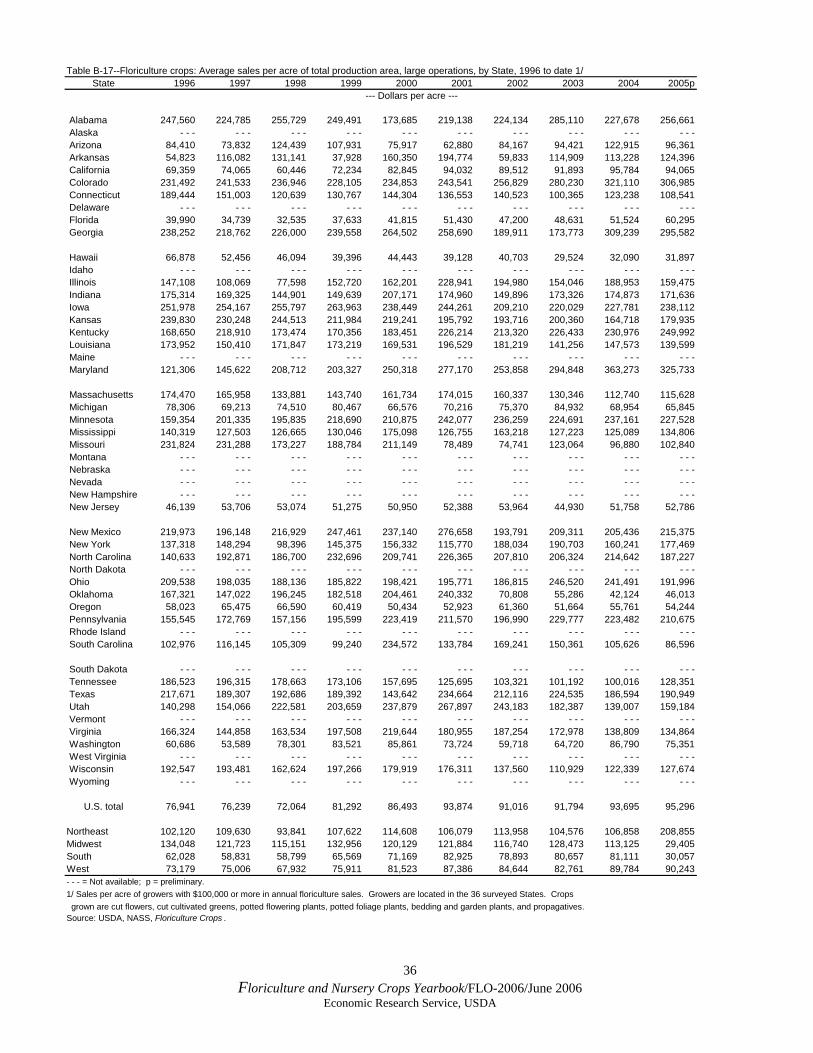
36 Floriculture and Nursery Crops Yearbook/FLO-2006/June 2006
Economic Research Service, USDA
Table B-17--Floriculture crops: Average sales per acre of total production area, large operations, by State, 1996 to date 1/State 1996 1997 1998 1999 2000 2001 2002 2003 2004 2005p
--- Dollars per acre ---
Alabama 247,560 224,785 255,729 249,491 173,685 219,138 224,134 285,110 227,678 256,661 Alaska - - - - - - - - - - - - - - - - - - - - - - - - - - - - - - Arizona 84,410 73,832 124,439 107,931 75,917 62,880 84,167 94,421 122,915 96,361 Arkansas 54,823 116,082 131,141 37,928 160,350 194,774 59,833 114,909 113,228 124,396 California 69,359 74,065 60,446 72,234 82,845 94,032 89,512 91,893 95,784 94,065 Colorado 231,492 241,533 236,946 228,105 234,853 243,541 256,829 280,230 321,110 306,985 Connecticut 189,444 151,003 120,639 130,767 144,304 136,553 140,523 100,365 123,238 108,541 Delaware - - - - - - - - - - - - - - - - - - - - - - - - - - - - - - Florida 39,990 34,739 32,535 37,633 41,815 51,430 47,200 48,631 51,524 60,295 Georgia 238,252 218,762 226,000 239,558 264,502 258,690 189,911 173,773 309,239 295,582
Hawaii 66,878 52,456 46,094 39,396 44,443 39,128 40,703 29,524 32,090 31,897 Idaho - - - - - - - - - - - - - - - - - - - - - - - - - - - - - - Illinois 147,108 108,069 77,598 152,720 162,201 228,941 194,980 154,046 188,953 159,475 Indiana 175,314 169,325 144,901 149,639 207,171 174,960 149,896 173,326 174,873 171,636 Iowa 251,978 254,167 255,797 263,963 238,449 244,261 209,210 220,029 227,781 238,112 Kansas 239,830 230,248 244,513 211,984 219,241 195,792 193,716 200,360 164,718 179,935 Kentucky 168,650 218,910 173,474 170,356 183,451 226,214 213,320 226,433 230,976 249,992 Louisiana 173,952 150,410 171,847 173,219 169,531 196,529 181,219 141,256 147,573 139,599 Maine - - - - - - - - - - - - - - - - - - - - - - - - - - - - - - Maryland 121,306 145,622 208,712 203,327 250,318 277,170 253,858 294,848 363,273 325,733
Massachusetts 174,470 165,958 133,881 143,740 161,734 174,015 160,337 130,346 112,740 115,628 Michigan 78,306 69,213 74,510 80,467 66,576 70,216 75,370 84,932 68,954 65,845 Minnesota 159,354 201,335 195,835 218,690 210,875 242,077 236,259 224,691 237,161 227,528 Mississippi 140,319 127,503 126,665 130,046 175,098 126,755 163,218 127,223 125,089 134,806 Missouri 231,824 231,288 173,227 188,784 211,149 78,489 74,741 123,064 96,880 102,840 Montana - - - - - - - - - - - - - - - - - - - - - - - - - - - - - - Nebraska - - - - - - - - - - - - - - - - - - - - - - - - - - - - - - Nevada - - - - - - - - - - - - - - - - - - - - - - - - - - - - - - New Hampshire - - - - - - - - - - - - - - - - - - - - - - - - - - - - - - New Jersey 46,139 53,706 53,074 51,275 50,950 52,388 53,964 44,930 51,758 52,786
New Mexico 219,973 196,148 216,929 247,461 237,140 276,658 193,791 209,311 205,436 215,375 New York 137,318 148,294 98,396 145,375 156,332 115,770 188,034 190,703 160,241 177,469 North Carolina 140,633 192,871 186,700 232,696 209,741 226,365 207,810 206,324 214,642 187,227 North Dakota - - - - - - - - - - - - - - - - - - - - - - - - - - - - - - Ohio 209,538 198,035 188,136 185,822 198,421 195,771 186,815 246,520 241,491 191,996 Oklahoma 167,321 147,022 196,245 182,518 204,461 240,332 70,808 55,286 42,124 46,013 Oregon 58,023 65,475 66,590 60,419 50,434 52,923 61,360 51,664 55,761 54,244 Pennsylvania 155,545 172,769 157,156 195,599 223,419 211,570 196,990 229,777 223,482 210,675 Rhode Island - - - - - - - - - - - - - - - - - - - - - - - - - - - - - - South Carolina 102,976 116,145 105,309 99,240 234,572 133,784 169,241 150,361 105,626 86,596
South Dakota - - - - - - - - - - - - - - - - - - - - - - - - - - - - - - Tennessee 186,523 196,315 178,663 173,106 157,695 125,695 103,321 101,192 100,016 128,351 Texas 217,671 189,307 192,686 189,392 143,642 234,664 212,116 224,535 186,594 190,949 Utah 140,298 154,066 222,581 203,659 237,879 267,897 243,183 182,387 139,007 159,184 Vermont - - - - - - - - - - - - - - - - - - - - - - - - - - - - - - Virginia 166,324 144,858 163,534 197,508 219,644 180,955 187,254 172,978 138,809 134,864 Washington 60,686 53,589 78,301 83,521 85,861 73,724 59,718 64,720 86,790 75,351 West Virginia - - - - - - - - - - - - - - - - - - - - - - - - - - - - - - Wisconsin 192,547 193,481 162,624 197,266 179,919 176,311 137,560 110,929 122,339 127,674 Wyoming - - - - - - - - - - - - - - - - - - - - - - - - - - - - - -
U.S. total 76,941 76,239 72,064 81,292 86,493 93,874 91,016 91,794 93,695 95,296
Northeast 102,120 109,630 93,841 107,622 114,608 106,079 113,958 104,576 106,858 208,855Midwest 134,048 121,723 115,151 132,956 120,129 121,884 116,740 128,473 113,125 29,405South 62,028 58,831 58,799 65,569 71,169 82,925 78,893 80,657 81,111 30,057West 73,179 75,006 67,932 75,911 81,523 87,386 84,644 82,761 89,784 90,243- - - = Not available; p = preliminary.1/ Sales per acre of growers with $100,000 or more in annual floriculture sales. Growers are located in the 36 surveyed States. Crops grown are cut flowers, cut cultivated greens, potted flowering plants, potted foliage plants, bedding and garden plants, and propagatives.Source: USDA, NASS, Floriculture Crops .
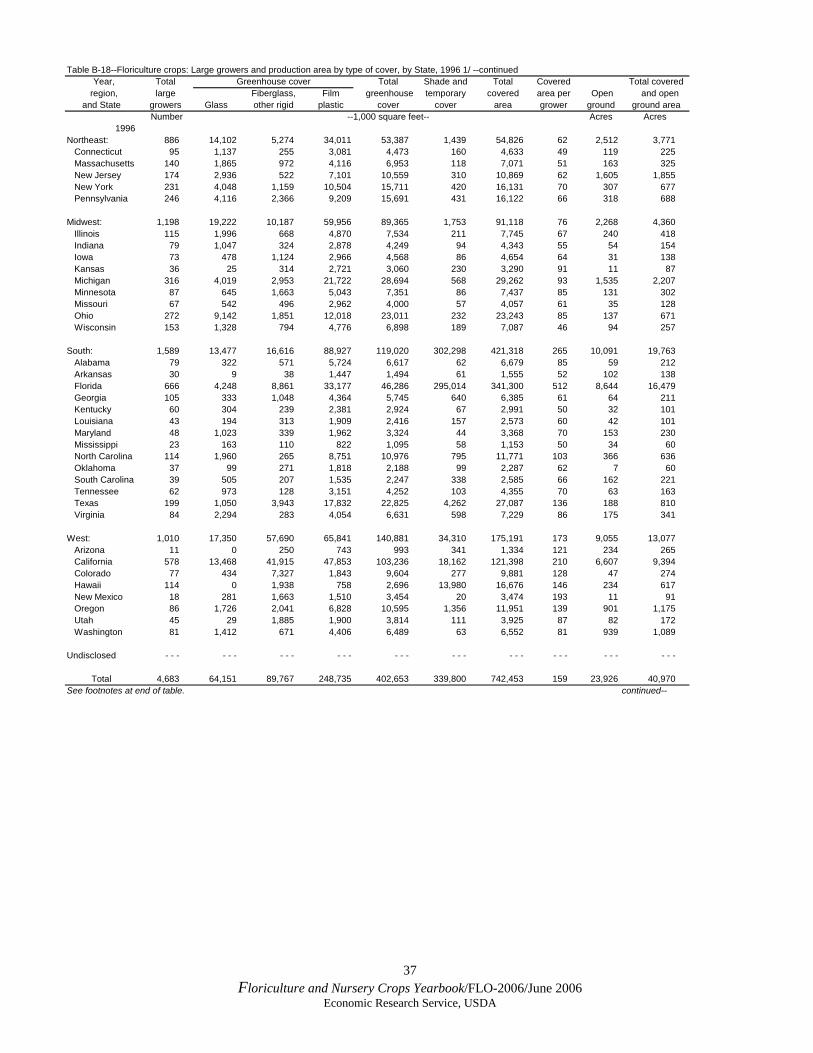
37 Floriculture and Nursery Crops Yearbook/FLO-2006/June 2006
Economic Research Service, USDA
Table B-18--Floriculture crops: Large growers and production area by type of cover, by State, 1996 1/ --continued Year, Total Greenhouse cover Total Shade and Total Covered Total covered
region, large Fiberglass, Film greenhouse temporary covered area per Open and open and State growers Glass other rigid plastic cover cover area grower ground ground area
Number --1,000 square feet-- Acres Acres1996
Northeast: 886 14,102 5,274 34,011 53,387 1,439 54,826 62 2,512 3,771 Connecticut 95 1,137 255 3,081 4,473 160 4,633 49 119 225 Massachusetts 140 1,865 972 4,116 6,953 118 7,071 51 163 325 New Jersey 174 2,936 522 7,101 10,559 310 10,869 62 1,605 1,855 New York 231 4,048 1,159 10,504 15,711 420 16,131 70 307 677 Pennsylvania 246 4,116 2,366 9,209 15,691 431 16,122 66 318 688
Midwest: 1,198 19,222 10,187 59,956 89,365 1,753 91,118 76 2,268 4,360 Illinois 115 1,996 668 4,870 7,534 211 7,745 67 240 418 Indiana 79 1,047 324 2,878 4,249 94 4,343 55 54 154 Iowa 73 478 1,124 2,966 4,568 86 4,654 64 31 138 Kansas 36 25 314 2,721 3,060 230 3,290 91 11 87 Michigan 316 4,019 2,953 21,722 28,694 568 29,262 93 1,535 2,207 Minnesota 87 645 1,663 5,043 7,351 86 7,437 85 131 302 Missouri 67 542 496 2,962 4,000 57 4,057 61 35 128 Ohio 272 9,142 1,851 12,018 23,011 232 23,243 85 137 671 Wisconsin 153 1,328 794 4,776 6,898 189 7,087 46 94 257
South: 1,589 13,477 16,616 88,927 119,020 302,298 421,318 265 10,091 19,763 Alabama 79 322 571 5,724 6,617 62 6,679 85 59 212 Arkansas 30 9 38 1,447 1,494 61 1,555 52 102 138 Florida 666 4,248 8,861 33,177 46,286 295,014 341,300 512 8,644 16,479 Georgia 105 333 1,048 4,364 5,745 640 6,385 61 64 211 Kentucky 60 304 239 2,381 2,924 67 2,991 50 32 101 Louisiana 43 194 313 1,909 2,416 157 2,573 60 42 101 Maryland 48 1,023 339 1,962 3,324 44 3,368 70 153 230 Mississippi 23 163 110 822 1,095 58 1,153 50 34 60 North Carolina 114 1,960 265 8,751 10,976 795 11,771 103 366 636 Oklahoma 37 99 271 1,818 2,188 99 2,287 62 7 60 South Carolina 39 505 207 1,535 2,247 338 2,585 66 162 221 Tennessee 62 973 128 3,151 4,252 103 4,355 70 63 163 Texas 199 1,050 3,943 17,832 22,825 4,262 27,087 136 188 810 Virginia 84 2,294 283 4,054 6,631 598 7,229 86 175 341
West: 1,010 17,350 57,690 65,841 140,881 34,310 175,191 173 9,055 13,077 Arizona 11 0 250 743 993 341 1,334 121 234 265 California 578 13,468 41,915 47,853 103,236 18,162 121,398 210 6,607 9,394 Colorado 77 434 7,327 1,843 9,604 277 9,881 128 47 274 Hawaii 114 0 1,938 758 2,696 13,980 16,676 146 234 617 New Mexico 18 281 1,663 1,510 3,454 20 3,474 193 11 91 Oregon 86 1,726 2,041 6,828 10,595 1,356 11,951 139 901 1,175 Utah 45 29 1,885 1,900 3,814 111 3,925 87 82 172 Washington 81 1,412 671 4,406 6,489 63 6,552 81 939 1,089
Undisclosed - - - - - - - - - - - - - - - - - - - - - - - - - - - - - -
Total 4,683 64,151 89,767 248,735 402,653 339,800 742,453 159 23,926 40,970See footnotes at end of table. continued--
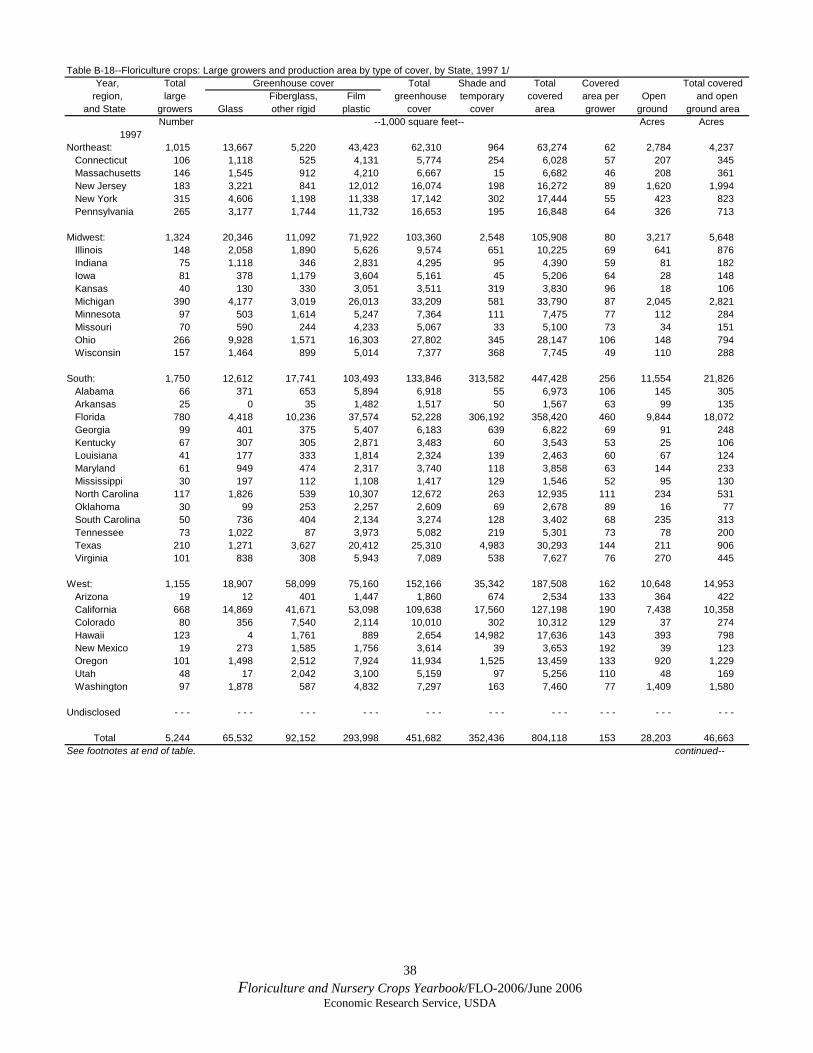
38 Floriculture and Nursery Crops Yearbook/FLO-2006/June 2006
Economic Research Service, USDA
Table B-18--Floriculture crops: Large growers and production area by type of cover, by State, 1997 1/ Year, Total Greenhouse cover Total Shade and Total Covered Total covered
region, large Fiberglass, Film greenhouse temporary covered area per Open and open and State growers Glass other rigid plastic cover cover area grower ground ground area
Number --1,000 square feet-- Acres Acres1997
Northeast: 1,015 13,667 5,220 43,423 62,310 964 63,274 62 2,784 4,237 Connecticut 106 1,118 525 4,131 5,774 254 6,028 57 207 345 Massachusetts 146 1,545 912 4,210 6,667 15 6,682 46 208 361 New Jersey 183 3,221 841 12,012 16,074 198 16,272 89 1,620 1,994 New York 315 4,606 1,198 11,338 17,142 302 17,444 55 423 823 Pennsylvania 265 3,177 1,744 11,732 16,653 195 16,848 64 326 713
Midwest: 1,324 20,346 11,092 71,922 103,360 2,548 105,908 80 3,217 5,648 Illinois 148 2,058 1,890 5,626 9,574 651 10,225 69 641 876 Indiana 75 1,118 346 2,831 4,295 95 4,390 59 81 182 Iowa 81 378 1,179 3,604 5,161 45 5,206 64 28 148 Kansas 40 130 330 3,051 3,511 319 3,830 96 18 106 Michigan 390 4,177 3,019 26,013 33,209 581 33,790 87 2,045 2,821 Minnesota 97 503 1,614 5,247 7,364 111 7,475 77 112 284 Missouri 70 590 244 4,233 5,067 33 5,100 73 34 151 Ohio 266 9,928 1,571 16,303 27,802 345 28,147 106 148 794 Wisconsin 157 1,464 899 5,014 7,377 368 7,745 49 110 288
South: 1,750 12,612 17,741 103,493 133,846 313,582 447,428 256 11,554 21,826 Alabama 66 371 653 5,894 6,918 55 6,973 106 145 305 Arkansas 25 0 35 1,482 1,517 50 1,567 63 99 135 Florida 780 4,418 10,236 37,574 52,228 306,192 358,420 460 9,844 18,072 Georgia 99 401 375 5,407 6,183 639 6,822 69 91 248 Kentucky 67 307 305 2,871 3,483 60 3,543 53 25 106 Louisiana 41 177 333 1,814 2,324 139 2,463 60 67 124 Maryland 61 949 474 2,317 3,740 118 3,858 63 144 233 Mississippi 30 197 112 1,108 1,417 129 1,546 52 95 130 North Carolina 117 1,826 539 10,307 12,672 263 12,935 111 234 531 Oklahoma 30 99 253 2,257 2,609 69 2,678 89 16 77 South Carolina 50 736 404 2,134 3,274 128 3,402 68 235 313 Tennessee 73 1,022 87 3,973 5,082 219 5,301 73 78 200 Texas 210 1,271 3,627 20,412 25,310 4,983 30,293 144 211 906 Virginia 101 838 308 5,943 7,089 538 7,627 76 270 445
West: 1,155 18,907 58,099 75,160 152,166 35,342 187,508 162 10,648 14,953 Arizona 19 12 401 1,447 1,860 674 2,534 133 364 422 California 668 14,869 41,671 53,098 109,638 17,560 127,198 190 7,438 10,358 Colorado 80 356 7,540 2,114 10,010 302 10,312 129 37 274 Hawaii 123 4 1,761 889 2,654 14,982 17,636 143 393 798 New Mexico 19 273 1,585 1,756 3,614 39 3,653 192 39 123 Oregon 101 1,498 2,512 7,924 11,934 1,525 13,459 133 920 1,229 Utah 48 17 2,042 3,100 5,159 97 5,256 110 48 169 Washington 97 1,878 587 4,832 7,297 163 7,460 77 1,409 1,580
Undisclosed - - - - - - - - - - - - - - - - - - - - - - - - - - - - - -
Total 5,244 65,532 92,152 293,998 451,682 352,436 804,118 153 28,203 46,663See footnotes at end of table. continued--
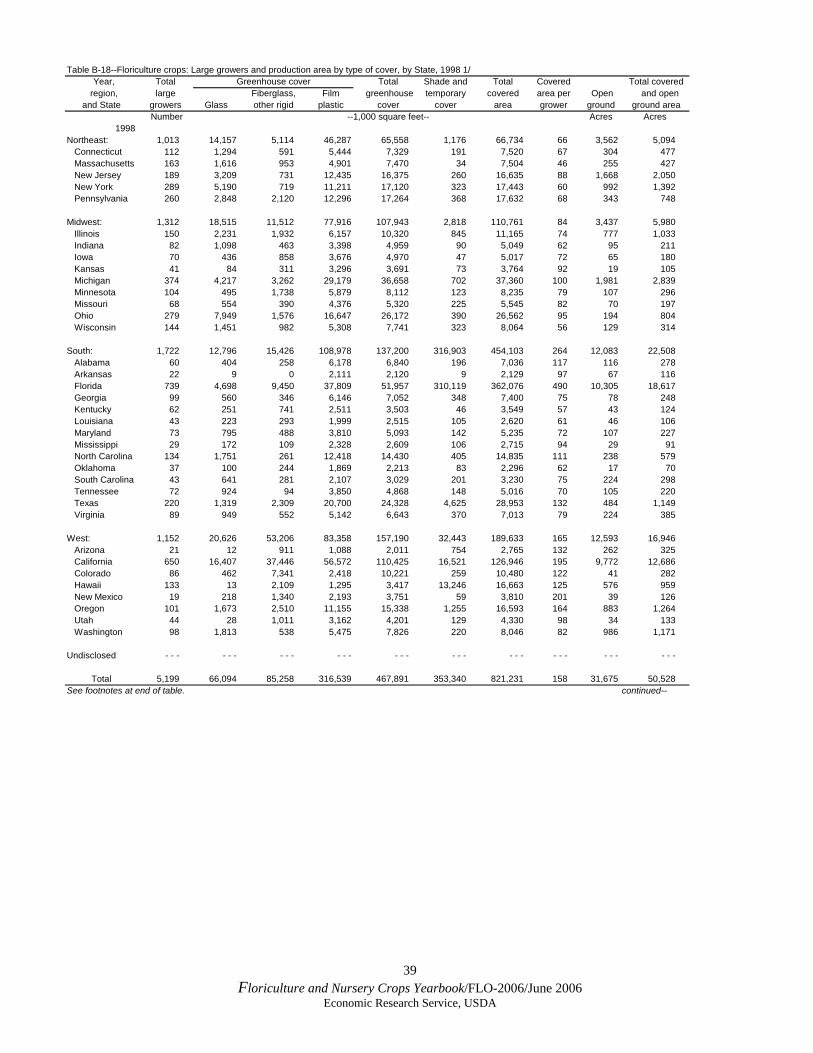
39 Floriculture and Nursery Crops Yearbook/FLO-2006/June 2006
Economic Research Service, USDA
Table B-18--Floriculture crops: Large growers and production area by type of cover, by State, 1998 1/ Year, Total Greenhouse cover Total Shade and Total Covered Total covered
region, large Fiberglass, Film greenhouse temporary covered area per Open and open and State growers Glass other rigid plastic cover cover area grower ground ground area
Number --1,000 square feet-- Acres Acres1998
Northeast: 1,013 14,157 5,114 46,287 65,558 1,176 66,734 66 3,562 5,094 Connecticut 112 1,294 591 5,444 7,329 191 7,520 67 304 477 Massachusetts 163 1,616 953 4,901 7,470 34 7,504 46 255 427 New Jersey 189 3,209 731 12,435 16,375 260 16,635 88 1,668 2,050 New York 289 5,190 719 11,211 17,120 323 17,443 60 992 1,392 Pennsylvania 260 2,848 2,120 12,296 17,264 368 17,632 68 343 748
Midwest: 1,312 18,515 11,512 77,916 107,943 2,818 110,761 84 3,437 5,980 Illinois 150 2,231 1,932 6,157 10,320 845 11,165 74 777 1,033 Indiana 82 1,098 463 3,398 4,959 90 5,049 62 95 211 Iowa 70 436 858 3,676 4,970 47 5,017 72 65 180 Kansas 41 84 311 3,296 3,691 73 3,764 92 19 105 Michigan 374 4,217 3,262 29,179 36,658 702 37,360 100 1,981 2,839 Minnesota 104 495 1,738 5,879 8,112 123 8,235 79 107 296 Missouri 68 554 390 4,376 5,320 225 5,545 82 70 197 Ohio 279 7,949 1,576 16,647 26,172 390 26,562 95 194 804 Wisconsin 144 1,451 982 5,308 7,741 323 8,064 56 129 314
South: 1,722 12,796 15,426 108,978 137,200 316,903 454,103 264 12,083 22,508 Alabama 60 404 258 6,178 6,840 196 7,036 117 116 278 Arkansas 22 9 0 2,111 2,120 9 2,129 97 67 116 Florida 739 4,698 9,450 37,809 51,957 310,119 362,076 490 10,305 18,617 Georgia 99 560 346 6,146 7,052 348 7,400 75 78 248 Kentucky 62 251 741 2,511 3,503 46 3,549 57 43 124 Louisiana 43 223 293 1,999 2,515 105 2,620 61 46 106 Maryland 73 795 488 3,810 5,093 142 5,235 72 107 227 Mississippi 29 172 109 2,328 2,609 106 2,715 94 29 91 North Carolina 134 1,751 261 12,418 14,430 405 14,835 111 238 579 Oklahoma 37 100 244 1,869 2,213 83 2,296 62 17 70 South Carolina 43 641 281 2,107 3,029 201 3,230 75 224 298 Tennessee 72 924 94 3,850 4,868 148 5,016 70 105 220 Texas 220 1,319 2,309 20,700 24,328 4,625 28,953 132 484 1,149 Virginia 89 949 552 5,142 6,643 370 7,013 79 224 385
West: 1,152 20,626 53,206 83,358 157,190 32,443 189,633 165 12,593 16,946 Arizona 21 12 911 1,088 2,011 754 2,765 132 262 325 California 650 16,407 37,446 56,572 110,425 16,521 126,946 195 9,772 12,686 Colorado 86 462 7,341 2,418 10,221 259 10,480 122 41 282 Hawaii 133 13 2,109 1,295 3,417 13,246 16,663 125 576 959 New Mexico 19 218 1,340 2,193 3,751 59 3,810 201 39 126 Oregon 101 1,673 2,510 11,155 15,338 1,255 16,593 164 883 1,264 Utah 44 28 1,011 3,162 4,201 129 4,330 98 34 133 Washington 98 1,813 538 5,475 7,826 220 8,046 82 986 1,171
Undisclosed - - - - - - - - - - - - - - - - - - - - - - - - - - - - - -
Total 5,199 66,094 85,258 316,539 467,891 353,340 821,231 158 31,675 50,528See footnotes at end of table. continued--

40 Floriculture and Nursery Crops Yearbook/FLO-2006/June 2006
Economic Research Service, USDA
Table B-18--Floriculture crops: Large growers and production area by type of cover, by State, 1999 1/ Year, Total Greenhouse cover Total Shade and Total Covered Total covered
region, large Fiberglass, Film greenhouse temporary covered area per Open and open and State growers Glass other rigid plastic cover cover area grower ground ground area
Number --1,000 square feet-- Acres Acres1999
Northeast: 930 14,073 4,572 44,728 63,373 1,417 64,790 70 3,217 4,704 Connecticut 112 1,247 608 4,806 6,661 338 6,999 62 304 465 Massachusetts 146 1,637 723 4,671 7,031 55 7,086 49 267 430 New Jersey 178 2,909 453 11,499 14,861 208 15,069 85 1,826 2,172 New York 252 4,557 780 11,799 17,136 410 17,546 70 553 956 Pennsylvania 242 3,723 2,008 11,953 17,684 406 18,090 75 267 682
Midwest: 1,222 18,019 12,193 74,596 104,808 2,444 107,252 88 2,735 5,197 Illinois 133 2,058 1,922 6,225 10,205 447 10,652 80 292 537 Indiana 81 928 677 3,543 5,148 35 5,183 64 77 196 Iowa 59 347 1,208 3,305 4,860 95 4,955 84 28 142 Kansas 36 70 323 3,367 3,760 25 3,785 105 37 124 Michigan 339 4,152 2,895 26,952 33,999 858 34,857 103 1,832 2,632 Minnesota 102 496 2,022 5,995 8,513 112 8,625 85 88 286 Missouri 59 621 374 4,097 5,092 236 5,328 90 60 182 Ohio 273 7,793 1,667 16,102 25,562 338 25,900 95 228 823 Wisconsin 140 1,554 1,105 5,010 7,669 298 7,967 57 93 276
South: 1,607 13,072 16,526 110,453 140,051 319,537 459,588 286 10,632 21,183 Alabama 70 505 234 7,061 7,800 84 7,884 113 129 310 Arkansas 22 9 0 3,435 3,444 7 3,451 157 151 230 Florida 682 4,309 9,289 38,021 51,619 311,212 362,831 532 8,830 17,159 Georgia 102 615 289 6,193 7,097 313 7,410 73 82 252 Kentucky 64 284 703 2,537 3,524 51 3,575 56 50 132 Louisiana 37 147 180 2,271 2,598 88 2,686 73 41 103 Maryland 61 667 394 4,390 5,451 136 5,587 92 93 221 Mississippi 33 168 120 2,731 3,019 96 3,115 94 28 100 North Carolina 125 2,464 283 12,135 14,882 403 15,285 122 174 525 Oklahoma 30 55 216 1,246 1,517 76 1,593 53 14 51 South Carolina 40 722 157 2,359 3,238 238 3,476 87 249 329 Tennessee 65 842 81 4,344 5,267 114 5,381 83 105 229 Texas 193 1,389 3,893 18,932 24,214 6,426 30,640 159 499 1,202 Virginia 83 896 687 4,798 6,381 293 6,674 80 187 340
West: 1,034 17,496 48,325 78,260 144,081 35,373 179,454 174 11,200 15,320 Arizona 19 10 1,100 1,068 2,178 637 2,815 148 289 354 California 568 13,286 31,891 55,081 100,258 16,669 116,927 206 8,043 10,727 Colorado 82 437 7,389 2,381 10,207 276 10,483 128 68 309 Hawaii 136 18 2,452 1,548 4,018 16,244 20,262 149 799 1,264 New Mexico 17 218 1,306 2,098 3,622 44 3,666 216 6 90 Oregon 79 1,592 2,622 7,346 11,560 1,116 12,676 160 971 1,262 Utah 43 29 1,027 3,444 4,500 207 4,707 109 70 178 Washington 90 1,906 538 5,294 7,738 180 7,918 88 954 1,136
Undisclosed - - - - - - - - - - - - - - - - - - - - - - - - - - - - - -
Total 4,793 62,660 81,616 308,037 452,313 358,771 811,084 169 27,784 46,404See footnotes at end of table. continued--
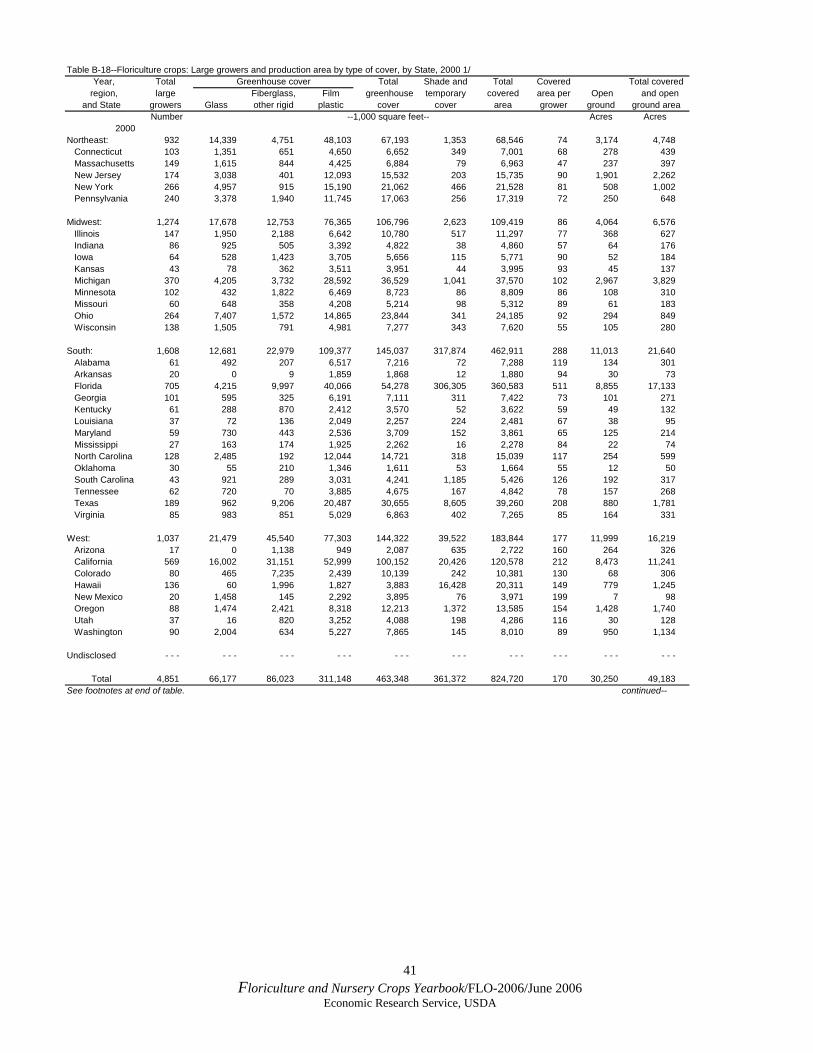
41 Floriculture and Nursery Crops Yearbook/FLO-2006/June 2006
Economic Research Service, USDA
Table B-18--Floriculture crops: Large growers and production area by type of cover, by State, 2000 1/ Year, Total Greenhouse cover Total Shade and Total Covered Total covered
region, large Fiberglass, Film greenhouse temporary covered area per Open and open and State growers Glass other rigid plastic cover cover area grower ground ground area
Number --1,000 square feet-- Acres Acres2000
Northeast: 932 14,339 4,751 48,103 67,193 1,353 68,546 74 3,174 4,748 Connecticut 103 1,351 651 4,650 6,652 349 7,001 68 278 439 Massachusetts 149 1,615 844 4,425 6,884 79 6,963 47 237 397 New Jersey 174 3,038 401 12,093 15,532 203 15,735 90 1,901 2,262 New York 266 4,957 915 15,190 21,062 466 21,528 81 508 1,002 Pennsylvania 240 3,378 1,940 11,745 17,063 256 17,319 72 250 648
Midwest: 1,274 17,678 12,753 76,365 106,796 2,623 109,419 86 4,064 6,576 Illinois 147 1,950 2,188 6,642 10,780 517 11,297 77 368 627 Indiana 86 925 505 3,392 4,822 38 4,860 57 64 176 Iowa 64 528 1,423 3,705 5,656 115 5,771 90 52 184 Kansas 43 78 362 3,511 3,951 44 3,995 93 45 137 Michigan 370 4,205 3,732 28,592 36,529 1,041 37,570 102 2,967 3,829 Minnesota 102 432 1,822 6,469 8,723 86 8,809 86 108 310 Missouri 60 648 358 4,208 5,214 98 5,312 89 61 183 Ohio 264 7,407 1,572 14,865 23,844 341 24,185 92 294 849 Wisconsin 138 1,505 791 4,981 7,277 343 7,620 55 105 280
South: 1,608 12,681 22,979 109,377 145,037 317,874 462,911 288 11,013 21,640 Alabama 61 492 207 6,517 7,216 72 7,288 119 134 301 Arkansas 20 0 9 1,859 1,868 12 1,880 94 30 73 Florida 705 4,215 9,997 40,066 54,278 306,305 360,583 511 8,855 17,133 Georgia 101 595 325 6,191 7,111 311 7,422 73 101 271 Kentucky 61 288 870 2,412 3,570 52 3,622 59 49 132 Louisiana 37 72 136 2,049 2,257 224 2,481 67 38 95 Maryland 59 730 443 2,536 3,709 152 3,861 65 125 214 Mississippi 27 163 174 1,925 2,262 16 2,278 84 22 74 North Carolina 128 2,485 192 12,044 14,721 318 15,039 117 254 599 Oklahoma 30 55 210 1,346 1,611 53 1,664 55 12 50 South Carolina 43 921 289 3,031 4,241 1,185 5,426 126 192 317 Tennessee 62 720 70 3,885 4,675 167 4,842 78 157 268 Texas 189 962 9,206 20,487 30,655 8,605 39,260 208 880 1,781 Virginia 85 983 851 5,029 6,863 402 7,265 85 164 331
West: 1,037 21,479 45,540 77,303 144,322 39,522 183,844 177 11,999 16,219 Arizona 17 0 1,138 949 2,087 635 2,722 160 264 326 California 569 16,002 31,151 52,999 100,152 20,426 120,578 212 8,473 11,241 Colorado 80 465 7,235 2,439 10,139 242 10,381 130 68 306 Hawaii 136 60 1,996 1,827 3,883 16,428 20,311 149 779 1,245 New Mexico 20 1,458 145 2,292 3,895 76 3,971 199 7 98 Oregon 88 1,474 2,421 8,318 12,213 1,372 13,585 154 1,428 1,740 Utah 37 16 820 3,252 4,088 198 4,286 116 30 128 Washington 90 2,004 634 5,227 7,865 145 8,010 89 950 1,134
Undisclosed - - - - - - - - - - - - - - - - - - - - - - - - - - - - - -
Total 4,851 66,177 86,023 311,148 463,348 361,372 824,720 170 30,250 49,183See footnotes at end of table. continued--

42 Floriculture and Nursery Crops Yearbook/FLO-2006/June 2006
Economic Research Service, USDA
Table B-18--Floriculture crops: Large growers and production area by type of cover, by State, 2001 1/ Year, Total Greenhouse cover Total Shade and Total Covered Total covered
region, large Fiberglass, Film greenhouse temporary covered area per Open and open and State growers Glass other rigid plastic cover cover area grower ground ground area
Number --1,000 square feet-- Acres Acres2001
Northeast: 933 15,978 6,224 44,921 67,123 1,824 68,947 74 3,830 5,413 Connecticut 104 1,684 1,389 4,315 7,388 386 7,774 75 351 529 Massachusetts 139 1,601 846 4,094 6,541 102 6,643 48 210 363 New Jersey 177 3,444 749 12,165 16,358 269 16,627 94 2,088 2,470 New York 258 5,840 1,054 11,755 18,649 604 19,253 75 858 1,300 Pennsylvania 255 3,409 2,186 12,592 18,187 463 18,650 73 323 751
Midwest: 1,253 18,875 12,978 76,850 108,703 2,879 111,582 89 4,260 6,822 Illinois 140 2,195 1,821 6,423 10,439 618 11,057 79 222 476 Indiana 81 1,140 1,012 3,539 5,691 56 5,747 71 102 234 Iowa 65 506 1,542 3,563 5,611 54 5,665 87 64 194 Kansas 46 66 409 3,586 4,061 45 4,106 89 55 149 Michigan 360 4,436 3,519 28,161 36,116 1,078 37,194 103 2,894 3,748 Minnesota 98 530 1,962 6,869 9,361 120 9,481 97 52 270 Missouri 66 606 480 4,300 5,386 104 5,490 83 382 508 Ohio 250 8,041 1,431 15,180 24,652 440 25,092 100 323 899 Wisconsin 147 1,355 802 5,229 7,386 364 7,750 53 166 344
South: 1,555 14,147 19,047 108,042 141,236 312,434 453,670 292 9,611 20,026 Alabama 61 661 298 6,858 7,817 189 8,006 131 58 242 Arkansas 16 9 5 1,668 1,682 12 1,694 106 29 68 Florida 656 4,463 12,965 36,160 53,588 300,725 354,313 540 7,785 15,919 Georgia 94 420 393 5,720 6,533 354 6,887 73 90 248 Kentucky 61 413 735 2,650 3,798 78 3,876 64 25 114 Louisiana 39 54 265 1,807 2,126 277 2,403 62 48 103 Maryland 55 933 410 2,711 4,054 54 4,108 75 106 200 Mississippi 31 163 41 2,645 2,849 41 2,890 93 39 105 North Carolina 136 2,871 238 12,338 15,447 398 15,845 117 310 674 Oklahoma 36 55 242 1,344 1,641 39 1,680 47 24 63 South Carolina 43 904 31 3,026 3,961 1,788 5,749 134 442 574 Tennessee 61 848 36 3,899 4,783 35 4,818 79 156 267 Texas 181 1,332 2,879 21,003 25,214 7,829 33,043 183 293 1,052 Virginia 85 1,021 509 6,213 7,743 615 8,358 98 206 398
West: 997 21,214 44,600 79,193 145,007 41,826 186,833 187 11,347 15,636 Arizona 17 0 836 1,419 2,255 829 3,084 181 350 421 California 553 17,329 30,288 54,697 102,314 22,860 125,174 226 7,610 10,484 Colorado 71 377 6,816 2,242 9,435 145 9,580 135 48 268 Hawaii 129 52 1,844 1,793 3,689 16,197 19,886 154 1,026 1,483 New Mexico 21 115 1,344 2,353 3,812 77 3,889 185 11 100 Oregon 81 1,465 2,134 8,646 12,245 1,407 13,652 169 1,199 1,512 Utah 37 18 918 3,053 3,989 116 4,105 111 20 114 Washington 88 1,858 420 4,990 7,268 195 7,463 85 1,083 1,254
Undisclosed - - - - - - - - - - - - - - - - - - - - - - - - - - - - - -
Total 4,738 70,214 82,849 309,006 462,069 358,963 821,032 173 29,048 47,896See footnotes at end of table. continued--

43 Floriculture and Nursery Crops Yearbook/FLO-2006/June 2006
Economic Research Service, USDA
Table B-18--Floriculture crops: Large growers and production area by type of cover, by State, 2002 1/ Year, Total Greenhouse cover Total Shade and Total Covered Total covered
region, large Fiberglass, Film greenhouse temporary covered area per Open and open and State growers Glass other rigid plastic cover cover area grower ground ground area
Number --1,000 square feet-- Acres Acres2002
Northeast: 959 14,490 5,005 45,347 64,842 1,871 66,713 70 3,881 5,413 Connecticut 103 1,376 948 5,115 7,439 377 7,816 76 361 540 Massachusetts 147 1,469 727 4,515 6,711 171 6,882 47 281 439 New Jersey 198 3,761 288 11,178 15,227 514 15,741 80 2,401 2,762 New York 255 4,092 665 12,522 17,279 510 17,789 70 453 861 Pennsylvania 256 3,792 2,377 12,017 18,186 299 18,485 72 385 809
Midwest: 1,280 19,151 11,630 80,328 111,109 2,767 113,876 89 4,887 7,501 Illinois 151 2,495 1,348 7,122 10,965 499 11,464 76 260 523 Indiana 91 1,300 859 4,271 6,430 86 6,516 72 159 309 Iowa 56 343 1,066 3,469 4,878 67 4,945 88 96 210 Kansas 44 79 308 3,457 3,844 62 3,906 89 54 144 Michigan 358 4,412 3,494 30,646 38,552 1,243 39,795 111 3,150 4,064 Minnesota 113 541 2,123 7,228 9,892 141 10,033 89 60 290 Missouri 70 650 479 4,221 5,350 34 5,384 77 428 552 Ohio 245 7,877 1,314 14,238 23,429 393 23,822 97 379 926 Wisconsin 152 1,454 639 5,676 7,769 242 8,011 53 301 485
South: 1,706 15,728 18,911 120,857 155,496 310,342 465,838 273 11,947 22,641 Alabama 58 658 205 6,968 7,831 170 8,001 138 93 277 Arkansas 24 10 9 2,323 2,342 53 2,395 100 178 233 Florida 697 4,770 11,710 42,060 58,540 300,005 358,545 514 8,950 17,181 Georgia 100 620 273 5,550 6,443 394 6,837 68 221 378 Kentucky 62 504 436 2,954 3,894 105 3,999 65 29 121 Louisiana 44 129 550 1,965 2,644 327 2,971 68 64 132 Maryland 85 1,870 639 3,853 6,362 138 6,500 76 158 307 Mississippi 29 160 42 1,665 1,867 31 1,898 65 38 82 North Carolina 137 3,044 243 13,267 16,554 554 17,108 125 323 716 Oklahoma 40 130 345 2,413 2,888 308 3,196 80 459 532 South Carolina 43 779 160 2,717 3,656 1,876 5,532 129 419 546 Tennessee 66 835 36 3,346 4,217 35 4,252 64 226 324 Texas 218 910 3,787 26,718 31,415 5,823 37,238 171 543 1,398 Virginia 103 1,309 476 5,058 6,843 523 7,366 72 246 415
West: 1,029 21,743 45,224 84,661 151,628 44,165 195,793 190 12,185 16,680 Arizona 17 265 841 1,432 2,538 851 3,389 199 261 339 California 559 16,890 29,923 56,967 103,780 23,108 126,888 227 8,272 11,185 Colorado 65 691 6,530 2,589 9,810 128 9,938 153 49 277 Hawaii 143 11 2,061 2,046 4,118 18,079 22,197 155 1,046 1,556 New Mexico 20 135 1,430 2,360 3,925 104 4,029 201 21 113 Oregon 86 1,575 2,093 9,277 12,945 1,611 14,556 169 1,044 1,378 Utah 40 26 1,870 3,659 5,555 98 5,653 141 43 173 Washington 99 2,150 476 6,331 8,957 186 9,143 92 1,449 1,659
Undisclosed - - - - - - - - - - - - - - - - - - - - - - - - - - - - - -
Total 4,974 71,112 80,770 331,193 483,075 359,145 842,220 169 32,900 52,235See footnotes at end of table. continued--
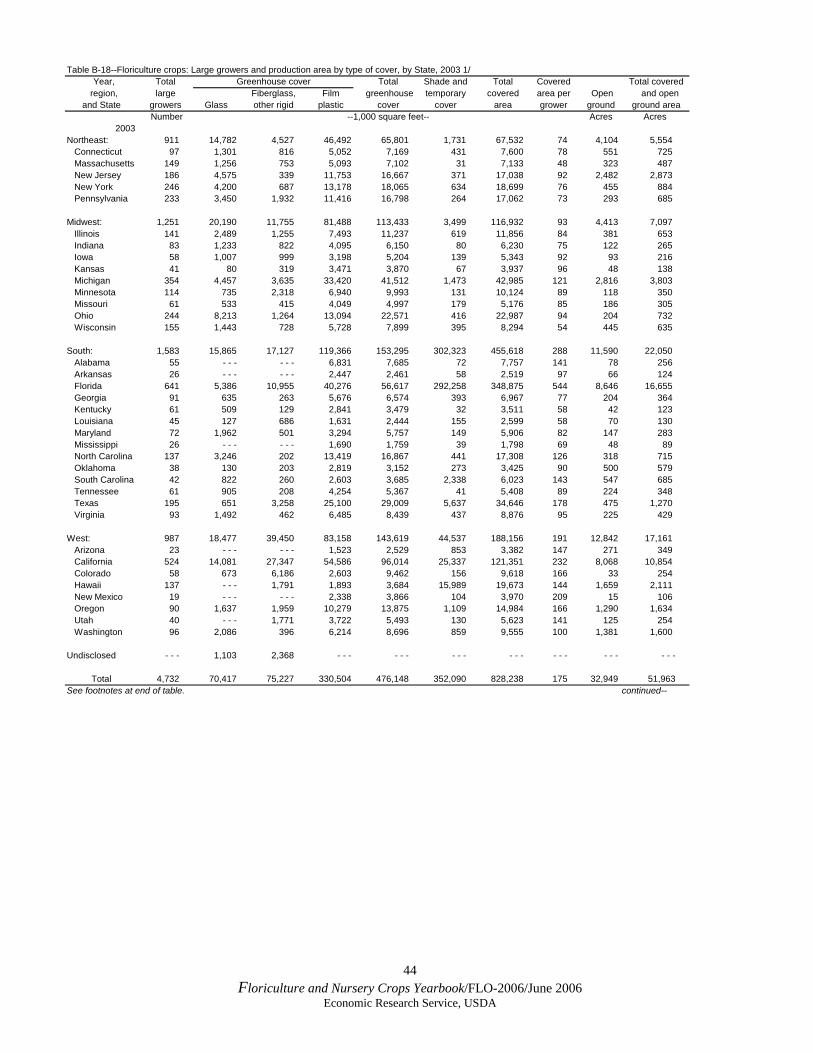
44 Floriculture and Nursery Crops Yearbook/FLO-2006/June 2006
Economic Research Service, USDA
Table B-18--Floriculture crops: Large growers and production area by type of cover, by State, 2003 1/ Year, Total Greenhouse cover Total Shade and Total Covered Total covered
region, large Fiberglass, Film greenhouse temporary covered area per Open and open and State growers Glass other rigid plastic cover cover area grower ground ground area
Number --1,000 square feet-- Acres Acres2003
Northeast: 911 14,782 4,527 46,492 65,801 1,731 67,532 74 4,104 5,554 Connecticut 97 1,301 816 5,052 7,169 431 7,600 78 551 725 Massachusetts 149 1,256 753 5,093 7,102 31 7,133 48 323 487 New Jersey 186 4,575 339 11,753 16,667 371 17,038 92 2,482 2,873 New York 246 4,200 687 13,178 18,065 634 18,699 76 455 884 Pennsylvania 233 3,450 1,932 11,416 16,798 264 17,062 73 293 685
Midwest: 1,251 20,190 11,755 81,488 113,433 3,499 116,932 93 4,413 7,097 Illinois 141 2,489 1,255 7,493 11,237 619 11,856 84 381 653 Indiana 83 1,233 822 4,095 6,150 80 6,230 75 122 265 Iowa 58 1,007 999 3,198 5,204 139 5,343 92 93 216 Kansas 41 80 319 3,471 3,870 67 3,937 96 48 138 Michigan 354 4,457 3,635 33,420 41,512 1,473 42,985 121 2,816 3,803 Minnesota 114 735 2,318 6,940 9,993 131 10,124 89 118 350 Missouri 61 533 415 4,049 4,997 179 5,176 85 186 305 Ohio 244 8,213 1,264 13,094 22,571 416 22,987 94 204 732 Wisconsin 155 1,443 728 5,728 7,899 395 8,294 54 445 635
South: 1,583 15,865 17,127 119,366 153,295 302,323 455,618 288 11,590 22,050 Alabama 55 - - - - - - 6,831 7,685 72 7,757 141 78 256 Arkansas 26 - - - - - - 2,447 2,461 58 2,519 97 66 124 Florida 641 5,386 10,955 40,276 56,617 292,258 348,875 544 8,646 16,655 Georgia 91 635 263 5,676 6,574 393 6,967 77 204 364 Kentucky 61 509 129 2,841 3,479 32 3,511 58 42 123 Louisiana 45 127 686 1,631 2,444 155 2,599 58 70 130 Maryland 72 1,962 501 3,294 5,757 149 5,906 82 147 283 Mississippi 26 - - - - - - 1,690 1,759 39 1,798 69 48 89 North Carolina 137 3,246 202 13,419 16,867 441 17,308 126 318 715 Oklahoma 38 130 203 2,819 3,152 273 3,425 90 500 579 South Carolina 42 822 260 2,603 3,685 2,338 6,023 143 547 685 Tennessee 61 905 208 4,254 5,367 41 5,408 89 224 348 Texas 195 651 3,258 25,100 29,009 5,637 34,646 178 475 1,270 Virginia 93 1,492 462 6,485 8,439 437 8,876 95 225 429
West: 987 18,477 39,450 83,158 143,619 44,537 188,156 191 12,842 17,161 Arizona 23 - - - - - - 1,523 2,529 853 3,382 147 271 349 California 524 14,081 27,347 54,586 96,014 25,337 121,351 232 8,068 10,854 Colorado 58 673 6,186 2,603 9,462 156 9,618 166 33 254 Hawaii 137 - - - 1,791 1,893 3,684 15,989 19,673 144 1,659 2,111 New Mexico 19 - - - - - - 2,338 3,866 104 3,970 209 15 106 Oregon 90 1,637 1,959 10,279 13,875 1,109 14,984 166 1,290 1,634 Utah 40 - - - 1,771 3,722 5,493 130 5,623 141 125 254 Washington 96 2,086 396 6,214 8,696 859 9,555 100 1,381 1,600
Undisclosed - - - 1,103 2,368 - - - - - - - - - - - - - - - - - - - - -
Total 4,732 70,417 75,227 330,504 476,148 352,090 828,238 175 32,949 51,963See footnotes at end of table. continued--
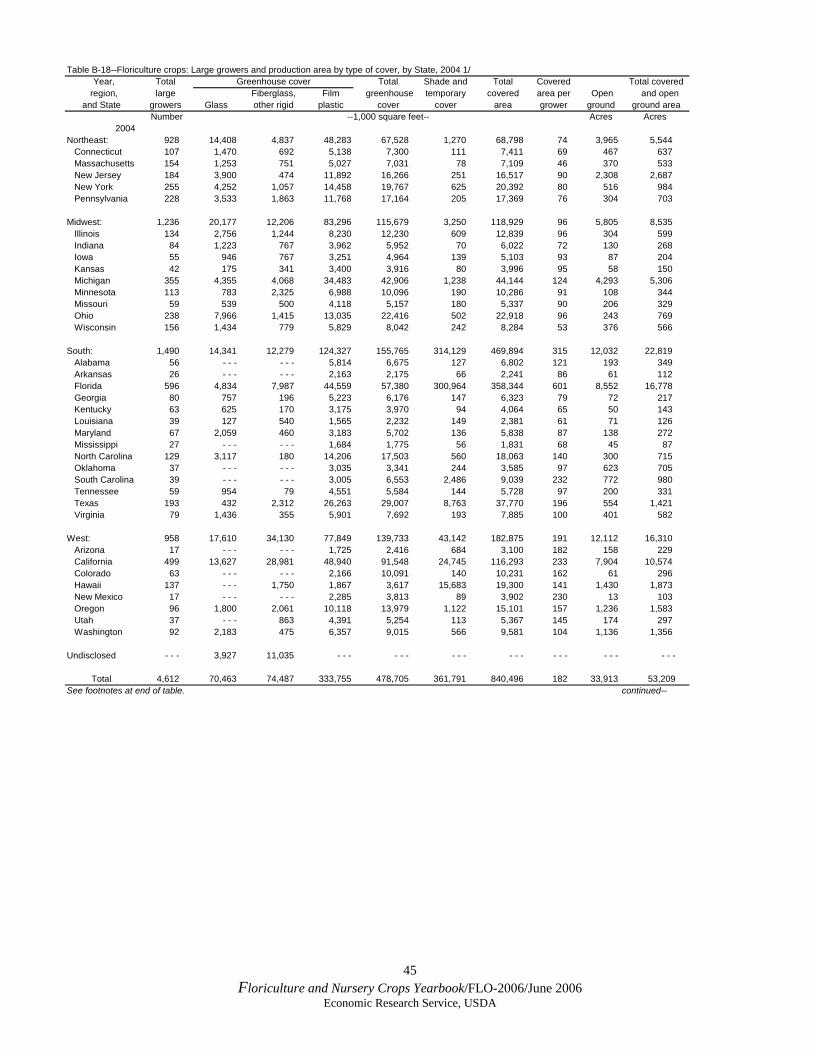
45 Floriculture and Nursery Crops Yearbook/FLO-2006/June 2006
Economic Research Service, USDA
Table B-18--Floriculture crops: Large growers and production area by type of cover, by State, 2004 1/ Year, Total Greenhouse cover Total Shade and Total Covered Total covered
region, large Fiberglass, Film greenhouse temporary covered area per Open and open and State growers Glass other rigid plastic cover cover area grower ground ground area
Number --1,000 square feet-- Acres Acres2004
Northeast: 928 14,408 4,837 48,283 67,528 1,270 68,798 74 3,965 5,544 Connecticut 107 1,470 692 5,138 7,300 111 7,411 69 467 637 Massachusetts 154 1,253 751 5,027 7,031 78 7,109 46 370 533 New Jersey 184 3,900 474 11,892 16,266 251 16,517 90 2,308 2,687 New York 255 4,252 1,057 14,458 19,767 625 20,392 80 516 984 Pennsylvania 228 3,533 1,863 11,768 17,164 205 17,369 76 304 703
Midwest: 1,236 20,177 12,206 83,296 115,679 3,250 118,929 96 5,805 8,535 Illinois 134 2,756 1,244 8,230 12,230 609 12,839 96 304 599 Indiana 84 1,223 767 3,962 5,952 70 6,022 72 130 268 Iowa 55 946 767 3,251 4,964 139 5,103 93 87 204 Kansas 42 175 341 3,400 3,916 80 3,996 95 58 150 Michigan 355 4,355 4,068 34,483 42,906 1,238 44,144 124 4,293 5,306 Minnesota 113 783 2,325 6,988 10,096 190 10,286 91 108 344 Missouri 59 539 500 4,118 5,157 180 5,337 90 206 329 Ohio 238 7,966 1,415 13,035 22,416 502 22,918 96 243 769 Wisconsin 156 1,434 779 5,829 8,042 242 8,284 53 376 566
South: 1,490 14,341 12,279 124,327 155,765 314,129 469,894 315 12,032 22,819 Alabama 56 - - - - - - 5,814 6,675 127 6,802 121 193 349 Arkansas 26 - - - - - - 2,163 2,175 66 2,241 86 61 112 Florida 596 4,834 7,987 44,559 57,380 300,964 358,344 601 8,552 16,778 Georgia 80 757 196 5,223 6,176 147 6,323 79 72 217 Kentucky 63 625 170 3,175 3,970 94 4,064 65 50 143 Louisiana 39 127 540 1,565 2,232 149 2,381 61 71 126 Maryland 67 2,059 460 3,183 5,702 136 5,838 87 138 272 Mississippi 27 - - - - - - 1,684 1,775 56 1,831 68 45 87 North Carolina 129 3,117 180 14,206 17,503 560 18,063 140 300 715 Oklahoma 37 - - - - - - 3,035 3,341 244 3,585 97 623 705 South Carolina 39 - - - - - - 3,005 6,553 2,486 9,039 232 772 980 Tennessee 59 954 79 4,551 5,584 144 5,728 97 200 331 Texas 193 432 2,312 26,263 29,007 8,763 37,770 196 554 1,421 Virginia 79 1,436 355 5,901 7,692 193 7,885 100 401 582
West: 958 17,610 34,130 77,849 139,733 43,142 182,875 191 12,112 16,310 Arizona 17 - - - - - - 1,725 2,416 684 3,100 182 158 229 California 499 13,627 28,981 48,940 91,548 24,745 116,293 233 7,904 10,574 Colorado 63 - - - - - - 2,166 10,091 140 10,231 162 61 296 Hawaii 137 - - - 1,750 1,867 3,617 15,683 19,300 141 1,430 1,873 New Mexico 17 - - - - - - 2,285 3,813 89 3,902 230 13 103 Oregon 96 1,800 2,061 10,118 13,979 1,122 15,101 157 1,236 1,583 Utah 37 - - - 863 4,391 5,254 113 5,367 145 174 297 Washington 92 2,183 475 6,357 9,015 566 9,581 104 1,136 1,356
Undisclosed - - - 3,927 11,035 - - - - - - - - - - - - - - - - - - - - -
Total 4,612 70,463 74,487 333,755 478,705 361,791 840,496 182 33,913 53,209See footnotes at end of table. continued--

46 Floriculture and Nursery Crops Yearbook/FLO-2006/June 2006
Economic Research Service, USDA
Table B-18--Floriculture crops: Large growers and production area by type of cover, by State, 2005 1/
Year, Total Greenhouse cover Total Shade and Total Covered Total covered region, large Fiberglass, Film greenhouse temporary covered area per Open and open
and State growers Glass other rigid plastic cover cover area grower ground ground area Number --1,000 square feet-- Acres Acres
2005Northeast: 903 14,082 4,283 47,495 65,860 1,406 67,266 74 4,024 5,568 Connecticut 101 1,780 705 4,958 7,443 173 7,616 75 521 696 Massachusetts 138 1,194 677 4,728 6,599 90 6,689 48 372 526 New Jersey 184 3,920 354 11,545 15,819 303 16,122 88 2,275 2,645 New York 250 3,942 895 14,651 19,488 491 19,979 80 542 1,001 Pennsylvania 230 3,246 1,652 11,613 16,511 349 16,860 73 314 701
Midwest: 1,201 19,159 12,045 84,669 115,873 3,058 118,931 99 6,254 8,984 Illinois 134 2,348 1,298 9,074 12,720 735 13,455 100 394 703 Indiana 83 1,093 788 4,000 5,881 69 5,950 72 157 294 Iowa 53 1,146 779 4,089 6,014 66 6,080 115 71 211 Kansas 37 187 317 3,392 3,896 88 3,984 108 43 134 Michigan 341 4,125 4,173 32,847 41,145 1,040 42,185 124 4,590 5,558 Minnesota 107 761 2,068 7,527 10,356 193 10,549 99 133 375 Missouri 60 579 506 4,065 5,150 185 5,335 89 201 323 Ohio 234 7,493 1,223 14,106 22,822 390 23,212 99 275 808 Wisconsin 152 1,427 893 5,569 7,889 292 8,181 54 390 578
South: 1,386 13,589 13,218 130,001 161,612 289,174 450,786 325 11,863 22,212 Alabama 54 - - - - - - 5,658 6,443 88 6,531 121 196 346 Arkansas 24 - - - - - - 2,206 2,218 83 2,301 96 63 116 Florida 541 4,385 8,206 52,046 64,637 275,692 340,329 629 8,085 15,898 Georgia 72 718 105 5,005 5,828 168 5,996 83 85 223 Kentucky 63 612 115 3,417 4,144 184 4,328 69 52 151 Louisiana 36 127 840 1,273 2,240 147 2,387 66 64 119 Maryland 63 2,077 383 3,021 5,481 169 5,650 90 129 259 Mississippi 20 - - - - - - 1,357 1,403 50 1,453 73 34 67 North Carolina 130 2,916 581 14,276 17,773 386 18,159 140 496 913 Oklahoma 37 - - - - - - 3,237 3,659 241 3,900 105 559 649 South Carolina 41 - - - - - - 2,877 6,416 2,468 8,884 217 873 1,077 Tennessee 55 951 180 4,393 5,524 95 5,619 102 232 361 Texas 191 432 2,478 26,127 29,037 9,154 38,191 200 563 1,440 Virginia 59 1,371 330 5,108 6,809 249 7,058 120 432 594
West: 922 16,871 35,981 78,551 140,984 41,380 182,364 198 12,393 16,579 Arizona 15 - - - 623 1,631 2,254 686 2,940 196 225 292 California 480 13,105 29,274 50,562 92,941 23,340 116,281 242 7,789 10,458 Colorado 59 - - - - - - 2,024 9,371 66 9,437 160 63 280 Hawaii 134 - - - 1,544 2,057 3,601 15,915 19,516 146 1,521 1,969 New Mexico 16 - - - - - - 2,273 4,507 94 4,601 288 14 120 Oregon 94 1,812 2,064 10,502 14,378 1,039 15,417 164 1,362 1,716 Utah 38 - - - 880 4,186 5,066 106 5,172 136 151 270 Washington 86 1,954 1,596 5,316 8,866 134 9,000 105 1,268 1,475
Undisclosed - - - 4,228 10,157 - - - - - - - - - - - - - - - - - - - - -
Total 4,412 67,929 75,684 340,716 484,329 335,018 819,347 186 34,534 53,344- - - = Not available. 1/ Growers with operations of $100,000+ in annual floriculture sales. Crops include cut flowers, cut cultivated greens, potted flowering plants, potted foliage plants,bedding and garden plants, and propagative materials. Totals may not add due to rounding. Growers are located in the 36 surveyed States.Source: USDA, NASS, Floriculture Crops .
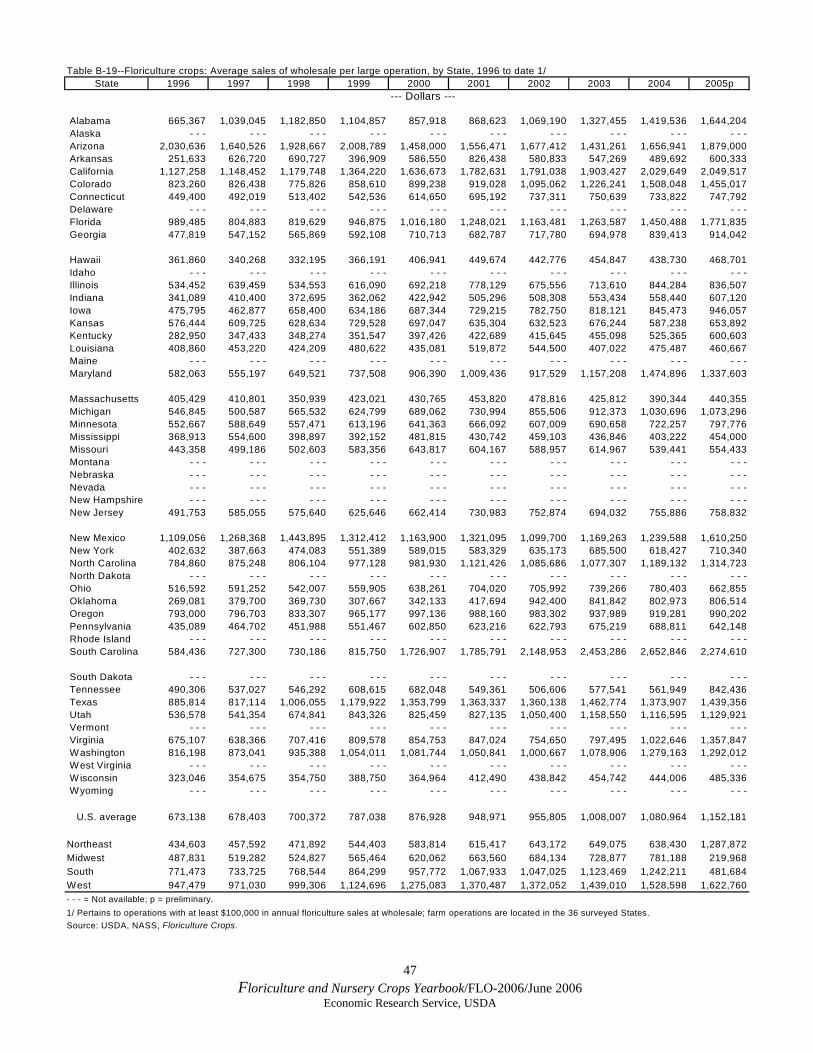
47 Floriculture and Nursery Crops Yearbook/FLO-2006/June 2006
Economic Research Service, USDA
Table B-19--Floriculture crops: Average sales of wholesale per large operation, by State, 1996 to date 1/State 1996 1997 1998 1999 2000 2001 2002 2003 2004 2005p
--- Dollars ---
Alabama 665,367 1,039,045 1,182,850 1,104,857 857,918 868,623 1,069,190 1,327,455 1,419,536 1,644,204 Alaska - - - - - - - - - - - - - - - - - - - - - - - - - - - - - - Arizona 2,030,636 1,640,526 1,928,667 2,008,789 1,458,000 1,556,471 1,677,412 1,431,261 1,656,941 1,879,000 Arkansas 251,633 626,720 690,727 396,909 586,550 826,438 580,833 547,269 489,692 600,333 California 1,127,258 1,148,452 1,179,748 1,364,220 1,636,673 1,782,631 1,791,038 1,903,427 2,029,649 2,049,517 Colorado 823,260 826,438 775,826 858,610 899,238 919,028 1,095,062 1,226,241 1,508,048 1,455,017 Connecticut 449,400 492,019 513,402 542,536 614,650 695,192 737,311 750,639 733,822 747,792 Delaware - - - - - - - - - - - - - - - - - - - - - - - - - - - - - - Florida 989,485 804,883 819,629 946,875 1,016,180 1,248,021 1,163,481 1,263,587 1,450,488 1,771,835 Georgia 477,819 547,152 565,869 592,108 710,713 682,787 717,780 694,978 839,413 914,042
Hawaii 361,860 340,268 332,195 366,191 406,941 449,674 442,776 454,847 438,730 468,701 Idaho - - - - - - - - - - - - - - - - - - - - - - - - - - - - - - Illinois 534,452 639,459 534,553 616,090 692,218 778,129 675,556 713,610 844,284 836,507 Indiana 341,089 410,400 372,695 362,062 422,942 505,296 508,308 553,434 558,440 607,120 Iowa 475,795 462,877 658,400 634,186 687,344 729,215 782,750 818,121 845,473 946,057 Kansas 576,444 609,725 628,634 729,528 697,047 635,304 632,523 676,244 587,238 653,892 Kentucky 282,950 347,433 348,274 351,547 397,426 422,689 415,645 455,098 525,365 600,603 Louisiana 408,860 453,220 424,209 480,622 435,081 519,872 544,500 407,022 475,487 460,667 Maine - - - - - - - - - - - - - - - - - - - - - - - - - - - - - - Maryland 582,063 555,197 649,521 737,508 906,390 1,009,436 917,529 1,157,208 1,474,896 1,337,603
Massachusetts 405,429 410,801 350,939 423,021 430,765 453,820 478,816 425,812 390,344 440,355 Michigan 546,845 500,587 565,532 624,799 689,062 730,994 855,506 912,373 1,030,696 1,073,296 Minnesota 552,667 588,649 557,471 613,196 641,363 666,092 607,009 690,658 722,257 797,776 Mississippi 368,913 554,600 398,897 392,152 481,815 430,742 459,103 436,846 403,222 454,000 Missouri 443,358 499,186 502,603 583,356 643,817 604,167 588,957 614,967 539,441 554,433 Montana - - - - - - - - - - - - - - - - - - - - - - - - - - - - - - Nebraska - - - - - - - - - - - - - - - - - - - - - - - - - - - - - - Nevada - - - - - - - - - - - - - - - - - - - - - - - - - - - - - - New Hampshire - - - - - - - - - - - - - - - - - - - - - - - - - - - - - - New Jersey 491,753 585,055 575,640 625,646 662,414 730,983 752,874 694,032 755,886 758,832
New Mexico 1,109,056 1,268,368 1,443,895 1,312,412 1,163,900 1,321,095 1,099,700 1,169,263 1,239,588 1,610,250 New York 402,632 387,663 474,083 551,389 589,015 583,329 635,173 685,500 618,427 710,340 North Carolina 784,860 875,248 806,104 977,128 981,930 1,121,426 1,085,686 1,077,307 1,189,132 1,314,723 North Dakota - - - - - - - - - - - - - - - - - - - - - - - - - - - - - - Ohio 516,592 591,252 542,007 559,905 638,261 704,020 705,992 739,266 780,403 662,855 Oklahoma 269,081 379,700 369,730 307,667 342,133 417,694 942,400 841,842 802,973 806,514 Oregon 793,000 796,703 833,307 965,177 997,136 988,160 983,302 937,989 919,281 990,202 Pennsylvania 435,089 464,702 451,988 551,467 602,850 623,216 622,793 675,219 688,811 642,148 Rhode Island - - - - - - - - - - - - - - - - - - - - - - - - - - - - - - South Carolina 584,436 727,300 730,186 815,750 1,726,907 1,785,791 2,148,953 2,453,286 2,652,846 2,274,610
South Dakota - - - - - - - - - - - - - - - - - - - - - - - - - - - - - - Tennessee 490,306 537,027 546,292 608,615 682,048 549,361 506,606 577,541 561,949 842,436 Texas 885,814 817,114 1,006,055 1,179,922 1,353,799 1,363,337 1,360,138 1,462,774 1,373,907 1,439,356 Utah 536,578 541,354 674,841 843,326 825,459 827,135 1,050,400 1,158,550 1,116,595 1,129,921 Vermont - - - - - - - - - - - - - - - - - - - - - - - - - - - - - - Virginia 675,107 638,366 707,416 809,578 854,753 847,024 754,650 797,495 1,022,646 1,357,847 Washington 816,198 873,041 935,388 1,054,011 1,081,744 1,050,841 1,000,667 1,078,906 1,279,163 1,292,012 West Virginia - - - - - - - - - - - - - - - - - - - - - - - - - - - - - - W isconsin 323,046 354,675 354,750 388,750 364,964 412,490 438,842 454,742 444,006 485,336 Wyoming - - - - - - - - - - - - - - - - - - - - - - - - - - - - - -
U.S. average 673,138 678,403 700,372 787,038 876,928 948,971 955,805 1,008,007 1,080,964 1,152,181
Northeast 434,603 457,592 471,892 544,403 583,814 615,417 643,172 649,075 638,430 1,287,872Midwest 487,831 519,282 524,827 565,464 620,062 663,560 684,134 728,877 781,188 219,968South 771,473 733,725 768,544 864,299 957,772 1,067,933 1,047,025 1,123,469 1,242,211 481,684West 947,479 971,030 999,306 1,124,696 1,275,083 1,370,487 1,372,052 1,439,010 1,528,598 1,622,760- - - = Not available; p = preliminary.1/ Pertains to operations with at least $100,000 in annual floriculture sales at wholesale; farm operations are located in the 36 surveyed States.Source: USDA, NASS, Floriculture Crops.
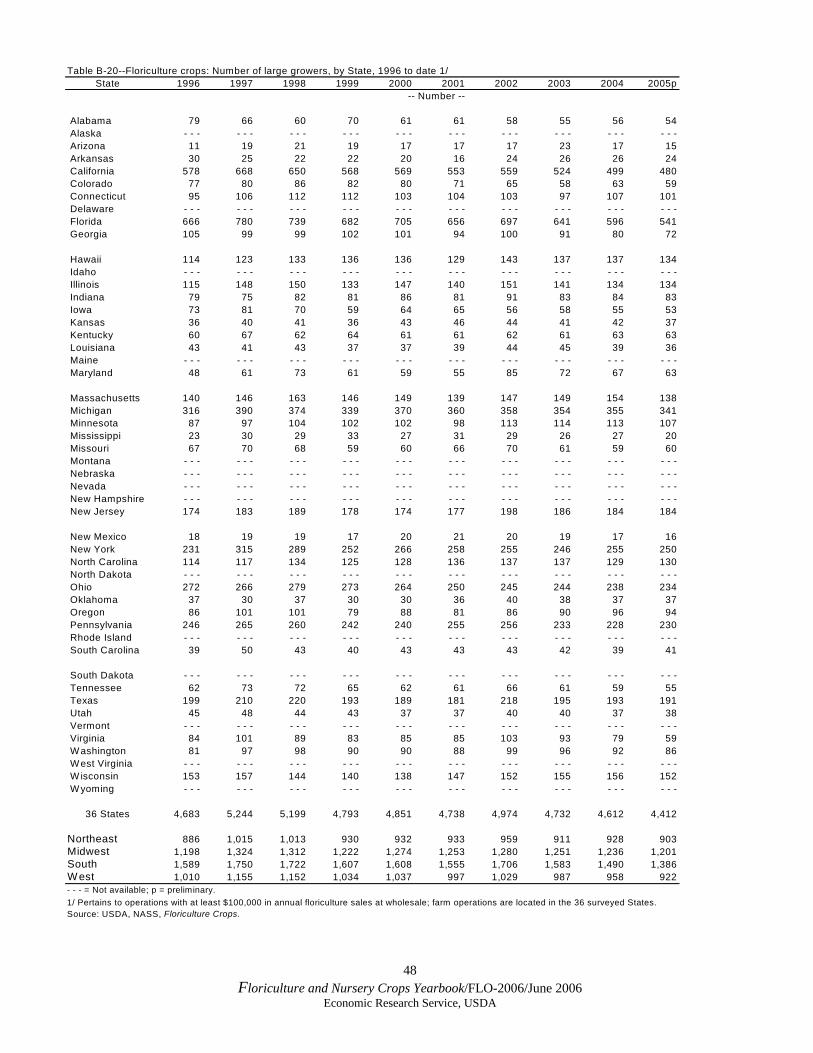
48 Floriculture and Nursery Crops Yearbook/FLO-2006/June 2006
Economic Research Service, USDA
Table B-20--Floriculture crops: Number of large growers, by State, 1996 to date 1/State 1996 1997 1998 1999 2000 2001 2002 2003 2004 2005p
-- Number --
Alabama 79 66 60 70 61 61 58 55 56 54 Alaska - - - - - - - - - - - - - - - - - - - - - - - - - - - - - - Arizona 11 19 21 19 17 17 17 23 17 15 Arkansas 30 25 22 22 20 16 24 26 26 24 California 578 668 650 568 569 553 559 524 499 480 Colorado 77 80 86 82 80 71 65 58 63 59 Connecticut 95 106 112 112 103 104 103 97 107 101 Delaware - - - - - - - - - - - - - - - - - - - - - - - - - - - - - - Florida 666 780 739 682 705 656 697 641 596 541 Georgia 105 99 99 102 101 94 100 91 80 72
Hawaii 114 123 133 136 136 129 143 137 137 134 Idaho - - - - - - - - - - - - - - - - - - - - - - - - - - - - - - Illinois 115 148 150 133 147 140 151 141 134 134 Indiana 79 75 82 81 86 81 91 83 84 83 Iowa 73 81 70 59 64 65 56 58 55 53 Kansas 36 40 41 36 43 46 44 41 42 37 Kentucky 60 67 62 64 61 61 62 61 63 63 Louisiana 43 41 43 37 37 39 44 45 39 36 Maine - - - - - - - - - - - - - - - - - - - - - - - - - - - - - - Maryland 48 61 73 61 59 55 85 72 67 63
Massachusetts 140 146 163 146 149 139 147 149 154 138 Michigan 316 390 374 339 370 360 358 354 355 341 Minnesota 87 97 104 102 102 98 113 114 113 107 Mississippi 23 30 29 33 27 31 29 26 27 20 Missouri 67 70 68 59 60 66 70 61 59 60 Montana - - - - - - - - - - - - - - - - - - - - - - - - - - - - - - Nebraska - - - - - - - - - - - - - - - - - - - - - - - - - - - - - - Nevada - - - - - - - - - - - - - - - - - - - - - - - - - - - - - - New Hampshire - - - - - - - - - - - - - - - - - - - - - - - - - - - - - - New Jersey 174 183 189 178 174 177 198 186 184 184
New Mexico 18 19 19 17 20 21 20 19 17 16 New York 231 315 289 252 266 258 255 246 255 250 North Carolina 114 117 134 125 128 136 137 137 129 130 North Dakota - - - - - - - - - - - - - - - - - - - - - - - - - - - - - - Ohio 272 266 279 273 264 250 245 244 238 234 Oklahoma 37 30 37 30 30 36 40 38 37 37 Oregon 86 101 101 79 88 81 86 90 96 94 Pennsylvania 246 265 260 242 240 255 256 233 228 230 Rhode Island - - - - - - - - - - - - - - - - - - - - - - - - - - - - - - South Carolina 39 50 43 40 43 43 43 42 39 41
South Dakota - - - - - - - - - - - - - - - - - - - - - - - - - - - - - - Tennessee 62 73 72 65 62 61 66 61 59 55 Texas 199 210 220 193 189 181 218 195 193 191 Utah 45 48 44 43 37 37 40 40 37 38 Vermont - - - - - - - - - - - - - - - - - - - - - - - - - - - - - - Virginia 84 101 89 83 85 85 103 93 79 59 W ashington 81 97 98 90 90 88 99 96 92 86 W est Virginia - - - - - - - - - - - - - - - - - - - - - - - - - - - - - - W isconsin 153 157 144 140 138 147 152 155 156 152 W yoming - - - - - - - - - - - - - - - - - - - - - - - - - - - - - -
36 States 4,683 5,244 5,199 4,793 4,851 4,738 4,974 4,732 4,612 4,412
Northeast 886 1,015 1,013 930 932 933 959 911 928 903Midwest 1,198 1,324 1,312 1,222 1,274 1,253 1,280 1,251 1,236 1,201South 1,589 1,750 1,722 1,607 1,608 1,555 1,706 1,583 1,490 1,386W est 1,010 1,155 1,152 1,034 1,037 997 1,029 987 958 922- - - = Not available; p = preliminary.1/ Pertains to operations with at least $100,000 in annual floriculture sales at wholesale; farm operations are located in the 36 surveyed States.Source: USDA, NASS, Floriculture Crops.
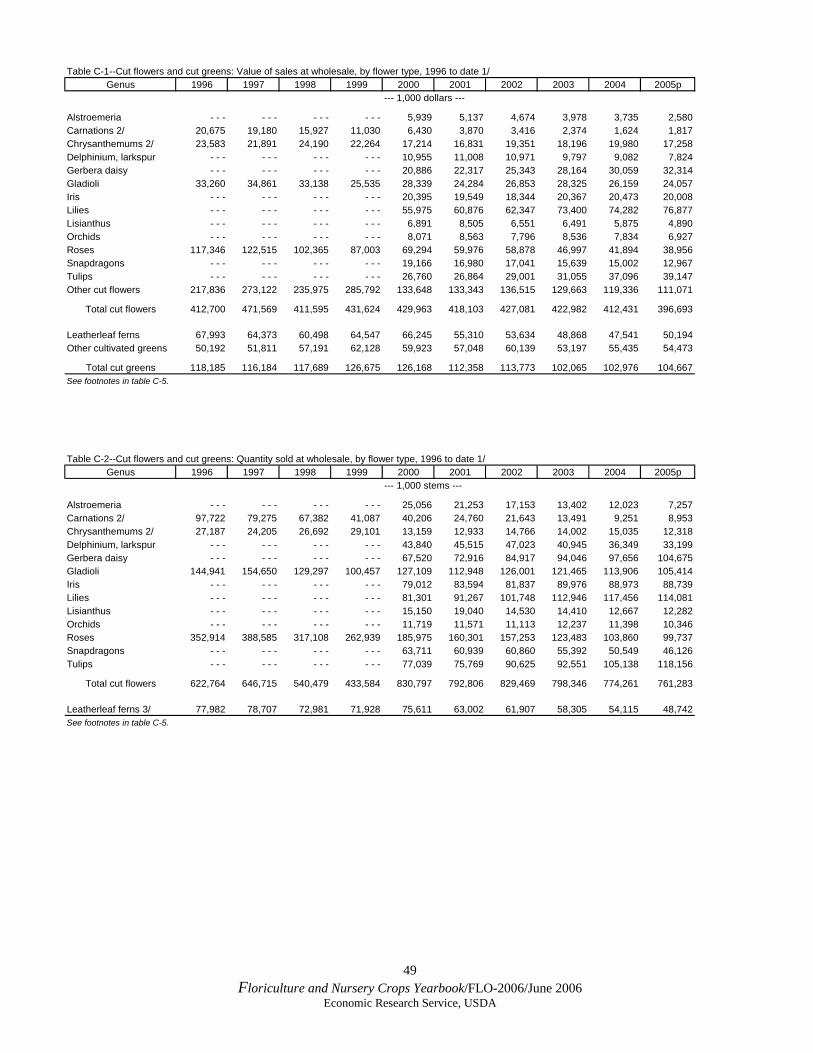
49 Floriculture and Nursery Crops Yearbook/FLO-2006/June 2006
Economic Research Service, USDA
Table C-1--Cut flowers and cut greens: Value of sales at wholesale, by flower type, 1996 to date 1/Genus 1996 1997 1998 1999 2000 2001 2002 2003 2004 2005p
--- 1,000 dollars ---
Alstroemeria - - - - - - - - - - - - 5,939 5,137 4,674 3,978 3,735 2,580Carnations 2/ 20,675 19,180 15,927 11,030 6,430 3,870 3,416 2,374 1,624 1,817Chrysanthemums 2/ 23,583 21,891 24,190 22,264 17,214 16,831 19,351 18,196 19,980 17,258Delphinium, larkspur - - - - - - - - - - - - 10,955 11,008 10,971 9,797 9,082 7,824Gerbera daisy - - - - - - - - - - - - 20,886 22,317 25,343 28,164 30,059 32,314Gladioli 33,260 34,861 33,138 25,535 28,339 24,284 26,853 28,325 26,159 24,057Iris - - - - - - - - - - - - 20,395 19,549 18,344 20,367 20,473 20,008Lilies - - - - - - - - - - - - 55,975 60,876 62,347 73,400 74,282 76,877Lisianthus - - - - - - - - - - - - 6,891 8,505 6,551 6,491 5,875 4,890Orchids - - - - - - - - - - - - 8,071 8,563 7,796 8,536 7,834 6,927Roses 117,346 122,515 102,365 87,003 69,294 59,976 58,878 46,997 41,894 38,956Snapdragons - - - - - - - - - - - - 19,166 16,980 17,041 15,639 15,002 12,967Tulips - - - - - - - - - - - - 26,760 26,864 29,001 31,055 37,096 39,147Other cut flowers 217,836 273,122 235,975 285,792 133,648 133,343 136,515 129,663 119,336 111,071
Total cut flowers 412,700 471,569 411,595 431,624 429,963 418,103 427,081 422,982 412,431 396,693
Leatherleaf ferns 67,993 64,373 60,498 64,547 66,245 55,310 53,634 48,868 47,541 50,194Other cultivated greens 50,192 51,811 57,191 62,128 59,923 57,048 60,139 53,197 55,435 54,473
Total cut greens 118,185 116,184 117,689 126,675 126,168 112,358 113,773 102,065 102,976 104,667See footnotes in table C-5.
Table C-2--Cut flowers and cut greens: Quantity sold at wholesale, by flower type, 1996 to date 1/Genus 1996 1997 1998 1999 2000 2001 2002 2003 2004 2005p
--- 1,000 stems ---
Alstroemeria - - - - - - - - - - - - 25,056 21,253 17,153 13,402 12,023 7,257Carnations 2/ 97,722 79,275 67,382 41,087 40,206 24,760 21,643 13,491 9,251 8,953Chrysanthemums 2/ 27,187 24,205 26,692 29,101 13,159 12,933 14,766 14,002 15,035 12,318Delphinium, larkspur - - - - - - - - - - - - 43,840 45,515 47,023 40,945 36,349 33,199Gerbera daisy - - - - - - - - - - - - 67,520 72,916 84,917 94,046 97,656 104,675Gladioli 144,941 154,650 129,297 100,457 127,109 112,948 126,001 121,465 113,906 105,414Iris - - - - - - - - - - - - 79,012 83,594 81,837 89,976 88,973 88,739Lilies - - - - - - - - - - - - 81,301 91,267 101,748 112,946 117,456 114,081Lisianthus - - - - - - - - - - - - 15,150 19,040 14,530 14,410 12,667 12,282Orchids - - - - - - - - - - - - 11,719 11,571 11,113 12,237 11,398 10,346Roses 352,914 388,585 317,108 262,939 185,975 160,301 157,253 123,483 103,860 99,737Snapdragons - - - - - - - - - - - - 63,711 60,939 60,860 55,392 50,549 46,126Tulips - - - - - - - - - - - - 77,039 75,769 90,625 92,551 105,138 118,156
Total cut flowers 622,764 646,715 540,479 433,584 830,797 792,806 829,469 798,346 774,261 761,283
Leatherleaf ferns 3/ 77,982 78,707 72,981 71,928 75,611 63,002 61,907 58,305 54,115 48,742See footnotes in table C-5.
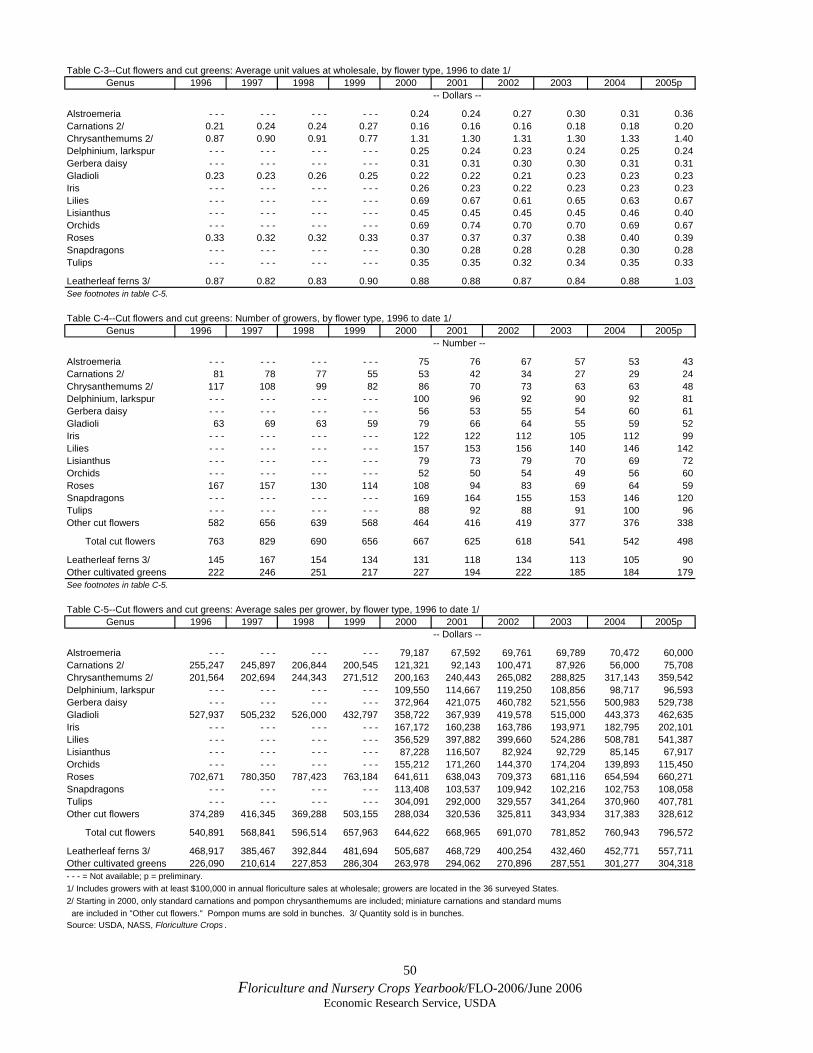
50 Floriculture and Nursery Crops Yearbook/FLO-2006/June 2006
Economic Research Service, USDA
Table C-3--Cut flowers and cut greens: Average unit values at wholesale, by flower type, 1996 to date 1/Genus 1996 1997 1998 1999 2000 2001 2002 2003 2004 2005p
-- Dollars --
Alstroemeria - - - - - - - - - - - - 0.24 0.24 0.27 0.30 0.31 0.36Carnations 2/ 0.21 0.24 0.24 0.27 0.16 0.16 0.16 0.18 0.18 0.20Chrysanthemums 2/ 0.87 0.90 0.91 0.77 1.31 1.30 1.31 1.30 1.33 1.40Delphinium, larkspur - - - - - - - - - - - - 0.25 0.24 0.23 0.24 0.25 0.24Gerbera daisy - - - - - - - - - - - - 0.31 0.31 0.30 0.30 0.31 0.31Gladioli 0.23 0.23 0.26 0.25 0.22 0.22 0.21 0.23 0.23 0.23Iris - - - - - - - - - - - - 0.26 0.23 0.22 0.23 0.23 0.23Lilies - - - - - - - - - - - - 0.69 0.67 0.61 0.65 0.63 0.67Lisianthus - - - - - - - - - - - - 0.45 0.45 0.45 0.45 0.46 0.40Orchids - - - - - - - - - - - - 0.69 0.74 0.70 0.70 0.69 0.67Roses 0.33 0.32 0.32 0.33 0.37 0.37 0.37 0.38 0.40 0.39Snapdragons - - - - - - - - - - - - 0.30 0.28 0.28 0.28 0.30 0.28Tulips - - - - - - - - - - - - 0.35 0.35 0.32 0.34 0.35 0.33
Leatherleaf ferns 3/ 0.87 0.82 0.83 0.90 0.88 0.88 0.87 0.84 0.88 1.03See footnotes in table C-5.
Table C-4--Cut flowers and cut greens: Number of growers, by flower type, 1996 to date 1/Genus 1996 1997 1998 1999 2000 2001 2002 2003 2004 2005p
-- Number --
Alstroemeria - - - - - - - - - - - - 75 76 67 57 53 43Carnations 2/ 81 78 77 55 53 42 34 27 29 24Chrysanthemums 2/ 117 108 99 82 86 70 73 63 63 48Delphinium, larkspur - - - - - - - - - - - - 100 96 92 90 92 81Gerbera daisy - - - - - - - - - - - - 56 53 55 54 60 61Gladioli 63 69 63 59 79 66 64 55 59 52Iris - - - - - - - - - - - - 122 122 112 105 112 99Lilies - - - - - - - - - - - - 157 153 156 140 146 142Lisianthus - - - - - - - - - - - - 79 73 79 70 69 72Orchids - - - - - - - - - - - - 52 50 54 49 56 60Roses 167 157 130 114 108 94 83 69 64 59Snapdragons - - - - - - - - - - - - 169 164 155 153 146 120Tulips - - - - - - - - - - - - 88 92 88 91 100 96Other cut flowers 582 656 639 568 464 416 419 377 376 338
Total cut flowers 763 829 690 656 667 625 618 541 542 498
Leatherleaf ferns 3/ 145 167 154 134 131 118 134 113 105 90Other cultivated greens 222 246 251 217 227 194 222 185 184 179See footnotes in table C-5.
Table C-5--Cut flowers and cut greens: Average sales per grower, by flower type, 1996 to date 1/Genus 1996 1997 1998 1999 2000 2001 2002 2003 2004 2005p
-- Dollars --
Alstroemeria - - - - - - - - - - - - 79,187 67,592 69,761 69,789 70,472 60,000Carnations 2/ 255,247 245,897 206,844 200,545 121,321 92,143 100,471 87,926 56,000 75,708Chrysanthemums 2/ 201,564 202,694 244,343 271,512 200,163 240,443 265,082 288,825 317,143 359,542Delphinium, larkspur - - - - - - - - - - - - 109,550 114,667 119,250 108,856 98,717 96,593Gerbera daisy - - - - - - - - - - - - 372,964 421,075 460,782 521,556 500,983 529,738Gladioli 527,937 505,232 526,000 432,797 358,722 367,939 419,578 515,000 443,373 462,635Iris - - - - - - - - - - - - 167,172 160,238 163,786 193,971 182,795 202,101Lilies - - - - - - - - - - - - 356,529 397,882 399,660 524,286 508,781 541,387Lisianthus - - - - - - - - - - - - 87,228 116,507 82,924 92,729 85,145 67,917Orchids - - - - - - - - - - - - 155,212 171,260 144,370 174,204 139,893 115,450Roses 702,671 780,350 787,423 763,184 641,611 638,043 709,373 681,116 654,594 660,271Snapdragons - - - - - - - - - - - - 113,408 103,537 109,942 102,216 102,753 108,058Tulips - - - - - - - - - - - - 304,091 292,000 329,557 341,264 370,960 407,781Other cut flowers 374,289 416,345 369,288 503,155 288,034 320,536 325,811 343,934 317,383 328,612
Total cut flowers 540,891 568,841 596,514 657,963 644,622 668,965 691,070 781,852 760,943 796,572
Leatherleaf ferns 3/ 468,917 385,467 392,844 481,694 505,687 468,729 400,254 432,460 452,771 557,711Other cultivated greens 226,090 210,614 227,853 286,304 263,978 294,062 270,896 287,551 301,277 304,318- - - = Not available; p = preliminary.1/ Includes growers with at least $100,000 in annual floriculture sales at wholesale; growers are located in the 36 surveyed States.2/ Starting in 2000, only standard carnations and pompon chrysanthemums are included; miniature carnations and standard mums are included in "Other cut flowers." Pompon mums are sold in bunches. 3/ Quantity sold is in bunches.Source: USDA, NASS, Floriculture Crops .
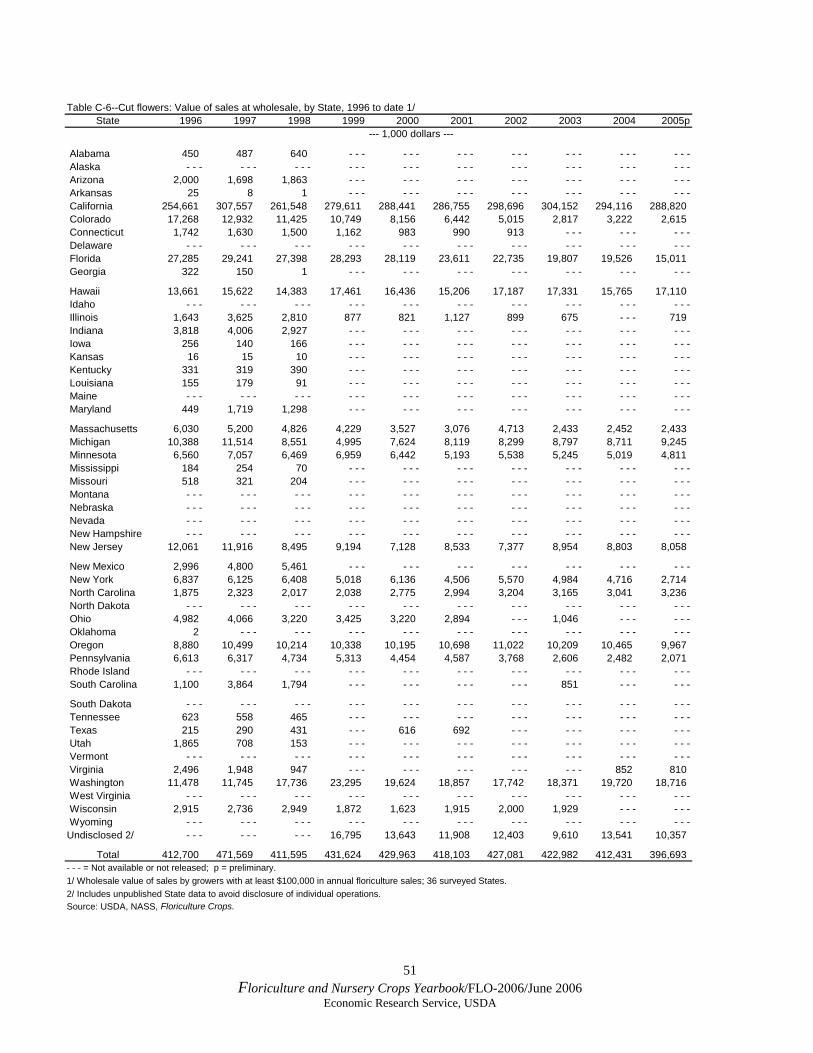
51 Floriculture and Nursery Crops Yearbook/FLO-2006/June 2006
Economic Research Service, USDA
Table C-6--Cut flowers: Value of sales at wholesale, by State, 1996 to date 1/State 1996 1997 1998 1999 2000 2001 2002 2003 2004 2005p
--- 1,000 dollars ---
Alabama 450 487 640 - - - - - - - - - - - - - - - - - - - - - Alaska - - - - - - - - - - - - - - - - - - - - - - - - - - - - - - Arizona 2,000 1,698 1,863 - - - - - - - - - - - - - - - - - - - - - Arkansas 25 8 1 - - - - - - - - - - - - - - - - - - - - - California 254,661 307,557 261,548 279,611 288,441 286,755 298,696 304,152 294,116 288,820 Colorado 17,268 12,932 11,425 10,749 8,156 6,442 5,015 2,817 3,222 2,615 Connecticut 1,742 1,630 1,500 1,162 983 990 913 - - - - - - - - - Delaware - - - - - - - - - - - - - - - - - - - - - - - - - - - - - - Florida 27,285 29,241 27,398 28,293 28,119 23,611 22,735 19,807 19,526 15,011 Georgia 322 150 1 - - - - - - - - - - - - - - - - - - - - -
Hawaii 13,661 15,622 14,383 17,461 16,436 15,206 17,187 17,331 15,765 17,110 Idaho - - - - - - - - - - - - - - - - - - - - - - - - - - - - - - Illinois 1,643 3,625 2,810 877 821 1,127 899 675 - - - 719 Indiana 3,818 4,006 2,927 - - - - - - - - - - - - - - - - - - - - - Iowa 256 140 166 - - - - - - - - - - - - - - - - - - - - - Kansas 16 15 10 - - - - - - - - - - - - - - - - - - - - - Kentucky 331 319 390 - - - - - - - - - - - - - - - - - - - - - Louisiana 155 179 91 - - - - - - - - - - - - - - - - - - - - - Maine - - - - - - - - - - - - - - - - - - - - - - - - - - - - - - Maryland 449 1,719 1,298 - - - - - - - - - - - - - - - - - - - - -
Massachusetts 6,030 5,200 4,826 4,229 3,527 3,076 4,713 2,433 2,452 2,433 Michigan 10,388 11,514 8,551 4,995 7,624 8,119 8,299 8,797 8,711 9,245 Minnesota 6,560 7,057 6,469 6,959 6,442 5,193 5,538 5,245 5,019 4,811 Mississippi 184 254 70 - - - - - - - - - - - - - - - - - - - - - Missouri 518 321 204 - - - - - - - - - - - - - - - - - - - - - Montana - - - - - - - - - - - - - - - - - - - - - - - - - - - - - - Nebraska - - - - - - - - - - - - - - - - - - - - - - - - - - - - - - Nevada - - - - - - - - - - - - - - - - - - - - - - - - - - - - - - New Hampshire - - - - - - - - - - - - - - - - - - - - - - - - - - - - - - New Jersey 12,061 11,916 8,495 9,194 7,128 8,533 7,377 8,954 8,803 8,058
New Mexico 2,996 4,800 5,461 - - - - - - - - - - - - - - - - - - - - - New York 6,837 6,125 6,408 5,018 6,136 4,506 5,570 4,984 4,716 2,714 North Carolina 1,875 2,323 2,017 2,038 2,775 2,994 3,204 3,165 3,041 3,236 North Dakota - - - - - - - - - - - - - - - - - - - - - - - - - - - - - - Ohio 4,982 4,066 3,220 3,425 3,220 2,894 - - - 1,046 - - - - - - Oklahoma 2 - - - - - - - - - - - - - - - - - - - - - - - - - - - Oregon 8,880 10,499 10,214 10,338 10,195 10,698 11,022 10,209 10,465 9,967 Pennsylvania 6,613 6,317 4,734 5,313 4,454 4,587 3,768 2,606 2,482 2,071 Rhode Island - - - - - - - - - - - - - - - - - - - - - - - - - - - - - - South Carolina 1,100 3,864 1,794 - - - - - - - - - - - - 851 - - - - - -
South Dakota - - - - - - - - - - - - - - - - - - - - - - - - - - - - - - Tennessee 623 558 465 - - - - - - - - - - - - - - - - - - - - - Texas 215 290 431 - - - 616 692 - - - - - - - - - - - - Utah 1,865 708 153 - - - - - - - - - - - - - - - - - - - - - Vermont - - - - - - - - - - - - - - - - - - - - - - - - - - - - - - Virginia 2,496 1,948 947 - - - - - - - - - - - - - - - 852 810 Washington 11,478 11,745 17,736 23,295 19,624 18,857 17,742 18,371 19,720 18,716 West Virginia - - - - - - - - - - - - - - - - - - - - - - - - - - - - - - Wisconsin 2,915 2,736 2,949 1,872 1,623 1,915 2,000 1,929 - - - - - - Wyoming - - - - - - - - - - - - - - - - - - - - - - - - - - - - - -Undisclosed 2/ - - - - - - - - - 16,795 13,643 11,908 12,403 9,610 13,541 10,357
Total 412,700 471,569 411,595 431,624 429,963 418,103 427,081 422,982 412,431 396,693- - - = Not available or not released; p = preliminary.1/ Wholesale value of sales by growers with at least $100,000 in annual floriculture sales; 36 surveyed States.2/ Includes unpublished State data to avoid disclosure of individual operations.Source: USDA, NASS, Floriculture Crops.
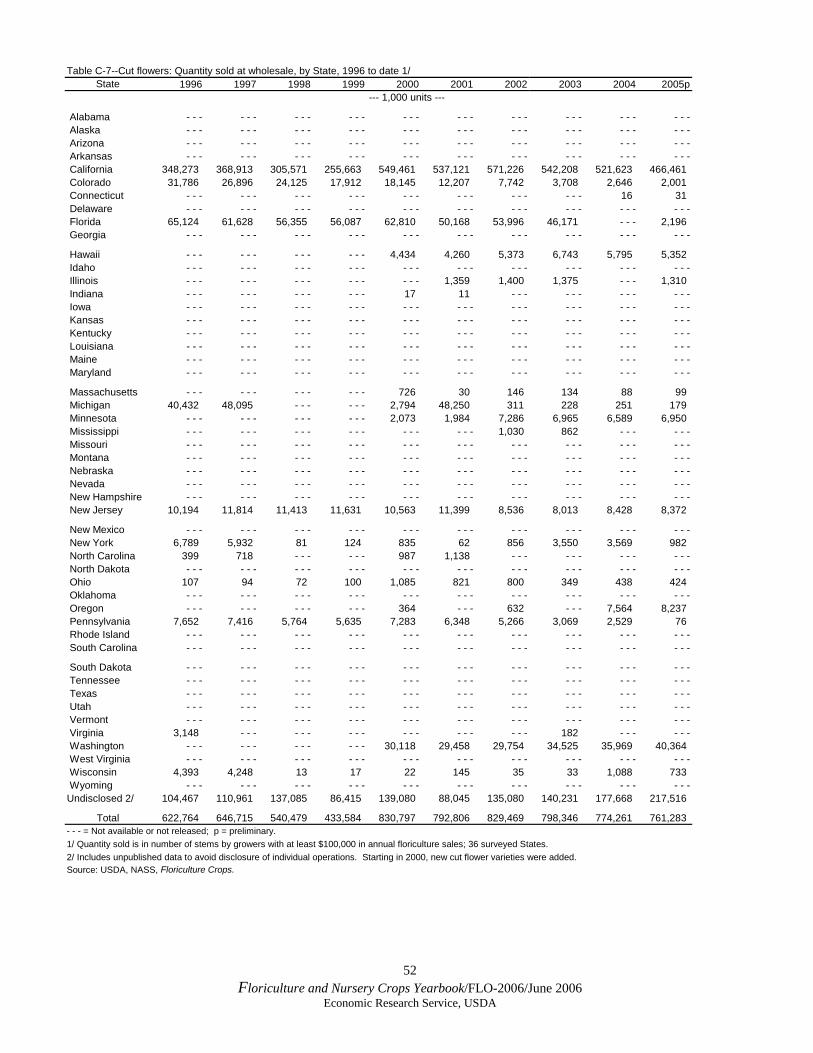
52 Floriculture and Nursery Crops Yearbook/FLO-2006/June 2006
Economic Research Service, USDA
Table C-7--Cut flowers: Quantity sold at wholesale, by State, 1996 to date 1/State 1996 1997 1998 1999 2000 2001 2002 2003 2004 2005p
--- 1,000 units ---
Alabama - - - - - - - - - - - - - - - - - - - - - - - - - - - - - - Alaska - - - - - - - - - - - - - - - - - - - - - - - - - - - - - - Arizona - - - - - - - - - - - - - - - - - - - - - - - - - - - - - - Arkansas - - - - - - - - - - - - - - - - - - - - - - - - - - - - - - California 348,273 368,913 305,571 255,663 549,461 537,121 571,226 542,208 521,623 466,461 Colorado 31,786 26,896 24,125 17,912 18,145 12,207 7,742 3,708 2,646 2,001 Connecticut - - - - - - - - - - - - - - - - - - - - - - - - 16 31 Delaware - - - - - - - - - - - - - - - - - - - - - - - - - - - - - - Florida 65,124 61,628 56,355 56,087 62,810 50,168 53,996 46,171 - - - 2,196 Georgia - - - - - - - - - - - - - - - - - - - - - - - - - - - - - -
Hawaii - - - - - - - - - - - - 4,434 4,260 5,373 6,743 5,795 5,352 Idaho - - - - - - - - - - - - - - - - - - - - - - - - - - - - - - Illinois - - - - - - - - - - - - - - - 1,359 1,400 1,375 - - - 1,310 Indiana - - - - - - - - - - - - 17 11 - - - - - - - - - - - - Iowa - - - - - - - - - - - - - - - - - - - - - - - - - - - - - - Kansas - - - - - - - - - - - - - - - - - - - - - - - - - - - - - - Kentucky - - - - - - - - - - - - - - - - - - - - - - - - - - - - - - Louisiana - - - - - - - - - - - - - - - - - - - - - - - - - - - - - - Maine - - - - - - - - - - - - - - - - - - - - - - - - - - - - - - Maryland - - - - - - - - - - - - - - - - - - - - - - - - - - - - - -
Massachusetts - - - - - - - - - - - - 726 30 146 134 88 99 Michigan 40,432 48,095 - - - - - - 2,794 48,250 311 228 251 179 Minnesota - - - - - - - - - - - - 2,073 1,984 7,286 6,965 6,589 6,950 Mississippi - - - - - - - - - - - - - - - - - - 1,030 862 - - - - - - Missouri - - - - - - - - - - - - - - - - - - - - - - - - - - - - - - Montana - - - - - - - - - - - - - - - - - - - - - - - - - - - - - - Nebraska - - - - - - - - - - - - - - - - - - - - - - - - - - - - - - Nevada - - - - - - - - - - - - - - - - - - - - - - - - - - - - - - New Hampshire - - - - - - - - - - - - - - - - - - - - - - - - - - - - - - New Jersey 10,194 11,814 11,413 11,631 10,563 11,399 8,536 8,013 8,428 8,372
New Mexico - - - - - - - - - - - - - - - - - - - - - - - - - - - - - - New York 6,789 5,932 81 124 835 62 856 3,550 3,569 982 North Carolina 399 718 - - - - - - 987 1,138 - - - - - - - - - - - - North Dakota - - - - - - - - - - - - - - - - - - - - - - - - - - - - - - Ohio 107 94 72 100 1,085 821 800 349 438 424 Oklahoma - - - - - - - - - - - - - - - - - - - - - - - - - - - - - - Oregon - - - - - - - - - - - - 364 - - - 632 - - - 7,564 8,237 Pennsylvania 7,652 7,416 5,764 5,635 7,283 6,348 5,266 3,069 2,529 76 Rhode Island - - - - - - - - - - - - - - - - - - - - - - - - - - - - - - South Carolina - - - - - - - - - - - - - - - - - - - - - - - - - - - - - -
South Dakota - - - - - - - - - - - - - - - - - - - - - - - - - - - - - - Tennessee - - - - - - - - - - - - - - - - - - - - - - - - - - - - - - Texas - - - - - - - - - - - - - - - - - - - - - - - - - - - - - - Utah - - - - - - - - - - - - - - - - - - - - - - - - - - - - - - Vermont - - - - - - - - - - - - - - - - - - - - - - - - - - - - - - Virginia 3,148 - - - - - - - - - - - - - - - - - - 182 - - - - - - Washington - - - - - - - - - - - - 30,118 29,458 29,754 34,525 35,969 40,364 West Virginia - - - - - - - - - - - - - - - - - - - - - - - - - - - - - - Wisconsin 4,393 4,248 13 17 22 145 35 33 1,088 733 Wyoming - - - - - - - - - - - - - - - - - - - - - - - - - - - - - -Undisclosed 2/ 104,467 110,961 137,085 86,415 139,080 88,045 135,080 140,231 177,668 217,516
Total 622,764 646,715 540,479 433,584 830,797 792,806 829,469 798,346 774,261 761,283- - - = Not available or not released; p = preliminary.1/ Quantity sold is in number of stems by growers with at least $100,000 in annual floriculture sales; 36 surveyed States.2/ Includes unpublished data to avoid disclosure of individual operations. Starting in 2000, new cut flower varieties were added.Source: USDA, NASS, Floriculture Crops.

53 Floriculture and Nursery Crops Yearbook/FLO-2006/June 2006
Economic Research Service, USDA
Table C-8--Cut flowers: Supply and Use, large operations, 1996 to dateAll cut flowers 1996 1997 1998 1999 2000 2001 2002 2003 2004 2005p
-- Million dollars --
Domestic production 1/ 412.7 471.6 411.6 431.6 430.0 418.1 427.1 423.0 412.4 396.7
+ Imports 572.5 595.0 614.4 592.4 610.5 565.5 541.7 610.9 705.9 709.1
= Total supply 985.2 1,066.6 1,026.0 1,024.0 1,040.4 983.6 968.7 1,033.9 1,118.3 1,105.8
- Exports 47.5 48.8 44.6 41.7 39.7 39.7 36.3 33.8 27.2 24.9
= Domestic consumption 2/ 937.7 1,017.9 981.4 982.3 1,000.7 943.9 932.4 1,000.1 1,091.1 1,080.9
Use per U.S. household (dollars) 9.50 10.19 9.71 9.51 9.49 8.83 8.63 9.18 9.92 9.73
Share of imports in use (percent) 61.1 58.5 62.6 60.3 61.0 59.9 58.1 61.1 64.7 65.6
- - - = Not available; p = preliminary. For reference, see table A-4.1/ Based on wholesale value of sales by commercial growers with $100,000+ in annual floriculture sales; 36 surveyed States.2/ Domestic use equals total supply minus exports. Supply equals domestic production plus imports. Includes dried, dyed, or prepared cut flowers.Sources: USDA, NASS, Floriculture Crops ; U.S. Bureau of Census, www.FAS.USDA.gov/ustrade.
Table C-9--Cut flowers: Value of U.S. imports, by flower variety, 1996 to date 1/Flower variety 1996 1997 1998 1999 2000 2001 2002 2003 2004 2005p
Import value: 1,000 dollars
Sweetheart roses, fresh 1,368 1,375 1,565 1,933 1,309 942 1,236 2,024 1,961 1,865Spray and other roses, fresh 177,555 205,220 215,951 199,193 211,419 204,746 189,474 214,622 248,227 272,871 All roses, fresh 178,923 206,595 217,517 201,126 212,728 205,688 190,710 216,645 250,188 274,736
Pompon chrysanthemums, fresh 68,966 66,732 73,023 67,441 61,765 50,629 41,580 55,013 58,890 55,335Other chrysanthemums, fresh 11,520 10,790 9,840 8,939 11,629 10,025 12,703 11,350 8,426 11,477 All chrysanthemums, fresh 80,486 77,521 82,863 76,379 73,394 60,655 54,284 66,363 67,316 66,812
Miniature/spray carnations, fresh 36,571 37,751 38,740 41,059 34,127 26,530 24,327 23,670 32,190 29,544Standard carnations, fresh 90,075 79,504 74,559 70,713 56,983 44,815 38,773 36,627 34,702 33,631 All carnations, fresh 126,646 117,254 113,299 111,772 91,110 71,345 63,100 60,297 66,892 63,175
Dendrobrium orchids, fresh 3,277 3,002 2,330 2,312 2,606 2,345 2,423 2,568 2,934 3,621Other orchids, fresh 1,737 1,432 1,495 1,458 2,023 1,933 1,949 1,944 2,879 4,304 All orchids, fresh 5,014 4,434 3,824 3,770 4,628 4,279 4,373 4,512 5,813 7,925
Anthuriums, fresh 855 642 328 247 500 324 367 421 370 377Alstroemeria, fresh - - - - - - - - - 26,750 19,356 23,647 30,153 37,261 47,425 46,719Gypsophila, fresh - - - - - - - - - 22,225 21,019 21,872 19,123 24,395 27,541 17,739Lilies, fresh - - - - - - - - - 13,022 12,091 11,977 13,529 13,613 15,076 21,592Snapdragons, fresh - - - - - - - - - 728 1,606 2,596 2,446 3,176 3,346 1,371Other cut flowers, fresh 165,749 172,767 181,072 118,948 158,358 148,797 151,408 174,465 215,849 202,904
All cut flowers, fresh 557,674 579,212 598,903 574,967 594,790 551,179 529,492 601,149 699,816 703,350
Cut flowers--dried, dyed, or prep. 14,876 15,833 15,459 17,399 15,671 14,289 12,163 9,794 6,038 5,799
Total cut flowers, fresh and prep. 572,550 595,045 614,362 592,366 610,461 565,468 541,655 610,943 705,854 709,149See footnotes in table C-11.
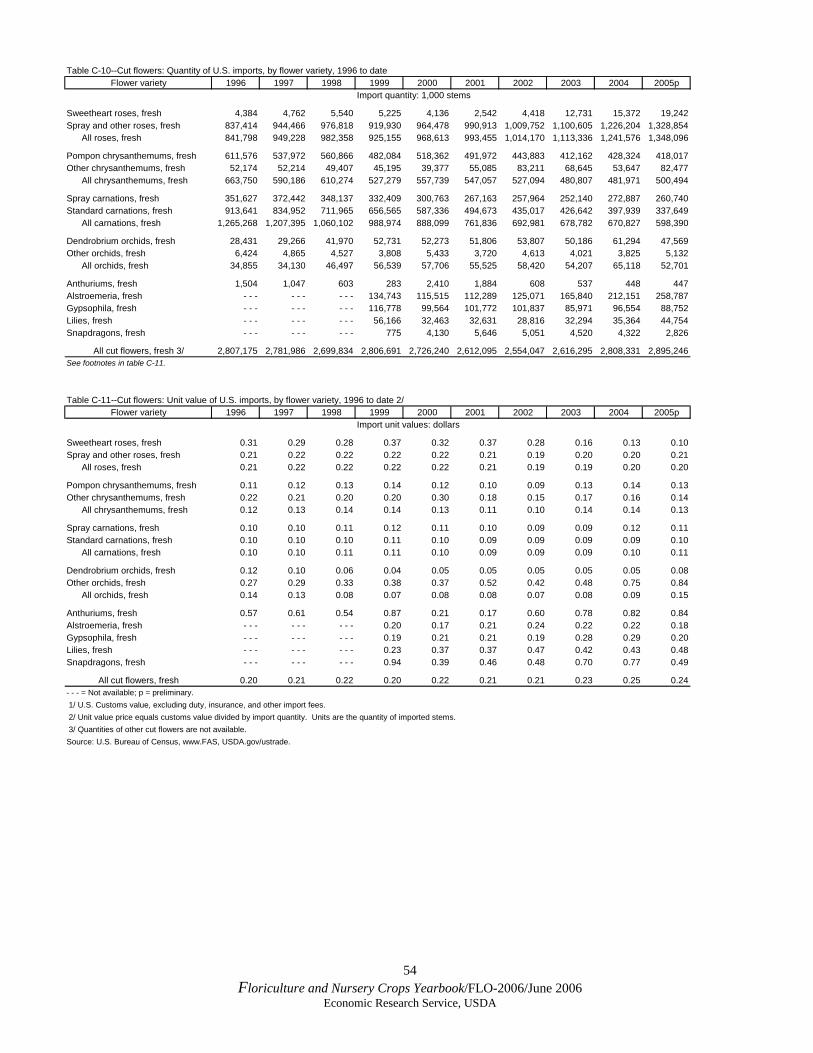
54 Floriculture and Nursery Crops Yearbook/FLO-2006/June 2006
Economic Research Service, USDA
Table C-10--Cut flowers: Quantity of U.S. imports, by flower variety, 1996 to dateFlower variety 1996 1997 1998 1999 2000 2001 2002 2003 2004 2005p
Import quantity: 1,000 stems
Sweetheart roses, fresh 4,384 4,762 5,540 5,225 4,136 2,542 4,418 12,731 15,372 19,242Spray and other roses, fresh 837,414 944,466 976,818 919,930 964,478 990,913 1,009,752 1,100,605 1,226,204 1,328,854 All roses, fresh 841,798 949,228 982,358 925,155 968,613 993,455 1,014,170 1,113,336 1,241,576 1,348,096
Pompon chrysanthemums, fresh 611,576 537,972 560,866 482,084 518,362 491,972 443,883 412,162 428,324 418,017Other chrysanthemums, fresh 52,174 52,214 49,407 45,195 39,377 55,085 83,211 68,645 53,647 82,477 All chrysanthemums, fresh 663,750 590,186 610,274 527,279 557,739 547,057 527,094 480,807 481,971 500,494
Spray carnations, fresh 351,627 372,442 348,137 332,409 300,763 267,163 257,964 252,140 272,887 260,740Standard carnations, fresh 913,641 834,952 711,965 656,565 587,336 494,673 435,017 426,642 397,939 337,649 All carnations, fresh 1,265,268 1,207,395 1,060,102 988,974 888,099 761,836 692,981 678,782 670,827 598,390
Dendrobrium orchids, fresh 28,431 29,266 41,970 52,731 52,273 51,806 53,807 50,186 61,294 47,569Other orchids, fresh 6,424 4,865 4,527 3,808 5,433 3,720 4,613 4,021 3,825 5,132 All orchids, fresh 34,855 34,130 46,497 56,539 57,706 55,525 58,420 54,207 65,118 52,701
Anthuriums, fresh 1,504 1,047 603 283 2,410 1,884 608 537 448 447Alstroemeria, fresh - - - - - - - - - 134,743 115,515 112,289 125,071 165,840 212,151 258,787Gypsophila, fresh - - - - - - - - - 116,778 99,564 101,772 101,837 85,971 96,554 88,752Lilies, fresh - - - - - - - - - 56,166 32,463 32,631 28,816 32,294 35,364 44,754Snapdragons, fresh - - - - - - - - - 775 4,130 5,646 5,051 4,520 4,322 2,826
All cut flowers, fresh 3/ 2,807,175 2,781,986 2,699,834 2,806,691 2,726,240 2,612,095 2,554,047 2,616,295 2,808,331 2,895,246See footnotes in table C-11.
Table C-11--Cut flowers: Unit value of U.S. imports, by flower variety, 1996 to date 2/Flower variety 1996 1997 1998 1999 2000 2001 2002 2003 2004 2005p
Import unit values: dollars
Sweetheart roses, fresh 0.31 0.29 0.28 0.37 0.32 0.37 0.28 0.16 0.13 0.10Spray and other roses, fresh 0.21 0.22 0.22 0.22 0.22 0.21 0.19 0.20 0.20 0.21 All roses, fresh 0.21 0.22 0.22 0.22 0.22 0.21 0.19 0.19 0.20 0.20
Pompon chrysanthemums, fresh 0.11 0.12 0.13 0.14 0.12 0.10 0.09 0.13 0.14 0.13Other chrysanthemums, fresh 0.22 0.21 0.20 0.20 0.30 0.18 0.15 0.17 0.16 0.14 All chrysanthemums, fresh 0.12 0.13 0.14 0.14 0.13 0.11 0.10 0.14 0.14 0.13
Spray carnations, fresh 0.10 0.10 0.11 0.12 0.11 0.10 0.09 0.09 0.12 0.11Standard carnations, fresh 0.10 0.10 0.10 0.11 0.10 0.09 0.09 0.09 0.09 0.10 All carnations, fresh 0.10 0.10 0.11 0.11 0.10 0.09 0.09 0.09 0.10 0.11
Dendrobrium orchids, fresh 0.12 0.10 0.06 0.04 0.05 0.05 0.05 0.05 0.05 0.08Other orchids, fresh 0.27 0.29 0.33 0.38 0.37 0.52 0.42 0.48 0.75 0.84 All orchids, fresh 0.14 0.13 0.08 0.07 0.08 0.08 0.07 0.08 0.09 0.15
Anthuriums, fresh 0.57 0.61 0.54 0.87 0.21 0.17 0.60 0.78 0.82 0.84Alstroemeria, fresh - - - - - - - - - 0.20 0.17 0.21 0.24 0.22 0.22 0.18Gypsophila, fresh - - - - - - - - - 0.19 0.21 0.21 0.19 0.28 0.29 0.20Lilies, fresh - - - - - - - - - 0.23 0.37 0.37 0.47 0.42 0.43 0.48Snapdragons, fresh - - - - - - - - - 0.94 0.39 0.46 0.48 0.70 0.77 0.49
All cut flowers, fresh 0.20 0.21 0.22 0.20 0.22 0.21 0.21 0.23 0.25 0.24- - - = Not available; p = preliminary. 1/ U.S. Customs value, excluding duty, insurance, and other import fees. 2/ Unit value price equals customs value divided by import quantity. Units are the quantity of imported stems. 3/ Quantities of other cut flowers are not available.Source: U.S. Bureau of Census, www.FAS, USDA.gov/ustrade.
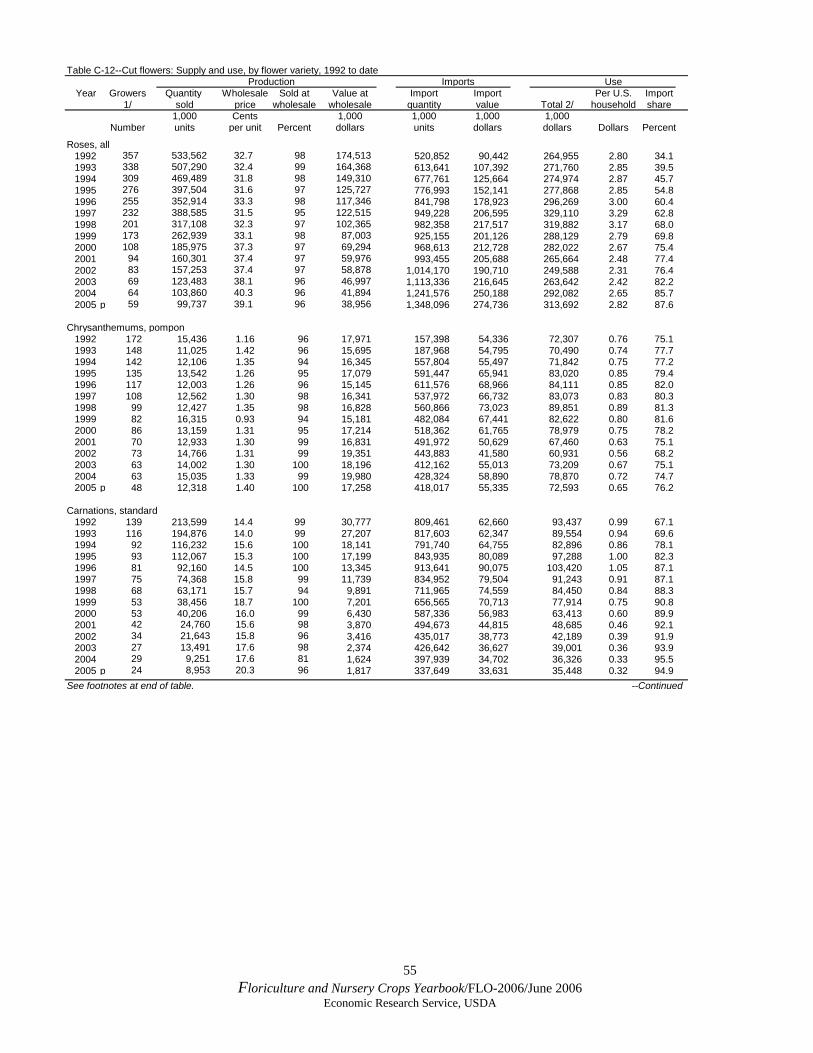
55 Floriculture and Nursery Crops Yearbook/FLO-2006/June 2006
Economic Research Service, USDA
Table C-12--Cut flowers: Supply and use, by flower variety, 1992 to dateProduction Imports Use
Year Growers Quantity Wholesale Sold at Value at Import Import Per U.S. Import1/ sold price wholesale wholesale quantity value Total 2/ household share
1,000 Cents 1,000 1,000 1,000 1,000Number units per unit Percent dollars units dollars dollars Dollars Percent
Roses, all1992 357 533,562 32.7 98 174,513 520,852 90,442 264,955 2.80 34.11993 338 507,290 32.4 99 164,368 613,641 107,392 271,760 2.85 39.51994 309 469,489 31.8 98 149,310 677,761 125,664 274,974 2.87 45.71995 276 397,504 31.6 97 125,727 776,993 152,141 277,868 2.85 54.81996 255 352,914 33.3 98 117,346 841,798 178,923 296,269 3.00 60.41997 232 388,585 31.5 95 122,515 949,228 206,595 329,110 3.29 62.81998 201 317,108 32.3 97 102,365 982,358 217,517 319,882 3.17 68.01999 173 262,939 33.1 98 87,003 925,155 201,126 288,129 2.79 69.82000 108 185,975 37.3 97 69,294 968,613 212,728 282,022 2.67 75.42001 94 160,301 37.4 97 59,976 993,455 205,688 265,664 2.48 77.42002 83 157,253 37.4 97 58,878 1,014,170 190,710 249,588 2.31 76.42003 69 123,483 38.1 96 46,997 1,113,336 216,645 263,642 2.42 82.22004 64 103,860 40.3 96 41,894 1,241,576 250,188 292,082 2.65 85.72005 p 59 99,737 39.1 96 38,956 1,348,096 274,736 313,692 2.82 87.6
Chrysanthemums, pompon1992 172 15,436 1.16 96 17,971 157,398 54,336 72,307 0.76 75.11993 148 11,025 1.42 96 15,695 187,968 54,795 70,490 0.74 77.71994 142 12,106 1.35 94 16,345 557,804 55,497 71,842 0.75 77.21995 135 13,542 1.26 95 17,079 591,447 65,941 83,020 0.85 79.41996 117 12,003 1.26 96 15,145 611,576 68,966 84,111 0.85 82.01997 108 12,562 1.30 98 16,341 537,972 66,732 83,073 0.83 80.31998 99 12,427 1.35 98 16,828 560,866 73,023 89,851 0.89 81.31999 82 16,315 0.93 94 15,181 482,084 67,441 82,622 0.80 81.62000 86 13,159 1.31 95 17,214 518,362 61,765 78,979 0.75 78.22001 70 12,933 1.30 99 16,831 491,972 50,629 67,460 0.63 75.12002 73 14,766 1.31 99 19,351 443,883 41,580 60,931 0.56 68.22003 63 14,002 1.30 100 18,196 412,162 55,013 73,209 0.67 75.12004 63 15,035 1.33 99 19,980 428,324 58,890 78,870 0.72 74.72005 p 48 12,318 1.40 100 17,258 418,017 55,335 72,593 0.65 76.2
Carnations, standard1992 139 213,599 14.4 99 30,777 809,461 62,660 93,437 0.99 67.11993 116 194,876 14.0 99 27,207 817,603 62,347 89,554 0.94 69.61994 92 116,232 15.6 100 18,141 791,740 64,755 82,896 0.86 78.11995 93 112,067 15.3 100 17,199 843,935 80,089 97,288 1.00 82.31996 81 92,160 14.5 100 13,345 913,641 90,075 103,420 1.05 87.11997 75 74,368 15.8 99 11,739 834,952 79,504 91,243 0.91 87.11998 68 63,171 15.7 94 9,891 711,965 74,559 84,450 0.84 88.31999 53 38,456 18.7 100 7,201 656,565 70,713 77,914 0.75 90.82000 53 40,206 16.0 99 6,430 587,336 56,983 63,413 0.60 89.92001 42 24,760 15.6 98 3,870 494,673 44,815 48,685 0.46 92.12002 34 21,643 15.8 96 3,416 435,017 38,773 42,189 0.39 91.92003 27 13,491 17.6 98 2,374 426,642 36,627 39,001 0.36 93.92004 29 9,251 17.6 81 1,624 397,939 34,702 36,326 0.33 95.52005 p 24 8,953 20.3 96 1,817 337,649 33,631 35,448 0.32 94.9
See footnotes at end of table. --Continued
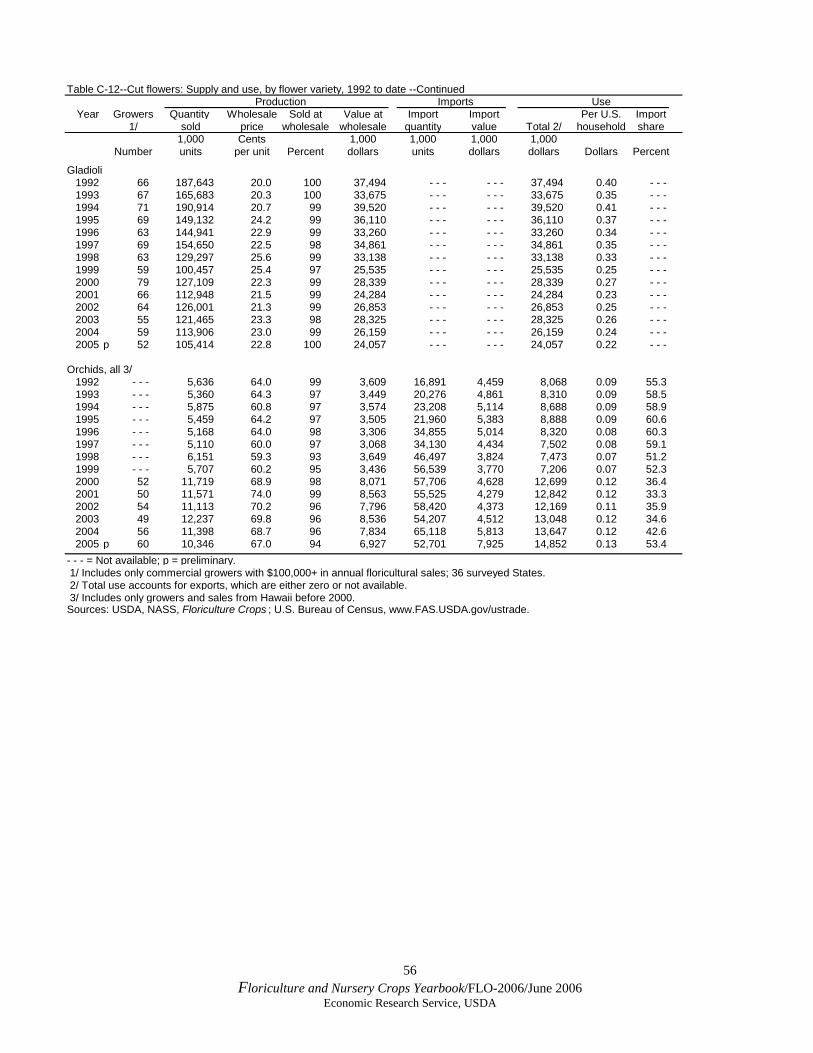
56 Floriculture and Nursery Crops Yearbook/FLO-2006/June 2006
Economic Research Service, USDA
Table C-12--Cut flowers: Supply and use, by flower variety, 1992 to date --Continued
Production Imports UseYear Growers Quantity Wholesale Sold at Value at Import Import Per U.S. Import
1/ sold price wholesale wholesale quantity value Total 2/ household share1,000 Cents 1,000 1,000 1,000 1,000
Number units per unit Percent dollars units dollars dollars Dollars Percent
Gladioli1992 66 187,643 20.0 100 37,494 - - - - - - 37,494 0.40 - - -1993 67 165,683 20.3 100 33,675 - - - - - - 33,675 0.35 - - -1994 71 190,914 20.7 99 39,520 - - - - - - 39,520 0.41 - - -1995 69 149,132 24.2 99 36,110 - - - - - - 36,110 0.37 - - -1996 63 144,941 22.9 99 33,260 - - - - - - 33,260 0.34 - - -1997 69 154,650 22.5 98 34,861 - - - - - - 34,861 0.35 - - -1998 63 129,297 25.6 99 33,138 - - - - - - 33,138 0.33 - - -1999 59 100,457 25.4 97 25,535 - - - - - - 25,535 0.25 - - -2000 79 127,109 22.3 99 28,339 - - - - - - 28,339 0.27 - - -2001 66 112,948 21.5 99 24,284 - - - - - - 24,284 0.23 - - -2002 64 126,001 21.3 99 26,853 - - - - - - 26,853 0.25 - - -2003 55 121,465 23.3 98 28,325 - - - - - - 28,325 0.26 - - -2004 59 113,906 23.0 99 26,159 - - - - - - 26,159 0.24 - - -2005 p 52 105,414 22.8 100 24,057 - - - - - - 24,057 0.22 - - -
Orchids, all 3/1992 - - - 5,636 64.0 99 3,609 16,891 4,459 8,068 0.09 55.31993 - - - 5,360 64.3 97 3,449 20,276 4,861 8,310 0.09 58.51994 - - - 5,875 60.8 97 3,574 23,208 5,114 8,688 0.09 58.91995 - - - 5,459 64.2 97 3,505 21,960 5,383 8,888 0.09 60.61996 - - - 5,168 64.0 98 3,306 34,855 5,014 8,320 0.08 60.31997 - - - 5,110 60.0 97 3,068 34,130 4,434 7,502 0.08 59.11998 - - - 6,151 59.3 93 3,649 46,497 3,824 7,473 0.07 51.21999 - - - 5,707 60.2 95 3,436 56,539 3,770 7,206 0.07 52.32000 52 11,719 68.9 98 8,071 57,706 4,628 12,699 0.12 36.42001 50 11,571 74.0 99 8,563 55,525 4,279 12,842 0.12 33.32002 54 11,113 70.2 96 7,796 58,420 4,373 12,169 0.11 35.92003 49 12,237 69.8 96 8,536 54,207 4,512 13,048 0.12 34.62004 56 11,398 68.7 96 7,834 65,118 5,813 13,647 0.12 42.62005 p 60 10,346 67.0 94 6,927 52,701 7,925 14,852 0.13 53.4
- - - = Not available; p = preliminary. 1/ Includes only commercial growers with $100,000+ in annual floricultural sales; 36 surveyed States. 2/ Total use accounts for exports, which are either zero or not available. 3/ Includes only growers and sales from Hawaii before 2000.Sources: USDA, NASS, Floriculture Crops ; U.S. Bureau of Census, www.FAS.USDA.gov/ustrade.

57 Floriculture and Nursery Crops Yearbook/FLO-2006/June 2006
Economic Research Service, USDA
Table C-13--Other cut flowers: Supply and use, by flower variety, 2000 to dateProduction Imports Use
Year Growers Quantity Wholesale Sold at Value at Import Import Per U.S. Import1/ sold price wholesale wholesale quantity value Total 2/ household share
1,000 Cents 1,000 1,000 1,000 1,000Number units per unit Percent dollars units dollars dollars Dollars Percent
Alstroemeria2000 75 25,056 23.7 99 5,939 115,515 19,356 25,295 0.24 76.52001 76 21,253 24.2 98 5,137 112,289 23,647 28,784 0.27 82.22002 67 17,153 27.2 98 4,674 125,071 30,153 34,827 0.32 86.62003 57 13,402 29.7 97 3,978 165,840 37,261 41,239 0.38 90.42004 53 12,023 31.1 98 3,735 212,151 47,425 51,160 0.46 92.72005 p 43 7,257 35.6 99 2,580 258,787 46,719 49,299 0.44 94.8
Delphinium and larkspur2000 100 43,840 25.0 98 10,955 - - - - - - 10,955 0.10 - - -2001 96 45,515 24.2 100 11,008 - - - - - - 11,008 0.10 - - -2002 92 47,023 23.3 100 10,971 - - - - - - 10,971 0.10 - - -2003 90 40,945 23.9 100 9,797 - - - - - - 9,797 0.09 - - -2004 92 36,349 25.0 100 9,082 - - - - - - 9,082 0.08 - - -2005 p 81 33,199 23.6 100 7,824 - - - - - - 7,824 0.07 - - -
Gerbera daisy2000 56 67,520 30.9 97 20,886 - - - - - - 20,886 0.20 - - -2001 53 72,916 30.6 100 22,317 - - - - - - 22,317 0.21 - - -2002 55 84,917 29.8 100 25,343 - - - - - - 25,343 0.23 - - -2003 54 94,046 29.9 100 28,164 - - - - - - 28,164 0.26 - - -2004 60 97,656 30.8 98 30,059 - - - - - - 30,059 0.27 - - -2005 p 61 104,675 30.9 100 32,314 - - - - - - 32,314 0.29 - - -
Iris2000 122 79,012 25.8 99 20,395 - - - - - - 20,395 0.19 - - -2001 122 83,594 23.4 100 19,549 - - - - - - 19,549 0.18 - - -2002 112 81,837 22.4 100 18,344 - - - - - - 18,344 0.17 - - -2003 105 89,976 22.6 100 20,367 - - - - - - 20,367 0.19 - - -2004 112 88,973 23.0 100 20,473 - - - - - - 20,473 0.19 - - -2005 p 99 88,739 22.5 100 20,008 - - - - - - 20,008 0.18 - - -
Lilies2000 157 81,301 68.8 98 55,975 32,463 12,091 68,066 0.65 17.82001 153 91,267 66.7 99 60,876 32,631 11,977 72,853 0.68 16.42002 156 101,748 61.3 99 62,347 28,816 13,529 75,876 0.70 17.82003 140 112,946 65.0 99 73,400 32,294 13,613 87,013 0.80 15.62004 146 117,456 63.2 100 74,282 35,364 15,076 89,358 0.81 16.92005 p 142 114,081 67.4 100 76,877 44,754 21,592 98,469 0.89 21.9
Lisianthus2000 79 15,150 45.5 98 6,891 - - - - - - 6,891 0.07 - - -2001 73 19,040 44.7 98 8,505 - - - - - - 8,505 0.08 - - -2002 79 14,530 45.1 98 6,551 - - - - - - 6,551 0.06 - - -2003 70 14,410 45.0 100 6,491 - - - - - - 6,491 0.06 - - -2004 69 12,667 46.4 98 5,875 - - - - - - 5,875 0.05 - - -2005 p 72 12,282 39.8 99 4,890 - - - - - - 4,890 0.04 - - -
Snap dragons2000 169 63,711 30.1 98 19,166 4,130 1,606 20,772 0.20 7.72001 164 60,939 27.9 98 16,980 5,646 2,596 19,576 0.18 13.32002 155 60,860 28.0 98 17,041 5,051 2,446 19,487 0.18 12.52003 153 55,392 28.2 98 15,639 4,520 3,176 18,815 0.17 16.92004 146 50,549 29.7 99 15,002 4,322 3,346 18,348 0.17 18.22005 p 120 46,126 28.1 99 12,967 2,826 1,371 14,338 0.13 9.6
Tulips2000 88 77,039 34.7 98 26,760 - - - - - - 26,760 0.25 - - -2001 92 75,769 35.5 97 26,864 - - - - - - 26,864 0.25 - - -2002 88 90,625 32.0 98 29,001 - - - - - - 29,001 0.27 - - -2003 91 92,551 33.6 98 31,055 - - - - - - 31,055 0.28 - - -2004 100 105,138 35.3 99 37,096 - - - - - - 37,096 0.34 - - -2005 p 96 118,156 33.1 99 39,147 - - - - - - 39,147 0.35 - - -
Other cut flowers2000 464 - - - - - - 97 113,648 - - - 158,358 292,006 2.77 - - -2001 416 - - - - - - 92 133,343 - - - 148,797 282,140 2.64 - - -2002 419 - - - - - - 90 136,515 - - - 151,408 287,923 2.66 - - -2003 377 - - - - - - 90 129,663 - - - 174,465 304,128 2.79 - - -2004 376 - - - - - - 97 119,336 - - - 215,849 335,185 3.05 - - -2005 p 338 - - - - - - 96 111,071 - - - 202,904 313,975 2.83 - - -111 071
- - - = Not available; p = preliminary.1/ Includes only commercial growers with $100,000+ in annual floricultural sales; 36 surveyed States. 2/ Exports are either zero or not available.Sources: USDA, NASS, Floriculture Crops ; U.S. Bureau of Census, www.FAS.USDA.gov/ustrade.

58 Floriculture and Nursery Crops Yearbook/FLO-2006/June 2006
Economic Research Service, USDA
Table C-14--Tropical cut flowers: Production and sales, by flower variety, Hawaii, 1994 to dateProduction Sales
Year Growers Quantity Wholesale Sold at Per U.S. Average1/ sold price wholesale Total household per grower
Number 1,000 units Cents per unit Percent 1,000 dollars Dollars Dollars
Anthuriums1994 59 10,608 69.0 99 7,320 0.08 124,0681995 67 11,520 61.0 99 7,027 0.07 104,8811996 65 10,872 64.9 99 7,056 0.07 108,5541997 61 9,096 75.8 98 6,892 0.07 112,9841998 75 10,002 63.0 75 6,301 0.06 84,0131999 68 12,228 55.0 78 6,725 0.07 98,8972000 64 12,120 60.7 74 7,357 0.07 114,9532001 61 10,512 56.4 71 5,929 0.06 97,1972002 66 8,856 53.3 95 4,720 0.04 71,5152003 61 9,720 60.0 98 5,832 0.05 95,6072004 59 7,404 63.0 96 4,665 0.04 79,0682005 p 58 7,224 71.7 96 5,180 0.05 89,310
Birds of paradise1994 28 1,296 54.2 98 702 0.01 25,0711995 32 1,428 52.8 100 754 0.01 23,5631996 28 1,224 45.3 100 554 0.01 19,7861997 31 936 51.9 98 486 0.00 15,6771998 24 790 62.7 99 495 0.00 20,6251999 24 1,032 54.8 100 566 0.01 23,5832000 26 1,212 56.9 99 690 0.01 26,5382001 27 1,164 58.1 97 676 0.01 25,0372002 24 1,128 59.0 93 666 0.01 27,7502003 29 888 66.0 95 586 0.01 20,2072004 30 612 69.6 96 426 0.00 14,2002005 p 33 588 64.7 81 380 0.00 11,515
Pink ginger1994 38 816 58.6 95 478 0.00 12,5791995 44 1,020 55.3 100 564 0.01 12,8181996 53 912 57.9 91 528 0.01 9,9621997 37 612 63.1 97 386 0.00 10,4321998 59 1,107 47.9 83 530 0.01 8,9831999 47 984 47.2 66 464 0.00 9,8722000 46 972 55.8 83 542 0.01 11,7832001 45 804 57.2 74 460 0.00 10,2222002 40 708 67.0 76 474 0.00 11,8502003 40 648 73.6 75 477 0.00 11,9252004 45 564 80.8 76 456 0.00 10,1332005 p 47 744 61.0 80 454 0.00 9,660
Red ginger1994 42 984 45.8 96 451 0.00 10,7381995 48 1,380 42.8 100 591 0.01 12,3131996 48 1,008 42.3 98 426 0.00 8,8751997 43 984 46.8 96 461 0.00 10,7211998 73 1,707 46.5 79 794 0.01 10,8771999 60 1,884 39.6 66 746 0.01 12,4332000 53 1,644 45.6 70 750 0.01 14,1512001 57 1,680 48.8 65 820 0.01 14,3862002 56 1,764 59.4 68 1,048 0.01 18,7142003 57 1,680 60.3 73 1,013 0.01 17,7722004 57 1,584 65.9 76 1,044 0.01 18,3162005 p 64 1,608 61.9 74 995 0.01 15,547
See footnotes at end of table. Continued--
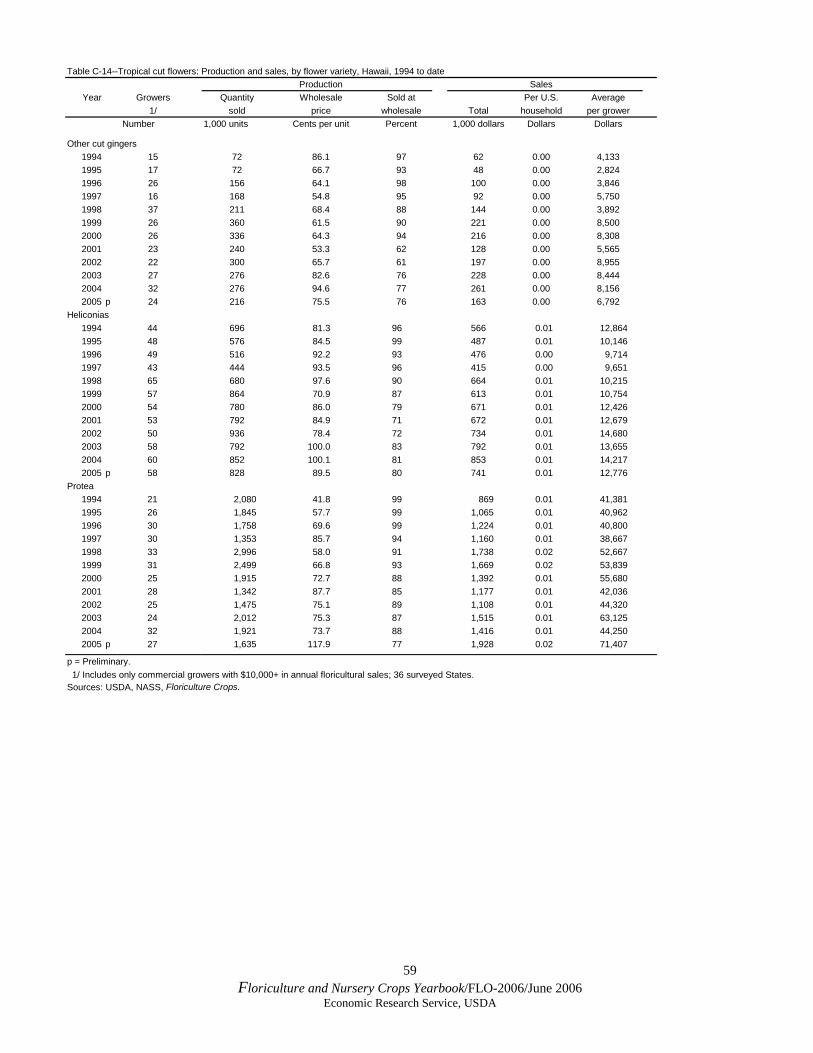
59 Floriculture and Nursery Crops Yearbook/FLO-2006/June 2006
Economic Research Service, USDA
Table C-14--Tropical cut flowers: Production and sales, by flower variety, Hawaii, 1994 to dateProduction Sales
Year Growers Quantity Wholesale Sold at Per U.S. Average1/ sold price wholesale Total household per grower
Number 1,000 units Cents per unit Percent 1,000 dollars Dollars Dollars
Other cut gingers1994 15 72 86.1 97 62 0.00 4,1331995 17 72 66.7 93 48 0.00 2,8241996 26 156 64.1 98 100 0.00 3,8461997 16 168 54.8 95 92 0.00 5,7501998 37 211 68.4 88 144 0.00 3,8921999 26 360 61.5 90 221 0.00 8,5002000 26 336 64.3 94 216 0.00 8,3082001 23 240 53.3 62 128 0.00 5,5652002 22 300 65.7 61 197 0.00 8,9552003 27 276 82.6 76 228 0.00 8,4442004 32 276 94.6 77 261 0.00 8,1562005 p 24 216 75.5 76 163 0.00 6,792
Heliconias1994 44 696 81.3 96 566 0.01 12,8641995 48 576 84.5 99 487 0.01 10,1461996 49 516 92.2 93 476 0.00 9,7141997 43 444 93.5 96 415 0.00 9,6511998 65 680 97.6 90 664 0.01 10,2151999 57 864 70.9 87 613 0.01 10,7542000 54 780 86.0 79 671 0.01 12,4262001 53 792 84.9 71 672 0.01 12,6792002 50 936 78.4 72 734 0.01 14,6802003 58 792 100.0 83 792 0.01 13,6552004 60 852 100.1 81 853 0.01 14,2172005 p 58 828 89.5 80 741 0.01 12,776
Protea1994 21 2,080 41.8 99 869 0.01 41,3811995 26 1,845 57.7 99 1,065 0.01 40,9621996 30 1,758 69.6 99 1,224 0.01 40,8001997 30 1,353 85.7 94 1,160 0.01 38,6671998 33 2,996 58.0 91 1,738 0.02 52,6671999 31 2,499 66.8 93 1,669 0.02 53,8392000 25 1,915 72.7 88 1,392 0.01 55,6802001 28 1,342 87.7 85 1,177 0.01 42,0362002 25 1,475 75.1 89 1,108 0.01 44,3202003 24 2,012 75.3 87 1,515 0.01 63,1252004 32 1,921 73.7 88 1,416 0.01 44,2502005 p 27 1,635 117.9 77 1,928 0.02 71,407
p = Preliminary. 1/ Includes only commercial growers with $10,000+ in annual floricultural sales; 36 surveyed States.Sources: USDA, NASS, Floriculture Crops.
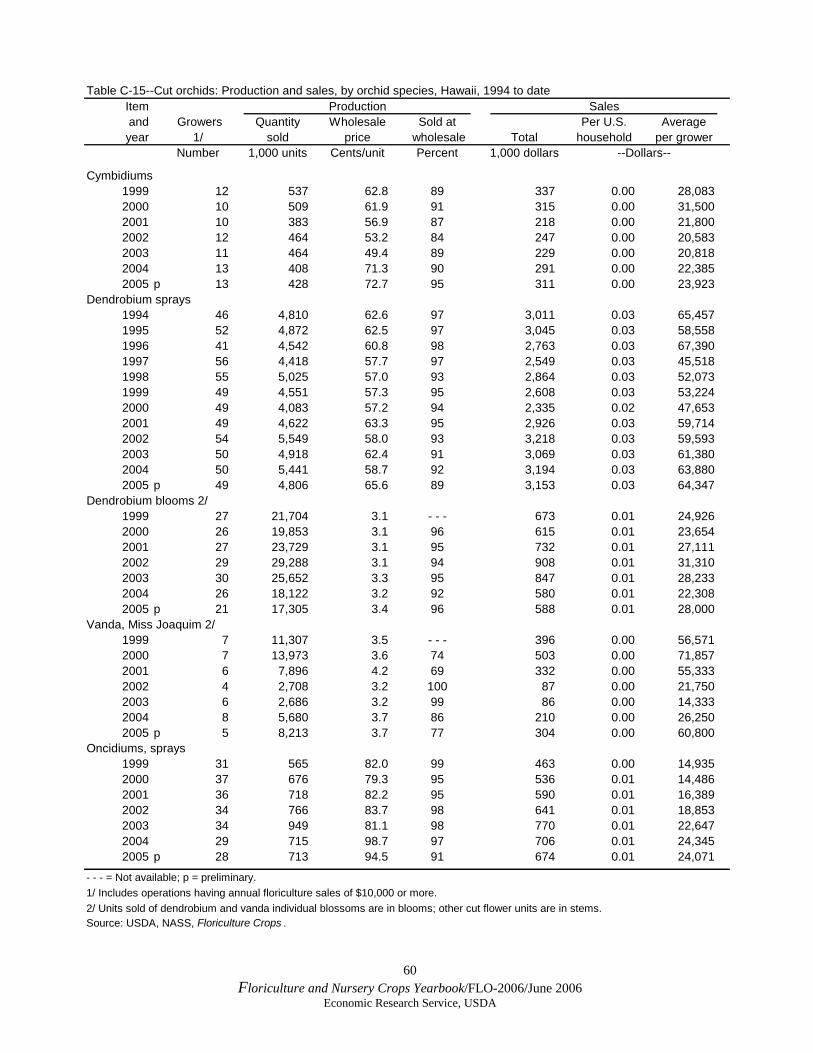
60 Floriculture and Nursery Crops Yearbook/FLO-2006/June 2006
Economic Research Service, USDA
Table C-15--Cut orchids: Production and sales, by orchid species, Hawaii, 1994 to date
Item Production Sales and Growers Quantity Wholesale Sold at Per U.S. Average year 1/ sold price wholesale Total household per grower
Number 1,000 units Cents/unit Percent 1,000 dollars --Dollars--
Cymbidiums1999 12 537 62.8 89 337 0.00 28,0832000 10 509 61.9 91 315 0.00 31,5002001 10 383 56.9 87 218 0.00 21,8002002 12 464 53.2 84 247 0.00 20,5832003 11 464 49.4 89 229 0.00 20,8182004 13 408 71.3 90 291 0.00 22,3852005 p 13 428 72.7 95 311 0.00 23,923
Dendrobium sprays1994 46 4,810 62.6 97 3,011 0.03 65,4571995 52 4,872 62.5 97 3,045 0.03 58,5581996 41 4,542 60.8 98 2,763 0.03 67,3901997 56 4,418 57.7 97 2,549 0.03 45,5181998 55 5,025 57.0 93 2,864 0.03 52,0731999 49 4,551 57.3 95 2,608 0.03 53,2242000 49 4,083 57.2 94 2,335 0.02 47,6532001 49 4,622 63.3 95 2,926 0.03 59,7142002 54 5,549 58.0 93 3,218 0.03 59,5932003 50 4,918 62.4 91 3,069 0.03 61,3802004 50 5,441 58.7 92 3,194 0.03 63,8802005 p 49 4,806 65.6 89 3,153 0.03 64,347
Dendrobium blooms 2/1999 27 21,704 3.1 - - - 673 0.01 24,9262000 26 19,853 3.1 96 615 0.01 23,6542001 27 23,729 3.1 95 732 0.01 27,1112002 29 29,288 3.1 94 908 0.01 31,3102003 30 25,652 3.3 95 847 0.01 28,2332004 26 18,122 3.2 92 580 0.01 22,3082005 p 21 17,305 3.4 96 588 0.01 28,000
Vanda, Miss Joaquim 2/1999 7 11,307 3.5 - - - 396 0.00 56,5712000 7 13,973 3.6 74 503 0.00 71,8572001 6 7,896 4.2 69 332 0.00 55,3332002 4 2,708 3.2 100 87 0.00 21,7502003 6 2,686 3.2 99 86 0.00 14,3332004 8 5,680 3.7 86 210 0.00 26,2502005 p 5 8,213 3.7 77 304 0.00 60,800
Oncidiums, sprays1999 31 565 82.0 99 463 0.00 14,9352000 37 676 79.3 95 536 0.01 14,4862001 36 718 82.2 95 590 0.01 16,3892002 34 766 83.7 98 641 0.01 18,8532003 34 949 81.1 98 770 0.01 22,6472004 29 715 98.7 97 706 0.01 24,3452005 p 28 713 94.5 91 674 0.01 24,071
- - - = Not available; p = preliminary.1/ Includes operations having annual floriculture sales of $10,000 or more.2/ Units sold of dendrobium and vanda individual blossoms are in blooms; other cut flower units are in stems.Source: USDA, NASS, Floriculture Crops .
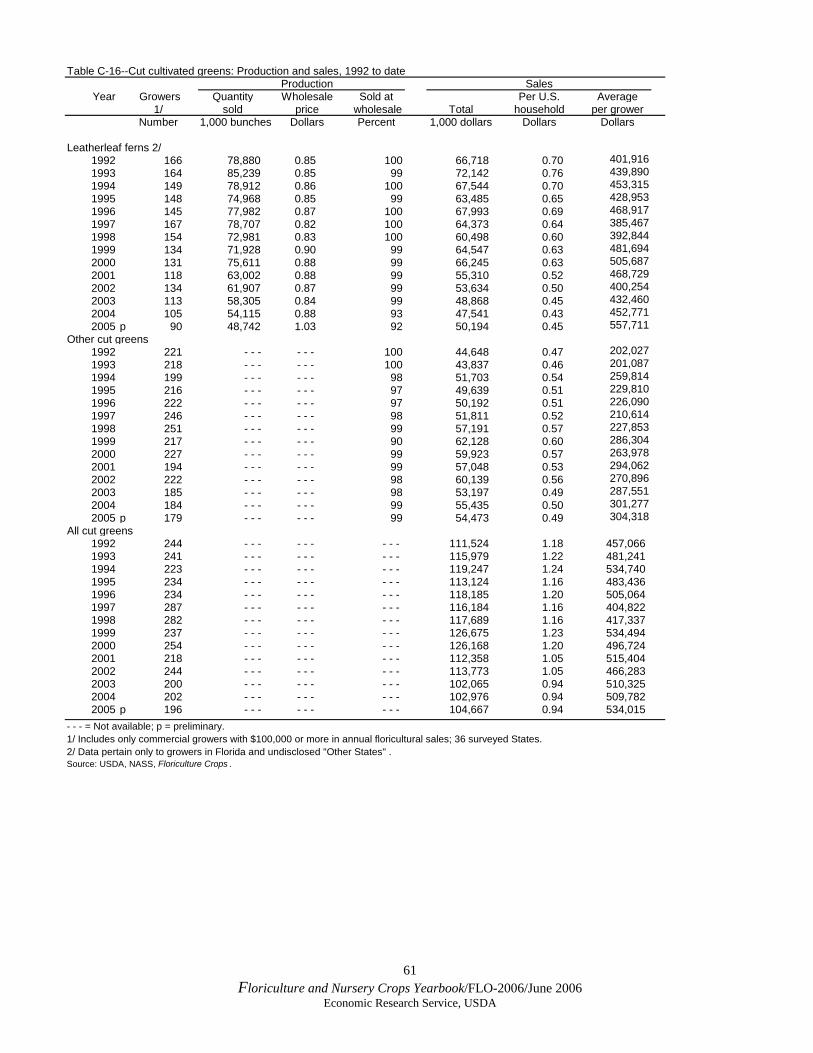
61 Floriculture and Nursery Crops Yearbook/FLO-2006/June 2006
Economic Research Service, USDA
Table C-16--Cut cultivated greens: Production and sales, 1992 to dateProduction Sales
Year Growers Quantity Wholesale Sold at Per U.S. Average1/ sold price wholesale Total household per grower
Number 1,000 bunches Dollars Percent 1,000 dollars Dollars Dollars
Leatherleaf ferns 2/ 1992 166 78,880 0.85 100 66,718 0.70 401,916 1993 164 85,239 0.85 99 72,142 0.76 439,890 1994 149 78,912 0.86 100 67,544 0.70 453,315 1995 148 74,968 0.85 99 63,485 0.65 428,953 1996 145 77,982 0.87 100 67,993 0.69 468,917 1997 167 78,707 0.82 100 64,373 0.64 385,467 1998 154 72,981 0.83 100 60,498 0.60 392,844 1999 134 71,928 0.90 99 64,547 0.63 481,694 2000 131 75,611 0.88 99 66,245 0.63 505,687 2001 118 63,002 0.88 99 55,310 0.52 468,729 2002 134 61,907 0.87 99 53,634 0.50 400,254 2003 113 58,305 0.84 99 48,868 0.45 432,460 2004 105 54,115 0.88 93 47,541 0.43 452,771 2005 p 90 48,742 1.03 92 50,194 0.45 557,711
Other cut greens 1992 221 - - - - - - 100 44,648 0.47 202,027 1993 218 - - - - - - 100 43,837 0.46 201,087 1994 199 - - - - - - 98 51,703 0.54 259,814 1995 216 - - - - - - 97 49,639 0.51 229,810 1996 222 - - - - - - 97 50,192 0.51 226,090 1997 246 - - - - - - 98 51,811 0.52 210,614 1998 251 - - - - - - 99 57,191 0.57 227,853 1999 217 - - - - - - 90 62,128 0.60 286,304 2000 227 - - - - - - 99 59,923 0.57 263,978 2001 194 - - - - - - 99 57,048 0.53 294,062 2002 222 - - - - - - 98 60,139 0.56 270,896 2003 185 - - - - - - 98 53,197 0.49 287,551 2004 184 - - - - - - 99 55,435 0.50 301,277 2005 p 179 - - - - - - 99 54,473 0.49 304,318
All cut greens 1992 244 - - - - - - - - - 111,524 1.18 457,066 1993 241 - - - - - - - - - 115,979 1.22 481,241 1994 223 - - - - - - - - - 119,247 1.24 534,740 1995 234 - - - - - - - - - 113,124 1.16 483,436 1996 234 - - - - - - - - - 118,185 1.20 505,064 1997 287 - - - - - - - - - 116,184 1.16 404,822 1998 282 - - - - - - - - - 117,689 1.16 417,337 1999 237 - - - - - - - - - 126,675 1.23 534,494 2000 254 - - - - - - - - - 126,168 1.20 496,724 2001 218 - - - - - - - - - 112,358 1.05 515,404 2002 244 - - - - - - - - - 113,773 1.05 466,283 2003 200 - - - - - - - - - 102,065 0.94 510,325 2004 202 - - - - - - - - - 102,976 0.94 509,782 2005 p 196 - - - - - - - - - 104,667 0.94 534,015
- - - = Not available; p = preliminary.1/ Includes only commercial growers with $100,000 or more in annual floricultural sales; 36 surveyed States.2/ Data pertain only to growers in Florida and undisclosed "Other States" .Source: USDA, NASS, Floriculture Crops .

62 Floriculture and Nursery Crops Yearbook/FLO-2006/June 2006
Economic Research Service, USDA
Table D-1--Potted flowering and foliage plants: Value of sales at wholesale, by plant type, 1985 to date 1/Florist Spring Other Total Potted Foliage
Year African chrysanthe- Florist flowering Orchids Easter Florist Poinsettias flowering flowering foliage hangingviolets mums azaleas bulbs lilies roses plants 2/ plants plants 3/ baskets
--1,000 dollars--
1985 14,074 70,269 30,000 - - - - - - 23,658 - - - 109,012 72,494 291,334 401,392 67,1031986 21,181 78,634 31,411 - - - - - - 25,328 - - - 124,176 105,653 388,727 449,391 71,9831987 27,749 95,079 37,515 - - - - - - 29,983 - - - 157,696 159,631 511,169 428,589 86,7431988 25,543 94,745 38,190 - - - - - - 30,976 - - - 155,130 159,808 507,731 404,133 77,4981989 27,185 95,617 45,533 - - - - - - 33,156 - - - 171,347 160,576 538,227 405,364 83,4871990 26,145 91,769 54,279 - - - - - - 34,247 - - - 165,777 256,428 632,691 400,539 74,3911991 25,585 88,075 62,150 - - - - - - 33,066 - - - 173,421 298,841 686,944 376,071 71,4961992 27,232 99,254 61,115 - - - - - - 34,729 - - - 193,484 230,217 646,031 350,915 76,0941993 24,777 95,564 59,241 - - - - - - 34,180 - - - 199,464 270,120 683,346 350,581 66,4681994 27,423 93,649 52,662 - - - - - - 36,021 - - - 207,605 245,130 662,490 400,232 89,0741995 25,086 92,219 57,770 - - - - - - 36,925 - - - 211,437 257,670 681,107 413,566 85,4031996 23,029 84,726 43,843 - - - 46,993 38,012 - - - 215,248 232,489 684,340 432,976 75,9711997 22,584 82,632 42,186 - - - 69,856 46,278 - - - 227,729 231,604 722,869 421,398 78,5661998 22,672 73,408 39,635 - - - 64,885 37,273 - - - 224,441 274,523 736,837 436,243 66,2581999 24,455 70,923 43,185 - - - 79,398 35,990 - - - 226,816 278,071 758,838 432,532 79,4672000 18,914 81,870 61,709 39,393 89,018 37,244 27,493 246,263 197,647 799,551 472,079 88,1132001 20,034 75,225 63,333 46,075 102,049 37,735 25,645 255,323 199,331 824,750 568,668 81,9222002 20,816 85,128 48,603 55,012 111,735 37,014 27,492 252,983 205,157 843,940 538,837 83,7232003 18,540 69,641 39,048 54,927 121,908 36,434 20,394 244,973 197,597 803,462 566,984 82,6972004 15,419 68,123 38,742 51,992 129,141 36,109 17,004 246,598 197,407 800,535 608,637 76,627
2005p 15,443 68,944 36,755 49,417 143,968 35,671 17,272 242,305 199,166 808,941 652,106 68,943See footnotes in table D-3.
Table D-2--Potted flowering and foliage plants: Quantity sold at wholesale, by plant type, 1985 to date 1/Florist Spring Other Total Potted Foliage
Year African chrysanthe- Florist flowering Orchids Easter Florist Poinsettias flowering flowering foliage hangingviolets mums azaleas bulbs lilies roses plants 2/ plants plants 3/ baskets
--1,000 pots--
1985 11,999 26,135 - - - - - - - - - 6,515 - - - 33,367 29,008 107,024 - - - 18,4531986 20,257 26,480 7,085 - - - - - - 6,921 - - - 36,674 46,660 144,077 - - - 19,7511987 24,321 33,064 8,619 - - - - - - 8,097 - - - 44,633 62,089 180,823 - - - 24,0141988 23,807 33,343 8,339 - - - - - - 8,041 - - - 43,137 62,008 178,675 - - - 20,6271989 22,972 32,403 10,316 - - - - - - 8,610 - - - 47,681 60,052 182,034 - - - 22,4161990 22,003 29,840 13,647 - - - - - - 8,893 - - - 47,494 83,134 205,011 - - - 20,5761991 22,443 29,908 14,675 - - - - - - 8,461 - - - 49,271 99,211 223,969 - - - 19,3361992 23,061 33,271 14,693 - - - - - - 8,989 - - - 55,554 100,538 236,106 - - - 20,0071993 22,729 32,134 14,143 - - - - - - 8,640 - - - 56,504 107,731 241,881 - - - 17,1961994 24,684 31,287 15,598 - - - - - - 9,081 - - - 57,895 83,421 221,966 - - - 24,0951995 22,073 32,000 16,044 - - - - - - 9,230 - - - 58,177 91,049 228,573 - - - 22,7251996 20,952 28,730 11,818 - - - 8,592 9,581 - - - 59,692 97,808 237,173 - - - 19,7361997 20,074 27,107 12,934 - - - 9,581 12,352 - - - 62,445 91,946 236,439 - - - 20,0661998 19,493 24,934 9,938 - - - 8,606 9,430 - - - 61,908 100,394 234,703 - - - 15,9931999 20,904 24,113 9,925 - - - 10,500 9,109 - - - 63,489 104,067 242,107 - - - 20,6302000 16,300 28,375 14,912 15,183 9,694 9,143 11,628 66,388 73,673 245,296 - - - 20,9832001 16,094 25,177 13,961 17,877 12,200 9,450 10,329 66,966 66,948 239,002 - - - 21,2922002 16,134 31,044 10,714 19,937 13,265 9,094 9,145 66,544 68,136 244,013 - - - 19,9842003 15,028 26,703 8,611 19,387 15,080 8,824 7,808 61,524 68,071 231,036 - - - 19,4522004 12,637 26,936 8,643 17,491 17,293 8,553 6,795 59,588 64,630 222,566 - - - 17,160
2005p 12,462 23,395 8,885 20,917 18,002 8,409 6,947 59,270 62,518 220,805 - - - 14,897See footnotes in table D-3.
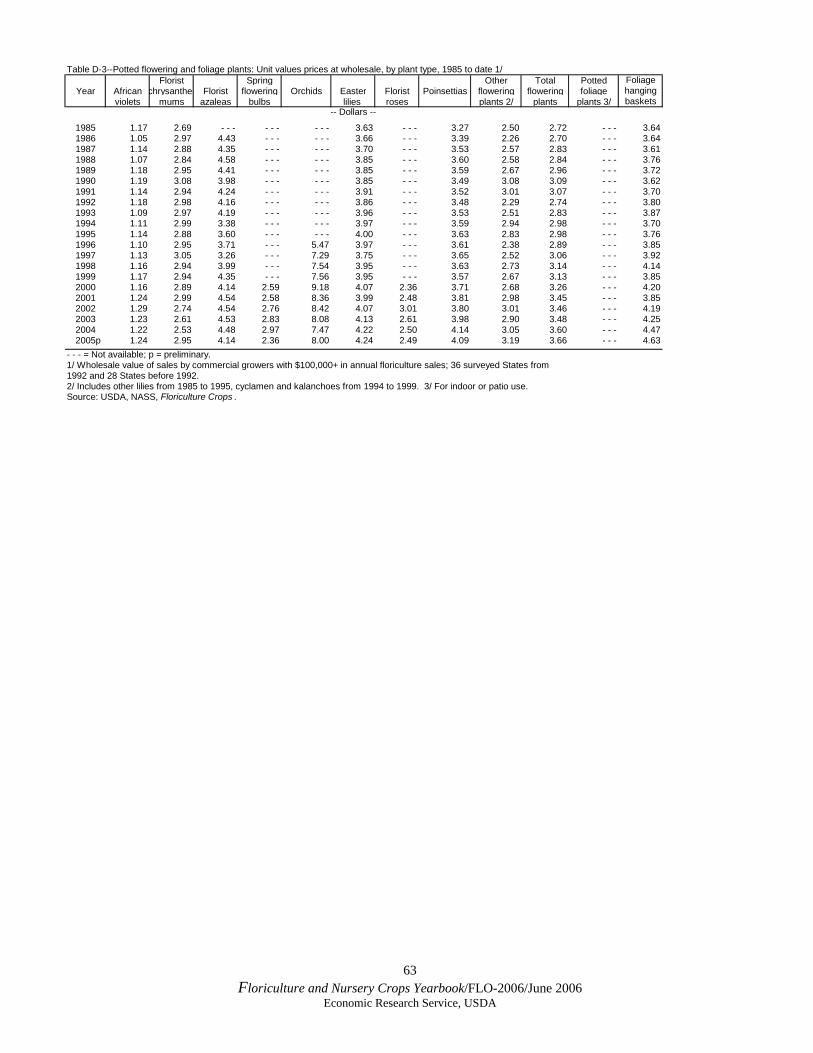
63 Floriculture and Nursery Crops Yearbook/FLO-2006/June 2006
Economic Research Service, USDA
Table D-3--Potted flowering and foliage plants: Unit values prices at wholesale, by plant type, 1985 to date 1/Florist Spring Other Total Potted Foliage
Year African chrysanthe- Florist flowering Orchids Easter Florist Poinsettias flowering flowering foliage hangingviolets mums azaleas bulbs lilies roses plants 2/ plants plants 3/ baskets
-- Dollars --
1985 1.17 2.69 - - - - - - - - - 3.63 - - - 3.27 2.50 2.72 - - - 3.641986 1.05 2.97 4.43 - - - - - - 3.66 - - - 3.39 2.26 2.70 - - - 3.641987 1.14 2.88 4.35 - - - - - - 3.70 - - - 3.53 2.57 2.83 - - - 3.611988 1.07 2.84 4.58 - - - - - - 3.85 - - - 3.60 2.58 2.84 - - - 3.761989 1.18 2.95 4.41 - - - - - - 3.85 - - - 3.59 2.67 2.96 - - - 3.721990 1.19 3.08 3.98 - - - - - - 3.85 - - - 3.49 3.08 3.09 - - - 3.621991 1.14 2.94 4.24 - - - - - - 3.91 - - - 3.52 3.01 3.07 - - - 3.701992 1.18 2.98 4.16 - - - - - - 3.86 - - - 3.48 2.29 2.74 - - - 3.801993 1.09 2.97 4.19 - - - - - - 3.96 - - - 3.53 2.51 2.83 - - - 3.871994 1.11 2.99 3.38 - - - - - - 3.97 - - - 3.59 2.94 2.98 - - - 3.701995 1.14 2.88 3.60 - - - - - - 4.00 - - - 3.63 2.83 2.98 - - - 3.761996 1.10 2.95 3.71 - - - 5.47 3.97 - - - 3.61 2.38 2.89 - - - 3.851997 1.13 3.05 3.26 - - - 7.29 3.75 - - - 3.65 2.52 3.06 - - - 3.921998 1.16 2.94 3.99 - - - 7.54 3.95 - - - 3.63 2.73 3.14 - - - 4.141999 1.17 2.94 4.35 - - - 7.56 3.95 - - - 3.57 2.67 3.13 - - - 3.852000 1.16 2.89 4.14 2.59 9.18 4.07 2.36 3.71 2.68 3.26 - - - 4.202001 1.24 2.99 4.54 2.58 8.36 3.99 2.48 3.81 2.98 3.45 - - - 3.852002 1.29 2.74 4.54 2.76 8.42 4.07 3.01 3.80 3.01 3.46 - - - 4.192003 1.23 2.61 4.53 2.83 8.08 4.13 2.61 3.98 2.90 3.48 - - - 4.252004 1.22 2.53 4.48 2.97 7.47 4.22 2.50 4.14 3.05 3.60 - - - 4.47
2005p 1.24 2.95 4.14 2.36 8.00 4.24 2.49 4.09 3.19 3.66 - - - 4.63- - - = Not available; p = preliminary.1/ Wholesale value of sales by commercial growers with $100,000+ in annual floriculture sales; 36 surveyed States from 1992 and 28 States before 1992.2/ Includes other lilies from 1985 to 1995, cyclamen and kalanchoes from 1994 to 1999. 3/ For indoor or patio use.Source: USDA, NASS, Floriculture Crops .
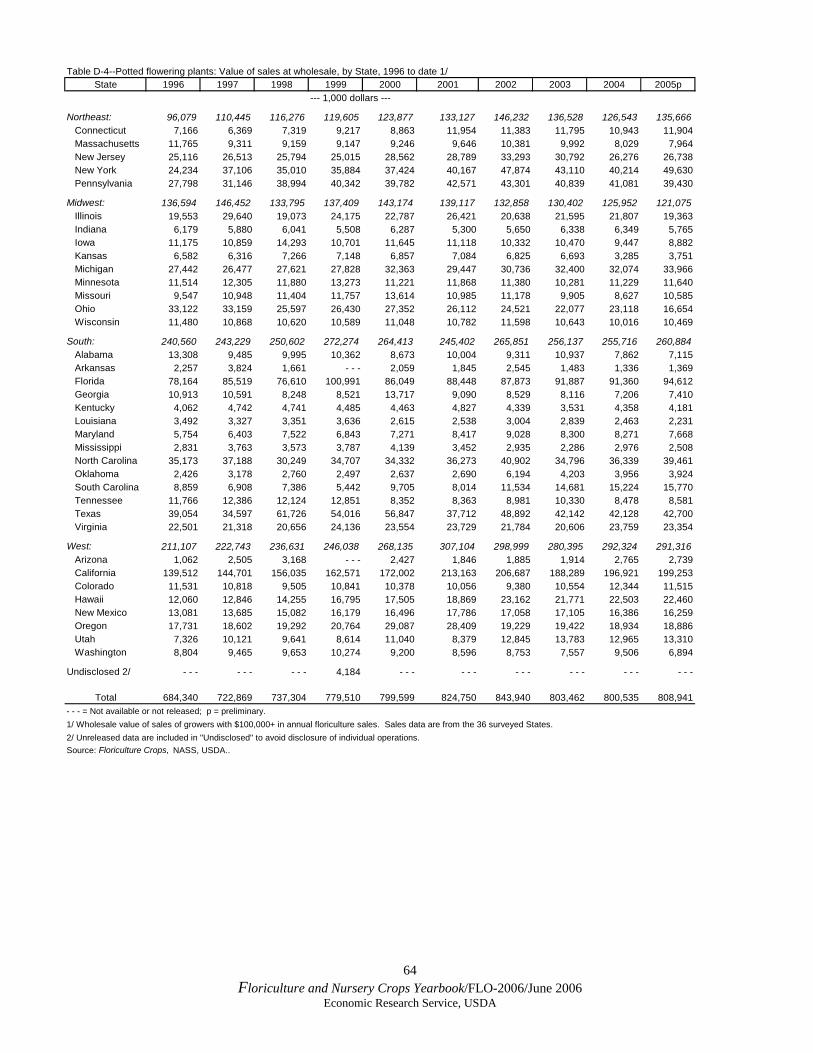
64 Floriculture and Nursery Crops Yearbook/FLO-2006/June 2006
Economic Research Service, USDA
Table D-4--Potted flowering plants: Value of sales at wholesale, by State, 1996 to date 1/State 1996 1997 1998 1999 2000 2001 2002 2003 2004 2005p
--- 1,000 dollars ---
Northeast: 96,079 110,445 116,276 119,605 123,877 133,127 146,232 136,528 126,543 135,666 Connecticut 7,166 6,369 7,319 9,217 8,863 11,954 11,383 11,795 10,943 11,904 Massachusetts 11,765 9,311 9,159 9,147 9,246 9,646 10,381 9,992 8,029 7,964 New Jersey 25,116 26,513 25,794 25,015 28,562 28,789 33,293 30,792 26,276 26,738 New York 24,234 37,106 35,010 35,884 37,424 40,167 47,874 43,110 40,214 49,630 Pennsylvania 27,798 31,146 38,994 40,342 39,782 42,571 43,301 40,839 41,081 39,430
Midwest: 136,594 146,452 133,795 137,409 143,174 139,117 132,858 130,402 125,952 121,075 Illinois 19,553 29,640 19,073 24,175 22,787 26,421 20,638 21,595 21,807 19,363 Indiana 6,179 5,880 6,041 5,508 6,287 5,300 5,650 6,338 6,349 5,765 Iowa 11,175 10,859 14,293 10,701 11,645 11,118 10,332 10,470 9,447 8,882 Kansas 6,582 6,316 7,266 7,148 6,857 7,084 6,825 6,693 3,285 3,751 Michigan 27,442 26,477 27,621 27,828 32,363 29,447 30,736 32,400 32,074 33,966 Minnesota 11,514 12,305 11,880 13,273 11,221 11,868 11,380 10,281 11,229 11,640 Missouri 9,547 10,948 11,404 11,757 13,614 10,985 11,178 9,905 8,627 10,585 Ohio 33,122 33,159 25,597 26,430 27,352 26,112 24,521 22,077 23,118 16,654 Wisconsin 11,480 10,868 10,620 10,589 11,048 10,782 11,598 10,643 10,016 10,469
South: 240,560 243,229 250,602 272,274 264,413 245,402 265,851 256,137 255,716 260,884 Alabama 13,308 9,485 9,995 10,362 8,673 10,004 9,311 10,937 7,862 7,115 Arkansas 2,257 3,824 1,661 - - - 2,059 1,845 2,545 1,483 1,336 1,369 Florida 78,164 85,519 76,610 100,991 86,049 88,448 87,873 91,887 91,360 94,612 Georgia 10,913 10,591 8,248 8,521 13,717 9,090 8,529 8,116 7,206 7,410 Kentucky 4,062 4,742 4,741 4,485 4,463 4,827 4,339 3,531 4,358 4,181 Louisiana 3,492 3,327 3,351 3,636 2,615 2,538 3,004 2,839 2,463 2,231 Maryland 5,754 6,403 7,522 6,843 7,271 8,417 9,028 8,300 8,271 7,668 Mississippi 2,831 3,763 3,573 3,787 4,139 3,452 2,935 2,286 2,976 2,508 North Carolina 35,173 37,188 30,249 34,707 34,332 36,273 40,902 34,796 36,339 39,461 Oklahoma 2,426 3,178 2,760 2,497 2,637 2,690 6,194 4,203 3,956 3,924 South Carolina 8,859 6,908 7,386 5,442 9,705 8,014 11,534 14,681 15,224 15,770 Tennessee 11,766 12,386 12,124 12,851 8,352 8,363 8,981 10,330 8,478 8,581 Texas 39,054 34,597 61,726 54,016 56,847 37,712 48,892 42,142 42,128 42,700 Virginia 22,501 21,318 20,656 24,136 23,554 23,729 21,784 20,606 23,759 23,354
West: 211,107 222,743 236,631 246,038 268,135 307,104 298,999 280,395 292,324 291,316 Arizona 1,062 2,505 3,168 - - - 2,427 1,846 1,885 1,914 2,765 2,739 California 139,512 144,701 156,035 162,571 172,002 213,163 206,687 188,289 196,921 199,253 Colorado 11,531 10,818 9,505 10,841 10,378 10,056 9,380 10,554 12,344 11,515 Hawaii 12,060 12,846 14,255 16,795 17,505 18,869 23,162 21,771 22,503 22,460 New Mexico 13,081 13,685 15,082 16,179 16,496 17,786 17,058 17,105 16,386 16,259 Oregon 17,731 18,602 19,292 20,764 29,087 28,409 19,229 19,422 18,934 18,886 Utah 7,326 10,121 9,641 8,614 11,040 8,379 12,845 13,783 12,965 13,310 Washington 8,804 9,465 9,653 10,274 9,200 8,596 8,753 7,557 9,506 6,894
Undisclosed 2/ - - - - - - - - - 4,184 - - - - - - - - - - - - - - - - - -
Total 684,340 722,869 737,304 779,510 799,599 824,750 843,940 803,462 800,535 808,941- - - = Not available or not released; p = preliminary.1/ Wholesale value of sales of growers with $100,000+ in annual floriculture sales. Sales data are from the 36 surveyed States.2/ Unreleased data are included in "Undisclosed" to avoid disclosure of individual operations.Source: Floriculture Crops, NASS, USDA..
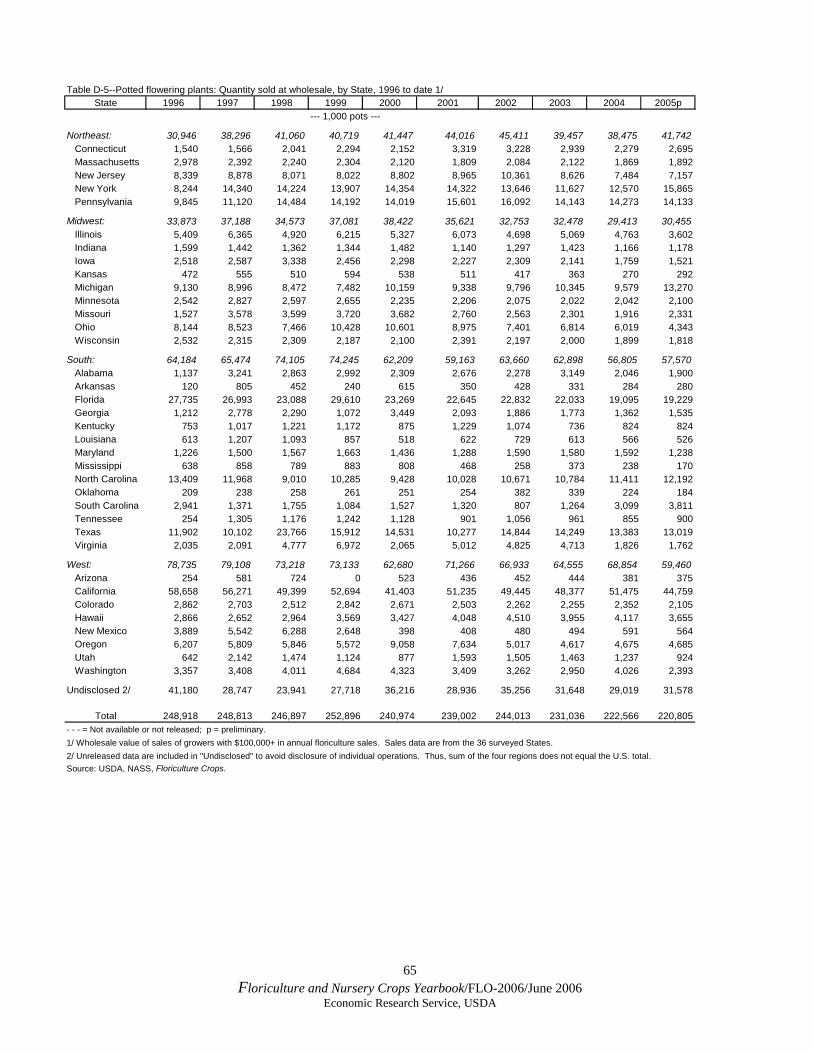
65 Floriculture and Nursery Crops Yearbook/FLO-2006/June 2006
Economic Research Service, USDA
Table D-5--Potted flowering plants: Quantity sold at wholesale, by State, 1996 to date 1/
State 1996 1997 1998 1999 2000 2001 2002 2003 2004 2005p--- 1,000 pots ---
Northeast: 30,946 38,296 41,060 40,719 41,447 44,016 45,411 39,457 38,475 41,742 Connecticut 1,540 1,566 2,041 2,294 2,152 3,319 3,228 2,939 2,279 2,695 Massachusetts 2,978 2,392 2,240 2,304 2,120 1,809 2,084 2,122 1,869 1,892 New Jersey 8,339 8,878 8,071 8,022 8,802 8,965 10,361 8,626 7,484 7,157 New York 8,244 14,340 14,224 13,907 14,354 14,322 13,646 11,627 12,570 15,865 Pennsylvania 9,845 11,120 14,484 14,192 14,019 15,601 16,092 14,143 14,273 14,133
Midwest: 33,873 37,188 34,573 37,081 38,422 35,621 32,753 32,478 29,413 30,455 Illinois 5,409 6,365 4,920 6,215 5,327 6,073 4,698 5,069 4,763 3,602 Indiana 1,599 1,442 1,362 1,344 1,482 1,140 1,297 1,423 1,166 1,178 Iowa 2,518 2,587 3,338 2,456 2,298 2,227 2,309 2,141 1,759 1,521 Kansas 472 555 510 594 538 511 417 363 270 292 Michigan 9,130 8,996 8,472 7,482 10,159 9,338 9,796 10,345 9,579 13,270 Minnesota 2,542 2,827 2,597 2,655 2,235 2,206 2,075 2,022 2,042 2,100 Missouri 1,527 3,578 3,599 3,720 3,682 2,760 2,563 2,301 1,916 2,331 Ohio 8,144 8,523 7,466 10,428 10,601 8,975 7,401 6,814 6,019 4,343 Wisconsin 2,532 2,315 2,309 2,187 2,100 2,391 2,197 2,000 1,899 1,818
South: 64,184 65,474 74,105 74,245 62,209 59,163 63,660 62,898 56,805 57,570 Alabama 1,137 3,241 2,863 2,992 2,309 2,676 2,278 3,149 2,046 1,900 Arkansas 120 805 452 240 615 350 428 331 284 280 Florida 27,735 26,993 23,088 29,610 23,269 22,645 22,832 22,033 19,095 19,229 Georgia 1,212 2,778 2,290 1,072 3,449 2,093 1,886 1,773 1,362 1,535 Kentucky 753 1,017 1,221 1,172 875 1,229 1,074 736 824 824 Louisiana 613 1,207 1,093 857 518 622 729 613 566 526 Maryland 1,226 1,500 1,567 1,663 1,436 1,288 1,590 1,580 1,592 1,238 Mississippi 638 858 789 883 808 468 258 373 238 170 North Carolina 13,409 11,968 9,010 10,285 9,428 10,028 10,671 10,784 11,411 12,192 Oklahoma 209 238 258 261 251 254 382 339 224 184 South Carolina 2,941 1,371 1,755 1,084 1,527 1,320 807 1,264 3,099 3,811 Tennessee 254 1,305 1,176 1,242 1,128 901 1,056 961 855 900 Texas 11,902 10,102 23,766 15,912 14,531 10,277 14,844 14,249 13,383 13,019 Virginia 2,035 2,091 4,777 6,972 2,065 5,012 4,825 4,713 1,826 1,762
West: 78,735 79,108 73,218 73,133 62,680 71,266 66,933 64,555 68,854 59,460 Arizona 254 581 724 0 523 436 452 444 381 375 California 58,658 56,271 49,399 52,694 41,403 51,235 49,445 48,377 51,475 44,759 Colorado 2,862 2,703 2,512 2,842 2,671 2,503 2,262 2,255 2,352 2,105 Hawaii 2,866 2,652 2,964 3,569 3,427 4,048 4,510 3,955 4,117 3,655 New Mexico 3,889 5,542 6,288 2,648 398 408 480 494 591 564 Oregon 6,207 5,809 5,846 5,572 9,058 7,634 5,017 4,617 4,675 4,685 Utah 642 2,142 1,474 1,124 877 1,593 1,505 1,463 1,237 924 Washington 3,357 3,408 4,011 4,684 4,323 3,409 3,262 2,950 4,026 2,393
Undisclosed 2/ 41,180 28,747 23,941 27,718 36,216 28,936 35,256 31,648 29,019 31,578
Total 248,918 248,813 246,897 252,896 240,974 239,002 244,013 231,036 222,566 220,805- - - = Not available or not released; p = preliminary.1/ Wholesale value of sales of growers with $100,000+ in annual floriculture sales. Sales data are from the 36 surveyed States.2/ Unreleased data are included in "Undisclosed" to avoid disclosure of individual operations. Thus, sum of the four regions does not equal the U.S. total.Source: USDA, NASS, Floriculture Crops.
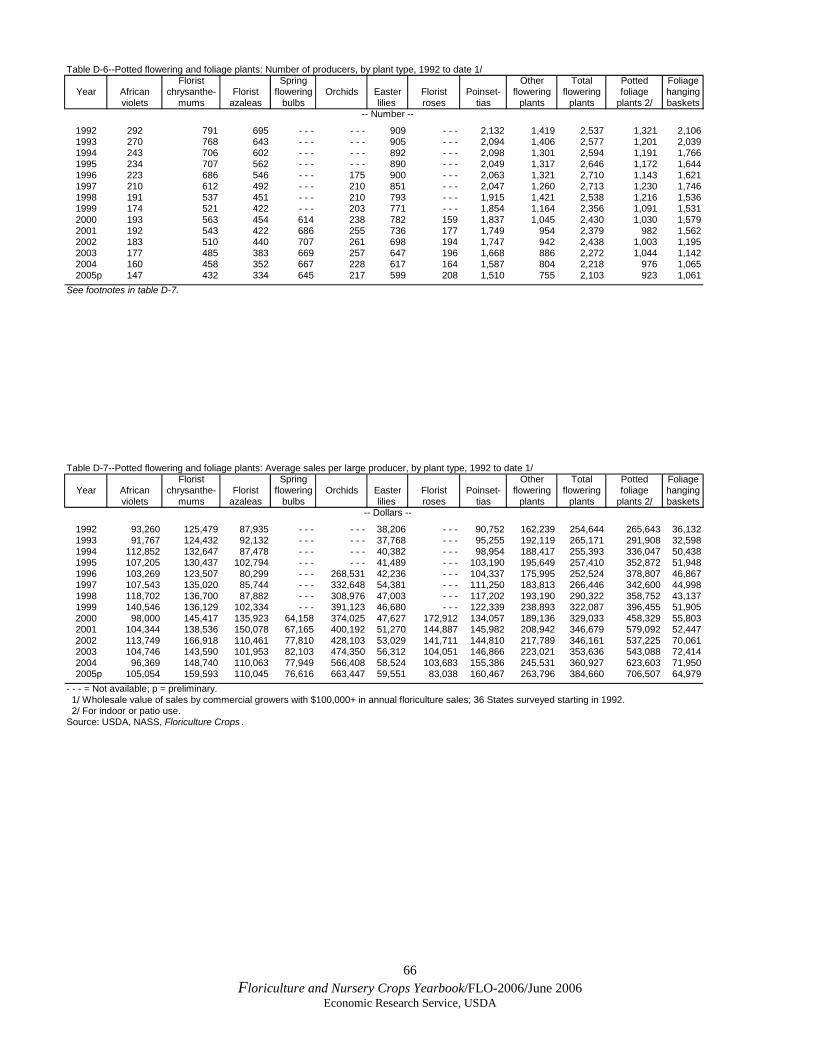
66 Floriculture and Nursery Crops Yearbook/FLO-2006/June 2006
Economic Research Service, USDA
Table D-6--Potted flowering and foliage plants: Number of producers, by plant type, 1992 to date 1/Florist Spring Other Total Potted Foliage
Year African chrysanthe- Florist flowering Orchids Easter Florist Poinset- flowering flowering foliage hangingviolets mums azaleas bulbs lilies roses tias plants plants plants 2/ baskets
-- Number --
1992 292 791 695 - - - - - - 909 - - - 2,132 1,419 2,537 1,321 2,1061993 270 768 643 - - - - - - 905 - - - 2,094 1,406 2,577 1,201 2,0391994 243 706 602 - - - - - - 892 - - - 2,098 1,301 2,594 1,191 1,7661995 234 707 562 - - - - - - 890 - - - 2,049 1,317 2,646 1,172 1,6441996 223 686 546 - - - 175 900 - - - 2,063 1,321 2,710 1,143 1,6211997 210 612 492 - - - 210 851 - - - 2,047 1,260 2,713 1,230 1,7461998 191 537 451 - - - 210 793 - - - 1,915 1,421 2,538 1,216 1,5361999 174 521 422 - - - 203 771 - - - 1,854 1,164 2,356 1,091 1,5312000 193 563 454 614 238 782 159 1,837 1,045 2,430 1,030 1,5792001 192 543 422 686 255 736 177 1,749 954 2,379 982 1,5622002 183 510 440 707 261 698 194 1,747 942 2,438 1,003 1,1952003 177 485 383 669 257 647 196 1,668 886 2,272 1,044 1,1422004 160 458 352 667 228 617 164 1,587 804 2,218 976 1,065
2005p 147 432 334 645 217 599 208 1,510 755 2,103 923 1,061See footnotes in table D-7.
Table D-7--Potted flowering and foliage plants: Average sales per large producer, by plant type, 1992 to date 1/Florist Spring Other Total Potted Foliage
Year African chrysanthe- Florist flowering Orchids Easter Florist Poinset- flowering flowering foliage hangingviolets mums azaleas bulbs lilies roses tias plants plants plants 2/ baskets
-- Dollars --
1992 93,260 125,479 87,935 - - - - - - 38,206 - - - 90,752 162,239 254,644 265,643 36,1321993 91,767 124,432 92,132 - - - - - - 37,768 - - - 95,255 192,119 265,171 291,908 32,5981994 112,852 132,647 87,478 - - - - - - 40,382 - - - 98,954 188,417 255,393 336,047 50,4381995 107,205 130,437 102,794 - - - - - - 41,489 - - - 103,190 195,649 257,410 352,872 51,9481996 103,269 123,507 80,299 - - - 268,531 42,236 - - - 104,337 175,995 252,524 378,807 46,8671997 107,543 135,020 85,744 - - - 332,648 54,381 - - - 111,250 183,813 266,446 342,600 44,9981998 118,702 136,700 87,882 - - - 308,976 47,003 - - - 117,202 193,190 290,322 358,752 43,1371999 140,546 136,129 102,334 - - - 391,123 46,680 - - - 122,339 238,893 322,087 396,455 51,9052000 98,000 145,417 135,923 64,158 374,025 47,627 172,912 134,057 189,136 329,033 458,329 55,8032001 104,344 138,536 150,078 67,165 400,192 51,270 144,887 145,982 208,942 346,679 579,092 52,4472002 113,749 166,918 110,461 77,810 428,103 53,029 141,711 144,810 217,789 346,161 537,225 70,0612003 104,746 143,590 101,953 82,103 474,350 56,312 104,051 146,866 223,021 353,636 543,088 72,4142004 96,369 148,740 110,063 77,949 566,408 58,524 103,683 155,386 245,531 360,927 623,603 71,950
2005p 105,054 159,593 110,045 76,616 663,447 59,551 83,038 160,467 263,796 384,660 706,507 64,979- - - = Not available; p = preliminary. 1/ Wholesale value of sales by commercial growers with $100,000+ in annual floriculture sales; 36 States surveyed starting in 1992. 2/ For indoor or patio use.Source: USDA, NASS, Floriculture Crops .
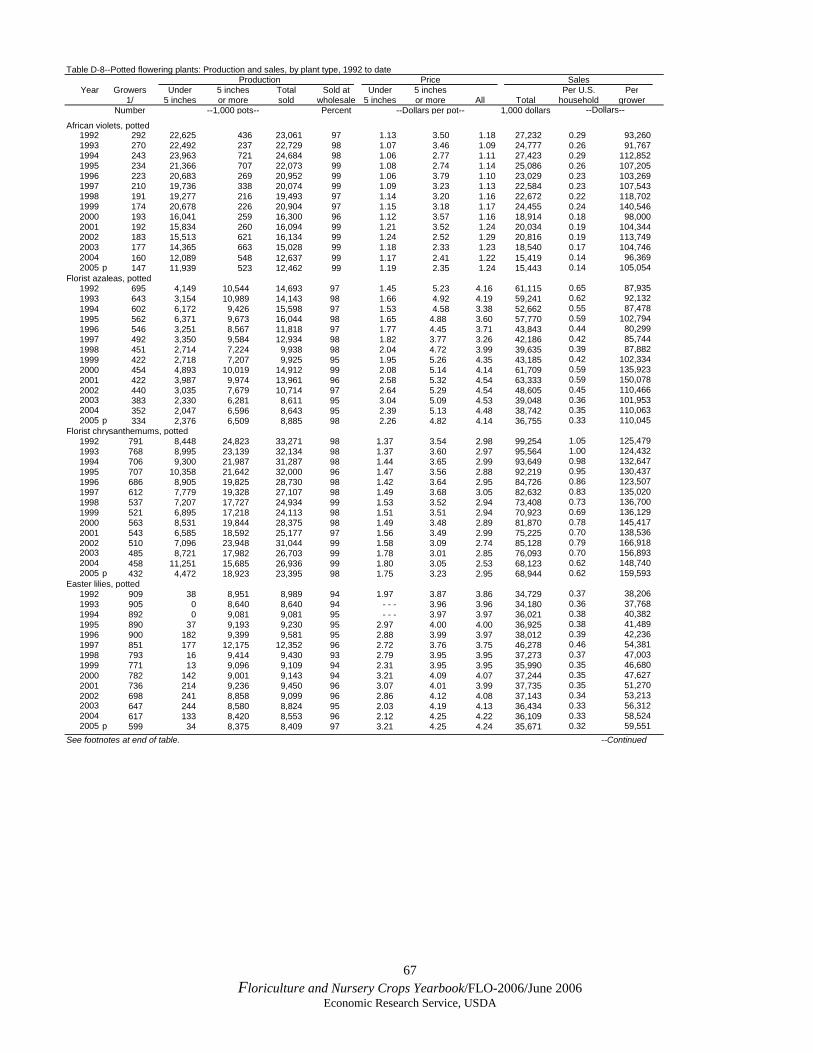
67 Floriculture and Nursery Crops Yearbook/FLO-2006/June 2006
Economic Research Service, USDA
Table D-8--Potted flowering plants: Production and sales, by plant type, 1992 to dateProduction Price Sales
Year Growers Under 5 inches Total Sold at Under 5 inches Per U.S. Per1/ 5 inches or more sold wholesale 5 inches or more All Total household grower
Number --1,000 pots-- Percent --Dollars per pot-- 1,000 dollars --Dollars--
African violets, potted1992 292 22,625 436 23,061 97 1.13 3.50 1.18 27,232 0.29 93,2601993 270 22,492 237 22,729 98 1.07 3.46 1.09 24,777 0.26 91,7671994 243 23,963 721 24,684 98 1.06 2.77 1.11 27,423 0.29 112,8521995 234 21,366 707 22,073 99 1.08 2.74 1.14 25,086 0.26 107,2051996 223 20,683 269 20,952 99 1.06 3.79 1.10 23,029 0.23 103,2691997 210 19,736 338 20,074 99 1.09 3.23 1.13 22,584 0.23 107,5431998 191 19,277 216 19,493 97 1.14 3.20 1.16 22,672 0.22 118,7021999 174 20,678 226 20,904 97 1.15 3.18 1.17 24,455 0.24 140,5462000 193 16,041 259 16,300 96 1.12 3.57 1.16 18,914 0.18 98,0002001 192 15,834 260 16,094 99 1.21 3.52 1.24 20,034 0.19 104,3442002 183 15,513 621 16,134 99 1.24 2.52 1.29 20,816 0.19 113,7492003 177 14,365 663 15,028 99 1.18 2.33 1.23 18,540 0.17 104,7462004 160 12,089 548 12,637 99 1.17 2.41 1.22 15,419 0.14 96,3692005 p 147 11,939 523 12,462 99 1.19 2.35 1.24 15,443 0.14 105,054
Florist azaleas, potted1992 695 4,149 10,544 14,693 97 1.45 5.23 4.16 61,115 0.65 87,9351993 643 3,154 10,989 14,143 98 1.66 4.92 4.19 59,241 0.62 92,1321994 602 6,172 9,426 15,598 97 1.53 4.58 3.38 52,662 0.55 87,4781995 562 6,371 9,673 16,044 98 1.65 4.88 3.60 57,770 0.59 102,7941996 546 3,251 8,567 11,818 97 1.77 4.45 3.71 43,843 0.44 80,2991997 492 3,350 9,584 12,934 98 1.82 3.77 3.26 42,186 0.42 85,7441998 451 2,714 7,224 9,938 98 2.04 4.72 3.99 39,635 0.39 87,8821999 422 2,718 7,207 9,925 95 1.95 5.26 4.35 43,185 0.42 102,3342000 454 4,893 10,019 14,912 99 2.08 5.14 4.14 61,709 0.59 135,9232001 422 3,987 9,974 13,961 96 2.58 5.32 4.54 63,333 0.59 150,0782002 440 3,035 7,679 10,714 97 2.64 5.29 4.54 48,605 0.45 110,4662003 383 2,330 6,281 8,611 95 3.04 5.09 4.53 39,048 0.36 101,9532004 352 2,047 6,596 8,643 95 2.39 5.13 4.48 38,742 0.35 110,0632005 p 334 2,376 6,509 8,885 98 2.26 4.82 4.14 36,755 0.33 110,045
Florist chrysanthemums, potted1992 791 8,448 24,823 33,271 98 1.37 3.54 2.98 99,254 1.05 125,4791993 768 8,995 23,139 32,134 98 1.37 3.60 2.97 95,564 1.00 124,4321994 706 9,300 21,987 31,287 98 1.44 3.65 2.99 93,649 0.98 132,6471995 707 10,358 21,642 32,000 96 1.47 3.56 2.88 92,219 0.95 130,4371996 686 8,905 19,825 28,730 98 1.42 3.64 2.95 84,726 0.86 123,5071997 612 7,779 19,328 27,107 98 1.49 3.68 3.05 82,632 0.83 135,0201998 537 7,207 17,727 24,934 99 1.53 3.52 2.94 73,408 0.73 136,7001999 521 6,895 17,218 24,113 98 1.51 3.51 2.94 70,923 0.69 136,1292000 563 8,531 19,844 28,375 98 1.49 3.48 2.89 81,870 0.78 145,4172001 543 6,585 18,592 25,177 97 1.56 3.49 2.99 75,225 0.70 138,5362002 510 7,096 23,948 31,044 99 1.58 3.09 2.74 85,128 0.79 166,9182003 485 8,721 17,982 26,703 99 1.78 3.01 2.85 76,093 0.70 156,8932004 458 11,251 15,685 26,936 99 1.80 3.05 2.53 68,123 0.62 148,7402005 p 432 4,472 18,923 23,395 98 1.75 3.23 2.95 68,944 0.62 159,593
Easter lilies, potted1992 909 38 8,951 8,989 94 1.97 3.87 3.86 34,729 0.37 38,2061993 905 0 8,640 8,640 94 - - - 3.96 3.96 34,180 0.36 37,7681994 892 0 9,081 9,081 95 - - - 3.97 3.97 36,021 0.38 40,3821995 890 37 9,193 9,230 95 2.97 4.00 4.00 36,925 0.38 41,4891996 900 182 9,399 9,581 95 2.88 3.99 3.97 38,012 0.39 42,2361997 851 177 12,175 12,352 96 2.72 3.76 3.75 46,278 0.46 54,3811998 793 16 9,414 9,430 93 2.79 3.95 3.95 37,273 0.37 47,0031999 771 13 9,096 9,109 94 2.31 3.95 3.95 35,990 0.35 46,6802000 782 142 9,001 9,143 94 3.21 4.09 4.07 37,244 0.35 47,6272001 736 214 9,236 9,450 96 3.07 4.01 3.99 37,735 0.35 51,2702002 698 241 8,858 9,099 96 2.86 4.12 4.08 37,143 0.34 53,2132003 647 244 8,580 8,824 95 2.03 4.19 4.13 36,434 0.33 56,3122004 617 133 8,420 8,553 96 2.12 4.25 4.22 36,109 0.33 58,5242005 p 599 34 8,375 8,409 97 3.21 4.25 4.24 35,671 0.32 59,551
See footnotes at end of table. --Continued
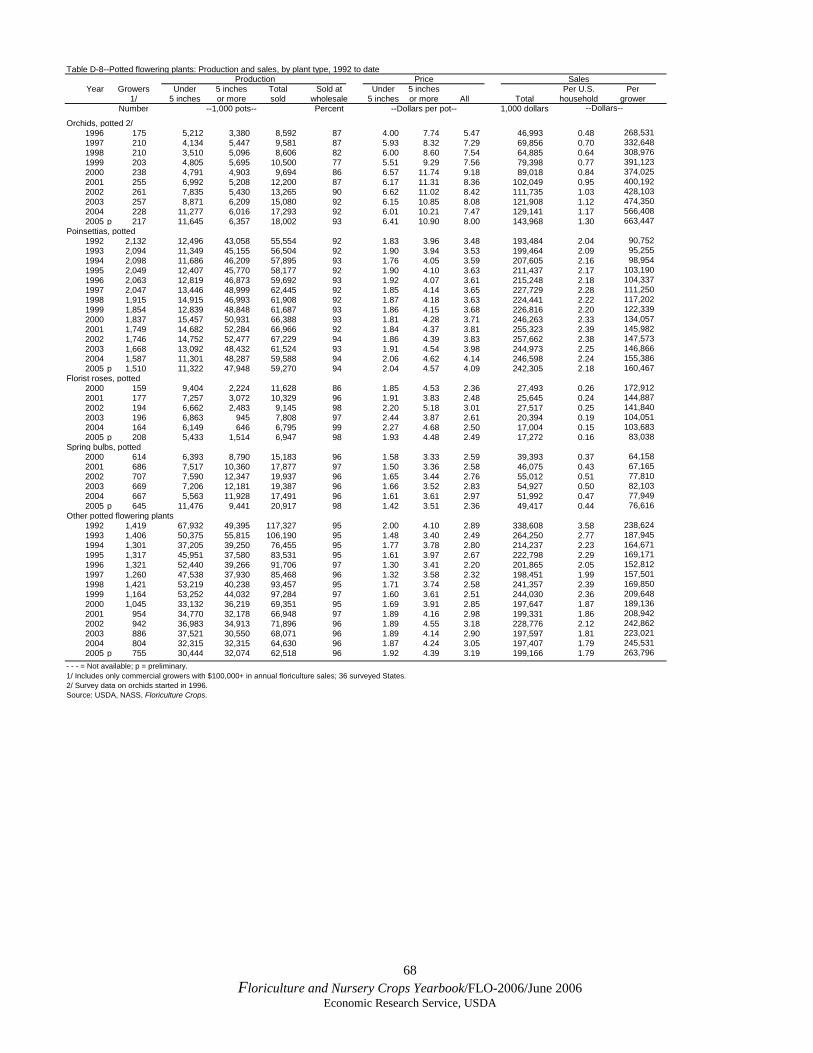
68 Floriculture and Nursery Crops Yearbook/FLO-2006/June 2006
Economic Research Service, USDA
Table D-8--Potted flowering plants: Production and sales, by plant type, 1992 to date Production Price Sales
Year Growers Under 5 inches Total Sold at Under 5 inches Per U.S. Per1/ 5 inches or more sold wholesale 5 inches or more All Total household grower
Number --1,000 pots-- Percent --Dollars per pot-- 1,000 dollars --Dollars--
Orchids, potted 2/1996 175 5,212 3,380 8,592 87 4.00 7.74 5.47 46,993 0.48 268,5311997 210 4,134 5,447 9,581 87 5.93 8.32 7.29 69,856 0.70 332,6481998 210 3,510 5,096 8,606 82 6.00 8.60 7.54 64,885 0.64 308,9761999 203 4,805 5,695 10,500 77 5.51 9.29 7.56 79,398 0.77 391,1232000 238 4,791 4,903 9,694 86 6.57 11.74 9.18 89,018 0.84 374,0252001 255 6,992 5,208 12,200 87 6.17 11.31 8.36 102,049 0.95 400,1922002 261 7,835 5,430 13,265 90 6.62 11.02 8.42 111,735 1.03 428,1032003 257 8,871 6,209 15,080 92 6.15 10.85 8.08 121,908 1.12 474,3502004 228 11,277 6,016 17,293 92 6.01 10.21 7.47 129,141 1.17 566,4082005 p 217 11,645 6,357 18,002 93 6.41 10.90 8.00 143,968 1.30 663,447
Poinsettias, potted1992 2,132 12,496 43,058 55,554 92 1.83 3.96 3.48 193,484 2.04 90,7521993 2,094 11,349 45,155 56,504 92 1.90 3.94 3.53 199,464 2.09 95,2551994 2,098 11,686 46,209 57,895 93 1.76 4.05 3.59 207,605 2.16 98,9541995 2,049 12,407 45,770 58,177 92 1.90 4.10 3.63 211,437 2.17 103,1901996 2,063 12,819 46,873 59,692 93 1.92 4.07 3.61 215,248 2.18 104,3371997 2,047 13,446 48,999 62,445 92 1.85 4.14 3.65 227,729 2.28 111,2501998 1,915 14,915 46,993 61,908 92 1.87 4.18 3.63 224,441 2.22 117,2021999 1,854 12,839 48,848 61,687 93 1.86 4.15 3.68 226,816 2.20 122,3392000 1,837 15,457 50,931 66,388 93 1.81 4.28 3.71 246,263 2.33 134,0572001 1,749 14,682 52,284 66,966 92 1.84 4.37 3.81 255,323 2.39 145,9822002 1,746 14,752 52,477 67,229 94 1.86 4.39 3.83 257,662 2.38 147,5732003 1,668 13,092 48,432 61,524 93 1.91 4.54 3.98 244,973 2.25 146,8662004 1,587 11,301 48,287 59,588 94 2.06 4.62 4.14 246,598 2.24 155,3862005 p 1,510 11,322 47,948 59,270 94 2.04 4.57 4.09 242,305 2.18 160,467
Florist roses, potted2000 159 9,404 2,224 11,628 86 1.85 4.53 2.36 27,493 0.26 172,9122001 177 7,257 3,072 10,329 96 1.91 3.83 2.48 25,645 0.24 144,8872002 194 6,662 2,483 9,145 98 2.20 5.18 3.01 27,517 0.25 141,8402003 196 6,863 945 7,808 97 2.44 3.87 2.61 20,394 0.19 104,0512004 164 6,149 646 6,795 99 2.27 4.68 2.50 17,004 0.15 103,6832005 p 208 5,433 1,514 6,947 98 1.93 4.48 2.49 17,272 0.16 83,038
Spring bulbs, potted2000 614 6,393 8,790 15,183 96 1.58 3.33 2.59 39,393 0.37 64,1582001 686 7,517 10,360 17,877 97 1.50 3.36 2.58 46,075 0.43 67,1652002 707 7,590 12,347 19,937 96 1.65 3.44 2.76 55,012 0.51 77,8102003 669 7,206 12,181 19,387 96 1.66 3.52 2.83 54,927 0.50 82,1032004 667 5,563 11,928 17,491 96 1.61 3.61 2.97 51,992 0.47 77,9492005 p 645 11,476 9,441 20,917 98 1.42 3.51 2.36 49,417 0.44 76,616
Other potted flowering plants1992 1,419 67,932 49,395 117,327 95 2.00 4.10 2.89 338,608 3.58 238,6241993 1,406 50,375 55,815 106,190 95 1.48 3.40 2.49 264,250 2.77 187,9451994 1,301 37,205 39,250 76,455 95 1.77 3.78 2.80 214,237 2.23 164,6711995 1,317 45,951 37,580 83,531 95 1.61 3.97 2.67 222,798 2.29 169,1711996 1,321 52,440 39,266 91,706 97 1.30 3.41 2.20 201,865 2.05 152,8121997 1,260 47,538 37,930 85,468 96 1.32 3.58 2.32 198,451 1.99 157,5011998 1,421 53,219 40,238 93,457 95 1.71 3.74 2.58 241,357 2.39 169,8501999 1,164 53,252 44,032 97,284 97 1.60 3.61 2.51 244,030 2.36 209,6482000 1,045 33,132 36,219 69,351 95 1.69 3.91 2.85 197,647 1.87 189,1362001 954 34,770 32,178 66,948 97 1.89 4.16 2.98 199,331 1.86 208,9422002 942 36,983 34,913 71,896 96 1.89 4.55 3.18 228,776 2.12 242,8622003 886 37,521 30,550 68,071 96 1.89 4.14 2.90 197,597 1.81 223,0212004 804 32,315 32,315 64,630 96 1.87 4.24 3.05 197,407 1.79 245,5312005 p 755 30,444 32,074 62,518 96 1.92 4.39 3.19 199,166 1.79 263,796
- - - = Not available; p = preliminary.1/ Includes only commercial growers with $100,000+ in annual floriculture sales; 36 surveyed States.2/ Survey data on orchids started in 1996.Source: USDA, NASS, Floriculture Crops.
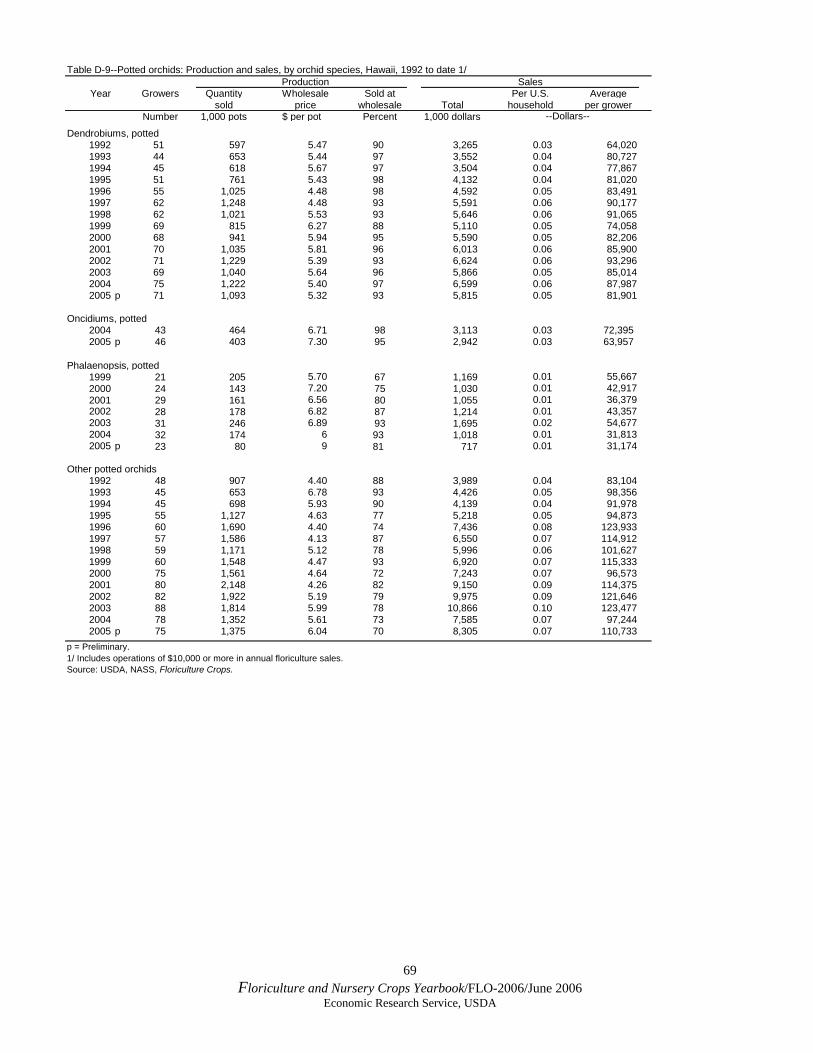
69 Floriculture and Nursery Crops Yearbook/FLO-2006/June 2006
Economic Research Service, USDA
Table D-9--Potted orchids: Production and sales, by orchid species, Hawaii, 1992 to date 1/Production Sales
Year Growers Quantity Wholesale Sold at Per U.S. Averagesold price wholesale Total household per grower
Number 1,000 pots $ per pot Percent 1,000 dollars --Dollars--
Dendrobiums, potted1992 51 597 5.47 90 3,265 0.03 64,0201993 44 653 5.44 97 3,552 0.04 80,7271994 45 618 5.67 97 3,504 0.04 77,8671995 51 761 5.43 98 4,132 0.04 81,0201996 55 1,025 4.48 98 4,592 0.05 83,4911997 62 1,248 4.48 93 5,591 0.06 90,1771998 62 1,021 5.53 93 5,646 0.06 91,0651999 69 815 6.27 88 5,110 0.05 74,0582000 68 941 5.94 95 5,590 0.05 82,2062001 70 1,035 5.81 96 6,013 0.06 85,9002002 71 1,229 5.39 93 6,624 0.06 93,2962003 69 1,040 5.64 96 5,866 0.05 85,0142004 75 1,222 5.40 97 6,599 0.06 87,9872005 p 71 1,093 5.32 93 5,815 0.05 81,901
Oncidiums, potted2004 43 464 6.71 98 3,113 0.03 72,395 2005 p 46 403 7.30 95 2,942 0.03 63,957
Phalaenopsis, potted1999 21 205 5.70 67 1,169 0.01 55,6672000 24 143 7.20 75 1,030 0.01 42,9172001 29 161 6.56 80 1,055 0.01 36,3792002 28 178 6.82 87 1,214 0.01 43,3572003 31 246 6.89 93 1,695 0.02 54,6772004 32 174 6 93 1,018 0.01 31,8132005 p 23 80 9 81 717 0.01 31,174
Other potted orchids1992 48 907 4.40 88 3,989 0.04 83,1041993 45 653 6.78 93 4,426 0.05 98,3561994 45 698 5.93 90 4,139 0.04 91,9781995 55 1,127 4.63 77 5,218 0.05 94,8731996 60 1,690 4.40 74 7,436 0.08 123,9331997 57 1,586 4.13 87 6,550 0.07 114,9121998 59 1,171 5.12 78 5,996 0.06 101,6271999 60 1,548 4.47 93 6,920 0.07 115,3332000 75 1,561 4.64 72 7,243 0.07 96,5732001 80 2,148 4.26 82 9,150 0.09 114,3752002 82 1,922 5.19 79 9,975 0.09 121,6462003 88 1,814 5.99 78 10,866 0.10 123,4772004 78 1,352 5.61 73 7,585 0.07 97,2442005 p 75 1,375 6.04 70 8,305 0.07 110,733
p = Preliminary.1/ Includes operations of $10,000 or more in annual floriculture sales.Source: USDA, NASS, Floriculture Crops.
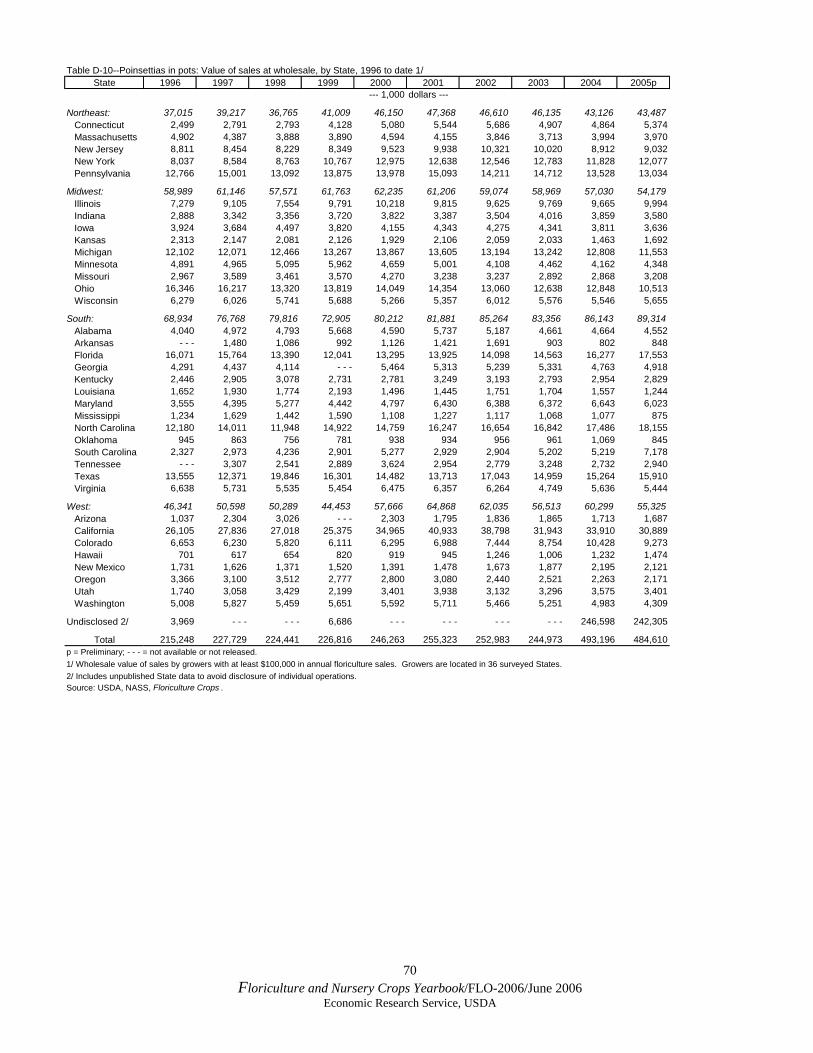
70 Floriculture and Nursery Crops Yearbook/FLO-2006/June 2006
Economic Research Service, USDA
Table D-10--Poinsettias in pots: Value of sales at wholesale, by State, 1996 to date 1/State 1996 1997 1998 1999 2000 2001 2002 2003 2004 2005p
--- 1,000 dollars ---
Northeast: 37,015 39,217 36,765 41,009 46,150 47,368 46,610 46,135 43,126 43,487 Connecticut 2,499 2,791 2,793 4,128 5,080 5,544 5,686 4,907 4,864 5,374 Massachusetts 4,902 4,387 3,888 3,890 4,594 4,155 3,846 3,713 3,994 3,970 New Jersey 8,811 8,454 8,229 8,349 9,523 9,938 10,321 10,020 8,912 9,032 New York 8,037 8,584 8,763 10,767 12,975 12,638 12,546 12,783 11,828 12,077 Pennsylvania 12,766 15,001 13,092 13,875 13,978 15,093 14,211 14,712 13,528 13,034
Midwest: 58,989 61,146 57,571 61,763 62,235 61,206 59,074 58,969 57,030 54,179 Illinois 7,279 9,105 7,554 9,791 10,218 9,815 9,625 9,769 9,665 9,994 Indiana 2,888 3,342 3,356 3,720 3,822 3,387 3,504 4,016 3,859 3,580 Iowa 3,924 3,684 4,497 3,820 4,155 4,343 4,275 4,341 3,811 3,636 Kansas 2,313 2,147 2,081 2,126 1,929 2,106 2,059 2,033 1,463 1,692 Michigan 12,102 12,071 12,466 13,267 13,867 13,605 13,194 13,242 12,808 11,553 Minnesota 4,891 4,965 5,095 5,962 4,659 5,001 4,108 4,462 4,162 4,348 Missouri 2,967 3,589 3,461 3,570 4,270 3,238 3,237 2,892 2,868 3,208 Ohio 16,346 16,217 13,320 13,819 14,049 14,354 13,060 12,638 12,848 10,513 Wisconsin 6,279 6,026 5,741 5,688 5,266 5,357 6,012 5,576 5,546 5,655
South: 68,934 76,768 79,816 72,905 80,212 81,881 85,264 83,356 86,143 89,314 Alabama 4,040 4,972 4,793 5,668 4,590 5,737 5,187 4,661 4,664 4,552 Arkansas - - - 1,480 1,086 992 1,126 1,421 1,691 903 802 848 Florida 16,071 15,764 13,390 12,041 13,295 13,925 14,098 14,563 16,277 17,553 Georgia 4,291 4,437 4,114 - - - 5,464 5,313 5,239 5,331 4,763 4,918 Kentucky 2,446 2,905 3,078 2,731 2,781 3,249 3,193 2,793 2,954 2,829 Louisiana 1,652 1,930 1,774 2,193 1,496 1,445 1,751 1,704 1,557 1,244 Maryland 3,555 4,395 5,277 4,442 4,797 6,430 6,388 6,372 6,643 6,023 Mississippi 1,234 1,629 1,442 1,590 1,108 1,227 1,117 1,068 1,077 875 North Carolina 12,180 14,011 11,948 14,922 14,759 16,247 16,654 16,842 17,486 18,155 Oklahoma 945 863 756 781 938 934 956 961 1,069 845 South Carolina 2,327 2,973 4,236 2,901 5,277 2,929 2,904 5,202 5,219 7,178 Tennessee - - - 3,307 2,541 2,889 3,624 2,954 2,779 3,248 2,732 2,940 Texas 13,555 12,371 19,846 16,301 14,482 13,713 17,043 14,959 15,264 15,910 Virginia 6,638 5,731 5,535 5,454 6,475 6,357 6,264 4,749 5,636 5,444
West: 46,341 50,598 50,289 44,453 57,666 64,868 62,035 56,513 60,299 55,325 Arizona 1,037 2,304 3,026 - - - 2,303 1,795 1,836 1,865 1,713 1,687 California 26,105 27,836 27,018 25,375 34,965 40,933 38,798 31,943 33,910 30,889 Colorado 6,653 6,230 5,820 6,111 6,295 6,988 7,444 8,754 10,428 9,273 Hawaii 701 617 654 820 919 945 1,246 1,006 1,232 1,474 New Mexico 1,731 1,626 1,371 1,520 1,391 1,478 1,673 1,877 2,195 2,121 Oregon 3,366 3,100 3,512 2,777 2,800 3,080 2,440 2,521 2,263 2,171 Utah 1,740 3,058 3,429 2,199 3,401 3,938 3,132 3,296 3,575 3,401 Washington 5,008 5,827 5,459 5,651 5,592 5,711 5,466 5,251 4,983 4,309
Undisclosed 2/ 3,969 - - - - - - 6,686 - - - - - - - - - - - - 246,598 242,305
Total 215,248 227,729 224,441 226,816 246,263 255,323 252,983 244,973 493,196 484,610p = Preliminary; - - - = not available or not released.1/ Wholesale value of sales by growers with at least $100,000 in annual floriculture sales. Growers are located in 36 surveyed States.2/ Includes unpublished State data to avoid disclosure of individual operations.Source: USDA, NASS, Floriculture Crops .
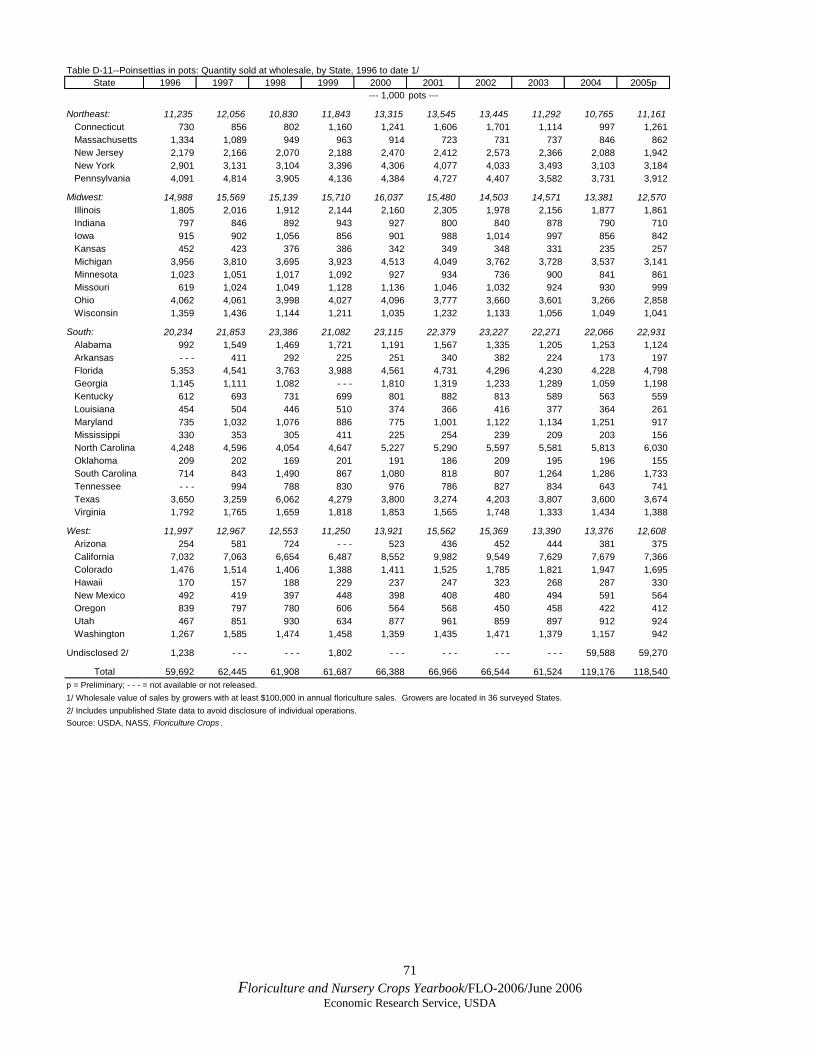
71 Floriculture and Nursery Crops Yearbook/FLO-2006/June 2006
Economic Research Service, USDA
Table D-11--Poinsettias in pots: Quantity sold at wholesale, by State, 1996 to date 1/State 1996 1997 1998 1999 2000 2001 2002 2003 2004 2005p
--- 1,000 pots ---
Northeast: 11,235 12,056 10,830 11,843 13,315 13,545 13,445 11,292 10,765 11,161 Connecticut 730 856 802 1,160 1,241 1,606 1,701 1,114 997 1,261 Massachusetts 1,334 1,089 949 963 914 723 731 737 846 862 New Jersey 2,179 2,166 2,070 2,188 2,470 2,412 2,573 2,366 2,088 1,942 New York 2,901 3,131 3,104 3,396 4,306 4,077 4,033 3,493 3,103 3,184 Pennsylvania 4,091 4,814 3,905 4,136 4,384 4,727 4,407 3,582 3,731 3,912
Midwest: 14,988 15,569 15,139 15,710 16,037 15,480 14,503 14,571 13,381 12,570 Illinois 1,805 2,016 1,912 2,144 2,160 2,305 1,978 2,156 1,877 1,861 Indiana 797 846 892 943 927 800 840 878 790 710 Iowa 915 902 1,056 856 901 988 1,014 997 856 842 Kansas 452 423 376 386 342 349 348 331 235 257 Michigan 3,956 3,810 3,695 3,923 4,513 4,049 3,762 3,728 3,537 3,141 Minnesota 1,023 1,051 1,017 1,092 927 934 736 900 841 861 Missouri 619 1,024 1,049 1,128 1,136 1,046 1,032 924 930 999 Ohio 4,062 4,061 3,998 4,027 4,096 3,777 3,660 3,601 3,266 2,858 Wisconsin 1,359 1,436 1,144 1,211 1,035 1,232 1,133 1,056 1,049 1,041
South: 20,234 21,853 23,386 21,082 23,115 22,379 23,227 22,271 22,066 22,931 Alabama 992 1,549 1,469 1,721 1,191 1,567 1,335 1,205 1,253 1,124 Arkansas - - - 411 292 225 251 340 382 224 173 197 Florida 5,353 4,541 3,763 3,988 4,561 4,731 4,296 4,230 4,228 4,798 Georgia 1,145 1,111 1,082 - - - 1,810 1,319 1,233 1,289 1,059 1,198 Kentucky 612 693 731 699 801 882 813 589 563 559 Louisiana 454 504 446 510 374 366 416 377 364 261 Maryland 735 1,032 1,076 886 775 1,001 1,122 1,134 1,251 917 Mississippi 330 353 305 411 225 254 239 209 203 156 North Carolina 4,248 4,596 4,054 4,647 5,227 5,290 5,597 5,581 5,813 6,030 Oklahoma 209 202 169 201 191 186 209 195 196 155 South Carolina 714 843 1,490 867 1,080 818 807 1,264 1,286 1,733 Tennessee - - - 994 788 830 976 786 827 834 643 741 Texas 3,650 3,259 6,062 4,279 3,800 3,274 4,203 3,807 3,600 3,674 Virginia 1,792 1,765 1,659 1,818 1,853 1,565 1,748 1,333 1,434 1,388
West: 11,997 12,967 12,553 11,250 13,921 15,562 15,369 13,390 13,376 12,608 Arizona 254 581 724 - - - 523 436 452 444 381 375 California 7,032 7,063 6,654 6,487 8,552 9,982 9,549 7,629 7,679 7,366 Colorado 1,476 1,514 1,406 1,388 1,411 1,525 1,785 1,821 1,947 1,695 Hawaii 170 157 188 229 237 247 323 268 287 330 New Mexico 492 419 397 448 398 408 480 494 591 564 Oregon 839 797 780 606 564 568 450 458 422 412 Utah 467 851 930 634 877 961 859 897 912 924 Washington 1,267 1,585 1,474 1,458 1,359 1,435 1,471 1,379 1,157 942
Undisclosed 2/ 1,238 - - - - - - 1,802 - - - - - - - - - - - - 59,588 59,270
Total 59,692 62,445 61,908 61,687 66,388 66,966 66,544 61,524 119,176 118,540p = Preliminary; - - - = not available or not released.1/ Wholesale value of sales by growers with at least $100,000 in annual floriculture sales. Growers are located in 36 surveyed States.2/ Includes unpublished State data to avoid disclosure of individual operations.Source: USDA, NASS, Floriculture Crops .
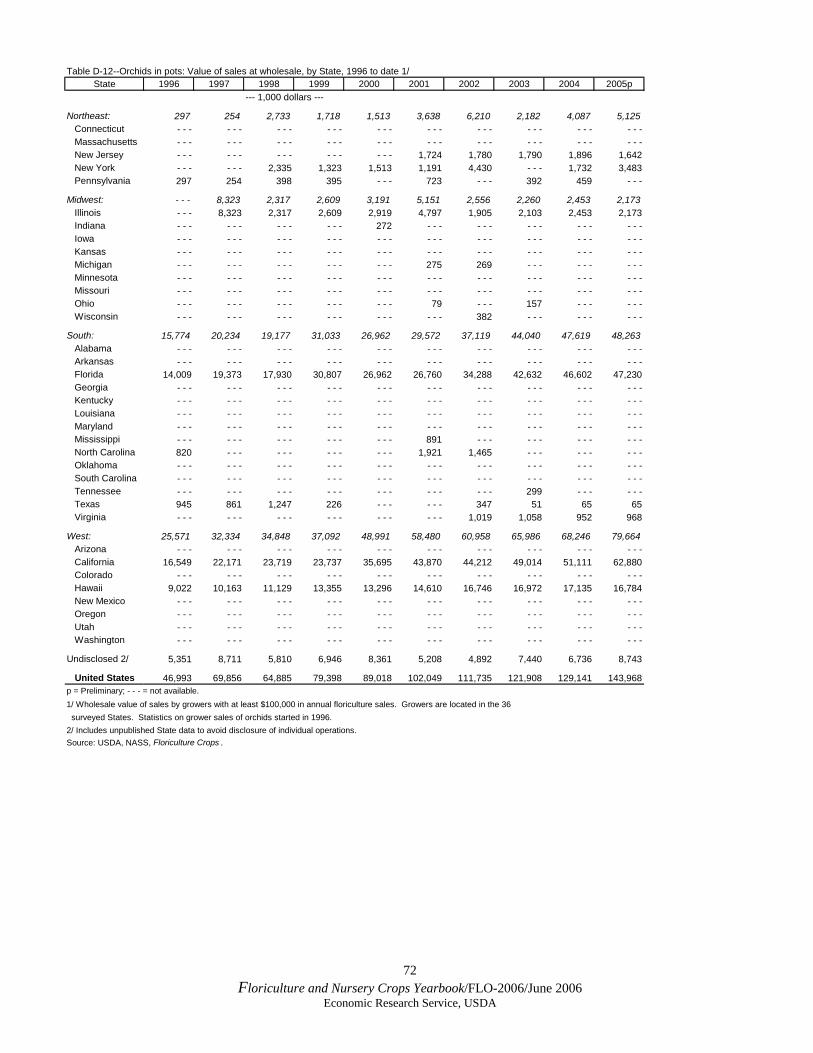
72 Floriculture and Nursery Crops Yearbook/FLO-2006/June 2006
Economic Research Service, USDA
Table D-12--Orchids in pots: Value of sales at wholesale, by State, 1996 to date 1/State 1996 1997 1998 1999 2000 2001 2002 2003 2004 2005p
--- 1,000 dollars ---
Northeast: 297 254 2,733 1,718 1,513 3,638 6,210 2,182 4,087 5,125 Connecticut - - - - - - - - - - - - - - - - - - - - - - - - - - - - - - Massachusetts - - - - - - - - - - - - - - - - - - - - - - - - - - - - - - New Jersey - - - - - - - - - - - - - - - 1,724 1,780 1,790 1,896 1,642 New York - - - - - - 2,335 1,323 1,513 1,191 4,430 - - - 1,732 3,483 Pennsylvania 297 254 398 395 - - - 723 - - - 392 459 - - -
Midwest: - - - 8,323 2,317 2,609 3,191 5,151 2,556 2,260 2,453 2,173 Illinois - - - 8,323 2,317 2,609 2,919 4,797 1,905 2,103 2,453 2,173 Indiana - - - - - - - - - - - - 272 - - - - - - - - - - - - - - - Iowa - - - - - - - - - - - - - - - - - - - - - - - - - - - - - - Kansas - - - - - - - - - - - - - - - - - - - - - - - - - - - - - - Michigan - - - - - - - - - - - - - - - 275 269 - - - - - - - - - Minnesota - - - - - - - - - - - - - - - - - - - - - - - - - - - - - - Missouri - - - - - - - - - - - - - - - - - - - - - - - - - - - - - - Ohio - - - - - - - - - - - - - - - 79 - - - 157 - - - - - - Wisconsin - - - - - - - - - - - - - - - - - - 382 - - - - - - - - -
South: 15,774 20,234 19,177 31,033 26,962 29,572 37,119 44,040 47,619 48,263 Alabama - - - - - - - - - - - - - - - - - - - - - - - - - - - - - - Arkansas - - - - - - - - - - - - - - - - - - - - - - - - - - - - - - Florida 14,009 19,373 17,930 30,807 26,962 26,760 34,288 42,632 46,602 47,230 Georgia - - - - - - - - - - - - - - - - - - - - - - - - - - - - - - Kentucky - - - - - - - - - - - - - - - - - - - - - - - - - - - - - - Louisiana - - - - - - - - - - - - - - - - - - - - - - - - - - - - - - Maryland - - - - - - - - - - - - - - - - - - - - - - - - - - - - - - Mississippi - - - - - - - - - - - - - - - 891 - - - - - - - - - - - - North Carolina 820 - - - - - - - - - - - - 1,921 1,465 - - - - - - - - - Oklahoma - - - - - - - - - - - - - - - - - - - - - - - - - - - - - - South Carolina - - - - - - - - - - - - - - - - - - - - - - - - - - - - - - Tennessee - - - - - - - - - - - - - - - - - - - - - 299 - - - - - - Texas 945 861 1,247 226 - - - - - - 347 51 65 65 Virginia - - - - - - - - - - - - - - - - - - 1,019 1,058 952 968
West: 25,571 32,334 34,848 37,092 48,991 58,480 60,958 65,986 68,246 79,664 Arizona - - - - - - - - - - - - - - - - - - - - - - - - - - - - - - California 16,549 22,171 23,719 23,737 35,695 43,870 44,212 49,014 51,111 62,880 Colorado - - - - - - - - - - - - - - - - - - - - - - - - - - - - - - Hawaii 9,022 10,163 11,129 13,355 13,296 14,610 16,746 16,972 17,135 16,784 New Mexico - - - - - - - - - - - - - - - - - - - - - - - - - - - - - - Oregon - - - - - - - - - - - - - - - - - - - - - - - - - - - - - - Utah - - - - - - - - - - - - - - - - - - - - - - - - - - - - - - Washington - - - - - - - - - - - - - - - - - - - - - - - - - - - - - -
Undisclosed 2/ 5,351 8,711 5,810 6,946 8,361 5,208 4,892 7,440 6,736 8,743
United States 46,993 69,856 64,885 79,398 89,018 102,049 111,735 121,908 129,141 143,968p = Preliminary; - - - = not available.1/ Wholesale value of sales by growers with at least $100,000 in annual floriculture sales. Growers are located in the 36 surveyed States. Statistics on grower sales of orchids started in 1996.2/ Includes unpublished State data to avoid disclosure of individual operations.Source: USDA, NASS, Floriculture Crops .

73 Floriculture and Nursery Crops Yearbook/FLO-2006/June 2006
Economic Research Service, USDA
Table D-13--Foliage plants for indoor or patio use: Production and sales at wholesale, 1992 to dateProduction Sales
Year Growers Quantity Wholesale Sold at Per U.S. Average1/ sold price wholesale Total household 2/ per grower
1,000 Dollars 1,000Number pots per pot Percent dollars -- Dollars --
Potted foliage1992 1,321 - - - - - - 87 350,915 3.71 265,6431993 1,201 - - - - - - 95 350,581 3.68 291,9081994 1,191 - - - - - - 97 400,232 4.17 336,0471995 1,172 - - - - - - 97 413,566 4.25 352,8721996 1,143 - - - - - - 97 432,976 4.39 378,8071997 1,230 - - - - - - 96 421,398 4.22 342,6001998 1,216 - - - - - - 89 436,243 4.32 358,7521999 1,091 - - - - - - 90 432,532 4.19 396,4552000 1,030 - - - - - - 99 472,079 4.48 458,3292001 982 - - - - - - 86 568,668 5.32 579,0922002 1,003 - - - - - - 98 538,837 4.99 537,2252003 1,044 - - - - - - 98 566,984 5.20 543,0882004 976 - - - - - - 98 608,637 5.53 623,603 2005 p 923 99 652,106 5.87 706,507
Foliage in hanging baskets1992 1,673 20,007 3.80 97 76,094 0.80 45,4841993 1,587 17,196 3.86 97 66,468 0.70 41,8831994 1,273 24,095 3.70 97 89,074 0.93 69,9721995 1,187 22,725 3.76 95 85,403 0.88 71,9491996 1,184 19,736 3.85 97 75,971 0.77 64,1651997 1,219 20,066 3.92 95 78,566 0.79 64,4511998 883 15,993 4.14 96 66,258 0.66 75,0371999 1,055 20,630 3.85 98 79,467 0.77 75,3242000 1,114 20,983 4.20 96 88,113 0.84 79,0962001 1,119 21,292 3.85 98 81,922 0.77 73,2102002 1,195 19,984 4.19 97 83,723 0.77 70,0612003 1,142 19,452 4.25 97 82,697 0.76 72,4142004 1,065 17,160 4.47 97 76,627 0.70 71,9502005 p 1,061 14,895 4.63 97 68,943 0.62 64,979
All foliage plants, potted1992 2,106 - - - - - - - - - 427,009 4.51 202,758 1993 2,039 - - - - - - - - - 417,049 4.37 204,536 1994 1,766 - - - - - - - - - 489,306 5.10 277,070 1995 1,644 - - - - - - - - - 498,969 5.13 303,509 1996 1,621 - - - - - - - - - 508,947 5.16 313,971 1997 1,746 - - - - - - - - - 499,964 5.01 286,348 1998 1,536 - - - - - - - - - 502,501 4.97 327,149 1999 1,531 - - - - - - - - - 511,999 4.96 334,421 2000 1,579 - - - - - - - - - 560,192 5.31 354,776 2001 1,562 - - - - - - - - - 650,590 6.08 416,511 2002 1,671 - - - - - - - - - 622,560 5.76 372,567 2003 1,586 - - - - - - - - - 649,681 5.96 409,635 2004 1,514 - - - - - - - - - 685,264 6.23 452,618 2005 p 1,472 - - - - - - - - - 721,049 6.49 489,843
- - - = Not available; p = preliminary. 1/ Includes only growers with $100,000+ in annual floricultural sales; 36 surveyed States. 2/ Sales per U.S. household were estimated to reflect growers' sales as national, not only local or regional. Foliage plants in pots and hanging baskets are intended for indoor or patio use, not landscape.Source: USDA, NASS, Floriculture Crops .

74 Floriculture and Nursery Crops Yearbook/FLO-2006/June 2006
Economic Research Service, USDA
Table D-14--Foliage plants for indoor or patio use: Value of sales at wholesale, by State, 1996 to date 1/State 1996 1997 1998 1999 2000 2001 2002 2003 2004 2005p
--- 1,000 dollars ---
Northeast: 20,269 17,561 16,975 16,738 14,605 16,218 18,652 16,821 12,795 11,039 Connecticut 2,346 1,071 584 743 786 1,356 1,727 644 610 568 Massachusetts 3,310 3,726 3,321 7,418 3,644 3,450 4,085 3,957 1,158 - - - New Jersey 5,925 6,722 7,510 3,258 3,822 5,552 4,399 4,139 3,813 3,644 New York 1,636 1,919 2,185 2,257 3,701 2,466 3,906 4,057 3,458 3,110 Pennsylvania 7,052 4,123 3,375 3,062 2,652 3,394 4,535 4,024 3,756 3,717
Midwest: 23,700 21,932 17,056 20,089 23,730 24,881 22,247 22,536 23,180 17,533 Illinois 1,593 1,384 1,486 3,637 1,993 3,114 2,220 2,988 4,759 3,829 Indiana 1,350 1,884 2,055 2,148 2,514 2,048 1,306 1,182 1,259 1,342 Iowa 1,363 1,359 1,832 1,459 2,146 2,328 2,301 1,479 1,053 1,191 Kansas 1,201 1,598 1,379 1,427 2,942 290 296 328 551 497 Michigan 3,712 3,313 3,056 2,996 3,601 3,531 3,699 3,375 4,152 3,299 Minnesota 1,212 1,338 1,252 1,298 1,737 1,825 1,229 1,265 924 832 Missouri 2,765 2,103 1,955 2,192 3,783 3,819 3,384 3,421 - - - - - - Ohio 9,599 8,342 3,728 4,543 4,537 6,292 6,288 7,045 9,443 5,199 Wisconsin 905 611 313 389 477 1,634 1,524 1,453 1,039 1,344
South: 370,998 352,876 356,151 352,619 390,338 479,960 453,974 478,698 510,281 541,644 Alabama 1,448 1,658 1,972 3,124 2,475 2,044 1,987 4,190 3,632 4,802 Arkansas 225 286 765 198 176 287 1,082 401 287 - - - Florida 329,580 305,603 311,104 312,057 346,946 439,698 405,103 423,882 469,728 499,656 Georgia 2,191 1,770 1,281 2,163 1,721 1,812 3,420 1,597 2,816 3,720 Kentucky 576 1,712 1,383 1,294 1,205 1,691 1,329 1,657 820 822 Louisiana 2,270 2,969 2,060 2,376 3,293 4,336 5,519 4,145 4,096 3,678 Maryland 196 1,073 710 - - - 467 371 799 1,368 - - - - - - Mississippi 327 488 357 686 439 576 1,041 601 - - - - - - North Carolina 6,892 6,272 7,816 7,240 8,373 8,673 5,782 7,384 5,191 6,916 Oklahoma 965 382 190 612 949 905 3,116 1,163 - - - - - - South Carolina 748 1,348 848 903 2,170 1,122 1,319 1,056 - - - - - - Tennessee 1,210 1,425 1,068 983 963 882 825 531 1,638 1,161 Texas 22,614 24,314 24,896 19,458 20,132 16,637 21,053 29,074 20,604 19,957 Virginia 1,756 3,576 1,701 1,525 1,029 926 1,599 1,649 1,469 932
West: 93,980 107,595 112,319 121,766 131,519 129,531 124,661 126,007 124,287 132,283 Arizona 1,005 2,429 2,363 2,436 2,385 2,021 - - - 3,313 - - - - - - California 72,514 86,811 87,819 93,764 104,856 96,613 97,536 102,532 103,698 109,351 Colorado 1,378 979 1,645 2,039 779 546 520 481 1,650 2,062 Hawaii 13,067 11,160 13,217 13,141 16,153 18,381 14,923 14,607 15,443 17,081 New Mexico 1,404 2,058 3,783 2,728 2,269 4,732 3,394 - - - - - - - - - Oregon 714 687 558 - - - 370 1,297 2,031 - - - 1,700 1,912 Utah 2,386 1,512 845 5,544 2,282 4,165 4,776 3,128 - - - - - - Washington 1,512 1,959 2,089 2,114 2,425 1,776 1,481 1,946 1,796 1,877
Undisclosed 2/ 0 0 0 787 0 0 3,026 5,619 14,721 18,550
Total 508,947 499,964 502,501 511,999 560,192 650,590 622,560 649,681 685,264 721,049- - - = Not available or not released; p = preliminary.1/ Includes potted foliage plants and foliage plants in hanging baskets for indoor and patio use. Data are wholesale value of sales of growers with at least $100,000 in annual floriculture sales. Growers are located in the 36 surveyed States.2/ Total may not equal sum of sales in the four regions because of undisclosed sales aggregated in "Undisclosed."Source: USDA, NASS, Floriculture Crops .
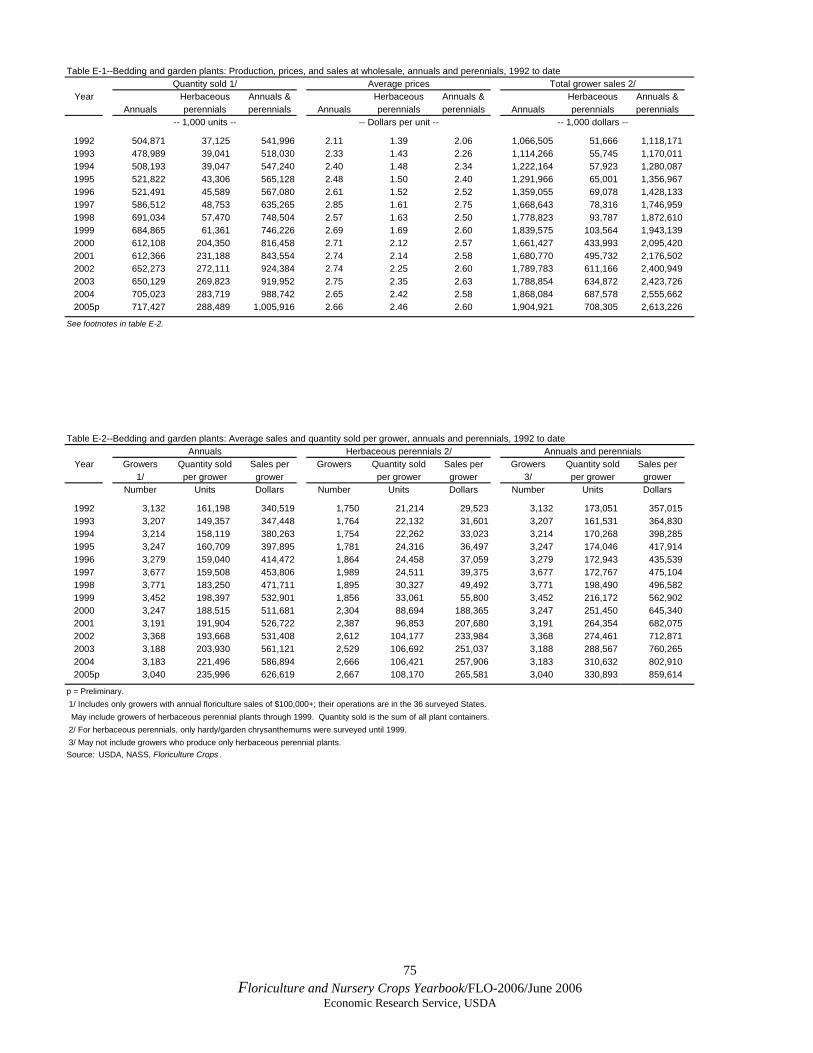
75 Floriculture and Nursery Crops Yearbook/FLO-2006/June 2006
Economic Research Service, USDA
Table E-1--Bedding and garden plants: Production, prices, and sales at wholesale, annuals and perennials, 1992 to dateQuantity sold 1/ Average prices Total grower sales 2/
Year Herbaceous Annuals & Herbaceous Annuals & Herbaceous Annuals &Annuals perennials perennials Annuals perennials perennials Annuals perennials perennials
-- 1,000 units -- -- Dollars per unit -- -- 1,000 dollars --
1992 504,871 37,125 541,996 2.11 1.39 2.06 1,066,505 51,666 1,118,1711993 478,989 39,041 518,030 2.33 1.43 2.26 1,114,266 55,745 1,170,0111994 508,193 39,047 547,240 2.40 1.48 2.34 1,222,164 57,923 1,280,0871995 521,822 43,306 565,128 2.48 1.50 2.40 1,291,966 65,001 1,356,9671996 521,491 45,589 567,080 2.61 1.52 2.52 1,359,055 69,078 1,428,1331997 586,512 48,753 635,265 2.85 1.61 2.75 1,668,643 78,316 1,746,9591998 691,034 57,470 748,504 2.57 1.63 2.50 1,778,823 93,787 1,872,6101999 684,865 61,361 746,226 2.69 1.69 2.60 1,839,575 103,564 1,943,1392000 612,108 204,350 816,458 2.71 2.12 2.57 1,661,427 433,993 2,095,4202001 612,366 231,188 843,554 2.74 2.14 2.58 1,680,770 495,732 2,176,5022002 652,273 272,111 924,384 2.74 2.25 2.60 1,789,783 611,166 2,400,9492003 650,129 269,823 919,952 2.75 2.35 2.63 1,788,854 634,872 2,423,7262004 705,023 283,719 988,742 2.65 2.42 2.58 1,868,084 687,578 2,555,662
2005p 717,427 288,489 1,005,916 2.66 2.46 2.60 1,904,921 708,305 2,613,226
See footnotes in table E-2.
Table E-2--Bedding and garden plants: Average sales and quantity sold per grower, annuals and perennials, 1992 to dateAnnuals Herbaceous perennials 2/ Annuals and perennials
Year Growers Quantity sold Sales per Growers Quantity sold Sales per Growers Quantity sold Sales per1/ per grower grower per grower grower 3/ per grower grower
Number Units Dollars Number Units Dollars Number Units Dollars
1992 3,132 161,198 340,519 1,750 21,214 29,523 3,132 173,051 357,0151993 3,207 149,357 347,448 1,764 22,132 31,601 3,207 161,531 364,8301994 3,214 158,119 380,263 1,754 22,262 33,023 3,214 170,268 398,2851995 3,247 160,709 397,895 1,781 24,316 36,497 3,247 174,046 417,9141996 3,279 159,040 414,472 1,864 24,458 37,059 3,279 172,943 435,5391997 3,677 159,508 453,806 1,989 24,511 39,375 3,677 172,767 475,1041998 3,771 183,250 471,711 1,895 30,327 49,492 3,771 198,490 496,5821999 3,452 198,397 532,901 1,856 33,061 55,800 3,452 216,172 562,9022000 3,247 188,515 511,681 2,304 88,694 188,365 3,247 251,450 645,3402001 3,191 191,904 526,722 2,387 96,853 207,680 3,191 264,354 682,0752002 3,368 193,668 531,408 2,612 104,177 233,984 3,368 274,461 712,8712003 3,188 203,930 561,121 2,529 106,692 251,037 3,188 288,567 760,2652004 3,183 221,496 586,894 2,666 106,421 257,906 3,183 310,632 802,910
2005p 3,040 235,996 626,619 2,667 108,170 265,581 3,040 330,893 859,614
p = Preliminary. 1/ Includes only growers with annual floriculture sales of $100,000+; their operations are in the 36 surveyed States. May include growers of herbaceous perennial plants through 1999. Quantity sold is the sum of all plant containers. 2/ For herbaceous perennials, only hardy/garden chrysanthemums were surveyed until 1999. 3/ May not include growers who produce only herbaceous perennial plants.Source: USDA, NASS, Floriculture Crops .
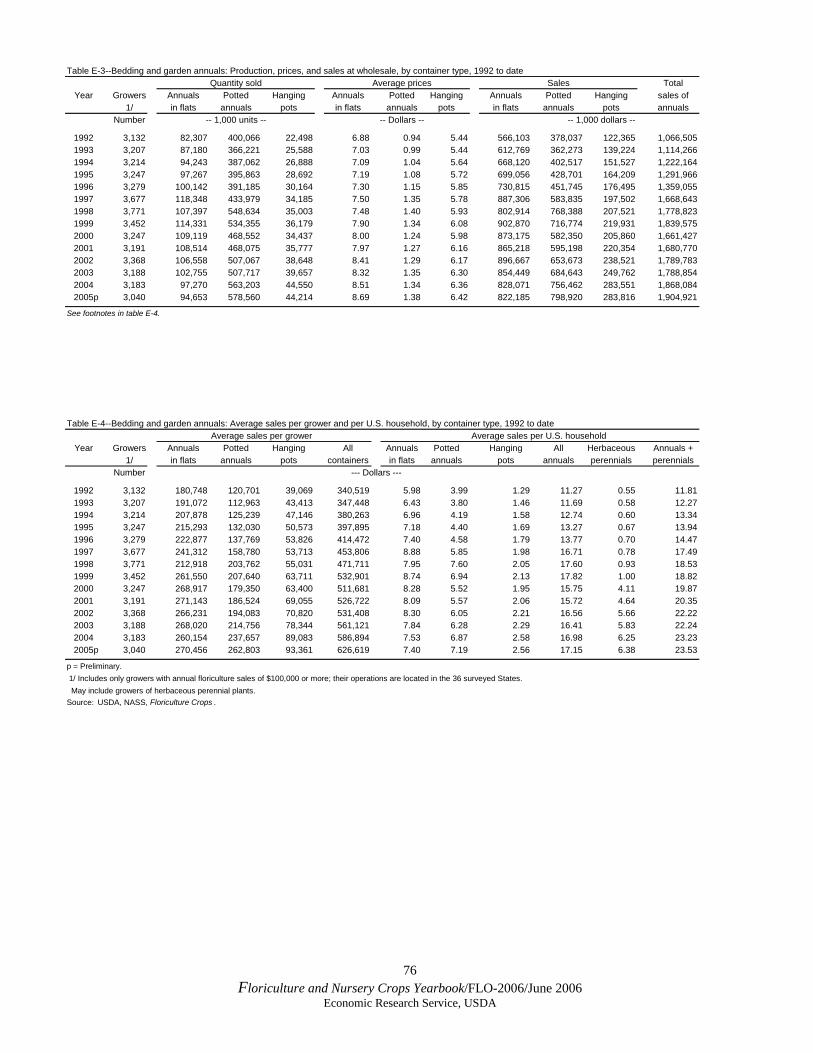
76 Floriculture and Nursery Crops Yearbook/FLO-2006/June 2006
Economic Research Service, USDA
Table E-3--Bedding and garden annuals: Production, prices, and sales at wholesale, by container type, 1992 to dateQuantity sold Average prices Sales Total
Year Growers Annuals Potted Hanging Annuals Potted Hanging Annuals Potted Hanging sales of1/ in flats annuals pots in flats annuals pots in flats annuals pots annuals
Number -- 1,000 units -- -- Dollars -- -- 1,000 dollars --
1992 3,132 82,307 400,066 22,498 6.88 0.94 5.44 566,103 378,037 122,365 1,066,5051993 3,207 87,180 366,221 25,588 7.03 0.99 5.44 612,769 362,273 139,224 1,114,2661994 3,214 94,243 387,062 26,888 7.09 1.04 5.64 668,120 402,517 151,527 1,222,1641995 3,247 97,267 395,863 28,692 7.19 1.08 5.72 699,056 428,701 164,209 1,291,9661996 3,279 100,142 391,185 30,164 7.30 1.15 5.85 730,815 451,745 176,495 1,359,0551997 3,677 118,348 433,979 34,185 7.50 1.35 5.78 887,306 583,835 197,502 1,668,6431998 3,771 107,397 548,634 35,003 7.48 1.40 5.93 802,914 768,388 207,521 1,778,8231999 3,452 114,331 534,355 36,179 7.90 1.34 6.08 902,870 716,774 219,931 1,839,5752000 3,247 109,119 468,552 34,437 8.00 1.24 5.98 873,175 582,350 205,860 1,661,4272001 3,191 108,514 468,075 35,777 7.97 1.27 6.16 865,218 595,198 220,354 1,680,7702002 3,368 106,558 507,067 38,648 8.41 1.29 6.17 896,667 653,673 238,521 1,789,7832003 3,188 102,755 507,717 39,657 8.32 1.35 6.30 854,449 684,643 249,762 1,788,8542004 3,183 97,270 563,203 44,550 8.51 1.34 6.36 828,071 756,462 283,551 1,868,084
2005p 3,040 94,653 578,560 44,214 8.69 1.38 6.42 822,185 798,920 283,816 1,904,921
See footnotes in table E-4.
Table E-4--Bedding and garden annuals: Average sales per grower and per U.S. household, by container type, 1992 to dateAverage sales per grower Average sales per U.S. household
Year Growers Annuals Potted Hanging All Annuals Potted Hanging All Herbaceous Annuals +1/ in flats annuals pots containers in flats annuals pots annuals perennials perennials
Number --- Dollars ---
1992 3,132 180,748 120,701 39,069 340,519 5.98 3.99 1.29 11.27 0.55 11.811993 3,207 191,072 112,963 43,413 347,448 6.43 3.80 1.46 11.69 0.58 12.271994 3,214 207,878 125,239 47,146 380,263 6.96 4.19 1.58 12.74 0.60 13.341995 3,247 215,293 132,030 50,573 397,895 7.18 4.40 1.69 13.27 0.67 13.941996 3,279 222,877 137,769 53,826 414,472 7.40 4.58 1.79 13.77 0.70 14.471997 3,677 241,312 158,780 53,713 453,806 8.88 5.85 1.98 16.71 0.78 17.491998 3,771 212,918 203,762 55,031 471,711 7.95 7.60 2.05 17.60 0.93 18.531999 3,452 261,550 207,640 63,711 532,901 8.74 6.94 2.13 17.82 1.00 18.822000 3,247 268,917 179,350 63,400 511,681 8.28 5.52 1.95 15.75 4.11 19.872001 3,191 271,143 186,524 69,055 526,722 8.09 5.57 2.06 15.72 4.64 20.352002 3,368 266,231 194,083 70,820 531,408 8.30 6.05 2.21 16.56 5.66 22.222003 3,188 268,020 214,756 78,344 561,121 7.84 6.28 2.29 16.41 5.83 22.242004 3,183 260,154 237,657 89,083 586,894 7.53 6.87 2.58 16.98 6.25 23.23
2005p 3,040 270,456 262,803 93,361 626,619 7.40 7.19 2.56 17.15 6.38 23.53
p = Preliminary. 1/ Includes only growers with annual floriculture sales of $100,000 or more; their operations are located in the 36 surveyed States. May include growers of herbaceous perennial plants.Source: USDA, NASS, Floriculture Crops .

77 Floriculture and Nursery Crops Yearbook/FLO-2006/June 2006
Economic Research Service, USDA
Table E-5--Bedding and garden annuals: Grower sales at wholesale, by plant species and container, 1992 to dateGeraniums Geraniums N. Guinea Pansy / Other Vegetable
Year fr. cuttings from seed Impatiens impatiens Petunias Begonias Marigolds viola foliars type-- 1,000 dollars --
Annuals in flats:1992 30,291 - - - - - - - - - - - - - - - - - - - - - 457,588 78,2241993 31,915 - - - - - - - - - - - - - - - - - - - - - 514,095 66,7591994 37,402 - - - 83,916 7,873 60,252 - - - - - - - - - 414,304 64,3731995 35,859 - - - 107,014 9,601 77,487 - - - - - - - - - 394,419 74,6761996 42,598 - - - 109,475 7,873 76,359 - - - - - - - - - 414,932 79,5781997 37,281 - - - 126,394 8,487 87,014 - - - - - - - - - 529,375 98,7551998 28,189 - - - 112,105 6,277 85,189 - - - - - - - - - 478,431 92,7231999 31,325 - - - 114,939 12,403 86,848 - - - - - - - - - 560,067 97,2882000 14,906 8,035 118,381 6,381 95,488 52,004 42,169 83,521 383,686 68,6042001 10,849 7,868 116,331 6,547 92,669 64,193 53,600 103,151 339,064 70,9462002 12,242 8,623 120,133 7,872 98,595 60,817 53,616 121,452 342,326 70,9912003 9,239 7,725 104,689 6,160 95,161 56,633 52,298 118,358 338,557 65,6292004 10,503 7,983 99,802 4,960 93,551 50,818 50,843 111,032 327,616 70,963
2005p 7,586 6,446 100,254 5,061 93,814 54,656 52,472 111,374 313,552 76,970
Potted annuals:1992 80,678 41,126 - - - - - - - - - - - - - - - - - - 241,175 15,0581993 83,038 40,758 - - - - - - - - - - - - - - - - - - 224,947 13,5301994 86,061 43,551 14,874 13,428 8,679 - - - - - - - - - 221,258 14,6661995 103,569 42,035 17,585 18,003 9,030 - - - - - - - - - 221,883 16,5961996 92,457 38,841 16,828 21,364 9,797 - - - - - - - - - 250,656 21,8021997 97,123 42,675 18,102 26,222 9,321 - - - - - - - - - 363,277 27,1151998 110,425 37,889 20,078 29,789 12,042 - - - - - - - - - 520,239 37,9261999 110,291 37,837 22,837 33,802 14,072 - - - - - - - - - 466,422 31,5132000 110,223 41,749 24,473 39,223 17,580 15,427 5,346 20,890 277,671 29,7682001 112,417 37,879 26,736 38,601 24,389 22,260 6,351 22,648 272,608 31,3092002 111,819 36,273 24,382 42,073 28,035 23,142 7,895 31,053 301,859 47,1422003 119,921 31,697 26,989 43,790 31,190 22,946 7,189 33,026 316,867 51,0282004 127,671 34,785 30,922 43,940 38,871 26,166 10,417 40,164 343,192 60,334
2005p 129,909 31,921 31,594 45,789 42,109 30,555 10,689 47,118 364,555 64,681
Annuals in hanging baskets:1992 - - - - - - - - - - - - - - - - - - - - - - - - - - - - - -1993 - - - - - - - - - - - - - - - - - - - - - - - - - - - - - -1994 20,833 - - - 15,922 19,777 4,614 - - - - - - - - - 90,381 - - -1995 25,407 - - - 19,163 23,014 7,205 - - - - - - - - - 89,420 - - -1996 30,142 - - - 20,891 26,604 8,984 - - - - - - - - - 89,874 - - -1997 32,333 - - - 21,912 29,198 10,876 - - - - - - - - - 103,183 - - -1998 31,058 - - - 20,536 28,668 11,822 - - - - - - - - - 115,437 - - -1999 32,502 - - - 21,559 31,196 15,774 - - - - - - - - - 118,900 - - -2000 29,024 3,991 20,859 29,615 15,595 15,733 455 1,932 88,656 - - -2001 28,200 3,869 18,492 29,572 18,269 19,062 345 2,784 99,761 - - -2002 30,997 3,666 20,972 32,584 20,950 14,919 290 3,651 110,492 - - -2003 33,848 4,201 19,267 29,247 23,325 17,229 137 4,383 118,125 - - -2004 37,943 4,290 20,257 32,725 28,547 16,122 317 6,049 137,301 - - -
2005p 33,322 4,571 20,430 30,013 30,222 16,674 246 7,446 140,892 - - -
All annuals:1992 110,969 41,126 - - - - - - - - - - - - - - - - - - 698,763 93,2821993 114,953 40,758 - - - - - - - - - - - - - - - - - - 739,042 80,2891994 144,296 43,551 114,712 41,078 73,545 - - - - - - - - - 725,943 79,0391995 164,835 42,035 143,762 50,618 93,722 - - - - - - - - - 705,722 91,2721996 165,197 38,841 147,194 55,841 95,140 - - - - - - - - - 755,462 101,3801997 166,737 42,675 166,408 63,907 107,211 - - - - - - - - - 995,835 125,8701998 169,672 37,889 152,719 64,734 109,053 - - - - - - - - - 1,114,107 130,6491999 174,118 37,837 159,335 77,401 116,694 - - - - - - - - - 1,145,389 128,8012000 154,153 53,775 163,713 75,219 128,663 83,164 47,970 106,343 750,013 98,3722001 151,466 49,616 161,559 74,720 135,327 105,515 60,296 128,583 711,433 102,2552002 155,058 48,562 165,487 82,529 147,580 98,878 61,801 156,156 754,677 118,1332003 163,008 43,623 150,945 79,197 149,676 96,808 59,624 155,767 773,549 116,6572004 176,117 47,058 150,981 81,625 160,969 93,106 61,577 157,245 808,109 131,297
2005p 170,817 42,938 152,278 80,863 166,145 101,885 63,407 165,938 818,999 141,651
- - - = Not available; p = preliminary. 1/ Includes only commercial growers with $100,000 or more in annual floriculture sales; 36 surveyed States. Source: USDA, NASS, Floriculture Crops .
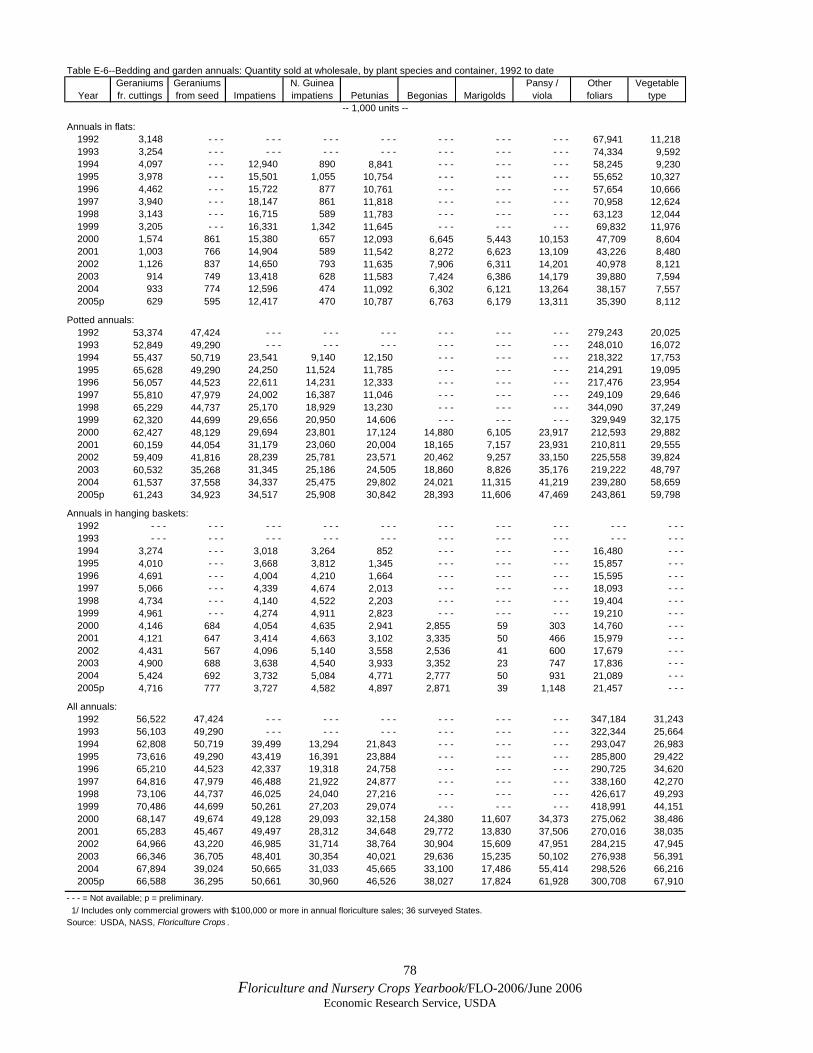
78 Floriculture and Nursery Crops Yearbook/FLO-2006/June 2006
Economic Research Service, USDA
Table E-6--Bedding and garden annuals: Quantity sold at wholesale, by plant species and container, 1992 to dateGeraniums Geraniums N. Guinea Pansy / Other Vegetable
Year fr. cuttings from seed Impatiens impatiens Petunias Begonias Marigolds viola foliars type-- 1,000 units --
Annuals in flats:1992 3,148 - - - - - - - - - - - - - - - - - - - - - 67,941 11,2181993 3,254 - - - - - - - - - - - - - - - - - - - - - 74,334 9,5921994 4,097 - - - 12,940 890 8,841 - - - - - - - - - 58,245 9,2301995 3,978 - - - 15,501 1,055 10,754 - - - - - - - - - 55,652 10,3271996 4,462 - - - 15,722 877 10,761 - - - - - - - - - 57,654 10,6661997 3,940 - - - 18,147 861 11,818 - - - - - - - - - 70,958 12,6241998 3,143 - - - 16,715 589 11,783 - - - - - - - - - 63,123 12,0441999 3,205 - - - 16,331 1,342 11,645 - - - - - - - - - 69,832 11,9762000 1,574 861 15,380 657 12,093 6,645 5,443 10,153 47,709 8,6042001 1,003 766 14,904 589 11,542 8,272 6,623 13,109 43,226 8,4802002 1,126 837 14,650 793 11,635 7,906 6,311 14,201 40,978 8,1212003 914 749 13,418 628 11,583 7,424 6,386 14,179 39,880 7,5942004 933 774 12,596 474 11,092 6,302 6,121 13,264 38,157 7,557
2005p 629 595 12,417 470 10,787 6,763 6,179 13,311 35,390 8,112
Potted annuals:1992 53,374 47,424 - - - - - - - - - - - - - - - - - - 279,243 20,0251993 52,849 49,290 - - - - - - - - - - - - - - - - - - 248,010 16,0721994 55,437 50,719 23,541 9,140 12,150 - - - - - - - - - 218,322 17,7531995 65,628 49,290 24,250 11,524 11,785 - - - - - - - - - 214,291 19,0951996 56,057 44,523 22,611 14,231 12,333 - - - - - - - - - 217,476 23,9541997 55,810 47,979 24,002 16,387 11,046 - - - - - - - - - 249,109 29,6461998 65,229 44,737 25,170 18,929 13,230 - - - - - - - - - 344,090 37,2491999 62,320 44,699 29,656 20,950 14,606 - - - - - - - - - 329,949 32,1752000 62,427 48,129 29,694 23,801 17,124 14,880 6,105 23,917 212,593 29,8822001 60,159 44,054 31,179 23,060 20,004 18,165 7,157 23,931 210,811 29,5552002 59,409 41,816 28,239 25,781 23,571 20,462 9,257 33,150 225,558 39,8242003 60,532 35,268 31,345 25,186 24,505 18,860 8,826 35,176 219,222 48,7972004 61,537 37,558 34,337 25,475 29,802 24,021 11,315 41,219 239,280 58,659
2005p 61,243 34,923 34,517 25,908 30,842 28,393 11,606 47,469 243,861 59,798
Annuals in hanging baskets:1992 - - - - - - - - - - - - - - - - - - - - - - - - - - - - - -1993 - - - - - - - - - - - - - - - - - - - - - - - - - - - - - -1994 3,274 - - - 3,018 3,264 852 - - - - - - - - - 16,480 - - -1995 4,010 - - - 3,668 3,812 1,345 - - - - - - - - - 15,857 - - -1996 4,691 - - - 4,004 4,210 1,664 - - - - - - - - - 15,595 - - -1997 5,066 - - - 4,339 4,674 2,013 - - - - - - - - - 18,093 - - -1998 4,734 - - - 4,140 4,522 2,203 - - - - - - - - - 19,404 - - -1999 4,961 - - - 4,274 4,911 2,823 - - - - - - - - - 19,210 - - -2000 4,146 684 4,054 4,635 2,941 2,855 59 303 14,760 - - -2001 4,121 647 3,414 4,663 3,102 3,335 50 466 15,979 - - -2002 4,431 567 4,096 5,140 3,558 2,536 41 600 17,679 - - -2003 4,900 688 3,638 4,540 3,933 3,352 23 747 17,836 - - -2004 5,424 692 3,732 5,084 4,771 2,777 50 931 21,089 - - -
2005p 4,716 777 3,727 4,582 4,897 2,871 39 1,148 21,457 - - -
All annuals:1992 56,522 47,424 - - - - - - - - - - - - - - - - - - 347,184 31,2431993 56,103 49,290 - - - - - - - - - - - - - - - - - - 322,344 25,6641994 62,808 50,719 39,499 13,294 21,843 - - - - - - - - - 293,047 26,9831995 73,616 49,290 43,419 16,391 23,884 - - - - - - - - - 285,800 29,4221996 65,210 44,523 42,337 19,318 24,758 - - - - - - - - - 290,725 34,6201997 64,816 47,979 46,488 21,922 24,877 - - - - - - - - - 338,160 42,2701998 73,106 44,737 46,025 24,040 27,216 - - - - - - - - - 426,617 49,2931999 70,486 44,699 50,261 27,203 29,074 - - - - - - - - - 418,991 44,1512000 68,147 49,674 49,128 29,093 32,158 24,380 11,607 34,373 275,062 38,4862001 65,283 45,467 49,497 28,312 34,648 29,772 13,830 37,506 270,016 38,0352002 64,966 43,220 46,985 31,714 38,764 30,904 15,609 47,951 284,215 47,9452003 66,346 36,705 48,401 30,354 40,021 29,636 15,235 50,102 276,938 56,3912004 67,894 39,024 50,665 31,033 45,665 33,100 17,486 55,414 298,526 66,216
2005p 66,588 36,295 50,661 30,960 46,526 38,027 17,824 61,928 300,708 67,910
- - - = Not available; p = preliminary. 1/ Includes only commercial growers with $100,000 or more in annual floriculture sales; 36 surveyed States. Source: USDA, NASS, Floriculture Crops .
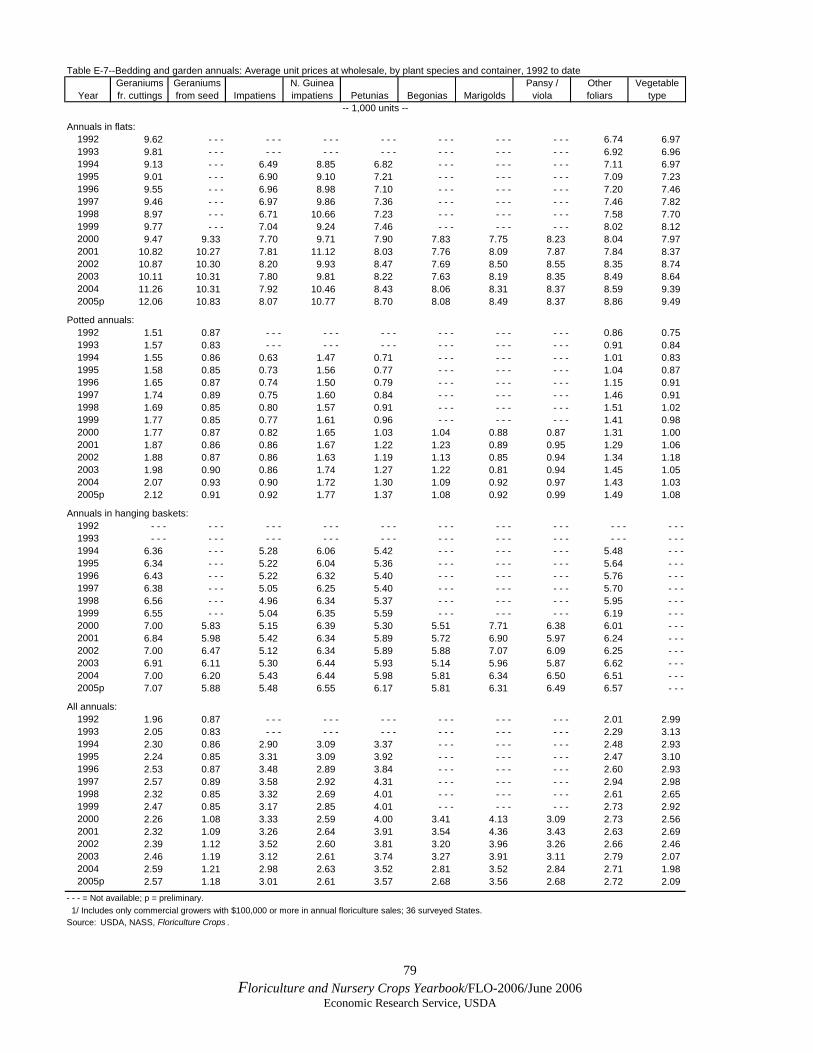
79 Floriculture and Nursery Crops Yearbook/FLO-2006/June 2006
Economic Research Service, USDA
Table E-7--Bedding and garden annuals: Average unit prices at wholesale, by plant species and container, 1992 to dateGeraniums Geraniums N. Guinea Pansy / Other Vegetable
Year fr. cuttings from seed Impatiens impatiens Petunias Begonias Marigolds viola foliars type-- 1,000 units --
Annuals in flats:1992 9.62 - - - - - - - - - - - - - - - - - - - - - 6.74 6.971993 9.81 - - - - - - - - - - - - - - - - - - - - - 6.92 6.961994 9.13 - - - 6.49 8.85 6.82 - - - - - - - - - 7.11 6.971995 9.01 - - - 6.90 9.10 7.21 - - - - - - - - - 7.09 7.231996 9.55 - - - 6.96 8.98 7.10 - - - - - - - - - 7.20 7.461997 9.46 - - - 6.97 9.86 7.36 - - - - - - - - - 7.46 7.821998 8.97 - - - 6.71 10.66 7.23 - - - - - - - - - 7.58 7.701999 9.77 - - - 7.04 9.24 7.46 - - - - - - - - - 8.02 8.122000 9.47 9.33 7.70 9.71 7.90 7.83 7.75 8.23 8.04 7.972001 10.82 10.27 7.81 11.12 8.03 7.76 8.09 7.87 7.84 8.372002 10.87 10.30 8.20 9.93 8.47 7.69 8.50 8.55 8.35 8.742003 10.11 10.31 7.80 9.81 8.22 7.63 8.19 8.35 8.49 8.642004 11.26 10.31 7.92 10.46 8.43 8.06 8.31 8.37 8.59 9.39
2005p 12.06 10.83 8.07 10.77 8.70 8.08 8.49 8.37 8.86 9.49
Potted annuals:1992 1.51 0.87 - - - - - - - - - - - - - - - - - - 0.86 0.751993 1.57 0.83 - - - - - - - - - - - - - - - - - - 0.91 0.841994 1.55 0.86 0.63 1.47 0.71 - - - - - - - - - 1.01 0.831995 1.58 0.85 0.73 1.56 0.77 - - - - - - - - - 1.04 0.871996 1.65 0.87 0.74 1.50 0.79 - - - - - - - - - 1.15 0.911997 1.74 0.89 0.75 1.60 0.84 - - - - - - - - - 1.46 0.911998 1.69 0.85 0.80 1.57 0.91 - - - - - - - - - 1.51 1.021999 1.77 0.85 0.77 1.61 0.96 - - - - - - - - - 1.41 0.982000 1.77 0.87 0.82 1.65 1.03 1.04 0.88 0.87 1.31 1.002001 1.87 0.86 0.86 1.67 1.22 1.23 0.89 0.95 1.29 1.062002 1.88 0.87 0.86 1.63 1.19 1.13 0.85 0.94 1.34 1.182003 1.98 0.90 0.86 1.74 1.27 1.22 0.81 0.94 1.45 1.052004 2.07 0.93 0.90 1.72 1.30 1.09 0.92 0.97 1.43 1.03
2005p 2.12 0.91 0.92 1.77 1.37 1.08 0.92 0.99 1.49 1.08
Annuals in hanging baskets:1992 - - - - - - - - - - - - - - - - - - - - - - - - - - - - - -1993 - - - - - - - - - - - - - - - - - - - - - - - - - - - - - -1994 6.36 - - - 5.28 6.06 5.42 - - - - - - - - - 5.48 - - -1995 6.34 - - - 5.22 6.04 5.36 - - - - - - - - - 5.64 - - -1996 6.43 - - - 5.22 6.32 5.40 - - - - - - - - - 5.76 - - -1997 6.38 - - - 5.05 6.25 5.40 - - - - - - - - - 5.70 - - -1998 6.56 - - - 4.96 6.34 5.37 - - - - - - - - - 5.95 - - -1999 6.55 - - - 5.04 6.35 5.59 - - - - - - - - - 6.19 - - -2000 7.00 5.83 5.15 6.39 5.30 5.51 7.71 6.38 6.01 - - -2001 6.84 5.98 5.42 6.34 5.89 5.72 6.90 5.97 6.24 - - -2002 7.00 6.47 5.12 6.34 5.89 5.88 7.07 6.09 6.25 - - -2003 6.91 6.11 5.30 6.44 5.93 5.14 5.96 5.87 6.62 - - -2004 7.00 6.20 5.43 6.44 5.98 5.81 6.34 6.50 6.51 - - -
2005p 7.07 5.88 5.48 6.55 6.17 5.81 6.31 6.49 6.57 - - -
All annuals:1992 1.96 0.87 - - - - - - - - - - - - - - - - - - 2.01 2.991993 2.05 0.83 - - - - - - - - - - - - - - - - - - 2.29 3.131994 2.30 0.86 2.90 3.09 3.37 - - - - - - - - - 2.48 2.931995 2.24 0.85 3.31 3.09 3.92 - - - - - - - - - 2.47 3.101996 2.53 0.87 3.48 2.89 3.84 - - - - - - - - - 2.60 2.931997 2.57 0.89 3.58 2.92 4.31 - - - - - - - - - 2.94 2.981998 2.32 0.85 3.32 2.69 4.01 - - - - - - - - - 2.61 2.651999 2.47 0.85 3.17 2.85 4.01 - - - - - - - - - 2.73 2.922000 2.26 1.08 3.33 2.59 4.00 3.41 4.13 3.09 2.73 2.562001 2.32 1.09 3.26 2.64 3.91 3.54 4.36 3.43 2.63 2.692002 2.39 1.12 3.52 2.60 3.81 3.20 3.96 3.26 2.66 2.462003 2.46 1.19 3.12 2.61 3.74 3.27 3.91 3.11 2.79 2.072004 2.59 1.21 2.98 2.63 3.52 2.81 3.52 2.84 2.71 1.98
2005p 2.57 1.18 3.01 2.61 3.57 2.68 3.56 2.68 2.72 2.09
- - - = Not available; p = preliminary. 1/ Includes only commercial growers with $100,000 or more in annual floriculture sales; 36 surveyed States. Source: USDA, NASS, Floriculture Crops .
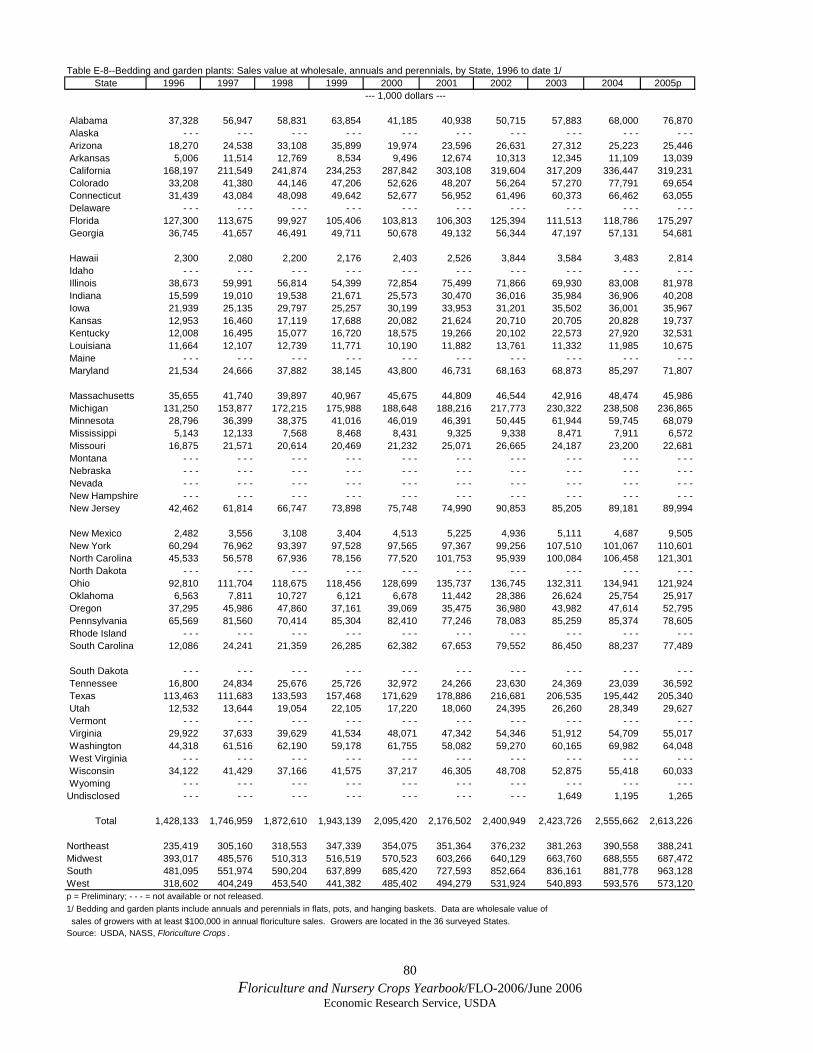
80 Floriculture and Nursery Crops Yearbook/FLO-2006/June 2006
Economic Research Service, USDA
Table E-8--Bedding and garden plants: Sales value at wholesale, annuals and perennials, by State, 1996 to date 1/State 1996 1997 1998 1999 2000 2001 2002 2003 2004 2005p
--- 1,000 dollars ---
Alabama 37,328 56,947 58,831 63,854 41,185 40,938 50,715 57,883 68,000 76,870 Alaska - - - - - - - - - - - - - - - - - - - - - - - - - - - - - - Arizona 18,270 24,538 33,108 35,899 19,974 23,596 26,631 27,312 25,223 25,446 Arkansas 5,006 11,514 12,769 8,534 9,496 12,674 10,313 12,345 11,109 13,039 California 168,197 211,549 241,874 234,253 287,842 303,108 319,604 317,209 336,447 319,231 Colorado 33,208 41,380 44,146 47,206 52,626 48,207 56,264 57,270 77,791 69,654 Connecticut 31,439 43,084 48,098 49,642 52,677 56,952 61,496 60,373 66,462 63,055 Delaware - - - - - - - - - - - - - - - - - - - - - - - - - - - - - - Florida 127,300 113,675 99,927 105,406 103,813 106,303 125,394 111,513 118,786 175,297 Georgia 36,745 41,657 46,491 49,711 50,678 49,132 56,344 47,197 57,131 54,681
Hawaii 2,300 2,080 2,200 2,176 2,403 2,526 3,844 3,584 3,483 2,814 Idaho - - - - - - - - - - - - - - - - - - - - - - - - - - - - - - Illinois 38,673 59,991 56,814 54,399 72,854 75,499 71,866 69,930 83,008 81,978 Indiana 15,599 19,010 19,538 21,671 25,573 30,470 36,016 35,984 36,906 40,208 Iowa 21,939 25,135 29,797 25,257 30,199 33,953 31,201 35,502 36,001 35,967 Kansas 12,953 16,460 17,119 17,688 20,082 21,624 20,710 20,705 20,828 19,737 Kentucky 12,008 16,495 15,077 16,720 18,575 19,266 20,102 22,573 27,920 32,531 Louisiana 11,664 12,107 12,739 11,771 10,190 11,882 13,761 11,332 11,985 10,675 Maine - - - - - - - - - - - - - - - - - - - - - - - - - - - - - - Maryland 21,534 24,666 37,882 38,145 43,800 46,731 68,163 68,873 85,297 71,807
Massachusetts 35,655 41,740 39,897 40,967 45,675 44,809 46,544 42,916 48,474 45,986 Michigan 131,250 153,877 172,215 175,988 188,648 188,216 217,773 230,322 238,508 236,865 Minnesota 28,796 36,399 38,375 41,016 46,019 46,391 50,445 61,944 59,745 68,079 Mississippi 5,143 12,133 7,568 8,468 8,431 9,325 9,338 8,471 7,911 6,572 Missouri 16,875 21,571 20,614 20,469 21,232 25,071 26,665 24,187 23,200 22,681 Montana - - - - - - - - - - - - - - - - - - - - - - - - - - - - - - Nebraska - - - - - - - - - - - - - - - - - - - - - - - - - - - - - - Nevada - - - - - - - - - - - - - - - - - - - - - - - - - - - - - - New Hampshire - - - - - - - - - - - - - - - - - - - - - - - - - - - - - - New Jersey 42,462 61,814 66,747 73,898 75,748 74,990 90,853 85,205 89,181 89,994
New Mexico 2,482 3,556 3,108 3,404 4,513 5,225 4,936 5,111 4,687 9,505 New York 60,294 76,962 93,397 97,528 97,565 97,367 99,256 107,510 101,067 110,601 North Carolina 45,533 56,578 67,936 78,156 77,520 101,753 95,939 100,084 106,458 121,301 North Dakota - - - - - - - - - - - - - - - - - - - - - - - - - - - - - - Ohio 92,810 111,704 118,675 118,456 128,699 135,737 136,745 132,311 134,941 121,924 Oklahoma 6,563 7,811 10,727 6,121 6,678 11,442 28,386 26,624 25,754 25,917 Oregon 37,295 45,986 47,860 37,161 39,069 35,475 36,980 43,982 47,614 52,795 Pennsylvania 65,569 81,560 70,414 85,304 82,410 77,246 78,083 85,259 85,374 78,605 Rhode Island - - - - - - - - - - - - - - - - - - - - - - - - - - - - - - South Carolina 12,086 24,241 21,359 26,285 62,382 67,653 79,552 86,450 88,237 77,489
South Dakota - - - - - - - - - - - - - - - - - - - - - - - - - - - - - - Tennessee 16,800 24,834 25,676 25,726 32,972 24,266 23,630 24,369 23,039 36,592 Texas 113,463 111,683 133,593 157,468 171,629 178,886 216,681 206,535 195,442 205,340 Utah 12,532 13,644 19,054 22,105 17,220 18,060 24,395 26,260 28,349 29,627 Vermont - - - - - - - - - - - - - - - - - - - - - - - - - - - - - - Virginia 29,922 37,633 39,629 41,534 48,071 47,342 54,346 51,912 54,709 55,017 Washington 44,318 61,516 62,190 59,178 61,755 58,082 59,270 60,165 69,982 64,048 West Virginia - - - - - - - - - - - - - - - - - - - - - - - - - - - - - - Wisconsin 34,122 41,429 37,166 41,575 37,217 46,305 48,708 52,875 55,418 60,033 Wyoming - - - - - - - - - - - - - - - - - - - - - - - - - - - - - -Undisclosed - - - - - - - - - - - - - - - - - - - - - 1,649 1,195 1,265
Total 1,428,133 1,746,959 1,872,610 1,943,139 2,095,420 2,176,502 2,400,949 2,423,726 2,555,662 2,613,226
Northeast 235,419 305,160 318,553 347,339 354,075 351,364 376,232 381,263 390,558 388,241Midwest 393,017 485,576 510,313 516,519 570,523 603,266 640,129 663,760 688,555 687,472South 481,095 551,974 590,204 637,899 685,420 727,593 852,664 836,161 881,778 963,128West 318,602 404,249 453,540 441,382 485,402 494,279 531,924 540,893 593,576 573,120p = Preliminary; - - - = not available or not released.1/ Bedding and garden plants include annuals and perennials in flats, pots, and hanging baskets. Data are wholesale value of sales of growers with at least $100,000 in annual floriculture sales. Growers are located in the 36 surveyed States.Source: USDA, NASS, Floriculture Crops .
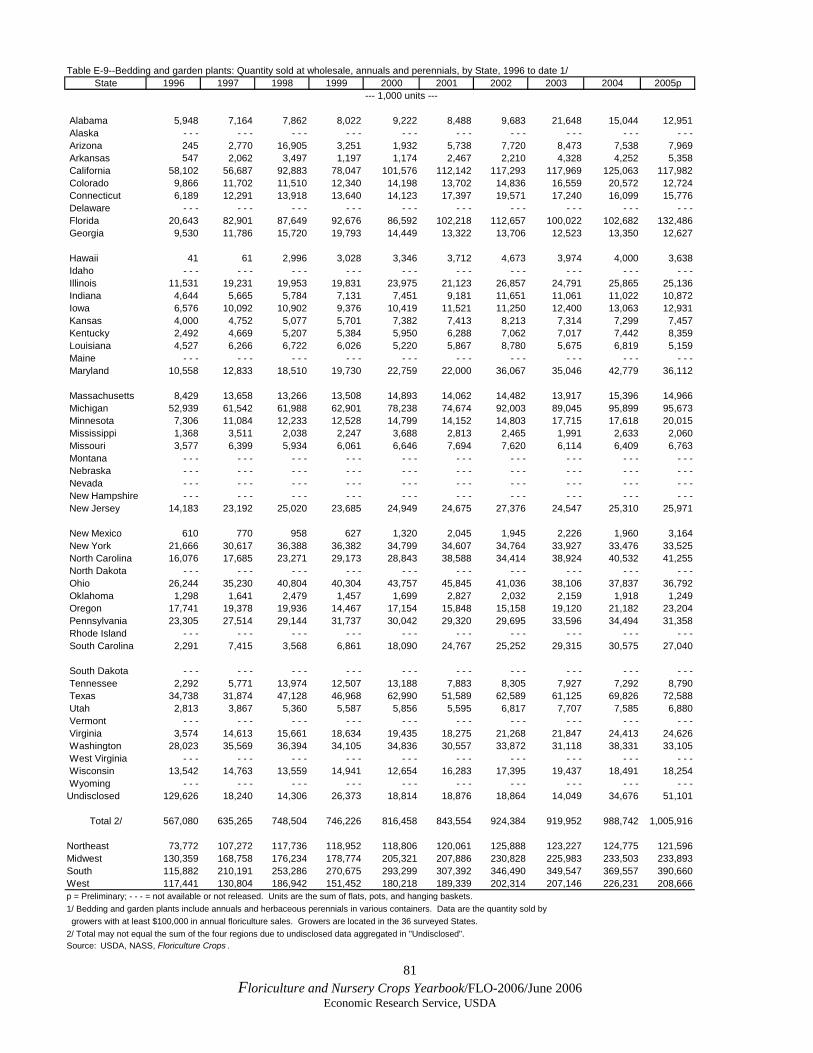
81 Floriculture and Nursery Crops Yearbook/FLO-2006/June 2006
Economic Research Service, USDA
Table E-9--Bedding and garden plants: Quantity sold at wholesale, annuals and perennials, by State, 1996 to date 1/State 1996 1997 1998 1999 2000 2001 2002 2003 2004 2005p
--- 1,000 units ---
Alabama 5,948 7,164 7,862 8,022 9,222 8,488 9,683 21,648 15,044 12,951 Alaska - - - - - - - - - - - - - - - - - - - - - - - - - - - - - - Arizona 245 2,770 16,905 3,251 1,932 5,738 7,720 8,473 7,538 7,969 Arkansas 547 2,062 3,497 1,197 1,174 2,467 2,210 4,328 4,252 5,358 California 58,102 56,687 92,883 78,047 101,576 112,142 117,293 117,969 125,063 117,982 Colorado 9,866 11,702 11,510 12,340 14,198 13,702 14,836 16,559 20,572 12,724 Connecticut 6,189 12,291 13,918 13,640 14,123 17,397 19,571 17,240 16,099 15,776 Delaware - - - - - - - - - - - - - - - - - - - - - - - - - - - - - - Florida 20,643 82,901 87,649 92,676 86,592 102,218 112,657 100,022 102,682 132,486 Georgia 9,530 11,786 15,720 19,793 14,449 13,322 13,706 12,523 13,350 12,627
Hawaii 41 61 2,996 3,028 3,346 3,712 4,673 3,974 4,000 3,638 Idaho - - - - - - - - - - - - - - - - - - - - - - - - - - - - - - Illinois 11,531 19,231 19,953 19,831 23,975 21,123 26,857 24,791 25,865 25,136 Indiana 4,644 5,665 5,784 7,131 7,451 9,181 11,651 11,061 11,022 10,872 Iowa 6,576 10,092 10,902 9,376 10,419 11,521 11,250 12,400 13,063 12,931 Kansas 4,000 4,752 5,077 5,701 7,382 7,413 8,213 7,314 7,299 7,457 Kentucky 2,492 4,669 5,207 5,384 5,950 6,288 7,062 7,017 7,442 8,359 Louisiana 4,527 6,266 6,722 6,026 5,220 5,867 8,780 5,675 6,819 5,159 Maine - - - - - - - - - - - - - - - - - - - - - - - - - - - - - - Maryland 10,558 12,833 18,510 19,730 22,759 22,000 36,067 35,046 42,779 36,112
Massachusetts 8,429 13,658 13,266 13,508 14,893 14,062 14,482 13,917 15,396 14,966 Michigan 52,939 61,542 61,988 62,901 78,238 74,674 92,003 89,045 95,899 95,673 Minnesota 7,306 11,084 12,233 12,528 14,799 14,152 14,803 17,715 17,618 20,015 Mississippi 1,368 3,511 2,038 2,247 3,688 2,813 2,465 1,991 2,633 2,060 Missouri 3,577 6,399 5,934 6,061 6,646 7,694 7,620 6,114 6,409 6,763 Montana - - - - - - - - - - - - - - - - - - - - - - - - - - - - - - Nebraska - - - - - - - - - - - - - - - - - - - - - - - - - - - - - - Nevada - - - - - - - - - - - - - - - - - - - - - - - - - - - - - - New Hampshire - - - - - - - - - - - - - - - - - - - - - - - - - - - - - - New Jersey 14,183 23,192 25,020 23,685 24,949 24,675 27,376 24,547 25,310 25,971
New Mexico 610 770 958 627 1,320 2,045 1,945 2,226 1,960 3,164 New York 21,666 30,617 36,388 36,382 34,799 34,607 34,764 33,927 33,476 33,525 North Carolina 16,076 17,685 23,271 29,173 28,843 38,588 34,414 38,924 40,532 41,255 North Dakota - - - - - - - - - - - - - - - - - - - - - - - - - - - - - - Ohio 26,244 35,230 40,804 40,304 43,757 45,845 41,036 38,106 37,837 36,792 Oklahoma 1,298 1,641 2,479 1,457 1,699 2,827 2,032 2,159 1,918 1,249 Oregon 17,741 19,378 19,936 14,467 17,154 15,848 15,158 19,120 21,182 23,204 Pennsylvania 23,305 27,514 29,144 31,737 30,042 29,320 29,695 33,596 34,494 31,358 Rhode Island - - - - - - - - - - - - - - - - - - - - - - - - - - - - - - South Carolina 2,291 7,415 3,568 6,861 18,090 24,767 25,252 29,315 30,575 27,040
South Dakota - - - - - - - - - - - - - - - - - - - - - - - - - - - - - - Tennessee 2,292 5,771 13,974 12,507 13,188 7,883 8,305 7,927 7,292 8,790 Texas 34,738 31,874 47,128 46,968 62,990 51,589 62,589 61,125 69,826 72,588 Utah 2,813 3,867 5,360 5,587 5,856 5,595 6,817 7,707 7,585 6,880 Vermont - - - - - - - - - - - - - - - - - - - - - - - - - - - - - - Virginia 3,574 14,613 15,661 18,634 19,435 18,275 21,268 21,847 24,413 24,626 Washington 28,023 35,569 36,394 34,105 34,836 30,557 33,872 31,118 38,331 33,105 West Virginia - - - - - - - - - - - - - - - - - - - - - - - - - - - - - - Wisconsin 13,542 14,763 13,559 14,941 12,654 16,283 17,395 19,437 18,491 18,254 Wyoming - - - - - - - - - - - - - - - - - - - - - - - - - - - - - -Undisclosed 129,626 18,240 14,306 26,373 18,814 18,876 18,864 14,049 34,676 51,101
Total 2/ 567,080 635,265 748,504 746,226 816,458 843,554 924,384 919,952 988,742 1,005,916
Northeast 73,772 107,272 117,736 118,952 118,806 120,061 125,888 123,227 124,775 121,596Midwest 130,359 168,758 176,234 178,774 205,321 207,886 230,828 225,983 233,503 233,893South 115,882 210,191 253,286 270,675 293,299 307,392 346,490 349,547 369,557 390,660West 117,441 130,804 186,942 151,452 180,218 189,339 202,314 207,146 226,231 208,666p = Preliminary; - - - = not available or not released. Units are the sum of flats, pots, and hanging baskets.1/ Bedding and garden plants include annuals and herbaceous perennials in various containers. Data are the quantity sold by growers with at least $100,000 in annual floriculture sales. Growers are located in the 36 surveyed States.2/ Total may not equal the sum of the four regions due to undisclosed data aggregated in "Undisclosed".Source: USDA, NASS, Floriculture Crops .
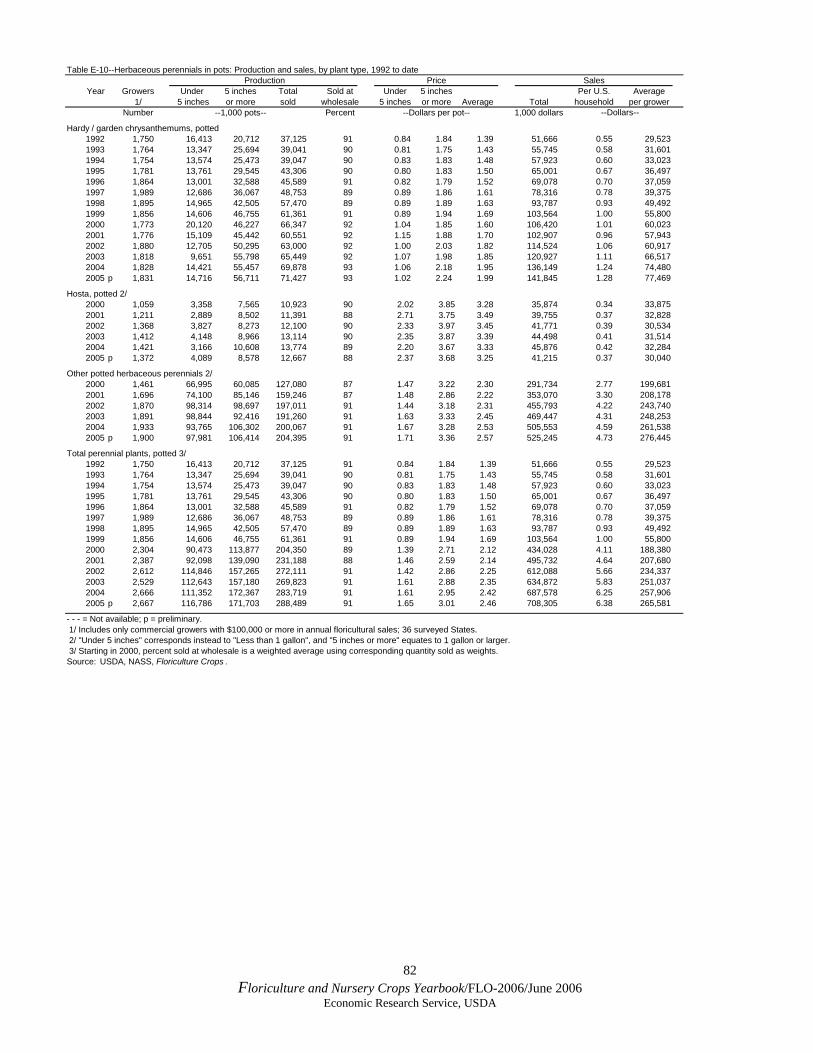
82 Floriculture and Nursery Crops Yearbook/FLO-2006/June 2006
Economic Research Service, USDA
Table E-10--Herbaceous perennials in pots: Production and sales, by plant type, 1992 to date Production Price Sales
Year Growers Under 5 inches Total Sold at Under 5 inches Per U.S. Average1/ 5 inches or more sold wholesale 5 inches or more Average Total household per grower
Number --1,000 pots-- Percent --Dollars per pot-- 1,000 dollars --Dollars--
Hardy / garden chrysanthemums, potted1992 1,750 16,413 20,712 37,125 91 0.84 1.84 1.39 51,666 0.55 29,5231993 1,764 13,347 25,694 39,041 90 0.81 1.75 1.43 55,745 0.58 31,6011994 1,754 13,574 25,473 39,047 90 0.83 1.83 1.48 57,923 0.60 33,0231995 1,781 13,761 29,545 43,306 90 0.80 1.83 1.50 65,001 0.67 36,4971996 1,864 13,001 32,588 45,589 91 0.82 1.79 1.52 69,078 0.70 37,0591997 1,989 12,686 36,067 48,753 89 0.89 1.86 1.61 78,316 0.78 39,3751998 1,895 14,965 42,505 57,470 89 0.89 1.89 1.63 93,787 0.93 49,4921999 1,856 14,606 46,755 61,361 91 0.89 1.94 1.69 103,564 1.00 55,8002000 1,773 20,120 46,227 66,347 92 1.04 1.85 1.60 106,420 1.01 60,0232001 1,776 15,109 45,442 60,551 92 1.15 1.88 1.70 102,907 0.96 57,9432002 1,880 12,705 50,295 63,000 92 1.00 2.03 1.82 114,524 1.06 60,9172003 1,818 9,651 55,798 65,449 92 1.07 1.98 1.85 120,927 1.11 66,5172004 1,828 14,421 55,457 69,878 93 1.06 2.18 1.95 136,149 1.24 74,4802005 p 1,831 14,716 56,711 71,427 93 1.02 2.24 1.99 141,845 1.28 77,469
Hosta, potted 2/2000 1,059 3,358 7,565 10,923 90 2.02 3.85 3.28 35,874 0.34 33,8752001 1,211 2,889 8,502 11,391 88 2.71 3.75 3.49 39,755 0.37 32,8282002 1,368 3,827 8,273 12,100 90 2.33 3.97 3.45 41,771 0.39 30,5342003 1,412 4,148 8,966 13,114 90 2.35 3.87 3.39 44,498 0.41 31,5142004 1,421 3,166 10,608 13,774 89 2.20 3.67 3.33 45,876 0.42 32,2842005 p 1,372 4,089 8,578 12,667 88 2.37 3.68 3.25 41,215 0.37 30,040
Other potted herbaceous perennials 2/2000 1,461 66,995 60,085 127,080 87 1.47 3.22 2.30 291,734 2.77 199,6812001 1,696 74,100 85,146 159,246 87 1.48 2.86 2.22 353,070 3.30 208,1782002 1,870 98,314 98,697 197,011 91 1.44 3.18 2.31 455,793 4.22 243,7402003 1,891 98,844 92,416 191,260 91 1.63 3.33 2.45 469,447 4.31 248,2532004 1,933 93,765 106,302 200,067 91 1.67 3.28 2.53 505,553 4.59 261,5382005 p 1,900 97,981 106,414 204,395 91 1.71 3.36 2.57 525,245 4.73 276,445
Total perennial plants, potted 3/1992 1,750 16,413 20,712 37,125 91 0.84 1.84 1.39 51,666 0.55 29,5231993 1,764 13,347 25,694 39,041 90 0.81 1.75 1.43 55,745 0.58 31,6011994 1,754 13,574 25,473 39,047 90 0.83 1.83 1.48 57,923 0.60 33,0231995 1,781 13,761 29,545 43,306 90 0.80 1.83 1.50 65,001 0.67 36,4971996 1,864 13,001 32,588 45,589 91 0.82 1.79 1.52 69,078 0.70 37,0591997 1,989 12,686 36,067 48,753 89 0.89 1.86 1.61 78,316 0.78 39,3751998 1,895 14,965 42,505 57,470 89 0.89 1.89 1.63 93,787 0.93 49,4921999 1,856 14,606 46,755 61,361 91 0.89 1.94 1.69 103,564 1.00 55,8002000 2,304 90,473 113,877 204,350 89 1.39 2.71 2.12 434,028 4.11 188,3802001 2,387 92,098 139,090 231,188 88 1.46 2.59 2.14 495,732 4.64 207,6802002 2,612 114,846 157,265 272,111 91 1.42 2.86 2.25 612,088 5.66 234,3372003 2,529 112,643 157,180 269,823 91 1.61 2.88 2.35 634,872 5.83 251,0372004 2,666 111,352 172,367 283,719 91 1.61 2.95 2.42 687,578 6.25 257,9062005 p 2,667 116,786 171,703 288,489 91 1.65 3.01 2.46 708,305 6.38 265,581
- - - = Not available; p = preliminary. 1/ Includes only commercial growers with $100,000 or more in annual floricultural sales; 36 surveyed States. 2/ "Under 5 inches" corresponds instead to "Less than 1 gallon", and "5 inches or more" equates to 1 gallon or larger. 3/ Starting in 2000, percent sold at wholesale is a weighted average using corresponding quantity sold as weights.Source: USDA, NASS, Floriculture Crops .
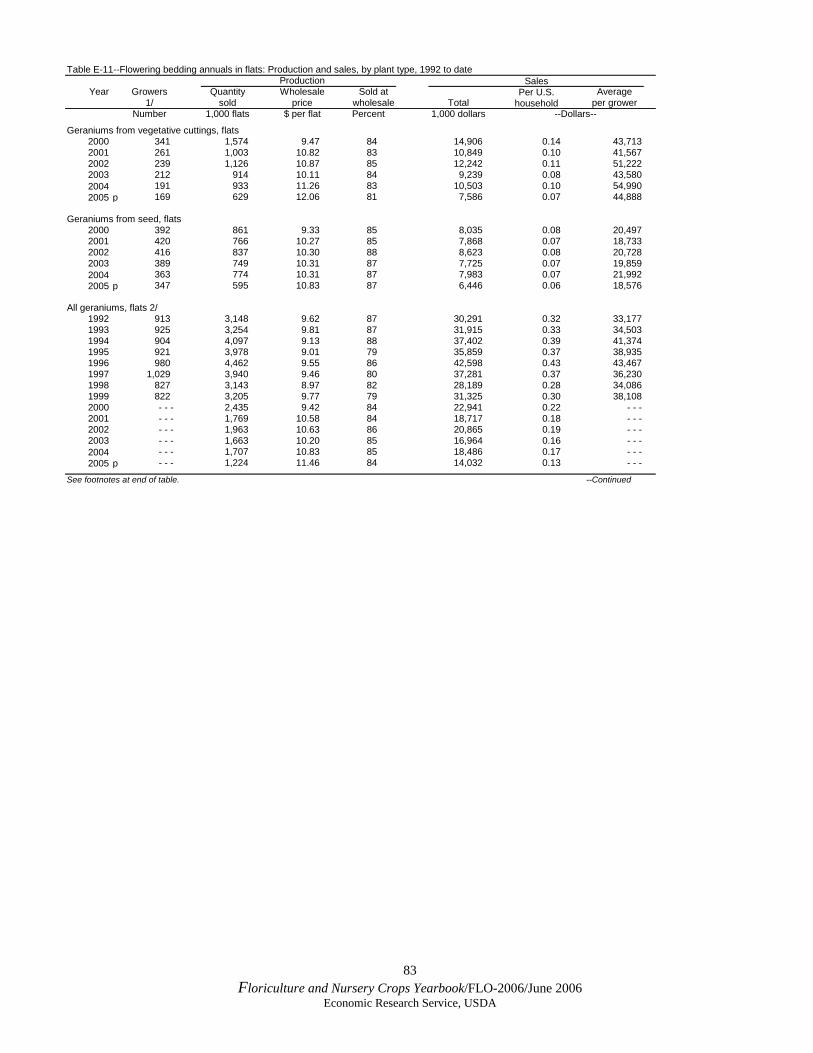
83 Floriculture and Nursery Crops Yearbook/FLO-2006/June 2006
Economic Research Service, USDA
Table E-11--Flowering bedding annuals in flats: Production and sales, by plant type, 1992 to dateProduction Sales
Year Growers Quantity Wholesale Sold at Per U.S. Average1/ sold price wholesale Total household per grower
Number 1,000 flats $ per flat Percent 1,000 dollars --Dollars--
Geraniums from vegetative cuttings, flats2000 341 1,574 9.47 84 14,906 0.14 43,7132001 261 1,003 10.82 83 10,849 0.10 41,5672002 239 1,126 10.87 85 12,242 0.11 51,2222003 212 914 10.11 84 9,239 0.08 43,5802004 191 933 11.26 83 10,503 0.10 54,9902005 p 169 629 12.06 81 7,586 0.07 44,888
Geraniums from seed, flats2000 392 861 9.33 85 8,035 0.08 20,4972001 420 766 10.27 85 7,868 0.07 18,7332002 416 837 10.30 88 8,623 0.08 20,7282003 389 749 10.31 87 7,725 0.07 19,8592004 363 774 10.31 87 7,983 0.07 21,9922005 p 347 595 10.83 87 6,446 0.06 18,576
All geraniums, flats 2/1992 913 3,148 9.62 87 30,291 0.32 33,1771993 925 3,254 9.81 87 31,915 0.33 34,5031994 904 4,097 9.13 88 37,402 0.39 41,3741995 921 3,978 9.01 79 35,859 0.37 38,9351996 980 4,462 9.55 86 42,598 0.43 43,4671997 1,029 3,940 9.46 80 37,281 0.37 36,2301998 827 3,143 8.97 82 28,189 0.28 34,0861999 822 3,205 9.77 79 31,325 0.30 38,1082000 - - - 2,435 9.42 84 22,941 0.22 - - -2001 - - - 1,769 10.58 84 18,717 0.18 - - -2002 - - - 1,963 10.63 86 20,865 0.19 - - -2003 - - - 1,663 10.20 85 16,964 0.16 - - -2004 - - - 1,707 10.83 85 18,486 0.17 - - -2005 p - - - 1,224 11.46 84 14,032 0.13 - - -
See footnotes at end of table. --Continued
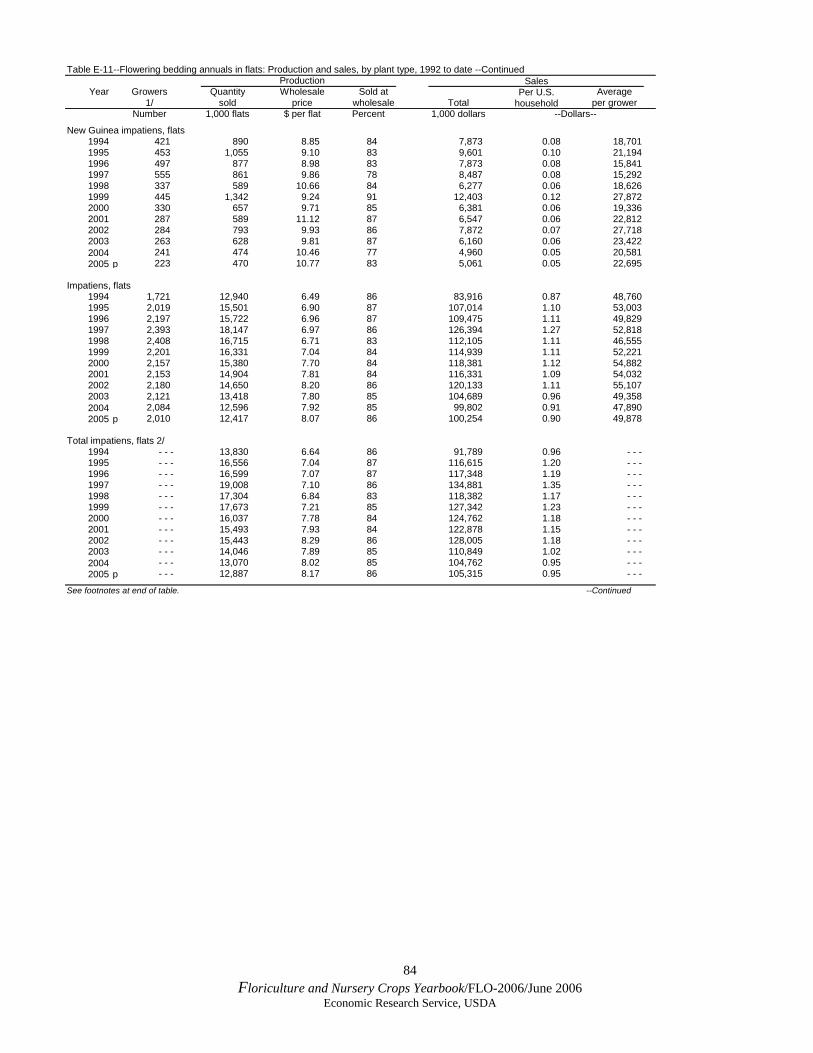
84 Floriculture and Nursery Crops Yearbook/FLO-2006/June 2006
Economic Research Service, USDA
Table E-11--Flowering bedding annuals in flats: Production and sales, by plant type, 1992 to date --ContinuedProduction Sales
Year Growers Quantity Wholesale Sold at Per U.S. Average1/ sold price wholesale Total household per grower
Number 1,000 flats $ per flat Percent 1,000 dollars --Dollars--
New Guinea impatiens, flats1994 421 890 8.85 84 7,873 0.08 18,7011995 453 1,055 9.10 83 9,601 0.10 21,1941996 497 877 8.98 83 7,873 0.08 15,8411997 555 861 9.86 78 8,487 0.08 15,2921998 337 589 10.66 84 6,277 0.06 18,6261999 445 1,342 9.24 91 12,403 0.12 27,8722000 330 657 9.71 85 6,381 0.06 19,3362001 287 589 11.12 87 6,547 0.06 22,8122002 284 793 9.93 86 7,872 0.07 27,7182003 263 628 9.81 87 6,160 0.06 23,4222004 241 474 10.46 77 4,960 0.05 20,5812005 p 223 470 10.77 83 5,061 0.05 22,695
Impatiens, flats1994 1,721 12,940 6.49 86 83,916 0.87 48,7601995 2,019 15,501 6.90 87 107,014 1.10 53,0031996 2,197 15,722 6.96 87 109,475 1.11 49,8291997 2,393 18,147 6.97 86 126,394 1.27 52,8181998 2,408 16,715 6.71 83 112,105 1.11 46,5551999 2,201 16,331 7.04 84 114,939 1.11 52,2212000 2,157 15,380 7.70 84 118,381 1.12 54,8822001 2,153 14,904 7.81 84 116,331 1.09 54,0322002 2,180 14,650 8.20 86 120,133 1.11 55,1072003 2,121 13,418 7.80 85 104,689 0.96 49,3582004 2,084 12,596 7.92 85 99,802 0.91 47,8902005 p 2,010 12,417 8.07 86 100,254 0.90 49,878
Total impatiens, flats 2/1994 - - - 13,830 6.64 86 91,789 0.96 - - -1995 - - - 16,556 7.04 87 116,615 1.20 - - -1996 - - - 16,599 7.07 87 117,348 1.19 - - -1997 - - - 19,008 7.10 86 134,881 1.35 - - -1998 - - - 17,304 6.84 83 118,382 1.17 - - -1999 - - - 17,673 7.21 85 127,342 1.23 - - -2000 - - - 16,037 7.78 84 124,762 1.18 - - -2001 - - - 15,493 7.93 84 122,878 1.15 - - -2002 - - - 15,443 8.29 86 128,005 1.18 - - -2003 - - - 14,046 7.89 85 110,849 1.02 - - -2004 - - - 13,070 8.02 85 104,762 0.95 - - -2005 p - - - 12,887 8.17 86 105,315 0.95 - - -
See footnotes at end of table. --Continued
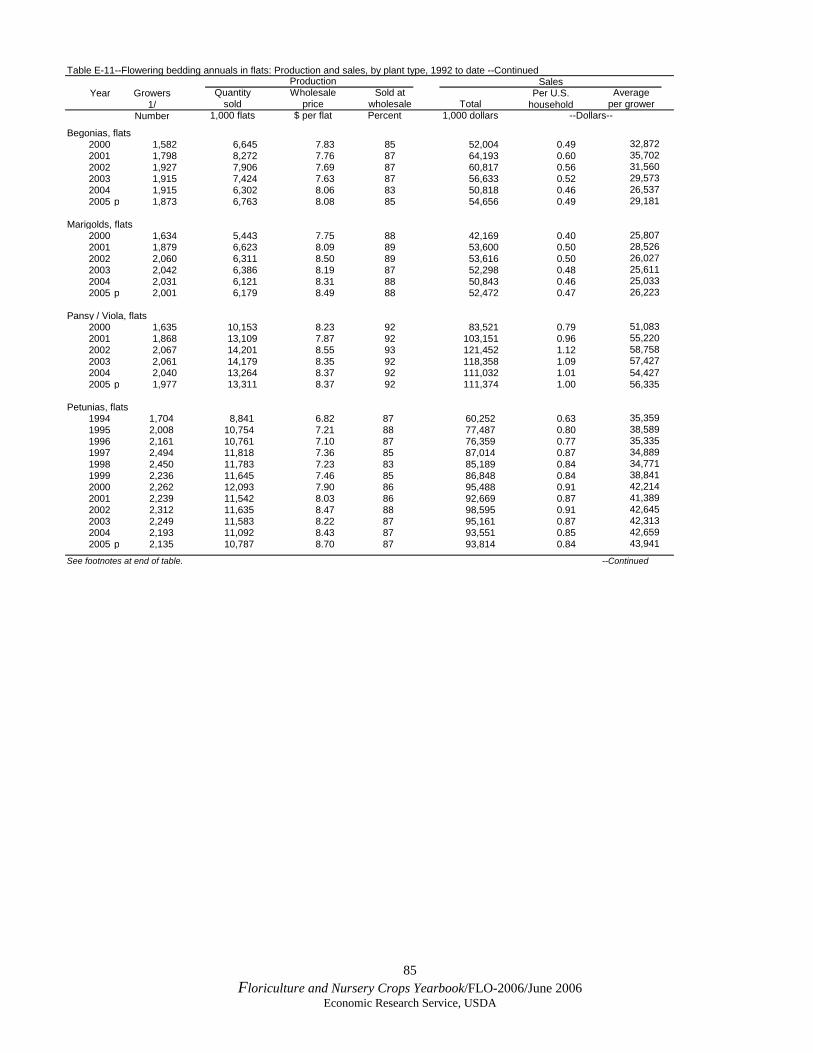
85 Floriculture and Nursery Crops Yearbook/FLO-2006/June 2006
Economic Research Service, USDA
Table E-11--Flowering bedding annuals in flats: Production and sales, by plant type, 1992 to date --ContinuedProduction Sales
Year Growers Quantity Wholesale Sold at Per U.S. Average1/ sold price wholesale Total household per grower
Number 1,000 flats $ per flat Percent 1,000 dollars --Dollars--
Begonias, flats2000 1,582 6,645 7.83 85 52,004 0.49 32,8722001 1,798 8,272 7.76 87 64,193 0.60 35,7022002 1,927 7,906 7.69 87 60,817 0.56 31,5602003 1,915 7,424 7.63 87 56,633 0.52 29,5732004 1,915 6,302 8.06 83 50,818 0.46 26,5372005 p 1,873 6,763 8.08 85 54,656 0.49 29,181
Marigolds, flats2000 1,634 5,443 7.75 88 42,169 0.40 25,8072001 1,879 6,623 8.09 89 53,600 0.50 28,5262002 2,060 6,311 8.50 89 53,616 0.50 26,0272003 2,042 6,386 8.19 87 52,298 0.48 25,6112004 2,031 6,121 8.31 88 50,843 0.46 25,0332005 p 2,001 6,179 8.49 88 52,472 0.47 26,223
Pansy / Viola, flats2000 1,635 10,153 8.23 92 83,521 0.79 51,0832001 1,868 13,109 7.87 92 103,151 0.96 55,2202002 2,067 14,201 8.55 93 121,452 1.12 58,7582003 2,061 14,179 8.35 92 118,358 1.09 57,4272004 2,040 13,264 8.37 92 111,032 1.01 54,4272005 p 1,977 13,311 8.37 92 111,374 1.00 56,335
Petunias, flats1994 1,704 8,841 6.82 87 60,252 0.63 35,3591995 2,008 10,754 7.21 88 77,487 0.80 38,5891996 2,161 10,761 7.10 87 76,359 0.77 35,3351997 2,494 11,818 7.36 85 87,014 0.87 34,8891998 2,450 11,783 7.23 83 85,189 0.84 34,7711999 2,236 11,645 7.46 85 86,848 0.84 38,8412000 2,262 12,093 7.90 86 95,488 0.91 42,2142001 2,239 11,542 8.03 86 92,669 0.87 41,3892002 2,312 11,635 8.47 88 98,595 0.91 42,6452003 2,249 11,583 8.22 87 95,161 0.87 42,3132004 2,193 11,092 8.43 87 93,551 0.85 42,6592005 p 2,135 10,787 8.70 87 93,814 0.84 43,941
See footnotes at end of table. --Continued
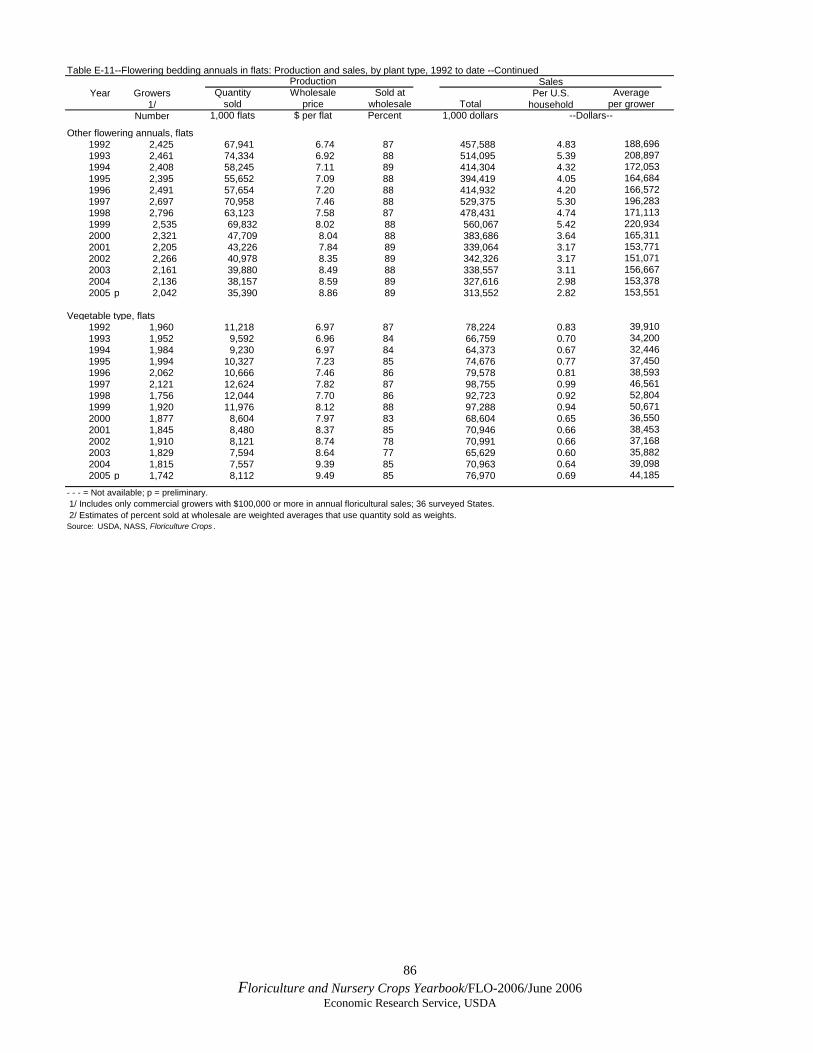
86 Floriculture and Nursery Crops Yearbook/FLO-2006/June 2006
Economic Research Service, USDA
Table E-11--Flowering bedding annuals in flats: Production and sales, by plant type, 1992 to date --ContinuedProduction Sales
Year Growers Quantity Wholesale Sold at Per U.S. Average1/ sold price wholesale Total household per grower
Number 1,000 flats $ per flat Percent 1,000 dollars --Dollars--
Other flowering annuals, flats1992 2,425 67,941 6.74 87 457,588 4.83 188,6961993 2,461 74,334 6.92 88 514,095 5.39 208,8971994 2,408 58,245 7.11 89 414,304 4.32 172,0531995 2,395 55,652 7.09 88 394,419 4.05 164,6841996 2,491 57,654 7.20 88 414,932 4.20 166,5721997 2,697 70,958 7.46 88 529,375 5.30 196,2831998 2,796 63,123 7.58 87 478,431 4.74 171,1131999 2,535 69,832 8.02 88 560,067 5.42 220,9342000 2,321 47,709 8.04 88 383,686 3.64 165,3112001 2,205 43,226 7.84 89 339,064 3.17 153,7712002 2,266 40,978 8.35 89 342,326 3.17 151,0712003 2,161 39,880 8.49 88 338,557 3.11 156,6672004 2,136 38,157 8.59 89 327,616 2.98 153,3782005 p 2,042 35,390 8.86 89 313,552 2.82 153,551
Vegetable type, flats1992 1,960 11,218 6.97 87 78,224 0.83 39,9101993 1,952 9,592 6.96 84 66,759 0.70 34,2001994 1,984 9,230 6.97 84 64,373 0.67 32,4461995 1,994 10,327 7.23 85 74,676 0.77 37,4501996 2,062 10,666 7.46 86 79,578 0.81 38,5931997 2,121 12,624 7.82 87 98,755 0.99 46,5611998 1,756 12,044 7.70 86 92,723 0.92 52,8041999 1,920 11,976 8.12 88 97,288 0.94 50,6712000 1,877 8,604 7.97 83 68,604 0.65 36,5502001 1,845 8,480 8.37 85 70,946 0.66 38,4532002 1,910 8,121 8.74 78 70,991 0.66 37,1682003 1,829 7,594 8.64 77 65,629 0.60 35,8822004 1,815 7,557 9.39 85 70,963 0.64 39,0982005 p 1,742 8,112 9.49 85 76,970 0.69 44,185
- - - = Not available; p = preliminary. 1/ Includes only commercial growers with $100,000 or more in annual floricultural sales; 36 surveyed States. 2/ Estimates of percent sold at wholesale are weighted averages that use quantity sold as weights.Source: USDA, NASS, Floriculture Crops .

87 Floriculture and Nursery Crops Yearbook/FLO-2006/June 2006
Economic Research Service, USDA
Table E-12--Flowering bedding annuals in pots: Production and sales, by plant type, 1992 to date Production Price Sales
Year Growers Under 5 inches Total Sold at Under 5 inches Per U.S. Average1/ 5 inches or more sold wholesale 5 inches or more All Total household per grower
Number --1,000 pots-- Percent --Dollars per pot-- 1,000 dollars --Dollars--
Geraniums from vegetative cuttings, potted1992 2,104 42,206 11,168 53,374 79 1.26 2.46 1.51 80,678 0.85 38,3451993 2,096 41,584 11,265 52,849 78 1.29 2.62 1.57 83,038 0.87 39,6171994 2,112 45,086 10,351 55,437 78 1.29 2.71 1.55 86,061 0.90 40,7491995 2,182 49,726 15,902 65,628 82 1.24 2.64 1.58 103,569 1.06 47,4651996 2,259 40,770 15,287 56,057 80 1.30 2.57 1.65 92,457 0.94 40,9281997 2,360 40,620 15,190 55,810 76 1.41 2.61 1.74 97,123 0.97 41,1541998 2,482 47,855 17,374 65,229 78 1.37 2.57 1.69 110,425 1.09 44,4901999 2,261 45,221 17,099 62,320 78 1.39 2.76 1.77 110,291 1.07 48,7802000 2,281 44,004 18,423 62,427 79 1.41 2.62 1.77 110,223 1.04 48,3222001 2,287 42,033 18,126 60,159 79 1.47 2.79 1.87 112,417 1.05 49,1552002 2,341 41,293 18,116 59,409 80 1.50 2.76 1.88 111,819 1.03 47,7652003 2,249 41,245 19,287 60,532 80 1.56 2.88 1.98 119,921 1.10 53,3222004 2,261 40,509 21,028 61,537 81 1.61 2.97 2.07 127,671 1.16 56,467 2005 p 2,195 39,287 21,956 61,243 81 1.61 3.03 2.12 129,909 1.17 59,184
Geraniums from seed, potted1992 1,033 45,542 1,882 47,424 92 0.80 2.44 0.87 41,126 0.43 39,8121993 1,023 47,211 2,079 49,290 92 0.77 2.08 0.83 40,758 0.43 39,8421994 1,018 48,612 2,107 50,719 91 0.80 2.24 0.86 43,551 0.45 42,7811995 960 46,913 2,377 49,290 92 0.80 1.84 0.85 42,035 0.43 43,7861996 919 42,339 2,184 44,523 92 0.82 1.91 0.87 38,841 0.39 42,2641997 954 44,198 3,781 47,979 93 0.80 1.90 0.89 42,675 0.43 44,7331998 957 42,564 2,173 44,737 92 0.80 1.82 0.85 37,889 0.37 39,5911999 841 42,550 2,149 44,699 93 0.79 1.87 0.85 37,837 0.37 44,9902000 815 46,677 1,452 48,129 93 0.83 2.07 0.87 41,749 0.40 51,2262001 757 43,675 379 44,054 93 0.84 3.58 0.86 37,879 0.35 50,0382002 770 40,451 1,365 41,816 93 0.84 1.65 0.87 36,273 0.34 47,1082003 776 34,196 1,072 35,268 93 0.86 2.05 0.90 31,697 0.29 40,8472004 757 36,671 887 37,558 94 0.90 2.01 0.93 34,785 0.32 45,9512005 p 746 34,146 777 34,923 93 0.87 2.67 0.91 31,921 0.29 42,790
Total geraniums, potted 2/1992 - - - 87,748 13,050 100,798 85 1.02 2.46 1.21 121,804 1.29 - - -1993 - - - 88,795 13,344 102,139 85 1.01 2.54 1.21 123,796 1.30 - - -1994 - - - 93,698 12,458 106,156 84 1.04 2.63 1.22 129,612 1.35 - - -1995 - - - 96,639 18,279 114,918 86 1.03 2.54 1.27 145,604 1.50 - - -1996 - - - 83,109 17,471 100,580 85 1.06 2.49 1.31 131,298 1.33 - - -1997 - - - 84,818 18,971 103,789 84 1.09 2.47 1.35 139,798 1.40 - - -1998 - - - 90,419 19,547 109,966 84 1.10 2.49 1.35 148,314 1.47 - - -1999 - - - 87,771 19,248 107,019 84 1.10 2.66 1.38 148,128 1.43 - - -2000 - - - 90,681 19,875 110,556 85 1.11 2.58 1.37 151,972 1.44 - - -2001 - - - 85,708 18,505 104,213 85 1.15 2.81 1.44 150,296 1.41 - - -2002 - - - 81,744 19,481 101,225 85 1.17 2.68 1.46 148,092 1.37 - - -2003 - - - 75,441 20,359 95,800 85 1.24 2.84 1.58 151,618 1.39 - - -2004 - - - 77,180 21,915 99,095 86 1.27 2.93 1.64 162,456 1.48 - - -2005 p - - - 73,433 22,733 96,166 85 1.27 3.02 1.68 161,830 1.46 - - -
See footnotes at end of table. --Continued
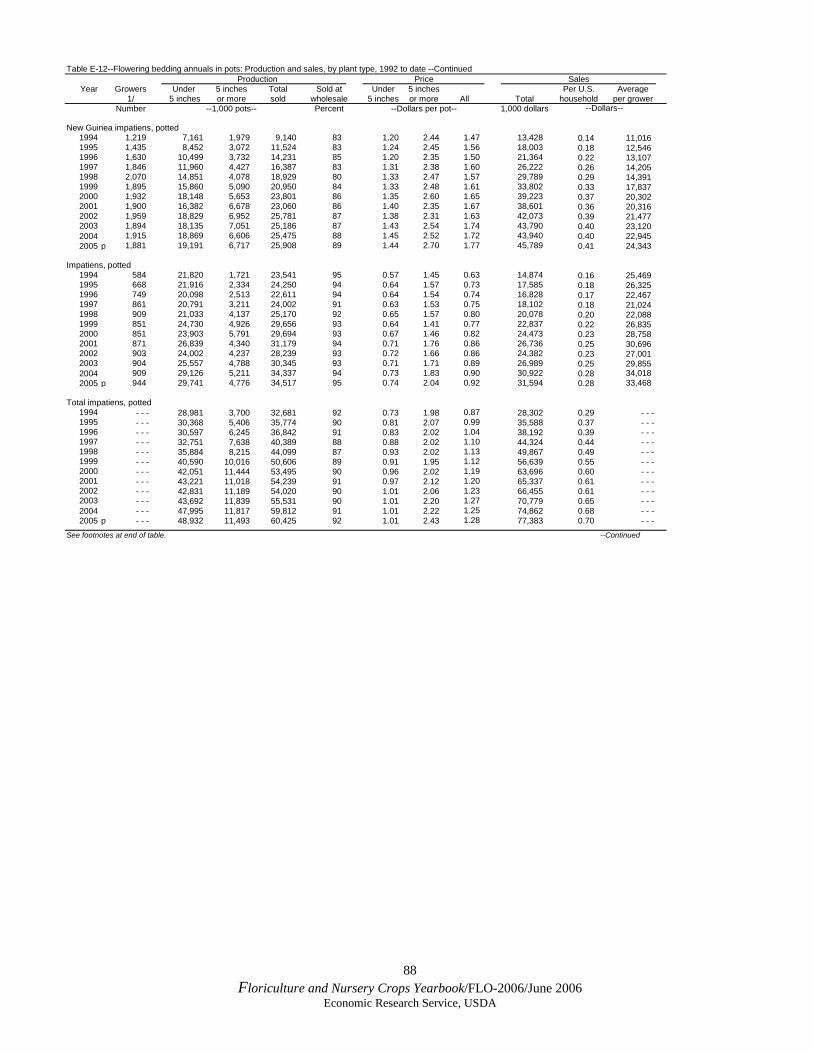
88 Floriculture and Nursery Crops Yearbook/FLO-2006/June 2006
Economic Research Service, USDA
Table E-12--Flowering bedding annuals in pots: Production and sales, by plant type, 1992 to date --Continued Production Price Sales
Year Growers Under 5 inches Total Sold at Under 5 inches Per U.S. Average1/ 5 inches or more sold wholesale 5 inches or more All Total household per grower
Number --1,000 pots-- Percent --Dollars per pot-- 1,000 dollars --Dollars--
New Guinea impatiens, potted1994 1,219 7,161 1,979 9,140 83 1.20 2.44 1.47 13,428 0.14 11,0161995 1,435 8,452 3,072 11,524 83 1.24 2.45 1.56 18,003 0.18 12,5461996 1,630 10,499 3,732 14,231 85 1.20 2.35 1.50 21,364 0.22 13,1071997 1,846 11,960 4,427 16,387 83 1.31 2.38 1.60 26,222 0.26 14,2051998 2,070 14,851 4,078 18,929 80 1.33 2.47 1.57 29,789 0.29 14,3911999 1,895 15,860 5,090 20,950 84 1.33 2.48 1.61 33,802 0.33 17,8372000 1,932 18,148 5,653 23,801 86 1.35 2.60 1.65 39,223 0.37 20,3022001 1,900 16,382 6,678 23,060 86 1.40 2.35 1.67 38,601 0.36 20,3162002 1,959 18,829 6,952 25,781 87 1.38 2.31 1.63 42,073 0.39 21,4772003 1,894 18,135 7,051 25,186 87 1.43 2.54 1.74 43,790 0.40 23,1202004 1,915 18,869 6,606 25,475 88 1.45 2.52 1.72 43,940 0.40 22,9452005 p 1,881 19,191 6,717 25,908 89 1.44 2.70 1.77 45,789 0.41 24,343
Impatiens, potted1994 584 21,820 1,721 23,541 95 0.57 1.45 0.63 14,874 0.16 25,4691995 668 21,916 2,334 24,250 94 0.64 1.57 0.73 17,585 0.18 26,3251996 749 20,098 2,513 22,611 94 0.64 1.54 0.74 16,828 0.17 22,4671997 861 20,791 3,211 24,002 91 0.63 1.53 0.75 18,102 0.18 21,0241998 909 21,033 4,137 25,170 92 0.65 1.57 0.80 20,078 0.20 22,0881999 851 24,730 4,926 29,656 93 0.64 1.41 0.77 22,837 0.22 26,8352000 851 23,903 5,791 29,694 93 0.67 1.46 0.82 24,473 0.23 28,7582001 871 26,839 4,340 31,179 94 0.71 1.76 0.86 26,736 0.25 30,6962002 903 24,002 4,237 28,239 93 0.72 1.66 0.86 24,382 0.23 27,0012003 904 25,557 4,788 30,345 93 0.71 1.71 0.89 26,989 0.25 29,8552004 909 29,126 5,211 34,337 94 0.73 1.83 0.90 30,922 0.28 34,018 2005 p 944 29,741 4,776 34,517 95 0.74 2.04 0.92 31,594 0.28 33,468
Total impatiens, potted1994 - - - 28,981 3,700 32,681 92 0.73 1.98 0.87 28,302 0.29 - - -1995 - - - 30,368 5,406 35,774 90 0.81 2.07 0.99 35,588 0.37 - - -1996 - - - 30,597 6,245 36,842 91 0.83 2.02 1.04 38,192 0.39 - - -1997 - - - 32,751 7,638 40,389 88 0.88 2.02 1.10 44,324 0.44 - - -1998 - - - 35,884 8,215 44,099 87 0.93 2.02 1.13 49,867 0.49 - - -1999 - - - 40,590 10,016 50,606 89 0.91 1.95 1.12 56,639 0.55 - - -2000 - - - 42,051 11,444 53,495 90 0.96 2.02 1.19 63,696 0.60 - - -2001 - - - 43,221 11,018 54,239 91 0.97 2.12 1.20 65,337 0.61 - - -2002 - - - 42,831 11,189 54,020 90 1.01 2.06 1.23 66,455 0.61 - - -2003 - - - 43,692 11,839 55,531 90 1.01 2.20 1.27 70,779 0.65 - - -2004 - - - 47,995 11,817 59,812 91 1.01 2.22 1.25 74,862 0.68 - - -2005 p - - - 48,932 11,493 60,425 92 1.01 2.43 1.28 77,383 0.70 - - -
See footnotes at end of table. --Continued

89 Floriculture and Nursery Crops Yearbook/FLO-2006/June 2006
Economic Research Service, USDA
Table E-12--Flowering bedding annuals in pots: Production and sales, by plant type, 1992 to date --Continued Production Price Sales
Year Growers Under 5 inches Total Sold at Under 5 inches Per U.S. Average1/ 5 inches or more sold wholesale 5 inches or more All Total household per grower
Number --1,000 pots-- Percent --Dollars per pot-- 1,000 dollars --Dollars--
Begonias, potted2000 913 12,526 2,354 14,880 88 0.89 1.82 1.04 15,427 0.15 16,8972001 1,075 13,890 4,275 18,165 88 0.92 2.23 1.23 22,260 0.21 20,7072002 1,202 15,969 4,493 20,462 88 0.89 1.98 1.13 23,142 0.21 19,2532003 1,211 14,489 4,371 18,860 86 1.02 1.88 1.22 22,946 0.21 18,9482004 1,276 19,261 4,760 24,021 89 0.88 1.94 1.09 26,166 0.24 20,5062005 p 1,280 23,377 5,016 28,393 92 0.88 1.99 1.08 30,555 0.28 23,871
Marigolds, potted2000 396 5,085 1,020 6,105 92 0.77 1.39 0.88 5,346 0.05 13,5002001 476 5,472 1,685 7,157 93 0.72 1.43 0.89 6,351 0.06 13,3422002 544 7,760 1,497 9,257 94 0.76 1.35 0.85 7,895 0.07 14,5132003 526 7,118 1,708 8,826 95 0.66 1.47 0.81 7,189 0.07 13,6672004 548 8,583 2,732 11,315 96 0.72 1.54 0.92 10,417 0.09 19,0092005 p 542 9,012 2,594 11,606 96 0.73 1.59 0.92 10,689 0.10 19,721
Pansy / Viola, potted2000 547 19,336 4,581 23,917 94 0.70 1.61 0.87 20,890 0.20 38,1902001 620 18,756 5,175 23,931 92 0.78 1.55 0.95 22,648 0.21 36,5292002 724 25,244 7,906 33,150 94 0.70 1.67 0.94 31,053 0.29 42,8912003 757 27,291 7,885 35,176 94 0.70 1.76 0.94 33,026 0.30 43,6272004 817 32,101 9,118 41,219 94 0.72 1.86 0.97 40,164 0.37 49,1602005 p 848 36,601 10,868 47,469 95 0.73 1.89 0.99 47,118 0.42 55,564
Petunias, potted1994 391 11,191 959 12,150 95 0.65 1.45 0.71 8,679 0.09 22,1971995 535 10,656 1,129 11,785 93 0.66 1.78 0.77 9,030 0.09 16,8791996 628 10,520 1,813 12,333 93 0.66 1.58 0.79 9,797 0.10 15,6001997 776 9,061 1,985 11,046 92 0.68 1.60 0.84 9,321 0.09 12,0121998 868 10,504 2,726 13,230 92 0.70 1.72 0.91 12,042 0.12 13,8731999 1,029 11,491 3,115 14,606 91 0.75 1.75 0.96 14,072 0.14 13,6752000 997 13,340 3,784 17,124 90 0.83 1.73 1.03 17,580 0.17 17,6332001 1,020 14,724 5,280 20,004 90 0.90 2.11 1.22 24,389 0.23 23,9112002 1,111 17,373 6,198 23,571 92 0.90 2.00 1.19 28,035 0.26 25,2342003 1,170 17,268 7,237 24,505 91 0.92 2.12 1.27 31,190 0.29 26,6582004 1,276 21,037 8,765 29,802 91 0.95 2.15 1.30 38,871 0.35 30,4632005 p 1,271 21,204 9,638 30,842 91 0.94 2.30 1.37 42,109 0.38 33,131
See footnotes at end of table. --Continued
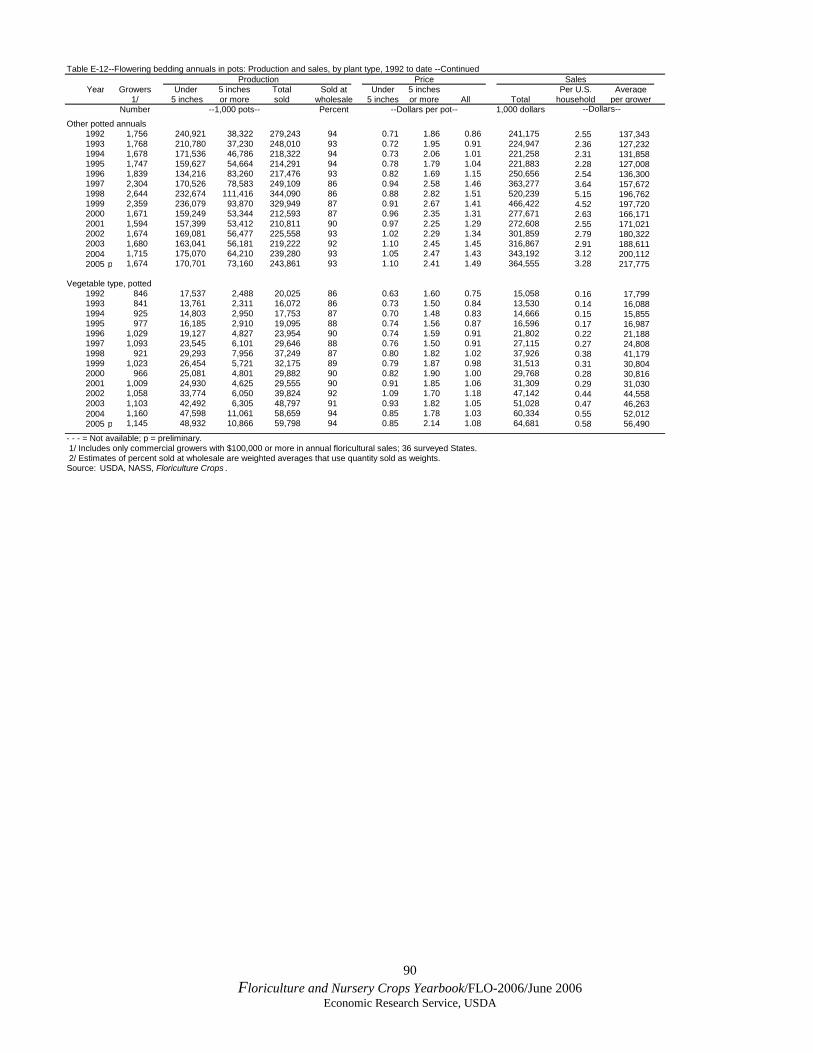
90 Floriculture and Nursery Crops Yearbook/FLO-2006/June 2006
Economic Research Service, USDA
Table E-12--Flowering bedding annuals in pots: Production and sales, by plant type, 1992 to date --Continued Production Price Sales
Year Growers Under 5 inches Total Sold at Under 5 inches Per U.S. Average1/ 5 inches or more sold wholesale 5 inches or more All Total household per grower
Number --1,000 pots-- Percent --Dollars per pot-- 1,000 dollars --Dollars--
Other potted annuals1992 1,756 240,921 38,322 279,243 94 0.71 1.86 0.86 241,175 2.55 137,3431993 1,768 210,780 37,230 248,010 93 0.72 1.95 0.91 224,947 2.36 127,2321994 1,678 171,536 46,786 218,322 94 0.73 2.06 1.01 221,258 2.31 131,8581995 1,747 159,627 54,664 214,291 94 0.78 1.79 1.04 221,883 2.28 127,0081996 1,839 134,216 83,260 217,476 93 0.82 1.69 1.15 250,656 2.54 136,3001997 2,304 170,526 78,583 249,109 86 0.94 2.58 1.46 363,277 3.64 157,6721998 2,644 232,674 111,416 344,090 86 0.88 2.82 1.51 520,239 5.15 196,7621999 2,359 236,079 93,870 329,949 87 0.91 2.67 1.41 466,422 4.52 197,7202000 1,671 159,249 53,344 212,593 87 0.96 2.35 1.31 277,671 2.63 166,1712001 1,594 157,399 53,412 210,811 90 0.97 2.25 1.29 272,608 2.55 171,0212002 1,674 169,081 56,477 225,558 93 1.02 2.29 1.34 301,859 2.79 180,3222003 1,680 163,041 56,181 219,222 92 1.10 2.45 1.45 316,867 2.91 188,6112004 1,715 175,070 64,210 239,280 93 1.05 2.47 1.43 343,192 3.12 200,1122005 p 1,674 170,701 73,160 243,861 93 1.10 2.41 1.49 364,555 3.28 217,775
Vegetable type, potted1992 846 17,537 2,488 20,025 86 0.63 1.60 0.75 15,058 0.16 17,7991993 841 13,761 2,311 16,072 86 0.73 1.50 0.84 13,530 0.14 16,0881994 925 14,803 2,950 17,753 87 0.70 1.48 0.83 14,666 0.15 15,8551995 977 16,185 2,910 19,095 88 0.74 1.56 0.87 16,596 0.17 16,9871996 1,029 19,127 4,827 23,954 90 0.74 1.59 0.91 21,802 0.22 21,1881997 1,093 23,545 6,101 29,646 88 0.76 1.50 0.91 27,115 0.27 24,8081998 921 29,293 7,956 37,249 87 0.80 1.82 1.02 37,926 0.38 41,1791999 1,023 26,454 5,721 32,175 89 0.79 1.87 0.98 31,513 0.31 30,8042000 966 25,081 4,801 29,882 90 0.82 1.90 1.00 29,768 0.28 30,8162001 1,009 24,930 4,625 29,555 90 0.91 1.85 1.06 31,309 0.29 31,0302002 1,058 33,774 6,050 39,824 92 1.09 1.70 1.18 47,142 0.44 44,5582003 1,103 42,492 6,305 48,797 91 0.93 1.82 1.05 51,028 0.47 46,2632004 1,160 47,598 11,061 58,659 94 0.85 1.78 1.03 60,334 0.55 52,0122005 p 1,145 48,932 10,866 59,798 94 0.85 2.14 1.08 64,681 0.58 56,490
- - - = Not available; p = preliminary. 1/ Includes only commercial growers with $100,000 or more in annual floricultural sales; 36 surveyed States. 2/ Estimates of percent sold at wholesale are weighted averages that use quantity sold as weights.Source: USDA, NASS, Floriculture Crops .
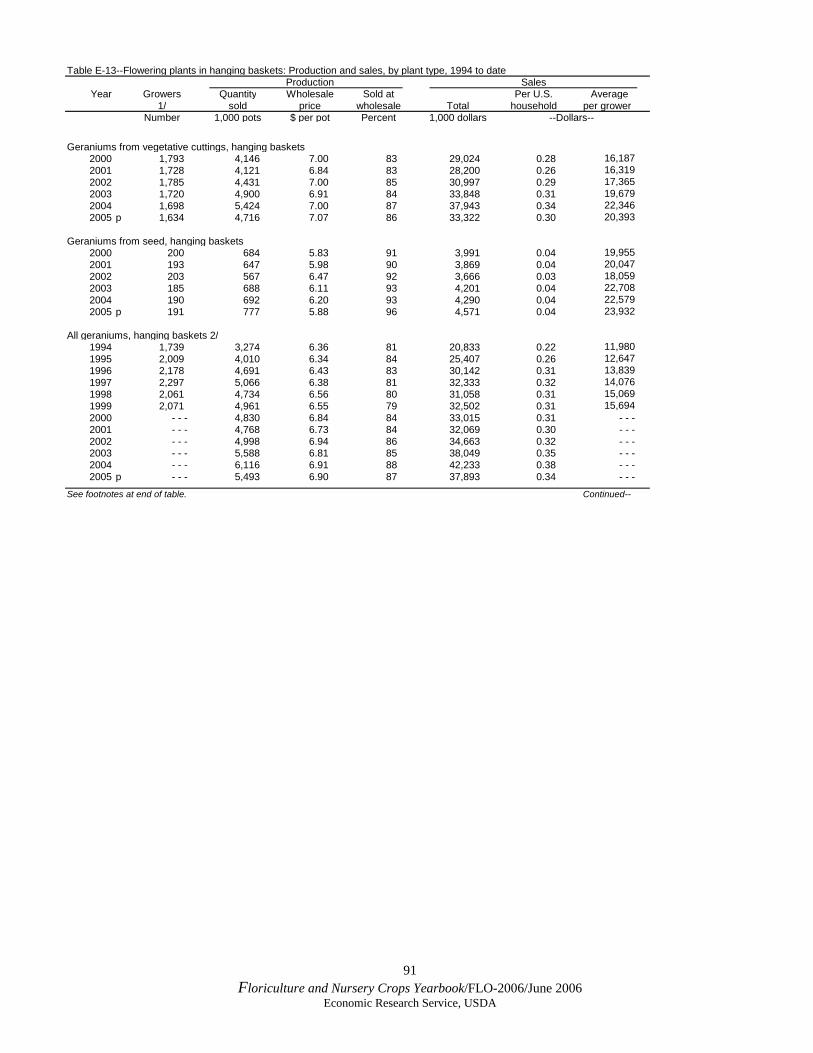
91 Floriculture and Nursery Crops Yearbook/FLO-2006/June 2006
Economic Research Service, USDA
Table E-13--Flowering plants in hanging baskets: Production and sales, by plant type, 1994 to dateProduction Sales
Year Growers Quantity Wholesale Sold at Per U.S. Average1/ sold price wholesale Total household per grower
Number 1,000 pots $ per pot Percent 1,000 dollars --Dollars--
Geraniums from vegetative cuttings, hanging baskets2000 1,793 4,146 7.00 83 29,024 0.28 16,1872001 1,728 4,121 6.84 83 28,200 0.26 16,3192002 1,785 4,431 7.00 85 30,997 0.29 17,3652003 1,720 4,900 6.91 84 33,848 0.31 19,6792004 1,698 5,424 7.00 87 37,943 0.34 22,3462005 p 1,634 4,716 7.07 86 33,322 0.30 20,393
Geraniums from seed, hanging baskets2000 200 684 5.83 91 3,991 0.04 19,9552001 193 647 5.98 90 3,869 0.04 20,0472002 203 567 6.47 92 3,666 0.03 18,0592003 185 688 6.11 93 4,201 0.04 22,7082004 190 692 6.20 93 4,290 0.04 22,5792005 p 191 777 5.88 96 4,571 0.04 23,932
All geraniums, hanging baskets 2/1994 1,739 3,274 6.36 81 20,833 0.22 11,9801995 2,009 4,010 6.34 84 25,407 0.26 12,6471996 2,178 4,691 6.43 83 30,142 0.31 13,8391997 2,297 5,066 6.38 81 32,333 0.32 14,0761998 2,061 4,734 6.56 80 31,058 0.31 15,0691999 2,071 4,961 6.55 79 32,502 0.31 15,6942000 - - - 4,830 6.84 84 33,015 0.31 - - -2001 - - - 4,768 6.73 84 32,069 0.30 - - -2002 - - - 4,998 6.94 86 34,663 0.32 - - -2003 - - - 5,588 6.81 85 38,049 0.35 - - -2004 - - - 6,116 6.91 88 42,233 0.38 - - -2005 p - - - 5,493 6.90 87 37,893 0.34 - - -
See footnotes at end of table. Continued--
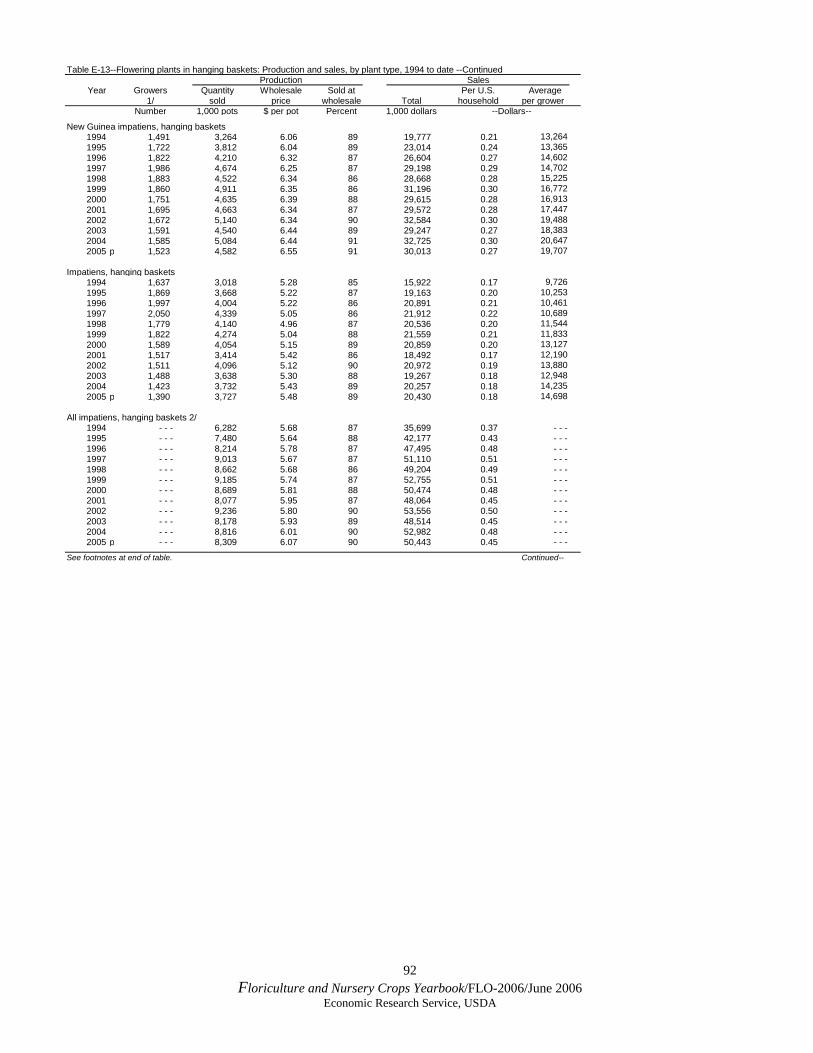
92 Floriculture and Nursery Crops Yearbook/FLO-2006/June 2006
Economic Research Service, USDA
Table E-13--Flowering plants in hanging baskets: Production and sales, by plant type, 1994 to date --ContinuedProduction Sales
Year Growers Quantity Wholesale Sold at Per U.S. Average1/ sold price wholesale Total household per grower
Number 1,000 pots $ per pot Percent 1,000 dollars --Dollars--
New Guinea impatiens, hanging baskets1994 1,491 3,264 6.06 89 19,777 0.21 13,2641995 1,722 3,812 6.04 89 23,014 0.24 13,3651996 1,822 4,210 6.32 87 26,604 0.27 14,6021997 1,986 4,674 6.25 87 29,198 0.29 14,7021998 1,883 4,522 6.34 86 28,668 0.28 15,2251999 1,860 4,911 6.35 86 31,196 0.30 16,7722000 1,751 4,635 6.39 88 29,615 0.28 16,9132001 1,695 4,663 6.34 87 29,572 0.28 17,4472002 1,672 5,140 6.34 90 32,584 0.30 19,4882003 1,591 4,540 6.44 89 29,247 0.27 18,3832004 1,585 5,084 6.44 91 32,725 0.30 20,6472005 p 1,523 4,582 6.55 91 30,013 0.27 19,707
Impatiens, hanging baskets1994 1,637 3,018 5.28 85 15,922 0.17 9,7261995 1,869 3,668 5.22 87 19,163 0.20 10,2531996 1,997 4,004 5.22 86 20,891 0.21 10,4611997 2,050 4,339 5.05 86 21,912 0.22 10,6891998 1,779 4,140 4.96 87 20,536 0.20 11,5441999 1,822 4,274 5.04 88 21,559 0.21 11,8332000 1,589 4,054 5.15 89 20,859 0.20 13,1272001 1,517 3,414 5.42 86 18,492 0.17 12,1902002 1,511 4,096 5.12 90 20,972 0.19 13,8802003 1,488 3,638 5.30 88 19,267 0.18 12,9482004 1,423 3,732 5.43 89 20,257 0.18 14,2352005 p 1,390 3,727 5.48 89 20,430 0.18 14,698
All impatiens, hanging baskets 2/1994 - - - 6,282 5.68 87 35,699 0.37 - - -1995 - - - 7,480 5.64 88 42,177 0.43 - - -1996 - - - 8,214 5.78 87 47,495 0.48 - - -1997 - - - 9,013 5.67 87 51,110 0.51 - - -1998 - - - 8,662 5.68 86 49,204 0.49 - - -1999 - - - 9,185 5.74 87 52,755 0.51 - - -2000 - - - 8,689 5.81 88 50,474 0.48 - - -2001 - - - 8,077 5.95 87 48,064 0.45 - - -2002 - - - 9,236 5.80 90 53,556 0.50 - - -2003 - - - 8,178 5.93 89 48,514 0.45 - - -2004 - - - 8,816 6.01 90 52,982 0.48 - - -2005 p - - - 8,309 6.07 90 50,443 0.45 - - -
See footnotes at end of table. Continued--

93 Floriculture and Nursery Crops Yearbook/FLO-2006/June 2006
Economic Research Service, USDA
Table E-13--Flowering plants in hanging baskets: Production and sales, by plant type, 1994 to date --ContinuedProduction Sales
Year Growers Quantity Wholesale Sold at Per U.S. Average1/ sold price wholesale Total household per grower
Number 1,000 pots $ per pot Percent 1,000 dollars --Dollars--
Begonias, hanging baskets2000 1,051 2,855 5.51 88 15,733 0.15 14,9702001 1,193 3,335 5.72 88 19,062 0.18 15,9782002 1,243 2,536 5.88 85 14,919 0.14 12,0022003 1,304 3,352 5.14 88 17,229 0.16 13,2122004 1,337 2,777 5.81 84 16,122 0.15 12,0582005 p 1,290 2,871 5.81 86 16,674 0.15 12,926
Marigold, hanging baskets2000 30 59 7.71 98 455 0.00 15,1672001 28 50 6.90 61 345 0.00 12,3212002 27 41 7.07 77 290 0.00 10,7412003 19 23 5.96 78 137 0.00 7,2112004 21 50 6.34 94 317 0.00 15,0952005 p 19 39 6.31 80 246 0.00 12,947
Pansy / viola, hanging baskets2000 238 303 6.38 91 1,932 0.02 8,1182001 273 466 5.97 94 2,784 0.03 10,1982002 299 600 6.09 95 3,651 0.03 12,2112003 306 747 5.87 95 4,383 0.04 14,3242004 322 931 6.50 97 6,049 0.05 18,7862005 p 343 1,148 6.49 97 7,446 0.07 21,708
Petunias, hanging baskets1994 1,171 852 5.42 84 4,614 0.05 3,9401995 1,467 1,345 5.36 86 7,205 0.07 4,9111996 1,695 1,664 5.40 84 8,984 0.09 5,3001997 1,908 2,013 5.40 83 10,876 0.11 5,7001998 1,711 2,203 5.37 84 11,822 0.12 6,9091999 1,910 2,823 5.59 84 15,774 0.15 8,2592000 1,616 2,941 5.30 86 15,595 0.15 9,6502001 1,593 3,102 5.89 84 18,269 0.17 11,4682002 1,597 3,558 5.89 86 20,950 0.19 13,1182003 1,629 3,933 5.93 85 23,325 0.21 14,3192004 1,637 4,771 5.98 87 28,547 0.26 17,4392005 p 1,632 4,897 6.17 87 30,222 0.27 18,518
Other flowering hanging baskets1994 2,540 16,480 5.48 88 90,381 0.94 35,5831995 2,537 15,857 5.64 88 89,420 0.92 35,2461996 2,618 15,595 5.76 86 89,874 0.91 34,3291997 2,734 18,093 5.70 87 103,183 1.03 37,7411998 2,525 19,404 5.95 84 115,437 1.14 45,7181999 2,544 19,210 6.19 88 118,900 1.15 46,7372000 1,847 14,760 6.01 88 88,656 0.84 48,0002001 1,745 15,979 6.24 89 99,761 0.93 57,1702002 1,793 17,679 6.25 89 110,492 1.02 61,6242003 1,768 17,836 6.62 88 118,125 1.08 66,8132004 1,775 21,089 6.51 90 137,301 1.25 77,3532005 p 1,747 21,457 6.57 90 140,892 1.27 80,648
- - - = Not available; p = preliminary. 1/ Includes only growers with $100,000+ in annual floriculture sales; 36 surveyed States. 2/ Estimates of percent sold at wholesale are weighted averages that use quantity sold as weights.Source: USDA, NASS, Floriculture Crops .
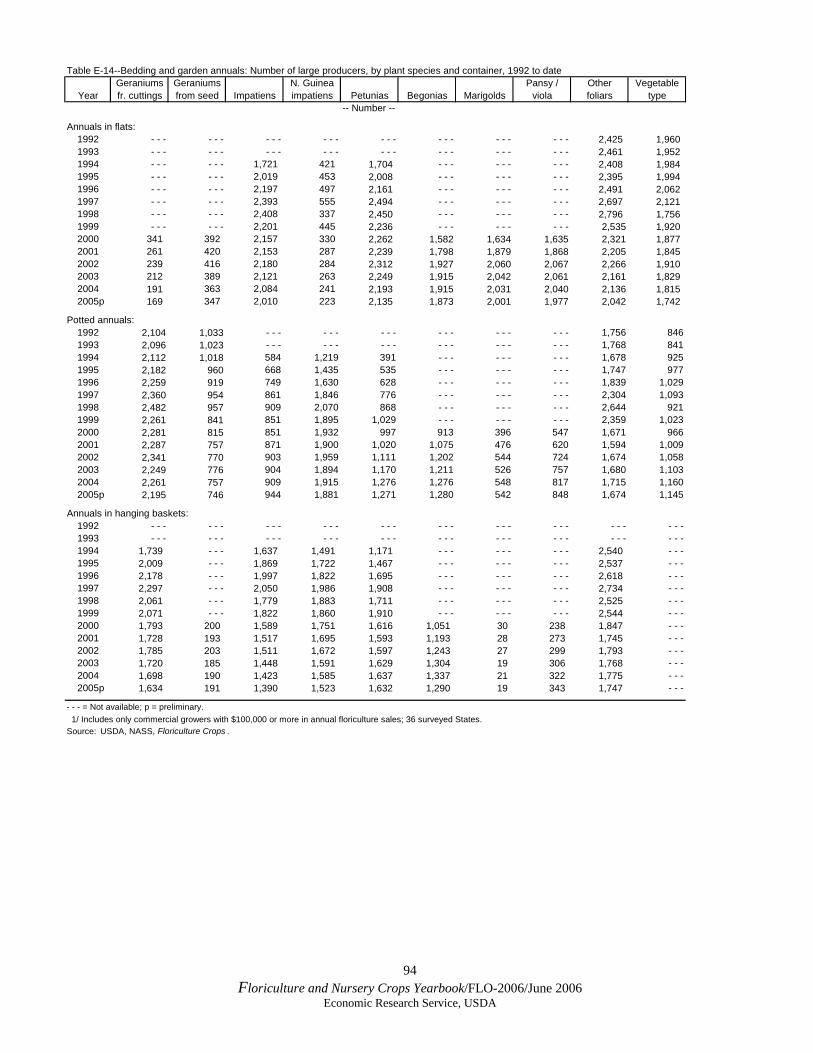
94 Floriculture and Nursery Crops Yearbook/FLO-2006/June 2006
Economic Research Service, USDA
Table E-14--Bedding and garden annuals: Number of large producers, by plant species and container, 1992 to dateGeraniums Geraniums N. Guinea Pansy / Other Vegetable
Year fr. cuttings from seed Impatiens impatiens Petunias Begonias Marigolds viola foliars type-- Number --
Annuals in flats:1992 - - - - - - - - - - - - - - - - - - - - - - - - 2,425 1,9601993 - - - - - - - - - - - - - - - - - - - - - - - - 2,461 1,9521994 - - - - - - 1,721 421 1,704 - - - - - - - - - 2,408 1,9841995 - - - - - - 2,019 453 2,008 - - - - - - - - - 2,395 1,9941996 - - - - - - 2,197 497 2,161 - - - - - - - - - 2,491 2,0621997 - - - - - - 2,393 555 2,494 - - - - - - - - - 2,697 2,1211998 - - - - - - 2,408 337 2,450 - - - - - - - - - 2,796 1,7561999 - - - - - - 2,201 445 2,236 - - - - - - - - - 2,535 1,9202000 341 392 2,157 330 2,262 1,582 1,634 1,635 2,321 1,8772001 261 420 2,153 287 2,239 1,798 1,879 1,868 2,205 1,8452002 239 416 2,180 284 2,312 1,927 2,060 2,067 2,266 1,9102003 212 389 2,121 263 2,249 1,915 2,042 2,061 2,161 1,8292004 191 363 2,084 241 2,193 1,915 2,031 2,040 2,136 1,815
2005p 169 347 2,010 223 2,135 1,873 2,001 1,977 2,042 1,742
Potted annuals:1992 2,104 1,033 - - - - - - - - - - - - - - - - - - 1,756 8461993 2,096 1,023 - - - - - - - - - - - - - - - - - - 1,768 8411994 2,112 1,018 584 1,219 391 - - - - - - - - - 1,678 9251995 2,182 960 668 1,435 535 - - - - - - - - - 1,747 9771996 2,259 919 749 1,630 628 - - - - - - - - - 1,839 1,0291997 2,360 954 861 1,846 776 - - - - - - - - - 2,304 1,0931998 2,482 957 909 2,070 868 - - - - - - - - - 2,644 9211999 2,261 841 851 1,895 1,029 - - - - - - - - - 2,359 1,0232000 2,281 815 851 1,932 997 913 396 547 1,671 9662001 2,287 757 871 1,900 1,020 1,075 476 620 1,594 1,0092002 2,341 770 903 1,959 1,111 1,202 544 724 1,674 1,0582003 2,249 776 904 1,894 1,170 1,211 526 757 1,680 1,1032004 2,261 757 909 1,915 1,276 1,276 548 817 1,715 1,160
2005p 2,195 746 944 1,881 1,271 1,280 542 848 1,674 1,145
Annuals in hanging baskets:1992 - - - - - - - - - - - - - - - - - - - - - - - - - - - - - -1993 - - - - - - - - - - - - - - - - - - - - - - - - - - - - - -1994 1,739 - - - 1,637 1,491 1,171 - - - - - - - - - 2,540 - - -1995 2,009 - - - 1,869 1,722 1,467 - - - - - - - - - 2,537 - - -1996 2,178 - - - 1,997 1,822 1,695 - - - - - - - - - 2,618 - - -1997 2,297 - - - 2,050 1,986 1,908 - - - - - - - - - 2,734 - - -1998 2,061 - - - 1,779 1,883 1,711 - - - - - - - - - 2,525 - - -1999 2,071 - - - 1,822 1,860 1,910 - - - - - - - - - 2,544 - - -2000 1,793 200 1,589 1,751 1,616 1,051 30 238 1,847 - - -2001 1,728 193 1,517 1,695 1,593 1,193 28 273 1,745 - - -2002 1,785 203 1,511 1,672 1,597 1,243 27 299 1,793 - - -2003 1,720 185 1,448 1,591 1,629 1,304 19 306 1,768 - - -2004 1,698 190 1,423 1,585 1,637 1,337 21 322 1,775 - - -
2005p 1,634 191 1,390 1,523 1,632 1,290 19 343 1,747 - - -
- - - = Not available; p = preliminary. 1/ Includes only commercial growers with $100,000 or more in annual floriculture sales; 36 surveyed States. Source: USDA, NASS, Floriculture Crops .
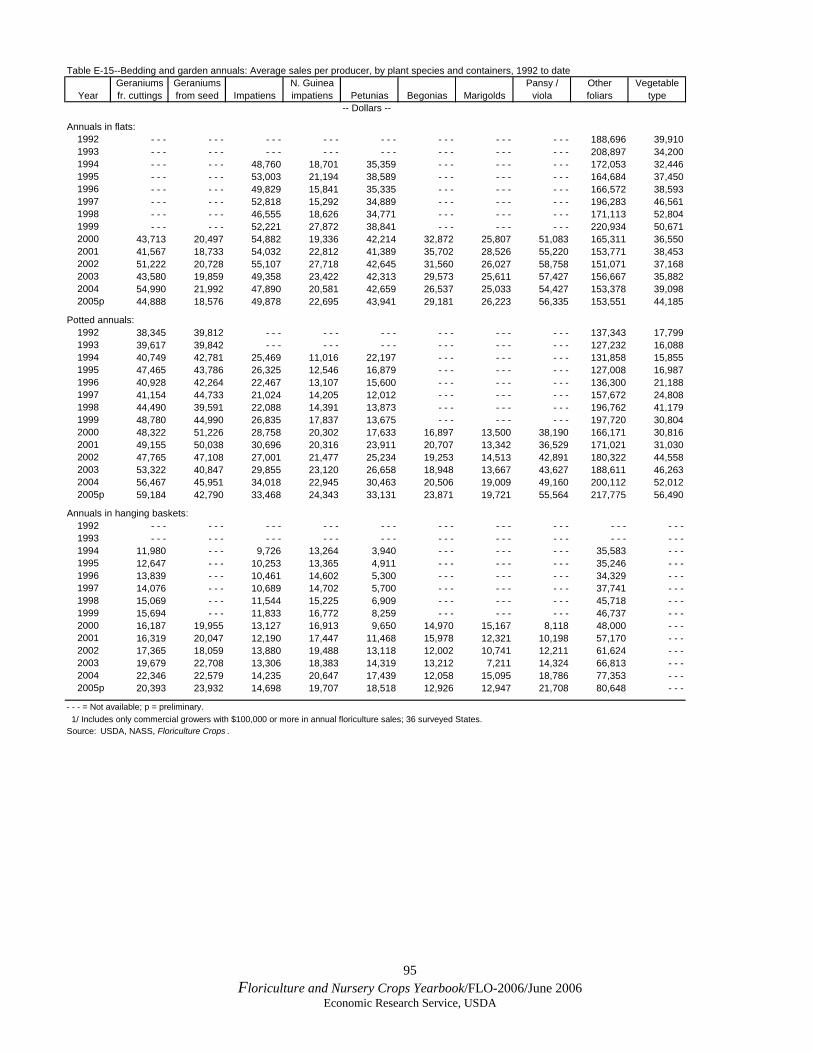
95 Floriculture and Nursery Crops Yearbook/FLO-2006/June 2006
Economic Research Service, USDA
Table E-15--Bedding and garden annuals: Average sales per producer, by plant species and containers, 1992 to dateGeraniums Geraniums N. Guinea Pansy / Other Vegetable
Year fr. cuttings from seed Impatiens impatiens Petunias Begonias Marigolds viola foliars type-- Dollars --
Annuals in flats:1992 - - - - - - - - - - - - - - - - - - - - - - - - 188,696 39,9101993 - - - - - - - - - - - - - - - - - - - - - - - - 208,897 34,2001994 - - - - - - 48,760 18,701 35,359 - - - - - - - - - 172,053 32,4461995 - - - - - - 53,003 21,194 38,589 - - - - - - - - - 164,684 37,4501996 - - - - - - 49,829 15,841 35,335 - - - - - - - - - 166,572 38,5931997 - - - - - - 52,818 15,292 34,889 - - - - - - - - - 196,283 46,5611998 - - - - - - 46,555 18,626 34,771 - - - - - - - - - 171,113 52,8041999 - - - - - - 52,221 27,872 38,841 - - - - - - - - - 220,934 50,6712000 43,713 20,497 54,882 19,336 42,214 32,872 25,807 51,083 165,311 36,5502001 41,567 18,733 54,032 22,812 41,389 35,702 28,526 55,220 153,771 38,4532002 51,222 20,728 55,107 27,718 42,645 31,560 26,027 58,758 151,071 37,1682003 43,580 19,859 49,358 23,422 42,313 29,573 25,611 57,427 156,667 35,8822004 54,990 21,992 47,890 20,581 42,659 26,537 25,033 54,427 153,378 39,098
2005p 44,888 18,576 49,878 22,695 43,941 29,181 26,223 56,335 153,551 44,185
Potted annuals:1992 38,345 39,812 - - - - - - - - - - - - - - - - - - 137,343 17,7991993 39,617 39,842 - - - - - - - - - - - - - - - - - - 127,232 16,0881994 40,749 42,781 25,469 11,016 22,197 - - - - - - - - - 131,858 15,8551995 47,465 43,786 26,325 12,546 16,879 - - - - - - - - - 127,008 16,9871996 40,928 42,264 22,467 13,107 15,600 - - - - - - - - - 136,300 21,1881997 41,154 44,733 21,024 14,205 12,012 - - - - - - - - - 157,672 24,8081998 44,490 39,591 22,088 14,391 13,873 - - - - - - - - - 196,762 41,1791999 48,780 44,990 26,835 17,837 13,675 - - - - - - - - - 197,720 30,8042000 48,322 51,226 28,758 20,302 17,633 16,897 13,500 38,190 166,171 30,8162001 49,155 50,038 30,696 20,316 23,911 20,707 13,342 36,529 171,021 31,0302002 47,765 47,108 27,001 21,477 25,234 19,253 14,513 42,891 180,322 44,5582003 53,322 40,847 29,855 23,120 26,658 18,948 13,667 43,627 188,611 46,2632004 56,467 45,951 34,018 22,945 30,463 20,506 19,009 49,160 200,112 52,012
2005p 59,184 42,790 33,468 24,343 33,131 23,871 19,721 55,564 217,775 56,490
Annuals in hanging baskets:1992 - - - - - - - - - - - - - - - - - - - - - - - - - - - - - -1993 - - - - - - - - - - - - - - - - - - - - - - - - - - - - - -1994 11,980 - - - 9,726 13,264 3,940 - - - - - - - - - 35,583 - - -1995 12,647 - - - 10,253 13,365 4,911 - - - - - - - - - 35,246 - - -1996 13,839 - - - 10,461 14,602 5,300 - - - - - - - - - 34,329 - - -1997 14,076 - - - 10,689 14,702 5,700 - - - - - - - - - 37,741 - - -1998 15,069 - - - 11,544 15,225 6,909 - - - - - - - - - 45,718 - - -1999 15,694 - - - 11,833 16,772 8,259 - - - - - - - - - 46,737 - - -2000 16,187 19,955 13,127 16,913 9,650 14,970 15,167 8,118 48,000 - - -2001 16,319 20,047 12,190 17,447 11,468 15,978 12,321 10,198 57,170 - - -2002 17,365 18,059 13,880 19,488 13,118 12,002 10,741 12,211 61,624 - - -2003 19,679 22,708 13,306 18,383 14,319 13,212 7,211 14,324 66,813 - - -2004 22,346 22,579 14,235 20,647 17,439 12,058 15,095 18,786 77,353 - - -
2005p 20,393 23,932 14,698 19,707 18,518 12,926 12,947 21,708 80,648 - - -
- - - = Not available; p = preliminary. 1/ Includes only commercial growers with $100,000 or more in annual floriculture sales; 36 surveyed States. Source: USDA, NASS, Floriculture Crops .
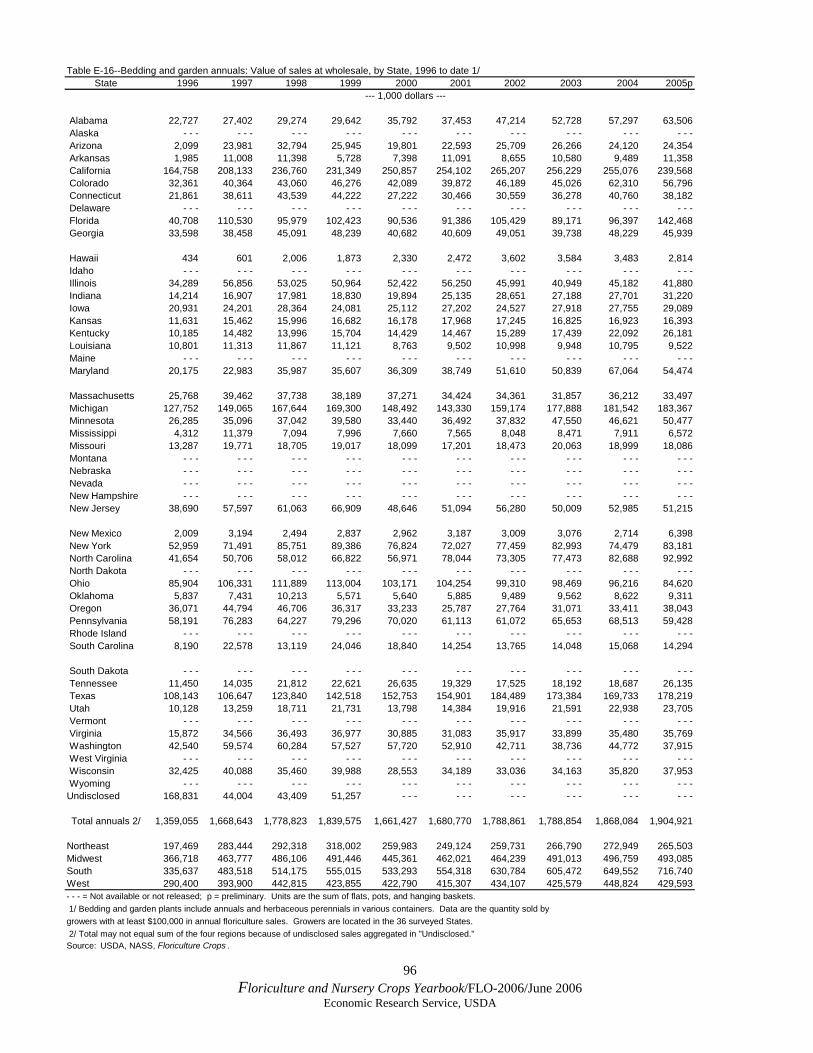
96 Floriculture and Nursery Crops Yearbook/FLO-2006/June 2006
Economic Research Service, USDA
Table E-16--Bedding and garden annuals: Value of sales at wholesale, by State, 1996 to date 1/State 1996 1997 1998 1999 2000 2001 2002 2003 2004 2005p
--- 1,000 dollars ---
Alabama 22,727 27,402 29,274 29,642 35,792 37,453 47,214 52,728 57,297 63,506 Alaska - - - - - - - - - - - - - - - - - - - - - - - - - - - - - - Arizona 2,099 23,981 32,794 25,945 19,801 22,593 25,709 26,266 24,120 24,354 Arkansas 1,985 11,008 11,398 5,728 7,398 11,091 8,655 10,580 9,489 11,358 California 164,758 208,133 236,760 231,349 250,857 254,102 265,207 256,229 255,076 239,568 Colorado 32,361 40,364 43,060 46,276 42,089 39,872 46,189 45,026 62,310 56,796 Connecticut 21,861 38,611 43,539 44,222 27,222 30,466 30,559 36,278 40,760 38,182 Delaware - - - - - - - - - - - - - - - - - - - - - - - - - - - - - - Florida 40,708 110,530 95,979 102,423 90,536 91,386 105,429 89,171 96,397 142,468 Georgia 33,598 38,458 45,091 48,239 40,682 40,609 49,051 39,738 48,229 45,939
Hawaii 434 601 2,006 1,873 2,330 2,472 3,602 3,584 3,483 2,814 Idaho - - - - - - - - - - - - - - - - - - - - - - - - - - - - - - Illinois 34,289 56,856 53,025 50,964 52,422 56,250 45,991 40,949 45,182 41,880 Indiana 14,214 16,907 17,981 18,830 19,894 25,135 28,651 27,188 27,701 31,220 Iowa 20,931 24,201 28,364 24,081 25,112 27,202 24,527 27,918 27,755 29,089 Kansas 11,631 15,462 15,996 16,682 16,178 17,968 17,245 16,825 16,923 16,393 Kentucky 10,185 14,482 13,996 15,704 14,429 14,467 15,289 17,439 22,092 26,181 Louisiana 10,801 11,313 11,867 11,121 8,763 9,502 10,998 9,948 10,795 9,522 Maine - - - - - - - - - - - - - - - - - - - - - - - - - - - - - - Maryland 20,175 22,983 35,987 35,607 36,309 38,749 51,610 50,839 67,064 54,474
Massachusetts 25,768 39,462 37,738 38,189 37,271 34,424 34,361 31,857 36,212 33,497 Michigan 127,752 149,065 167,644 169,300 148,492 143,330 159,174 177,888 181,542 183,367 Minnesota 26,285 35,096 37,042 39,580 33,440 36,492 37,832 47,550 46,621 50,477 Mississippi 4,312 11,379 7,094 7,996 7,660 7,565 8,048 8,471 7,911 6,572 Missouri 13,287 19,771 18,705 19,017 18,099 17,201 18,473 20,063 18,999 18,086 Montana - - - - - - - - - - - - - - - - - - - - - - - - - - - - - - Nebraska - - - - - - - - - - - - - - - - - - - - - - - - - - - - - - Nevada - - - - - - - - - - - - - - - - - - - - - - - - - - - - - - New Hampshire - - - - - - - - - - - - - - - - - - - - - - - - - - - - - - New Jersey 38,690 57,597 61,063 66,909 48,646 51,094 56,280 50,009 52,985 51,215
New Mexico 2,009 3,194 2,494 2,837 2,962 3,187 3,009 3,076 2,714 6,398 New York 52,959 71,491 85,751 89,386 76,824 72,027 77,459 82,993 74,479 83,181 North Carolina 41,654 50,706 58,012 66,822 56,971 78,044 73,305 77,473 82,688 92,992 North Dakota - - - - - - - - - - - - - - - - - - - - - - - - - - - - - - Ohio 85,904 106,331 111,889 113,004 103,171 104,254 99,310 98,469 96,216 84,620 Oklahoma 5,837 7,431 10,213 5,571 5,640 5,885 9,489 9,562 8,622 9,311 Oregon 36,071 44,794 46,706 36,317 33,233 25,787 27,764 31,071 33,411 38,043 Pennsylvania 58,191 76,283 64,227 79,296 70,020 61,113 61,072 65,653 68,513 59,428 Rhode Island - - - - - - - - - - - - - - - - - - - - - - - - - - - - - - South Carolina 8,190 22,578 13,119 24,046 18,840 14,254 13,765 14,048 15,068 14,294
South Dakota - - - - - - - - - - - - - - - - - - - - - - - - - - - - - - Tennessee 11,450 14,035 21,812 22,621 26,635 19,329 17,525 18,192 18,687 26,135 Texas 108,143 106,647 123,840 142,518 152,753 154,901 184,489 173,384 169,733 178,219 Utah 10,128 13,259 18,711 21,731 13,798 14,384 19,916 21,591 22,938 23,705 Vermont - - - - - - - - - - - - - - - - - - - - - - - - - - - - - - Virginia 15,872 34,566 36,493 36,977 30,885 31,083 35,917 33,899 35,480 35,769 Washington 42,540 59,574 60,284 57,527 57,720 52,910 42,711 38,736 44,772 37,915 West Virginia - - - - - - - - - - - - - - - - - - - - - - - - - - - - - - Wisconsin 32,425 40,088 35,460 39,988 28,553 34,189 33,036 34,163 35,820 37,953 Wyoming - - - - - - - - - - - - - - - - - - - - - - - - - - - - - -Undisclosed 168,831 44,004 43,409 51,257 - - - - - - - - - - - - - - - - - -
Total annuals 2/ 1,359,055 1,668,643 1,778,823 1,839,575 1,661,427 1,680,770 1,788,861 1,788,854 1,868,084 1,904,921
Northeast 197,469 283,444 292,318 318,002 259,983 249,124 259,731 266,790 272,949 265,503Midwest 366,718 463,777 486,106 491,446 445,361 462,021 464,239 491,013 496,759 493,085South 335,637 483,518 514,175 555,015 533,293 554,318 630,784 605,472 649,552 716,740West 290,400 393,900 442,815 423,855 422,790 415,307 434,107 425,579 448,824 429,593- - - = Not available or not released; p = preliminary. Units are the sum of flats, pots, and hanging baskets. 1/ Bedding and garden plants include annuals and herbaceous perennials in various containers. Data are the quantity sold bygrowers with at least $100,000 in annual floriculture sales. Growers are located in the 36 surveyed States. 2/ Total may not equal sum of the four regions because of undisclosed sales aggregated in "Undisclosed."Source: USDA, NASS, Floriculture Crops .
97 Floriculture and Nursery Crops Yearbook/FLO-2006/June 2006
Economic Research Service, USDA
Table E-17--Herbaceous perennials in pots: Value of sales at wholesale, by State, 1996 to date 1/State 1996 1997 1998 1999 2000 2001 2002 2003 2004 2005p
--- 1,000 dollars ---
Alabama 992 1,963 1,947 2,088 5,393 3,485 3,501 5,155 10,703 13,364 Alaska - - - - - - - - - - - - - - - - - - - - - - - - - - - - - - Arizona - - - - - - - - - - - - 173 1,003 922 1,046 1,103 1,092 Arkansas - - - 291 - - - 820 2,098 1,583 1,658 1,765 1,620 1,681 California 3,439 3,416 5,114 2,904 36,985 49,006 54,397 60,980 81,371 79,663 Colorado 847 1,016 1,086 930 10,537 8,335 10,075 12,244 15,481 12,858 Connecticut 2,427 2,389 2,563 2,932 25,455 26,486 30,937 24,095 25,702 24,873 Delaware - - - - - - - - - - - - - - - - - - - - - - - - - - - - - - Florida 1,325 2,239 2,435 2,983 13,277 14,917 19,965 22,342 22,389 32,829 Georgia 1,247 1,099 1,400 1,472 9,996 8,523 7,293 7,459 8,902 8,742
Hawaii - - - - - - - - - - - - 73 54 242 - - - - - - - - - Idaho - - - - - - - - - - - - - - - - - - - - - - - - - - - - - - Illinois 2,886 3,135 3,789 3,435 20,432 19,249 25,875 28,981 37,826 40,098 Indiana 1,385 2,103 1,557 2,841 5,679 5,335 7,365 8,796 9,205 8,988 Iowa 781 934 1,433 1,176 5,087 6,751 6,674 7,584 8,246 6,878 Kansas 752 998 1,123 1,006 3,904 3,656 3,465 3,880 3,905 3,344 Kentucky - - - 1,343 1,081 1,016 4,146 4,799 4,813 5,134 5,828 6,350 Louisiana 701 668 689 513 1,427 2,380 2,763 1,384 1,190 1,153 Maine - - - - - - - - - - - - - - - - - - - - - - - - - - - - - - Maryland 1,267 1,683 1,895 1,919 7,491 7,982 16,553 18,034 18,233 17,333
Massachusetts 3,421 2,278 2,159 2,778 8,404 10,385 12,183 11,059 12,262 12,489 Michigan 3,498 4,812 4,571 6,688 40,156 44,886 58,599 52,434 56,966 53,498 Minnesota 1,235 1,303 1,333 1,436 12,579 9,899 12,613 14,394 13,124 17,602 Mississippi 514 671 408 333 771 1,760 1,290 0 0 0 Missouri 1,518 1,800 1,909 1,452 3,133 7,870 8,192 4,124 4,201 4,595 Montana - - - - - - - - - - - - - - - - - - - - - - - - - - - - - - Nebraska - - - - - - - - - - - - - - - - - - - - - - - - - - - - - - Nevada - - - - - - - - - - - - - - - - - - - - - - - - - - - - - - New Hampshire - - - - - - - - - - - - - - - - - - - - - - - - - - - - - - New Jersey 3,772 4,217 5,023 6,989 27,102 23,896 34,573 35,196 36,196 38,779
New Mexico 142 119 231 55 1,551 2,038 1,927 2,035 1,973 3,107 New York 4,456 5,471 6,518 8,142 20,741 25,340 21,797 24,517 26,588 27,420 North Carolina 3,879 5,872 9,150 10,085 20,549 23,709 22,634 22,611 23,770 28,309 North Dakota - - - - - - - - - - - - - - - - - - - - - - - - - - - - - - Ohio 4,258 5,373 6,786 5,452 25,528 31,483 37,435 33,842 38,725 37,304 Oklahoma 461 273 391 432 1,038 5,557 18,897 17,062 17,132 16,606 Oregon 1,224 1,192 1,154 844 5,836 9,688 9,216 12,911 14,203 14,752 Pennsylvania 4,657 5,277 6,187 6,008 12,390 16,133 17,011 19,606 16,861 19,177 Rhode Island - - - - - - - - - - - - - - - - - - - - - - - - - - - - - - South Carolina 1,287 1,634 847 1,334 43,542 53,399 65,787 72,402 73,169 63,195
South Dakota - - - - - - - - - - - - - - - - - - - - - - - - - - - - - - Tennessee - - - 3,340 3,527 2,548 6,337 4,937 6,105 6,177 4,352 10,457 Texas 5,320 5,036 9,753 14,950 18,876 23,985 32,192 33,151 25,709 27,121 Utah 273 219 248 224 3,422 3,676 4,479 4,669 5,411 5,922 Vermont - - - - - - - - - - - - - - - - - - - - - - - - - - - - - - Virginia - - - 2,721 2,882 4,336 17,186 16,259 18,429 18,013 19,229 19,248 W ashington 1,778 1,942 1,906 1,651 4,035 5,172 16,559 21,429 25,210 26,133 W est Virginia - - - - - - - - - - - - - - - - - - - - - - - - - - - - - - W isconsin 1,697 1,341 1,658 1,587 8,664 12,116 15,672 18,712 19,598 22,080 W yoming - - - - - - - - - - - - - - - - - - - - - - - - - - - - - -Undisclosed 7,639 148 1,034 205 - - - - - - - - - 1,649 1,195 1,265
Total perennials 69,078 78,316 93,787 103,564 433,993 495,732 612,088 634,872 687,578 708,3052/
Northeast 18,733 19,632 22,450 26,849 94,092 102,240 116,501 114,473 117,609 122,738Midwest 18,010 21,799 24,159 25,073 125,162 141,245 175,890 172,747 191,796 194,387South 16,993 28,833 36,405 44,829 152,127 173,275 221,880 230,689 232,226 246,388W est 7,703 7,904 9,739 6,608 62,612 78,972 97,817 115,314 144,752 143,527- - - = Not available or not released; p = preliminary.1/ Includes growers with at least $100,000 in annual floriculture sales. Growers are located in the 36 surveyed States.2/ Includes only hardy/garden chrysanthemums through 1999.Source: USDA, NASS, Floriculture Crops .
98 Floriculture and Nursery Crops Yearbook/FLO-2006/June 2006
Economic Research Service, USDA
Table E-18--Propagative material: Value of sales at wholesale, by floriculture sector, 1996 to date 1/Potted Bedding Potted Cut Total Imports of
Year Cut flowering and garden Herbaceous foliage cultivated propagative unrootedflowers plants annuals perennials plants greens material cuttings 2/
-- 1,000 dollars --
1996 - - - - - - - - - - - - - - - - - - - - - 22,1291997 - - - - - - - - - - - - - - - - - - - - - 23,6701998 - - - - - - - - - - - - - - - - - - - - - 28,1441999 - - - - - - - - - - - - - - - - - - - - - 29,9232000 5,713 41,067 134,182 28,769 32,592 315 242,638 36,7102001 7,029 62,774 170,428 45,206 28,134 351 313,922 45,4492002 7,190 72,276 162,414 66,422 37,256 313 345,871 50,5052003 7,674 51,572 200,851 64,990 42,742 142 367,971 53,5992004 6,628 57,487 219,898 95,422 48,974 131 428,540 55,269
2005p 4,732 61,017 214,332 112,808 45,815 131 438,845 60,136
- - - = Not available; p = preliminary.
1/ Includes only growers with at least $100,000 in annual floriculture sales; 36 surveyed States. Includes liners, plug seedlings, tissue cultured plantlets,
prefinished plants, and unfinished plants sold to other growers for further growing-on. Excludes seeds, bulbs, tubers, rhizomes, corms, and finished plants
sold to others. Survey data for propagative floriculture material started in 2000.
2/ Includes slips of plants; HS code 0602100000. Souce: U.S. Census Bureau.Source: USDA, NASS, Floriculture Crops .
Table E-19--Propagative material: Number of growers, by floriculture sector, 2000 to date 1/Potted Bedding Potted Cut
Year Cut flowering and garden Herbaceous foliage cultivatedflowers plants annuals perennials plants greens
-- Number --
2000 18 161 223 96 74 62001 21 205 235 108 79 92002 21 216 263 147 81 122003 18 195 252 152 85 52004 18 179 268 134 91 3
2005p 15 170 242 128 69 4p = preliminary.1/ Includes only growers with at least $100,000 in annual floriculture sales; 36 surveyed States.Source: USDA, NASS, Floriculture Crops .
99 Floriculture and Nursery Crops Yearbook/FLO-2006/June 2006
Economic Research Service, USDA
Table E-20--Propagative material: Average sales per grower, by floriculture sector, 2000 to date 1/Potted Bedding Potted Cut
Year Cut flowering and garden Herbaceous foliage cultivatedflowers plants annuals perennials plants greens
-- Dollars --
2000 317,389 255,075 601,713 299,677 440,432 52,5002001 334,714 306,215 725,226 418,574 356,127 39,0002002 342,381 334,611 617,544 451,850 459,951 26,0832003 426,333 264,472 797,028 427,566 502,847 28,4002004 368,222 321,156 820,515 712,104 538,176 43,667
2005p 315,467 358,924 885,669 881,313 663,986 32,750p = preliminary.1/ Includes only growers with at least $100,000 in annual floriculture sales; 36 surveyed States.Source: USDA, NASS, Floriculture Crops .
100 Floriculture and Nursery Crops Yearbook/FLO-2006/June 2006
Economic Research Service, USDA
Table E-21--Propagative material: Value of sales at wholesale, by State, 2000 to date 1/State 2000 2001 2002 2003 2004 2005p
Northeast: Connecticut - - - 1,048 424 - - - 504 - - - Massachusetts 2,092 2,100 4,663 4,148 - - - 4,386 New Jersey - - - 11,520 13,147 - - - 11,001 11,191 New York 11,852 5,993 5,363 8,972 8,244 11,530 Pennsylvania 15,386 31,122 29,748 24,598 24,356 23,871Midwest: Illinois 3,301 2,777 6,386 5,431 3,560 6,203 Indiana 1,999 3,111 3,284 2,431 2,395 3,076 Iowa - - - - - - - - - - - - - - - 4,101 Kansas 92 226 - - - - - - - - - 209 Michigan 22,717 33,845 45,764 48,086 82,452 82,619 Minnesota - - - - - - - - - - - - 4,698 - - - Missouri - - - - - - - - - - - - - - - - - - Ohio 4,693 4,970 5,414 17,902 18,234 11,331 Wisconsin - - - - - - 2,874 3,585 2,783 1,925South: Alabama - - - - - - - - - - - - - - - - - - Arkansas - - - - - - - - - - - - - - - - - - Florida 50,873 72,806 81,599 81,798 88,069 95,940 Georgia 5,666 4,148 3,485 6,333 - - - - - - Kentucky - - - - - - - - - - - - - - - 304 Louisiana - - - 1,519 1,674 - - - - - - - - - Maryland 1,939 - - - - - - 4,778 5,250 4,794 Mississippi - - - - - - - - - - - - - - - - - - North Carolina 2,687 2,821 2,912 2,162 2,369 - - - Oklahoma - - - - - - - - - - - - - - - - - - South Carolina - - - - - - - - - - - - - - - - - - Tennessee - - - - - - - - - - - - - - - - - - Texas 6,644 12,837 9,884 7,490 6,990 6,920 Virginia - - - - - - - - - - - - - - - - - -West: Arizona - - - - - - - - - 380 180 - - - California 60,118 68,781 61,052 73,090 81,613 67,113 Colorado - - - - - - - - - - - - - - - - - - Hawaii 2,592 2,679 3,697 4,387 2,912 3,341 New Mexico - - - - - - - - - - - - - - - - - - Oregon 3,199 - - - 9,872 4,230 9,538 9,519 Utah - - - - - - - - - 3,171 - - - - - - Washington 4,353 5,163 11,820 15,536 16,679 19,578Undisclosed 42,435 46,456 42,809 49,463 56,713 70,894
Total 242,638 313,922 345,871 367,971 428,540 438,845- - - = Not available; p = preliminary.1/ Includes only growers with at least $100,000 in annual floriculture sales; 36 surveyed States. Includes liners, plug seedlings, tissue cultured plantlets, prefinished plants, and unfinished plants sold to other growers for further growing-on. Excludes seeds, bulbs, tubers, rhizomes, corms, and finished plants sold to others. Survey data for propagative floriculture material started in 2000.Source: USDA, NASS, Floriculture Crops .

101 Floriculture and Nursery Crops Yearbook/FLO-2006/June 2006
Economic Research Service, USDA
Table F-1--Floriculture and nursery products: Value of U.S. imports and exports, 1976 to date-- Imports -- 1/ -- Exports -- 4/
Cut flowers Cut flower Nursery Nursery Total Total F/N Total F/N Total N/G exportsCut as percent imports stock, stock as floriculture as percent as percent nursery and as percent
Year flowers of total F/N per U.S. bulbs, percent of and nursery of U.S. G/N of total U.S. greenhouse of total G/Nimports household etc. 2/ F/N imports stock (F/N) receipts 3/ ag. imports exports (N/G) receipts
1,000 dollars Percent Dollars 1,000 dollars Percent 1,000 dollars Percent Percent 1,000 dollars Percent
1976 25,356 38 0.35 41,179 62 66,535 3.3 0.6 33,681 1.71977 38,310 45 0.52 46,480 55 84,790 3.8 0.6 41,823 1.91978 57,640 53 0.76 52,132 47 109,772 4.2 0.7 48,398 1.81979 77,471 56 1.00 60,661 44 138,132 4.6 0.8 51,457 1.7
1980 88,581 56 1.10 69,490 44 158,071 4.6 0.9 61,649 1.81981 102,805 60 1.25 67,833 40 170,638 4.7 1.0 72,464 2.01982 130,231 65 1.57 69,881 35 200,112 5.0 1.3 70,848 1.81983 163,033 69 1.95 73,811 31 236,844 5.2 1.4 71,755 1.61984 214,200 69 2.51 94,946 31 309,145 6.0 1.6 63,495 1.21985 220,870 68 2.55 104,020 32 324,891 5.9 1.6 55,265 1.01986 234,895 66 2.68 123,151 34 358,046 6.0 1.7 62,470 1.01987 243,609 65 2.74 132,256 35 375,865 5.6 1.8 67,171 1.01988 283,505 66 3.14 145,663 34 429,169 5.9 2.0 83,797 1.11989 315,654 62 3.45 195,749 38 511,403 6.5 2.3 119,942 1.5
1990 326,246 61 3.55 211,506 39 537,751 6.1 2.3 203,964 2.31991 322,016 59 3.46 224,801 41 546,817 6.0 2.4 215,765 2.41992 352,366 58 3.72 251,570 42 603,936 6.3 2.4 221,500 2.31993 382,182 58 4.01 271,860 42 654,042 6.6 2.6 241,543 2.51994 420,104 59 4.38 292,294 41 712,398 6.9 2.6 252,214 2.51995 511,524 60 5.25 347,306 40 858,830 8.0 2.8 241,012 2.21996 572,550 60 5.80 379,408 40 951,958 8.4 2.8 242,459 2.11997 595,045 59 5.96 408,748 41 1,003,793 8.1 2.8 282,770 2.31998 614,362 57 6.08 466,102 43 1,080,464 8.6 2.9 305,841 2.41999 592,366 54 5.74 508,559 46 1,100,924 8.4 2.9 299,330 2.3
2000 610,461 53 5.79 549,375 47 1,159,835 8.4 3.0 278,838 2.02001 565,468 49 5.29 585,587 51 1,151,055 8.0 2.9 264,233 1.82002 541,655 48 5.01 591,344 52 1,132,999 7.5 2.7 249,942 1.62003 610,943 49 5.61 638,871 51 1,249,814 8.0 2.6 272,055 1.72004 705,854 51 6.42 673,792 49 1,379,646 9.3 2.6 294,248 2.02005 p 709,149 51 6.39 677,604 49 1,386,754 9.1 2.3 312,372 2.1
p = Preliminary.1/ F/N = imports of floriculture and nursery products, which include cut flowers.2/ Ornamental imports except cut flowers, including flowering bulbs and tubers (HS 601), live plants and trees, cuttings and slips of plants (HS 602), and foliage, grasses, and fresh Christmas trees (HS 604).3/ G/N = greenhouse and nursery crops, including vegetables, vegetable transplants, sod, floriculture crops, etc. from Table A-1.4/ N/G = exports of nursery and greenhouse products, which include floriculture crops.Sources: FATUS , USDA; U.S. Census Bureau, www.FAS.USDA.gov/ustrade.
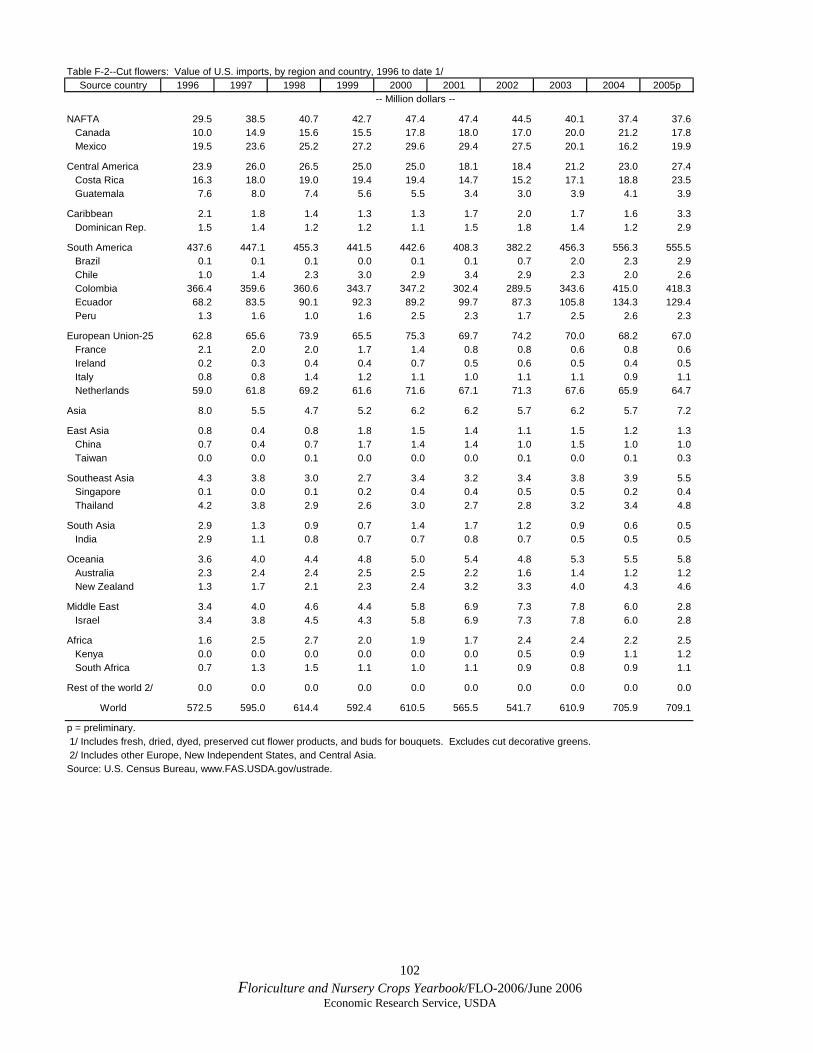
102 Floriculture and Nursery Crops Yearbook/FLO-2006/June 2006
Economic Research Service, USDA
Table F-2--Cut flowers: Value of U.S. imports, by region and country, 1996 to date 1/Source country 1996 1997 1998 1999 2000 2001 2002 2003 2004 2005p
-- Million dollars --
NAFTA 29.5 38.5 40.7 42.7 47.4 47.4 44.5 40.1 37.4 37.6 Canada 10.0 14.9 15.6 15.5 17.8 18.0 17.0 20.0 21.2 17.8 Mexico 19.5 23.6 25.2 27.2 29.6 29.4 27.5 20.1 16.2 19.9
Central America 23.9 26.0 26.5 25.0 25.0 18.1 18.4 21.2 23.0 27.4 Costa Rica 16.3 18.0 19.0 19.4 19.4 14.7 15.2 17.1 18.8 23.5 Guatemala 7.6 8.0 7.4 5.6 5.5 3.4 3.0 3.9 4.1 3.9
Caribbean 2.1 1.8 1.4 1.3 1.3 1.7 2.0 1.7 1.6 3.3 Dominican Rep. 1.5 1.4 1.2 1.2 1.1 1.5 1.8 1.4 1.2 2.9
South America 437.6 447.1 455.3 441.5 442.6 408.3 382.2 456.3 556.3 555.5 Brazil 0.1 0.1 0.1 0.0 0.1 0.1 0.7 2.0 2.3 2.9 Chile 1.0 1.4 2.3 3.0 2.9 3.4 2.9 2.3 2.0 2.6 Colombia 366.4 359.6 360.6 343.7 347.2 302.4 289.5 343.6 415.0 418.3 Ecuador 68.2 83.5 90.1 92.3 89.2 99.7 87.3 105.8 134.3 129.4 Peru 1.3 1.6 1.0 1.6 2.5 2.3 1.7 2.5 2.6 2.3
European Union-25 62.8 65.6 73.9 65.5 75.3 69.7 74.2 70.0 68.2 67.0 France 2.1 2.0 2.0 1.7 1.4 0.8 0.8 0.6 0.8 0.6 Ireland 0.2 0.3 0.4 0.4 0.7 0.5 0.6 0.5 0.4 0.5 Italy 0.8 0.8 1.4 1.2 1.1 1.0 1.1 1.1 0.9 1.1 Netherlands 59.0 61.8 69.2 61.6 71.6 67.1 71.3 67.6 65.9 64.7
Asia 8.0 5.5 4.7 5.2 6.2 6.2 5.7 6.2 5.7 7.2
East Asia 0.8 0.4 0.8 1.8 1.5 1.4 1.1 1.5 1.2 1.3 China 0.7 0.4 0.7 1.7 1.4 1.4 1.0 1.5 1.0 1.0 Taiwan 0.0 0.0 0.1 0.0 0.0 0.0 0.1 0.0 0.1 0.3
Southeast Asia 4.3 3.8 3.0 2.7 3.4 3.2 3.4 3.8 3.9 5.5 Singapore 0.1 0.0 0.1 0.2 0.4 0.4 0.5 0.5 0.2 0.4 Thailand 4.2 3.8 2.9 2.6 3.0 2.7 2.8 3.2 3.4 4.8
South Asia 2.9 1.3 0.9 0.7 1.4 1.7 1.2 0.9 0.6 0.5 India 2.9 1.1 0.8 0.7 0.7 0.8 0.7 0.5 0.5 0.5
Oceania 3.6 4.0 4.4 4.8 5.0 5.4 4.8 5.3 5.5 5.8 Australia 2.3 2.4 2.4 2.5 2.5 2.2 1.6 1.4 1.2 1.2 New Zealand 1.3 1.7 2.1 2.3 2.4 3.2 3.3 4.0 4.3 4.6
Middle East 3.4 4.0 4.6 4.4 5.8 6.9 7.3 7.8 6.0 2.8 Israel 3.4 3.8 4.5 4.3 5.8 6.9 7.3 7.8 6.0 2.8
Africa 1.6 2.5 2.7 2.0 1.9 1.7 2.4 2.4 2.2 2.5 Kenya 0.0 0.0 0.0 0.0 0.0 0.0 0.5 0.9 1.1 1.2 South Africa 0.7 1.3 1.5 1.1 1.0 1.1 0.9 0.8 0.9 1.1
Rest of the world 2/ 0.0 0.0 0.0 0.0 0.0 0.0 0.0 0.0 0.0 0.0
World 572.5 595.0 614.4 592.4 610.5 565.5 541.7 610.9 705.9 709.1
p = preliminary. 1/ Includes fresh, dried, dyed, preserved cut flower products, and buds for bouquets. Excludes cut decorative greens. 2/ Includes other Europe, New Independent States, and Central Asia.Source: U.S. Census Bureau, www.FAS.USDA.gov/ustrade.

103 Floriculture and Nursery Crops Yearbook/FLO-2006/June 2006
Economic Research Service, USDA
Table F-3--Nursery stock: Value of U.S. imports, by region and country, 1996 to date 1/Source country 1996 1997 1998 1999 2000 2001 2002 2003 2004 2005p
-- Million dollars --
NAFTA 155.3 185.2 226.5 248.0 280.9 309.2 314.0 326.4 331.4 305.7 Canada 145.7 174.1 213.8 234.4 264.9 292.9 298.3 309.7 312.5 286.2 Mexico 9.6 11.2 12.7 13.7 16.1 16.3 15.7 16.7 19.0 19.4
Central America 21.3 21.5 24.6 28.1 33.7 37.7 40.5 47.6 50.2 56.0 Costa Rica 12.8 13.3 14.9 16.9 20.5 21.3 23.0 28.1 31.8 36.0 Guatemala 6.2 6.5 8.3 9.9 11.6 14.5 15.9 17.6 16.4 18.1 Honduras 1.1 0.7 0.7 0.6 0.7 0.9 1.0 1.1 1.3 1.6
Caribbean 1.4 1.4 1.6 2.3 1.4 0.8 0.7 0.9 1.2 0.8
South America 2.2 2.4 3.8 5.0 5.3 7.8 8.2 9.5 14.4 18.6 Argentina 0.0 - - - 0.0 0.1 0.1 0.0 - - - - - - 1.5 3.3 Brazil 0.5 0.4 0.5 0.7 0.7 0.9 0.9 1.7 2.2 3.3 Chile 0.3 0.5 1.1 2.5 2.6 2.7 2.9 3.1 3.9 4.8 Colombia 1.2 1.3 2.0 1.5 1.8 3.9 3.9 3.9 6.1 6.4
European Union 167.2 164.7 175.1 187.6 178.7 176.0 168.9 183.6 204.6 208.6 Belgium 1.5 2.2 1.9 1.9 2.0 2.0 2.0 2.7 3.1 3.9 Denmark 0.4 0.3 0.4 0.6 0.5 0.7 1.0 1.6 1.2 1.1 France 1.3 2.0 1.8 2.5 2.8 2.8 2.4 2.3 2.1 1.4 Italy 3.8 4.9 5.6 6.4 5.7 7.4 7.6 7.7 8.4 9.9 Netherlands 153.9 148.3 157.6 167.8 158.6 157.1 150.8 164.0 184.0 185.2 Poland 0.1 0.0 0.1 0.3 0.4 0.4 0.7 0.7 0.9 1.1 United Kingdom 4.4 5.2 5.6 6.3 7.2 4.6 3.5 3.7 4.0 4.2
Asia 18.2 19.6 20.7 21.9 30.6 36.8 40.6 50.7 46.7 53.5
East Asia 10.8 10.8 11.6 13.9 19.4 24.1 27.7 31.7 32.0 36.2 China 5.9 4.2 2.9 3.5 5.5 8.3 11.7 13.6 14.1 16.3 Japan 1.2 1.4 1.2 1.3 1.6 1.4 1.4 1.5 1.6 1.3 South Korea 0.9 0.7 0.9 0.6 1.0 1.9 1.4 2.6 2.0 3.3 Taiwan 2.6 4.4 6.4 8.2 11.1 12.3 12.9 13.9 14.1 15.2
Southeast Asia 4.4 4.4 4.1 4.9 6.7 8.8 7.9 9.4 6.3 7.8 Philippines 1.7 1.7 1.8 1.9 2.8 2.0 1.9 2.1 1.8 2.1 Thailand 1.6 1.8 1.4 1.8 2.9 5.4 4.7 6.1 3.6 4.1
South Asia 3.0 4.4 5.1 3.2 4.5 3.9 5.0 9.5 8.4 9.5 India 3.0 4.3 5.0 3.1 4.5 3.9 4.9 9.3 8.2 9.2
Oceania 1.4 1.6 1.5 1.9 2.8 3.1 3.4 5.5 7.9 9.7 Australia 0.6 0.6 0.4 0.5 0.6 0.6 0.8 0.6 1.0 0.8 New Zealand 0.8 0.9 1.0 1.4 2.1 2.4 2.5 4.7 6.8 8.7
Middle East 7.6 8.1 8.0 9.2 10.8 9.6 9.8 9.9 11.7 19.4 Israel 7.5 7.9 7.9 9.1 10.6 9.4 9.6 9.6 11.4 19.0
Africa 4.7 3.9 4.2 4.3 4.9 4.2 4.9 4.7 5.6 5.2 Kenya 0.1 0.1 0.2 0.4 0.7 0.4 0.8 0.7 0.5 0.5 Madagascar 2.4 1.6 1.3 1.1 1.0 0.9 0.9 0.6 0.8 0.7 South Africa 2.0 2.1 2.4 2.5 2.8 2.6 3.1 3.1 3.9 3.6
Rest of the world 2/ 0.1 0.2 0.2 0.3 0.2 0.3 0.3 0.1 0.1 0.2
World 379.4 408.7 466.1 508.6 549.4 585.6 591.3 638.9 673.8 677.6
p = preliminary; - - - = not available.1/ Includes all greenhouse products, cut decorative greens, live plants, eules, etc., except cut flowers.2/ Includes other Europe, New Independent States, and Central Asia.Source: U.S. Census Bureau, www.FAS.USDA.gov/ustrade.
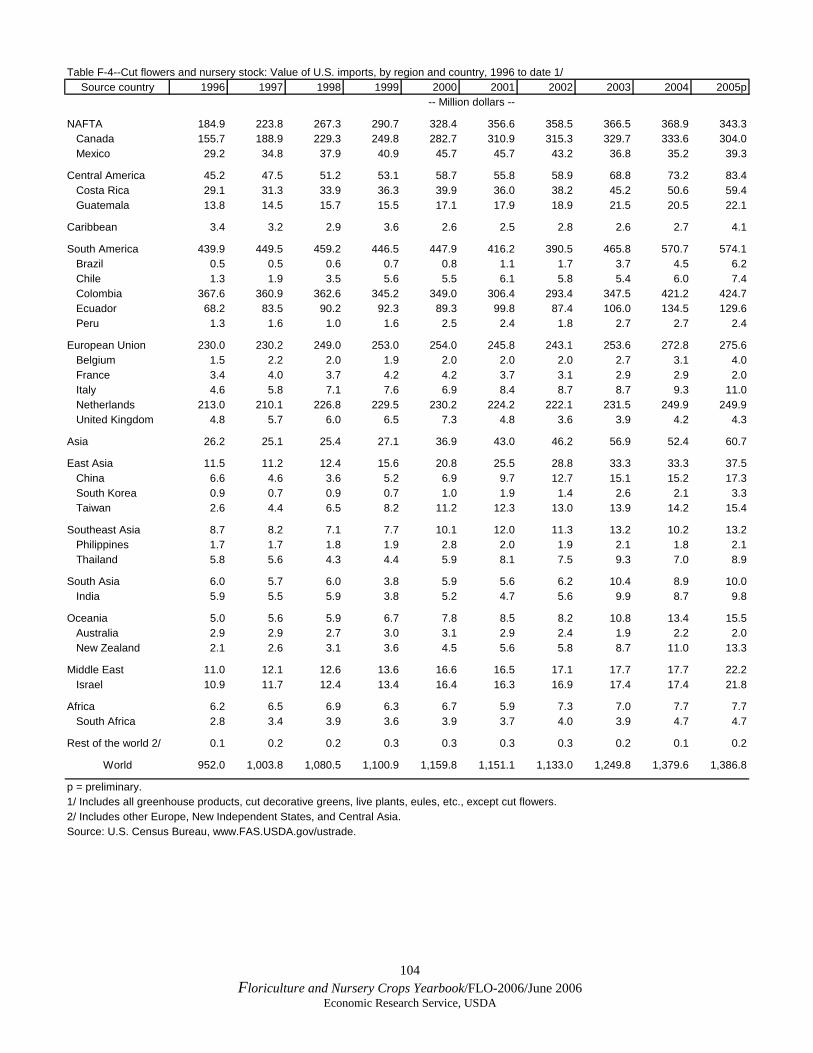
104 Floriculture and Nursery Crops Yearbook/FLO-2006/June 2006
Economic Research Service, USDA
Table F-4--Cut flowers and nursery stock: Value of U.S. imports, by region and country, 1996 to date 1/Source country 1996 1997 1998 1999 2000 2001 2002 2003 2004 2005p
-- Million dollars --
NAFTA 184.9 223.8 267.3 290.7 328.4 356.6 358.5 366.5 368.9 343.3 Canada 155.7 188.9 229.3 249.8 282.7 310.9 315.3 329.7 333.6 304.0 Mexico 29.2 34.8 37.9 40.9 45.7 45.7 43.2 36.8 35.2 39.3
Central America 45.2 47.5 51.2 53.1 58.7 55.8 58.9 68.8 73.2 83.4 Costa Rica 29.1 31.3 33.9 36.3 39.9 36.0 38.2 45.2 50.6 59.4 Guatemala 13.8 14.5 15.7 15.5 17.1 17.9 18.9 21.5 20.5 22.1
Caribbean 3.4 3.2 2.9 3.6 2.6 2.5 2.8 2.6 2.7 4.1
South America 439.9 449.5 459.2 446.5 447.9 416.2 390.5 465.8 570.7 574.1 Brazil 0.5 0.5 0.6 0.7 0.8 1.1 1.7 3.7 4.5 6.2 Chile 1.3 1.9 3.5 5.6 5.5 6.1 5.8 5.4 6.0 7.4 Colombia 367.6 360.9 362.6 345.2 349.0 306.4 293.4 347.5 421.2 424.7 Ecuador 68.2 83.5 90.2 92.3 89.3 99.8 87.4 106.0 134.5 129.6 Peru 1.3 1.6 1.0 1.6 2.5 2.4 1.8 2.7 2.7 2.4
European Union 230.0 230.2 249.0 253.0 254.0 245.8 243.1 253.6 272.8 275.6 Belgium 1.5 2.2 2.0 1.9 2.0 2.0 2.0 2.7 3.1 4.0 France 3.4 4.0 3.7 4.2 4.2 3.7 3.1 2.9 2.9 2.0 Italy 4.6 5.8 7.1 7.6 6.9 8.4 8.7 8.7 9.3 11.0 Netherlands 213.0 210.1 226.8 229.5 230.2 224.2 222.1 231.5 249.9 249.9 United Kingdom 4.8 5.7 6.0 6.5 7.3 4.8 3.6 3.9 4.2 4.3
Asia 26.2 25.1 25.4 27.1 36.9 43.0 46.2 56.9 52.4 60.7
East Asia 11.5 11.2 12.4 15.6 20.8 25.5 28.8 33.3 33.3 37.5 China 6.6 4.6 3.6 5.2 6.9 9.7 12.7 15.1 15.2 17.3 South Korea 0.9 0.7 0.9 0.7 1.0 1.9 1.4 2.6 2.1 3.3 Taiwan 2.6 4.4 6.5 8.2 11.2 12.3 13.0 13.9 14.2 15.4
Southeast Asia 8.7 8.2 7.1 7.7 10.1 12.0 11.3 13.2 10.2 13.2 Philippines 1.7 1.7 1.8 1.9 2.8 2.0 1.9 2.1 1.8 2.1 Thailand 5.8 5.6 4.3 4.4 5.9 8.1 7.5 9.3 7.0 8.9
South Asia 6.0 5.7 6.0 3.8 5.9 5.6 6.2 10.4 8.9 10.0 India 5.9 5.5 5.9 3.8 5.2 4.7 5.6 9.9 8.7 9.8
Oceania 5.0 5.6 5.9 6.7 7.8 8.5 8.2 10.8 13.4 15.5 Australia 2.9 2.9 2.7 3.0 3.1 2.9 2.4 1.9 2.2 2.0 New Zealand 2.1 2.6 3.1 3.6 4.5 5.6 5.8 8.7 11.0 13.3
Middle East 11.0 12.1 12.6 13.6 16.6 16.5 17.1 17.7 17.7 22.2 Israel 10.9 11.7 12.4 13.4 16.4 16.3 16.9 17.4 17.4 21.8
Africa 6.2 6.5 6.9 6.3 6.7 5.9 7.3 7.0 7.7 7.7 South Africa 2.8 3.4 3.9 3.6 3.9 3.7 4.0 3.9 4.7 4.7
Rest of the world 2/ 0.1 0.2 0.2 0.3 0.3 0.3 0.3 0.2 0.1 0.2
World 952.0 1,003.8 1,080.5 1,100.9 1,159.8 1,151.1 1,133.0 1,249.8 1,379.6 1,386.8
p = preliminary.1/ Includes all greenhouse products, cut decorative greens, live plants, eules, etc., except cut flowers.2/ Includes other Europe, New Independent States, and Central Asia.Source: U.S. Census Bureau, www.FAS.USDA.gov/ustrade.
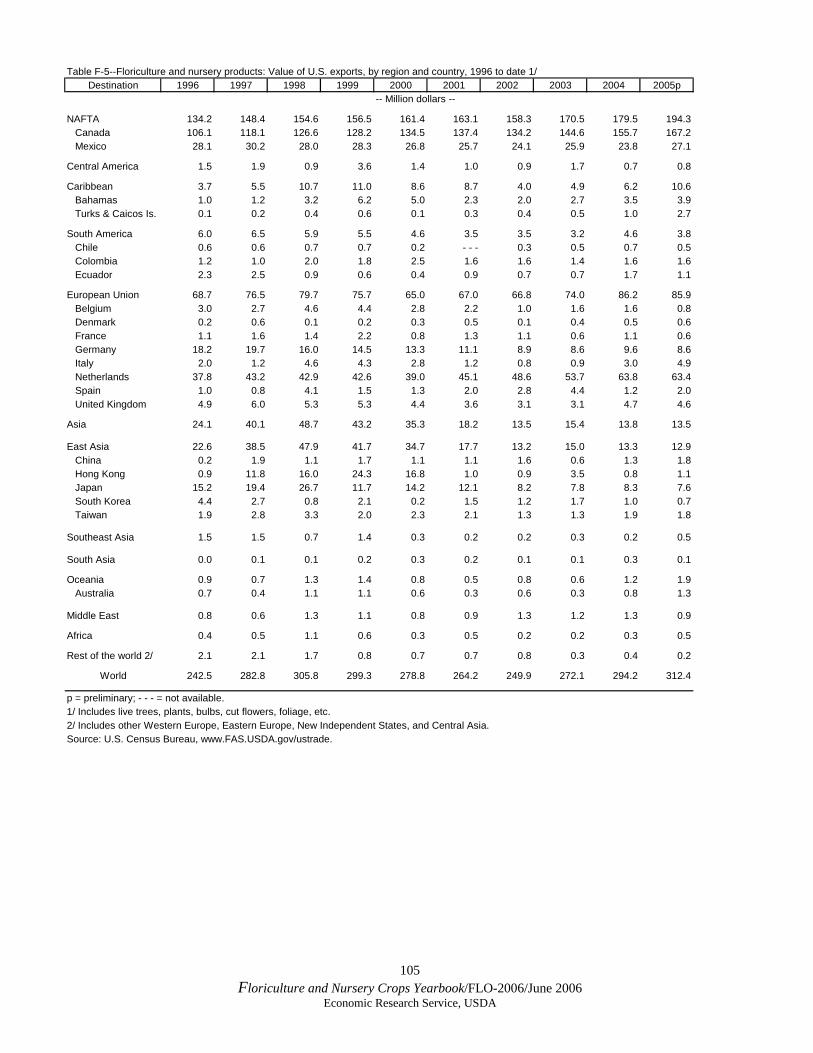
105 Floriculture and Nursery Crops Yearbook/FLO-2006/June 2006
Economic Research Service, USDA
Table F-5--Floriculture and nursery products: Value of U.S. exports, by region and country, 1996 to date 1/Destination 1996 1997 1998 1999 2000 2001 2002 2003 2004 2005p
-- Million dollars --
NAFTA 134.2 148.4 154.6 156.5 161.4 163.1 158.3 170.5 179.5 194.3 Canada 106.1 118.1 126.6 128.2 134.5 137.4 134.2 144.6 155.7 167.2 Mexico 28.1 30.2 28.0 28.3 26.8 25.7 24.1 25.9 23.8 27.1
Central America 1.5 1.9 0.9 3.6 1.4 1.0 0.9 1.7 0.7 0.8
Caribbean 3.7 5.5 10.7 11.0 8.6 8.7 4.0 4.9 6.2 10.6 Bahamas 1.0 1.2 3.2 6.2 5.0 2.3 2.0 2.7 3.5 3.9 Turks & Caicos Is. 0.1 0.2 0.4 0.6 0.1 0.3 0.4 0.5 1.0 2.7
South America 6.0 6.5 5.9 5.5 4.6 3.5 3.5 3.2 4.6 3.8 Chile 0.6 0.6 0.7 0.7 0.2 - - - 0.3 0.5 0.7 0.5 Colombia 1.2 1.0 2.0 1.8 2.5 1.6 1.6 1.4 1.6 1.6 Ecuador 2.3 2.5 0.9 0.6 0.4 0.9 0.7 0.7 1.7 1.1
European Union 68.7 76.5 79.7 75.7 65.0 67.0 66.8 74.0 86.2 85.9 Belgium 3.0 2.7 4.6 4.4 2.8 2.2 1.0 1.6 1.6 0.8 Denmark 0.2 0.6 0.1 0.2 0.3 0.5 0.1 0.4 0.5 0.6 France 1.1 1.6 1.4 2.2 0.8 1.3 1.1 0.6 1.1 0.6 Germany 18.2 19.7 16.0 14.5 13.3 11.1 8.9 8.6 9.6 8.6 Italy 2.0 1.2 4.6 4.3 2.8 1.2 0.8 0.9 3.0 4.9 Netherlands 37.8 43.2 42.9 42.6 39.0 45.1 48.6 53.7 63.8 63.4 Spain 1.0 0.8 4.1 1.5 1.3 2.0 2.8 4.4 1.2 2.0 United Kingdom 4.9 6.0 5.3 5.3 4.4 3.6 3.1 3.1 4.7 4.6
Asia 24.1 40.1 48.7 43.2 35.3 18.2 13.5 15.4 13.8 13.5
East Asia 22.6 38.5 47.9 41.7 34.7 17.7 13.2 15.0 13.3 12.9 China 0.2 1.9 1.1 1.7 1.1 1.1 1.6 0.6 1.3 1.8 Hong Kong 0.9 11.8 16.0 24.3 16.8 1.0 0.9 3.5 0.8 1.1 Japan 15.2 19.4 26.7 11.7 14.2 12.1 8.2 7.8 8.3 7.6 South Korea 4.4 2.7 0.8 2.1 0.2 1.5 1.2 1.7 1.0 0.7 Taiwan 1.9 2.8 3.3 2.0 2.3 2.1 1.3 1.3 1.9 1.8
Southeast Asia 1.5 1.5 0.7 1.4 0.3 0.2 0.2 0.3 0.2 0.5
South Asia 0.0 0.1 0.1 0.2 0.3 0.2 0.1 0.1 0.3 0.1
Oceania 0.9 0.7 1.3 1.4 0.8 0.5 0.8 0.6 1.2 1.9 Australia 0.7 0.4 1.1 1.1 0.6 0.3 0.6 0.3 0.8 1.3
Middle East 0.8 0.6 1.3 1.1 0.8 0.9 1.3 1.2 1.3 0.9
Africa 0.4 0.5 1.1 0.6 0.3 0.5 0.2 0.2 0.3 0.5
Rest of the world 2/ 2.1 2.1 1.7 0.8 0.7 0.7 0.8 0.3 0.4 0.2
World 242.5 282.8 305.8 299.3 278.8 264.2 249.9 272.1 294.2 312.4
p = preliminary; - - - = not available.1/ Includes live trees, plants, bulbs, cut flowers, foliage, etc.2/ Includes other Western Europe, Eastern Europe, New Independent States, and Central Asia.Source: U.S. Census Bureau, www.FAS.USDA.gov/ustrade.
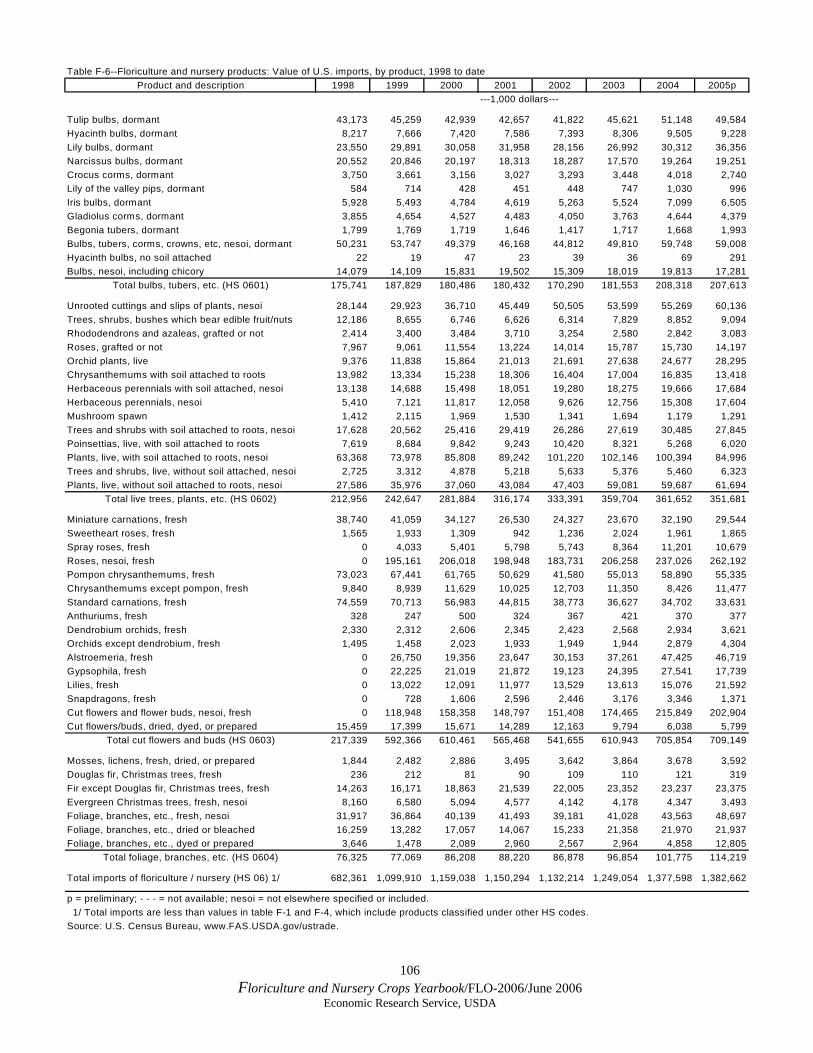
106 Floriculture and Nursery Crops Yearbook/FLO-2006/June 2006
Economic Research Service, USDA
Table F-6--Floriculture and nursery products: Value of U.S. imports, by product, 1998 to dateProduct and description 1998 1999 2000 2001 2002 2003 2004 2005p
---1,000 dollars---
Tulip bulbs, dormant 43,173 45,259 42,939 42,657 41,822 45,621 51,148 49,584Hyacinth bulbs, dormant 8,217 7,666 7,420 7,586 7,393 8,306 9,505 9,228Lily bulbs, dormant 23,550 29,891 30,058 31,958 28,156 26,992 30,312 36,356Narcissus bulbs, dormant 20,552 20,846 20,197 18,313 18,287 17,570 19,264 19,251Crocus corms, dormant 3,750 3,661 3,156 3,027 3,293 3,448 4,018 2,740Lily of the valley pips, dormant 584 714 428 451 448 747 1,030 996Iris bulbs, dormant 5,928 5,493 4,784 4,619 5,263 5,524 7,099 6,505Gladiolus corms, dormant 3,855 4,654 4,527 4,483 4,050 3,763 4,644 4,379Begonia tubers, dormant 1,799 1,769 1,719 1,646 1,417 1,717 1,668 1,993Bulbs, tubers, corms, crowns, etc, nesoi, dormant 50,231 53,747 49,379 46,168 44,812 49,810 59,748 59,008Hyacinth bulbs, no soil attached 22 19 47 23 39 36 69 291Bulbs, nesoi, including chicory 14,079 14,109 15,831 19,502 15,309 18,019 19,813 17,281
Total bulbs, tubers, etc. (HS 0601) 175,741 187,829 180,486 180,432 170,290 181,553 208,318 207,613
Unrooted cuttings and slips of plants, nesoi 28,144 29,923 36,710 45,449 50,505 53,599 55,269 60,136Trees, shrubs, bushes which bear edible fruit/nuts 12,186 8,655 6,746 6,626 6,314 7,829 8,852 9,094Rhododendrons and azaleas, grafted or not 2,414 3,400 3,484 3,710 3,254 2,580 2,842 3,083Roses, grafted or not 7,967 9,061 11,554 13,224 14,014 15,787 15,730 14,197Orchid plants, live 9,376 11,838 15,864 21,013 21,691 27,638 24,677 28,295Chrysanthemums with soil attached to roots 13,982 13,334 15,238 18,306 16,404 17,004 16,835 13,418Herbaceous perennials with soil attached, nesoi 13,138 14,688 15,498 18,051 19,280 18,275 19,666 17,684Herbaceous perennials, nesoi 5,410 7,121 11,817 12,058 9,626 12,756 15,308 17,604Mushroom spawn 1,412 2,115 1,969 1,530 1,341 1,694 1,179 1,291Trees and shrubs with soil attached to roots, nesoi 17,628 20,562 25,416 29,419 26,286 27,619 30,485 27,845Poinsettias, live, with soil attached to roots 7,619 8,684 9,842 9,243 10,420 8,321 5,268 6,020Plants, live, with soil attached to roots, nesoi 63,368 73,978 85,808 89,242 101,220 102,146 100,394 84,996Trees and shrubs, live, without soil attached, nesoi 2,725 3,312 4,878 5,218 5,633 5,376 5,460 6,323Plants, live, without soil attached to roots, nesoi 27,586 35,976 37,060 43,084 47,403 59,081 59,687 61,694
Total live trees, plants, etc. (HS 0602) 212,956 242,647 281,884 316,174 333,391 359,704 361,652 351,681
Miniature carnations, fresh 38,740 41,059 34,127 26,530 24,327 23,670 32,190 29,544Sweetheart roses, fresh 1,565 1,933 1,309 942 1,236 2,024 1,961 1,865Spray roses, fresh 0 4,033 5,401 5,798 5,743 8,364 11,201 10,679Roses, nesoi, fresh 0 195,161 206,018 198,948 183,731 206,258 237,026 262,192Pompon chrysanthemums, fresh 73,023 67,441 61,765 50,629 41,580 55,013 58,890 55,335Chrysanthemums except pompon, fresh 9,840 8,939 11,629 10,025 12,703 11,350 8,426 11,477Standard carnations, fresh 74,559 70,713 56,983 44,815 38,773 36,627 34,702 33,631Anthuriums, fresh 328 247 500 324 367 421 370 377Dendrobium orchids, fresh 2,330 2,312 2,606 2,345 2,423 2,568 2,934 3,621Orchids except dendrobium, fresh 1,495 1,458 2,023 1,933 1,949 1,944 2,879 4,304Alstroemeria, fresh 0 26,750 19,356 23,647 30,153 37,261 47,425 46,719Gypsophila, fresh 0 22,225 21,019 21,872 19,123 24,395 27,541 17,739Lilies, fresh 0 13,022 12,091 11,977 13,529 13,613 15,076 21,592Snapdragons, fresh 0 728 1,606 2,596 2,446 3,176 3,346 1,371Cut flowers and flower buds, nesoi, fresh 0 118,948 158,358 148,797 151,408 174,465 215,849 202,904Cut flowers/buds, dried, dyed, or prepared 15,459 17,399 15,671 14,289 12,163 9,794 6,038 5,799
Total cut flowers and buds (HS 0603) 217,339 592,366 610,461 565,468 541,655 610,943 705,854 709,149
Mosses, lichens, fresh, dried, or prepared 1,844 2,482 2,886 3,495 3,642 3,864 3,678 3,592Douglas fir, Christmas trees, fresh 236 212 81 90 109 110 121 319Fir except Douglas fir, Christmas trees, fresh 14,263 16,171 18,863 21,539 22,005 23,352 23,237 23,375Evergreen Christmas trees, fresh, nesoi 8,160 6,580 5,094 4,577 4,142 4,178 4,347 3,493Foliage, branches, etc., fresh, nesoi 31,917 36,864 40,139 41,493 39,181 41,028 43,563 48,697Foliage, branches, etc., dried or bleached 16,259 13,282 17,057 14,067 15,233 21,358 21,970 21,937Foliage, branches, etc., dyed or prepared 3,646 1,478 2,089 2,960 2,567 2,964 4,858 12,805
Total foliage, branches, etc. (HS 0604) 76,325 77,069 86,208 88,220 86,878 96,854 101,775 114,219
Total imports of floriculture / nursery (HS 06) 1/ 682,361 1,099,910 1,159,038 1,150,294 1,132,214 1,249,054 1,377,598 1,382,662
p = preliminary; - - - = not available; nesoi = not elsewhere specified or included. 1/ Total imports are less than values in table F-1 and F-4, which include products classified under other HS codes.Source: U.S. Census Bureau, www.FAS.USDA.gov/ustrade.
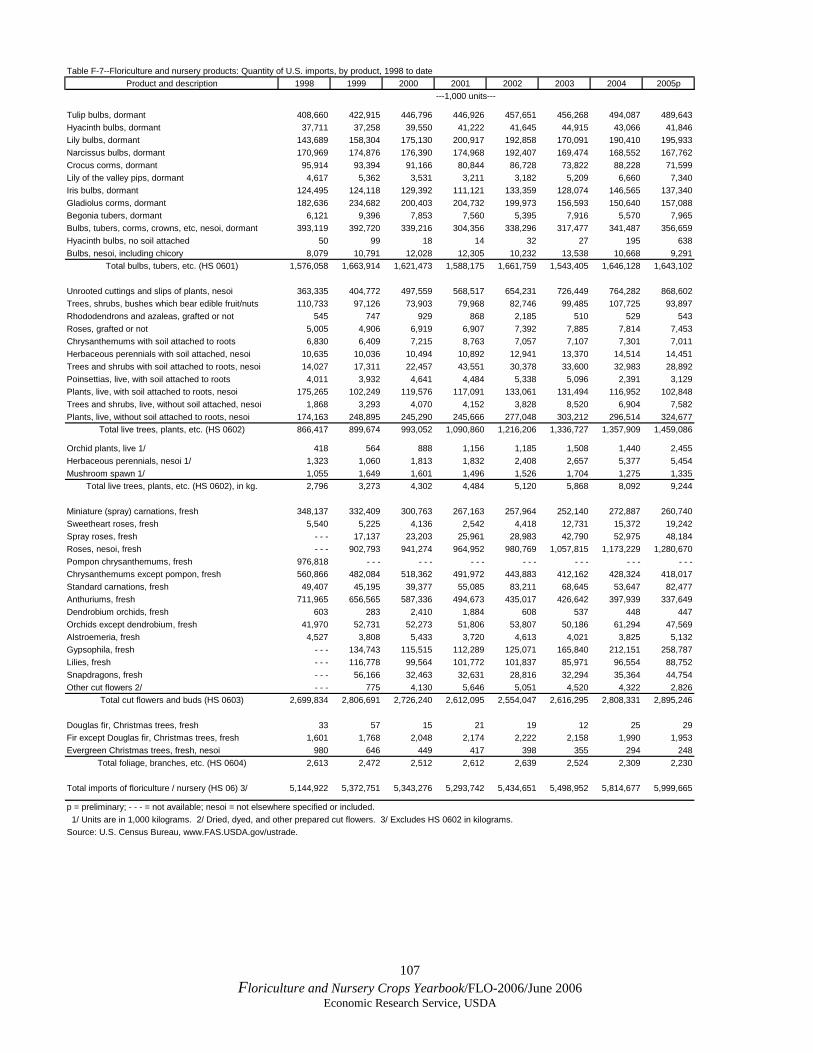
107 Floriculture and Nursery Crops Yearbook/FLO-2006/June 2006
Economic Research Service, USDA
Table F-7--Floriculture and nursery products: Quantity of U.S. imports, by product, 1998 to dateProduct and description 1998 1999 2000 2001 2002 2003 2004 2005p
---1,000 units---
Tulip bulbs, dormant 408,660 422,915 446,796 446,926 457,651 456,268 494,087 489,643Hyacinth bulbs, dormant 37,711 37,258 39,550 41,222 41,645 44,915 43,066 41,846Lily bulbs, dormant 143,689 158,304 175,130 200,917 192,858 170,091 190,410 195,933Narcissus bulbs, dormant 170,969 174,876 176,390 174,968 192,407 169,474 168,552 167,762Crocus corms, dormant 95,914 93,394 91,166 80,844 86,728 73,822 88,228 71,599Lily of the valley pips, dormant 4,617 5,362 3,531 3,211 3,182 5,209 6,660 7,340Iris bulbs, dormant 124,495 124,118 129,392 111,121 133,359 128,074 146,565 137,340Gladiolus corms, dormant 182,636 234,682 200,403 204,732 199,973 156,593 150,640 157,088Begonia tubers, dormant 6,121 9,396 7,853 7,560 5,395 7,916 5,570 7,965Bulbs, tubers, corms, crowns, etc, nesoi, dormant 393,119 392,720 339,216 304,356 338,296 317,477 341,487 356,659Hyacinth bulbs, no soil attached 50 99 18 14 32 27 195 638Bulbs, nesoi, including chicory 8,079 10,791 12,028 12,305 10,232 13,538 10,668 9,291
Total bulbs, tubers, etc. (HS 0601) 1,576,058 1,663,914 1,621,473 1,588,175 1,661,759 1,543,405 1,646,128 1,643,102
Unrooted cuttings and slips of plants, nesoi 363,335 404,772 497,559 568,517 654,231 726,449 764,282 868,602Trees, shrubs, bushes which bear edible fruit/nuts 110,733 97,126 73,903 79,968 82,746 99,485 107,725 93,897Rhododendrons and azaleas, grafted or not 545 747 929 868 2,185 510 529 543Roses, grafted or not 5,005 4,906 6,919 6,907 7,392 7,885 7,814 7,453Chrysanthemums with soil attached to roots 6,830 6,409 7,215 8,763 7,057 7,107 7,301 7,011Herbaceous perennials with soil attached, nesoi 10,635 10,036 10,494 10,892 12,941 13,370 14,514 14,451Trees and shrubs with soil attached to roots, nesoi 14,027 17,311 22,457 43,551 30,378 33,600 32,983 28,892Poinsettias, live, with soil attached to roots 4,011 3,932 4,641 4,484 5,338 5,096 2,391 3,129Plants, live, with soil attached to roots, nesoi 175,265 102,249 119,576 117,091 133,061 131,494 116,952 102,848Trees and shrubs, live, without soil attached, nesoi 1,868 3,293 4,070 4,152 3,828 8,520 6,904 7,582Plants, live, without soil attached to roots, nesoi 174,163 248,895 245,290 245,666 277,048 303,212 296,514 324,677
Total live trees, plants, etc. (HS 0602) 866,417 899,674 993,052 1,090,860 1,216,206 1,336,727 1,357,909 1,459,086
Orchid plants, live 1/ 418 564 888 1,156 1,185 1,508 1,440 2,455Herbaceous perennials, nesoi 1/ 1,323 1,060 1,813 1,832 2,408 2,657 5,377 5,454Mushroom spawn 1/ 1,055 1,649 1,601 1,496 1,526 1,704 1,275 1,335
Total live trees, plants, etc. (HS 0602), in kg. 2,796 3,273 4,302 4,484 5,120 5,868 8,092 9,244
Miniature (spray) carnations, fresh 348,137 332,409 300,763 267,163 257,964 252,140 272,887 260,740Sweetheart roses, fresh 5,540 5,225 4,136 2,542 4,418 12,731 15,372 19,242Spray roses, fresh - - - 17,137 23,203 25,961 28,983 42,790 52,975 48,184Roses, nesoi, fresh - - - 902,793 941,274 964,952 980,769 1,057,815 1,173,229 1,280,670Pompon chrysanthemums, fresh 976,818 - - - - - - - - - - - - - - - - - - - - -Chrysanthemums except pompon, fresh 560,866 482,084 518,362 491,972 443,883 412,162 428,324 418,017Standard carnations, fresh 49,407 45,195 39,377 55,085 83,211 68,645 53,647 82,477Anthuriums, fresh 711,965 656,565 587,336 494,673 435,017 426,642 397,939 337,649Dendrobium orchids, fresh 603 283 2,410 1,884 608 537 448 447Orchids except dendrobium, fresh 41,970 52,731 52,273 51,806 53,807 50,186 61,294 47,569Alstroemeria, fresh 4,527 3,808 5,433 3,720 4,613 4,021 3,825 5,132Gypsophila, fresh - - - 134,743 115,515 112,289 125,071 165,840 212,151 258,787Lilies, fresh - - - 116,778 99,564 101,772 101,837 85,971 96,554 88,752Snapdragons, fresh - - - 56,166 32,463 32,631 28,816 32,294 35,364 44,754Other cut flowers 2/ - - - 775 4,130 5,646 5,051 4,520 4,322 2,826
Total cut flowers and buds (HS 0603) 2,699,834 2,806,691 2,726,240 2,612,095 2,554,047 2,616,295 2,808,331 2,895,246
Douglas fir, Christmas trees, fresh 33 57 15 21 19 12 25 29Fir except Douglas fir, Christmas trees, fresh 1,601 1,768 2,048 2,174 2,222 2,158 1,990 1,953Evergreen Christmas trees, fresh, nesoi 980 646 449 417 398 355 294 248
Total foliage, branches, etc. (HS 0604) 2,613 2,472 2,512 2,612 2,639 2,524 2,309 2,230
Total imports of floriculture / nursery (HS 06) 3/ 5,144,922 5,372,751 5,343,276 5,293,742 5,434,651 5,498,952 5,814,677 5,999,665
p = preliminary; - - - = not available; nesoi = not elsewhere specified or included. 1/ Units are in 1,000 kilograms. 2/ Dried, dyed, and other prepared cut flowers. 3/ Excludes HS 0602 in kilograms.Source: U.S. Census Bureau, www.FAS.USDA.gov/ustrade.
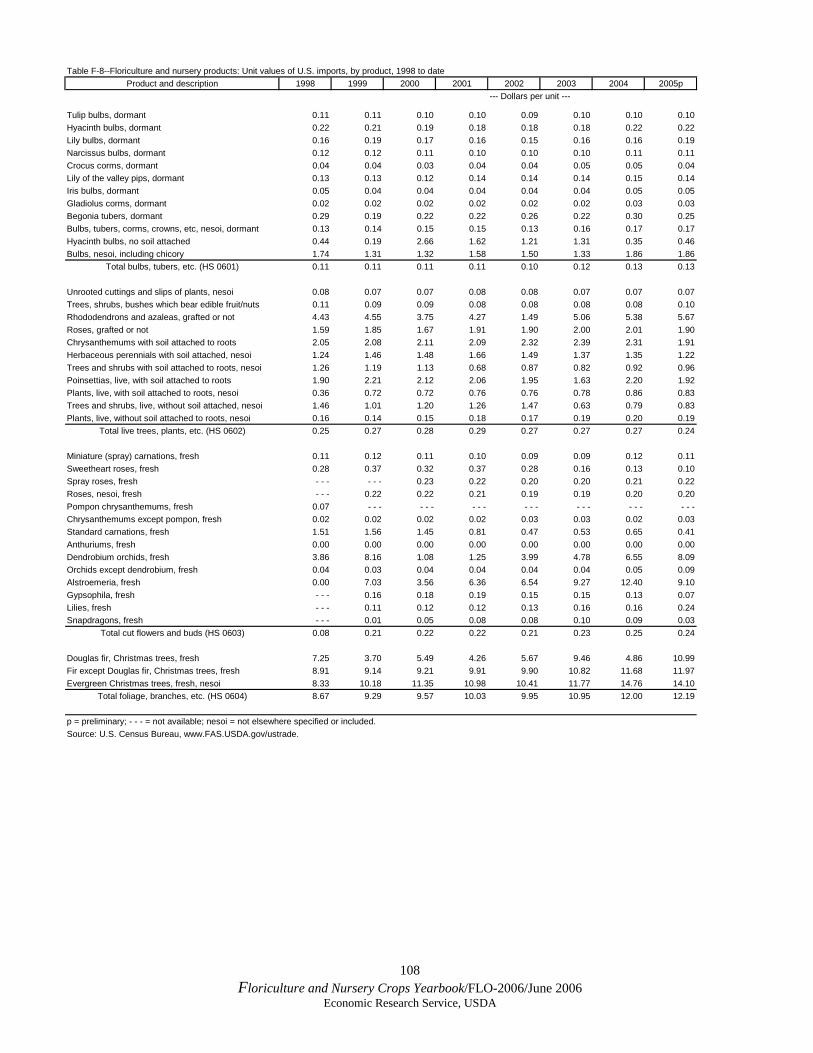
108 Floriculture and Nursery Crops Yearbook/FLO-2006/June 2006
Economic Research Service, USDA
Table F-8--Floriculture and nursery products: Unit values of U.S. imports, by product, 1998 to dateProduct and description 1998 1999 2000 2001 2002 2003 2004 2005p
--- Dollars per unit ---
Tulip bulbs, dormant 0.11 0.11 0.10 0.10 0.09 0.10 0.10 0.10Hyacinth bulbs, dormant 0.22 0.21 0.19 0.18 0.18 0.18 0.22 0.22Lily bulbs, dormant 0.16 0.19 0.17 0.16 0.15 0.16 0.16 0.19Narcissus bulbs, dormant 0.12 0.12 0.11 0.10 0.10 0.10 0.11 0.11Crocus corms, dormant 0.04 0.04 0.03 0.04 0.04 0.05 0.05 0.04Lily of the valley pips, dormant 0.13 0.13 0.12 0.14 0.14 0.14 0.15 0.14Iris bulbs, dormant 0.05 0.04 0.04 0.04 0.04 0.04 0.05 0.05Gladiolus corms, dormant 0.02 0.02 0.02 0.02 0.02 0.02 0.03 0.03Begonia tubers, dormant 0.29 0.19 0.22 0.22 0.26 0.22 0.30 0.25Bulbs, tubers, corms, crowns, etc, nesoi, dormant 0.13 0.14 0.15 0.15 0.13 0.16 0.17 0.17Hyacinth bulbs, no soil attached 0.44 0.19 2.66 1.62 1.21 1.31 0.35 0.46Bulbs, nesoi, including chicory 1.74 1.31 1.32 1.58 1.50 1.33 1.86 1.86
Total bulbs, tubers, etc. (HS 0601) 0.11 0.11 0.11 0.11 0.10 0.12 0.13 0.13
Unrooted cuttings and slips of plants, nesoi 0.08 0.07 0.07 0.08 0.08 0.07 0.07 0.07Trees, shrubs, bushes which bear edible fruit/nuts 0.11 0.09 0.09 0.08 0.08 0.08 0.08 0.10Rhododendrons and azaleas, grafted or not 4.43 4.55 3.75 4.27 1.49 5.06 5.38 5.67Roses, grafted or not 1.59 1.85 1.67 1.91 1.90 2.00 2.01 1.90Chrysanthemums with soil attached to roots 2.05 2.08 2.11 2.09 2.32 2.39 2.31 1.91Herbaceous perennials with soil attached, nesoi 1.24 1.46 1.48 1.66 1.49 1.37 1.35 1.22Trees and shrubs with soil attached to roots, nesoi 1.26 1.19 1.13 0.68 0.87 0.82 0.92 0.96Poinsettias, live, with soil attached to roots 1.90 2.21 2.12 2.06 1.95 1.63 2.20 1.92Plants, live, with soil attached to roots, nesoi 0.36 0.72 0.72 0.76 0.76 0.78 0.86 0.83Trees and shrubs, live, without soil attached, nesoi 1.46 1.01 1.20 1.26 1.47 0.63 0.79 0.83Plants, live, without soil attached to roots, nesoi 0.16 0.14 0.15 0.18 0.17 0.19 0.20 0.19
Total live trees, plants, etc. (HS 0602) 0.25 0.27 0.28 0.29 0.27 0.27 0.27 0.24
Miniature (spray) carnations, fresh 0.11 0.12 0.11 0.10 0.09 0.09 0.12 0.11Sweetheart roses, fresh 0.28 0.37 0.32 0.37 0.28 0.16 0.13 0.10Spray roses, fresh - - - - - - 0.23 0.22 0.20 0.20 0.21 0.22Roses, nesoi, fresh - - - 0.22 0.22 0.21 0.19 0.19 0.20 0.20Pompon chrysanthemums, fresh 0.07 - - - - - - - - - - - - - - - - - - - - -Chrysanthemums except pompon, fresh 0.02 0.02 0.02 0.02 0.03 0.03 0.02 0.03Standard carnations, fresh 1.51 1.56 1.45 0.81 0.47 0.53 0.65 0.41Anthuriums, fresh 0.00 0.00 0.00 0.00 0.00 0.00 0.00 0.00Dendrobium orchids, fresh 3.86 8.16 1.08 1.25 3.99 4.78 6.55 8.09Orchids except dendrobium, fresh 0.04 0.03 0.04 0.04 0.04 0.04 0.05 0.09Alstroemeria, fresh 0.00 7.03 3.56 6.36 6.54 9.27 12.40 9.10Gypsophila, fresh - - - 0.16 0.18 0.19 0.15 0.15 0.13 0.07Lilies, fresh - - - 0.11 0.12 0.12 0.13 0.16 0.16 0.24Snapdragons, fresh - - - 0.01 0.05 0.08 0.08 0.10 0.09 0.03
Total cut flowers and buds (HS 0603) 0.08 0.21 0.22 0.22 0.21 0.23 0.25 0.24
Douglas fir, Christmas trees, fresh 7.25 3.70 5.49 4.26 5.67 9.46 4.86 10.99Fir except Douglas fir, Christmas trees, fresh 8.91 9.14 9.21 9.91 9.90 10.82 11.68 11.97Evergreen Christmas trees, fresh, nesoi 8.33 10.18 11.35 10.98 10.41 11.77 14.76 14.10
Total foliage, branches, etc. (HS 0604) 8.67 9.29 9.57 10.03 9.95 10.95 12.00 12.19
p = preliminary; - - - = not available; nesoi = not elsewhere specified or included.Source: U.S. Census Bureau, www.FAS.USDA.gov/ustrade.
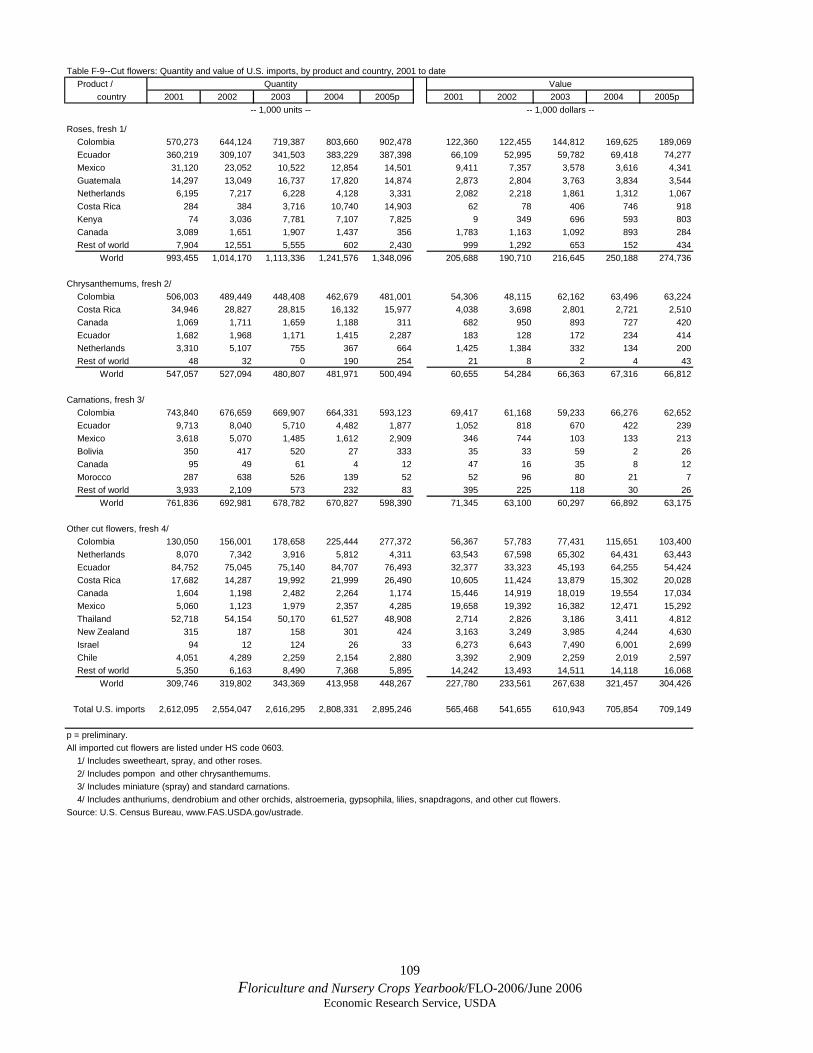
109 Floriculture and Nursery Crops Yearbook/FLO-2006/June 2006
Economic Research Service, USDA
Table F-9--Cut flowers: Quantity and value of U.S. imports, by product and country, 2001 to dateProduct / Quantity Value
country 2001 2002 2003 2004 2005p 2001 2002 2003 2004 2005p-- 1,000 units -- -- 1,000 dollars --
Roses, fresh 1/Colombia 570,273 644,124 719,387 803,660 902,478 122,360 122,455 144,812 169,625 189,069Ecuador 360,219 309,107 341,503 383,229 387,398 66,109 52,995 59,782 69,418 74,277Mexico 31,120 23,052 10,522 12,854 14,501 9,411 7,357 3,578 3,616 4,341Guatemala 14,297 13,049 16,737 17,820 14,874 2,873 2,804 3,763 3,834 3,544Netherlands 6,195 7,217 6,228 4,128 3,331 2,082 2,218 1,861 1,312 1,067Costa Rica 284 384 3,716 10,740 14,903 62 78 406 746 918Kenya 74 3,036 7,781 7,107 7,825 9 349 696 593 803Canada 3,089 1,651 1,907 1,437 356 1,783 1,163 1,092 893 284Rest of world 7,904 12,551 5,555 602 2,430 999 1,292 653 152 434
World 993,455 1,014,170 1,113,336 1,241,576 1,348,096 205,688 190,710 216,645 250,188 274,736
Chrysanthemums, fresh 2/Colombia 506,003 489,449 448,408 462,679 481,001 54,306 48,115 62,162 63,496 63,224Costa Rica 34,946 28,827 28,815 16,132 15,977 4,038 3,698 2,801 2,721 2,510Canada 1,069 1,711 1,659 1,188 311 682 950 893 727 420Ecuador 1,682 1,968 1,171 1,415 2,287 183 128 172 234 414Netherlands 3,310 5,107 755 367 664 1,425 1,384 332 134 200Rest of world 48 32 0 190 254 21 8 2 4 43
World 547,057 527,094 480,807 481,971 500,494 60,655 54,284 66,363 67,316 66,812
Carnations, fresh 3/Colombia 743,840 676,659 669,907 664,331 593,123 69,417 61,168 59,233 66,276 62,652Ecuador 9,713 8,040 5,710 4,482 1,877 1,052 818 670 422 239Mexico 3,618 5,070 1,485 1,612 2,909 346 744 103 133 213Bolivia 350 417 520 27 333 35 33 59 2 26Canada 95 49 61 4 12 47 16 35 8 12Morocco 287 638 526 139 52 52 96 80 21 7Rest of world 3,933 2,109 573 232 83 395 225 118 30 26
World 761,836 692,981 678,782 670,827 598,390 71,345 63,100 60,297 66,892 63,175
Other cut flowers, fresh 4/Colombia 130,050 156,001 178,658 225,444 277,372 56,367 57,783 77,431 115,651 103,400Netherlands 8,070 7,342 3,916 5,812 4,311 63,543 67,598 65,302 64,431 63,443Ecuador 84,752 75,045 75,140 84,707 76,493 32,377 33,323 45,193 64,255 54,424Costa Rica 17,682 14,287 19,992 21,999 26,490 10,605 11,424 13,879 15,302 20,028Canada 1,604 1,198 2,482 2,264 1,174 15,446 14,919 18,019 19,554 17,034Mexico 5,060 1,123 1,979 2,357 4,285 19,658 19,392 16,382 12,471 15,292Thailand 52,718 54,154 50,170 61,527 48,908 2,714 2,826 3,186 3,411 4,812New Zealand 315 187 158 301 424 3,163 3,249 3,985 4,244 4,630Israel 94 12 124 26 33 6,273 6,643 7,490 6,001 2,699Chile 4,051 4,289 2,259 2,154 2,880 3,392 2,909 2,259 2,019 2,597Rest of world 5,350 6,163 8,490 7,368 5,895 14,242 13,493 14,511 14,118 16,068
World 309,746 319,802 343,369 413,958 448,267 227,780 233,561 267,638 321,457 304,426
Total U.S. imports 2,612,095 2,554,047 2,616,295 2,808,331 2,895,246 565,468 541,655 610,943 705,854 709,149
p = preliminary.All imported cut flowers are listed under HS code 0603.
1/ Includes sweetheart, spray, and other roses.2/ Includes pompon and other chrysanthemums.3/ Includes miniature (spray) and standard carnations.4/ Includes anthuriums, dendrobium and other orchids, alstroemeria, gypsophila, lilies, snapdragons, and other cut flowers.
Source: U.S. Census Bureau, www.FAS.USDA.gov/ustrade.
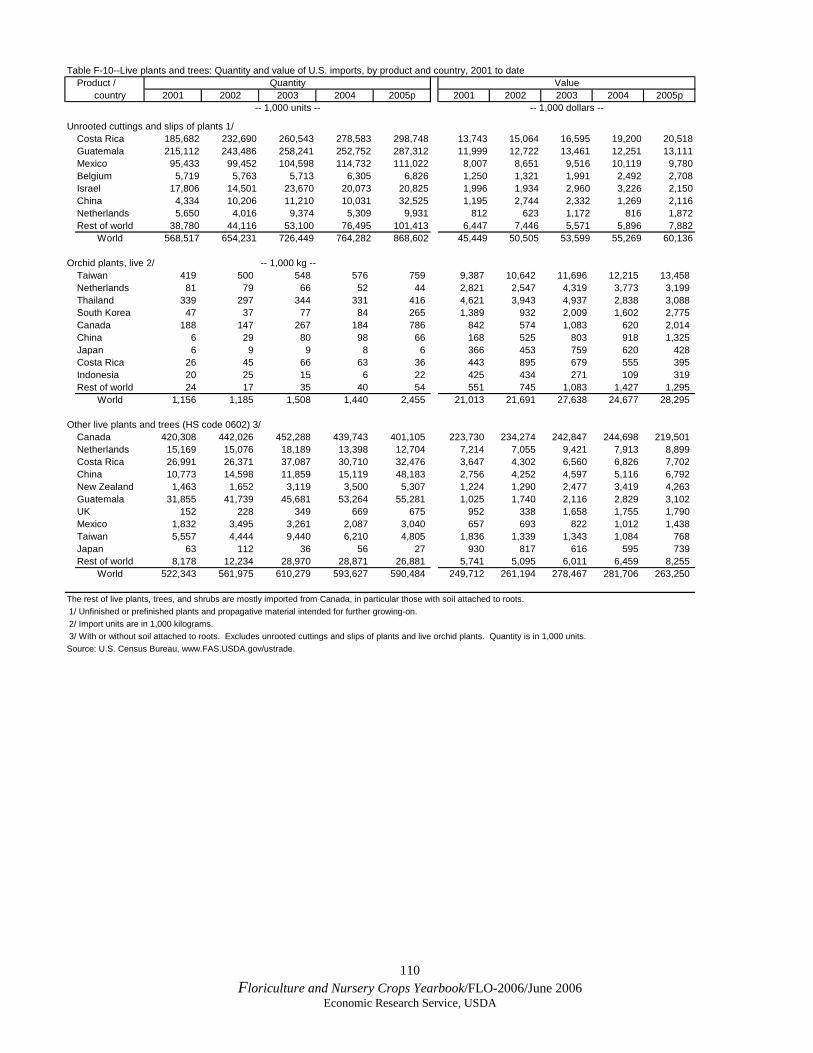
110 Floriculture and Nursery Crops Yearbook/FLO-2006/June 2006
Economic Research Service, USDA
Table F-10--Live plants and trees: Quantity and value of U.S. imports, by product and country, 2001 to dateProduct / Quantity Value
country 2001 2002 2003 2004 2005p 2001 2002 2003 2004 2005p-- 1,000 units -- -- 1,000 dollars --
Unrooted cuttings and slips of plants 1/Costa Rica 185,682 232,690 260,543 278,583 298,748 13,743 15,064 16,595 19,200 20,518Guatemala 215,112 243,486 258,241 252,752 287,312 11,999 12,722 13,461 12,251 13,111Mexico 95,433 99,452 104,598 114,732 111,022 8,007 8,651 9,516 10,119 9,780Belgium 5,719 5,763 5,713 6,305 6,826 1,250 1,321 1,991 2,492 2,708Israel 17,806 14,501 23,670 20,073 20,825 1,996 1,934 2,960 3,226 2,150China 4,334 10,206 11,210 10,031 32,525 1,195 2,744 2,332 1,269 2,116Netherlands 5,650 4,016 9,374 5,309 9,931 812 623 1,172 816 1,872Rest of world 38,780 44,116 53,100 76,495 101,413 6,447 7,446 5,571 5,896 7,882
World 568,517 654,231 726,449 764,282 868,602 45,449 50,505 53,599 55,269 60,136
Orchid plants, live 2/ -- 1,000 kg --Taiwan 419 500 548 576 759 9,387 10,642 11,696 12,215 13,458 Netherlands 81 79 66 52 44 2,821 2,547 4,319 3,773 3,199 Thailand 339 297 344 331 416 4,621 3,943 4,937 2,838 3,088 South Korea 47 37 77 84 265 1,389 932 2,009 1,602 2,775 Canada 188 147 267 184 786 842 574 1,083 620 2,014 China 6 29 80 98 66 168 525 803 918 1,325 Japan 6 9 9 8 6 366 453 759 620 428 Costa Rica 26 45 66 63 36 443 895 679 555 395 Indonesia 20 25 15 6 22 425 434 271 109 319 Rest of world 24 17 35 40 54 551 745 1,083 1,427 1,295
World 1,156 1,185 1,508 1,440 2,455 21,013 21,691 27,638 24,677 28,295
Other live plants and trees (HS code 0602) 3/Canada 420,308 442,026 452,288 439,743 401,105 223,730 234,274 242,847 244,698 219,501 Netherlands 15,169 15,076 18,189 13,398 12,704 7,214 7,055 9,421 7,913 8,899 Costa Rica 26,991 26,371 37,087 30,710 32,476 3,647 4,302 6,560 6,826 7,702 China 10,773 14,598 11,859 15,119 48,183 2,756 4,252 4,597 5,116 6,792 New Zealand 1,463 1,652 3,119 3,500 5,307 1,224 1,290 2,477 3,419 4,263 Guatemala 31,855 41,739 45,681 53,264 55,281 1,025 1,740 2,116 2,829 3,102 UK 152 228 349 669 675 952 338 1,658 1,755 1,790 Mexico 1,832 3,495 3,261 2,087 3,040 657 693 822 1,012 1,438 Taiwan 5,557 4,444 9,440 6,210 4,805 1,836 1,339 1,343 1,084 768 Japan 63 112 36 56 27 930 817 616 595 739 Rest of world 8,178 12,234 28,970 28,871 26,881 5,741 5,095 6,011 6,459 8,255
World 522,343 561,975 610,279 593,627 590,484 249,712 261,194 278,467 281,706 263,250
The rest of live plants, trees, and shrubs are mostly imported from Canada, in particular those with soil attached to roots. 1/ Unfinished or prefinished plants and propagative material intended for further growing-on. 2/ Import units are in 1,000 kilograms. 3/ With or without soil attached to roots. Excludes unrooted cuttings and slips of plants and live orchid plants. Quantity is in 1,000 units.Source: U.S. Census Bureau, www.FAS.USDA.gov/ustrade.

111 Floriculture and Nursery Crops Yearbook/FLO-2006/June 2006
Economic Research Service, USDA
Table F-11--Bulbs and tubers: Quantity and value of U.S. imports, by product and country, 2001 to dateProduct / Quantity Value
country 2001 2002 2003 2004 2005p 2001 2002 2003 2004 2005p-- 1,000 units -- -- 1,000 dollars --
Other bulbs, tubers, etc. (HS 0601) 1/Netherlands 842,265 898,025 830,592 874,396 862,232 74,928 73,268 79,940 94,861 90,790 Canada 7,985 6,983 10,047 9,645 7,536 18,976 15,080 17,549 19,583 16,677 Israel 27,100 41,432 26,416 29,407 25,537 5,127 5,576 5,529 5,972 5,681 UK 45,049 45,496 34,011 37,206 39,199 2,696 2,377 1,679 1,893 2,049 South Africa 1,105 1,510 1,665 2,507 3,276 1,139 1,611 1,236 1,637 1,527 Brazil 291 247 468 688 2,372 396 235 321 491 1,253 China 276 521 544 428 6,058 271 239 311 416 800 Rest of world 16,261 17,036 13,303 7,354 11,318 2,284 1,926 2,375 2,005 2,896
World 940,332 1,011,251 917,046 961,631 957,527 105,818 100,311 108,939 126,858 121,673
Tulip bulbs, dormantNetherlands 439,931 450,541 444,237 476,998 471,230 41,685 40,846 43,837 48,677 46,931New Zealand 3,327 3,475 8,309 8,576 12,145 305 387 1,152 1,133 1,743Chile 1,054 1,765 2,234 4,378 4,267 158 239 284 550 530France 2,313 1,785 1,418 3,377 1,462 392 330 319 678 269Rest of world 302 84 70 758 539 117 19 29 110 110
World 446,926 457,651 456,268 494,087 489,643 42,657 41,822 45,621 51,148 49,584
Lily bulbs, dormantNetherlands 179,453 174,168 154,967 171,801 180,419 28,524 25,199 24,235 26,708 32,588Chile 8,108 10,732 10,386 13,137 10,854 1,659 1,571 1,635 2,199 2,553New Zealand 1,755 2,105 2,116 2,702 2,779 411 434 516 643 748France 2,658 958 1,923 1,045 1,086 626 175 253 169 233Israel 6,519 4,224 91 1,033 155 543 480 60 297 82Rest of world 2,423 671 609 691 641 195 298 293 297 153
World 200,917 192,858 170,091 190,410 195,933 31,958 28,156 26,992 30,312 36,356- - - = Not available. 1/ Excludes dormant tulip and lily bulbs.Source: USDA, www.FAS.USDA.gov/ustrade.
Table F-12--Foliage and branches: Quantity and value of U.S. imports, by product and country, 2001 to date 1/Quantity 1/ Value
Country 2001 2002 2003 2004 2005p 2001 2002 2003 2004 2005p-- 1,000 units -- -- 1,000 dollars --
Canada 2,610 2,619 2,514 2,307 2,227 48,210 46,753 47,924 47,252 47,723 Israel - - - - - - - - - - - - - - - 647 1,182 949 1,782 9,858 Italy - - - - - - - - - - - - - - - 6,597 6,939 7,191 7,665 9,138 India - - - - - - - - - - - - - - - 3,477 4,393 8,405 7,279 8,189 Mexico - - - - - - - - - - - - - - - 7,527 6,337 6,331 7,764 8,077 Costa Rica - - - - - - - - - - - - - - - 3,207 2,457 3,924 4,996 6,832 Colombia - - - - - - - - - - - - - - - 3,795 3,745 3,513 5,395 5,289 China - - - - - - - - - - - - - - - 3,903 3,721 5,303 6,247 5,028 Guatemala - - - - - - - - - - - - - - - 1,496 1,383 2,029 1,319 1,878 Rest of world - - - - - - - - - - - - - - - 9,362 9,969 11,284 12,075 12,206
World 2,612 2,639 2,524 2,309 2,230 88,220 86,878 96,854 101,775 114,219 - - - = Not available. 1/ Includes only Christmas trees. Shipments from other countries are not available.Source: U.S. Census Bureau, www.FAS.USDA.gov/ustrade.
112 Floriculture and Nursery Crops Yearbook/FLO-2006/June 2006
Economic Research Service, USDA
Table F-13--Floriculture and nursery products: Value of U.S. exports, by product, 1998 to dateProduct and description 1998 1999 2000 2001 2002 2003 2004 2005p
---1,000 dollars---
Bulbs, tubers, corms, crowns, rhizoms, etc., dormant 17,623 9,472 10,056 8,482 10,087 12,465 14,635 13,042Bulbs, etc., in growth or flower, chicory 4,944 6,614 3,655 3,373 2,206 2,960 4,189 1,942
Total bulbs, tubers, etc. (HS 0601) 22,567 16,085 13,711 11,854 12,294 15,424 18,825 14,983
Unrooted cuttings and slips of plants, nesoi 13,047 10,641 12,951 11,745 8,755 12,439 9,480 9,720Trees, shrubs, bushes bearing edible fruit/nuts 13,766 15,471 11,467 13,740 13,064 14,742 17,272 21,578Rhododendrons and azaleas, grafted or not 5,846 5,521 5,020 5,655 5,913 5,791 5,670 6,622Rose plants, grafted or not 7,264 6,551 6,637 5,743 5,069 5,801 11,597 11,758Orchid plants, live 2,230 506 144 236 249 271 273 4,413Chrysanthemums, live, with soil attached to roots 33 37 3 26 35 0 51 0Herbaceous perennials with soil attached, live, nesoi 1,446 2,409 1,615 158 294 261 82 133Herbaceous perennials without soil attached, nesoi 16,174 30,631 20,867 4,145 3,459 3,165 2,327 2,561Mushroom spawn 10,772 11,194 10,943 10,931 9,331 9,697 9,570 8,735Trees and shrubs with soil attached to roots 1,316 912 1,106 396 1,115 1,158 1,835 1,569Poinsettias, live, with soil attached to roots 0 8 34 19 3 26 0 0Plants, live, with soil attached to roots, nesoi 4,240 6,531 3,988 6,271 2,786 3,719 4,687 9,635Trees and shrubs, live, without soil attached, nesoi 13,979 9,447 10,339 9,831 11,753 14,706 20,762 28,986Plants, live, without soil attached to roots, nesoi 40,472 38,947 43,891 46,268 48,726 50,317 56,132 58,313
Total live plants and trees (HS 0602) 130,588 138,806 129,006 115,165 110,551 122,093 139,737 164,024
Cut flowers and flower buds, fresh 30,713 30,339 29,466 31,498 29,624 30,185 24,542 22,107Cut flowers / buds, dried, dyed, or prepared 13,840 11,387 10,253 8,177 6,706 3,620 2,686 2,814
Total cut flowers and buds (HS 0603) 44,553 41,726 39,719 39,675 36,330 33,805 27,228 24,921
Mosses, lichens, fresh, dried, or prepared 17,323 20,573 14,616 1,909 2,051 4,185 1,335 1,290Foliage, branches, etc., fresh 49,938 50,711 58,660 74,404 75,115 78,013 78,022 91,094Foliage, branches, etc., dried, dyed, or prepared 18,716 14,569 9,009 10,380 6,202 7,478 17,956 5,707
Total foliage, branches, etc. (HS 0604) 85,977 85,853 82,284 86,693 83,368 89,676 97,314 98,091
Total floriculture and nursery exports (HS 06) 283,684 282,470 264,720 253,387 242,544 260,998 283,104 302,020
p = preliminary; nesoi = Not elsewhere specified or included.Source: U.S. Census Bureau, www.FAS.USDA.gov/ustrade.
113 Floriculture and Nursery Crops Yearbook/FLO-2006/June 2006
Economic Research Service, USDA
Table F-14--Floriculture and nursery products: Quantity of U.S. exports, by product, 1998 to dateProduct and description 1998 1999 2000 2001 2002 2003 2004 2005p
---1,000 units---
Bulbs, tubers, corms, crowns, rhizoms, etc., dorman 8,749 7,474 7,501 6,325 7,660 9,773 11,316 9,984Bulbs, etc., in growth or flower, chicory 1,696 2,214 613 484 382 588 774 372
Total bulbs, tubers, etc. (HS 0601) 10,445 9,688 8,114 6,809 8,042 10,361 12,089 10,355
Unrooted cuttings and slips of plants, nesoi 9,362 5,360 3,192 5,160 4,114 3,912 3,571 3,362Trees, shrubs, bushes bearing edible fruit/nuts 602 659 508 550 533 582 819 986Rhododendrons and azaleas, grafted or not 1,252 1,272 1,177 1,253 1,411 1,406 1,361 1,336Rose plants, grafted or not 1,556 1,333 1,289 1,036 918 1,060 1,748 1,755Orchid plants, live 184 121 23 30 54 46 29 558Chrysanthemums, live, with soil attached to roots 13 5 0 3 5 0 6 0Herbaceous perennials with soil attached, live 189 568 333 33 68 24 12 36Herbaceous perennials without soil attached 819 1,581 1,008 536 367 332 241 215Mushroom spawn 4,974 5,194 5,699 6,129 4,839 5,318 6,189 5,688Trees and shrubs with soil attached to roots 54 60 116 43 119 91 264 81Poinsettias, live, with soil attached to roots 0 1 10 2 0 4 0 0Plants, live, with soil attached to roots, nesoi 1,148 1,269 938 569 719 696 815 2,084Trees and shrubs, live, without soil attached to roots 4,122 3,127 3,302 2,977 3,477 3,789 4,043 4,059Plants, live, without soil attached to roots, nesoi 17,973 16,750 19,998 20,737 21,576 23,983 22,601 15,014
Total live plants and trees (HS 0602) 42,247 37,299 37,591 39,058 38,203 41,244 41,698 35,173
Total exports of floriculture / nursery (HS 06) 52,692 46,987 45,705 45,867 46,245 51,605 53,787 45,529
Orchid plants, live 1/ 184 121 23 30 54 46 29 558Herbaceous perennials without soil attached, nesoi 819 1,581 1,008 536 367 332 241 215Mushroom spawn 1/ 4,974 5,194 5,699 6,129 4,839 5,318 6,189 5,688
Total live plants and trees (HS 0602), in kg. 5,977 6,897 6,729 6,695 5,261 5,697 6,459 6,461
p = preliminary; nesoi = Not elsewhere specified or included. 1/ Units are in 1,000 kilograms.Source: U.S. Census Bureau. www.FAS.USDA.gov/ustrade.
114 Floriculture and Nursery Crops Yearbook/FLO-2006/June 2006
Economic Research Service, USDA
Table F-15--Number of U.S. households, by region and State, 1996 to date 1/States 2005p 2004 2003 2002 2001 2000 1999 1998 1997 1996
-- 1,000 --
United States 111,057 110,030 108,988 107,927 106,865 105,480 103,258 101,041 99,884 98,706
Northeast 20,711 20,688 20,630 20,541 20,444 20,286 19,864 19,450 19,364 19,269 Connecticut 1,343 1,339 1,334 1,323 1,313 1,302 1,269 1,238 1,234 1,230 Maine 538 535 532 528 523 518 503 490 485 481 Massachusetts 2,465 2,468 2,472 2,470 2,463 2,444 2,396 2,349 2,330 2,310 New Hampshire 503 498 494 489 483 475 462 450 444 438 New Jersey 3,177 3,165 3,149 3,125 3,100 3,065 3,010 2,957 2,929 2,901 New York 7,173 7,182 7,163 7,139 7,112 7,057 6,913 6,766 6,742 6,715 Pennsylvania 4,847 4,833 4,822 4,806 4,795 4,777 4,684 4,593 4,594 4,593 Rhode Island 420 421 419 417 413 408 392 376 376 376 Vermont 247 246 245 244 242 241 236 231 229 226
Midwest 25,372 25,265 25,156 25,036 24,926 24,735 24,243 23,761 23,642 23,515 Illinois 4,725 4,706 4,683 4,660 4,634 4,592 4,516 4,438 4,418 4,396 Indiana 2,412 2,395 2,383 2,367 2,356 2,336 2,283 2,231 2,218 2,205 Iowa 1,168 1,162 1,158 1,155 1,154 1,149 1,127 1,103 1,102 1,099 Kansas 1,061 1,057 1,053 1,049 1,044 1,038 1,019 999 994 989 Michigan 3,860 3,853 3,843 3,828 3,815 3,786 3,737 3,693 3,670 3,645 Minnesota 1,977 1,963 1,950 1,935 1,920 1,895 1,842 1,791 1,776 1,761 Missouri 2,277 2,261 2,245 2,230 2,216 2,195 2,141 2,089 2,073 2,057 Nebraska 686 682 678 673 670 666 651 636 633 630 North Dakota 256 256 255 255 256 257 252 247 247 247 Ohio 4,498 4,493 4,485 4,475 4,467 4,446 4,364 4,285 4,274 4,261 South Dakota 299 297 295 293 292 290 283 277 277 276 Wisconsin 2,154 2,141 2,129 2,116 2,102 2,085 2,027 1,973 1,962 1,949
South 2/ 40,740 40,169 39,625 39,114 38,611 38,015 37,001 35,985 35,449 34,908 Alabama 1,783 1,771 1,762 1,753 1,748 1,737 1,701 1,663 1,648 1,632 Arkansas 1,085 1,074 1,064 1,057 1,051 1,043 1,006 970 959 948 Delaware 321 316 312 307 303 299 291 284 280 276 Florida 7,046 6,886 6,731 6,606 6,476 6,338 6,104 5,881 5,775 5,668 Georgia 3,324 3,267 3,204 3,144 3,083 3,006 2,924 2,843 2,778 2,713 Kentucky 1,644 1,632 1,622 1,611 1,602 1,591 1,544 1,497 1,487 1,477 Louisiana 1,681 1,675 1,669 1,663 1,659 1,656 1,630 1,599 1,587 1,574 Maryland 2,095 2,080 2,062 2,036 2,012 1,981 1,942 1,906 1,890 1,874 Mississippi 1,076 1,069 1,061 1,056 1,053 1,046 1,022 997 987 976 North Carolina 3,376 3,321 3,275 3,232 3,188 3,132 3,008 2,883 2,836 2,789 Oklahoma 1,383 1,373 1,366 1,359 1,351 1,342 1,318 1,288 1,277 1,265 South Carolina 1,627 1,605 1,585 1,569 1,552 1,534 1,488 1,441 1,416 1,390 Tennessee 2,341 2,314 2,294 2,274 2,257 2,233 2,167 2,100 2,068 2,037 Texas 8,091 7,954 7,822 7,689 7,551 7,393 7,255 7,113 6,973 6,834 Virginia 2,884 2,851 2,813 2,776 2,741 2,699 2,638 2,579 2,546 2,513 West Virginia 742 741 740 737 736 736 726 716 714 712
West 24,234 23,908 23,577 23,237 22,883 22,445 22,148 21,845 21,429 21,014 Alaska 235 233 230 227 224 222 219 215 213 212 Arizona 2,192 2,119 2,059 2,007 1,955 1,901 1,831 1,762 1,709 1,657 California 12,259 12,160 12,030 11,871 11,714 11,503 11,478 11,446 11,244 11,039 Colorado 1,793 1,769 1,748 1,729 1,702 1,658 1,611 1,561 1,529 1,499 Hawaii 425 421 416 412 408 403 401 401 396 391 Idaho 518 506 496 487 479 470 459 448 438 429 Montana 373 369 365 362 361 359 352 346 343 340 Nevada 901 871 837 809 782 751 713 676 646 617 New Mexico 720 710 701 693 684 678 655 632 625 618 Oregon 1,419 1,400 1,389 1,373 1,354 1,334 1,311 1,286 1,267 1,247 Utah 774 759 746 733 717 701 689 677 662 648 Washington 2,423 2,392 2,363 2,338 2,309 2,271 2,242 2,211 2,172 2,133 Wyoming 200 199 197 196 194 194 189 185 184 183
U.S. resident pop. 296,410 293,657 290,850 287,985 285,108 282,193 279,295 275,854 272,912 269,6671/ July 1 resident estimates. The number of households from 2001 to 2005 is estimated from each State's share in 2000.2/ Includes the District of Columbia.Source: U.S. Census Bureau, www.FAS.USDA.gov/ustrade.