flinthills usd 492 - kansas state department of education finance/budget/budget... · 492 also...
TRANSCRIPT

Flinthills USD 492
• Budget General Information (characteristics of district)
• Supplemental Information for Tables in Summary of Expenditures
• KSDE Website Information Available
• Summary of Expenditures (Sumexpen.xls)
i
1
2009-2010 Budget General Information USD #: 492_ Flinthills USD 492 school district covers 389 square miles in Butler and Greenwood Counties, has a general fund assessed valuation of $14,535,699 and a capital outlay and bond and interest assessed valuation of $15,385,775. The mill levy for the general fund is 20 mills. The capital outlay mill levy is 4 mills and the bond and interest mill levy is estimated to be 13.831. USD 492 also utilizes the supplemental general fund which has a mill levy of 24.717. The total mill levy for 2009-2010 budget is 62.548 which is a .084 mill increase from last year’s 62.464 mill levy. Flinthills Primary School is located in Cassoday, Flinthills Intermediate, Middle and High Schools are located in one building in Rosalia. The schools have an estimated enrollment of 300, grades kindergarten through twelve and a staff of 33 licensed members and 24 classified employees. Flinthills USD 492 is a member of the Butler County Special Ed Cooperative located in El Dorado and South Central Kansas Educational Service Center in Clearwater.
Introduction Flinthills is located on the western edge of the beautiful Flint hills range of eastern Kansas. Most of the district is rural. Flinthills has performed well in academic and extracurricular areas and has set high expectations. Flinthills participates in the Lyon County League and is a member of the Butler County Special Education Cooperative operated by USD 490. Flinthills is a member of the South Central Kansas Educational Cooperative and participates in their functions, uses their education specialists for professional development, and is a member of the Interactive Distance Learning Network.
Board Members Pat Hannon President Brian Vogt Vice President Pam Dunham Billy Jackson Kermit Keplar Monty Melugin Ava Wedel
Key Staff : Superintendent: Robert Diepenbrock Business Office Staff: Susan Grunder, Clerk Leesa Smith, Treasurer Curriculum & Instruction Staff: Larry Gawith Elementary / MS Principal Pam Breech Kindergarten Charlene Foster Kindergarten, Title I Reading Specialist Deborah Anderson Grade 1 Barbara Anderson Grade K-2 Music, Technology, Art

2
Abby Thorne Grade 2 Kristin Sangals Grade 3/4 Sarah Grunder Grade 3/4 Tiffany Willard Grade 3/4 Denise Hodge Grade 5/6 Tami Gray Grade 5/6 Math and Science, 3-6 PE Laureen Simon Grade 5/6 Robert Diepenbrock HS Principal Donald Wedel MS/HS Counselor John Donner 7th, 8th Science, HS Chemistry, HS Health Shane Thornton 7th and 8th Grade Social Studies, MS Careers Lisa Sjogren 7th and 8th Grade Language Arts Kent Harms 7th, 8th and 9th Grade Math Sharon McClure Librarian Michael Austin Art, Technology Integration Specialist Cindy Nelson Music Rick Cox Instrumental Music Joseph Harkins HS Biology, Earth Science Pat Vossen HS Social Sciences Maggie McKiethen HS Language Arts, Speech, Newspaper Sallie Scribner HS Language Arts Erik Sorum PE, HS Math, Athletic Director Mark McNemee HS Math Deborah Hanson Computer, Yearbook, Accounting Ryan Rose Industrial Technology Julie Muench MS/HS Special Ed Patti Plett Elementary Special Ed Nancy Thomas Gifted Facilitator Sharon Simmons Elementary Counselor Other Key Contacts: Leesa Smith Middle School/High School Administrative Assistant Katie Taylor Intermediate School Administrative Assistant Laura Norton Primary School Administrative Assistant Jackie Stands Primary Paraprofessional Peggy Williams Intermediate Paraprofessional Phyllis Jackson Director of Food Service Cooks: Berthadean Bender Keli Davis Sheri Stephens Teresa Travinchek Richard Williams Director of Transportation Cheryl Dragoo Safety Director/Driver Bus Drivers: Lisa Donner Jana Turner Yvonne Martin Jim Vaught Robert Simmons Sarah Vanarsdale, Sub
David Rogers, Sub Custodians: Dennis Switzer

ORGANIZATIONAL FLOW CHART
BOARD OF EDUCATION
SUPERINTENDENT
PRINCIPALS
CLASSIFIED SUPERVISORS SUPPLEMENTAL STAFF LICENSED FACULTY
CLASSIFIED STAFF PARAPROFESSIONALS
The District’s Accomplishments and Challenges Accomplishments: Flinthills once again made AYP at all levels and as a district having only 10 students district-wide that are non-proficient. Once again, the standard of excellence was made at many levels throughout the district in state assessments. Additionally, Flinthills participates in the NWEA measures of academic progress and is fully accredited by North Central Accreditation. Graduation rates remain high and Flinthills continues to offer credit recovery programs, credit completion, and assistance to students who need additional assistance while challenging the top students by offering a variety of college course choices and opportunities for our highest achieving students. Flinthills remains a comprehensive school offering courses in fine arts and career and technical education and a variety of clubs, sports and activities for developing the whole child.
3

4
Flinthills places an emphasis on professional development and ties in the staff learning to their evaluations. Recent emphasis has been on differentiated instruction and integration of technology into the classroom. Two teachers devote a portion of their day to assisting other teachers in finding and using technology in the classroom and have placed greater priority in placing that technology in the hands of students. Those teachers have made state and national presentations for classroom technology and will again present in the national arena. Classroom clickers have been added and additional and upgraded computer desktops, laptops, video projectors, and interactive whiteboards are at the disposal of students and teachers. Additionally, special programs and additional high school courses are available through the interactive distance learning where up to three concurrent class offerings are available. Flinthills continues to emphasize learning for both students and adults and works at continuous improvement. Challenges: Some of the challenges we face are the same faced by all schools across the state by dealing with budget cuts. Reduced staffing included moving from a three person administration to a two person administration. A full-time business position was reduced to half-time also. Declining enrollment makes budget reductions even more painful. Increased costs of insurance, labor, transportation, energy, etc. add to the burden. The district has not had to find additional teachers this year, but Flinthills is last in the county in terms of pay and fringe benefits and when the economy improves, that could again make it difficult to attract and retain qualified faculty. Finding and retaining qualified coaches is already a problem and will continue into the forseeable future. Providing up-to-date technology, safe and secure schools, and readily meeting the diverse demands of the 21st century workforce and preparing our students to meet those demands are challenges Flinthills will continue to face. If budgets continue to be reduced, it will be impossible to meet all of those expectations.
5
Supplemental Information for the Following Tables 1. Summary of Total Expenditures by Function (All Funds) 2. Summary of General Fund Expenditures by Function 3. Summary of Supplemental General Fund Expenditures by Function 4. Summary of General and Supplemental General Fund Expenditures by Function 5. Summary of Special Education Fund by Function 6. Instruction Expenditures (1000) 7. Student and Instructional Support Expenditures (2100 & 2200) 8. General Administration Expenditures (2300) 9. School Administration Expenditures (2400) 10. Operations and Maintenance Expenditures (2600) 11. Other Costs (2500 & 2900: Other Supplemental Services) (3000: Non-Instruction Services) 12. Capital Improvements (4000) 13. Debt Services (5000) 14. Miscellaneous Information Unencumbered Cash Balance by Fund 15. Reserve Funds Unencumbered Cash Balance 16. Other Information - FTE 17. Miscellaneous Information Mill Rates by Fund 18. Other Information – Assessed Valuation and Bonded Indebtedness Note: The FTE (full time equivalency) used in this report to calculate the “Amount Per Pupil” is defined as following: Enrollment (FTE) includes the enrollment of the district used for state aid and budget authority, and all other preschool enrollment and kindergarten students attending full time.
6
KSDE Website Information Available K-12 Statistics (Building, District or State Totals) http://www.ksde.org/Default.aspx?tabid=223
• Attendance / Enrollment Reports • Staff Reports • Graduates / Dropouts Reports • Crime / Violence Reports
School Finance Reports and Publications http://www.ksde.org/Default.aspx?tabid=1870
• Certified Personnel • Enrollment • Dropouts • Graduates • Salary Reports
Kansas Building Report Card (listed on the right under Data Portal sections) http://www.ksde.org/Default.aspx?tabid=229
• Attendance Rate • Graduation Rate • Dropout Rate • School Violence • Assessments
o Reading o Mathematics o Writing
• Graduates Passing Adv. Science Courses • Graduates Passing Adv. Math Courses
USD# 492
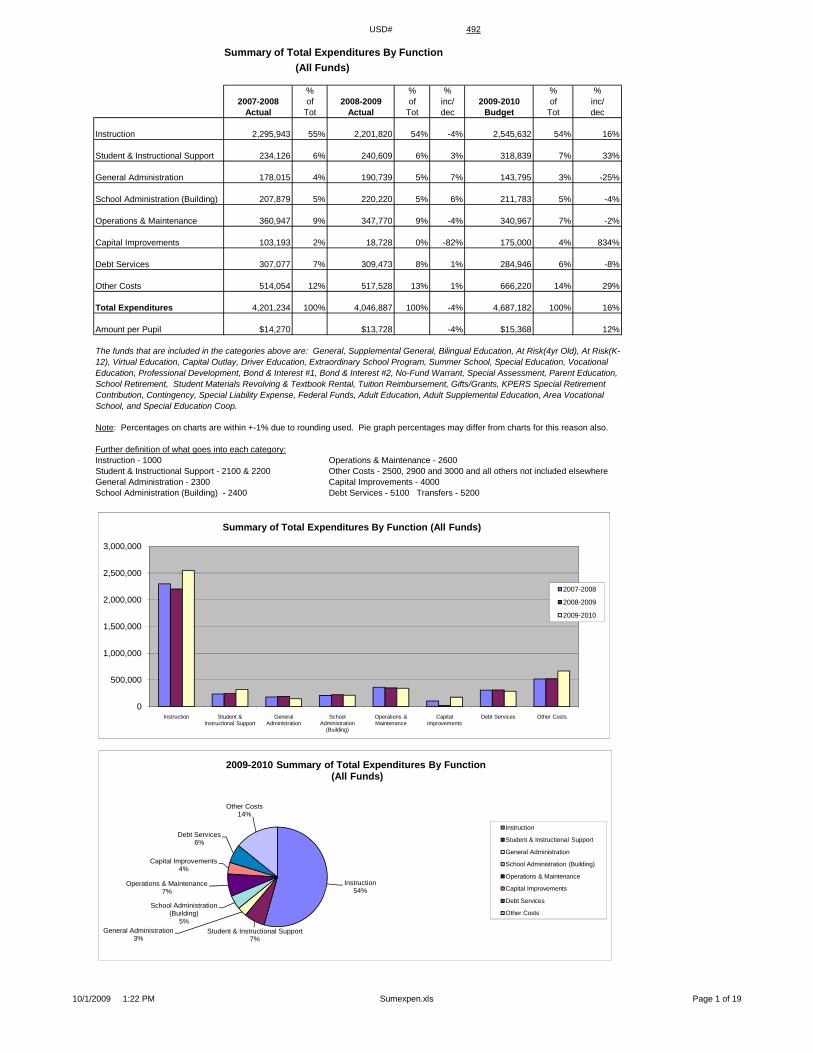
Summary of Total Expenditures By Function
(All Funds)
% % % % %2007-2008 of 2008-2009 of inc/ 2009-2010 of inc/
Actual Tot Actual Tot dec Budget Tot dec
Instruction 2,295,943 55% 2,201,820 54% -4% 2,545,632 54% 16%
Student & Instructional Support 234,126 6% 240,609 6% 3% 318,839 7% 33%
General Administration 178,015 4% 190,739 5% 7% 143,795 3% -25%
School Administration (Building) 207,879 5% 220,220 5% 6% 211,783 5% -4%
Operations & Maintenance 360,947 9% 347,770 9% -4% 340,967 7% -2%
Capital Improvements 103,193 2% 18,728 0% -82% 175,000 4% 834%
Debt Services 307,077 7% 309,473 8% 1% 284,946 6% -8%
Other Costs 514,054 12% 517,528 13% 1% 666,220 14% 29%
Total Expenditures 4,201,234 100% 4,046,887 100% -4% 4,687,182 100% 16%
Amount per Pupil $14,270 $13,728 -4% $15,368 12%
Note: Percentages on charts are within +-1% due to rounding used. Pie graph percentages may differ from charts for this reason also.
Further definition of what goes into each category:Instruction - 1000 Operations & Maintenance - 2600Student & Instructional Support - 2100 & 2200 Other Costs - 2500, 2900 and 3000 and all others not included elsewhereGeneral Administration - 2300 Capital Improvements - 4000School Administration (Building) - 2400 Debt Services - 5100 Transfers - 5200
The funds that are included in the categories above are: General, Supplemental General, Bilingual Education, At Risk(4yr Old), At Risk(K-12), Virtual Education, Capital Outlay, Driver Education, Extraordinary School Program, Summer School, Special Education, Vocational Education, Professional Development, Bond & Interest #1, Bond & Interest #2, No-Fund Warrant, Special Assessment, Parent Education, School Retirement, Student Materials Revolving & Textbook Rental, Tuition Reimbursement, Gifts/Grants, KPERS Special Retirement Contribution, Contingency, Special Liability Expense, Federal Funds, Adult Education, Adult Supplemental Education, Area Vocational School, and Special Education Coop.
0
500,000
1,000,000
1,500,000
2,000,000
2,500,000
3,000,000
Instruction Student & Instructional Support
General Administration
School Administration
(Building)
Operations & Maintenance
Capital Improvements
Debt Services Other Costs
Summary of Total Expenditures By Function (All Funds)
2007-2008
2008-2009
2009-2010
Instruction54%
Student & Instructional Support7%
General Administration3%
School Administration (Building)
5%
Operations & Maintenance7%
Capital Improvements4%
Debt Services6%
Other Costs14%
2009-2010 Summary of Total Expenditures By Function(All Funds)
Instruction
Student & Instructional Support
General Administration
School Administration (Building)
Operations & Maintenance
Capital Improvements
Debt Services
Other Costs
10/1/2009 1:22 PM Sumexpen.xls Page 1 of 19

USD# 492
Summary of General Expendituresby Function
% % % % %2007-2008 of 2008-2009 of inc/ 2009-2010 of inc/
Actual Tot Actual Tot dec Budget Tot dec
Instruction 1,392,418 62% 1,360,166 60% -2% 1,460,300 64% 7%
Student & Instructional Support 30,872 1% 60,269 3% 95% 29,000 1% -52%
General Administration 168,800 7% 174,993 8% 4% 131,295 6% -25%
School Administration (Building) 199,881 9% 207,931 9% 4% 196,783 9% -5%
Operations & Maintenance 210,164 9% 220,999 10% 5% 224,467 10% 2%
Capital Improvements 0 0% 0 0% 0% 0 0% 0%
Other Costs 251,081 11% 259,790 11% 3% 237,610 10% -9%
Total Expenditures 2,253,216 100% 2,284,148 100% 1% 2,279,455 100% 0%
Amount per Pupil $7,654 $7,748 1% $7,474 -4%
The Summary of General Fund Expenditures chart information comes from pages 6-13 and only uses the 'General Fund' line items.
600 000
800,000
1,000,000
1,200,000
1,400,000
1,600,000
Summary of General Fund Expendituresby Function
2007-2008
2008-2009
2009-2010
0
200,000
400,000
600,000
800,000
1,000,000
1,200,000
1,400,000
1,600,000
Instruction Student & Instructional
Support
General Administration
School Administration
(Building)
Operations & Maintenance
Capital Improvements
Other Costs
Summary of General Fund Expendituresby Function
2007-2008
2008-2009
2009-2010
Instruction64%
Student & Instructional Support
1%
General Administration6%
School Administration (Building)
9%
Operations & Maintenance10%
Other Costs10%
2009-2010 Summary of General Fund Expendituresby Function
Instruction
Student & Instructional Support
General Administration
School Administration (Building)
Operations & Maintenance
Capital Improvements
Other Costs
10/1/2009 1:22 PM Sumexpen.xls Page 2 of 19
USD# 492
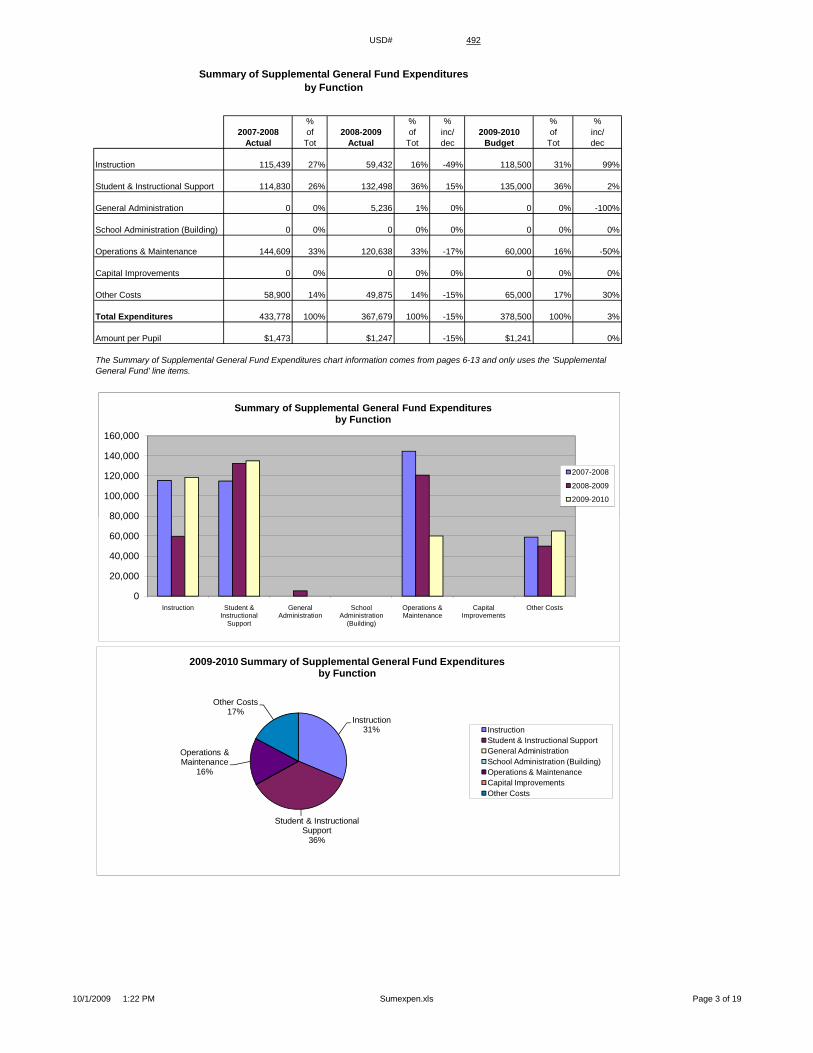
Summary of Supplemental General Fund Expendituresby Function
% % % % %2007-2008 of 2008-2009 of inc/ 2009-2010 of inc/
Actual Tot Actual Tot dec Budget Tot dec
Instruction 115,439 27% 59,432 16% -49% 118,500 31% 99%
Student & Instructional Support 114,830 26% 132,498 36% 15% 135,000 36% 2%
General Administration 0 0% 5,236 1% 0% 0 0% -100%
School Administration (Building) 0 0% 0 0% 0% 0 0% 0%
Operations & Maintenance 144,609 33% 120,638 33% -17% 60,000 16% -50%
Capital Improvements 0 0% 0 0% 0% 0 0% 0%
Other Costs 58,900 14% 49,875 14% -15% 65,000 17% 30%
Total Expenditures 433,778 100% 367,679 100% -15% 378,500 100% 3%
Amount per Pupil $1,473 $1,247 -15% $1,241 0%
The Summary of Supplemental General Fund Expenditures chart information comes from pages 6-13 and only uses the 'Supplemental General Fund' line items.
80 000
100,000
120,000
140,000
160,000
Summary of Supplemental General Fund Expendituresby Function
2007-2008
2008-2009
2009-2010
Instruction31%
Student & Instructional Support
36%
Operations & Maintenance
16%
Other Costs17%
2009-2010 Summary of Supplemental General Fund Expendituresby Function
InstructionStudent & Instructional SupportGeneral AdministrationSchool Administration (Building)Operations & MaintenanceCapital ImprovementsOther Costs
0
20,000
40,000
60,000
80,000
100,000
120,000
140,000
160,000
Instruction Student & Instructional
Support
General Administration
School Administration
(Building)
Operations & Maintenance
Capital Improvements
Other Costs
Summary of Supplemental General Fund Expendituresby Function
2007-2008
2008-2009
2009-2010
10/1/2009 1:22 PM Sumexpen.xls Page 3 of 19

USD# 492Summary of General and Supplemental General Fund
Expenditures by Function
% % % % %2007-2008 of 2008-2009 of inc/ 2009-2010 of inc/
Actual Tot Actual Tot dec Budget Tot dec
Instruction 1,507,857 56% 1,419,598 54% -6% 1,578,800 59% 11%
Student & Instructional Support 145,702 5% 192,767 7% 32% 164,000 6% -15%
General Administration 168,800 6% 180,229 7% 7% 131,295 5% -27%
School Administration (Building) 199,881 7% 207,931 8% 4% 196,783 7% -5%
Operations & Maintenance 354,773 13% 341,637 13% -4% 284,467 11% -17%
Capital Improvements 0 0% 0 0% 0% 0 0% 0%
Other Costs 309,981 12% 309,665 12% 0% 302,610 11% -2%
Total Expenditures 2,686,994 100% 2,651,827 100% -1% 2,657,955 100% 0%
Amount per Pupil $9,127 $8,995 -1% $8,715 -3%
The Summary of General and Supplemental General Fund Expenditures chart information comes from pages 6-13 and adds togetherthe 'General Fund' and 'Supplemental General Fund' line items.
600,000
800,000
1,000,000
1,200,000
1,400,000
1,600,000
1,800,000
Summary of General and Supplemental General FundExpenditures by Function
2007-2008
2008-2009
2009-2010
0
200,000
400,000
600,000
800,000
1,000,000
1,200,000
1,400,000
1,600,000
1,800,000
Instruction Student & Instructional
Support
General Administration
School Administration
(Building)
Operations & Maintenance
Capital Improvements
Other Costs
Summary of General and Supplemental General FundExpenditures by Function
2007-2008
2008-2009
2009-2010
Instruction59%
Student & Instructional Support
6%
General Administration5%
School Administration (Building)
8%
Operations & Maintenance11%
Other Costs11%
2009-2010 Summary of General and Supplemental General Fund Expenditures by Function
Instruction
Student & Instructional Support
General Administration
School Administration (Building)
Operations & Maintenance
Capital Improvements
Other Costs
10/1/2009 1:22 PM Sumexpen.xls Page 4 of 19

USD# 492
Summary of Special Education Fundby Function
% % % % %2007-2008 of 2008-2009 of inc/ 2009-2010 of inc/
Actual Tot Actual Tot dec Budget Tot dec
Instruction 374,336 93% 373,838 94% 0% 384,286 93% 3%
Student & Instructional Support 0 0% 0 0% 0% 0 0% 0%
General Administration 0 0% 0 0% 0% 0 0% 0%
School Administration (Building) 0 0% 0 0% 0% 0 0% 0%
Operations & Maintenance 0 0% 0 0% 0% 0 0% 0%
Capital Improvements 0 0% 0 0% 0% 0 0% 0%
Other Costs 26,812 7% 22,450 6% -16% 29,892 7% 33%
Total Expenditures 401,148 100% 396,288 100% -1% 414,178 100% 5%
Amount per Pupil $1,363 $1,344 -1% $1,358 1%
The Summary of Special Education Fund Expenditures chart information comes from pages 6-13 and only uses the 'Special Education Fund'line items. (Total expenditures excludes Special Ed Coop Fund because it would include expenditures for all schools participating in the Coop.)
150,000
200,000
250,000
300,000
350,000
400,000
450,000
Summary of Special Education Fund Expendituresby Function
2007-2008
2008-2009
2009-2010
0
50,000
100,000
150,000
200,000
250,000
300,000
350,000
400,000
450,000
Instruction Student & Instructional
Support
General Administration
School Administration
(Building)
Operations & Maintenance
Capital Improvements
Other Costs
Summary of Special Education Fund Expendituresby Function
2007-2008
2008-2009
2009-2010
Instruction93%
Other Costs7%
2009-2010 Summary of Special Education Fundby Function
Instruction
Student & Instructional Support
General Administration
School Administration (Building)
Operations & Maintenance
Capital Improvements
Other Costs
10/1/2009 1:22 PM Sumexpen.xls Page 5 of 19
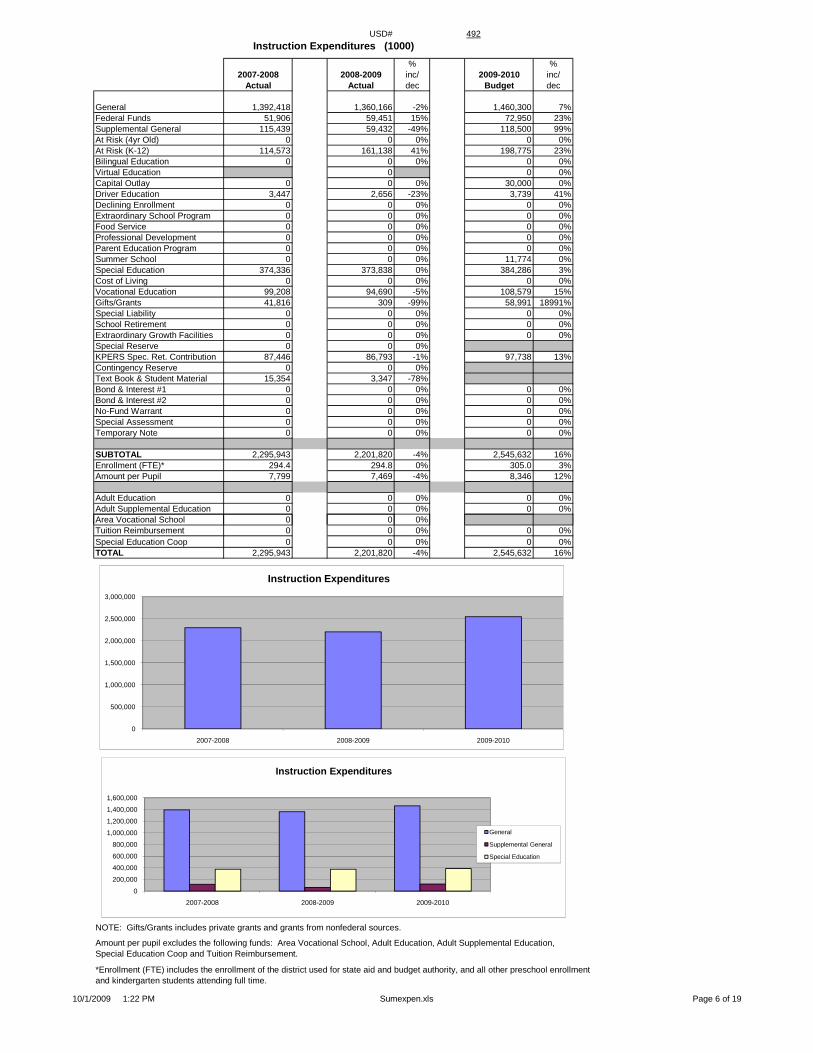
USD# 492Instruction Expenditures (1000)
% %2007-2008 2008-2009 inc/ 2009-2010 inc/
Actual Actual dec Budget dec
General 1,392,418 1,360,166 -2% 1,460,300 7%Federal Funds 51,906 59,451 15% 72,950 23%Supplemental General 115,439 59,432 -49% 118,500 99%At Risk (4yr Old) 0 0 0% 0 0%At Risk (K-12) 114,573 161,138 41% 198,775 23%Bilingual Education 0 0 0% 0 0%Virtual Education 0 0 0%Capital Outlay 0 0 0% 30,000 0%Driver Education 3,447 2,656 -23% 3,739 41%Declining Enrollment 0 0 0% 0 0%Extraordinary School Program 0 0 0% 0 0%Food Service 0 0 0% 0 0%Professional Development 0 0 0% 0 0%Parent Education Program 0 0 0% 0 0%Summer School 0 0 0% 11,774 0%Special Education 374,336 373,838 0% 384,286 3%Cost of Living 0 0 0% 0 0%Vocational Education 99,208 94,690 -5% 108,579 15%Gifts/Grants 41,816 309 -99% 58,991 18991%Special Liability 0 0 0% 0 0%School Retirement 0 0 0% 0 0%Extraordinary Growth Facilities 0 0 0% 0 0%Special Reserve 0 0 0%KPERS Spec. Ret. Contribution 87,446 86,793 -1% 97,738 13%Contingency Reserve 0 0 0%Text Book & Student Material 15,354 3,347 -78%Bond & Interest #1 0 0 0% 0 0%Bond & Interest #2 0 0 0% 0 0%No-Fund Warrant 0 0 0% 0 0%Special Assessment 0 0 0% 0 0%Temporary Note 0 0 0% 0 0%
SUBTOTAL 2,295,943 2,201,820 -4% 2,545,632 16%Enrollment (FTE)* 294.4 294.8 0% 305.0 3%Amount per Pupil 7,799 7,469 -4% 8,346 12%
Adult Education 0 0 0% 0 0%Adult Supplemental Education 0 0 0% 0 0%A V i l S h l 0 0 0%Area Vocational School 0 0 0%Tuition Reimbursement 0 0 0% 0 0%Special Education Coop 0 0 0% 0 0%TOTAL 2,295,943 2,201,820 -4% 2,545,632 16%
NOTE: Gifts/Grants includes private grants and grants from nonfederal sources.
Amount per pupil excludes the following funds: Area Vocational School, Adult Education, Adult Supplemental Education,Special Education Coop and Tuition Reimbursement.
*Enrollment (FTE) includes the enrollment of the district used for state aid and budget authority, and all other preschool enrollmentand kindergarten students attending full time.
0
500,000
1,000,000
1,500,000
2,000,000
2,500,000
3,000,000
2007-2008 2008-2009 2009-2010
Instruction Expenditures
0
200,000
400,000
600,000
800,000
1,000,000
1,200,000
1,400,000
1,600,000
2007-2008 2008-2009 2009-2010
Instruction Expenditures
General
Supplemental General
Special Education
10/1/2009 1:22 PM Sumexpen.xls Page 6 of 19
USD# 492
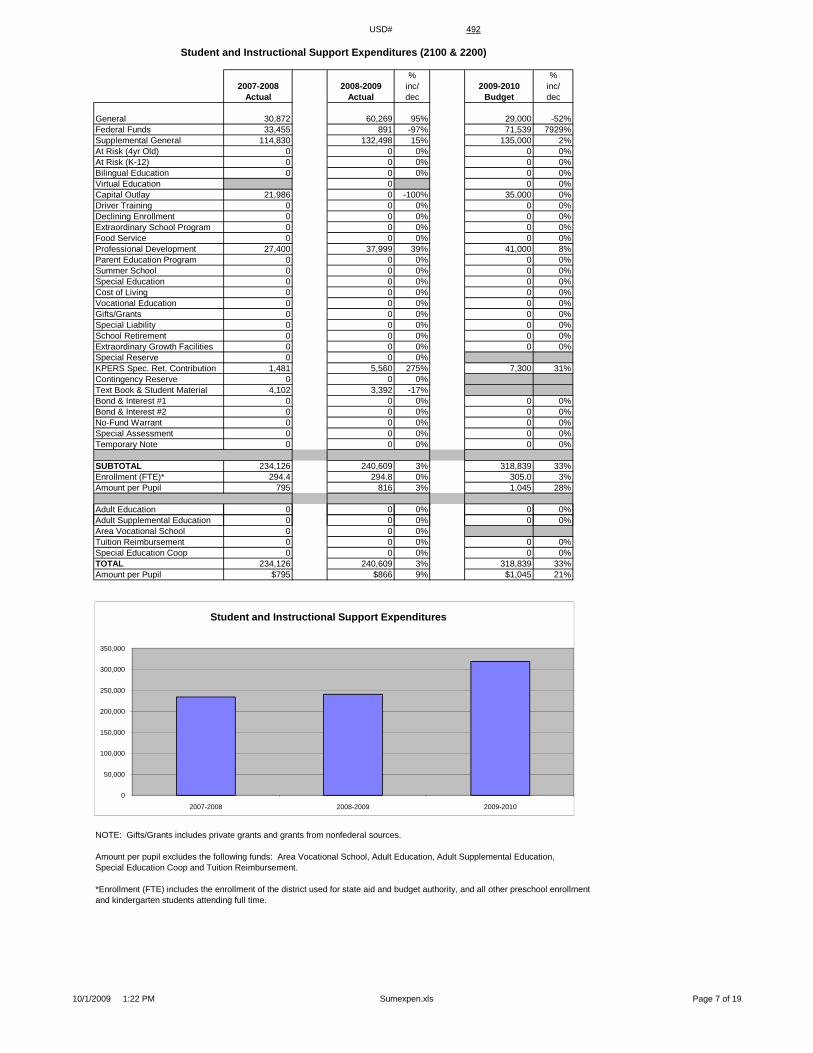
Student and Instructional Support Expenditures (2100 & 2200)
% %2007-2008 2008-2009 inc/ 2009-2010 inc/
Actual Actual dec Budget dec
General 30,872 60,269 95% 29,000 -52%Federal Funds 33,455 891 -97% 71,539 7929%Supplemental General 114,830 132,498 15% 135,000 2%At Risk (4yr Old) 0 0 0% 0 0%At Risk (K-12) 0 0 0% 0 0%Bilingual Education 0 0 0% 0 0%Virtual Education 0 0 0%Capital Outlay 21,986 0 -100% 35,000 0%Driver Training 0 0 0% 0 0%Declining Enrollment 0 0 0% 0 0%Extraordinary School Program 0 0 0% 0 0%Food Service 0 0 0% 0 0%Professional Development 27,400 37,999 39% 41,000 8%Parent Education Program 0 0 0% 0 0%Summer School 0 0 0% 0 0%Special Education 0 0 0% 0 0%Cost of Living 0 0 0% 0 0%Vocational Education 0 0 0% 0 0%Gifts/Grants 0 0 0% 0 0%Special Liability 0 0 0% 0 0%School Retirement 0 0 0% 0 0%Extraordinary Growth Facilities 0 0 0% 0 0%Special Reserve 0 0 0%KPERS Spec. Ret. Contribution 1,481 5,560 275% 7,300 31%Contingency Reserve 0 0 0%Text Book & Student Material 4,102 3,392 -17%Bond & Interest #1 0 0 0% 0 0%Bond & Interest #2 0 0 0% 0 0%No-Fund Warrant 0 0 0% 0 0%Special Assessment 0 0 0% 0 0%Temporary Note 0 0 0% 0 0%
SUBTOTAL 234,126 240,609 3% 318,839 33%Enrollment (FTE)* 294.4 294.8 0% 305.0 3%Amount per Pupil 795 816 3% 1,045 28%
Adult Education 0 0 0% 0 0%Adult Supplemental Education 0 0 0% 0 0%Area Vocational School 0 0 0%Tuition Reimbursement 0 0 0% 0 0%Special Education Coop 0 0 0% 0 0%TOTAL 234,126 240,609 3% 318,839 33%Amount per Pupil $795 $866 9% $1,045 21%
NOTE: Gifts/Grants includes private grants and grants from nonfederal sources.
Amount per pupil excludes the following funds: Area Vocational School, Adult Education, Adult Supplemental Education,Special Education Coop and Tuition Reimbursement.
*Enrollment (FTE) includes the enrollment of the district used for state aid and budget authority, and all other preschool enrollmentand kindergarten students attending full time.
0
50,000
100,000
150,000
200,000
250,000
300,000
350,000
2007-2008 2008-2009 2009-2010
Student and Instructional Support Expenditures
10/1/2009 1:22 PM Sumexpen.xls Page 7 of 19

USD# 492
General Administration Expenditures (2300)
% %2007-2008 2008-2009 inc/ 2009-2010 inc/
Actual Actual dec Budget dec
General 168,800 174,993 4% 131,295 -25%Federal Funds 0 0 0% 0 0%Supplemental General 0 5,236 0% 0 -100%At Risk (4yr Old) 0 0 0% 0 0%At Risk (K-12) 0 0 0% 0 0%Bilingual Education 0 0 0% 0 0%Virtual Education 0 0 0%Capital Outlay 0 0 0% 0 0%Driver Training 0 0 0% 0 0%Declining Enrollment 0 0 0% 0 0%Extraordinary School Program 0 0 0% 0 0%Food Service 0 0 0% 0 0%Professional Development 0 0 0% 0 0%Parent Education Program 0 0 0% 0 0%Summer School 0 0 0% 0 0%Special Education 0 0 0% 0 0%Cost of Living 0 0 0% 0 0%Vocational Education 0 0 0% 0 0%Gifts/Grants 0 0 0% 0 0%Special Liability Expense 0 0 0% 0 0%School Retirement 0 0 0% 0 0%Extraordinary Growth Facilities 0 0 0% 0 0%Special Reserve 0 0 0%KPERS Spec. Ret. Contribution 9,215 10,510 14% 12,500 19%Contingency Reserve 0 0 0%Text Book & Student Material 0 0 0%Bond & Interest #1 0 0 0% 0 0%Bond & Interest #2 0 0 0% 0 0%No-Fund Warrant 0 0 0% 0 0%Special Assessment 0 0 0% 0 0%Temporary Note 0 0 0% 0 0%
SUBTOTAL 178,015 190,739 7% 143,795 -25%Enrollment (FTE)* 294.4 294.8 0% 305.0 3%Amount per Pupil 605 647 7% 471 -27%
Adult Education 0 0 0% 0 0%Adult Education 0 0 0% 0 0%Adult Supplemental Education 0 0 0% 0 0%Area Vocational School 0 0 0%Tuition Reimbursement 0 0 0% 0 0%Special Education Coop 0 0 0% 0 0%TOTAL 178,015 190,739 7% 143,795 -25%
NOTE: Gifts/Grants includes private grants and grants from nonfederal sources.
Amount per pupil excludes the following funds: Area Vocational School, Adult Education, Adult Supplemental Education,Special Education Coop and Tuition Reimbursement.
*Enrollment (FTE) includes the enrollment of the district used for state aid and budget authority, and all other preschool enrollmentand kindergarten students attending full time.
0
50,000
100,000
150,000
200,000
250,000
2007-2008 2008-2009 2009-2010
General Administration Expenditures
10/1/2009 1:22 PM Sumexpen.xls Page 8 of 19

USD# 492
School Administration Expenditures (2400)
% %2007-2008 2008-2009 inc/ 2009-2010 inc/
Actual Actual dec Budget dec
General 199,881 207,931 4% 196,783 -5%Federal Funds 0 0 0% 0 0%Supplemental General 0 0 0% 0 0%At Risk (4yr Old) 0 0 0% 0 0%At Risk (K-12) 0 0 0% 0 0%Bilingual Education 0 0 0% 0 0%Virtual Education 0 0 0%Capital Outlay 0 0 0% 0 0%Driver Training 0 0 0% 0 0%Declining Enrollment 0 0 0% 0 0%Extraordinary School Program 0 0 0% 0 0%Food Service 0 0 0% 0 0%Professional Development 0 0 0% 0 0%Parent Education Program 0 0 0% 0 0%Summer School 0 0 0% 0 0%Special Education 0 0 0% 0 0%Cost of Living 0 0 0% 0 0%Vocational Education 0 0 0% 0 0%Gifts/Grants 0 0 0% 0 0%Special Liability Expense 0 0 0% 0 0%School Retirement 0 0 0% 0 0%Extraordinary Growth Facilities 0 0 0% 0 0%Special Reserve 0 0 0%KPERS Spec. Ret. Contribution 7,998 12,289 54% 15,000 22%Contingency Reserve 0 0 0%Text Book & Student Material 0 0 0%Bond & Interest #1 0 0 0% 0 0%Bond & Interest #2 0 0 0% 0 0%No-Fund Warrant 0 0 0% 0 0%Special Assessment 0 0 0% 0 0%Temporary Note 0 0 0% 0 0%
SUBTOTAL 207,879 220,220 6% 211,783 -4%Enrollment (FTE)* 294.4 294.8 0% 305.0 3%Amount per Pupil 706 747 6% 694 -7%
Adult Education 0 0 0% 0 0%Adult Education 0 0 0% 0 0%Adult Supplemental Education 0 0 0% 0 0%Area Vocational School 0 0 0%Tuition Reimbursement 0 0 0% 0 0%Special Education Coop 0 0 0% 0 0%TOTAL 207,879 220,220 6% 211,783 -4%
NOTE: Gifts/Grants includes private grants and grants from nonfederal sources.
Amount per pupil excludes the following funds: Area Vocational School, Adult Education, Adult Supplemental Education,Special Education Coop and Tuition Reimbursement.
*Enrollment (FTE) includes the enrollment of the district used for state aid and budget authority, and all other preschool enrollmentand kindergarten students attending full time.
0
50,000
100,000
150,000
200,000
250,000
2007-2008 2008-2009 2009-2010
School Administration Expenditures
10/1/2009 1:22 PM Sumexpen.xls Page 9 of 19
USD# 492
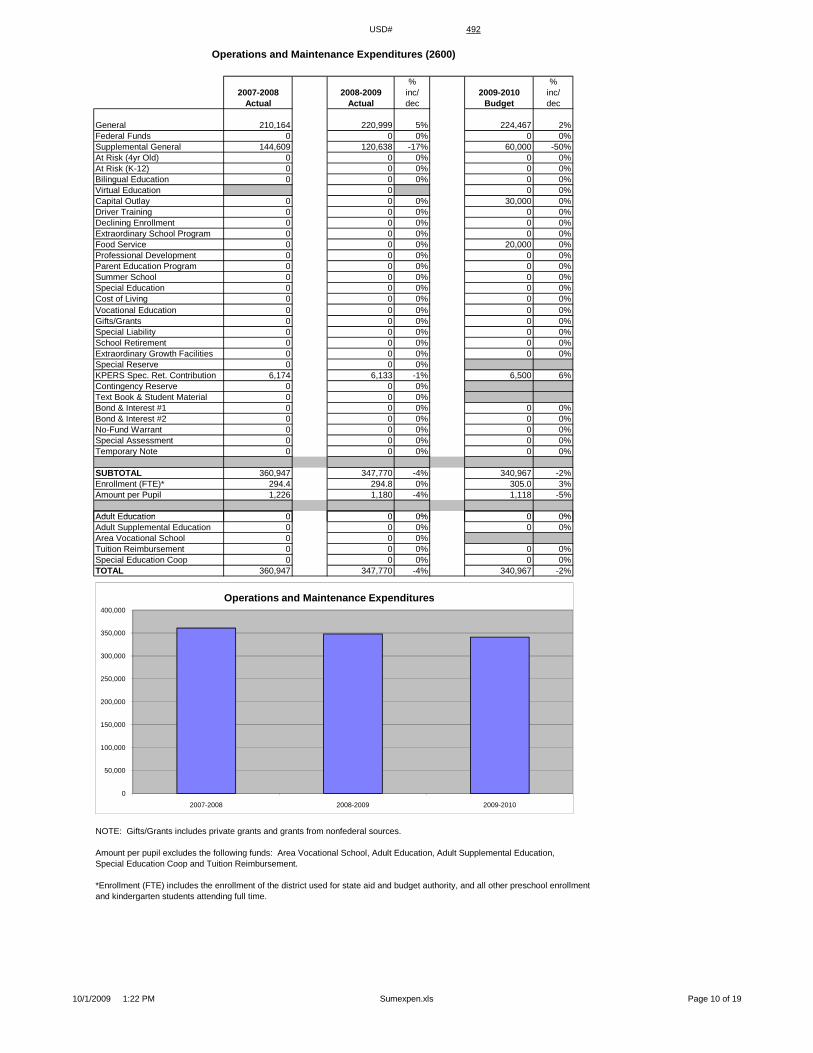
Operations and Maintenance Expenditures (2600)
% %2007-2008 2008-2009 inc/ 2009-2010 inc/
Actual Actual dec Budget dec
General 210,164 220,999 5% 224,467 2%Federal Funds 0 0 0% 0 0%Supplemental General 144,609 120,638 -17% 60,000 -50%At Risk (4yr Old) 0 0 0% 0 0%At Risk (K-12) 0 0 0% 0 0%Bilingual Education 0 0 0% 0 0%Virtual Education 0 0 0%Capital Outlay 0 0 0% 30,000 0%Driver Training 0 0 0% 0 0%Declining Enrollment 0 0 0% 0 0%Extraordinary School Program 0 0 0% 0 0%Food Service 0 0 0% 20,000 0%Professional Development 0 0 0% 0 0%Parent Education Program 0 0 0% 0 0%Summer School 0 0 0% 0 0%Special Education 0 0 0% 0 0%Cost of Living 0 0 0% 0 0%Vocational Education 0 0 0% 0 0%Gifts/Grants 0 0 0% 0 0%Special Liability 0 0 0% 0 0%School Retirement 0 0 0% 0 0%Extraordinary Growth Facilities 0 0 0% 0 0%Special Reserve 0 0 0%KPERS Spec. Ret. Contribution 6,174 6,133 -1% 6,500 6%Contingency Reserve 0 0 0%Text Book & Student Material 0 0 0%Bond & Interest #1 0 0 0% 0 0%Bond & Interest #2 0 0 0% 0 0%No-Fund Warrant 0 0 0% 0 0%Special Assessment 0 0 0% 0 0%Temporary Note 0 0 0% 0 0%
SUBTOTAL 360,947 347,770 -4% 340,967 -2%Enrollment (FTE)* 294.4 294.8 0% 305.0 3%Amount per Pupil 1,226 1,180 -4% 1,118 -5%
Adult Education 0 0 0% 0 0%Adult Education 0 0 0% 0 0%Adult Supplemental Education 0 0 0% 0 0%Area Vocational School 0 0 0%Tuition Reimbursement 0 0 0% 0 0%Special Education Coop 0 0 0% 0 0%TOTAL 360,947 347,770 -4% 340,967 -2%
NOTE: Gifts/Grants includes private grants and grants from nonfederal sources.
Amount per pupil excludes the following funds: Area Vocational School, Adult Education, Adult Supplemental Education,Special Education Coop and Tuition Reimbursement.
*Enrollment (FTE) includes the enrollment of the district used for state aid and budget authority, and all other preschool enrollmentand kindergarten students attending full time.
0
50,000
100,000
150,000
200,000
250,000
300,000
350,000
400,000
2007-2008 2008-2009 2009-2010
Operations and Maintenance Expenditures
10/1/2009 1:22 PM Sumexpen.xls Page 10 of 19

USD# 492
Other Costs(2500 & 2900: Other Supplemental Services)
(2700: Transportation)(3000: Non-Instruction Services)
% %2007-2008 2008-2009 inc/ 2009-2010 inc/
Actual Actual dec Budget dec
General 251,081 259,790 3% 237,610 -9%Federal Funds 0 0 0% 0 0%Supplemental General 58,900 49,875 -15% 65,000 30%At Risk (4yr Old) 0 0 0% 0 0%At Risk (K-12) 0 0 0% 0 0%Bilingual Education 0 0 0% 0 0%Virtual Education 0 0 0%Capital Outlay 0 0 0% 130,000 0%Driver Training 0 0 0% 0 0%Declining Enrollment 0 0 0% 0 0%Extraordinary School Program 0 0 0% 0 0%Food Service 167,391 175,630 5% 190,718 9%Professional Development 0 0 0% 0 0%Parent Education Program 0 0 0% 0 0%Summer School 0 0 0% 0 0%Special Education 26,812 22,450 -16% 29,892 33%Cost of Living 0 0 0% 0 0%Vocational Education 0 0 0% 0 0%Gifts/Grants 0 0 0% 0 0%Special Liability 0 0 0% 0 0%School Retirement 0 0 0% 0 0%Extraordinary Growth Facilities 0 0 0% 0 0%Special Reserve 0 0 0%KPERS Spec. Ret. Contribution 9,870 9,783 -1% 13,000 33%Contingency Reserve 0 0 0%Text Book & Student Material 0 0 0%Bond & Interest #1 0 0 0% 0 0%Bond & Interest #2 0 0 0% 0 0%No-Fund Warrant 0 0 0% 0 0%Special Assessment 0 0 0% 0 0%Temporary Note 0 0 0% 0 0%
SUBTOTAL 514,054 517,528 1% 666,220 29%Enrollment (FTE)* 294 4 294 8 0% 305 0 3%Enrollment (FTE)* 294.4 294.8 0% 305.0 3%Amount per Pupil 1,746 1,756 1% 2,184 24%
Adult Education 0 0 0% 0 0%Adult Supplemental Education 0 0 0% 0 0%Area Vocational School 0 0 0%Tuition Reimbursement 0 0 0% 0 0%Special Education Coop 0 0 0% 0 0%TOTAL 514,054 517,528 1% 666,220 29%
NOTE: Gifts/Grants includes private grants and grants from nonfederal sources.
Amount per pupil excludes the following funds: Area Vocational School, Adult Education, Adult Supplemental Education,Special Education Coop and Tuition Reimbursement.
*Enrollment (FTE) includes the enrollment of the district used for state aid and budget authority, and all other preschool enrollmentand kindergarten students attending full time.
0
100,000
200,000
300,000
400,000
500,000
600,000
700,000
2007-2008 2008-2009 2009-2010
Other Costs
10/1/2009 1:22 PM Sumexpen.xls Page 11 of 19

USD# 492
Capital Improvements Expenditures (4000)
% %2007-2008 2008-2009 inc/ 2009-2010 inc/
Actual Actual dec Budget dec
General 0 0 0% 0 0%Federal Funds 0 0 0% 0 0%Supplemental General 0 0 0% 0 0%At Risk (4yr Old) 0 0 0% 0 0%At Risk (K-12) 0 0 0% 0 0%Bilingual Education 0 0 0% 0 0%Virtual Education 0 0 0%Capital Outlay 103,193 18,728 -82% 175,000 834%Driver Training 0 0 0% 0 0%Declining Enrollment 0 0 0% 0 0%Extraordinary School Program 0 0 0% 0 0%Food Service 0 0 0% 0 0%Professional Development 0 0 0% 0 0%Parent Education Program 0 0 0% 0 0%Summer School 0 0 0% 0 0%Special Education 0 0 0% 0 0%Cost of Living 0 0 0% 0 0%Vocational Education 0 0 0% 0 0%Gifts/Grants 0 0 0% 0 0%Special Liability 0 0 0% 0 0%School Retirement 0 0 0% 0 0%Extraordinary Growth Facilities 0 0 0% 0 0%Special Reserve 0 0 0%KPERS Spec. Ret. Contribution 0 0 0% 0 0%Contingency Reserve 0 0 0%Text Book & Student Material 0 0 0%Bond & Interest #1 0 0 0% 0 0%Bond & Interest #2 0 0 0% 0 0%No-Fund Warrant 0 0 0% 0 0%Special Assessment 0 0 0% 0 0%Temporary Note 0 0 0% 0 0%
SUBTOTAL 103,193 18,728 -82% 175,000 834%Enrollment (FTE)* 294.4 294.8 0% 305.0 3%Amount per Pupil 351 64 -82% 574 803%
Adult Education 0 0 0% 0 0%Ad lt S l t l Ed ti 0 0 0% 0 0%Adult Supplemental Education 0 0 0% 0 0%Area Vocational School 0 0 0%Tuition Reimbursement 0 0 0% 0 0%Special Education Coop 0 0 0% 0 0%TOTAL 103,193 18,728 -82% 175,000 834%
NOTE: Gifts/Grants includes private grants and grants from nonfederal sources.
Amount per pupil excludes the following funds: Area Vocational School, Adult Education, Adult Supplemental Education,Special Education Coop and Tuition Reimbursement.
*Enrollment (FTE) includes the enrollment of the district used for state aid and budget authority, and all other preschool enrollmentand kindergarten students attending full time.
0
20,000
40,000
60,000
80,000
100,000
120,000
140,000
160,000
180,000
200,000
2007-2008 2008-2009 2009-2010
Capital Improvements (4000)
10/1/2009 1:22 PM Sumexpen.xls Page 12 of 19

USD# 492
Debt Services Expenditures (5100)
% %2007-2008 2008-2009 inc/ 2009-2010 inc/
Actual Actual dec Budget dec
General 0 0 0% 0 0%Federal Funds 0 0 0% 0 0%Supplemental General 0 0 0% 0 0%At Risk (4yr Old) 0 0 0% 0 0%At Risk (K-12) 0 0 0% 0 0%Bilingual Education 0 0 0% 0 0%Virtual Education 0 0 0%Capital Outlay 0 0 0% 0 0%Driver Training 0 0 0% 0 0%Declining Enrollment 0 0 0% 0 0%Extraordinary School Program 0 0 0% 0 0%Food Service 0 0 0% 0 0%Professional Development 0 0 0% 0 0%Parent Education Program 0 0 0% 0 0%Summer School 0 0 0% 0 0%Special Education 0 0 0% 0 0%Cost of Living 0 0 0% 0 0%Vocational Education 0 0 0% 0 0%Gifts/Grants 0 0 0% 0 0%Special Liability 0 0 0% 0 0%School Retirement 0 0 0% 0 0%Extraordinary Growth Facilities 0 0 0% 0 0%Special Reserve 0 0 0%KPERS Spec. Ret. Contribution 0 0 0% 0 0%Contingency Reserve 0 0 0%Text Book & Student Material 0 0 0%Bond & Interest #1 307,077 309,473 1% 284,946 -8%Bond & Interest #2 0 0 0% 0 0%No-Fund Warrant 0 0 0% 0 0%Special Assessment 0 0 0% 0 0%Temporary Note 0 0 0% 0 0%
SUBTOTAL 307,077 309,473 1% 284,946 -8%Enrollment (FTE)* 294.4 294.8 0% 305.0 3%Amount per Pupil 1,043 1,050 1% 934 -11%
Adult Education 0 0 0% 0 0%Adult Education 0 0 0% 0 0%Adult Supplemental Education 0 0 0% 0 0%Area Vocational School 0 0 0%Tuition Reimbursement 0 0 0% 0 0%Special Education Coop 0 0 0% 0 0%TOTAL 307,077 309,473 1% 284,946 -8%
NOTE: Gifts/Grants includes private grants and grants from nonfederal sources.
Amount per pupil excludes the following funds: Area Vocational School, Adult Education, Adult Supplemental Education,Special Education Coop and Tuition Reimbursement.
*Enrollment (FTE) includes the enrollment of the district used for state aid and budget authority, and all other preschool enrollmentand kindergarten students attending full time.
0
50,000
100,000
150,000
200,000
250,000
300,000
350,000
2007-2008 2008-2009 2009-2010
Debt Services (5100)
10/1/2009 1:22 PM Sumexpen.xls Page 13 of 19
USD# 492
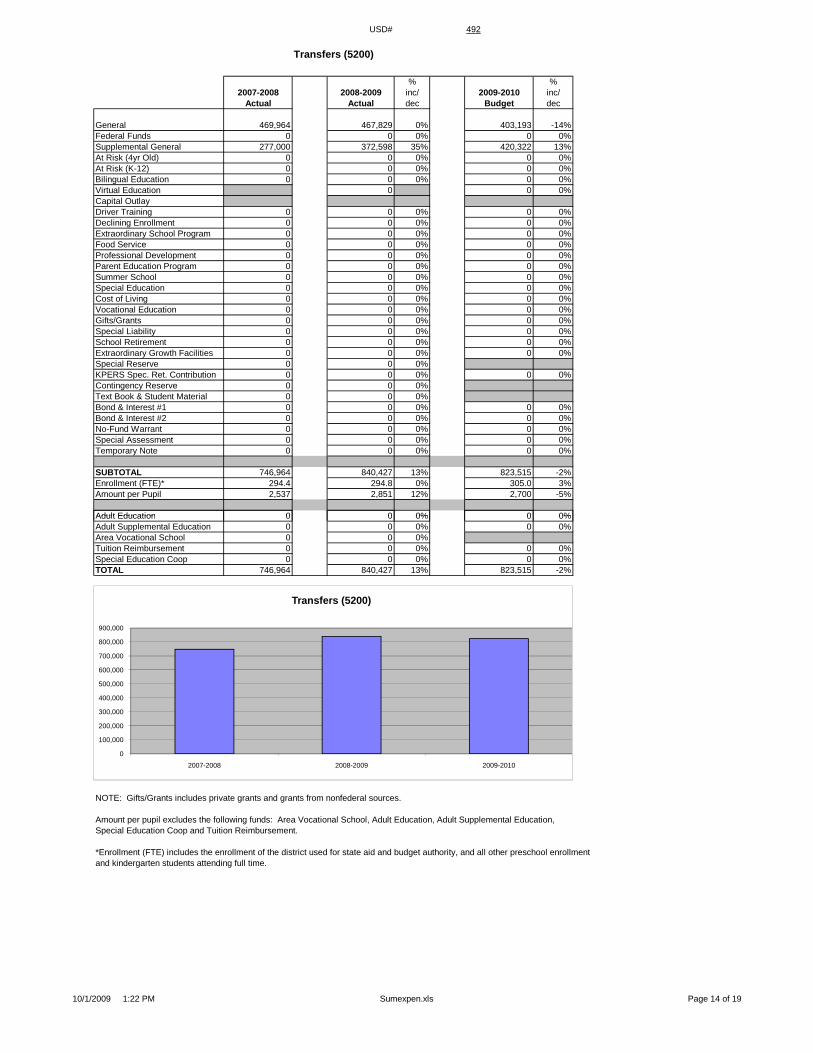
Transfers (5200)
% %2007-2008 2008-2009 inc/ 2009-2010 inc/
Actual Actual dec Budget dec
General 469,964 467,829 0% 403,193 -14%Federal Funds 0 0 0% 0 0%Supplemental General 277,000 372,598 35% 420,322 13%At Risk (4yr Old) 0 0 0% 0 0%At Risk (K-12) 0 0 0% 0 0%Bilingual Education 0 0 0% 0 0%Virtual Education 0 0 0%Capital OutlayDriver Training 0 0 0% 0 0%Declining Enrollment 0 0 0% 0 0%Extraordinary School Program 0 0 0% 0 0%Food Service 0 0 0% 0 0%Professional Development 0 0 0% 0 0%Parent Education Program 0 0 0% 0 0%Summer School 0 0 0% 0 0%Special Education 0 0 0% 0 0%Cost of Living 0 0 0% 0 0%Vocational Education 0 0 0% 0 0%Gifts/Grants 0 0 0% 0 0%Special Liability 0 0 0% 0 0%School Retirement 0 0 0% 0 0%Extraordinary Growth Facilities 0 0 0% 0 0%Special Reserve 0 0 0%KPERS Spec. Ret. Contribution 0 0 0% 0 0%Contingency Reserve 0 0 0%Text Book & Student Material 0 0 0%Bond & Interest #1 0 0 0% 0 0%Bond & Interest #2 0 0 0% 0 0%No-Fund Warrant 0 0 0% 0 0%Special Assessment 0 0 0% 0 0%Temporary Note 0 0 0% 0 0%
SUBTOTAL 746,964 840,427 13% 823,515 -2%Enrollment (FTE)* 294.4 294.8 0% 305.0 3%Amount per Pupil 2,537 2,851 12% 2,700 -5%
Adult Education 0 0 0% 0 0%Adult Education 0 0 0% 0 0%Adult Supplemental Education 0 0 0% 0 0%Area Vocational School 0 0 0%Tuition Reimbursement 0 0 0% 0 0%Special Education Coop 0 0 0% 0 0%TOTAL 746,964 840,427 13% 823,515 -2%
NOTE: Gifts/Grants includes private grants and grants from nonfederal sources.
Amount per pupil excludes the following funds: Area Vocational School, Adult Education, Adult Supplemental Education,Special Education Coop and Tuition Reimbursement.
*Enrollment (FTE) includes the enrollment of the district used for state aid and budget authority, and all other preschool enrollmentand kindergarten students attending full time.
0
100,000
200,000
300,000
400,000
500,000
600,000
700,000
800,000
900,000
2007-2008 2008-2009 2009-2010
Transfers (5200)
10/1/2009 1:22 PM Sumexpen.xls Page 14 of 19

USD# 492Miscellaneous Information
Unencumbered Cash Balance by Fund
July 1, 2007 July 1, 2008 July 1, 2009General 307 35 0Federal Funds 0 0 0Supplemental General 31,115 36,717 62,254At Risk (4yr Old) 0 0 0At Risk (K-12) 24,895 23,322 44,184Bilingual Education 0 0 0Virtual Education 0 0Capital Outlay 370,281 384,592 516,606Driver Training 3,748 4,041 4,002Declining Enrollment 0 0 0Extraordinary School Program 0 0 0Food Service 46,598 46,574 49,531Professional Development 26,988 30,998 34,746Parent Education Program 0 0 0Summer School 4,876 4,876 4,876Special Education 47,540 48,056 49,195Cost of Living 0 0 0Vocational Education 22,681 22,783 25,035Gifts/Grants 5,301 9,274 8,991Special Liability 0 0 0School Retirement 0 0 0Extraordinary Growth Facilities 0 0 0Special Reserve 0 0KPERS Spec. Ret. Contribution 0 0 0Contingency Reserve 68,915 118,915Text Book & Student Material 9,708 3,233Bond & Interest 1 502,288 508,211 489,168Bond & Interest 2 0 0 0No Fund Warrant 0 0 0Special Assessment 0 0 0Temporary Note 0 0 0
SUBTOTAL 1,165,241 1,241,627 1,288,588Enrollment (FTE)* 294.4 294.8 305.0Amount per Pupil 3,958 4,212 4,225
Adult Education 0 0 0Adult Supplemental Education 0 0 0du t Supp e e ta ducat o 0 0 0Area Vocational School 0 0Tuition Reimbursement 0 0 0Special Education Coop 0 0 0TOTAL 1,165,241 1,241,627 1,288,588
NOTE: Gifts/Grants includes private grants and grants from nonfederal sources.
Amount per pupil excludes the following funds: Area Vocational School, Adult Education, Adult Supplemental Education,Special Education Coop and Tuition Reimbursement.
*Enrollment (FTE) includes the enrollment of the district used for state aid and budget authority, and all other preschool enrollmentand kindergarten students attending full time.
0
200,000
400,000
600,000
800,000
1,000,000
1,200,000
1,400,000
July 1, 2007 July 1, 2008 July 1, 2009
Unencumbered Cash Balances by Fund
10/1/2009 1:22 PM Sumexpen.xls Page 15 of 19
USD# 492
Reserve FundsUnencumbered Cash Balance
July 1, 2007 July 1, 2008Special Reserve 0 0TOTAL OTHER 0 0Amount per Pupil $0 $0
*School districts are authorized by law to self insure rather than purchase insurance for the following categories: Worker's Comp,Health Insurance, Life Insurance, Property and Casualty (Risk Management) and Disability Income Insurance. Monies are placedin the Self Insured Fund to pay for claims which may arise from the categories listed above.
0
0
0
0
0
1
1
1
1
1
1
July 1, 2007 July 1, 2008
Unencumbered Cash Balances by Fund (Reserve Funds Only)
10/1/2009 1:22 PM Sumexpen.xls Page 16 of 19

USD# 492Other Information
2005-2006 2006-2007 % 2007-2008 % 2008-2009 % 2009-2010 %Actual Actual inc/ Actual inc/ Actual inc/ Budget inc/
dec dec dec dec
Enrollment (FTE)* 312.4 316.3 1% 294.4 -7% 278.0 -6% 305.0 10%
Enrollment (FTE)** 312.4 316.3 1% 294.4 -7% 294.8 0% 305.0 3%Number of Students - Free Meals 63 83 32% 63 -24% 77 22% 80 4%Number of Students - Reduced Meals 44 45 2% 37 -18% 33 -11% 37 12%
0.0
50.0
100.0
150.0
200.0
250.0
300.0
350.0
2005-2006 2006-2007 2007-2008 2008-2009 2009-2010
Enrollment (FTE)* for Budget Authority
300.0
305.0
310.0
315.0
320.0
Enrollment (FTE)** Used for Calculating "Amount Per Pupil"
*FTE for state aid and budget authority purposes for general fund (excludes 4 yr old at-risk).
** FTE includes 9/20 enrollment used for state aid purposes and adding the additional FTE for preschool programs, headstart, and all-daykindergarten. For example, preschool students attending half days on September 20th would be counted as .5 FTE. Kindergartenstudents attending full time every day would be counted as 1.0 FTE.
0.0
50.0
100.0
150.0
200.0
250.0
300.0
350.0
2005-2006 2006-2007 2007-2008 2008-2009 2009-2010
Enrollment (FTE)* for Budget Authority
0
10
20
30
40
50
60
70
80
90
2005-2006 2006-2007 2007-2008 2008-2009 2009-2010
Low Income Students
Free Meals
Reduced Meals
280.0
285.0
290.0
295.0
300.0
305.0
310.0
315.0
320.0
2005-2006 2006-2007 2007-2008 2008-2009 2009-2010
Enrollment (FTE)** Used for Calculating "Amount Per Pupil"
10/1/2009 1:22 PM Sumexpen.xls Page 17 of 19

USD# 492
Miscellaneous InformationMill Rates by Fund
2007-2008 2008-2009 2009-2010Actual Actual Budget
General 20.000 20.000 20.000Supplemental General 24.756 25.967 24.717Adult Education 0.000 0.000 0.000Capital Outlay 3.989 3.999 4.000Declining Enrollment 0.000 0.000 0.000Cost of Living 0.000 0.000 0.000Special Liability 0.000 0.000 0.000School Retirement 0.000 0.000 0.000Extraordinary Growth Facilities 0.000 0.000 0.000Bond & Interest 1 12.285 12.498 13.831Bond & Interest 2 0.000 0.000 0.000No Fund Warrant 0.000 0.000 0.000Special Assessment 0.000 0.000 0.000Temporary Note 0.000 0.000 0.000TOTAL USD 61.030 62.464 62.548Historical Museum 0.000 0.000 0.000Public Library Board 0.000 0.000 0.000Public Library Brd & Emp Benf 0.000 0.000 0.000Recreation Commission 0.000 0.000 0.000Recreation Commission Employee Benefit 0.000 0.000 0.000TOTAL OTHER 0.000 0.000 0.000
10.000
20.000
30.000
40.000
50.000
60.000
70.000
Total USD Mill Rates
General32%
Supplemental General40%
Capital Outlay6%
Bond & Interest 122%
2009-2010 Miscellaneous InformationMill Rates by Fund (Total USD)
General
Supplemental General
Adult Education
Capital Outlay
Special Liability
School Retirement
Declining Enrollment
Cost of Living
Bond & Interest 1
Bond & Interest 2
Extraordinary Growth Facilities
No Fund Warrant
Special Assessment
Temporary Note
0.000
10.000
20.000
30.000
40.000
50.000
60.000
70.000
2007-2008 2008-2009 2009-2010
Total USD Mill Rates
10/1/2009 1:22 PM Sumexpen.xls Page 18 of 19

USD# 492Other Information
2007-2008 2008-2009 2009-2010Actual Actual Budget
Assessed Valuation $15,185,888 $15,388,866 $14,644,429
Bonded Indebtedness $3,405,000 $3,260,000 $3,280,098
$0
$2,000,000
$4,000,000
$6,000,000
$8,000,000
$10,000,000
$12,000,000
$14,000,000
$16,000,000
$18,000,000
2007-2008 2008-2009 2009-2010
Assessed Valuation
$0
$500,000
$1,000,000
$1,500,000
$2,000,000
$2,500,000
$3,000,000
$3,500,000
$4,000,000
2007-2008 2008-2009 2009-2010
Bonded Indebtedness
$0
$2,000,000
$4,000,000
$6,000,000
$8,000,000
$10,000,000
$12,000,000
$14,000,000
$16,000,000
$18,000,000
2007-2008 2008-2009 2009-2010
Assessed Valuation
$0
$500,000
$1,000,000
$1,500,000
$2,000,000
$2,500,000
$3,000,000
$3,500,000
$4,000,000
2007-2008 2008-2009 2009-2010
Bonded Indebtedness
10/1/2009 1:22 PM Sumexpen.xls Page 19 of 19