fitch ratings, inc. 2016 form nrsro annual certification exhibit 1
TRANSCRIPT

Fitch Ratings, Inc.
2017 Form NRSRO Annual Certification
Exhibit 1. Credit Ratings Performance Statistics.
Fitch Ratings Inc. (“Fitch”) makes information pursuant to the requirements of 17 CFR 17g-2(d) publicly available at the following web address: https://www.fitchratings.com/site/regulatory
The files containing the information can be found at the above web address by clicking on the links under the title “Annual NRSRO Certification.”

A. Financial Institutions, Brokers, or Dealers - 1-Year Transition and Default Rates
(December 31, 2015 through December 31, 2016)
Credit Ratings as of
12/31/2015 Credit ratings as of 12/31/2016 (%)
Other Outcomes During
12/31/2015 - 12/31/2016 (%)
Credit
Rating
# of Ratings
Outstanding AAA AA+ AA AA-
A+ A A-
BBB+ BBB BBB-
BB+ BB BB-
B+ B B-
CCC+ CCC CCC-
CC C Default Paid Off Withdrawn
(other)
AAA 14 100.0%
AA+ 2 100.0%
AA 13 100.0%
AA- 73 2.7% 94.5% 2.7%
A+ 106 3.8% 79.2% 11.3% 0.9% 4.7%
A 146 4.8% 85.6% 4.8% 0.7% 4.1%
A- 130 2.3% 86.2% 9.2% 0.8% 1.5%
BBB+ 125 2.4% 88.8% 7.2% 1.6%
BBB 124 1.6% 86.3% 8.9% 0.8% 2.4%
BBB- 178 7.9% 75.3% 9.0% 7.9%
BB+ 70 11.4% 67.1% 12.9% 1.4% 7.1%
BB 62 8.1% 72.6% 9.7% 1.6% 8.1%
BB- 53 3.8% 83.0% 11.3% 1.9%
B+ 44 22.7% 56.8% 9.1% 4.5% 2.3% 4.5%
B 43 9.3% 53.5% 23.3% 4.7% 9.3%
B- 37 10.8% 5.4% 73.0% 5.4% 5.4%
CCC+
CCC 21 19.0% 33.3% 38.1% 4.8% 4.8%
CCC-
CC C
TOTAL 1241
A. Financial Institutions, Brokers, or Dealers - 3-Year Transition and Default Rates
(December 31, 2013 through December 31, 2016)
Credit Ratings as of
12/31/2013 Credit ratings as of 12/31/2016 (%)
Other Outcomes During
12/31/2013 - 12/31/2016 (%)
Credit
Rating
# of Ratings
Outstanding AAA AA+ AA AA-
A+ A A-
BBB+ BBB BBB-
BB+ BB BB-
B+ B B-
CCC+ CCC CCC-
CC C Default Paid Off Withdrawn
(other)
AAA 12 91.7% 8.3%
AA+ 1 100.0%
AA 3 100.0%
AA- 77 14.3% 75.3% 2.6% 2.6% 5.2%
A+ 103 1.0% 11.7% 53.4% 10.7% 8.7% 2.9% 11.7%
A 166 11.4% 60.8% 7.2% 6.0% 1.2% 0.6% 12.7%
A- 121 0.8% 4.1% 10.7% 50.4% 14.9% 4.1% 5.0% 9.9%
BBB+ 119 10.9% 48.7% 3.4% 15.1% 2.5% 0.8% 18.5%
BBB 161 1.2% 11.8% 47.8% 14.3% 3.7% 3.7% 1.2% 0.6% 0.6% 14.9%
BBB- 140 0.7% 14.3% 49.3% 9.3% 2.1% 1.4% 22.9%
BB+ 73 17.8% 34.2% 17.8% 15.1% 2.7% 1.4% 1.4% 9.6%
BB 45 6.7% 11.1% 44.4% 11.1% 2.2% 2.2% 2.2% 2.2% 17.8%
BB- 42 2.4% 14.3% 52.4% 11.9% 2.4% 16.7%
B+ 38 2.6% 15.8% 26.3% 10.5% 2.6% 7.9% 7.9% 26.3%
B 52 9.6% 13.5% 23.1% 23.1% 7.7% 1.9% 21.2%
B- 52 1.9% 7.7% 17.3% 32.7% 1.9% 15.4% 23.1%
CCC+
CCC 5 20.0% 40.0% 40.0%
CCC-
CC C 1 100.0%
TOTAL 1211
Page 2
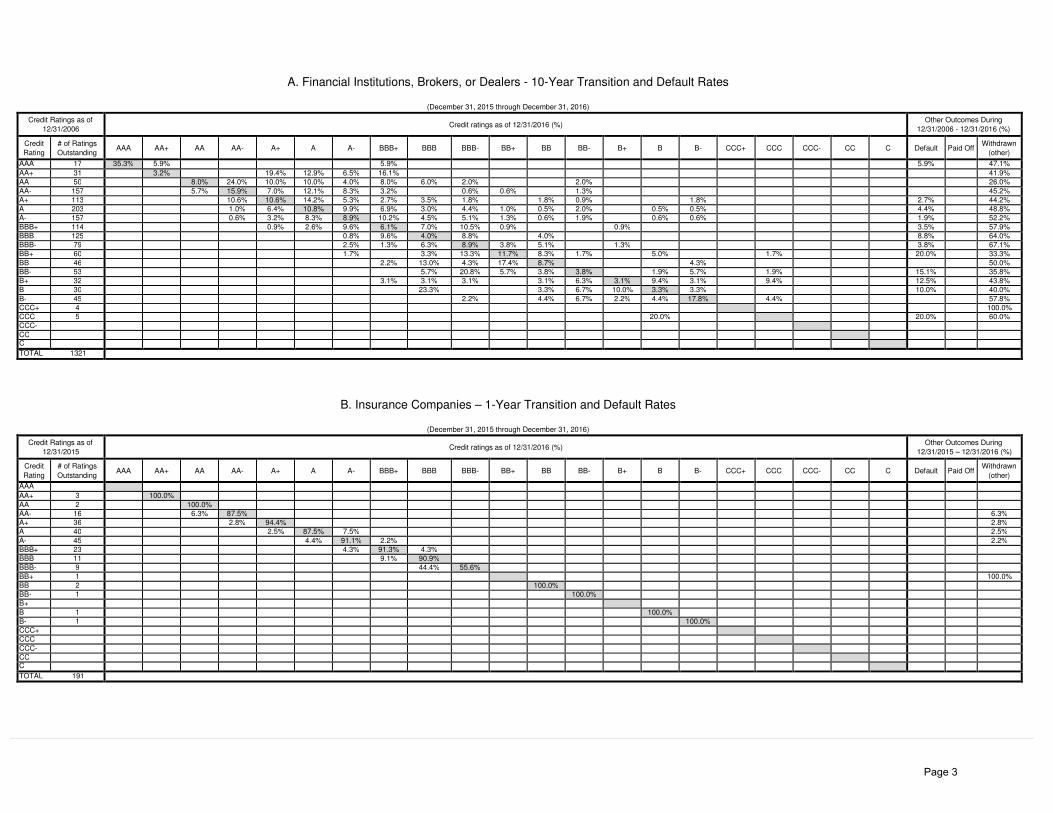
A. Financial Institutions, Brokers, or Dealers - 10-Year Transition and Default Rates
(December 31, 2015 through December 31, 2016)
Credit Ratings as of
12/31/2006 Credit ratings as of 12/31/2016 (%)
Other Outcomes During
12/31/2006 - 12/31/2016 (%)
Credit
Rating
# of Ratings
Outstanding AAA AA+ AA AA-
A+ A A-
BBB+ BBB BBB-
BB+ BB BB-
B+ B B-
CCC+ CCC CCC-
CC C Default Paid Off Withdrawn
(other)
AAA 17 35.3% 5.9% 5.9% 5.9% 47.1%
AA+ 31 3.2% 19.4% 12.9% 6.5% 16.1% 41.9%
AA 50 8.0% 24.0% 10.0% 10.0% 4.0% 8.0% 6.0% 2.0% 2.0% 26.0%
AA- 157 5.7% 15.9% 7.0% 12.1% 8.3% 3.2% 0.6% 0.6% 1.3% 45.2%
A+ 113 10.6% 10.6% 14.2% 5.3% 2.7% 3.5% 1.8% 1.8% 0.9% 1.8% 2.7% 44.2%
A 203 1.0% 6.4% 10.8% 9.9% 6.9% 3.0% 4.4% 1.0% 0.5% 2.0% 0.5% 0.5% 4.4% 48.8%
A- 157 0.6% 3.2% 8.3% 8.9% 10.2% 4.5% 5.1% 1.3% 0.6% 1.9% 0.6% 0.6% 1.9% 52.2%
BBB+ 114 0.9% 2.6% 9.6% 6.1% 7.0% 10.5% 0.9% 0.9% 3.5% 57.9%
BBB 125 0.8% 9.6% 4.0% 8.8% 4.0% 8.8% 64.0%
BBB- 79 2.5% 1.3% 6.3% 8.9% 3.8% 5.1% 1.3% 3.8% 67.1%
BB+ 60 1.7% 3.3% 13.3% 11.7% 8.3% 1.7% 5.0% 1.7% 20.0% 33.3%
BB 46 2.2% 13.0% 4.3% 17.4% 8.7% 4.3% 50.0%
BB- 53 5.7% 20.8% 5.7% 3.8% 3.8% 1.9% 5.7% 1.9% 15.1% 35.8%
B+ 32 3.1% 3.1% 3.1% 3.1% 6.3% 3.1% 9.4% 3.1% 9.4% 12.5% 43.8%
B 30 23.3% 3.3% 6.7% 10.0% 3.3% 3.3% 10.0% 40.0%
B- 45 2.2% 4.4% 6.7% 2.2% 4.4% 17.8% 4.4% 57.8%
CCC+ 4 100.0%
CCC 5 20.0% 20.0% 60.0%
CCC-
CC C
TOTAL 1321
B. Insurance Companies – 1-Year Transition and Default Rates
(December 31, 2015 through December 31, 2016)
Credit Ratings as of
12/31/2015 Credit ratings as of 12/31/2016 (%)
Other Outcomes During
12/31/2015 – 12/31/2016 (%)
Credit
Rating
# of Ratings
Outstanding AAA AA+ AA AA-
A+ A A-
BBB+ BBB BBB-
BB+ BB BB-
B+ B B-
CCC+ CCC CCC-
CC C Default Paid Off Withdrawn
(other)
AAA
AA+ 3 100.0%
AA 2 100.0%
AA- 16 6.3% 87.5% 6.3%
A+ 36 2.8% 94.4% 2.8%
A 40 2.5% 87.5% 7.5% 2.5%
A- 45 4.4% 91.1% 2.2% 2.2%
BBB+ 23 4.3% 91.3% 4.3%
BBB 11 9.1% 90.9%
BBB- 9 44.4% 55.6%
BB+ 1 100.0%
BB 2 100.0%
BB- 1 100.0%
B+
B 1 100.0%
B- 1 100.0%
CCC+
CCC
CCC-
CC C
TOTAL 191
Page 3
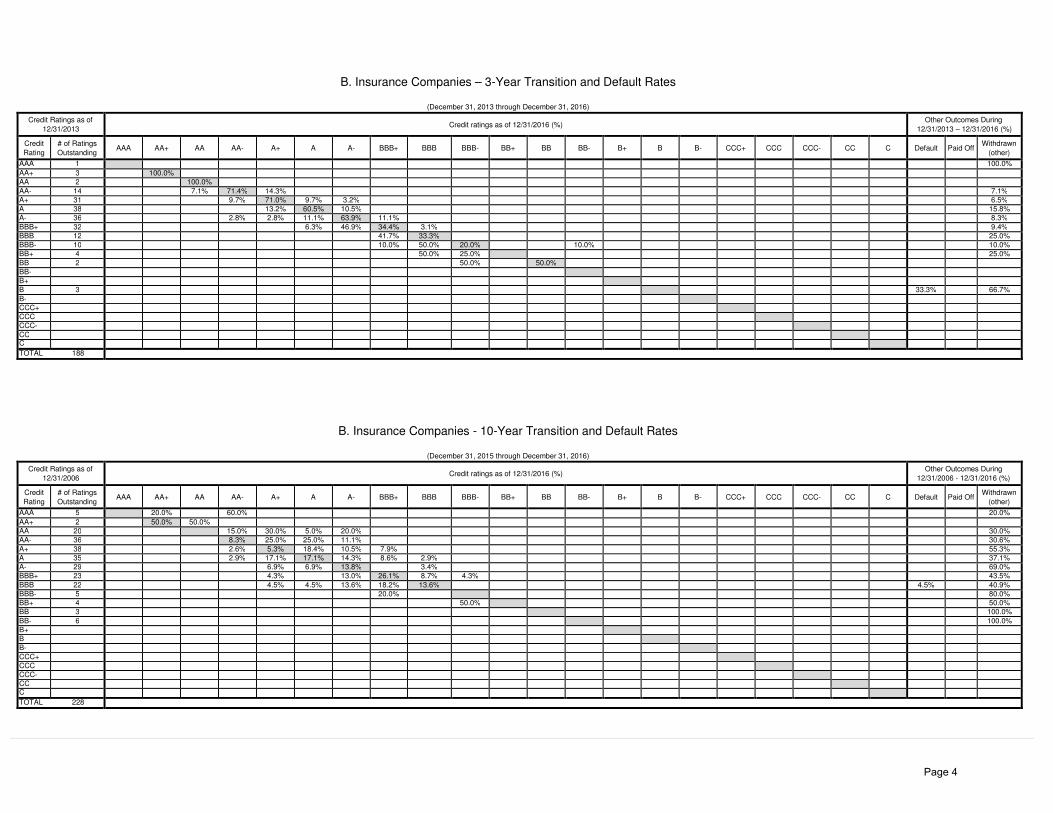
B. Insurance Companies – 3-Year Transition and Default Rates
(December 31, 2013 through December 31, 2016)
Credit Ratings as of
12/31/2013
Credit ratings as of 12/31/2016 (%) Other Outcomes During
12/31/2013 – 12/31/2016 (%)
Credit
Rating
# of Ratings
Outstanding
AAA
AA+
AA
AA-
A+
A
A-
BBB+
BBB
BBB-
BB+
BB
BB-
B+
B
B-
CCC+
CCC
CCC-
CC
C
Default
Paid Off Withdrawn
(other)
AAA 1 100.0%
AA+ 3 100.0%
AA 2 100.0%
AA- 14 7.1% 71.4% 14.3% 7.1%
A+ 31 9.7% 71.0% 9.7% 3.2% 6.5%
A 38 13.2% 60.5% 10.5% 15.8%
A- 36 2.8% 2.8% 11.1% 63.9% 11.1% 8.3%
BBB+ 32 6.3% 46.9% 34.4% 3.1% 9.4%
BBB 12 41.7% 33.3% 25.0%
BBB- 10 10.0% 50.0% 20.0% 10.0% 10.0%
BB+ 4 50.0% 25.0% 25.0%
BB 2 50.0% 50.0%
BB-
B+
B 3 33.3% 66.7%
B-
CCC+
CCC
CCC-
CC
C
TOTAL 188
B. Insurance Companies - 10-Year Transition and Default Rates
(December 31, 2015 through December 31, 2016)
Credit Ratings as of
12/31/2006
Credit ratings as of 12/31/2016 (%) Other Outcomes During
12/31/2006 - 12/31/2016 (%)
Credit
Rating
# of Ratings
Outstanding
AAA
AA+
AA
AA-
A+
A
A-
BBB+
BBB
BBB-
BB+
BB
BB-
B+
B
B-
CCC+
CCC
CCC-
CC
C
Default
Paid Off Withdrawn
(other)
AAA 5 20.0% 60.0% 20.0%
AA+ 2 50.0% 50.0%
AA 20 15.0% 30.0% 5.0% 20.0% 30.0%
AA- 36 8.3% 25.0% 25.0% 11.1% 30.6%
A+ 38 2.6% 5.3% 18.4% 10.5% 7.9% 55.3%
A 35 2.9% 17.1% 17.1% 14.3% 8.6% 2.9% 37.1%
A- 29 6.9% 6.9% 13.8% 3.4% 69.0%
BBB+ 23 4.3% 13.0% 26.1% 8.7% 4.3% 43.5%
BBB 22 4.5% 4.5% 13.6% 18.2% 13.6% 4.5% 40.9%
BBB- 5 20.0% 80.0%
BB+ 4 50.0% 50.0%
BB 3 100.0%
BB- 6 100.0%
B+
B
B-
CCC+
CCC
CCC-
CC
C
TOTAL 228
Page 4

C. Corporate issuers - 1-Year Transition and Default Rates
(December 31, 2013 through December 31, 2016)
Credit Ratings as of
12/31/2015 Credit ratings as of 12/31/2016 (%)
Other Outcomes During
12/31/2015 - 12/31/2016 (%)
Credit
Rating
# of Ratings
Outstanding AAA AA+ AA AA-
A+ A A-
BBB+ BBB BBB-
BB+ BB BB-
B+ B B-
CCC+ CCC CCC-
CC C Default Paid Off Withdrawn
(other)
AAA 1 100.0%
AA+ 2 50.0% 50.0%
AA 11 54.5% 18.2% 27.3%
AA- 16 87.5% 6.3% 6.3%
A+ 48 4.2% 91.7% 4.2%
A 99 1.0% 85.9% 11.1% 1.0% 1.0%
A- 143 0.7% 2.8% 88.1% 4.2% 2.1% 2.1%
BBB+ 248 3.6% 83.5% 9.7% 0.8% 2.4%
BBB 229 0.4% 6.6% 78.2% 7.4% 1.7% 5.7%
BBB- 285 1.1% 7.0% 75.8% 8.8% 0.7% 0.4% 0.4% 1.1% 4.9%
BB+ 120 13.3% 72.5% 5.8% 0.8% 2.5% 0.8% 4.2%
BB 91 8.8% 61.5% 16.5% 4.4% 1.1% 1.1% 6.6%
BB- 101 3.0% 15.8% 48.5% 16.8% 6.9% 2.0% 6.9%
B+ 90 1.1% 2.2% 7.8% 62.2% 11.1% 5.6% 1.1% 1.1% 7.8%
B 69 2.9% 11.6% 59.4% 4.3% 4.3% 5.8% 11.6%
B- 34 11.8% 5.9% 35.3% 11.8% 2.9% 17.6% 14.7%
CCC+
CCC 30 16.7% 20.0% 26.7% 6.7% 3.3% 23.3% 3.3%
CCC-
CC 8 87.5% 12.5% C 4 100.0%
TOTAL 1629
C. Corporate issuers - 3-Year Transition and Default Rates
(December 31, 2013 through December 31, 2016)
Credit Ratings as of
12/31/2013 Credit ratings as of 12/31/2016 (%)
Other Outcomes During
12/31/2013 - 12/31/2016 (%)
Credit
Rating
# of Ratings
Outstanding AAA AA+ AA AA-
A+ A A-
BBB+ BBB BBB-
BB+ BB BB-
B+ B B-
CCC+ CCC CCC-
CC C Default Paid Off Withdrawn
(other)
AAA 1 100.0%
AA+ 4 25.0% 25.0% 50.0%
AA 13 46.2% 23.1% 30.8%
AA- 14 71.4% 7.1% 14.3% 7.1%
A+ 51 5.9% 70.6% 11.8% 7.8% 2.0% 2.0%
A 99 2.0% 58.6% 25.3% 2.0% 3.0% 9.1%
A- 134 1.5% 7.5% 55.2% 23.1% 1.5% 2.2% 9.0%
BBB+ 243 12.3% 57.6% 11.5% 2.9% 1.2% 14.4%
BBB 259 1.2% 12.0% 47.1% 12.7% 5.0% 0.4% 0.4% 0.4% 20.8%
BBB- 235 0.9% 3.0% 16.2% 46.8% 8.1% 0.9% 1.3% 0.9% 0.4% 0.9% 0.4% 20.4%
BB+ 136 2.9% 22.8% 41.2% 3.7% 2.2% 1.5% 0.7% 1.5% 1.5% 22.1%
BB 114 0.9% 5.3% 7.9% 28.9% 8.8% 8.8% 1.8% 0.9% 1.8% 35.1%
BB- 101 3.0% 10.9% 10.9% 22.8% 16.8% 5.9% 1.0% 1.0% 5.0% 22.8%
B+ 105 1.0% 1.0% 1.0% 8.6% 9.5% 25.7% 8.6% 1.9% 1.9% 11.4% 29.5%
B 88 6.8% 5.7% 17.0% 20.5% 1.1% 2.3% 1.1% 11.4% 34.1%
B- 51 17.6% 15.7% 9.8% 21.6% 35.3%
CCC+
CCC 21 9.5% 4.8% 14.3% 28.6% 4.8% 14.3% 23.8%
CCC-
CC 4 75.0% 25.0% C 3 100.0%
TOTAL 1676
Page 5

C. Corporate issuers - 10-Year Transition and Default Rates
(December 31, 2006 through December 31, 2016)
Credit Ratings as of
12/31/2006
Credit ratings as of 12/31/2016 (%) Other Outcomes During
12/31/2006 - 12/31/2016 (%)
Credit
Rating
# of Ratings
Outstanding
AAA
AA+
AA
AA-
A+
A
A-
BBB+
BBB
BBB-
BB+
BB
BB-
B+
B
B-
CCC+
CCC
CCC-
CC
C
Default
Paid Off Withdrawn
(other)
AAA 7 14.3% 28.6% 14.3% 14.3% 28.6%
AA+ 5 20.0% 40.0% 40.0%
AA 16 6.3% 6.3% 31.3% 56.3%
AA- 33 9.1% 3.0% 9.1% 15.2% 6.1% 9.1% 3.0% 45.5%
A+ 74 2.7% 8.1% 21.6% 21.6% 8.1% 2.7% 2.7% 6.8% 25.7%
A 117 1.7% 6.8% 14.5% 23.9% 12.8% 4.3% 1.7% 2.6% 0.9% 0.9% 29.9%
A- 145 4.1% 2.1% 3.4% 19.3% 20.0% 11.0% 4.1% 0.7% 0.7% 0.7% 33.8%
BBB+ 196 4.1% 8.2% 28.1% 13.8% 5.6% 3.6% 0.5% 0.5% 35.7%
BBB 212 5.7% 14.2% 20.3% 8.5% 3.8% 0.5% 1.4% 0.9% 44.8%
BBB- 177 0.6% 2.3% 7.3% 8.5% 18.6% 3.4% 1.1% 2.3% 0.6% 3.4% 52.0%
BB+ 81 1.2% 7.4% 4.9% 14.8% 6.2% 3.7% 2.5% 1.2% 1.2% 1.2% 7.4% 48.1%
BB 98 1.0% 1.0% 7.1% 6.1% 7.1% 8.2% 3.1% 4.1% 3.1% 4.1% 8.2% 46.9%
BB- 71 1.4% 5.6% 8.5% 2.8% 4.2% 5.6% 4.2% 4.2% 1.4% 11.3% 50.7%
B+ 72 2.8% 1.4% 1.4% 6.9% 4.2% 1.4% 16.7% 65.3%
B 83 4.8% 2.4% 1.2% 1.2% 3.6% 1.2% 14.5% 71.1%
B- 55 5.5% 1.8% 1.8% 3.6% 3.6% 21.8% 61.8%
CCC+
CCC 21 9.5% 66.7% 23.8%
CCC-
CC
C
TOTAL 1463
D(i) Residential mortgage backed securities ("RMBS") - 1-Year Transition and Default Rates
(December 31, 2015 through December 31, 2016)
Credit Ratings as of
12/31/2015
Credit ratings as of 12/31/2016 (%) Other Outcomes During
12/31/2015 - 12/31/2016 (%)
Credit
Rating
# of Ratings
Outstanding
AAA
AA+
AA
AA-
A+
A
A-
BBB+
BBB
BBB-
BB+
BB
BB-
B+
B
B-
CCC+
CCC
CCC-
CC
C
Default
Paid Off Withdrawn
(other)
AAA 2559 72.9% 0.04% 0.4% 0.04% 0.04% 0.2% 0.1% 0.04% 0.1% 26.1% 0.04%
AA+ 213 6.1% 76.1% 5.6% 0.5% 0.9% 0.5% 0.9% 9.4%
AA 956 7.9% 1.6% 57.6% 0.1% 0.1% 9.6% 1.3% 21.7% 0.1%
AA- 77 1.3% 3.9% 14.3% 66.2% 2.6% 7.8% 2.6% 1.3%
A+ 121 1.7% 0.8% 10.7% 7.4% 59.5% 1.7% 18.2%
A 2135 0.9% 0.1% 8.1% 0.2% 1.0% 66.8% 0.2% 0.3% 5.0% 0.5% 0.4% 16.0% 0.3%
A- 76 3.9% 13.2% 5.3% 68.4% 1.3% 7.9%
BBB+ 89 2.2% 15.7% 14.6% 50.6% 3.4% 2.2% 11.2%
BBB 1766 1.1% 0.1% 14.5% 0.3% 0.5% 62.3% 0.1% 8.2% 0.7% 0.1% 0.1% 0.2% 11.6% 0.5%
BBB- 95 3.2% 12.6% 9.5% 17.9% 53.7% 1.1% 2.1%
BB+ 43 2.3% 16.3% 4.7% 69.8% 7.0%
BB 1846 0.2% 1.4% 12.7% 0.2% 0.6% 75.0% 0.1% 2.3% 0.8% 0.2% 0.1% 6.0% 0.6%
BB- 36 2.8% 44.4% 5.6% 41.7% 5.6%
B+ 15 6.7% 13.3% 73.3% 6.7%
B 1638 1.5% 37.6% 0.4% 0.2% 48.6% 2.8% 0.4% 0.9% 0.4% 6.7% 0.5%
B- 21 100.0%
CCC+
CCC 1841 1.4% 0.1% 34.6% 0.1% 50.8% 3.2% 4.6% 1.2% 3.9% 0.2% CCC-
CC 2434 0.1% 1.2% 31.9% 47.7% 13.8% 2.0% 3.2% 0.2% C 2483 0.1% 0.1% 0.1% 17.6% 65.1% 15.9% 1.0%
TOTAL 18444
Page 6

D(i) Residential mortgage backed securities ("RMBS") - 3-Year Transition and Default Rates
(December 31, 2013 through December 31, 2016)
Credit Ratings as of
12/31/2013
Credit ratings as of 12/31/2016 (%) Other Outcomes During
12/31/2013 - 12/31/2016 (%)
Credit
Rating
# of Ratings
Outstanding
AAA
AA+
AA
AA-
A+
A
A-
BBB+
BBB
BBB-
BB+
BB
BB-
B+
B
B-
CCC+
CCC
CCC-
CC
C
Default
Paid Off Withdrawn
(other)
AAA 2591 37.5% 0.04% 1.7% 0.04% 0.2% 2.2% 0.2% 0.1% 0.1% 57.7% 0.2%
AA+ 180 4.4% 46.1% 7.2% 2.2% 2.2% 0.6% 36.1% 1.1%
AA 1346 4.9% 1.2% 26.2% 0.1% 17.5% 0.1% 0.1% 9.1% 3.0% 0.6% 0.1% 36.6% 0.4%
AA- 144 9.7% 36.1% 11.1% 19.4% 4.9% 7.6% 2.1% 1.4% 7.6%
A+ 76 1.3% 7.9% 14.5% 11.8% 34.2% 1.3% 26.3% 2.6%
A 1906 1.0% 0.2% 7.5% 0.5% 2.2% 42.8% 0.1% 0.6% 8.7% 0.2% 0.1% 3.1% 0.1% 0.5% 0.1% 0.1% 32.0% 0.4%
A- 52 11.5% 13.5% 11.5% 48.1% 3.8% 9.6% 1.9%
BBB+ 87 1.1% 3.4% 12.6% 17.2% 23.0% 1.1% 4.6% 1.1% 34.5% 1.1%
BBB 1721 1.2% 0.1% 2.8% 0.2% 0.3% 10.6% 0.8% 1.0% 43.0% 0.3% 0.2% 10.4% 0.1% 0.1% 1.1% 0.6% 0.1% 0.2% 26.1% 0.9%
BBB- 71 1.4% 12.7% 2.8% 7.0% 5.6% 32.4% 1.4% 7.0% 1.4% 4.2% 1.4% 19.7% 2.8%
BB+ 32 3.1% 3.1% 6.3% 3.1% 50.0% 9.4% 25.0%
BB 1437 0.5% 1.3% 0.2% 8.4% 0.3% 9.3% 0.3% 0.8% 52.3% 0.4% 0.1% 6.3% 0.1% 1.0% 0.1% 0.3% 0.1% 17.3% 1.0%
BB- 20 10.0% 5.0% 15.0% 20.0% 5.0% 10.0% 10.0% 20.0% 5.0%
B+ 28 3.6% 3.6% 25.0% 3.6% 64.3%
B 1958 0.3% 0.4% 3.9% 4.1% 0.1% 0.2% 32.0% 0.3% 0.3% 32.1% 0.5% 7.9% 1.7% 1.6% 0.9% 13.5% 0.4%
B- 11 9.1% 18.2% 72.7%
CCC+
CCC 2613 0.04% 0.7% 5.6% 4.3% 13.3% 0.04% 19.9% 0.1% 29.8% 5.9% 8.3% 4.5% 7.2% 0.2%
CCC-
CC 2638 0.04% 1.2% 3.4% 0.1% 6.8% 21.7% 30.4% 14.4% 14.4% 7.2% 0.3% C 4296 0.02% 0.02% 0.1% 0.02% 0.8% 0.05% 5.6% 15.5% 33.1% 40.7% 3.8% 0.2%
TOTAL 21207
D(i) Residential mortgage backed securities ("RMBS") - 10-Year Transition and Default Rates
(December 31, 2006 through December 31, 2016)
Credit Ratings as of
12/31/2006
Credit ratings as of 12/31/2016 (%) Other Outcomes During
12/31/2006 - 12/31/2016 (%)
Credit
Rating
# of Ratings
Outstanding
AAA
AA+
AA
AA-
A+
A
A-
BBB+
BBB
BBB-
BB+
BB
BB-
B+
B
B-
CCC+
CCC
CCC-
CC
C
Default
Paid Off Withdrawn
(other)
AAA 23407 1.2% 0.2% 1.2% 0.1% 0.05% 4.1% 0.01% 0.02% 4.4% 0.02% 6.0% 3.0% 0.01% 2.1% 1.8% 3.6% 21.6% 40.8% 9.9%
AA+ 1192 1.7% 0.5% 1.3% 0.1% 0.2% 7.2% 0.1% 2.7% 9.5% 7.1% 0.1% 6.2% 3.3% 2.9% 27.8% 26.0% 3.5%
AA 2739 1.6% 0.5% 1.5% 0.1% 0.2% 3.2% 0.1% 2.6% 0.04% 6.6% 0.1% 8.5% 0.04% 8.3% 4.6% 3.5% 34.0% 21.7% 2.8%
AA- 779 1.0% 0.4% 1.2% 0.5% 5.5% 0.1% 1.7% 0.1% 4.5% 6.7% 11.2% 7.1% 3.0% 39.7% 15.7% 1.8%
A+ 970 0.2% 0.3% 1.2% 0.4% 0.8% 2.7% 0.2% 0.3% 2.0% 0.2% 2.9% 4.9% 0.1% 11.2% 8.6% 5.2% 41.6% 15.1% 2.1%
A 2556 0.7% 0.4% 0.9% 0.4% 0.5% 1.6% 0.2% 0.2% 0.8% 0.1% 0.1% 2.1% 0.04% 3.5% 0.1% 9.5% 8.6% 4.4% 47.1% 16.2% 2.4%
A- 1073 0.1% 0.1% 0.8% 0.2% 0.7% 0.6% 0.7% 0.1% 1.3% 3.3% 0.1% 8.6% 12.6% 5.3% 49.3% 12.3% 4.0%
BBB+ 1218 0.1% 0.2% 0.2% 0.2% 0.8% 0.2% 0.4% 0.6% 0.1% 0.2% 1.2% 0.1% 1.4% 0.2% 5.5% 11.2% 5.1% 57.1% 12.6% 2.8%
BBB 2550 0.04% 0.1% 0.1% 0.04% 0.1% 0.5% 0.4% 0.4% 1.1% 0.2% 0.5% 1.0% 0.04% 0.9% 0.2% 2.2% 6.0% 4.2% 60.6% 18.6% 2.9%
BBB- 1119 0.2% 0.2% 0.2% 0.2% 0.5% 0.3% 0.6% 0.9% 1.6% 5.5% 5.1% 59.4% 15.0% 10.4%
BB+ 558 0.7% 1.8% 0.7% 0.5% 0.2% 0.7% 3.0% 2.2% 74.6% 9.5% 6.1%
BB 1379 0.1% 0.8% 0.1% 0.3% 0.3% 0.8% 0.1% 0.4% 0.9% 1.4% 1.1% 2.5% 75.2% 9.9% 6.3%
BB- 93 1.1% 1.1% 1.1% 3.2% 2.2% 64.5% 15.1% 11.8%
B+ 96 7.3% 1.0% 2.1% 71.9% 8.3% 9.4%
B 909 0.1% 0.1% 0.1% 0.7% 0.6% 0.3% 0.4% 0.4% 1.3% 87.7% 4.4% 3.9%
B- 45 2.2% 4.4% 4.4% 53.3% 11.1% 24.4%
CCC+
CCC 149 0.7% 3.4% 0.7% 2.7% 2.0% 5.4% 2.0% 20.1% 38.3% 13.4% 11.4%
CCC- 3 33.3% 66.7%
CC 97 1.0% 1.0% 2.1% 4.1% 25.8% 55.7% 3.1% 7.2% C 231 0.4% 0.4% 16.0% 66.2% 4.3% 12.6%
TOTAL 41163
Page 7

D(ii) Commercial mortgage backed securities ("CMBS") - 1-Year Transition and Default Rates
(December 31, 2015 through December 31, 2016)
Credit Ratings as of
12/31/2015
Credit ratings as of 12/31/2016 (%) Other Outcomes During
12/31/2015 - 12/31/2016 (%)
Credit
Rating
# of Ratings
Outstanding
AAA
AA+
AA
AA-
A+
A
A-
BBB+
BBB
BBB-
BB+
BB
BB-
B+
B
B-
CCC+
CCC
CCC-
CC
C
Default
Paid Off Withdrawn
(other)
AAA 1914 86.0% 0.1% 13.9%
AA+ 10 60.0% 20.0% 20.0%
AA 152 9.2% 70.4% 3.9% 16.4%
AA- 186 3.2% 93.5% 1.1% 2.2%
A+ 16 6.3% 75.0% 18.8%
A 299 9.0% 2.3% 0.3% 66.9% 2.0% 0.3% 19.1%
A- 268 4.5% 92.2% 0.4% 3.0%
BBB+ 48 4.2% 93.8% 2.1%
BBB 168 5.4% 13.1% 5.4% 55.4% 4.2% 0.6% 16.1%
BBB- 284 0.4% 2.1% 1.4% 90.5% 0.7% 4.9%
BB+ 31 90.3% 9.7%
BB 267 2.6% 0.4% 4.1% 6.4% 0.7% 0.4% 68.5% 1.9% 1.1% 0.4% 13.5%
BB- 88 1.1% 1.1% 96.6% 1.1%
B+ 2 100.0%
B 237 0.8% 1.3% 1.7% 0.4% 8.4% 0.4% 65.8% 4.6% 1.3% 0.4% 0.8% 13.9%
B- 71 91.5% 1.4% 2.8% 4.2%
CCC+
CCC 251 0.4% 0.8% 3.2% 11.2% 62.2% 5.6% 2.4% 4.0% 9.6% 0.8%
CCC-
CC 226 0.4% 6.2% 66.4% 16.4% 5.3% 4.4% 0.9% C 433 0.2% 0.5% 0.5% 59.6% 38.3% 0.9%
TOTAL 4951
D(ii) Commercial mortgage backed securities ("CMBS") - 3-Year Transition and Default Rates
(December 31, 2013 through December 31, 2016)
Credit Ratings as of
12/31/2013
Credit ratings as of 12/31/2016 (%) Other Outcomes During
12/31/2013 - 12/31/2016 (%)
Credit
Rating
# of Ratings
Outstanding
AAA
AA+
AA
AA-
A+
A
A-
BBB+
BBB
BBB-
BB+
BB
BB-
B+
B
B-
CCC+
CCC
CCC-
CC
C
Default
Paid Off Withdrawn
(other)
AAA 1657 55.0% 0.6% 0.1% 44.3%
AA+ 23 4.3% 13.0% 8.7% 8.7% 65.2%
AA 213 5.6% 0.5% 39.9% 4.7% 0.5% 48.4% 0.5%
AA- 84 7.1% 58.3% 2.4% 32.1%
A+ 18 11.1% 5.6% 27.8% 55.6%
A 336 4.2% 2.1% 0.6% 39.3% 2.7% 0.6% 0.3% 49.7% 0.6%
A- 128 1.6% 11.7% 68.8% 0.8% 16.4% 0.8%
BBB+ 55 7.3% 5.5% 54.5% 1.8% 12.7% 16.4% 1.8%
BBB 248 4.4% 0.4% 6.9% 4.0% 21.8% 0.4% 0.4% 5.2% 0.8% 0.8% 0.4% 1.6% 52.0% 0.8%
BBB- 212 2.8% 1.4% 4.7% 2.8% 48.1% 2.8% 1.9% 34.9% 0.5%
BB+ 32 3.1% 3.1% 34.4% 3.1% 50.0% 6.3%
BB 324 4.3% 0.3% 4.3% 4.0% 0.3% 0.3% 31.5% 0.3% 3.7% 1.9% 0.9% 0.3% 2.5% 44.1% 1.2%
BB- 24 4.2% 50.0% 45.8%
B+ 11 9.1% 9.1% 9.1% 9.1% 9.1% 54.5%
B 290 6.6% 0.7% 2.4% 2.4% 0.3% 4.5% 0.3% 31.7% 0.3% 7.6% 2.1% 1.7% 2.4% 34.8% 2.1%
B- 49 4.1% 4.1% 2.0% 2.0% 8.2% 2.0% 2.0% 26.5% 2.0% 8.2% 4.1% 34.7%
CCC+
CCC 460 1.5% 2.0% 2.2% 5.9% 7.6% 27.6% 8.7% 5.7% 7.8% 27.8% 3.3%
CCC-
CC 366 0.3% 0.3% 0.3% 0.5% 1.4% 6.0% 31.1% 19.1% 30.6% 8.7% 1.6% C 679 0.1% 0.1% 0.4% 0.4% 0.6% 29.3% 62.2% 3.1% 3.7%
TOTAL 5209
Page 8

D(ii) Commercial mortgage backed securities ("CMBS") - 10-Year Transition and Default Rates
(December 31, 2006 through December 31, 2016)
Credit Ratings as of
12/31/2006
Credit ratings as of 12/31/2016 (%) Other Outcomes During
12/31/2006 - 12/31/2016 (%)
Credit
Rating
# of Ratings
Outstanding
AAA
AA+
AA
AA-
A+
A
A-
BBB+
BBB
BBB-
BB+
BB
BB-
B+
B
B-
CCC+
CCC
CCC-
CC
C
Default
Paid Off Withdrawn
(other)
AAA 3139 1.1% 0.3% 0.03% 0.6% 0.03% 0.1% 0.1% 0.03% 0.03% 0.3% 0.03% 0.4% 0.4% 0.2% 0.1% 0.9% 78.7% 16.7%
AA+ 165 0.6% 1.8% 0.6% 0.6% 0.6% 0.6% 1.2% 1.8% 1.2% 1.2% 1.8% 87.9%
AA 440 0.9% 0.2% 5.9% 0.2% 1.6% 0.2% 0.9% 1.8% 0.5% 0.9% 2.0% 1.6% 2.5% 8.4% 70.9% 1.4%
AA- 210 2.9% 1.0% 0.5% 1.9% 1.9% 0.5% 0.5% 1.4% 1.4% 0.5% 2.9% 3.3% 6.7% 7.1% 66.7% 1.0%
A+ 173 0.6% 0.6% 0.6% 1.2% 0.6% 0.6% 2.9% 1.7% 2.9% 1.7% 2.9% 5.2% 77.5% 1.2%
A 420 1.4% 0.5% 4.0% 0.2% 2.4% 0.5% 1.0% 1.7% 1.9% 2.1% 4.3% 13.1% 66.2% 0.7%
A- 242 3.7% 0.8% 0.8% 0.8% 2.9% 2.1% 0.4% 3.3% 2.5% 7.4% 16.5% 57.9% 0.8%
BBB+ 299 4.0% 1.7% 2.3% 1.0% 0.7% 2.3% 3.7% 2.0% 3.0% 24.1% 54.8% 0.3%
BBB 455 2.0% 0.2% 1.1% 2.2% 0.4% 1.5% 0.9% 3.1% 2.4% 2.6% 26.8% 54.9% 1.8%
BBB- 419 2.1% 0.7% 1.0% 0.5% 0.5% 0.2% 3.1% 1.4% 2.9% 35.8% 50.1% 1.7%
BB+ 236 4.2% 0.8% 0.4% 1.7% 1.3% 1.3% 3.0% 1.7% 50.0% 34.7% 0.8%
BB 285 2.1% 0.4% 0.4% 1.8% 2.5% 0.4% 0.7% 2.5% 5.3% 50.9% 29.5% 3.9%
BB- 177 2.3% 0.6% 2.3% 1.1% 0.6% 1.7% 1.7% 0.6% 2.3% 3.4% 67.8% 15.8%
B+ 172 1.7% 1.2% 1.2% 0.6% 4.1% 1.7% 0.6% 1.2% 2.3% 70.3% 15.1%
B 200 1.5% 1.0% 1.0% 1.5% 1.5% 1.5% 4.0% 71.5% 14.0% 2.5%
B- 202 0.5% 0.5% 1.0% 0.5% 1.5% 1.0% 3.0% 80.7% 10.4% 1.0%
CCC+ 1 100.0%
CCC 43 81.4% 18.6%
CCC-
CC 14 85.7% 7.1% 7.1% C 31 83.9% 12.9% 3.2%
TOTAL 7323
D(iii) Collateralized loan obligations ("CLOs") - 1-Year Transition and Default Rates
(December 31, 2015 through December 31, 2016)
Credit Ratings as of
12/31/2015
Credit ratings as of 12/31/2016 (%) Other Outcomes During
12/31/2015 - 12/31/2016 (%)
Credit
Rating
# of Ratings
Outstanding
AAA
AA+
AA
AA-
A+
A
A-
BBB+
BBB
BBB-
BB+
BB
BB-
B+
B
B-
CCC+
CCC
CCC-
CC
C
Default
Paid Off Withdrawn
(other)
AAA 537 86.2% 13.8%
AA+ 43 2.3% 95.3% 2.3%
AA 90 5.6% 1.1% 82.2% 11.1%
AA-
A+ 22 4.5% 77.3% 18.2%
A 69 1.4% 1.4% 4.3% 85.5% 7.2%
A- 6 16.7% 16.7% 66.7%
BBB+ 16 12.5% 75.0% 12.5%
BBB 82 7.3% 7.3% 79.3% 6.1%
BBB- 6 16.7% 33.3% 50.0%
BB+ 12 91.7% 8.3%
BB 80 3.8% 5.0% 85.0% 6.3%
BB- 5 20.0% 20.0% 40.0% 20.0%
B+ 2 50.0% 50.0%
B 24 8.3% 20.8% 62.5% 4.2% 4.2%
B- 61 3.3% 1.6% 86.9% 8.2%
CCC+
CCC 6 16.7% 16.7% 33.3% 33.3%
CCC-
CC 3 100.0%
C 2 100.0%
TOTAL 1066
Page 9
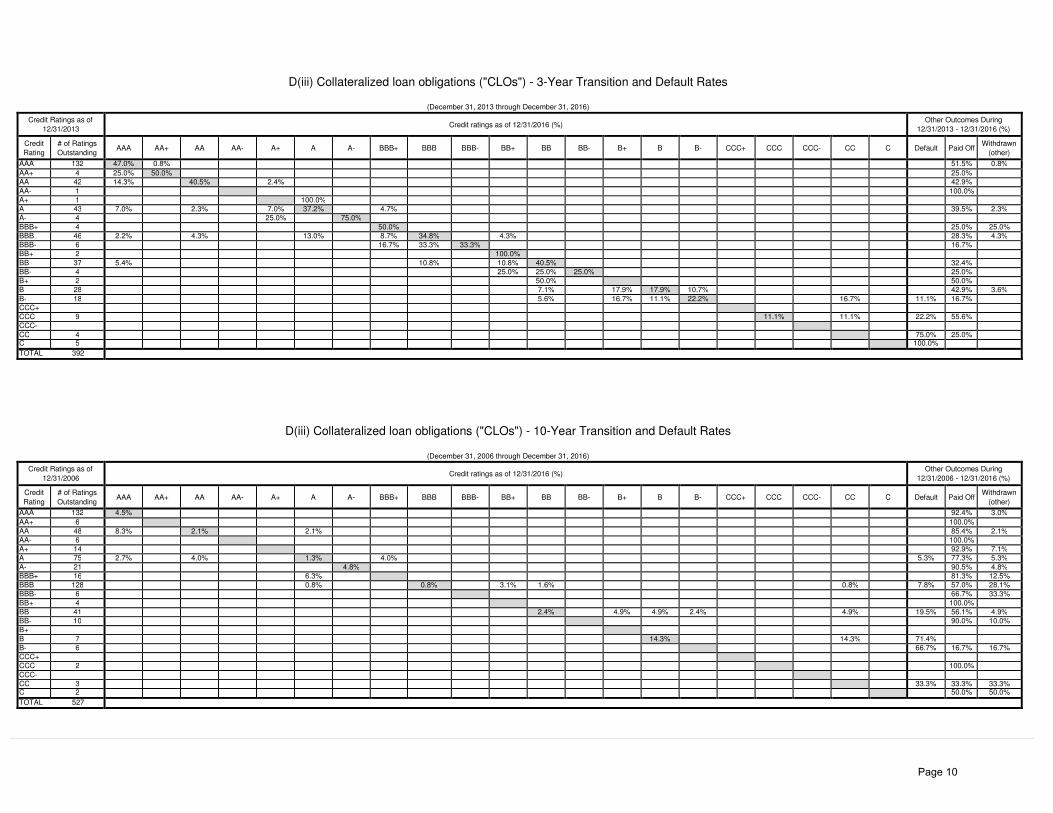
D(iii) Collateralized loan obligations ("CLOs") - 3-Year Transition and Default Rates
(December 31, 2013 through December 31, 2016)
Credit Ratings as of
12/31/2013
Credit ratings as of 12/31/2016 (%) Other Outcomes During
12/31/2013 - 12/31/2016 (%)
Credit
Rating
# of Ratings
Outstanding
AAA
AA+
AA
AA-
A+
A
A-
BBB+
BBB
BBB-
BB+
BB
BB-
B+
B
B-
CCC+
CCC
CCC-
CC
C
Default
Paid Off Withdrawn
(other)
AAA 132 47.0% 0.8% 51.5% 0.8%
AA+ 4 25.0% 50.0% 25.0%
AA 42 14.3% 40.5% 2.4% 42.9%
AA- 1 100.0%
A+ 1 100.0%
A 43 7.0% 2.3% 7.0% 37.2% 4.7% 39.5% 2.3%
A- 4 25.0% 75.0%
BBB+ 4 50.0% 25.0% 25.0%
BBB 46 2.2% 4.3% 13.0% 8.7% 34.8% 4.3% 28.3% 4.3%
BBB- 6 16.7% 33.3% 33.3% 16.7%
BB+ 2 100.0%
BB 37 5.4% 10.8% 10.8% 40.5% 32.4%
BB- 4 25.0% 25.0% 25.0% 25.0%
B+ 2 50.0% 50.0%
B 28 7.1% 17.9% 17.9% 10.7% 42.9% 3.6%
B- 18 5.6% 16.7% 11.1% 22.2% 16.7% 11.1% 16.7%
CCC+
CCC 9 11.1% 11.1% 22.2% 55.6%
CCC-
CC 4 75.0% 25.0%
C 5 100.0%
TOTAL 392
D(iii) Collateralized loan obligations ("CLOs") - 10-Year Transition and Default Rates
(December 31, 2006 through December 31, 2016)
Credit Ratings as of
12/31/2006
Credit ratings as of 12/31/2016 (%) Other Outcomes During
12/31/2006 - 12/31/2016 (%)
Credit
Rating
# of Ratings
Outstanding
AAA
AA+
AA
AA-
A+
A
A-
BBB+
BBB
BBB-
BB+
BB
BB-
B+
B
B-
CCC+
CCC
CCC-
CC
C
Default
Paid Off Withdrawn
(other)
AAA 132 4.5% 92.4% 3.0%
AA+ 6 100.0%
AA 48 8.3% 2.1% 2.1% 85.4% 2.1%
AA- 6 100.0%
A+ 14 92.9% 7.1%
A 75 2.7% 4.0% 1.3% 4.0% 5.3% 77.3% 5.3%
A- 21 4.8% 90.5% 4.8%
BBB+ 16 6.3% 81.3% 12.5%
BBB 128 0.8% 0.8% 3.1% 1.6% 0.8% 7.8% 57.0% 28.1%
BBB- 6 66.7% 33.3%
BB+ 4 100.0%
BB 41 2.4% 4.9% 4.9% 2.4% 4.9% 19.5% 56.1% 4.9%
BB- 10 90.0% 10.0%
B+
B 7 14.3% 14.3% 71.4%
B- 6 66.7% 16.7% 16.7%
CCC+
CCC 2 100.0%
CCC-
CC 3 33.3% 33.3% 33.3% C 2 50.0% 50.0%
TOTAL 527
Page 10
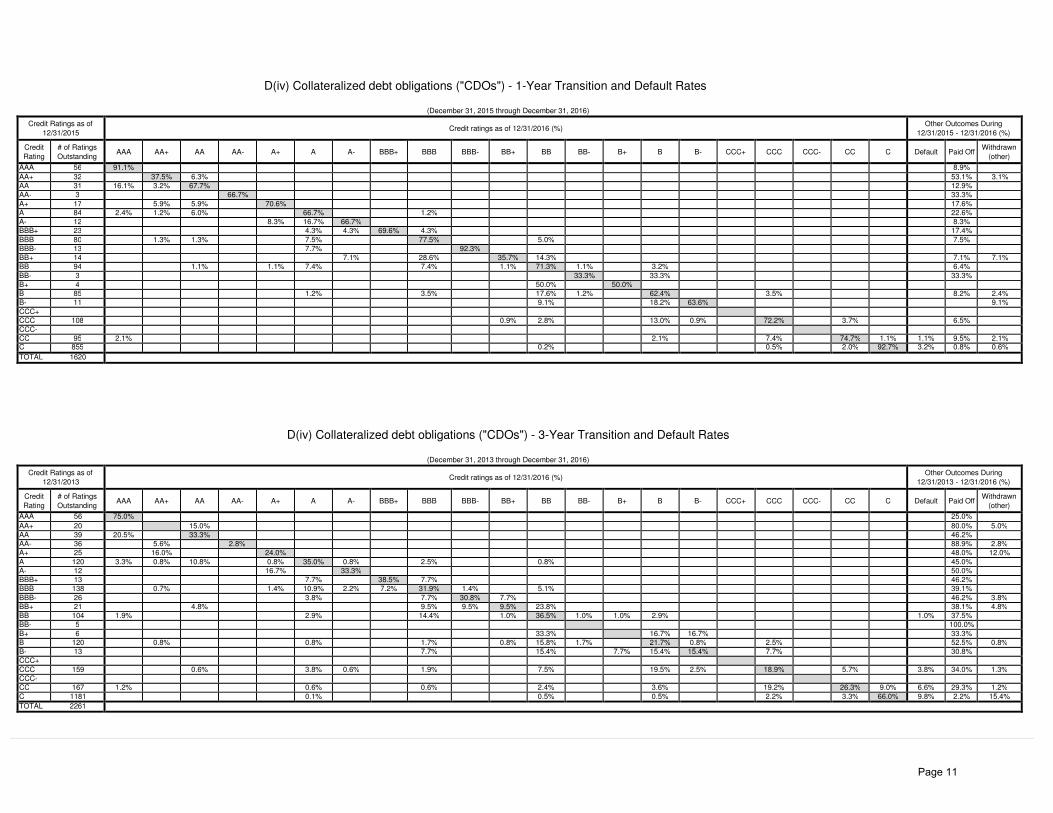
D(iv) Collateralized debt obligations ("CDOs") - 1-Year Transition and Default Rates
(December 31, 2015 through December 31, 2016)
Credit Ratings as of
12/31/2015
Credit ratings as of 12/31/2016 (%) Other Outcomes During
12/31/2015 - 12/31/2016 (%)
Credit
Rating
# of Ratings
Outstanding
AAA
AA+
AA
AA-
A+
A
A-
BBB+
BBB
BBB-
BB+
BB
BB-
B+
B
B-
CCC+
CCC
CCC-
CC
C
Default
Paid Off Withdrawn
(other)
AAA 56 91.1% 8.9%
AA+ 32 37.5% 6.3% 53.1% 3.1%
AA 31 16.1% 3.2% 67.7% 12.9%
AA- 3 66.7% 33.3%
A+ 17 5.9% 5.9% 70.6% 17.6%
A 84 2.4% 1.2% 6.0% 66.7% 1.2% 22.6%
A- 12 8.3% 16.7% 66.7% 8.3%
BBB+ 23 4.3% 4.3% 69.6% 4.3% 17.4%
BBB 80 1.3% 1.3% 7.5% 77.5% 5.0% 7.5%
BBB- 13 7.7% 92.3%
BB+ 14 7.1% 28.6% 35.7% 14.3% 7.1% 7.1%
BB 94 1.1% 1.1% 7.4% 7.4% 1.1% 71.3% 1.1% 3.2% 6.4%
BB- 3 33.3% 33.3% 33.3%
B+ 4 50.0% 50.0%
B 85 1.2% 3.5% 17.6% 1.2% 62.4% 3.5% 8.2% 2.4%
B- 11 9.1% 18.2% 63.6% 9.1%
CCC+
CCC 108 0.9% 2.8% 13.0% 0.9% 72.2% 3.7% 6.5%
CCC-
CC 95 2.1% 2.1% 7.4% 74.7% 1.1% 1.1% 9.5% 2.1% C 855 0.2% 0.5% 2.0% 92.7% 3.2% 0.8% 0.6%
TOTAL 1620
D(iv) Collateralized debt obligations ("CDOs") - 3-Year Transition and Default Rates
(December 31, 2013 through December 31, 2016)
Credit Ratings as of
12/31/2013
Credit ratings as of 12/31/2016 (%) Other Outcomes During
12/31/2013 - 12/31/2016 (%)
Credit
Rating
# of Ratings
Outstanding
AAA
AA+
AA
AA-
A+
A
A-
BBB+
BBB
BBB-
BB+
BB
BB-
B+
B
B-
CCC+
CCC
CCC-
CC
C
Default
Paid Off Withdrawn
(other)
AAA 56 75.0% 25.0%
AA+ 20 15.0% 80.0% 5.0%
AA 39 20.5% 33.3% 46.2%
AA- 36 5.6% 2.8% 88.9% 2.8%
A+ 25 16.0% 24.0% 48.0% 12.0%
A 120 3.3% 0.8% 10.8% 0.8% 35.0% 0.8% 2.5% 0.8% 45.0%
A- 12 16.7% 33.3% 50.0%
BBB+ 13 7.7% 38.5% 7.7% 46.2%
BBB 138 0.7% 1.4% 10.9% 2.2% 7.2% 31.9% 1.4% 5.1% 39.1%
BBB- 26 3.8% 7.7% 30.8% 7.7% 46.2% 3.8%
BB+ 21 4.8% 9.5% 9.5% 9.5% 23.8% 38.1% 4.8%
BB 104 1.9% 2.9% 14.4% 1.0% 36.5% 1.0% 1.0% 2.9% 1.0% 37.5%
BB- 5 100.0%
B+ 6 33.3% 16.7% 16.7% 33.3%
B 120 0.8% 0.8% 1.7% 0.8% 15.8% 1.7% 21.7% 0.8% 2.5% 52.5% 0.8%
B- 13 7.7% 15.4% 7.7% 15.4% 15.4% 7.7% 30.8%
CCC+
CCC 159 0.6% 3.8% 0.6% 1.9% 7.5% 19.5% 2.5% 18.9% 5.7% 3.8% 34.0% 1.3%
CCC-
CC 167 1.2% 0.6% 0.6% 2.4% 3.6% 19.2% 26.3% 9.0% 6.6% 29.3% 1.2%
C 1181 0.1% 0.5% 0.5% 2.2% 3.3% 66.0% 9.8% 2.2% 15.4%
TOTAL 2261
Page 11

D(iv) Collateralized debt obligations ("CDOs") - 10-Year Transition and Default Rates
(December 31, 2006 through December 31, 2016)
Credit Ratings as of
12/31/2006
Credit ratings as of 12/31/2016 (%) Other Outcomes During
12/31/2006 - 12/31/2016 (%)
Credit
Rating
# of Ratings
Outstanding
AAA
AA+
AA
AA-
A+
A
A-
BBB+
BBB
BBB-
BB+
BB
BB-
B+
B
B-
CCC+
CCC
CCC-
CC
C
Default
Paid Off Withdrawn
(other)
AAA 1645 1.5% 0.2% 1.2% 3.0% 0.2% 0.3% 2.7% 0.1% 0.1% 2.1% 0.1% 0.8% 1.0% 0.7% 6.0% 14.1% 55.6% 10.4%
AA+ 142 0.7% 0.7% 4.2% 1.4% 1.4% 2.1% 13.4% 62.7% 13.4%
AA 466 1.1% 0.6% 0.4% 3.0% 0.2% 0.2% 3.6% 3.6% 2.6% 9.2% 27.5% 36.3% 11.6%
AA- 123 0.8% 0.8% 0.8% 0.8% 1.6% 6.5% 26.0% 49.6% 13.0%
A+ 125 1.6% 1.6% 0.8% 1.6% 1.6% 0.8% 2.4% 0.8% 9.6% 13.6% 55.2% 10.4%
A 404 0.2% 0.5% 0.2% 0.2% 2.5% 0.2% 2.2% 3.2% 30.4% 15.3% 30.0% 14.9%
A- 221 0.9% 1.8% 0.5% 1.8% 3.2% 32.1% 23.5% 28.1% 8.1%
BBB+ 127 1.6% 0.8% 0.8% 3.1% 26.0% 18.1% 42.5% 7.1%
BBB 450 0.4% 0.2% 0.2% 0.2% 0.4% 1.3% 1.1% 34.4% 17.3% 24.4% 19.8%
BBB- 104 1.0% 1.0% 1.0% 1.0% 2.9% 3.8% 26.9% 23.1% 30.8% 8.7%
BB+ 91 3.3% 2.2% 1.1% 1.1% 19.8% 20.9% 37.4% 14.3%
BB 143 1.4% 0.7% 0.7% 0.7% 26.6% 25.2% 31.5% 13.3%
BB- 56 1.8% 3.6% 14.3% 25.0% 50.0% 5.4%
B+ 36 2.8% 16.7% 36.1% 36.1% 8.3%
B 57 3.5% 1.8% 24.6% 31.6% 29.8% 8.8%
B- 31 6.5% 16.1% 35.5% 35.5% 6.5%
CCC+ 5 20.0% 20.0% 60.0%
CCC 24 25.0% 33.3% 25.0% 16.7%
CCC- 6 33.3% 16.7% 50.0%
CC 52 7.7% 59.6% 11.5% 21.2% C 62 6.5% 71.0% 11.3% 11.3%
TOTAL 4370
Page 12

D(v) Asset-backed commercial paper ("ABCP") - 1-Year Transition and Default Rates
(December 31, 2015 through December 31, 2016)
Credit Ratings as of
12/31/2015
Credit ratings as of 12/31/2016 (%) Other Outcomes During
12/31/2015 - 12/31/2016 (%)
Credit
Rating
# of Ratings
Outstanding
F1+
F1
F2
F3
B
C
Defaults
Paid Off Withdrawn
(other)
F1+ 7 100.0%
F1 25 100.0%
F2 3 100.0%
F3
B
C 1 100.0%
TOTAL 36
D(v) Asset-backed commercial paper ("ABCP") - 3-Year Transition and Default Rates
(December 31, 2013 through December 31, 2015)
Credit Ratings as of
12/31/2013
Credit ratings as of 12/31/2016 (%) Other Outcomes During
12/31/2013 - 12/31/2016 (%)
Credit
Rating
# of Ratings
Outstanding
F1+
F1
F2
F3
B
C
Defaults
Paid Off Withdrawn
(other)
F1+ 16 31.3% 12.5% 6.3% 37.5% 12.5%
F1 35 5.7% 62.9% 2.9% 22.9% 5.7%
F2 1 100.0%
F3
B
C 1 100.0%
TOTAL 53
D(v) Asset-backed commercial paper ("ABCP") - 10-Year Transition and Default Rates
(December 31, 2006 through December 31, 2016)
Credit Ratings as of
12/31/2006
Credit ratings as of 12/31/2016 (%) Other Outcomes During
12/31/2006 - 12/31/2016 (%)
Credit
Rating
# of Ratings
Outstanding
F1+
F1
F2
F3
B
C
Defaults
Paid Off Withdrawn
(other)
F1+ 55 7.3% 9.1% 1.8% 50.9% 30.9%
F1 71 2.8% 12.7% 22.5% 62.0%
F2 3 66.7% 33.3%
F3
B
C
TOTAL 129
Page 13

D(vi) Other asset-backed securities ("other ABS") - 1-Year Transition and Default Rates
(December 31, 2015 through December 31, 2016)
Credit Ratings as of
12/31/2015
Credit ratings as of 12/31/2016 (%) Other Outcomes During
12/31/2015 - 12/31/2016 (%)
Credit
Rating
# of Ratings
Outstanding
AAA
AA+
AA
AA-
A+
A
A-
BBB+
BBB
BBB-
BB+
BB
BB-
B+
B
B-
CCC+
CCC
CCC-
CC
C
Default
Paid Off Withdrawn
(other)
AAA 1841 72.0% 0.8% 0.7% 0.2% 0.5% 0.7% 0.1% 22.6% 2.5%
AA+ 36 16.7% 63.9% 5.6% 2.8% 11.1%
AA 318 14.5% 1.6% 60.1% 0.6% 0.3% 0.6% 0.6% 20.1% 1.6%
AA- 31 3.2% 12.9% 67.7% 6.5% 9.7%
A+ 187 0.5% 2.1% 7.5% 0.5% 71.1% 0.5% 8.0% 9.6%
A 708 1.0% 15.5% 0.1% 0.4% 68.9% 0.1% 2.8% 0.6% 0.4% 0.1% 9.9%
A- 117 0.9% 1.7% 0.9% 86.3% 10.3%
BBB+ 198 0.5% 0.5% 4.0% 24.7% 3.0% 67.2%
BBB 257 0.4% 0.8% 7.8% 0.4% 71.6% 1.2% 0.4% 0.8% 13.6% 3.1%
BBB- 46 4.3% 4.3% 56.5% 10.9% 23.9%
BB+ 26 7.7% 50.0% 3.8% 15.4% 7.7% 15.4%
BB 76 1.3% 5.3% 56.6% 2.6% 1.3% 3.9% 19.7% 9.2%
BB- 34 61.8% 5.9% 5.9% 26.5%
B+ 14 7.1% 7.1% 21.4% 14.3% 50.0%
B 64 4.7% 26.6% 1.6% 6.3% 6.3% 54.7%
B- 60 16.7% 6.7% 5.0% 3.3% 68.3%
CCC+
CCC 10 10.0% 50.0% 10.0% 20.0% 10.0%
CCC-
CC 21 9.5% 66.7% 19.0% 4.8% C 62 1.6% 77.4% 4.8% 16.1%
TOTAL 4106
D(vi) Other asset-backed securities ("other ABS") - 3-Year Transition and Default Rates
(December 31, 2013 through December 31, 2016)
Credit Ratings as of
12/31/2013
Credit ratings as of 12/31/2016 (%) Other Outcomes During
12/31/2013 - 12/31/2016 (%)
Credit
Rating
# of Ratings
Outstanding
AAA
AA+
AA
AA-
A+
A
A-
BBB+
BBB
BBB-
BB+
BB
BB-
B+
B
B-
CCC+
CCC
CCC-
CC
C
Default
Paid Off Withdrawn
(other)
AAA 1745 42.6% 0.9% 1.0% 0.2% 0.5% 0.7% 0.1% 52.7% 1.4%
AA+ 33 6.1% 18.2% 15.2% 3.0% 45.5% 12.1%
AA 231 7.8% 22.9% 1.7% 0.9% 64.5% 2.2%
AA- 50 6.0% 10.0% 36.0% 2.0% 4.0% 42.0%
A+ 147 2.7% 0.7% 19.7% 34.0% 0.7% 1.4% 2.0% 36.7% 2.0%
A 626 3.5% 11.5% 2.6% 40.6% 4.5% 0.2% 2.2% 0.2% 0.2% 0.3% 34.3%
A- 36 2.8% 5.6% 2.8% 22.2% 25.0% 2.8% 2.8% 2.8% 33.3%
BBB+ 160 8.8% 8.8% 2.5% 33.1% 46.9%
BBB 378 1.6% 1.9% 0.3% 2.6% 7.9% 0.3% 1.9% 23.0% 0.3% 1.1% 0.3% 0.8% 0.3% 1.1% 48.7% 8.2%
BBB- 56 7.1% 3.6% 1.8% 3.6% 3.6% 1.8% 3.6% 60.7% 14.3%
BB+ 33 3.0% 6.1% 15.2% 6.1% 36.4% 33.3%
BB 90 1.1% 10.0% 1.1% 4.4% 22.2% 1.1% 2.2% 1.1% 47.8% 8.9%
BB- 29 44.8% 3.4% 51.7%
B+ 12 8.3% 8.3% 83.3%
B 90 2.2% 1.1% 10.0% 2.2% 3.3% 30.0% 51.1%
B- 52 1.9% 19.2% 46.2% 32.7%
CCC+
CCC 15 6.7% 26.7% 20.0% 40.0% 6.7%
CCC-
CC 20 5.0% 55.0% 5.0% 30.0% 5.0%
C 75 1.3% 1.3% 62.7% 4.0% 5.3% 25.3%
TOTAL 3878
Page 14

D(vi) Other asset-backed securities ("other ABS") - 10-Year Transition and Default Rates
(December 31, 2006 through December 31, 2016)
Credit Ratings as of
12/31/2006
Credit ratings as of 12/31/2016 (%) Other Outcomes During
12/31/2006 - 12/31/2016 (%)
Credit
Rating
# of Ratings
Outstanding
AAA
AA+
AA
AA-
A+
A
A-
BBB+
BBB
BBB-
BB+
BB
BB-
B+
B
B-
CCC+
CCC
CCC-
CC
C
Default
Paid Off Withdrawn
(other)
AAA 3568 8.2% 0.7% 0.1% 0.1% 1.4% 0.2% 0.7% 0.5% 0.3% 0.1% 0.3% 0.3% 74.4% 12.8%
AA+ 38 2.6% 2.6% 7.9% 18.4% 2.6% 2.6% 2.6% 5.3% 7.9% 47.4%
AA 203 0.5% 4.4% 3.0% 1.5% 0.5% 2.5% 81.8% 5.9%
AA- 40 5.0% 95.0%
A+ 175 1.1% 1.1% 0.6% 1.1% 1.1% 93.1% 1.7%
A 578 0.3% 2.9% 1.7% 3.1% 2.1% 1.0% 0.3% 0.9% 0.3% 0.3% 0.5% 1.9% 80.1% 4.3%
A- 46 4.3% 89.1% 6.5%
BBB+ 96 1.0% 2.1% 2.1% 88.5% 6.3%
BBB 528 2.7% 0.2% 0.9% 0.2% 0.2% 0.8% 0.4% 0.4% 70.5% 23.9%
BBB- 71 2.8% 1.4% 70.4% 25.4%
BB+ 31 6.5% 3.2% 77.4% 12.9%
BB 81 1.2% 1.2% 1.2% 2.5% 3.7% 69.1% 21.0%
BB- 30 20.0% 70.0% 10.0%
B+ 7 42.9% 57.1%
B 30 3.3% 23.3% 23.3% 50.0%
B- 10 50.0% 50.0%
CCC+
CCC 38 13.2% 15.8% 71.1%
CCC- 1 100.0%
CC 27 37.0% 63.0% C 120 0.8% 0.8% 0.8% 45.0% 2.5% 50.0%
TOTAL 5718
D(vii) Other Structured Finance Products ("other SFPs") - 1-Year Transition and Default Rates
(December 31, 2015 through December 31, 2016)
Credit Ratings as of
12/31/2015
Credit ratings as of 12/31/2016 (%) Other Outcomes During
12/31/2015 - 12/31/2016 (%)
Credit
Rating
# of Ratings
Outstanding
AAA
AA+
AA
AA-
A+
A
A-
BBB+
BBB
BBB-
BB+
BB
BB-
B+
B
B-
CCC+
CCC
CCC-
CC
C
Default
Paid Off Withdrawn
(other)
AAA 421 83.6% 13.8% 2.6%
AA+ 7 28.6% 71.4%
AA 81 1.2% 2.5% 88.9% 3.7% 3.7%
AA-
A+ 6 33.3% 50.0% 16.7%
A 38 2.6% 86.8% 10.5%
A- 1 100.0%
BBB+ 6 16.7% 33.3% 16.7% 16.7% 16.7%
BBB 14 7.1% 21.4% 7.1% 42.9% 21.4%
BBB- 3 100.0%
BB+ 2 50.0% 50.0%
BB
BB-
B+ 1 100.0%
B
B- 2 100.0%
CCC+ 2 50.0% 50.0%
CCC
CCC-
CC
C
TOTAL 584
Page 15

D(vii) Other Structured Finance Products ("other SFPs") - 3-Year Transition and Default Rates
(December 31, 2013 through December 31, 2016)
Credit Ratings as of
12/31/2013
Credit ratings as of 12/31/2016 (%) Other Outcomes During
12/31/2013 - 12/31/2016 (%)
Credit
Rating
# of Ratings
Outstanding
AAA
AA+
AA
AA-
A+
A
A-
BBB+
BBB
BBB-
BB+
BB
BB-
B+
B
B-
CCC+
CCC
CCC-
CC
C
Default
Paid Off Withdrawn
(other)
AAA 414 63.5% 32.1% 4.3%
AA+ 10 20.0% 20.0% 20.0% 10.0% 30.0%
AA 50 2.0% 60.0% 10.0% 16.0% 12.0%
AA- 5 20.0% 20.0% 60.0%
A+ 4 25.0% 25.0% 50.0%
A 35 2.9% 5.7% 71.4% 2.9% 5.7% 11.4%
A- 1 100.0%
BBB+ 10 10.0% 10.0% 10.0% 30.0% 40.0%
BBB 4 50.0% 50.0%
BBB- 2 50.0% 50.0%
BB+
BB
BB-
B+ 2 100.0%
B 4 25.0% 25.0% 25.0% 25.0%
B-
CCC+
CCC
CCC-
CC
C
TOTAL 541
D(vii) Other Structured Finance Products ("other SFPs") - 10-Year Transition and Default Rates
(December 31, 2006 through December 31, 2016)
Credit Ratings as of
12/31/2006
Credit ratings as of 12/31/2016 (%) Other Outcomes During
12/31/2006 - 12/31/2016 (%)
Credit
Rating
# of Ratings
Outstanding
AAA
AA+
AA
AA-
A+
A
A-
BBB+
BBB
BBB-
BB+
BB
BB-
B+
B
B-
CCC+
CCC
CCC-
CC
C
Default
Paid Off Withdrawn
(other)
AAA 330 22.1% 0.3% 0.9% 0.3% 61.5% 14.8%
AA+ 3 100.0%
AA 23 52.2% 21.7% 26.1%
AA- 1 100.0%
A+ 41 43.9% 48.8% 7.3%
A 12 16.7% 83.3%
A-
BBB+ 1 100.0%
BBB
BBB-
BB+
BB
BB- 1 100.0%
B+
B 4 100.0%
B-
CCC+ 2 100.0%
CCC
CCC-
CC 1 100.0% C 2 100.0%
TOTAL 421
*D(vii) Other Structured Finance Products ("other SFPs") Data includes structured finance and other long term ratings not otherwise classified including covered bond programs, closed end fund and other funds.
Page 16

E(i) Sovereign issuers - 1-Year Transition and Default Rates
(December 31, 2015 through December 31, 2016)
Credit Ratings as of
12/31/2015
Credit ratings as of 12/31/2016 (%) Other Outcomes During
12/31/2015 - 12/31/2016 (%)
Credit
Rating
# of Ratings
Outstanding
AAA
AA+
AA
AA-
A+
A
A-
BBB+
BBB
BBB-
BB+
BB
BB-
B+
B
B-
CCC+
CCC
CCC-
CC
C
Default
Paid Off Withdrawn
(other)
AAA 24 95.8% 4.2%
AA+ 5 60.0% 40.0%
AA 10 80.0% 20.0%
AA- 3 100.0%
A+ 6 16.7% 83.3%
A 5 20.0% 80.0%
A- 6 16.7% 83.3%
BBB+ 9 11.1% 66.7% 22.2%
BBB 4 100.0%
BBB- 16 6.3% 81.3% 12.5%
BB+ 5 20.0% 40.0% 40.0%
BB 5 80.0% 20.0%
BB- 9 55.6% 44.4%
B+ 13 23.1% 61.5% 7.7% 7.7%
B 11 72.7% 18.2% 9.1%
B- 2 50.0% 50.0%
CCC+
CCC 3 33.3% 66.7%
CCC-
CC
C
TOTAL 136
E(i) Sovereign issuers - 3-Year Transition and Default Rates
(December 31, 2013 through December 31, 2016)
Credit Ratings as of
12/31/2013
Credit ratings as of 12/31/2016 (%) Other Outcomes During
12/31/2013 - 12/31/2016 (%)
Credit
Rating
# of Ratings
Outstanding
AAA
AA+
AA
AA-
A+
A
A-
BBB+
BBB
BBB-
BB+
BB
BB-
B+
B
B-
CCC+
CCC
CCC-
CC
C
Default
Paid Off Withdrawn
(other)
AAA 25 92.0% 8.0%
AA+ 6 33.3% 66.7%
AA 5 80.0% 20.0%
AA- 5 80.0% 20.0%
A+ 7 14.3% 71.4% 14.3%
A 4 25.0% 75.0%
A- 2 100.0%
BBB+ 10 10.0% 30.0% 40.0% 20.0%
BBB 10 10.0% 20.0% 20.0% 30.0% 10.0% 10.0%
BBB- 12 8.3% 83.3% 8.3%
BB+ 6 16.7% 33.3% 50.0%
BB 1 100.0%
BB- 13 7.7% 30.8% 53.8% 7.7%
B+ 7 14.3% 14.3% 14.3% 14.3% 14.3% 28.6%
B 9 22.2% 22.2% 44.4% 11.1%
B- 4 25.0% 25.0% 25.0% 25.0%
CCC+
CCC 1 100.0%
CCC-
CC 1 100.0%
C
TOTAL 128
Page 17
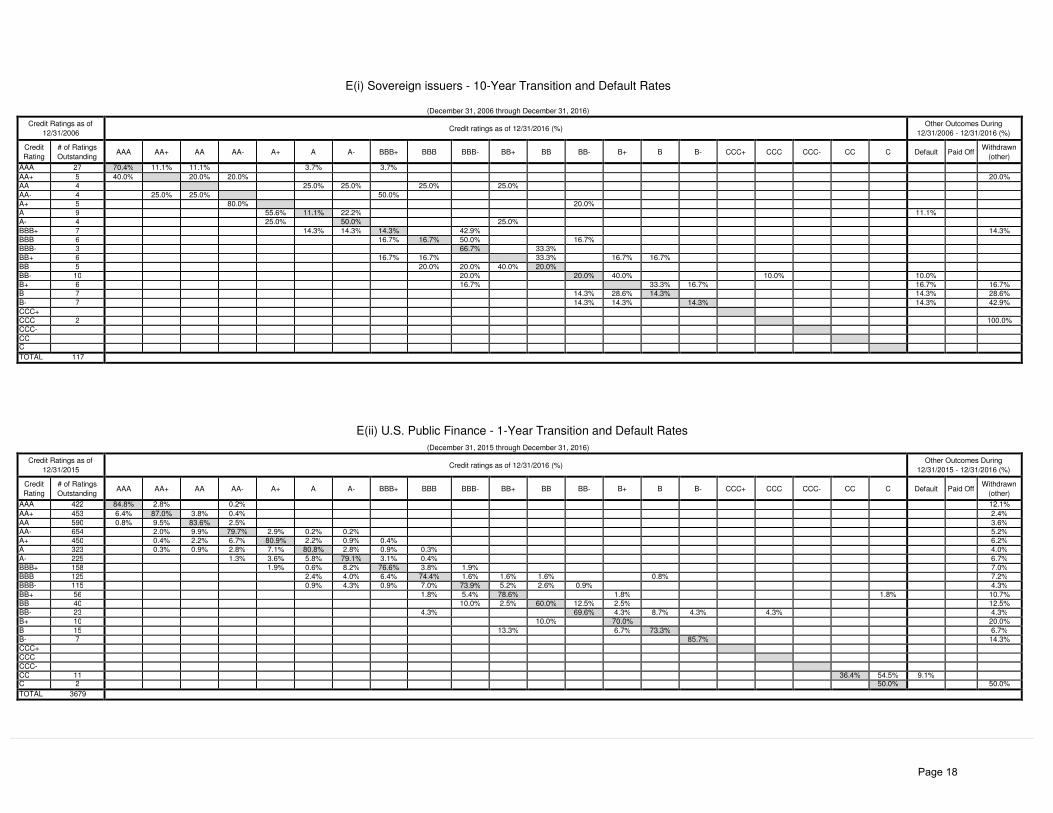
E(i) Sovereign issuers - 10-Year Transition and Default Rates
(December 31, 2006 through December 31, 2016)
Credit Ratings as of
12/31/2006
Credit ratings as of 12/31/2016 (%) Other Outcomes During
12/31/2006 - 12/31/2016 (%)
Credit
Rating
# of Ratings
Outstanding
AAA
AA+
AA
AA-
A+
A
A-
BBB+
BBB
BBB-
BB+
BB
BB-
B+
B
B-
CCC+
CCC
CCC-
CC
C
Default
Paid Off Withdrawn
(other)
AAA 27 70.4% 11.1% 11.1% 3.7% 3.7%
AA+ 5 40.0% 20.0% 20.0% 20.0%
AA 4 25.0% 25.0% 25.0% 25.0%
AA- 4 25.0% 25.0% 50.0%
A+ 5 80.0% 20.0%
A 9 55.6% 11.1% 22.2% 11.1%
A- 4 25.0% 50.0% 25.0%
BBB+ 7 14.3% 14.3% 14.3% 42.9% 14.3%
BBB 6 16.7% 16.7% 50.0% 16.7%
BBB- 3 66.7% 33.3%
BB+ 6 16.7% 16.7% 33.3% 16.7% 16.7%
BB 5 20.0% 20.0% 40.0% 20.0%
BB- 10 20.0% 20.0% 40.0% 10.0% 10.0%
B+ 6 16.7% 33.3% 16.7% 16.7% 16.7%
B 7 14.3% 28.6% 14.3% 14.3% 28.6%
B- 7 14.3% 14.3% 14.3% 14.3% 42.9%
CCC+
CCC 2 100.0%
CCC-
CC
C
TOTAL 117
E(ii) U.S. Public Finance - 1-Year Transition and Default Rates
(December 31, 2015 through December 31, 2016)
Credit Ratings as of
12/31/2015
Credit ratings as of 12/31/2016 (%) Other Outcomes During
12/31/2015 - 12/31/2016 (%)
Credit
Rating
# of Ratings
Outstanding
AAA
AA+
AA
AA-
A+
A
A-
BBB+
BBB
BBB-
BB+
BB
BB-
B+
B
B-
CCC+
CCC
CCC-
CC
C
Default
Paid Off Withdrawn
(other)
AAA 422 84.8% 2.8% 0.2% 12.1%
AA+ 453 6.4% 87.0% 3.8% 0.4% 2.4%
AA 590 0.8% 9.5% 83.6% 2.5% 3.6%
AA- 654 2.0% 9.9% 79.7% 2.9% 0.2% 0.2% 5.2%
A+ 450 0.4% 2.2% 6.7% 80.9% 2.2% 0.9% 0.4% 6.2%
A 323 0.3% 0.9% 2.8% 7.1% 80.8% 2.8% 0.9% 0.3% 4.0%
A- 225 1.3% 3.6% 5.8% 79.1% 3.1% 0.4% 6.7%
BBB+ 158 1.9% 0.6% 8.2% 76.6% 3.8% 1.9% 7.0%
BBB 125 2.4% 4.0% 6.4% 74.4% 1.6% 1.6% 1.6% 0.8% 7.2%
BBB- 115 0.9% 4.3% 0.9% 7.0% 73.9% 5.2% 2.6% 0.9% 4.3%
BB+ 56 1.8% 5.4% 78.6% 1.8% 1.8% 10.7%
BB 40 10.0% 2.5% 60.0% 12.5% 2.5% 12.5%
BB- 23 4.3% 69.6% 4.3% 8.7% 4.3% 4.3% 4.3%
B+ 10 10.0% 70.0% 20.0%
B 15 13.3% 6.7% 73.3% 6.7%
B- 7 85.7% 14.3%
CCC+
CCC
CCC-
CC 11 36.4% 54.5% 9.1%
C 2 50.0% 50.0%
TOTAL 3679
Page 18
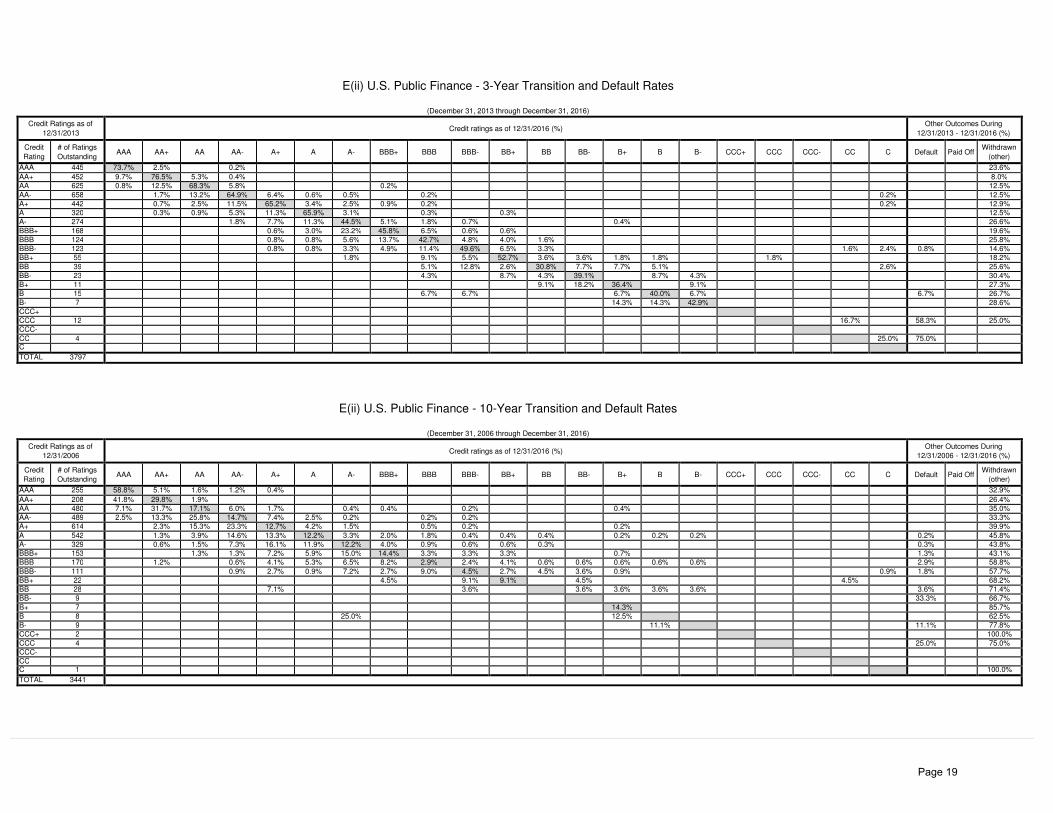
E(ii) U.S. Public Finance - 3-Year Transition and Default Rates
(December 31, 2013 through December 31, 2016)
Credit Ratings as of
12/31/2013
Credit ratings as of 12/31/2016 (%) Other Outcomes During
12/31/2013 - 12/31/2016 (%)
Credit
Rating
# of Ratings
Outstanding
AAA
AA+
AA
AA-
A+
A
A-
BBB+
BBB
BBB-
BB+
BB
BB-
B+
B
B-
CCC+
CCC
CCC-
CC
C
Default
Paid Off Withdrawn
(other)
AAA 445 73.7% 2.5% 0.2% 23.6%
AA+ 452 9.7% 76.5% 5.3% 0.4% 8.0%
AA 625 0.8% 12.5% 68.3% 5.8% 0.2% 12.5%
AA- 658 1.7% 13.2% 64.9% 6.4% 0.6% 0.5% 0.2% 0.2% 12.5%
A+ 442 0.7% 2.5% 11.5% 65.2% 3.4% 2.5% 0.9% 0.2% 0.2% 12.9%
A 320 0.3% 0.9% 5.3% 11.3% 65.9% 3.1% 0.3% 0.3% 12.5%
A- 274 1.8% 7.7% 11.3% 44.5% 5.1% 1.8% 0.7% 0.4% 26.6%
BBB+ 168 0.6% 3.0% 23.2% 45.8% 6.5% 0.6% 0.6% 19.6%
BBB 124 0.8% 0.8% 5.6% 13.7% 42.7% 4.8% 4.0% 1.6% 25.8%
BBB- 123 0.8% 0.8% 3.3% 4.9% 11.4% 49.6% 6.5% 3.3% 1.6% 2.4% 0.8% 14.6%
BB+ 55 1.8% 9.1% 5.5% 52.7% 3.6% 3.6% 1.8% 1.8% 1.8% 18.2%
BB 39 5.1% 12.8% 2.6% 30.8% 7.7% 7.7% 5.1% 2.6% 25.6%
BB- 23 4.3% 8.7% 4.3% 39.1% 8.7% 4.3% 30.4%
B+ 11 9.1% 18.2% 36.4% 9.1% 27.3%
B 15 6.7% 6.7% 6.7% 40.0% 6.7% 6.7% 26.7%
B- 7 14.3% 14.3% 42.9% 28.6%
CCC+
CCC 12 16.7% 58.3% 25.0%
CCC-
CC 4 25.0% 75.0%
C
TOTAL 3797
E(ii) U.S. Public Finance - 10-Year Transition and Default Rates
(December 31, 2006 through December 31, 2016)
Credit Ratings as of
12/31/2006
Credit ratings as of 12/31/2016 (%) Other Outcomes During
12/31/2006 - 12/31/2016 (%)
Credit
Rating
# of Ratings
Outstanding
AAA
AA+
AA
AA-
A+
A
A-
BBB+
BBB
BBB-
BB+
BB
BB-
B+
B
B-
CCC+
CCC
CCC-
CC
C
Default
Paid Off Withdrawn
(other)
AAA 255 58.8% 5.1% 1.6% 1.2% 0.4% 32.9%
AA+ 208 41.8% 29.8% 1.9% 26.4%
AA 480 7.1% 31.7% 17.1% 6.0% 1.7% 0.4% 0.4% 0.2% 0.4% 35.0%
AA- 489 2.5% 13.3% 25.8% 14.7% 7.4% 2.5% 0.2% 0.2% 0.2% 33.3%
A+ 614 2.3% 15.3% 23.3% 12.7% 4.2% 1.5% 0.5% 0.2% 0.2% 39.9%
A 542 1.3% 3.9% 14.6% 13.3% 12.2% 3.3% 2.0% 1.8% 0.4% 0.4% 0.4% 0.2% 0.2% 0.2% 0.2% 45.8%
A- 329 0.6% 1.5% 7.3% 16.1% 11.9% 12.2% 4.0% 0.9% 0.6% 0.6% 0.3% 0.3% 43.8%
BBB+ 153 1.3% 1.3% 7.2% 5.9% 15.0% 14.4% 3.3% 3.3% 3.3% 0.7% 1.3% 43.1%
BBB 170 1.2% 0.6% 4.1% 5.3% 6.5% 8.2% 2.9% 2.4% 4.1% 0.6% 0.6% 0.6% 0.6% 0.6% 2.9% 58.8%
BBB- 111 0.9% 2.7% 0.9% 7.2% 2.7% 9.0% 4.5% 2.7% 4.5% 3.6% 0.9% 0.9% 1.8% 57.7%
BB+ 22 4.5% 9.1% 9.1% 4.5% 4.5% 68.2%
BB 28 7.1% 3.6% 3.6% 3.6% 3.6% 3.6% 3.6% 71.4%
BB- 9 33.3% 66.7%
B+ 7 14.3% 85.7%
B 8 25.0% 12.5% 62.5%
B- 9 11.1% 11.1% 77.8%
CCC+ 2 100.0%
CCC 4 25.0% 75.0%
CCC-
CC
C 1 100.0%
TOTAL 3441
Page 19

E(iii) International Public Finance - 1-Year Transition and Default Rates
(December 31, 2015 through December 31, 2016)
Credit Ratings as of
12/31/2015
Credit ratings as of 12/31/2016 (%) Other Outcomes During
12/31/2015 - 12/31/2016 (%)
Credit
Rating
# of Ratings
Outstanding
AAA
AA+
AA
AA-
A+
A
A-
BBB+
BBB
BBB-
BB+
BB
BB-
B+
B
B-
CCC+
CCC
CCC-
CC
C
Default
Paid Off Withdrawn
(other)
AAA 12 100.0%
AA+ 5 20.0% 80.0%
AA 31 83.9% 6.5% 9.7%
AA- 17 100.0%
A+ 8 100.0%
A 16 93.8% 6.3%
A- 12 91.7% 8.3%
BBB+ 25 4.0% 76.0% 16.0% 4.0%
BBB 28 7.1% 82.1% 10.7%
BBB- 33 3.0% 84.8% 6.1% 6.1%
BB+ 17 70.6% 29.4%
BB 19 78.9% 10.5% 10.5%
BB- 11 81.8% 9.1% 9.1%
B+ 6 83.3% 16.7%
B
B-
CCC+
CCC 5 80.0% 20.0%
CCC-
CC
C 1 100.0%
TOTAL 246
E(iii) International Public Finance - 3-Year Transition and Default Rates
(December 31, 2013 through December 31, 2016)
Credit Ratings as of
12/31/2013
Credit ratings as of 12/31/2016 (%) Other Outcomes During
12/31/2013 - 12/31/2016 (%)
Credit
Rating
# of Ratings
Outstanding
AAA
AA+
AA
AA-
A+
A
A-
BBB+
BBB
BBB-
BB+
BB
BB-
B+
B
B-
CCC+
CCC
CCC-
CC
C
Default
Paid Off Withdrawn
(other)
AAA 12 100.0%
AA+ 20 5.0% 85.0% 10.0%
AA 21 52.4% 33.3% 14.3%
AA- 16 62.5% 25.0% 12.5%
A+ 5 60.0% 20.0% 20.0%
A 7 85.7% 14.3%
A- 14 28.6% 57.1% 14.3%
BBB+ 23 8.7% 43.5% 17.4% 30.4%
BBB 37 18.9% 37.8% 24.3% 5.4% 5.4% 8.1%
BBB- 36 2.8% 13.9% 58.3% 2.8% 11.1% 2.8% 8.3%
BB+ 14 7.1% 50.0% 14.3% 7.1% 21.4%
BB 15 13.3% 53.3% 26.7% 6.7%
BB- 10 10.0% 30.0% 30.0% 30.0%
B+ 6 16.7% 33.3% 50.0%
B 1 100.0%
B- 7 42.9% 14.3% 28.6% 14.3%
CCC+
CCC
CCC-
CC
C
TOTAL 244
Page 20
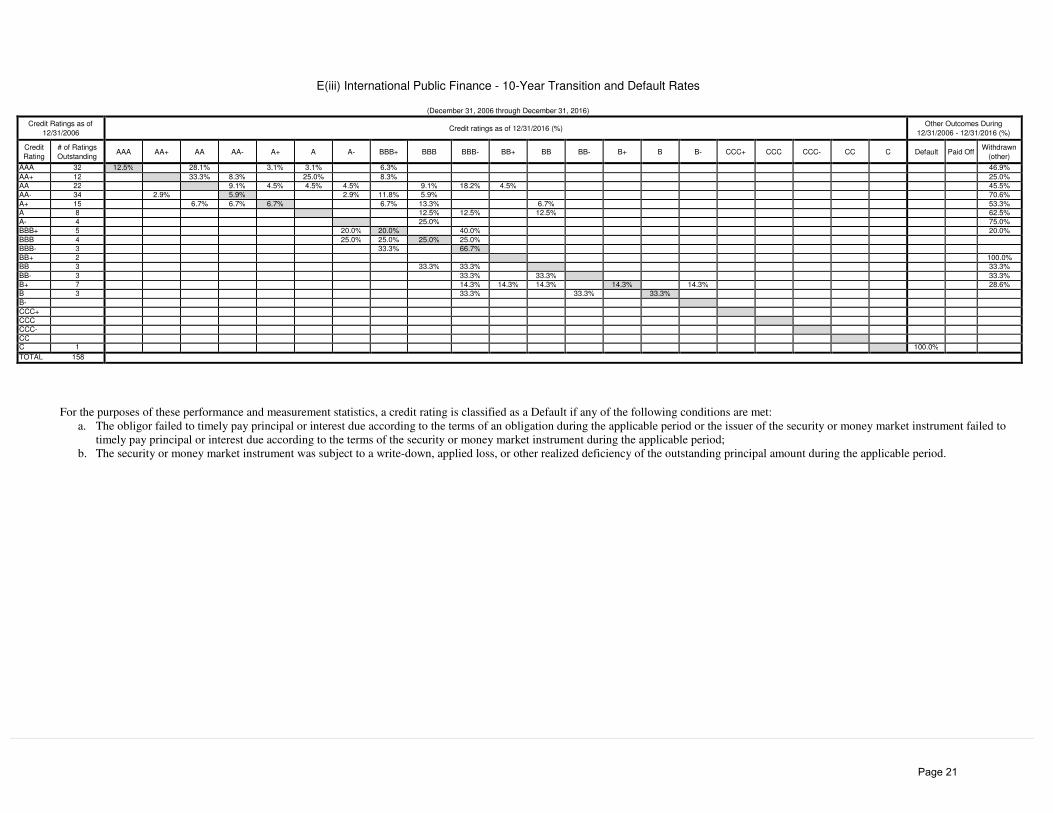
E(iii) International Public Finance - 10-Year Transition and Default Rates
(December 31, 2006 through December 31, 2016)
Credit Ratings as of
12/31/2006
Credit ratings as of 12/31/2016 (%) Other Outcomes During
12/31/2006 - 12/31/2016 (%)
Credit
Rating
# of Ratings
Outstanding
AAA
AA+
AA
AA-
A+
A
A-
BBB+
BBB
BBB-
BB+
BB
BB-
B+
B
B-
CCC+
CCC
CCC-
CC
C
Default
Paid Off Withdrawn
(other)
AAA 32 12.5% 28.1% 3.1% 3.1% 6.3% 46.9%
AA+ 12 33.3% 8.3% 25.0% 8.3% 25.0%
AA 22 9.1% 4.5% 4.5% 4.5% 9.1% 18.2% 4.5% 45.5%
AA- 34 2.9% 5.9% 2.9% 11.8% 5.9% 70.6%
A+ 15 6.7% 6.7% 6.7% 6.7% 13.3% 6.7% 53.3%
A 8 12.5% 12.5% 12.5% 62.5%
A- 4 25.0% 75.0%
BBB+ 5 20.0% 20.0% 40.0% 20.0%
BBB 4 25.0% 25.0% 25.0% 25.0%
BBB- 3 33.3% 66.7%
BB+ 2 100.0%
BB 3 33.3% 33.3% 33.3%
BB- 3 33.3% 33.3% 33.3%
B+ 7 14.3% 14.3% 14.3% 14.3% 14.3% 28.6%
B 3 33.3% 33.3% 33.3%
B-
CCC+
CCC
CCC-
CC
C 1 100.0%
TOTAL 158
For the purposes of these performance and measurement statistics, a credit rating is classified as a Default if any of the following conditions are met:
a. The obligor failed to timely pay principal or interest due according to the terms of an obligation during the applicable period or the issuer of the security or money market instrument failed to
timely pay principal or interest due according to the terms of the security or money market instrument during the applicable period;
b. The security or money market instrument was subject to a write-down, applied loss, or other realized deficiency of the outstanding principal amount during the applicable period.
Page 21

Definitions and Symbols International Credit Rating Scales The Primary Credit Rating Scales (those featuring the symbols 'AAA'–'D' and 'F1'–'D') are used for debt and financial strength ratings. This page describes their use for issuers and obligations in corporate, public, structured and infrastructure and project finance debt markets. Within rating categories, Fitch may use modifiers. The modifiers "+" or "-" may be appended to a rating to denote relative status within major rating categories. For example, the rating category ‘AA’ has three notch-specific rating levels (‘AA+’; ‘AA’; ‘AA–‘; each a rating level). Such suffixes are not added to ‘AAA’ ratings. For corporate finance obligation ratings, they are not appended to rating categories below the ‘CCC’. For all other sectors/obligations, they are not assigned to rating categories below the ‘B’. For the short-term rating category of ‘F1’, a ‘+’ may be appended. International credit ratings relate to either foreign currency or local currency commitments and, in both cases, assess the capacity to meet these commitments using a globally applicable scale. As such, both foreign currency and local currency international ratings are internationally comparable assessments. The Local Currency International Rating measures the likelihood of repayment in the currency of the jurisdiction in which the issuer is domiciled and hence does not take account of the possibility that it will not be possible to convert local currency into foreign currency or make transfers between sovereign jurisdictions (transfer and convertibility [T&C] risk). Foreign Currency Ratings additionally consider the profile of the issuer or note after taking into account T&C risk. This risk is usually communicated for different countries by the Country Ceiling, which caps the foreign currency ratings of most, though not all, issuers within a given country. Where the rating is not explicitly described in the relevant Rating Action Commentary as local or foreign currency, the reader should assume that the rating is a Foreign Currency Rating (i.e. the rating is applicable for all convertible currencies of obligation).
Issuer Default Ratings Rated entities in a number of sectors, including financial and non-financial corporations, sovereigns, insurance companies and certain sectors within public finance, are generally assigned Issuer Default Ratings (IDRs). IDRs are also assigned to certain entities in global infrastructure and project finance. IDRs opine on an entity's relative vulnerability to default on financial obligations. The threshold default risk addressed by the IDR is generally that of the financial obligations whose non-payment would best reflect the uncured failure of that entity. As such, IDRs also address relative vulnerability to bankruptcy, administrative receivership or similar concepts. In aggregate, IDRs provide an ordinal ranking of issuers based on Fitch's view of their relative vulnerability to default, rather than a prediction of a specific percentage likelihood of default.
Page 22
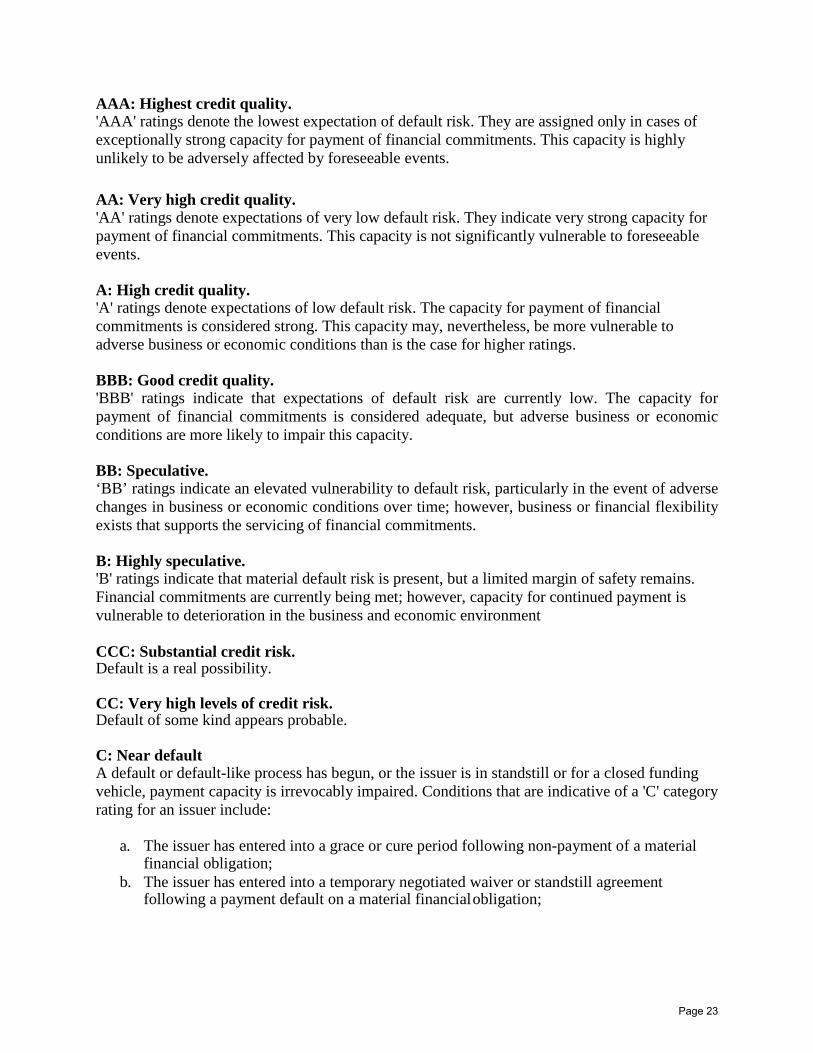
AAA: Highest credit quality. 'AAA' ratings denote the lowest expectation of default risk. They are assigned only in cases of exceptionally strong capacity for payment of financial commitments. This capacity is highly unlikely to be adversely affected by foreseeable events. AA: Very high credit quality. 'AA' ratings denote expectations of very low default risk. They indicate very strong capacity for payment of financial commitments. This capacity is not significantly vulnerable to foreseeable events. A: High credit quality. 'A' ratings denote expectations of low default risk. The capacity for payment of financial commitments is considered strong. This capacity may, nevertheless, be more vulnerable to adverse business or economic conditions than is the case for higher ratings. BBB: Good credit quality. 'BBB' ratings indicate that expectations of default risk are currently low. The capacity for payment of financial commitments is considered adequate, but adverse business or economic conditions are more likely to impair this capacity. BB: Speculative. ‘BB’ ratings indicate an elevated vulnerability to default risk, particularly in the event of adverse changes in business or economic conditions over time; however, business or financial flexibility exists that supports the servicing of financial commitments. B: Highly speculative. 'B' ratings indicate that material default risk is present, but a limited margin of safety remains. Financial commitments are currently being met; however, capacity for continued payment is vulnerable to deterioration in the business and economic environment CCC: Substantial credit risk. Default is a real possibility. CC: Very high levels of credit risk. Default of some kind appears probable. C: Near default A default or default-like process has begun, or the issuer is in standstill or for a closed funding vehicle, payment capacity is irrevocably impaired. Conditions that are indicative of a 'C' category rating for an issuer include:
a. The issuer has entered into a grace or cure period following non-payment of a material financial obligation;
b. The issuer has entered into a temporary negotiated waiver or standstill agreement following a payment default on a material financial obligation;
Page 23
c. The formal announcement by the issuer or their agent of a distressed debt exchange; d. A closed financing vehicle where payment capacity is irrevocably impaired such that it is
not expected to pay interest and/or principal in full during the life of the transaction, but where no payment default is imminent
RD: Restricted default. 'RD' ratings indicate an issuer that in Fitch’s opinion has experienced:
a. An uncured payment default on a bond, loan or other material financial obligation, but b. Has not entered into bankruptcy filings, administration, receivership, liquidation, or other
formal winding-up procedure, and c. Has not otherwise ceased operating.
This would include:
i. the selective payment default on a specific class or currency of debt; ii. the uncured expiry of any applicable grace period, cure period or default forbearance
period following a payment default on a bank loan, capital markets security or other material financial obligation;
iii. The extension of multiple waivers or forbearance periods upon a payment default on one or more material financial obligations, either in series or in parallel; ordinary execution of a distressed debt exchange on one or more material financial obligations.
D: Default. 'D' ratings indicate an issuer that in Fitch’s opinion has entered into bankruptcy filings, administration, receivership, liquidation or other formal winding-up procedure or that has otherwise ceased business. Default ratings are not assigned prospectively to entities or their obligations; within this context, non-payment on an instrument that contains a deferral feature or grace period will generally not be considered a default until after the expiration of the deferral or grace period, unless a default is otherwise driven by bankruptcy or other similar circumstance, or by a distressed debt exchange. In all cases, the assignment of a default rating reflects the Fitch's opinion as to the most appropriate rating category consistent with the rest of its universe of ratings and may differ from the definition of default under the terms of an issuer's financial obligations or local commercial practice.
Structured Finance Ratings of structured finance obligations on the long-term scale consider the obligations' relative vulnerability to default. These ratings are typically assigned to an individual security or tranche in a transaction and not to an issuer.
Page 24

AAA: Highest Credit Quality. 'AAA' ratings denote the lowest expectation of default risk. They are assigned only in cases of exceptionally strong capacity for payment of financial commitments. This capacity is highly unlikely to be adversely affected by foreseeable events. AA: Very High Credit Quality. 'AA' ratings denote expectations of very low default risk. They indicate very strong capacity for payment of financial commitments. This capacity is not significantly vulnerable to foreseeable events. A: High Credit Quality. 'A' ratings denote expectations of low default risk. The capacity for payment of financial commitments is considered strong. This capacity may, nevertheless, be more vulnerable to adverse business or economic conditions than is the case for higher ratings. BBB: Good Credit Quality. 'BBB' ratings indicate that expectations of default risk are currently low. The capacity for payment of financial commitments is considered adequate, but adverse business or economic conditions are more likely to impair this capacity. BB: Speculative. 'BB' ratings indicate an elevated vulnerability to default risk, particularly in the event of adverse changes in business or economic conditions over time. B: Highly Speculative. 'B' ratings indicate that material default risk is present, but a limited margin of safety remains. Financial commitments are currently being met; however, capacity for continued payment is vulnerable to deterioration in the business and economic environment. CCC: Substantial Credit Risk. Default is a real possibility. CC: Very High Levels of Credit Risk. Default of some kind appears probable. C: Exceptionally High Levels of Credit Risk. Default appears imminent or inevitable. D: Default. Indicates a default. Default generally is defined as one of the following:
a. Failure to make payment of principal and/or interest under the contractual terms of the rated obligation;
b. Bankruptcy filings, administration, receivership, liquidation or other winding-up or cessation of the business of an issuer/obligor; or
c. Distressed exchange of an obligation, where creditors were offered securities with diminished structural or economic terms compared with the existing obligation to avoid a probable payment default.
Page 25
Structured Finance Defaults Imminent default, categorized under 'C', typically refers to the occasion where a payment default has been intimated by the issuer and is all but inevitable. This may, for example, be where an issuer has missed a scheduled payment but (as is typical) has a grace period during which it may cure the payment default. Another alternative would be where an issuer has formally announced a distressed debt exchange, but the date of the exchange still lies several days or weeks in the immediate future. Additionally, in structured finance transactions, where analysis indicates that an instrument is irrevocably impaired such that it is not expected to pay interest and/or principal in full in accordance with the terms of the obligation's documentation during the life of the transaction, but where no payment default in accordance with the terms of the documentation is imminent, the obligation will typically be rated in the 'C' category. Structured Finance Write-downs Where an instrument has experienced an involuntary and, in the Fitch's opinion, irreversible write- down of principal (i.e. other than through amortization, and resulting in a loss to the investor), a credit rating of 'D' will be assigned to the instrument. Where Fitch believes the write-down may prove to be temporary (and the loss may be written up again in future if and when performance improves), then a credit rating of 'C' will typically be assigned. Should the write-down then later be reversed, the credit rating will be raised to an appropriate level for that instrument. Should the write- down later be deemed as irreversible, the credit rating will be lowered to 'D'. Notes: In the case of structured finance, while the ratings do not address the loss severity given default of the rated liability, loss severity assumptions on the underlying assets are nonetheless typically included as part of the analysis. Loss severity assumptions are used to derive pool cash flows available to service the rated liability.
Short-Term Ratings Assigned to Issuers and Obligations A short-term issuer or obligation rating is based in all cases on the short-term vulnerability to default of the rated entity and relates to the capacity to meet financial obligations in accordance with the documentation governing the relevant obligation. Short-term deposit ratings may be adjusted for loss severity. Short-Term Ratings are assigned to obligations whose initial maturity is viewed as "short term" based on market convention. Typically, this means up to 13 months for corporate, sovereign, and structured obligations and up to 36 months for obligations in U.S. public finance markets. F1: Highest Short-Term Credit Quality. Indicates the strongest intrinsic capacity for timely payment of financial commitments; may have an added "+" to denote any exceptionally strong credit feature.
Page 26

F2: Good Short-Term Credit Quality. Good intrinsic capacity for timely payment of financial commitments. F3: Fair Short-Term Credit Quality. The intrinsic capacity for timely payment of financial commitments is adequate. B: Speculative Short-Term Credit Quality. Minimal capacity for timely payment of financial commitments, plus heightened vulnerability to near term adverse changes in financial and economic conditions. C: High Short-Term Default risk. Default is a real possibility. RD: Restricted Default. Indicates an entity that has defaulted on one or more of its financial commitments, although it continues to meet other financial obligations. Typically applicable to entity ratings only. D: Default. Indicates a broad-based default event for an entity, or the default of a short-term obligation.
Relationship between Short-Term and Long-Term Ratings For corporate and public finance ratings, issuers may often carry both Long-Term and Short- Term Ratings. These may be assigned to the issuer, to its obligations, or to both. While there are a large number of discrete factors that drive Short-Term Ratings, a linkage has typically existed between Short-Term and Long-Term Ratings. In part, this reflects the inherent importance of liquidity and near-term concerns within the assessment of the longer-term credit profile. Additionally, it ensures that the two scales do not intuitively contradict each other for a given issuer. This linkage is outlined below, and in most circumstances displays a certain asymmetry, namely:
a. Higher relative short-term default risk implies an elevated risk of default in the near- term that cannot be separated from the long-term default assessment for most instruments and issuers; but
b. Lower relative short-term default risk, perhaps through factors that lend the issuer's profile temporary support, may coexist with higher medium- or longer- term default risk.
The Rating Correspondence Table thus represents a "common-sense" check on the combination of a particularly weak Short-Term Rating with a high Long-Term Rating. The other asymmetry — stronger Short-Term Rating but weaker Long-Term Rating — is addressed conceptually. The Short- Term Rating within investment grade is a measure of intrinsic or sustainable liquidity, which in most cases excludes the kind of temporary or unsustainable support, described in point b. above. The table below is a guide only. Actual ratings assigned can differ from this correspondence consistent with the criteria employed by individual rating groups, where analytically merited.
Page 27

Rating Correspondence Table Long-Term Rating Short-Term Rating
AAA F1+ AA+ F1+ AA F1+ AA– F1+ A+ F1 or F1+ A F1 A– F2 or F1 BBB+ F2 BBB F3 or F2 BBB– F3 BB+ B BB B BB– B B+ B B B B– B CCC C CC C C C RD/D RD/D
Ratings Definitions Additional information regarding Ratings Definitions can also be found via the web link below under the heading: “Ratings Definitions”, “Ratings Definitions (PDF, 870 KB)” https://www.fitchratings.com/site/definitions 17 CFR 17g-7(b) Disclosure of Credit Rating Histories Information pursuant to 17 CFR 17g-7(b) Disclosure of Credit Rating Histories, can be found at the web address below under the headings: “Disclosures”, “17g-7 Ratings History Disclosure”: https://www.fitchratings.com/site/regulatory
Page 28