fisheries monitoring of the ribble catchment...
TRANSCRIPT
Fisheries Monitoring of the Ribble Catchment 2017
Ribble Rivers Trust
Adam Wheeler: Fisheries Monitoring Officer
Fisheries Monitoring of the Ribble Catchment 2017
i | P a g e
Ribble Rivers Trust
c/o Hanson Cement
Ribblesdale Works
Clitheroe
BB7 4QF
Phone: 01200 444452
E-mail: [email protected]
Report title: Fisheries Monitoring of The Ribble Catchment 2017
Report reference: RRT_Electrofishing_2017_Report
Report version: 1.0
Date: 01/11/2017
Prepared for: The Ribble Rivers Trust
Authored by: Adam Wheeler: Fisheries Monitoring Officer
Checked by: Mike Forty: Catchment Science Co-Ordinator
Copyright Ribble Rivers Trust, 2017.
This report has been prepared using due skill, care and diligence for the exclusive use of the commissioning party by Ribble
Rivers Trust. No liability is accepted by Ribble Rivers Trust for the use and or application of the contents of the report.

Fisheries Monitoring of the Ribble Catchment 2017
Table of Contents Acknowledgements ................................................................................................................................................ i
Executive Summary ............................................................................................................................................... ii
Introduction........................................................................................................................................................... 1
Methodology ......................................................................................................................................................... 3
Electrofishing surveys ......................................................................................................................................... 3
Sub-catchment map ........................................................................................................................................... 5
Data Analysis ...................................................................................................................................................... 6
Results ................................................................................................................................................................... 7
Brown trout ....................................................................................................................................................... 7
Calder .......................................................................................................................................................... 10
Hodder ......................................................................................................................................................... 10
Lower Ribble ................................................................................................................................................ 11
Main Ribble .................................................................................................................................................. 12
Salmon............................................................................................................................................................. 13
Calder .......................................................................................................................................................... 16
Hodder ......................................................................................................................................................... 17
Lower Ribble ................................................................................................................................................ 17
Main Ribble .................................................................................................................................................. 17
Biodiversity ...................................................................................................................................................... 18
Other Species ................................................................................................................................................... 19
Bycatch ........................................................................................................................................................ 19
Annex II Species............................................................................................................................................ 20
Eel ................................................................................................................................................................ 21
Crayfish ........................................................................................................................................................ 24
Discussion and Conclusions.................................................................................................................................. 25
Recommendations ............................................................................................................................................... 28
References ........................................................................................................................................................... 29
Appendices .......................................................................................................................................................... 30
Appendix A ....................................................................................................................................................... 30
Appendix B ....................................................................................................................................................... 30
Appendix C ....................................................................................................................................................... 33
Appendix D....................................................................................................................................................... 34
Fisheries Monitoring of the Ribble Catchment 2017
i | P a g e
Acknowledgements Thanks are offered to the following researchers, staff, and volunteers whose help and continued enthusiasm has
proved invaluable during the annual survey programme: Mike Forty (RRT), Paul Peters (RRT), Ellie Brown (RRT),
Caroline Taylor (Seasonal Survey Assistant), Victoria O’Brien (Seasonal Survey Assistant), Abigail Powel (Liverpool
University), Jacob Marsden (Bowland High), Harvey Manley (Ribblesdale High School), Jason Cummings (Woodlands
and Wetlands Trust, AUS), Kat Rowland (Durham University), Bill Auty, Simon Hardacre, Charles Allen Kenyon, Finn
Mannion, Jane Wheeler (Fish Friday Volunteers).
Fisheries Monitoring of the Ribble Catchment 2017
ii | P a g e
Executive Summary The River Ribble Trust concluded its tenth year of its inter-annual fisheries assessment of the Calder, Hodder and
main Ribble Catchments. In addition, sites on the River Darwen have been included in 2017’s fisheries programme
to monitor capital works for Ribble Life Together. Results of these surveys are used to support the identification for
future work as well as monitoring the long-term impacts of habitat and migration restoration schemes.
Quantitative and semi-quantitative surveys are performed to assess catchment productivity using an adapted
Crozier and Kennedy (1994) electrofishing method. A total of 326 sites were surveyed in 2017 covering 37km² of
river. As juvenile fish densities change rapidly with age: surveys are conducted at a similar time each year (June –
October) and in the same area to allow for valid comparisons. Salmonids are a keystone species within a river system,
they rely on ecological stability and are indicators of water and habitat quality. The Ribble Trust uses the National
Fisheries Classification System (NFCS) to allows for the standardisation of results by grading sites based on the
densities of these fry. Delays were suffered during 2017’s fisheries programme as higher than average rainfall
(September-October) resulted in sites above Gisburn being surveyed later than usual. Surveys commenced on the
19th of Jun and ended on the 16th of October.
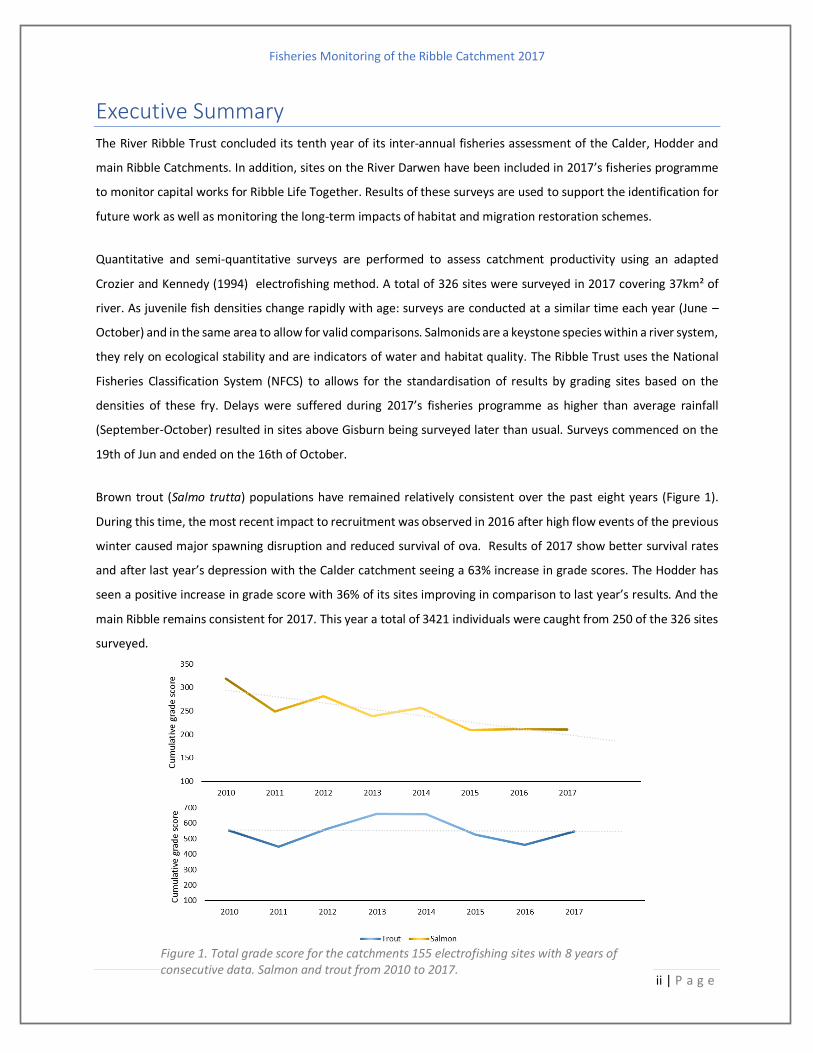
Brown trout (Salmo trutta) populations have remained relatively consistent over the past eight years (Figure 1).
During this time, the most recent impact to recruitment was observed in 2016 after high flow events of the previous
winter caused major spawning disruption and reduced survival of ova. Results of 2017 show better survival rates
and after last year’s depression with the Calder catchment seeing a 63% increase in grade scores. The Hodder has
seen a positive increase in grade score with 36% of its sites improving in comparison to last year’s results. And the
main Ribble remains consistent for 2017. This year a total of 3421 individuals were caught from 250 of the 326 sites
surveyed.
Figure 1. Total grade score for the catchments 155 electrofishing sites with 8 years of consecutive data. Salmon and trout from 2010 to 2017.
Fisheries Monitoring of the Ribble Catchment 2017
iii | P a g e
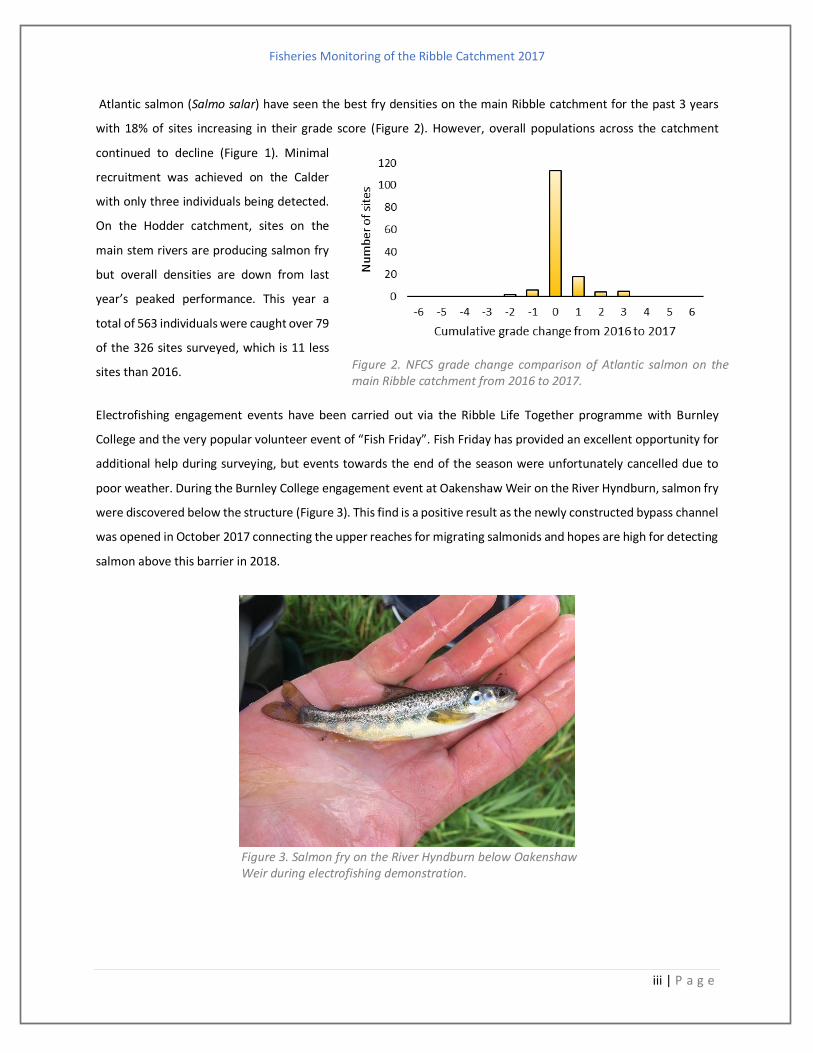
Atlantic salmon (Salmo salar) have seen the best fry densities on the main Ribble catchment for the past 3 years
with 18% of sites increasing in their grade score (Figure 2). However, overall populations across the catchment
continued to decline (Figure 1). Minimal
recruitment was achieved on the Calder
with only three individuals being detected.
On the Hodder catchment, sites on the
main stem rivers are producing salmon fry
but overall densities are down from last
year’s peaked performance. This year a
total of 563 individuals were caught over 79
of the 326 sites surveyed, which is 11 less
sites than 2016.
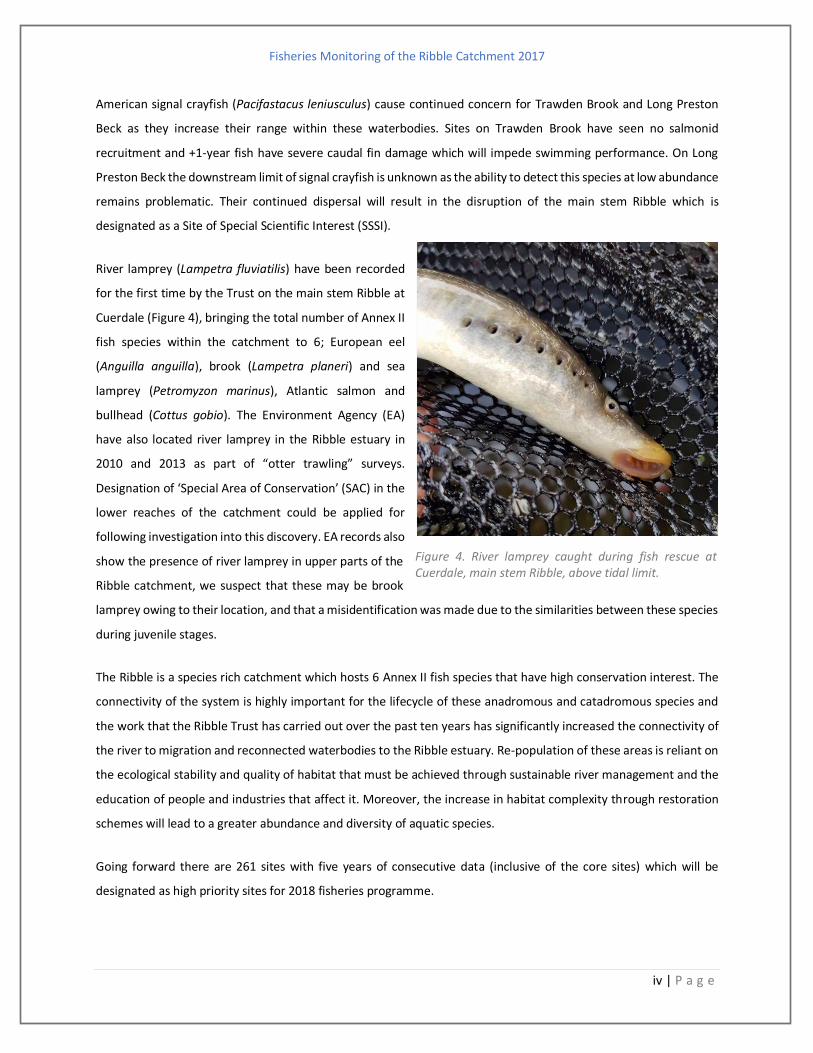
Electrofishing engagement events have been carried out via the Ribble Life Together programme with Burnley
College and the very popular volunteer event of “Fish Friday”. Fish Friday has provided an excellent opportunity for
additional help during surveying, but events towards the end of the season were unfortunately cancelled due to
poor weather. During the Burnley College engagement event at Oakenshaw Weir on the River Hyndburn, salmon fry
were discovered below the structure (Figure 3). This find is a positive result as the newly constructed bypass channel
was opened in October 2017 connecting the upper reaches for migrating salmonids and hopes are high for detecting
salmon above this barrier in 2018.
Figure 2. NFCS grade change comparison of Atlantic salmon on the main Ribble catchment from 2016 to 2017.
Figure 3. Salmon fry on the River Hyndburn below Oakenshaw Weir during electrofishing demonstration.
Fisheries Monitoring of the Ribble Catchment 2017
iv | P a g e
American signal crayfish (Pacifastacus leniusculus) cause continued concern for Trawden Brook and Long Preston
Beck as they increase their range within these waterbodies. Sites on Trawden Brook have seen no salmonid
recruitment and +1-year fish have severe caudal fin damage which will impede swimming performance. On Long
Preston Beck the downstream limit of signal crayfish is unknown as the ability to detect this species at low abundance
remains problematic. Their continued dispersal will result in the disruption of the main stem Ribble which is
designated as a Site of Special Scientific Interest (SSSI).
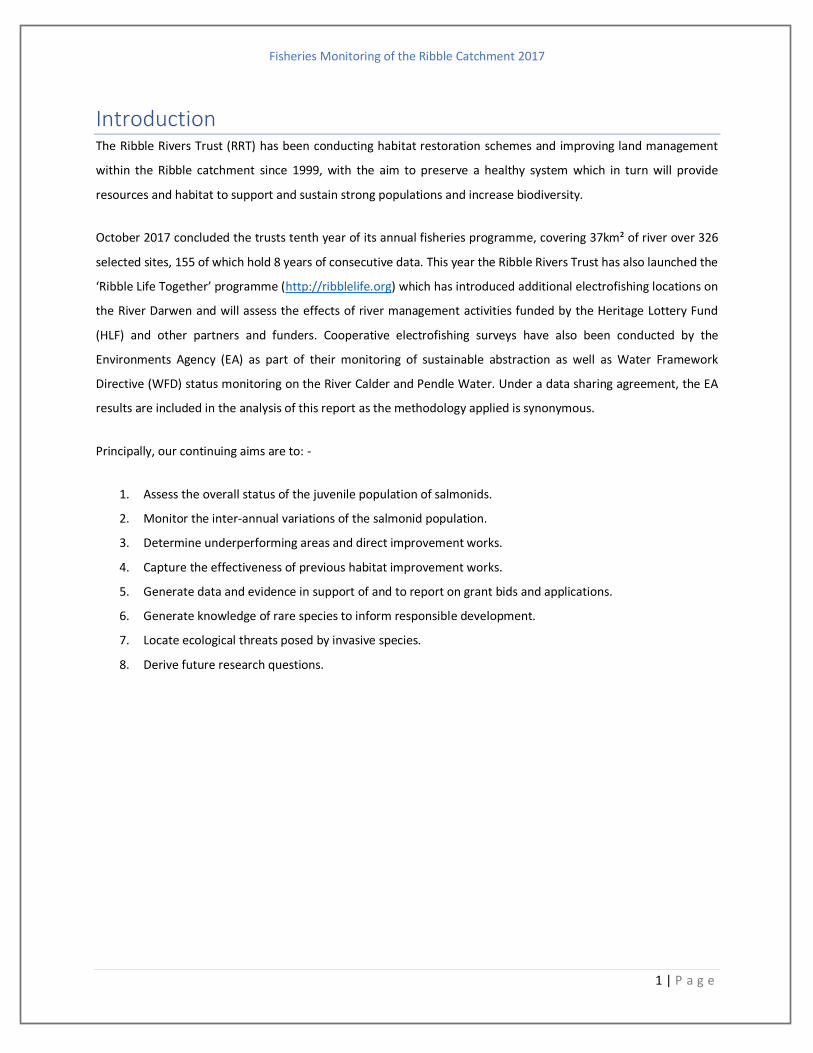
River lamprey (Lampetra fluviatilis) have been recorded
for the first time by the Trust on the main stem Ribble at
Cuerdale (Figure 4), bringing the total number of Annex II
fish species within the catchment to 6; European eel
(Anguilla anguilla), brook (Lampetra planeri) and sea
lamprey (Petromyzon marinus), Atlantic salmon and
bullhead (Cottus gobio). The Environment Agency (EA)
have also located river lamprey in the Ribble estuary in
2010 and 2013 as part of “otter trawling” surveys.
Designation of ‘Special Area of Conservation’ (SAC) in the
lower reaches of the catchment could be applied for
following investigation into this discovery. EA records also
show the presence of river lamprey in upper parts of the
Ribble catchment, we suspect that these may be brook
lamprey owing to their location, and that a misidentification was made due to the similarities between these species
during juvenile stages.
The Ribble is a species rich catchment which hosts 6 Annex II fish species that have high conservation interest. The
connectivity of the system is highly important for the lifecycle of these anadromous and catadromous species and
the work that the Ribble Trust has carried out over the past ten years has significantly increased the connectivity of
the river to migration and reconnected waterbodies to the Ribble estuary. Re-population of these areas is reliant on
the ecological stability and quality of habitat that must be achieved through sustainable river management and the
education of people and industries that affect it. Moreover, the increase in habitat complexity through restoration
schemes will lead to a greater abundance and diversity of aquatic species.
Going forward there are 261 sites with five years of consecutive data (inclusive of the core sites) which will be
designated as high priority sites for 2018 fisheries programme.
Figure 4. River lamprey caught during fish rescue at Cuerdale, main stem Ribble, above tidal limit.
Fisheries Monitoring of the Ribble Catchment 2017
1 | P a g e
Introduction The Ribble Rivers Trust (RRT) has been conducting habitat restoration schemes and improving land management
within the Ribble catchment since 1999, with the aim to preserve a healthy system which in turn will provide
resources and habitat to support and sustain strong populations and increase biodiversity.
October 2017 concluded the trusts tenth year of its annual fisheries programme, covering 37km² of river over 326
selected sites, 155 of which hold 8 years of consecutive data. This year the Ribble Rivers Trust has also launched the
‘Ribble Life Together’ programme (http://ribblelife.org) which has introduced additional electrofishing locations on
the River Darwen and will assess the effects of river management activities funded by the Heritage Lottery Fund
(HLF) and other partners and funders. Cooperative electrofishing surveys have also been conducted by the
Environments Agency (EA) as part of their monitoring of sustainable abstraction as well as Water Framework
Directive (WFD) status monitoring on the River Calder and Pendle Water. Under a data sharing agreement, the EA
results are included in the analysis of this report as the methodology applied is synonymous.
Principally, our continuing aims are to: -
1. Assess the overall status of the juvenile population of salmonids.
2. Monitor the inter-annual variations of the salmonid population.
3. Determine underperforming areas and direct improvement works.
4. Capture the effectiveness of previous habitat improvement works.
5. Generate data and evidence in support of and to report on grant bids and applications.
6. Generate knowledge of rare species to inform responsible development.
7. Locate ecological threats posed by invasive species.
8. Derive future research questions.
Fisheries Monitoring of the Ribble Catchment 2017
2 | P a g e
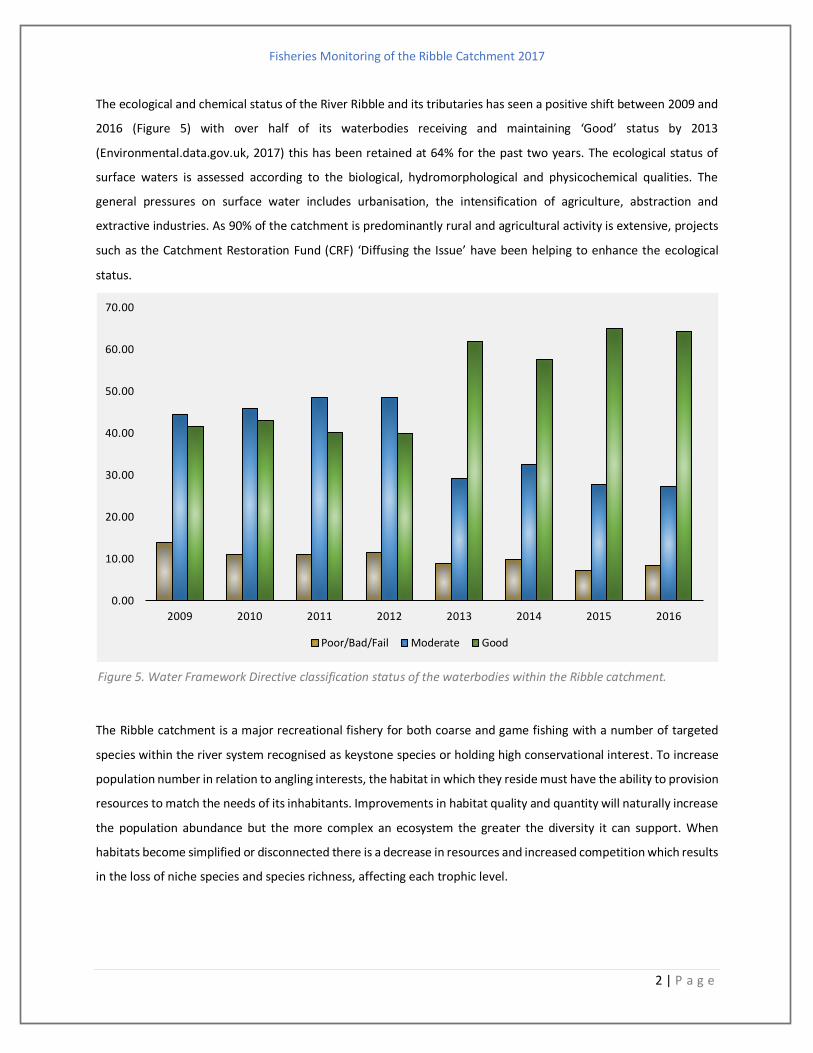
The ecological and chemical status of the River Ribble and its tributaries has seen a positive shift between 2009 and
2016 (Figure 5) with over half of its waterbodies receiving and maintaining ‘Good’ status by 2013
(Environmental.data.gov.uk, 2017) this has been retained at 64% for the past two years. The ecological status of
surface waters is assessed according to the biological, hydromorphological and physicochemical qualities. The
general pressures on surface water includes urbanisation, the intensification of agriculture, abstraction and
extractive industries. As 90% of the catchment is predominantly rural and agricultural activity is extensive, projects
such as the Catchment Restoration Fund (CRF) ‘Diffusing the Issue’ have been helping to enhance the ecological
status.
The Ribble catchment is a major recreational fishery for both coarse and game fishing with a number of targeted
species within the river system recognised as keystone species or holding high conservational interest. To increase
population number in relation to angling interests, the habitat in which they reside must have the ability to provision
resources to match the needs of its inhabitants. Improvements in habitat quality and quantity will naturally increase
the population abundance but the more complex an ecosystem the greater the diversity it can support. When
habitats become simplified or disconnected there is a decrease in resources and increased competition which results
in the loss of niche species and species richness, affecting each trophic level.
0.00
10.00
20.00
30.00
40.00
50.00
60.00
70.00
2009 2010 2011 2012 2013 2014 2015 2016
Poor/Bad/Fail Moderate Good
Figure 5. Water Framework Directive classification status of the waterbodies within the Ribble catchment.
Fisheries Monitoring of the Ribble Catchment 2017
3 | P a g e
Methodology
Electrofishing surveys This year, the Ribble catchment’s fish population was monitored by the Environments Agency (EA) in fulfilment of
its obligations under the Water Framework Directive (2000). Prior to the survey programme the Ribble Rivers Trust
co-ordinated with the EA to avoid a duplication of effort with three key sites identified. The applied methodologies
are adapted from Crozier and Kennedy (1994) and have been employed by the Trust since 2008. Each site was fished
in a zig-zag pattern moving up river. During this process the anode was swept through the water column,
approximately half depth, matching the flow towards the netter. Riffle/pool habitat was targeted to capture both
the young of year and the adult populous using an E-fish 500W electrofishing backpack system.
A review was conducted and 325 survey sites were identified and assigned an index value based on the number of
consecutive years they had been sampled. Sites assigned priority 1 held the greatest priority, with five years of
continuous data now available for 270 sample sites and 8 years’ data for 155. As juvenile fish densities change rapidly
with age: surveys are conducted at a similar time each year and in the same area to allow for valid comparisons.
Typically, two types of survey were undertaken: semi-quantitative, where the river is actively fished for five minutes
covering a measured un-isolated area without using stop-nets; and quantitative, where a netted area of river is
sampled as sequential runs, with the catch from each run detained separately for processing. Quantitative surveys
allow for the identification of capture efficiencies of each electro-fisher, thus allowing standardised results from
semi-quantitative surveys to be presented.
Commencing from the 19th June and closing on the 16nd October, 7 quantitative sites (8 in 2016) were fished on the
Calder, 9 on the Hodder (8 in 2016), and 10 completed on the Ribble (12 in 2016). It was suggested that subsequent
quantitative sites be assessed prior to surveying using the relative abundance of salmonids caught in neighbouring
semi-quantitative sites. A total of 299 (289 in 2016) semi quantitative sites were surveyed, this included 10
quantitative sites that were fished as semi-quants due to time constraints imposed by higher than average rainfall.
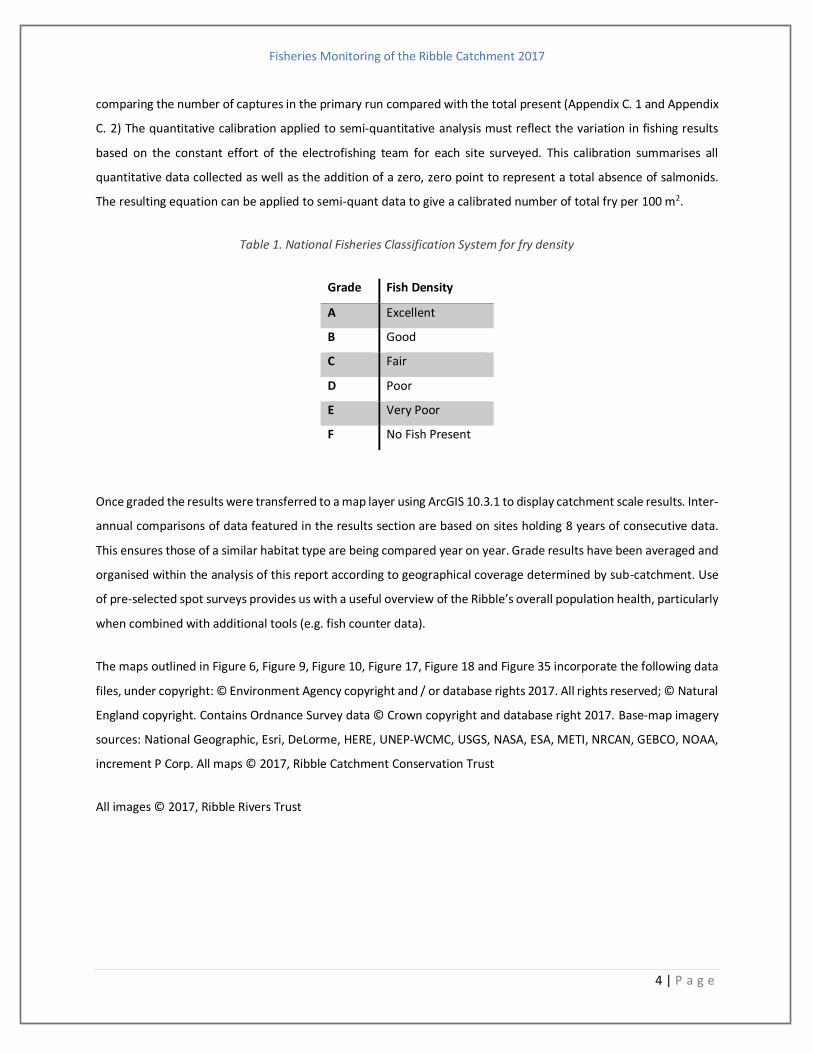
The densities of trout and salmon from the above activities were calibrated and allocated a grade score (Table 1).
The grades standardise the Trust’s field observations with those of the National Fisheries Classification System (NFCS;
National Rivers Authority (now EA), 1994). The system is species related and based upon the number of fry captured.
Fry were distinguished by establishing a maximum fork length (Appendix B. 1 toAppendix B. 5) discerned by the two-
peaked shape of the frequency-length distribution for all captures of that species for each major catchment. Grades
A – F are assigned by extrapolating the density of fry per 100m2 using the number of fry captured over a minimum
of five minutes. The capture efficiency of the electrofishing team is calculated through quantitative surveys by
Fisheries Monitoring of the Ribble Catchment 2017
4 | P a g e
comparing the number of captures in the primary run compared with the total present (Appendix C. 1 and Appendix
C. 2) The quantitative calibration applied to semi-quantitative analysis must reflect the variation in fishing results
based on the constant effort of the electrofishing team for each site surveyed. This calibration summarises all
quantitative data collected as well as the addition of a zero, zero point to represent a total absence of salmonids.
The resulting equation can be applied to semi-quant data to give a calibrated number of total fry per 100 m2.
Table 1. National Fisheries Classification System for fry density
Grade Fish Density
A Excellent
B Good
C Fair
D Poor
E Very Poor
F No Fish Present
Once graded the results were transferred to a map layer using ArcGIS 10.3.1 to display catchment scale results. Inter-
annual comparisons of data featured in the results section are based on sites holding 8 years of consecutive data.
This ensures those of a similar habitat type are being compared year on year. Grade results have been averaged and
organised within the analysis of this report according to geographical coverage determined by sub-catchment. Use
of pre-selected spot surveys provides us with a useful overview of the Ribble’s overall population health, particularly
when combined with additional tools (e.g. fish counter data).
The maps outlined in Figure 6, Figure 9, Figure 10, Figure 17, Figure 18 and Figure 35 incorporate the following data
files, under copyright: © Environment Agency copyright and / or database rights 2017. All rights reserved; © Natural
England copyright. Contains Ordnance Survey data © Crown copyright and database right 2017. Base-map imagery
sources: National Geographic, Esri, DeLorme, HERE, UNEP-WCMC, USGS, NASA, ESA, METI, NRCAN, GEBCO, NOAA,
increment P Corp. All maps © 2017, Ribble Catchment Conservation Trust
All images © 2017, Ribble Rivers Trust
Fisheries Monitoring of the Ribble Catchment 2017
5 | P a g e
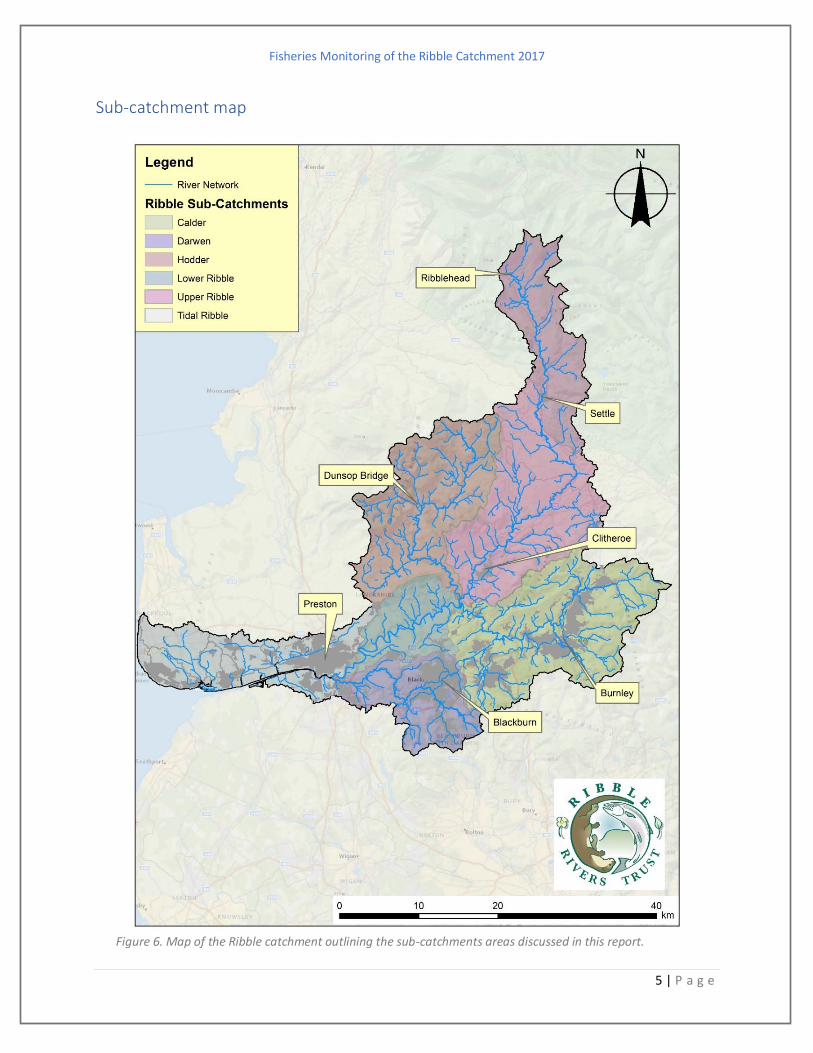
Sub-catchment map
Figure 6. Map of the Ribble catchment outlining the sub-catchments areas discussed in this report.
Fisheries Monitoring of the Ribble Catchment 2017
6 | P a g e
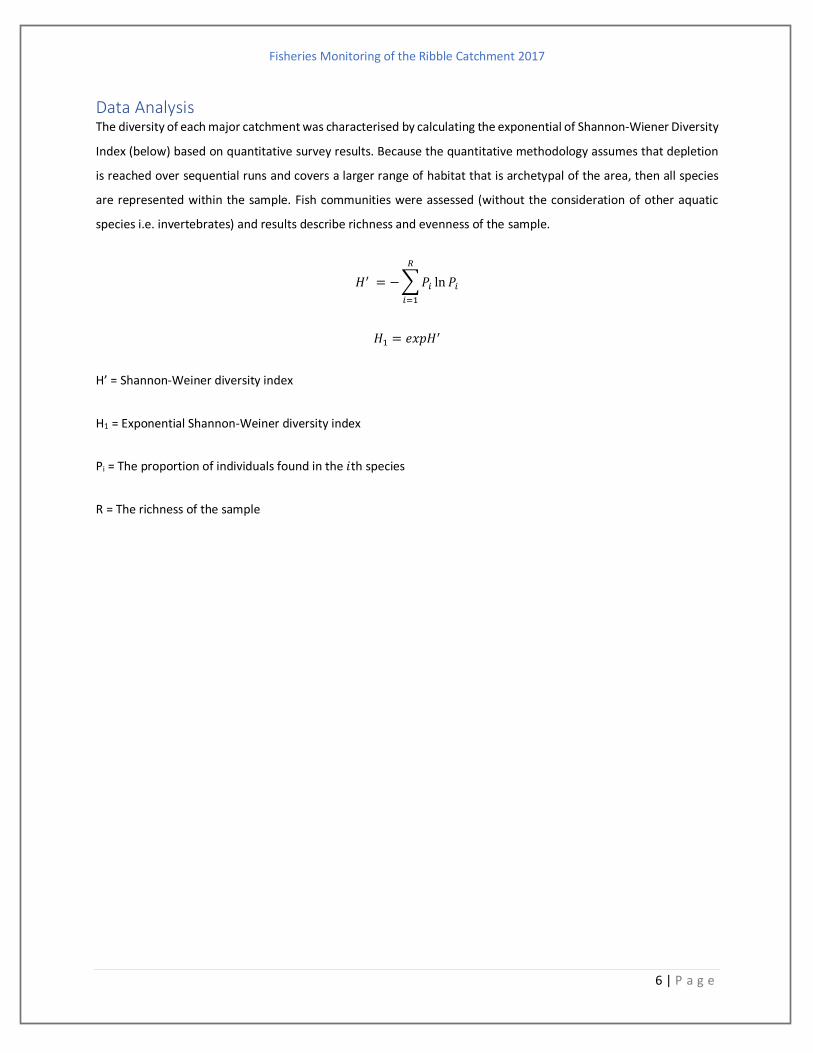
Data Analysis The diversity of each major catchment was characterised by calculating the exponential of Shannon-Wiener Diversity
Index (below) based on quantitative survey results. Because the quantitative methodology assumes that depletion
is reached over sequential runs and covers a larger range of habitat that is archetypal of the area, then all species
are represented within the sample. Fish communities were assessed (without the consideration of other aquatic
species i.e. invertebrates) and results describe richness and evenness of the sample.
𝐻′ = − ∑ 𝑃𝑖 ln 𝑃𝑖
𝑅
𝑖=1
𝐻1 = 𝑒𝑥𝑝𝐻′
H’ = Shannon-Weiner diversity index
H1 = Exponential Shannon-Weiner diversity index
Pi = The proportion of individuals found in the 𝑖th species
R = The richness of the sample

Fisheries Monitoring of the Ribble Catchment 2017
7 | P a g e
Results
Brown trout Brown trout have seen a positive recovery from last year’s depression (Figure 7) with a total of 3421 fry, parr and
adult fish captured over 250/326 electrofishing sites. This is an increase of 800 individuals in comparison with 2016
surveying results, the most notable change
being on the Calder catchment. In 2016 it
produced the lowest extreme of fry after
high fluvial events whereas 2017 sees the
Calder become the most productive sub-
catchment of the Ribble. The Hodder has
also seen a recruitment boost with the main
Ribble remaining relatively consistent to the
preceding year’s results. All 3 sub
catchments are yielding a similar degree of
young when comparing cumulative grade
scores. 2017 has seen a reduction in the
number of sites with poor status or an
absence of brown trout (E – F). The number
of F grade sites (absence of trout) will
always be of concern but there has been a
positive shift in fair to excellent (C – A)
grades over the past three years ().
Figure 7. Cumulative brown trout fry grades of sub-catchments of the Ribble 2010 to 2017.
Figure 8. Frequency comparison of brown trout NFCS grades in the Ribble catchment 2015 to 2017.
0
20
40
60
80
A B C D E F
2015 2016 2017
Fisheries Monitoring of the Ribble Catchment 2017
8 | P a g e
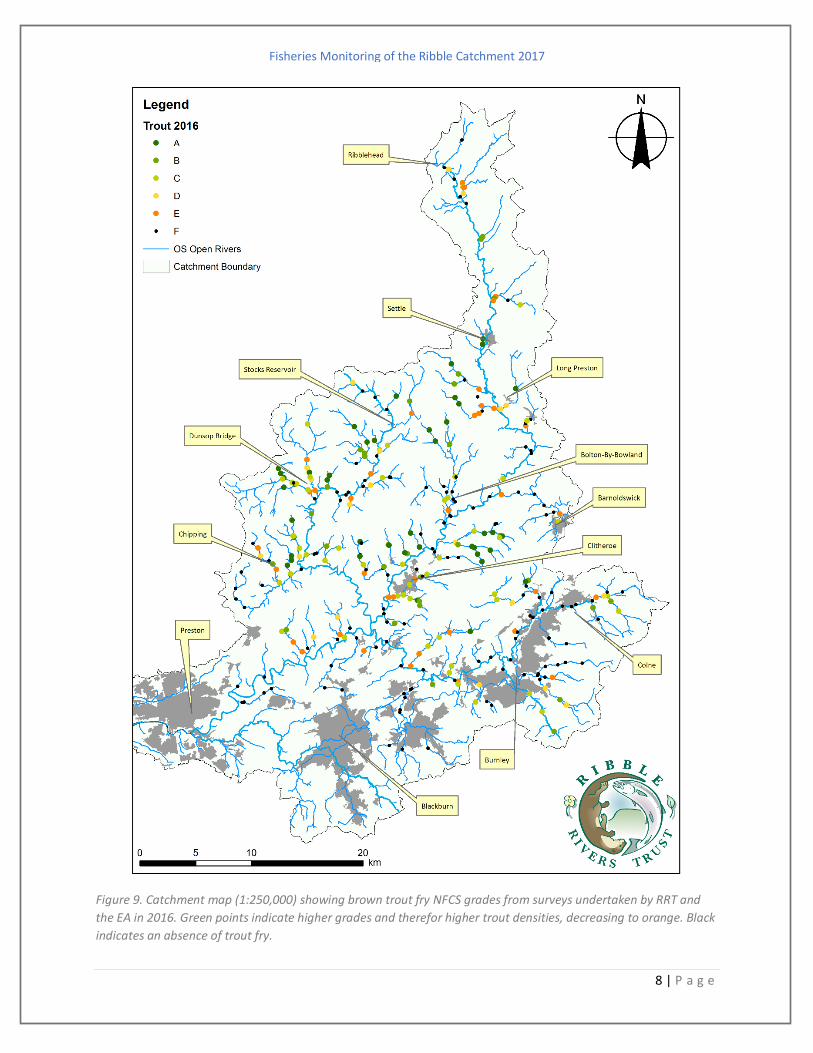
Figure 9. Catchment map (1:250,000) showing brown trout fry NFCS grades from surveys undertaken by RRT and
the EA in 2016. Green points indicate higher grades and therefor higher trout densities, decreasing to orange. Black
indicates an absence of trout fry.
Fisheries Monitoring of the Ribble Catchment 2017
9 | P a g e
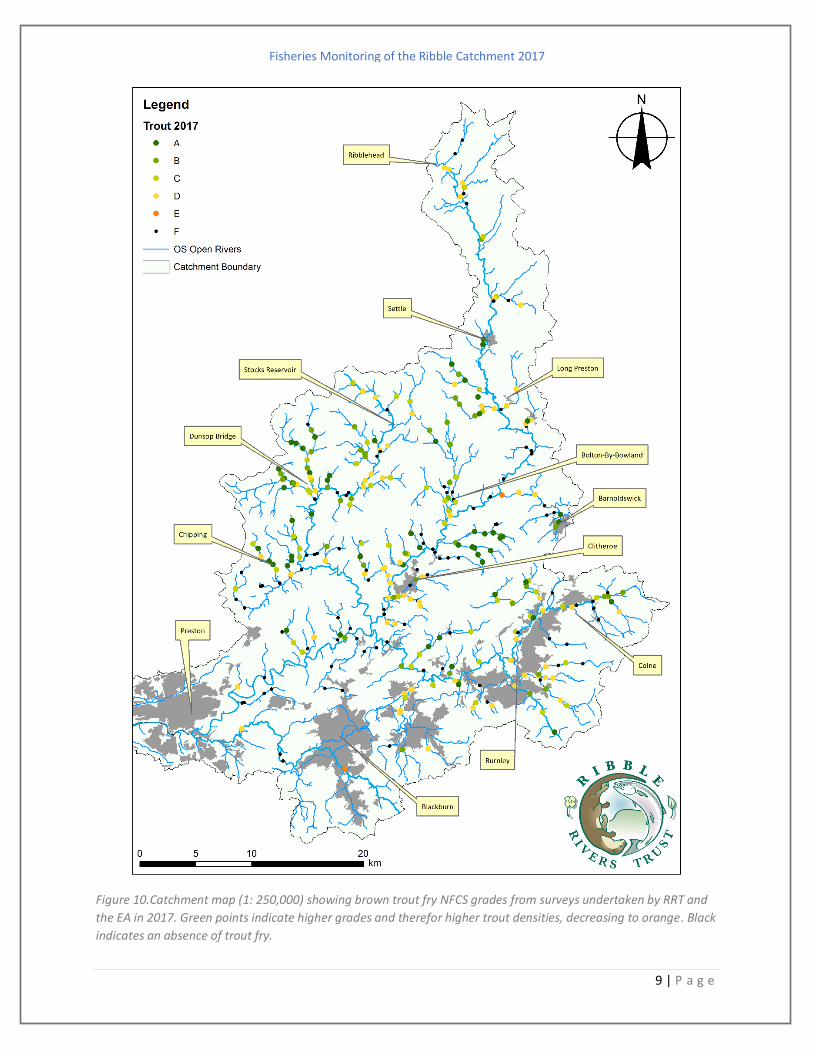
Figure 10.Catchment map (1: 250,000) showing brown trout fry NFCS grades from surveys undertaken by RRT and
the EA in 2017. Green points indicate higher grades and therefor higher trout densities, decreasing to orange. Black
indicates an absence of trout fry.
Fisheries Monitoring of the Ribble Catchment 2017
10 | P a g e
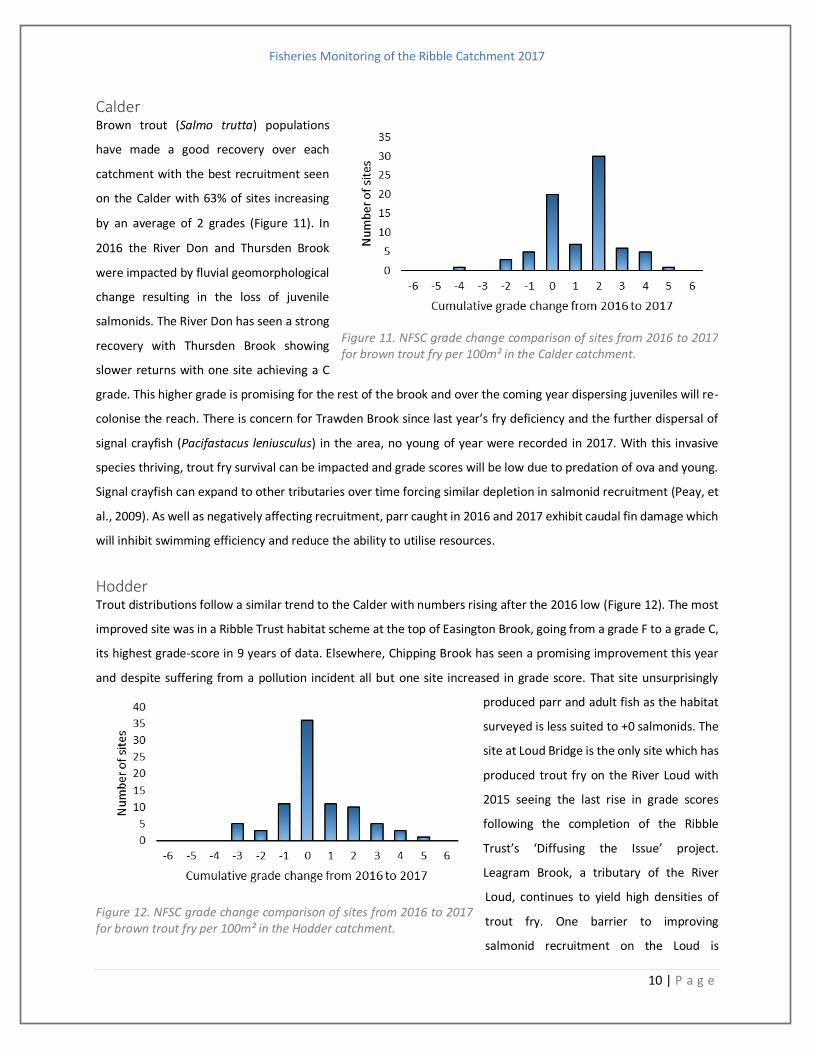
Calder Brown trout (Salmo trutta) populations
have made a good recovery over each
catchment with the best recruitment seen
on the Calder with 63% of sites increasing
by an average of 2 grades (Figure 11). In
2016 the River Don and Thursden Brook
were impacted by fluvial geomorphological
change resulting in the loss of juvenile
salmonids. The River Don has seen a strong
recovery with Thursden Brook showing
slower returns with one site achieving a C
grade. This higher grade is promising for the rest of the brook and over the coming year dispersing juveniles will re-
colonise the reach. There is concern for Trawden Brook since last year’s fry deficiency and the further dispersal of
signal crayfish (Pacifastacus leniusculus) in the area, no young of year were recorded in 2017. With this invasive
species thriving, trout fry survival can be impacted and grade scores will be low due to predation of ova and young.
Signal crayfish can expand to other tributaries over time forcing similar depletion in salmonid recruitment (Peay, et
al., 2009). As well as negatively affecting recruitment, parr caught in 2016 and 2017 exhibit caudal fin damage which
will inhibit swimming efficiency and reduce the ability to utilise resources.
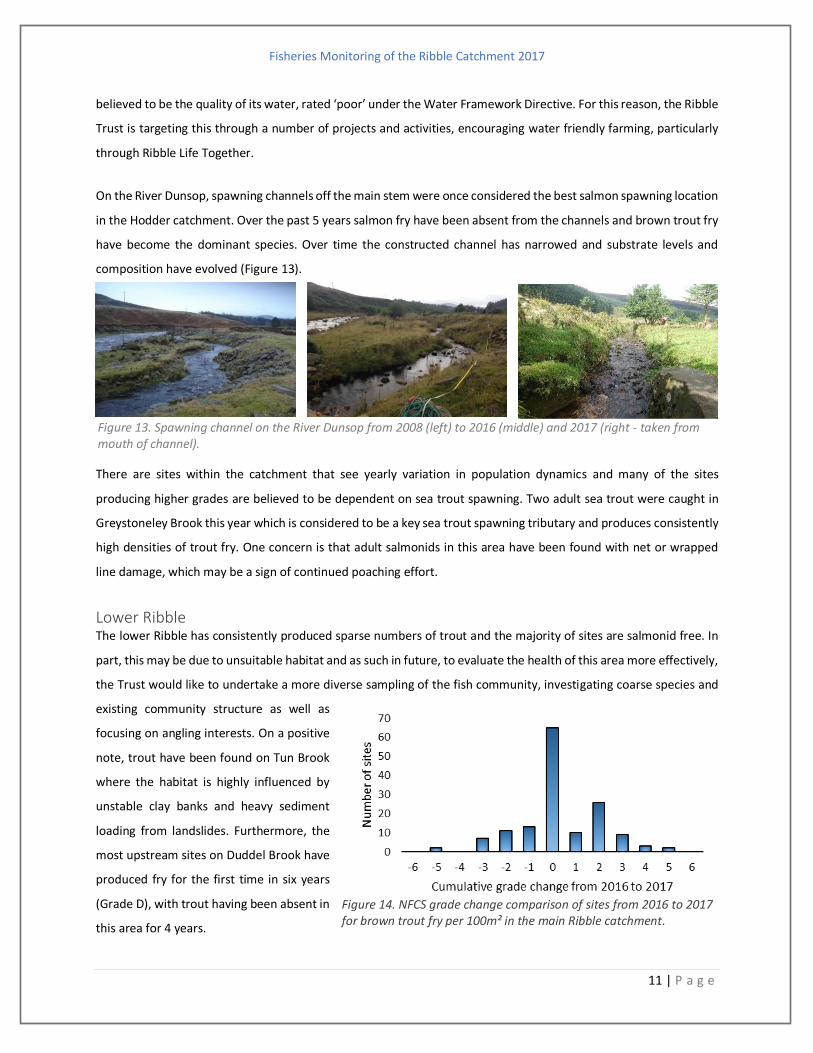
Hodder Trout distributions follow a similar trend to the Calder with numbers rising after the 2016 low (Figure 12). The most
improved site was in a Ribble Trust habitat scheme at the top of Easington Brook, going from a grade F to a grade C,
its highest grade-score in 9 years of data. Elsewhere, Chipping Brook has seen a promising improvement this year
and despite suffering from a pollution incident all but one site increased in grade score. That site unsurprisingly
produced parr and adult fish as the habitat
surveyed is less suited to +0 salmonids. The
site at Loud Bridge is the only site which has
produced trout fry on the River Loud with
2015 seeing the last rise in grade scores
following the completion of the Ribble
Trust’s ‘Diffusing the Issue’ project.
Leagram Brook, a tributary of the River
Loud, continues to yield high densities of
trout fry. One barrier to improving
salmonid recruitment on the Loud is
Figure 11. NFSC grade change comparison of sites from 2016 to 2017 for brown trout fry per 100m² in the Calder catchment.
Figure 12. NFSC grade change comparison of sites from 2016 to 2017 for brown trout fry per 100m² in the Hodder catchment.
Fisheries Monitoring of the Ribble Catchment 2017
11 | P a g e
believed to be the quality of its water, rated ‘poor’ under the Water Framework Directive. For this reason, the Ribble
Trust is targeting this through a number of projects and activities, encouraging water friendly farming, particularly
through Ribble Life Together.
On the River Dunsop, spawning channels off the main stem were once considered the best salmon spawning location
in the Hodder catchment. Over the past 5 years salmon fry have been absent from the channels and brown trout fry
have become the dominant species. Over time the constructed channel has narrowed and substrate levels and
composition have evolved (Figure 13).
There are sites within the catchment that see yearly variation in population dynamics and many of the sites
producing higher grades are believed to be dependent on sea trout spawning. Two adult sea trout were caught in
Greystoneley Brook this year which is considered to be a key sea trout spawning tributary and produces consistently
high densities of trout fry. One concern is that adult salmonids in this area have been found with net or wrapped
line damage, which may be a sign of continued poaching effort.
Lower Ribble The lower Ribble has consistently produced sparse numbers of trout and the majority of sites are salmonid free. In
part, this may be due to unsuitable habitat and as such in future, to evaluate the health of this area more effectively,
the Trust would like to undertake a more diverse sampling of the fish community, investigating coarse species and
existing community structure as well as
focusing on angling interests. On a positive
note, trout have been found on Tun Brook
where the habitat is highly influenced by
unstable clay banks and heavy sediment
loading from landslides. Furthermore, the
most upstream sites on Duddel Brook have
produced fry for the first time in six years
(Grade D), with trout having been absent in
this area for 4 years.
Figure 13. Spawning channel on the River Dunsop from 2008 (left) to 2016 (middle) and 2017 (right - taken from mouth of channel).
Figure 14. NFCS grade change comparison of sites from 2016 to 2017 for brown trout fry per 100m² in the main Ribble catchment.
Fisheries Monitoring of the Ribble Catchment 2017
12 | P a g e
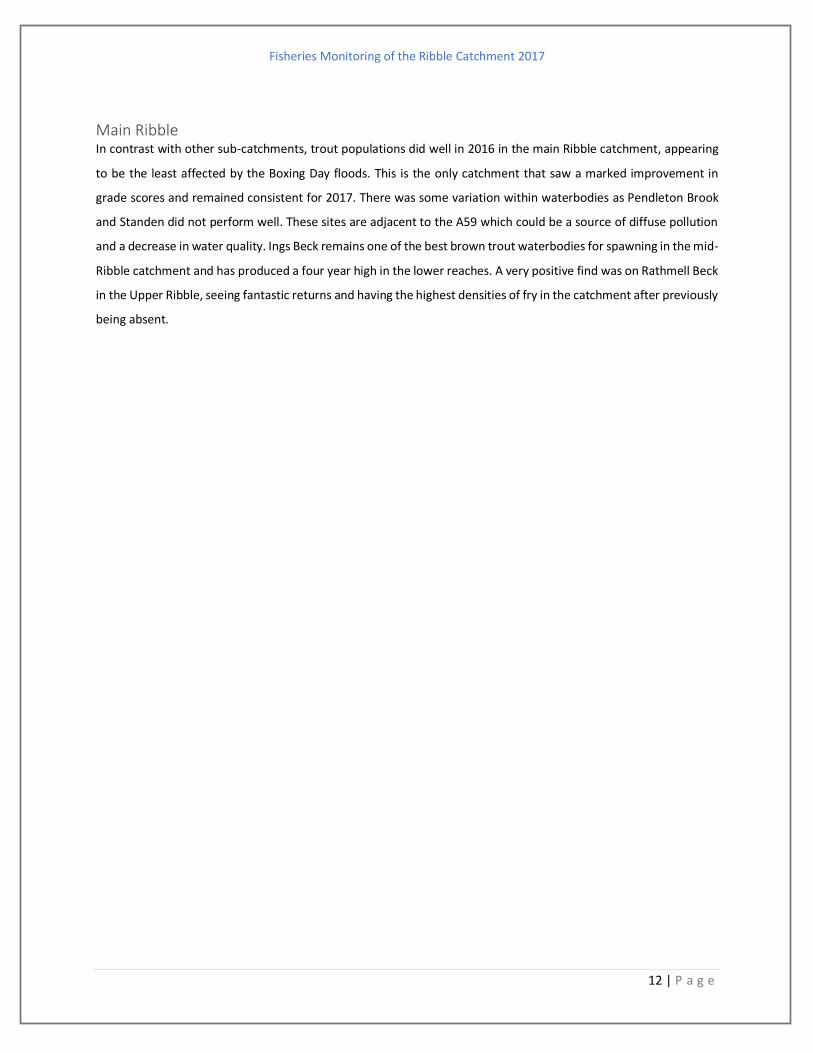
Main Ribble In contrast with other sub-catchments, trout populations did well in 2016 in the main Ribble catchment, appearing
to be the least affected by the Boxing Day floods. This is the only catchment that saw a marked improvement in
grade scores and remained consistent for 2017. There was some variation within waterbodies as Pendleton Brook
and Standen did not perform well. These sites are adjacent to the A59 which could be a source of diffuse pollution
and a decrease in water quality. Ings Beck remains one of the best brown trout waterbodies for spawning in the mid-
Ribble catchment and has produced a four year high in the lower reaches. A very positive find was on Rathmell Beck
in the Upper Ribble, seeing fantastic returns and having the highest densities of fry in the catchment after previously
being absent.

Fisheries Monitoring of the Ribble Catchment 2017
13 | P a g e
Salmon Atlantic salmon (Salmo salar) have seen the best fry densities on the main Ribble catchment in the past 3 years with
18% of sites increasing in their grade score. However, overall populations continue to decline (Figure 15) with a total
of 469 fry and parr captured over 87/326 electrofishing sites in 2017. This is approximately a third of 2012’s
maximum abundance where a total of 1533 individuals were processed. The Calder catchment saw minimal
improvements where three individuals
were caught after the previous year’s total
absence. The Hodder, once considered the
best spawning habitat on the Ribble,
continues to decline after last year’s rise in
fry numbers. This rise could be a buffered
outcome of salmon returns from 2012’s
population high. There has been very little
shift over the past 3 years in the number of
sites showing an absence of salmon. In
2017, 69% of sites were designated F-grade
with less than 10% of sites receiving a fair to
excellent rating (Figure 16). There are
considerations when looking at the number
of F-grade salmon sites in the Ribble
catchment. A sizable proportion of
returning Atlantic salmon are considered to
spawn on the main stem rivers where
locations are not suitable for backpack
electrofishing analysis, therefore, the
majority of Ribble Trust sites are located on
smaller tributaries. There are limitations to where salmon will spawn; depth, water velocity and substrate
composition are considered the most important contributing factors to site selection (Louhi, et al., 2008). In
comparison to brown trout, salmon have more sensitive ova requirements and consequently demand higher water
quality for development, with good dissolved oxygen concentrations and low sediment loading. Sites that have a
historical absence of salmon may persist as they are naturally inaccessible to migration and the morphology of
smaller tributaries may only permit the migration of large adults in ideal flows. Waterbodies that have the potential
to sustain salmon ova and fry development are identified through the fisheries programme and are targeted by
projects to reinstate migration routes as well as improving spawning habitat and water quality.
Figure 15. Cumulative Atlantic salmon grade of sub-catchments of the Ribble 2010 to 2017.
Figure 16. Frequency comparison of Atlantic salmon NFCS grades in the Ribble catchment 2015 to 2017.
Fisheries Monitoring of the Ribble Catchment 2017
14 | P a g e
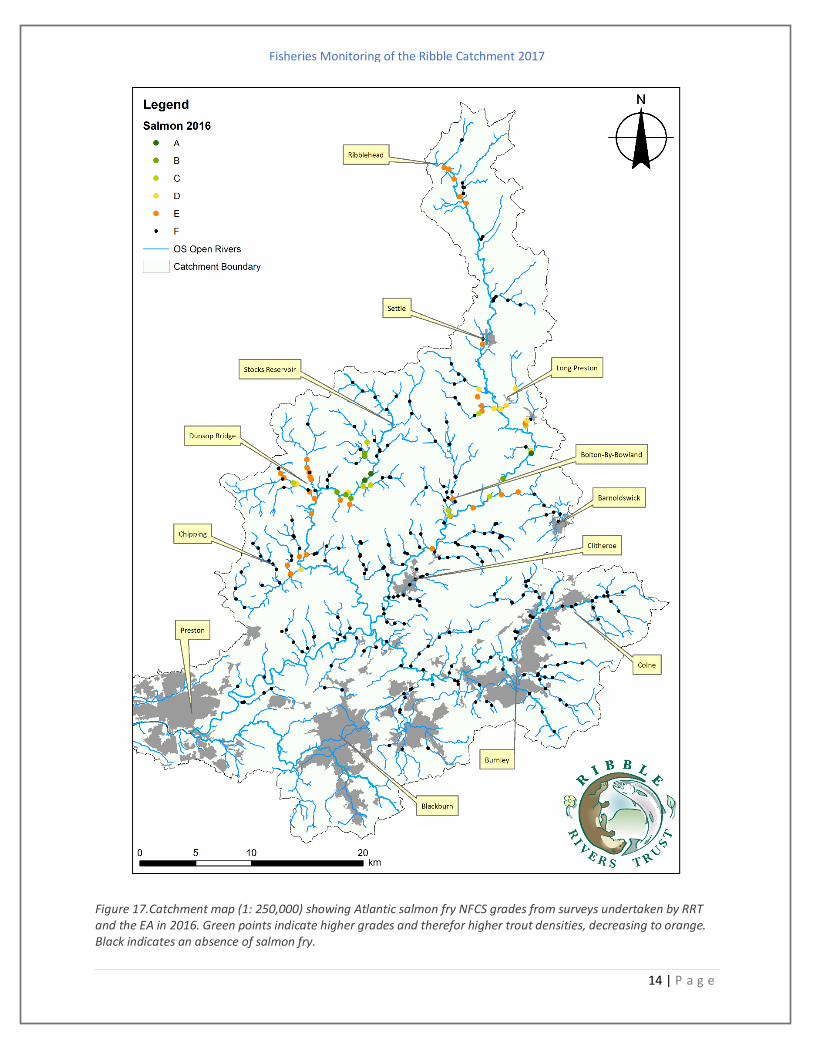
Figure 17.Catchment map (1: 250,000) showing Atlantic salmon fry NFCS grades from surveys undertaken by RRT and the EA in 2016. Green points indicate higher grades and therefor higher trout densities, decreasing to orange. Black indicates an absence of salmon fry.
Fisheries Monitoring of the Ribble Catchment 2017
15 | P a g e
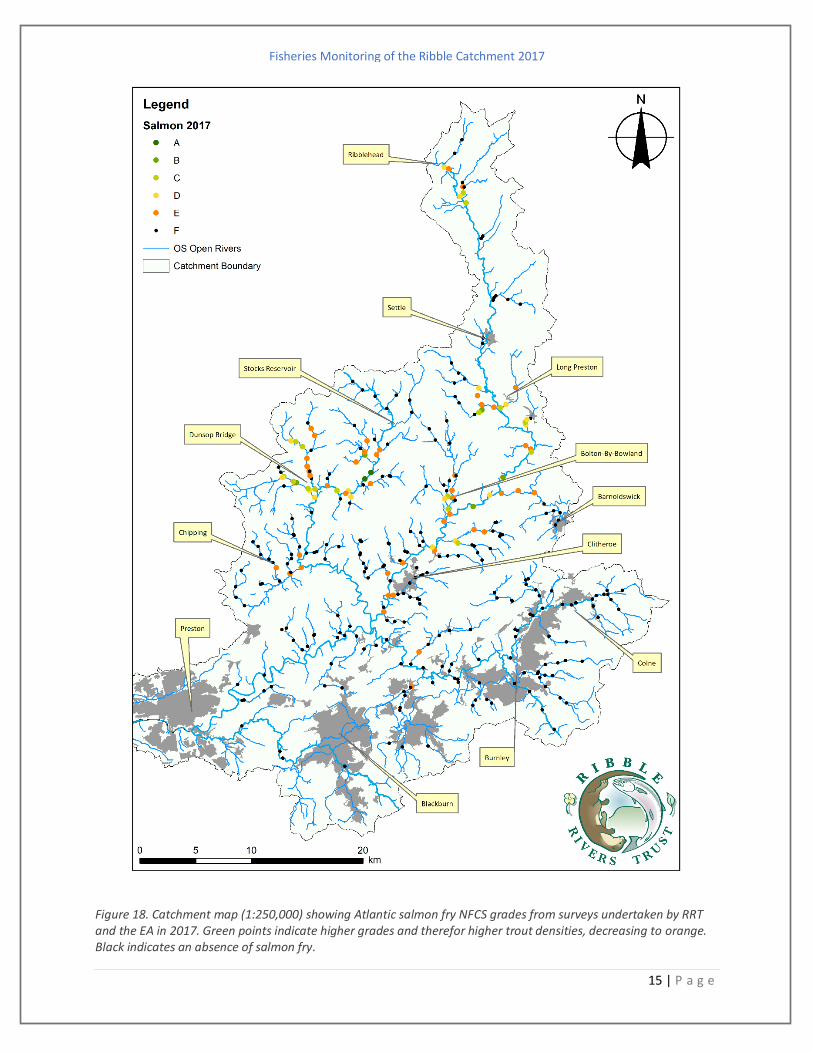
Figure 18. Catchment map (1:250,000) showing Atlantic salmon fry NFCS grades from surveys undertaken by RRT and the EA in 2017. Green points indicate higher grades and therefor higher trout densities, decreasing to orange. Black indicates an absence of salmon fry.
Fisheries Monitoring of the Ribble Catchment 2017
16 | P a g e
Calder Salmon within the Calder catchment were
absent in 2016 and fry returns are minimal
for 2017 (Figure 19). Sabden Brook was
historically considered one of the most
important tributaries for salmon spawning
in the catchment from Ribble Trust surveys,
but this year only a single fry was identified
on the lower reaches of the brook. With the
installation of the fish pass at Sabden Weir
in May 2017, 14km of river has been
reconnected and hopes are high for salmon
to return during this year’s migration. During the monitoring of the easement a sea trout was captured above the
newly constructed fish pass during a mark-recapture exercise. This study has shown fish movements both upstream
and downstream of the easement. Salmon fry have also been found on the River Hyndburn with two individuals
being caught during the electrofishing season. Several fry were also caught as part of an engagement day with
Burnley College downstream of Oakenshaw Weir (Figure 20). With the construction of the bypass channel in October
2017 the Trust is hoping to observe salmon fry above this structure in 2018 and potential spawning sites will be
identified before survey work begins.
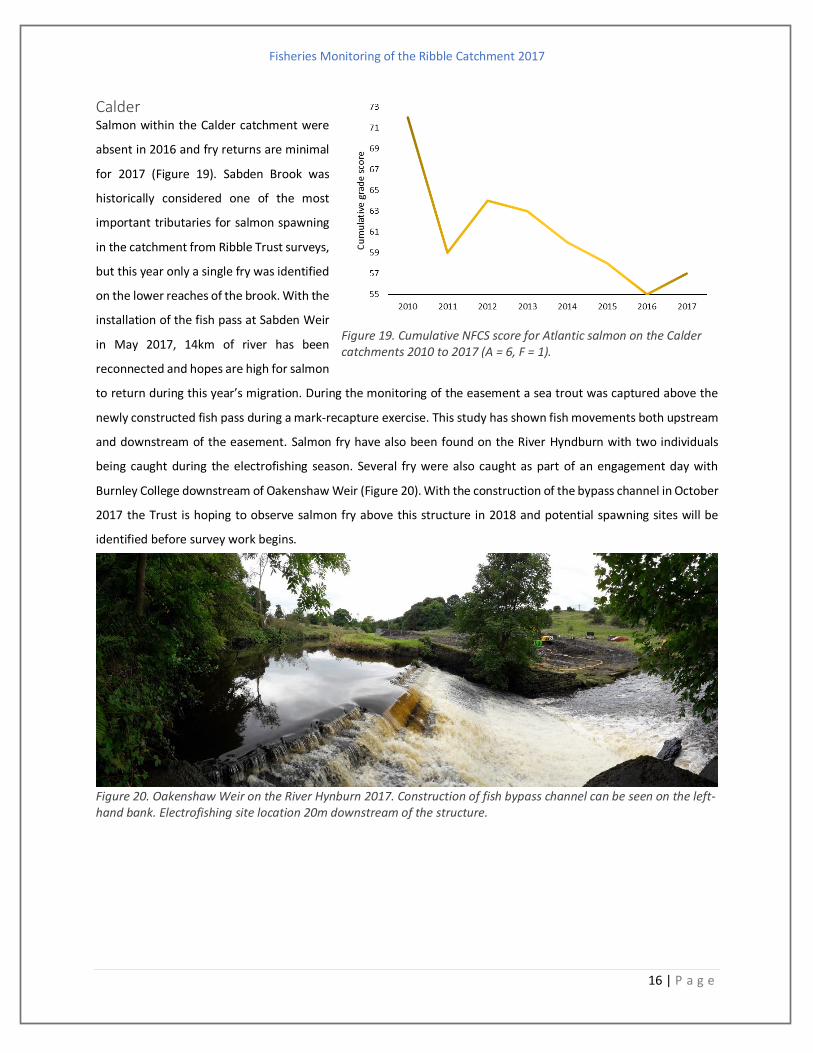
Figure 19. Cumulative NFCS score for Atlantic salmon on the Calder catchments 2010 to 2017 (A = 6, F = 1).
Figure 20. Oakenshaw Weir on the River Hynburn 2017. Construction of fish bypass channel can be seen on the left-hand bank. Electrofishing site location 20m downstream of the structure.
Fisheries Monitoring of the Ribble Catchment 2017
17 | P a g e
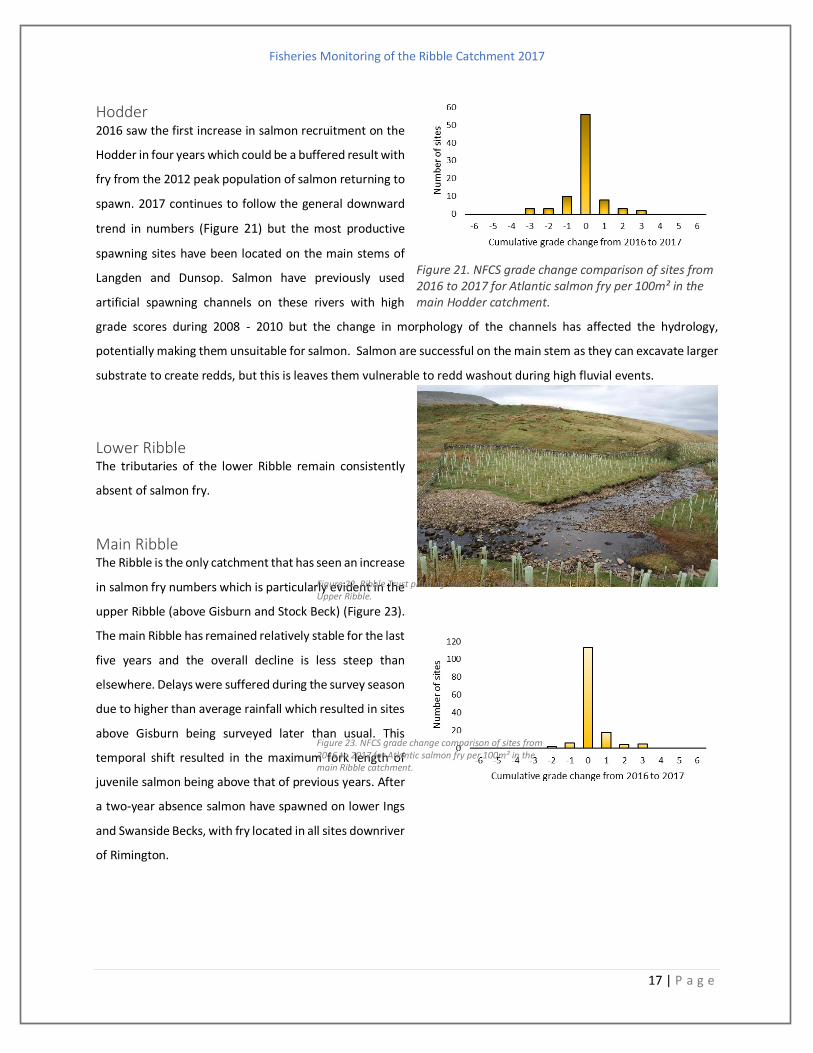
Hodder 2016 saw the first increase in salmon recruitment on the
Hodder in four years which could be a buffered result with
fry from the 2012 peak population of salmon returning to
spawn. 2017 continues to follow the general downward
trend in numbers (Figure 21) but the most productive
spawning sites have been located on the main stems of
Langden and Dunsop. Salmon have previously used
artificial spawning channels on these rivers with high
grade scores during 2008 - 2010 but the change in morphology of the channels has affected the hydrology,
potentially making them unsuitable for salmon. Salmon are successful on the main stem as they can excavate larger
substrate to create redds, but this is leaves them vulnerable to redd washout during high fluvial events.
Lower Ribble The tributaries of the lower Ribble remain consistently
absent of salmon fry.
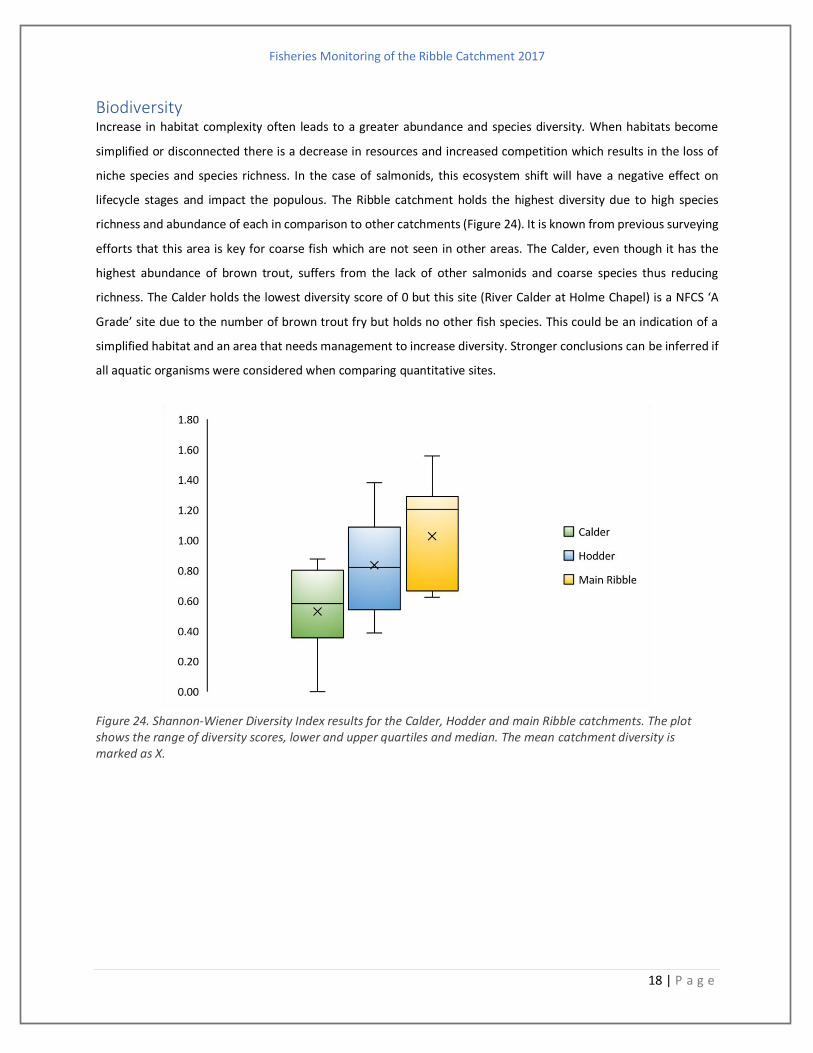
Main Ribble The Ribble is the only catchment that has seen an increase
in salmon fry numbers which is particularly evident in the
upper Ribble (above Gisburn and Stock Beck) (Figure 23).
The main Ribble has remained relatively stable for the last
five years and the overall decline is less steep than
elsewhere. Delays were suffered during the survey season
due to higher than average rainfall which resulted in sites
above Gisburn being surveyed later than usual. This
temporal shift resulted in the maximum fork length of
juvenile salmon being above that of previous years. After
a two-year absence salmon have spawned on lower Ings
and Swanside Becks, with fry located in all sites downriver
of Rimington.
Figure 21. NFCS grade change comparison of sites from 2016 to 2017 for Atlantic salmon fry per 100m² in the main Hodder catchment.
Figure 22. Ribble Trust planting scheme on Cam Beck - Upper Ribble.
Figure 23. NFCS grade change comparison of sites from 2016 to 2017 for Atlantic salmon fry per 100m² in the main Ribble catchment.
Fisheries Monitoring of the Ribble Catchment 2017
18 | P a g e
Biodiversity Increase in habitat complexity often leads to a greater abundance and species diversity. When habitats become
simplified or disconnected there is a decrease in resources and increased competition which results in the loss of
niche species and species richness. In the case of salmonids, this ecosystem shift will have a negative effect on
lifecycle stages and impact the populous. The Ribble catchment holds the highest diversity due to high species
richness and abundance of each in comparison to other catchments (Figure 24). It is known from previous surveying
efforts that this area is key for coarse fish which are not seen in other areas. The Calder, even though it has the
highest abundance of brown trout, suffers from the lack of other salmonids and coarse species thus reducing
richness. The Calder holds the lowest diversity score of 0 but this site (River Calder at Holme Chapel) is a NFCS ‘A
Grade’ site due to the number of brown trout fry but holds no other fish species. This could be an indication of a
simplified habitat and an area that needs management to increase diversity. Stronger conclusions can be inferred if
all aquatic organisms were considered when comparing quantitative sites.
Figure 24. Shannon-Wiener Diversity Index results for the Calder, Hodder and main Ribble catchments. The plot shows the range of diversity scores, lower and upper quartiles and median. The mean catchment diversity is marked as X.

Fisheries Monitoring of the Ribble Catchment 2017
19 | P a g e
Other Species
Bycatch Bullheads (Cottus gobio) and Stone loach (Barbatula barbatula) remain the dominant species in the catchment
(Figure 25) with 80% of sites containing bullheads and 50% stone loach. Yearly records of minnow (Phoxinus
phoxinus) are variable depending on conditions but also habitat type. If sites contain a pool feature a greater number
of minnows are likely to be detected, as the species is less abundant in faster flows and large numbers can be caught
due to their shoaling behavior. Numbers of chub (Squalius
cephalus), gudgeon (Gobio gobio) and grayling (Thymallus
thymallus) were down from 2016 (Figure 26) but were
present in key areas around Long Preston Deeps and
surrounding tributaries; Wigglesworth Beck, Rathmell,
Long Preston and Hellifield highlight the Deeps as an
important rearing site for coarse fish likely due to
morphology. 2016’s “year of the grayling” has not seen a
repeat trend, but on Colne water catch-return data shows
a good head of grayling moving into the area. This is a
fantastic indicator that the fish easements are optimised
for fish passage as grayling do not have the burst capacity for swimming against fast flows in comparison to other
salmonids, and their response to flow patterns will determine their success in traversing barriers or utilising fishways
(Lucas & Bubb, 2005). Also, Chipping Brook has seen grayling move up from the River Loud.
River lamprey have been recorded for the first time by the Trust at Cuerdale, bringing the total number of Annex II
fish species within the catchment to 6 (eel, brook lamprey, sea lamprey, Atlantic salmon and bullhead). Investigation
into this finding could allow for
the application for the
designation of ‘special area of
conservation’ (SAC) in the
lower reaches of the
catchment. The EA have also
located river lamprey in the
estuary in 2010 and 2013 as
part of otter trawling surveys.
Another species to note at
Cuerdale was a juvenile
barbel (barbus barbus) found
in the tidal limit of the Ribble.
0
5
10
15
20
25
30
2015 2016 2017
0
5
10
15
20
25
30
Bullhead Stoneloach Minnow
2015 2016 2017
Figure 25. The average abundance of dominant bycatch species per site 2015 to 2017.
Figure 26. The average abundance of accompanying bycatch species per site 2015 to 2017.
Fisheries Monitoring of the Ribble Catchment 2017
20 | P a g e
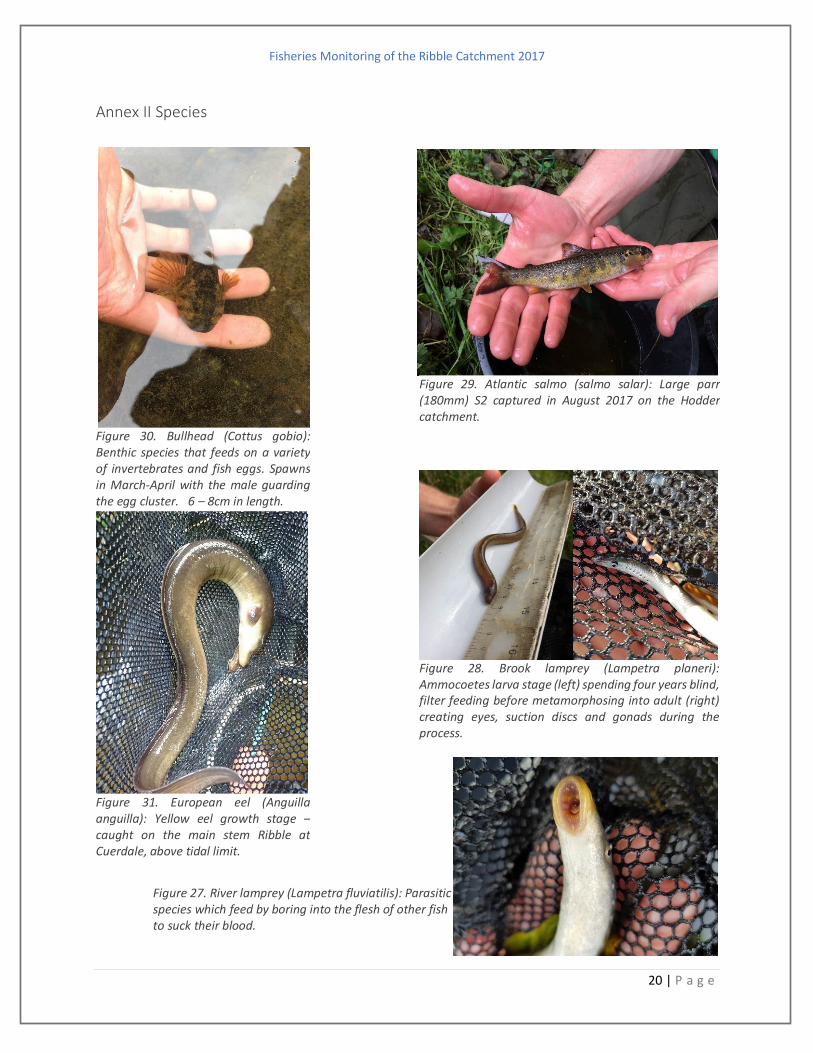
Annex II Species
Figure 28. Brook lamprey (Lampetra planeri): Ammocoetes larva stage (left) spending four years blind, filter feeding before metamorphosing into adult (right) creating eyes, suction discs and gonads during the process.
Figure 31. European eel (Anguilla anguilla): Yellow eel growth stage – caught on the main stem Ribble at Cuerdale, above tidal limit.
Figure 29. Atlantic salmo (salmo salar): Large parr (180mm) S2 captured in August 2017 on the Hodder catchment.
Figure 27. River lamprey (Lampetra fluviatilis): Parasitic species which feed by boring into the flesh of other fish to suck their blood.
Figure 30. Bullhead (Cottus gobio): Benthic species that feeds on a variety of invertebrates and fish eggs. Spawns in March-April with the male guarding the egg cluster. 6 – 8cm in length.
Fisheries Monitoring of the Ribble Catchment 2017
21 | P a g e
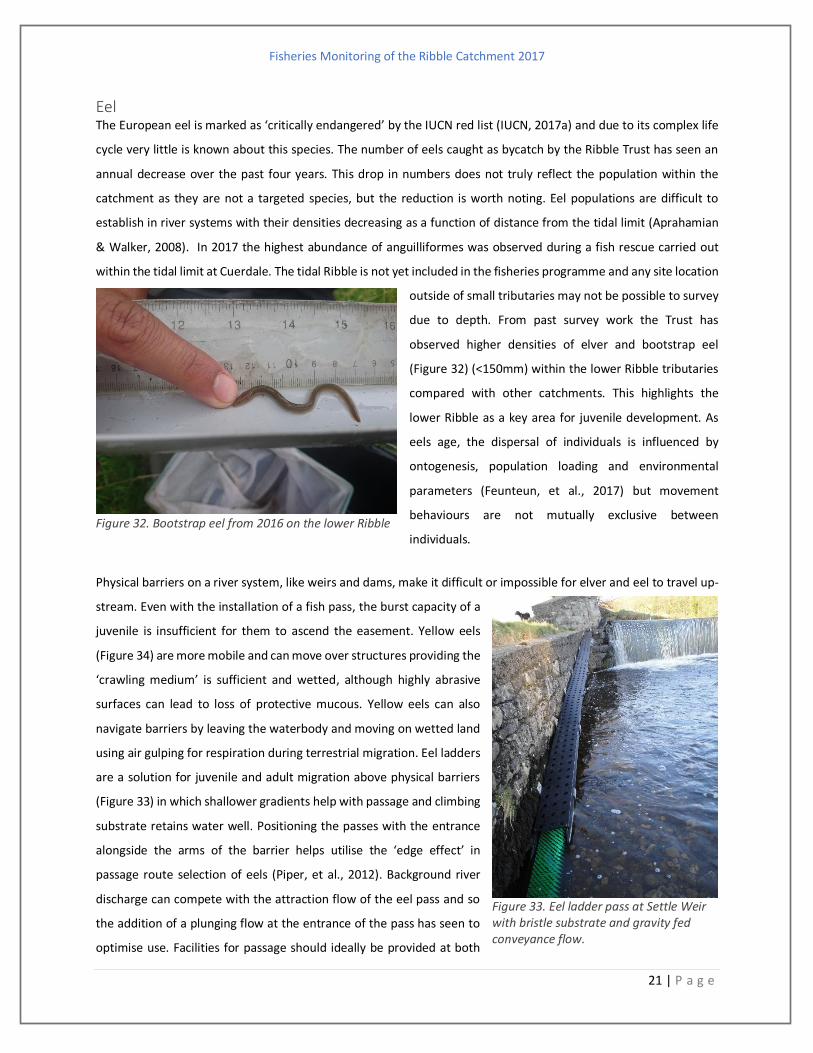
Eel The European eel is marked as ‘critically endangered’ by the IUCN red list (IUCN, 2017a) and due to its complex life
cycle very little is known about this species. The number of eels caught as bycatch by the Ribble Trust has seen an
annual decrease over the past four years. This drop in numbers does not truly reflect the population within the
catchment as they are not a targeted species, but the reduction is worth noting. Eel populations are difficult to
establish in river systems with their densities decreasing as a function of distance from the tidal limit (Aprahamian
& Walker, 2008). In 2017 the highest abundance of anguilliformes was observed during a fish rescue carried out
within the tidal limit at Cuerdale. The tidal Ribble is not yet included in the fisheries programme and any site location
outside of small tributaries may not be possible to survey
due to depth. From past survey work the Trust has
observed higher densities of elver and bootstrap eel
(Figure 32) (<150mm) within the lower Ribble tributaries
compared with other catchments. This highlights the
lower Ribble as a key area for juvenile development. As
eels age, the dispersal of individuals is influenced by
ontogenesis, population loading and environmental
parameters (Feunteun, et al., 2017) but movement
behaviours are not mutually exclusive between
individuals.
Physical barriers on a river system, like weirs and dams, make it difficult or impossible for elver and eel to travel up-
stream. Even with the installation of a fish pass, the burst capacity of a
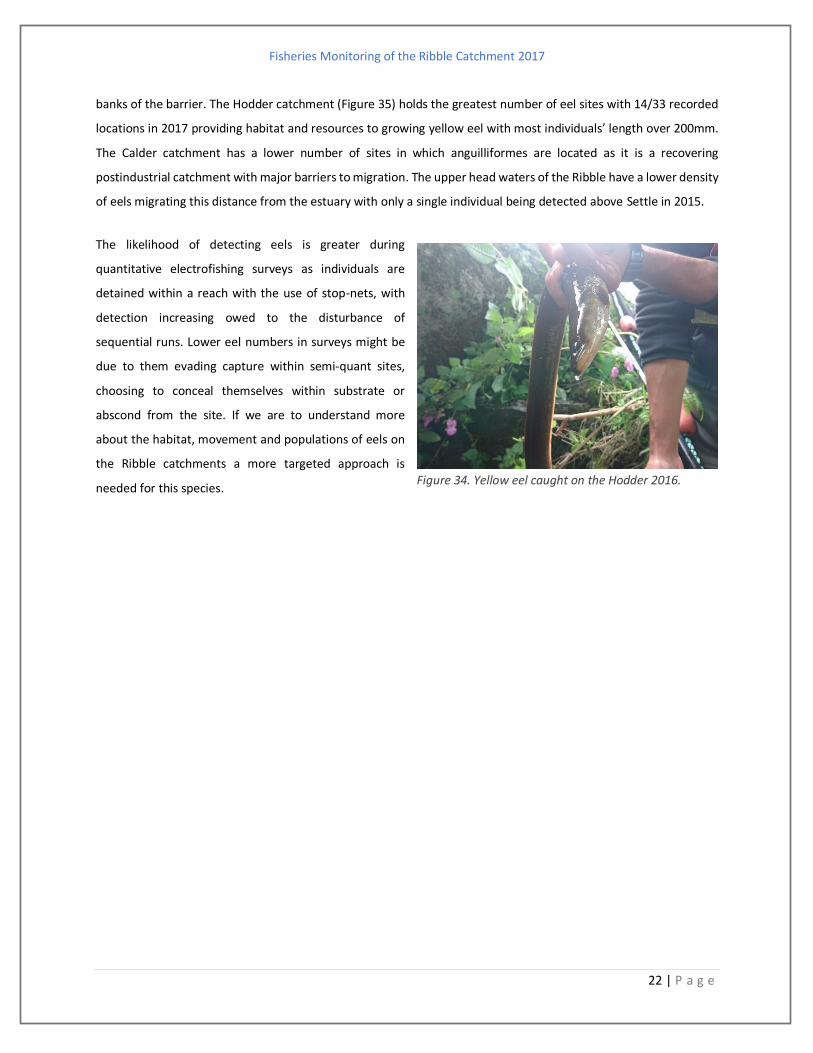
juvenile is insufficient for them to ascend the easement. Yellow eels
(Figure 34) are more mobile and can move over structures providing the
‘crawling medium’ is sufficient and wetted, although highly abrasive
surfaces can lead to loss of protective mucous. Yellow eels can also
navigate barriers by leaving the waterbody and moving on wetted land
using air gulping for respiration during terrestrial migration. Eel ladders
are a solution for juvenile and adult migration above physical barriers
(Figure 33) in which shallower gradients help with passage and climbing
substrate retains water well. Positioning the passes with the entrance
alongside the arms of the barrier helps utilise the ‘edge effect’ in
passage route selection of eels (Piper, et al., 2012). Background river
discharge can compete with the attraction flow of the eel pass and so
the addition of a plunging flow at the entrance of the pass has seen to
optimise use. Facilities for passage should ideally be provided at both
Figure 33. Eel ladder pass at Settle Weir with bristle substrate and gravity fed conveyance flow.
Figure 32. Bootstrap eel from 2016 on the lower Ribble
Fisheries Monitoring of the Ribble Catchment 2017
22 | P a g e
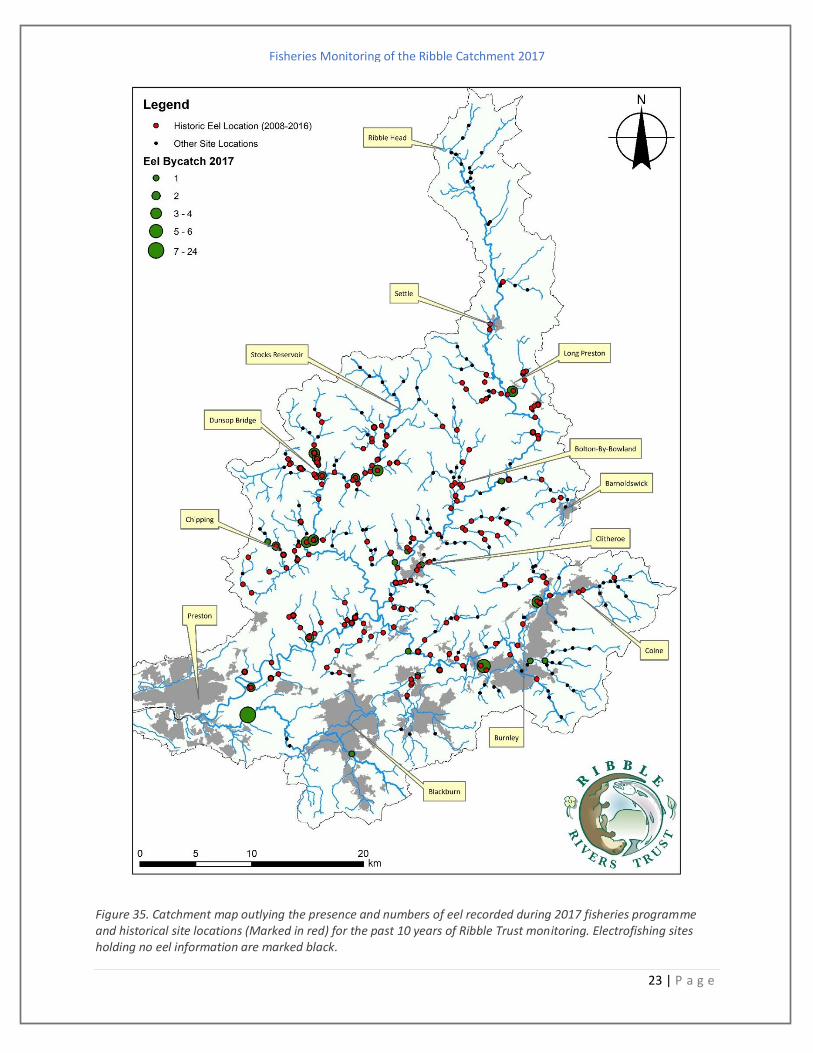
banks of the barrier. The Hodder catchment (Figure 35) holds the greatest number of eel sites with 14/33 recorded
locations in 2017 providing habitat and resources to growing yellow eel with most individuals’ length over 200mm.
The Calder catchment has a lower number of sites in which anguilliformes are located as it is a recovering
postindustrial catchment with major barriers to migration. The upper head waters of the Ribble have a lower density
of eels migrating this distance from the estuary with only a single individual being detected above Settle in 2015.
The likelihood of detecting eels is greater during
quantitative electrofishing surveys as individuals are
detained within a reach with the use of stop-nets, with
detection increasing owed to the disturbance of
sequential runs. Lower eel numbers in surveys might be
due to them evading capture within semi-quant sites,
choosing to conceal themselves within substrate or
abscond from the site. If we are to understand more
about the habitat, movement and populations of eels on
the Ribble catchments a more targeted approach is
needed for this species. Figure 34. Yellow eel caught on the Hodder 2016.
Fisheries Monitoring of the Ribble Catchment 2017
23 | P a g e
Figure 35. Catchment map outlying the presence and numbers of eel recorded during 2017 fisheries programme and historical site locations (Marked in red) for the past 10 years of Ribble Trust monitoring. Electrofishing sites holding no eel information are marked black.
Fisheries Monitoring of the Ribble Catchment 2017
24 | P a g e
Crayfish The white-clawed crayfish (Austropotamobius pallipes) has seen a national decline over the past 10 years with losses
between 50-80% (IUCN, 2017b). Localised extinction can be attributed to the introduction of American signal crayfish
(Pacifastacus leniusculus) as they are vectors for the fungal disease Aphanomyces astaci. The Ribble Trust gains
insight into the distribution of crayfish through the fisheries programme as these species are an unavoidable bycatch
of electrofishing. However, this is by no-means and exhaustive method that will allow inferences on the population.
With this in mind, the number of sites where white-clawed crayfish were found to be present is at a five-year low
(Figure 26). Water contaminants and loss of refuge can be contributing factor (Rosewarne , et al., 2017) but changes
have been observed in areas where American signal crayfish are present. From the locations monitored by the Ribble
Trust, the abundance and overall distribution of signal crayfish is unknown and the ability to detect this species
where numbers are low remains problematic. Observations from 2016 have seen the continued dispersal of signal
crayfish within Long Preston Beck. In the long term this downstream movement will result in signals residing in the
main stem Ribble and consequently increasing the difficulties of control and putting them in close proximity to a
designated Site of Special Scientific Interest (SSSI). EA surveys on the Calder located a single large male signal crayfish
in 2011 downstream of Burnley, but non-since. Also on the Calder, illegal introductions of signal crayfish are
considered to be impacting salmonid recruitment in Trawden Brook. Musseau, et al. (2014) has shown that
introductions of European eel can be used as a biocontrol to reduce population growth and distribution rates. The
advantage of encouraging eels into the area is that there is limited competition with salmonids and piscivorous
predation is only more common in individuals over 400mm. With the number of structures on the Calder restricting
the upstream (and downstream) migration of eels it is seen as a limiting factor to the population size in the
catchment. This increases the importance of habitat connectivity in the Calder, but also the wider Ribble Catchment.
Fisheries Monitoring of the Ribble Catchment 2017
25 | P a g e
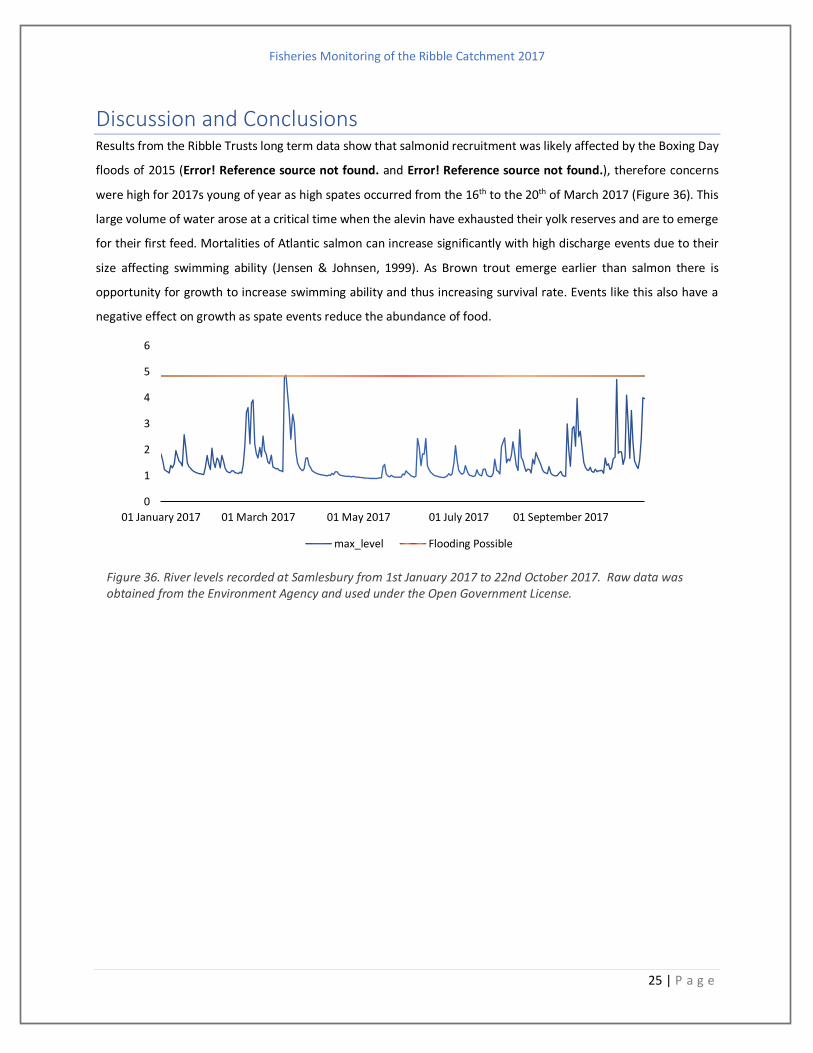
Discussion and Conclusions Results from the Ribble Trusts long term data show that salmonid recruitment was likely affected by the Boxing Day
floods of 2015 (Error! Reference source not found. and Error! Reference source not found.), therefore concerns
were high for 2017s young of year as high spates occurred from the 16th to the 20th of March 2017 (Figure 36). This
large volume of water arose at a critical time when the alevin have exhausted their yolk reserves and are to emerge
for their first feed. Mortalities of Atlantic salmon can increase significantly with high discharge events due to their
size affecting swimming ability (Jensen & Johnsen, 1999). As Brown trout emerge earlier than salmon there is
opportunity for growth to increase swimming ability and thus increasing survival rate. Events like this also have a
negative effect on growth as spate events reduce the abundance of food.
0
1
2
3
4
5
6
01 January 2017 01 March 2017 01 May 2017 01 July 2017 01 September 2017
max_level Flooding Possible
Figure 36. River levels recorded at Samlesbury from 1st January 2017 to 22nd October 2017. Raw data was obtained from the Environment Agency and used under the Open Government License.
Fisheries Monitoring of the Ribble Catchment 2017
26 | P a g e
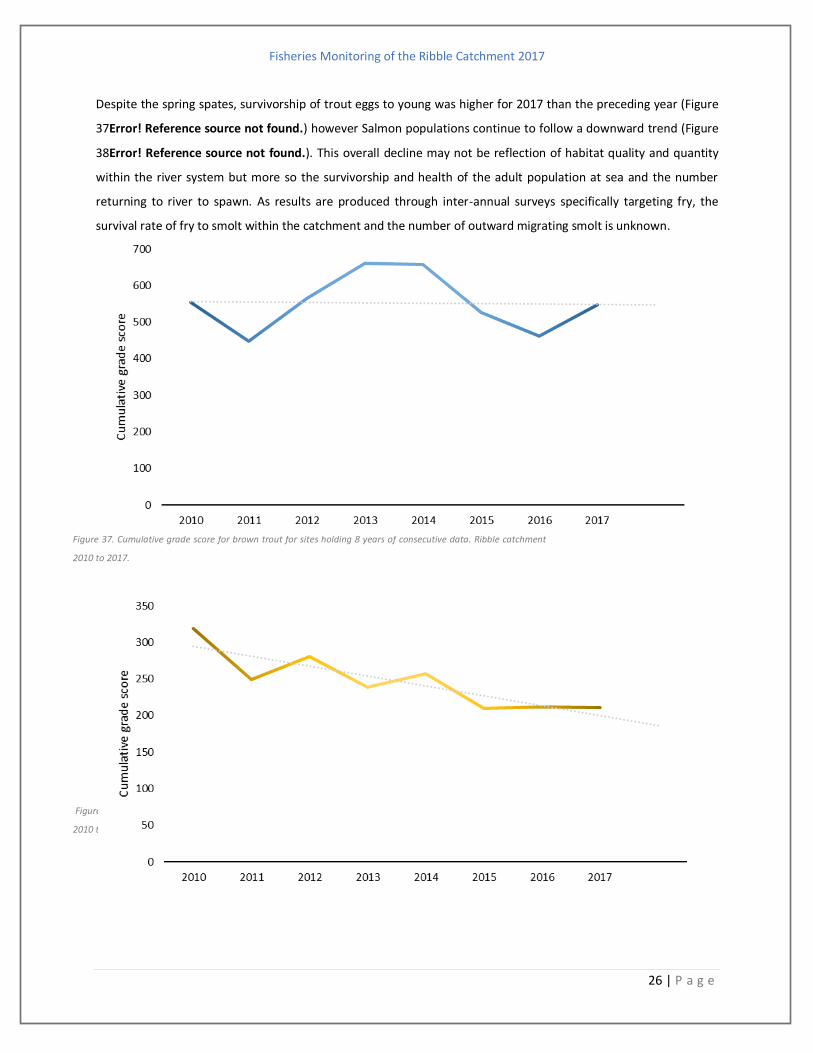
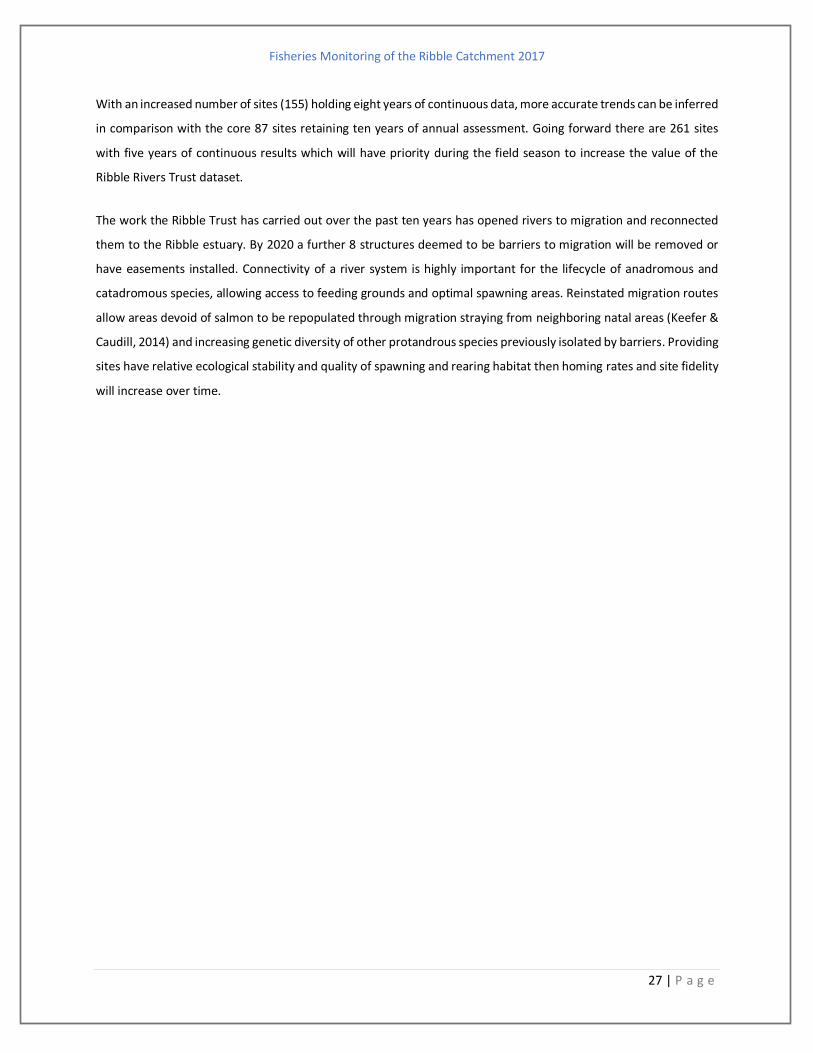
Despite the spring spates, survivorship of trout eggs to young was higher for 2017 than the preceding year (Figure
37Error! Reference source not found.) however Salmon populations continue to follow a downward trend (Figure
38Error! Reference source not found.). This overall decline may not be reflection of habitat quality and quantity
within the river system but more so the survivorship and health of the adult population at sea and the number
returning to river to spawn. As results are produced through inter-annual surveys specifically targeting fry, the
survival rate of fry to smolt within the catchment and the number of outward migrating smolt is unknown.
Figure 37. Cumulative grade score for brown trout for sites holding 8 years of consecutive data. Ribble catchment
2010 to 2017.
Figure 38. Cumulative grade score for Atlantic salmon for sites holding 8 years of consecutive data. Ribble catchment
2010 to 2017.
Fisheries Monitoring of the Ribble Catchment 2017
27 | P a g e
With an increased number of sites (155) holding eight years of continuous data, more accurate trends can be inferred
in comparison with the core 87 sites retaining ten years of annual assessment. Going forward there are 261 sites
with five years of continuous results which will have priority during the field season to increase the value of the
Ribble Rivers Trust dataset.
The work the Ribble Trust has carried out over the past ten years has opened rivers to migration and reconnected
them to the Ribble estuary. By 2020 a further 8 structures deemed to be barriers to migration will be removed or
have easements installed. Connectivity of a river system is highly important for the lifecycle of anadromous and
catadromous species, allowing access to feeding grounds and optimal spawning areas. Reinstated migration routes
allow areas devoid of salmon to be repopulated through migration straying from neighboring natal areas (Keefer &
Caudill, 2014) and increasing genetic diversity of other protandrous species previously isolated by barriers. Providing
sites have relative ecological stability and quality of spawning and rearing habitat then homing rates and site fidelity
will increase over time.
Fisheries Monitoring of the Ribble Catchment 2017
28 | P a g e
Recommendations 1. Continue monitoring existing inter-annual electrofishing sites for cost/benefit monitoring purposes
of previously completed projects. Priorities must be given to sustain and extend the five-year records
of RRT fisheries data held across 261 sites (inclusive of the core ten-year sites).
2. Reduce the number of quantitative surveys to be able to focus resources on providing a wider coverage
of the catchment with the introduction of taking weights of individual salmonids and total biomass of
bycatch species to give more understanding to fish health and relationships between bycatch and
keystone species.
3. Introduce new electrofishing sites above Oakenshaw Weir to identify salmon spawning areas after
locating salmon fry below the structure and the opening of the new by-pass structure.
4. Continue to monitor the main-stem Ribble, with the possibility of increasing the number of main-stem
sites, including an efficiency evaluation of single anode backpack fishing on main stem sites.
5. Designation of areas that hold significant spawning importance and increase education efforts on
water friendly farming.
6. Continue to support the voluntary catchment and release of salmonids, encouraging anglers to aim
for a rate of at least 90%, with perhaps 100% in September and October.
7. Undertake a high-resolution study to map the distribution of American signal crayfish.
8. Reduce impacts of invasive species on native crayfish and support strategies and efforts to reduce
further movement, and prevent introductions, especially where there are impacts on a designated site
and on where there is a risk of interface with key spawning, and juvenile nursery areas.
9. Introduce invertebrate studies alongside quantitative fisheries surveys to map the aquatic biodiversity
of the catchment, and explore how this can be best used to inform future targeting of work.
10. Assessment of the lower Ribble to capture more information on coarse species populations alongside
continued salmonid monitoring.
11. Increase knowledge of eel populations and movements within the catchment. Consider possible
projects with eel in the classroom.
12. Focus on improving knowledge on salmonid smolts such as fry to smolt survival.
13. Support targeted research on river lamprey on the lower Ribble, to identify if this area would support
SAC designation and whether this should be sought.
14. Consider how we may assess sites to determine if use of the NCFS grading is an appropriate measure
of population health.
Fisheries Monitoring of the Ribble Catchment 2017
29 | P a g e
References Aprahamian, M. & Walker, A., 2008. Status of eel fisheries, stocks and their management in England and
Wales. Knowledge and Management of Aquatic Ecosystems, 7(1), pp. 390-391.
Crozier, W. W. & Kennedy, G. J. A., 1994. Application of semi-quantitative electrofishing to juvenile salmonid
stock surveys. Journal of Fish Biology, 45(1), pp. 159-164.
Environmental.data.gov.uk, 2017. Environment Agency – Catchment Data Explorer. [Online]
Available at: http://environment.data.gov.uk/catchment-planning/ManagementCatchment/3070
[Accessed 1 November 2017].
Feunteun, E. et al., 2017. A Review of Upstream Migration and Movement in Inland Waters by Anguillid Eels:
Towards a General Theory. In: K. Aida , K. Tsukamoto & K. Yamauchi , eds. Eel Biology. Tokyo: Springer, pp. 5-
14.
IUCN, 2017a. Austropotamobius pallipes (Atlantic Stream Crayfish, River Crayfish, White-clawed Crayfish).
[Online]
Available at: http://www.iucnredlist.org/details/2430/0
[Accessed 22 November 2017].
IUCN, 2017b. Anguilla Anguilla (European Eel). [Online]
Available at: http://www.iucnredlist.org/details/60344/0
[Accessed 22 November 2017].
Jensen, J. & Johnsen, B. O., 1999. The functional relationship between Spring Floods and Suvival Growth of
Juvinile Atlantic Salmon (Salmo salar) and Brown Trout (Salmo trutta). British ecology Society, 13(6), pp. 778-
785.
Keefer, M. L. & Caudill, C. C., 2014. Homing and straying by anadromouse salmonids: A review of mechanism
rates. Fisheries Biology and fisheries, 24(1), pp. 333-368.
Louhi, P., Mäki-Patäys, A. & Erkinaro, J., 2008. Spawning Habitat of Atlantic Salmon and Brown trout: General
Criteria and Intragravel Factors. River Research and Applications, Volume 27, pp. 330-339.
Lucas, M. C. & Bubb, D. H., 2005. Seasonal movements and habitat use of grayling in the UK, Bristol:
Environments Agency.
Musseau, C. et al., 2014. Native European eels as a potential biological control for invasive crayfish.
Freshwater Biology, 30(4), pp. 636-645.
Peay, S. et al., 2009. The impact of signal crayfish (Pacifastacus leniusculus) on the recruitment of salmonid
fish in a headwater stream in Yorkshire, England. Knowledge and Management of Aquatic Ecosystems, 12(1),
pp. 394-395.
Piper, A. T., Wright, R. M. & Kemp, P. S., 2012. The influence of attraction flow on upstream passage of
European eel (Anguilla anguilla) at intertidal barriers. Ecological Engineering, 44(1), pp. 329-336.
Rosewarne , P. J., Mortimer, R. J. G. & Dunn, A. M., 2017. Habitat use by the endangered white-clawed
crayfish Austropotamobius species complex: a systematic review. Knowledge and Management of Aquatic
Ecosystmens, 418(1), p. 4.
Fisheries Monitoring of the Ribble Catchment 2017
30 | P a g e
Appendices
Appendix A
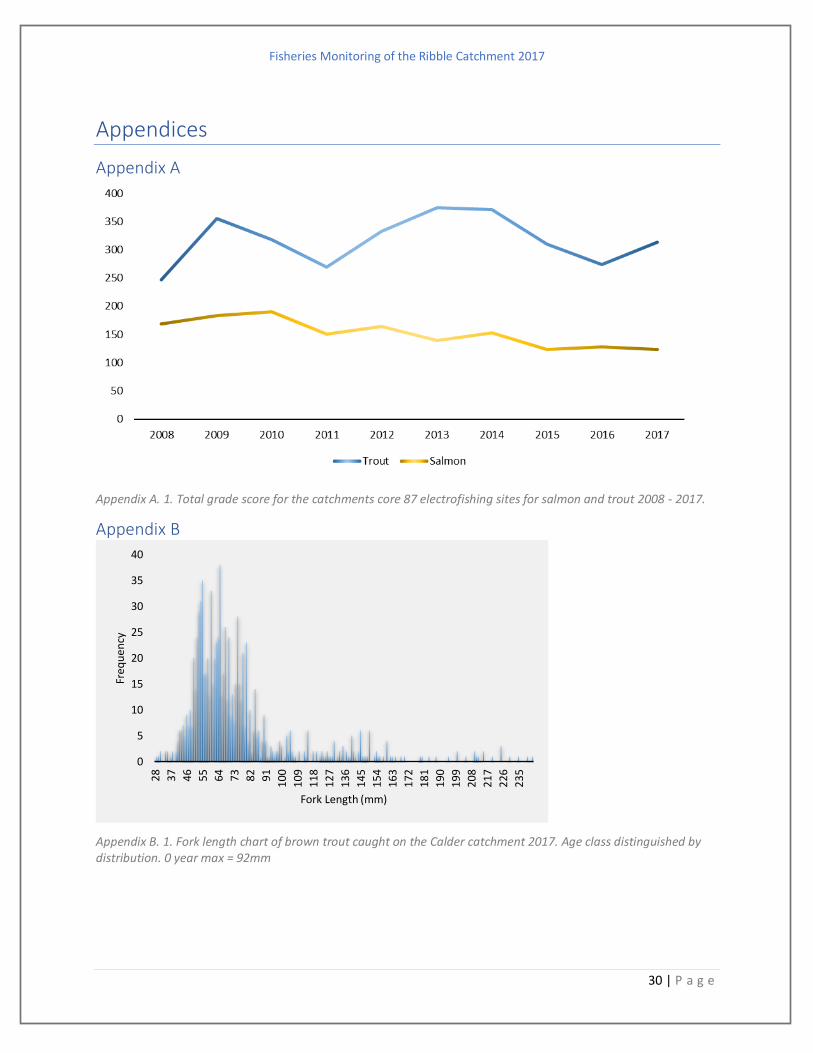
Appendix A. 1. Total grade score for the catchments core 87 electrofishing sites for salmon and trout 2008 - 2017.
Appendix B
Appendix B. 1. Fork length chart of brown trout caught on the Calder catchment 2017. Age class distinguished by distribution. 0 year max = 92mm
0
5
10
15
20
25
30
35
40
28
37
46
55
64
73
82
91
10
0
10
9
11
8
12
7
13
6
14
5
15
4
16
3
17
2
18
1
19
0
19
9
20
8
21
7
22
6
23
5
Freq
uen
cy
Fork Length (mm)
Fisheries Monitoring of the Ribble Catchment 2017
31 | P a g e
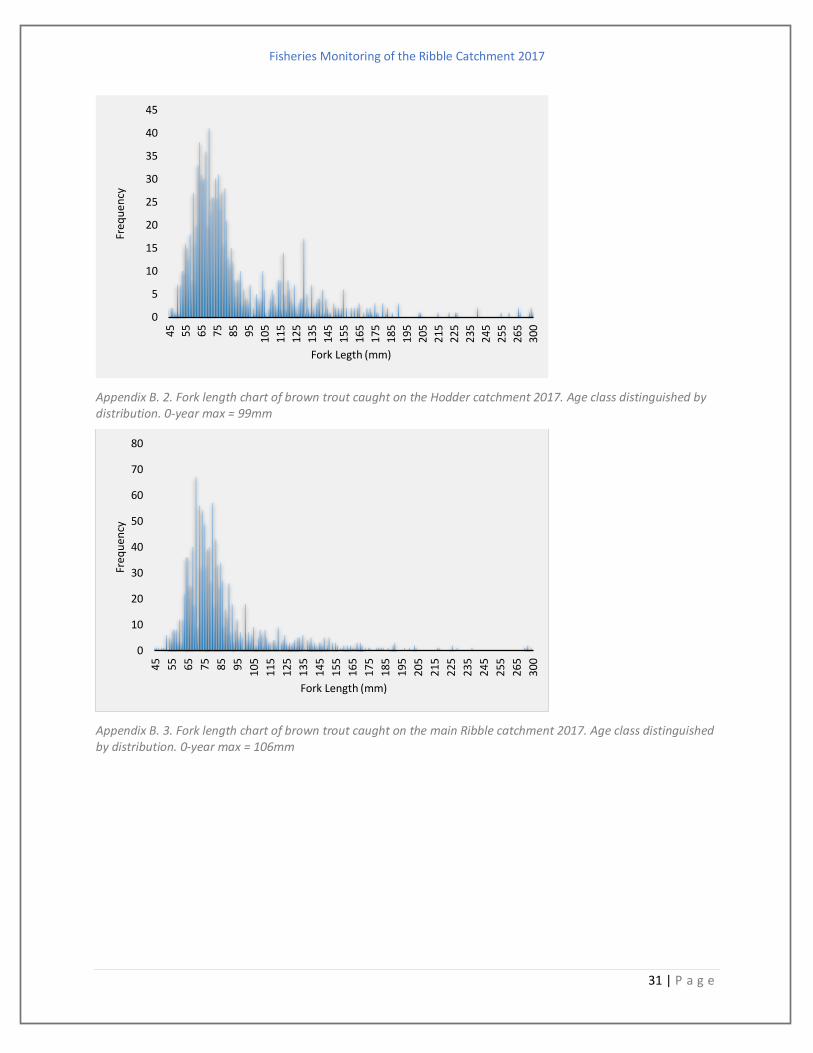
Appendix B. 2. Fork length chart of brown trout caught on the Hodder catchment 2017. Age class distinguished by distribution. 0-year max = 99mm
Appendix B. 3. Fork length chart of brown trout caught on the main Ribble catchment 2017. Age class distinguished by distribution. 0-year max = 106mm
0
5
10
15
20
25
30
35
40
45
45
55
65
75
85
95
10
5
11
5
12
5
13
5
14
5
15
5
16
5
17
5
18
5
19
5
20
5
21
5
225
23
5
24
5
25
5
26
5
300
Freq
uen
cy
Fork Legth (mm)
0
10
20
30
40
50
60
70
80
45
55 65 75
85
95
10
5
11
5
12
5
13
5
14
5
15
5
16
5
17
5
18
5
19
5
20
5
21
5
22
5
23
5
24
5
25
5
26
5
30
0
Freq
uen
cy
Fork Length (mm)
Fisheries Monitoring of the Ribble Catchment 2017
32 | P a g e
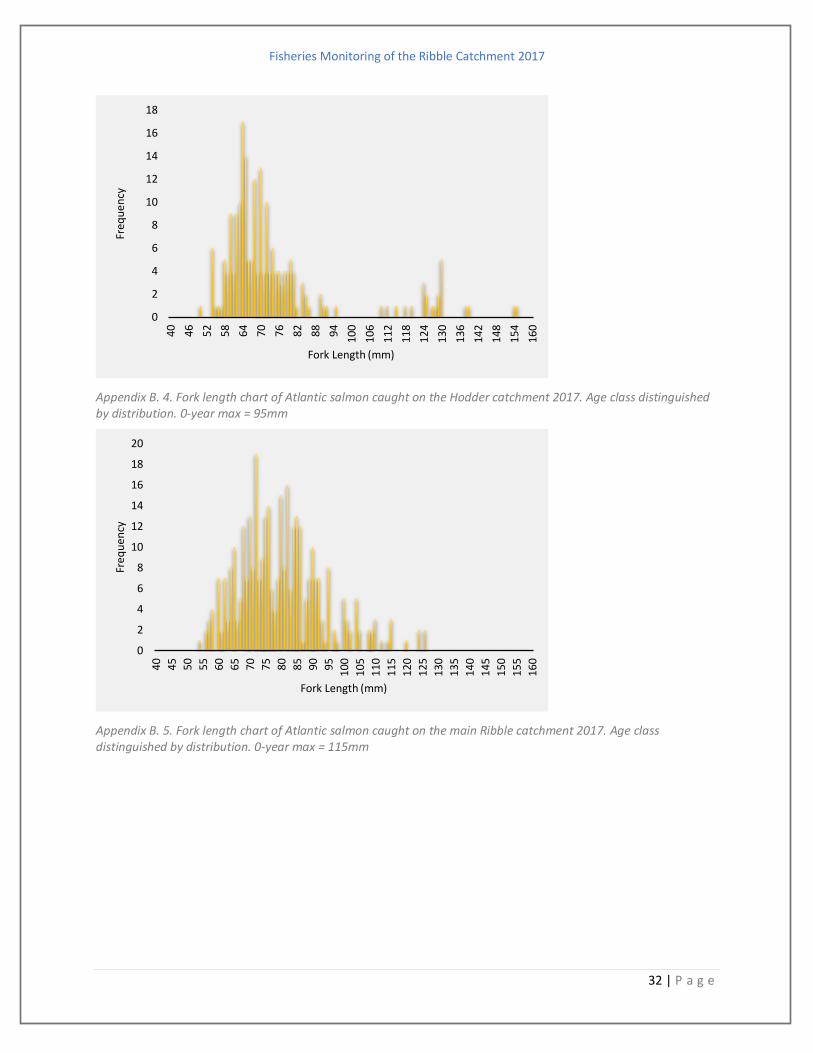
Appendix B. 4. Fork length chart of Atlantic salmon caught on the Hodder catchment 2017. Age class distinguished by distribution. 0-year max = 95mm
Appendix B. 5. Fork length chart of Atlantic salmon caught on the main Ribble catchment 2017. Age class distinguished by distribution. 0-year max = 115mm
0
2
4
6
8
10
12
14
16
18
40 46 52
58
64 70 76
82
88
94
10
0
10
6
11
2
11
8
124
13
0
13
6
14
2
148
15
4
16
0
Freq
uen
cy
Fork Length (mm)
0
2
4
6
8
10
12
14
16
18
20
40
45
50
55
60
65
70
75 80 85
90
95
10
0
10
5
11
0
11
5
12
0
12
5
13
0
13
5
14
0
14
5
15
0
15
5
16
0
Freq
uen
cy
Fork Length (mm)
Fisheries Monitoring of the Ribble Catchment 2017
33 | P a g e
Appendix C
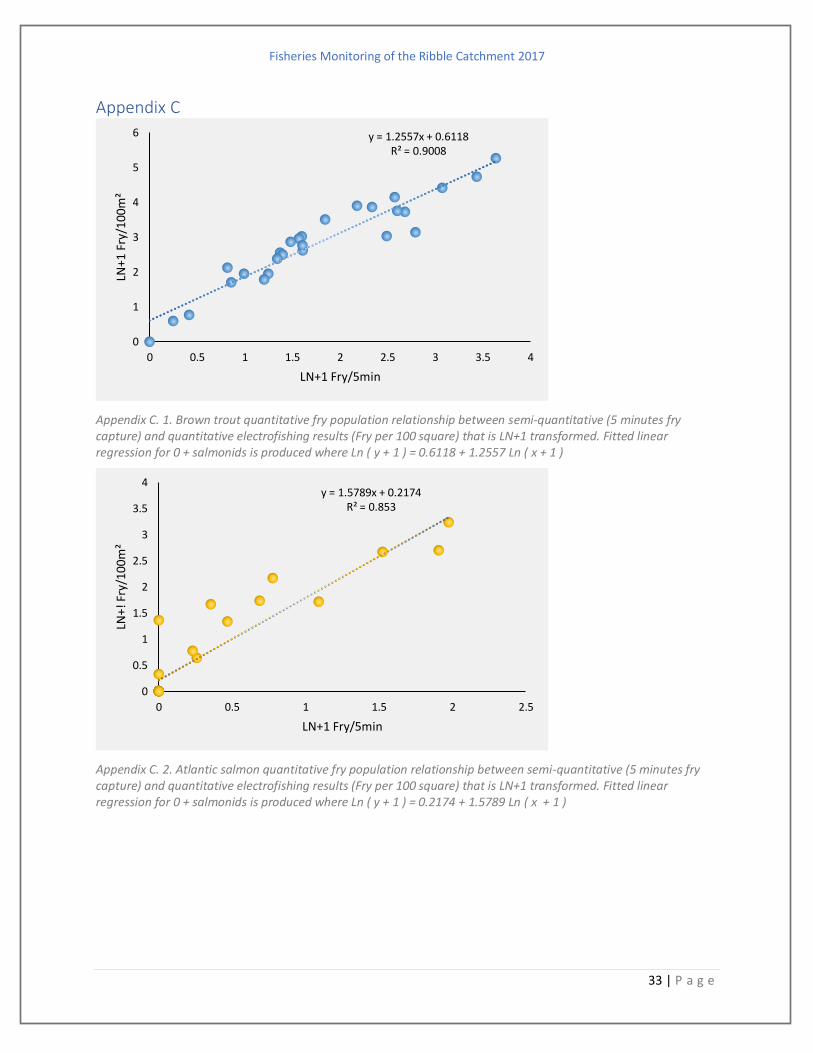
Appendix C. 1. Brown trout quantitative fry population relationship between semi-quantitative (5 minutes fry capture) and quantitative electrofishing results (Fry per 100 square) that is LN+1 transformed. Fitted linear regression for 0 + salmonids is produced where Ln ( y + 1 ) = 0.6118 + 1.2557 Ln ( x + 1 )
Appendix C. 2. Atlantic salmon quantitative fry population relationship between semi-quantitative (5 minutes fry capture) and quantitative electrofishing results (Fry per 100 square) that is LN+1 transformed. Fitted linear regression for 0 + salmonids is produced where Ln ( y + 1 ) = 0.2174 + 1.5789 Ln ( x + 1 )
y = 1.2557x + 0.6118R² = 0.9008
0
1
2
3
4
5
6
0 0.5 1 1.5 2 2.5 3 3.5 4
LN+1
Fry
/100
m²
LN+1 Fry/5min
y = 1.5789x + 0.2174R² = 0.853
0
0.5
1
1.5
2
2.5
3
3.5
4
0 0.5 1 1.5 2 2.5
LN+!
Fry
/100
m²
LN+1 Fry/5min
Fisheries Monitoring of the Ribble Catchment 2017
34 | P a g e
Appendix D
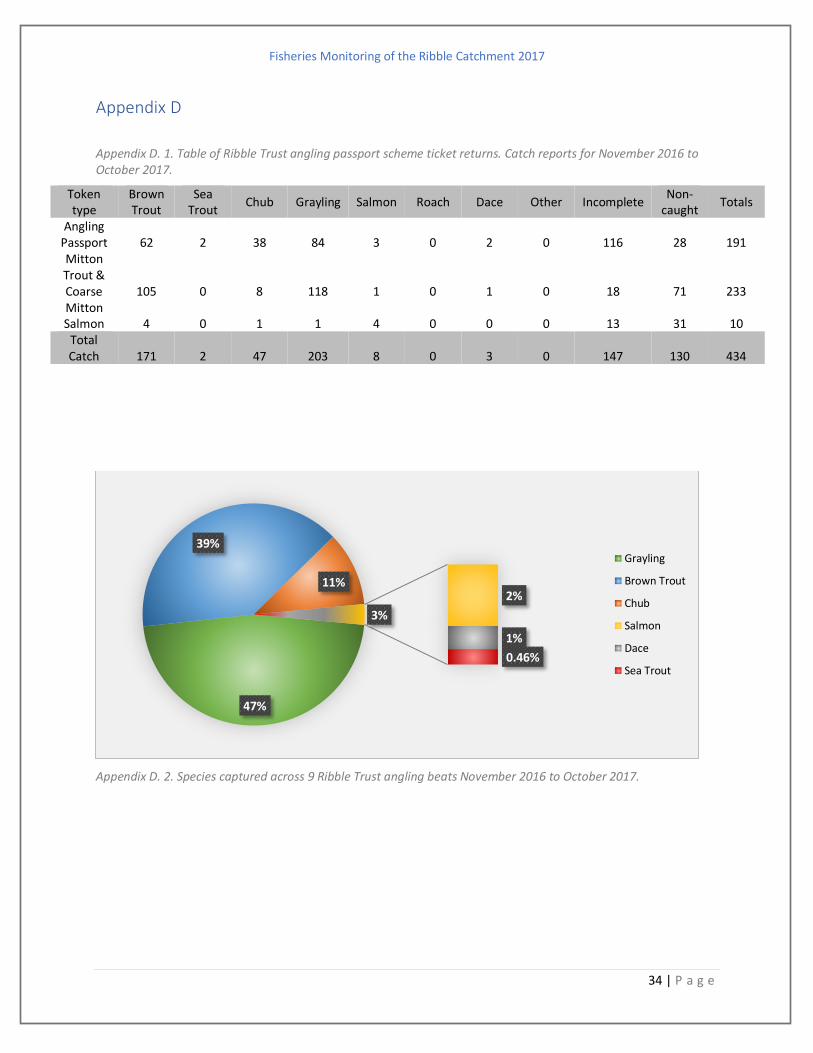
Appendix D. 1. Table of Ribble Trust angling passport scheme ticket returns. Catch reports for November 2016 to October 2017.
Token type
Brown Trout
Sea Trout
Chub Grayling Salmon Roach Dace Other Incomplete Non-
caught Totals
Angling Passport 62 2 38 84 3 0 2 0 116 28 191 Mitton Trout & Coarse 105 0 8 118 1 0 1 0 18 71 233 Mitton Salmon 4 0 1 1 4 0 0 0 13 31 10
Total Catch 171 2 47 203 8 0 3 0 147 130 434
Appendix D. 2. Species captured across 9 Ribble Trust angling beats November 2016 to October 2017.
47%
39%
11%2%
1%
0.46%
3%
Grayling
Brown Trout
Chub
Salmon
Dace
Sea Trout
Fisheries Monitoring of the Ribble Catchment 2017
TRUSTEES: J. Bleasdale, D. Bradley, J. Cowburn, V. Edmondson, M. Ellactot, Dr. M.W. Horner, J.P. Lord (Chairman), C.H. Marchbank, A.T. Rowntree, D. Wilmot.
CHARITY NUMBER: 1070672 COMPANY NUMBER: 3498691 ENTRUST REGISTRATION NUMBER: 600122
To secure the conservation, protection, rehabilitation and improvement of our rivers, streams, watercourses, water impoundments, bank sides
tributaries and estuaries in particular of the river Ribble, Calder and Hodder for the benefit of the public.
The Ribble Rivers Trust is the operating name of the Ribble Catchment Conservation Trust Limited, Registered Address: Central Buildings,
Richmond Terrace, Blackburn, Lancashire, BB1 7AP
“ Improving rivers for people and wildlife”