fish spawning in the lower river murray icon sites, south australia: with reference … ·...
TRANSCRIPT

FISH SPAWNING IN THE LOWER RIVER MURRAY ICON SITES, SOUTH AUSTRALIA: WITH
REFERENCE TO DROUGHT INTERVENTION MONITORING
SARDI Aquatic Sciences Publication Number: F2009/000360-1 SARDI Research Report Series Number: 377
Luciana Bucater, Katherine Cheshire and Qifeng Ye
SARDI Aquatic Sciences PO Box 120 Henley Beach SA 5022
2009

FISH SPAWNING IN THE LOWER RIVER MURRAY ICON SITES, SOUTH AUSTRALIA:
WITH REFERENCE TO DROUGHT INTERVENTION MONITORING
SARDI Aquatic Sciences Publication Number: F2009/000360-1 SARDI Research Report Series Number: 377
Luciana Bucater, Katherine Cheshire and Qifeng Ye
2009
This Publication may be cited as:
Bucater, L., Cheshire, K. and Ye, Q. (2009) Fish spawning in the lower River Murray icon sites, South Australia: with reference to drought intervention. SARDI research
report series number: 377, SARDI Aquatic Sciences Publication Number F2009/000360-1, SARDI Aquatic Sciences, Adelaide, pp 53.
South Australian Research and Development Institute
SARDI Aquatic Sciences
2 Hamra Avenue
West Beach SA 5024
Telephone: (08) 8207 5400
Facsimile: (08) 8207 5406
www.sardi.sa.gov.au

Bucater et al. 2009
DISCLAIMER © 2009 Murray-Darling Basin Authority and SARDI Aquatic Sciences
The authors warrant that they have taken all reasonable care in producing this report. The report has been through the SARDI Aquatic Sciences internal review process, and has been formally approved for release by the Editorial Board. Although all reasonable efforts have been made to ensure quality, SARDI does not warrant that the information in this report is free from errors or omissions. SARDI does not accept any liability for the contents of this report or for any consequences arising from its use or any reliance placed upon it.
This work is copyright Murray-Darling Basin Authority and South Australian Research and Development Institute – Aquatic Sciences. Photographs cover artwork and logos are not to be reproduced, copied or stored by any process without the written permission of the copyright holders or owners. All commercial rights are reserved and no part of this publication covered by copyright may be reproduced, copied or stored in any form or by any means for the purpose of acquiring profit or generating monies through commercially exploiting (including but not limited to sales) any part of or the whole of this publication except with the written permission of the copyright holders.
However, the copyright holders permit any person to reproduce or copy the text and other graphics in this publication or any part of it for the purposes of research, scientific advancement, academic discussion, record-keeping, free distribution, educational use or for any other public use or benefit provided that any such reproduction or copy (in part or in whole) acknowledges the permission of the copyright holders and its source (‘insert title of publication’) is clearly acknowledged.
To the extent permitted by law, the copyright holders (including its employees and consultants) exclude all liability to any person for any consequences, including but not limited to all losses, damages, costs, expenses and any other compensation, arising directly or indirectly from using this report (in part or in whole) and any information or material contained in it.
The contents of this publication do not purport to represent the position of Murray-Darling Basin Authority/South Australian Research and Development Institute – Aquatic Sciences in any way and are presented for the purpose of informing and stimulating discussion for improved management of Basin's natural resources.
SARDI Research Report Series Number: 377
SARDI Aquatic Sciences Publication Number: F2009/000360-1
Authors: Luciana Bucater, Katherine Cheshire and Qifeng Ye Reviewers: Sandra Leigh & Lachie McLeay (SARDI), David Hohnberg & Stuart Little (MDBA) Glynn Ricketts (SA MDB NRM Board) Approved by: Jason Tanner
Signed: Date: 7 October 2009 Distribution: SA Murray-Darling Basin Natural Resource Management Board, Murray-Darling Basin Authority and SARDI Aquatic Sciences Library Circulation: Public Domain

Bucater et al. 2009
1
TABLE OF CONTENTS
TABLE OF CONTENTS............................................................................................................................... 1 LIST OF TABLES ........................................................................................................................................ 2 LIST OF FIGURES....................................................................................................................................... 3 ACKNOWLEDGEMENTS............................................................................................................................ 4 EXECUTIVE SUMMARY.............................................................................................................................. 5 1 INTRODUCTION ................................................................................................................................. 7 2 OBJECTIVES ...................................................................................................................................... 8 3 METHODS........................................................................................................................................... 8
3.1 STUDY SITE................................................................................................................................... 8 3.2 HYDROLOGY ............................................................................................................................... 10 3.3 SAMPLING REGIME....................................................................................................................... 10 3.4 SAMPLING EQUIPMENT AND METHODOLOGY .................................................................................. 11 3.5 SORTING AND IDENTIFICATION ...................................................................................................... 11 3.6 MEASUREMENT OF ENVIRONMENTAL VARIABLES............................................................................ 12 3.7 DATA ANALYSIS ........................................................................................................................... 12
3.7.1 Assemblage descriptors ....................................................................................................... 12 3.7.2 Statistical analyses ............................................................................................................... 12
4 RESULTS .......................................................................................................................................... 14 4.1 SPATIAL VARIATION IN 2008 DOWNSTREAM OF WELLINGTON, LOCK 1 AND LOCK 6.......................... 14
4.1.1 Environmental variables (from TDS field measurements).................................................... 14 4.1.2 Larval assemblage in 2008................................................................................................... 16
4.1.2.1 Catch summary .......................................................................................................................... 16 4.1.2.2 Spatial variation in total larval abundance and species richness................................................ 19 4.1.2.3 Spatial variation in larval assemblage structure with reference to environmental variables ....... 21
4.2 INTER-ANNUAL AND SPATIAL VARIATION DOWNSTREAM OF LOCK 1 AND LOCK 6 FROM 2005 TO 200825 4.2.1 Environmental variables 2005-2008 (from DWLBC data) .................................................... 25 4.2.2 Larval assemblage 2005-2008 ............................................................................................. 27
4.2.2.1 Catch summary .......................................................................................................................... 27 4.2.2.2 Inter-annual and spatial variation in total larval abundance and species richness ..................... 32 4.2.2.3 Inter-annual and spatial variation in larval assemblage structure with reference to environmental variables 34
4.3 LOWER LAKES LARVAL ASSEMBLAGE ............................................................................................ 40 4.3.1 Environmental variables (from TDS field measurements).................................................... 40 4.3.2 Catch summary..................................................................................................................... 40 4.3.3 Spatial variation .................................................................................................................... 41
5 DISCUSSION..................................................................................................................................... 43 5.1 SPATIAL VARIATION...................................................................................................................... 43 5.2 INTERANNUAL VARIATION DOWNSTREAM OF LOCKS 1 AND 6, FROM 2005-2008 .............................. 45
6 KEY FINDINGS ................................................................................................................................. 48 7 MANAGEMENT IMPLICATIONS...................................................................................................... 50 8 RECOMMENDATIONS FOR FUTURE RESEARCH........................................................................ 52 9 REFERENCES .................................................................................................................................. 53 10 PERSONAL COMMUNICATION ...................................................................................................... 57

Bucater et al. 2009
2
LIST OF TABLES
Table 1. Sampling sites with corresponding river section and coordinates. ............................... 10 Table 2. Two-way univariate PERMANOVA for differences among sites and trips for dissolved
oxygen, conductivity, temperature and pH. Bold text indicates significant value........ 14 Table 3. Total number of fish larvae collected downstream of Wellington and Lock 1 and Lock 6,
in 2008. ........................................................................................................................ 16 Table 4. Two-way univariate PERMANOVA for total larval abundance and species richness in
2008, amongst site and trip. Bold text indicates significant value............................... 20 Table 5. Two-way multivariate PERMANOVA for assemblage structure in 2008, amongst site
and trip. Bold text indicates significant value. ............................................................. 21 Table 6. SIMPER analysis for the comparison of assemblage structure between Wellington,
Lock 1 and Lock 6, collected in 2008. ......................................................................... 22 Table 7. Pearson (r) and Kendall (τ) correlation coefficients between each NMS axis and the
environmental variables and species. (Critical τ value for significance at 0.05 = 0.205). Bold text indicates significant correlations. .................................................................. 24
Table 8. Three-way univariate PERMANOVA for differences among years, sites and trips for discharge, water level, temperature and salinity. Bold text indicates significant value...................................................................................................................................... 25
Table 9. Total number of freshwater fish larvae collected downstream of Locks 1 and 6 in 2005, 2006, 2007 and 2008................................................................................................... 28
Table 10. Three-way univariate PERMANOVA for total larval abundance and species richness among years, site and trip. Bold text indicates significant value................................. 32
Table 11. Three-way multivariate PERMANOVA for differences in assemblage structure among year, site and trip. Bold text indicates significant value. .............................................. 34
Table 12. SIMPER analysis for the comparison of assemblage structure between years, downstream of Lock 1. ................................................................................................ 35
Table 13. SIMPER analysis for the comparison of assemblage structure between years, downstream of Lock 6. ................................................................................................ 36
Table 14. SIMPER analysis for the comparison of assemblage structure between Lock1 and Lock 6, in 2005, 2006, 2007 and 2008.. ...................................................................... 37
Table 15. Pearson (r) and Kendall (τ) correlation coefficients between each NMS axis and the environmental variables and species. (Critical τ value for significance at 0.05 = 0.124)...................................................................................................................................... 39
Table 16. Environmental variables dissolved oxygen (ppm), electrical conductivity (µS/cm at 25 oC), pH and water temperature (oC) in the Lower Lakes sites. .................................... 40
Table 17. Total number of fish larvae collected at the Lower Lakes sites in 2008. .................... 40 Table 18. One-way multivariate PERMANOVA for differences in assemblage structure among
sites.. ........................................................................................................................... 41 Table 19. Pearson (r) and Kendall (τ) correlation coefficients between each NMS axis (figure
14) and the environmental variables and species. (Critical τ value for significance at 0.05 = 0.602). B. .......................................................................................................... 42

Bucater et al. 2009
3
LIST OF FIGURES
Figure 1. A map of Lower Murray River, South Australia. Regular sampling sites marked by the large red circles, prospective sites in the Lower Lakes marked by red dots.................. 9
Figure 2. Bongo nets used for plankton tows ............................................................................ 11
Figure 3. Environmental variables measured downstream of Wellington, Lock 1 and Lock 6, a) dissolved oxygen (ppm), b) electrical conductivity (µS/cm at 25 oC), c) water temperature (oC) and d) pH.. ....................................................................................... 15
Figure 4. Small-bodied freshwater native fish larvae sampled downstream of Wellington, Lock 1 and Lock 6, in 2008. Data presented as the mean of 6 replicates ± standard error. ... 17
Figure 5. Small-bodied estuarine native fish larvae sampled downstream of Wellington, Lock 1 and Lock 6, in 2008. Data presented as the mean of 6 replicates ± standard error. ... 18
Figure 6. Exotic freshwater fish larvae sampled downstream of Wellington, Lock 1 and Lock 6, in 2008......................................................................................................................... 19
Figure 7. Comparison of total abundance (fish per 1000 m3) and species richness of fish larvae collected during 2008 downstream of Wellington, Lock 1 and Lock 6. ........................ 20
Figure 8. Non-metric MDS ordination (2-dimensional plot) for assemblage structure (stress 0.18) comparing sites downstream of Wellington, Lock 1 and Lock 6. Superimposed vectors for species and the characterising environmental variables are presented……………23
Figure 9. Comparison of the environmental conditions between 2005, 2006, 2007 and 2008, downstream of Locks 1 and 6...................................................................................... 26
Figure 10. Small-bodied freshwater native fish larvae for 2005, 2006, 2007 and 2008 sampling events downstream of Locks 1 and 6. ......................................................................... 29
Figure 11. Large-bodied freshwater native fish larvae for the 2005, 2006, 2007 and 2008 sampling events downstream of Locks 1 and 6........................................................... 30
Figure 12. Exotic freshwater species fish larvae for the 2005, 2006, 2007 and 2008 sampling events downstream of Locks 1 and 6. ......................................................................... 31
Figure 13. Comparison of total abundance and species richness of fish larvae collected in a) 2005, b) 2006, c) 2007 and d) 2008 sampling events downstream of Locks 1 and 6........................................................................................................................................ 33
Figure 14. Non-metric MDS ordination (2-dimensional plot) for assemblage structure (stress 0.19) comparing 2005, 2006, 2007 and 2008, downstream of Locks 1 and 6. Superimposed vectors for the characterising environmental variables are presented ....................................................................................................................................... 38
Figure 15. Non-metric MDS ordination (2-dimensional plot) for assemblage structure (stress 0.03) comparing Clayton, Pomanda island and Point Sturt. Superimposed vectors for the characterising environmental variables are presented………………………………42

Bucater et al. 2009
4
ACKNOWLEDGEMENTS
Funding from the Murray-Darling Basin Authority’s (MDBA) The Living Murray Intervention
Monitoring Program was provided through the South Australia Murray-Darling Basin Natural
Resources Management (SA MDB NRM) Board.
Special thanks to Simon Westergaard, Lesley Alton and Phillipa Wilson who were integral in
assisting us with identification of fish larvae. Many thanks to Michael Guderian and Matt
Pellizzari who played major roles in the field and in sorting samples. We also thank Neil
Wellman, Josh Fredberg, Michelle Roberts, Natalie Bool, Catherine Lawless, David Short and
David Fleer for field and lab assistance. Additionally, thanks to Carlos Teixeira and David
Schmarr for computer assistance.
Thanks to Narrandera Fisheries Centre (NSW-DPI) and Mike Hammer, who provided us with
fish larvae vouchers and Anthony Miskiewicz for assisting us with identification of estuarine
species.
The Department of Water, Land and Biodiversity Conservation (DWLBC) Knowledge and
Information Division provided discharge, water level, temperature and conductivity data for the
sites throughout the Lower River Murray, thanks to Barry Porter and Peta Hansen for additional
information.
Thank you to David Honhberg, Stuart Little and Lex Cogle (MDBA) who provided project
management and conducted the MDBA review. Special thanks to Judy Goode, Adrienne Frears
and Glynn Ricketts (SA MDB NRM Board) for their continuous support for this project and for
conducting SA MDB NRM Board review.
Similarly, thanks to Jason Tanner for acting as editor and overseeing the review process, and to
Lachie McLeay and Sandra Leigh for conducting the SARDI internal reviews on the draft report
and providing constructive advice to improve the manuscript. Thank you to Suzanne Bennett
and Carmel Elmawey for organising the SARDI review process.

Bucater et al. 2009
5
EXECUTIVE SUMMARY
Fish spawning and recruitment studies are a good indicator of river and fish population health.
Larval fish sampling in the Lower River Murray was conducted fortnightly from 2005 -2008, at
Locks 1 and 6, from October to December, resulting in six trips per year. An additional site at
Wellington was added in 2008. Lower Lakes sites at Pomanda Island, Point Sturt, and Clayton
were sampled only once, in December 2008 as a pilot study. Environmental variables were
also monitored throughout the sampling period to determine whether linkages between
distribution of larval assemblage and any environmental variables could be identified.
Discharge, water level and conductivity differed between years, as a direct result of the drought
conditions. Discharge and water level were highest in 2005, and decreased downstream of
Locks 1 and 6 in subsequent years. The first year (2005) was an above regulation flow year,
with a significant period during which within-channel flow pulses occurred as a result of a
combination of increased inflows into the tributaries and an environmental water allocation
release in the Upper River Murray. The following three years (2006, 2007 and 2008) were
hydrologically similar, being drought years of below regulation flow. Conductivity was negatively
correlated to flow and water level, and was highest downstream of Lock 1 and Wellington.
Fifteen species of fish were collected as larvae, comprising nine native freshwater, four native
estuarine, and two exotic freshwater species. The freshwater fish assemblage was comprised of
highly abundant small-bodied species and some large-bodied iconic species. The estuarine
species were only collected during 2008, in the new sites, downstream of Wellington and in the
Lower Lakes.
Significant spatial variation was identified for total abundance, species richness and
assemblage structure between sites downstream of Lock 1, Lock 6 and Wellington in 2008.
These differences in assemblages are most likely a result of differences in habitats surrounding
the regions. Spatial differences between the Lower Lakes sites were also identified and are
most likely a function of differences in conductivity.
Inter-annual variation in the total abundance, species richness and assemblage structure was
identified downstream of Locks 1 and 6, over the four sampling years. These differences were
correlated to changes in discharge, water level, conductivity and temperature. Three distinct
larval responses were identified:
1) Increased flow response: larval abundances positively correlated to discharge and water
level (and negatively correlated to conductivity). Including: golden perch, silver perch and
freshwater catfish.

Bucater et al. 2009
6
2) Decreased flow response: larval abundances negatively correlated to discharge and water
level (and positively to conductivity). Including: Australian smelt, flathead gudgeons, carp
gudgeons and hardyheads (consistent with the Low Flow Recruitment Hypothesis (LFRH),
Humphries et al. 1999).
3) Temperature response: larval abundances strongly correlated to temperature. Applied to
most species, however, bony herring, carp gudgeons and redfin perch were more strongly
influenced by lower temperature than other variables.
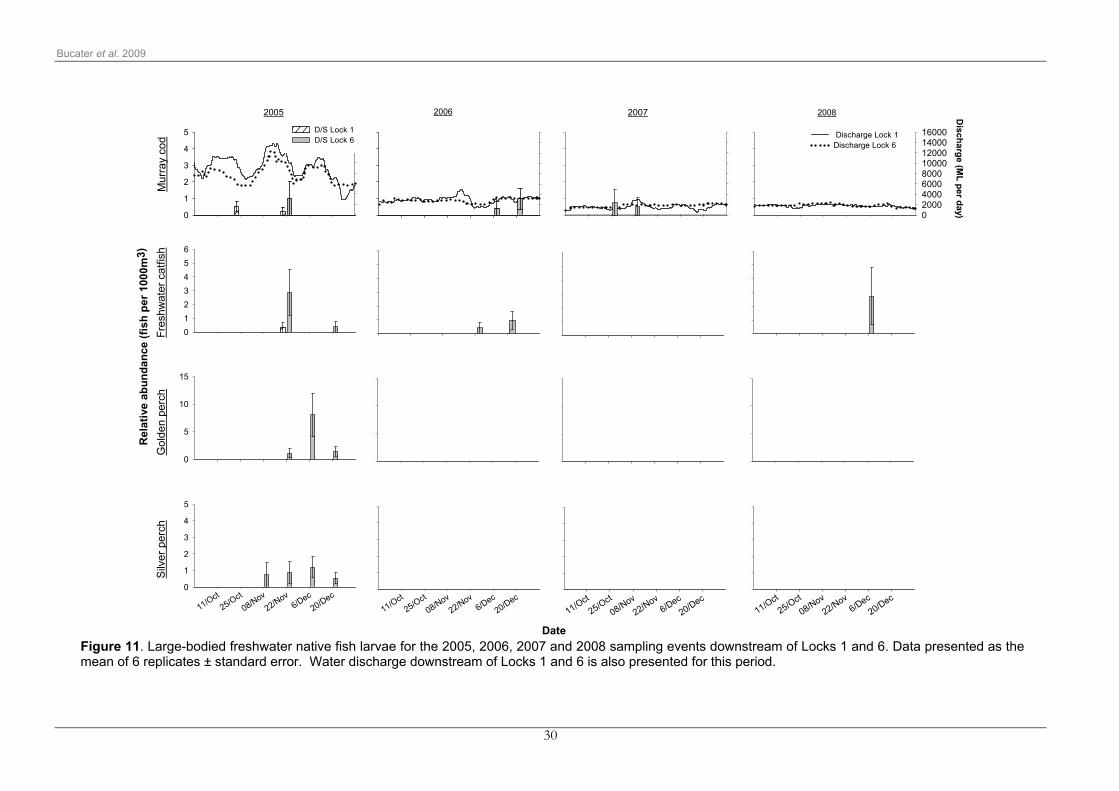
Abundances of larvae of the large-bodied species have decreased in each consecutive year,
and were very low throughout the duration of the project, which should be of significant concern.
Murray cod larvae were only collected downstream of Lock 1 in the flow pulse year, and no
larvae were detected in either site in 2008. Notably, flow-cued spawners, golden perch and
silver perch, were only present during 2005 under the increased discharge conditions. Under
low flow conditions abundance and distribution of large-bodied native species is decreased. A
within-channel flow pulse may be sufficient to benefit spawning of many species, however,
further research is required to determine the impact on recruitment to the juvenile population.
Small-bodied native species appear to respond positively to the low flow conditions initially, with
higher abundances of larvae recorded in the low flow years. However, a decrease in the
abundances of these species was recorded in 2008, suggesting that longer term monitoring
may be needed.
This report details the results of a four year study on the inter-annual and spatial variation in
larval fish assemblages in the main channel of the Lower River Murray, South Australia.
Separate sections are included highlighting key findings, management implications and
recommendations for future research. Results indicated that water management strategies
should be of a high priority for native fish management in South Australia. Furthermore,
environmental water allocations upstream may indirectly benefit downstream sites, and during
prolonged periods of low flow, the importance of within-channel flow pulses should not be
under-estimated.

Bucater et al. 2009
7
1 INTRODUCTION
The severe drought conditions that began in 2002 are likely to have intensified pressure on
already stressed native fish communities. It is, therefore, important to understand the biological
impacts and responses of key fish species during the current drought conditions. This will
provide information for adaptive management to assist recovery of fish communities and
riverine health.
In recent years discharge in the Lower River Murray, South Australia (SA) has been the lowest
on record and the low flow patterns are predicted to continue (MDBC 2008). In the Lower River
Murray, the riverine characteristics and associated floodplains are substantially different from
those in the mid and upper River Murray (Walker 2006). Therefore, specific investigations in the
lower Murray region are needed to improve our understanding of the importance of flows,
flooding and floodplains on the life cycle of native fish, fish habitat and environmental
requirements of critical life stages of fish species. A combination of increased tributary inflows
and an environmental water allocation release in the Upper Murray, had flow-on effects,
resulting in an increase in within-channel flow in the Lower River Murray during 2005.
Larval fish sampling from 2005 to 2008, downstream of Locks 1 and 6 in the main channel of
the River Murray, had identified significant inter-annual variation in assemblage structure and
highlighted the importance of elevated flows. Higher flows in 2005 resulted in spawning and the
presence of larvae of golden perch and silver perch, whereas the results from 2006, 2007 and
2008 suggested that the low flow conditions as a result of extended drought had contributed to
recruitment failure of large-bodied native species. In 2006, 2007 and 2008, no golden perch or
silver perch were detected from any of the survey sites, furthermore, larval Murray cod and
freshwater catfish were not collected downstream of Lock 1 (Cheshire and Ye 2008a, Ye et al.
2008).
This project aimed to continue monitoring larval fish assemblages in 2008 downstream of Locks
1 and 6, with an additional site established near Wellington. More specifically, the aim was to
examine the impacts of prolonged low flow conditions and water quality deterioration on the
larval community, and provide recommendations on potential mitigation measures. In addition,
pilot sampling was conducted at three selected sites in the Lower Lakes, to identify the larval
fish assemblage during the peak spawning season and to inform future monitoring programs in
the region.
This report has additional information complementing previous studies done by SARDI’s
researchers, for more comprehensive background information please see Cheshire and Ye
(2008a) and Cheshire and Ye (2008b).

Bucater et al. 2009
8
2 OBJECTIVES
The overall aim of this project was to determine the effect of drought induced weir pool lowering,
particularly in the reaches below Lock 1 and near Wellington, on fish spawning. The specific
objectives were:
To investigate the spatial variation of larval fish assemblage structure between sites
downstream of Wellington, Lock 1 and Lock 6, in 2008, in relation to environmental variables;
To describe the patterns and compare the inter-annual change in larval fish assemblage
structure in the main channel at sites downstream of Lock 1 and Lock 6, between 2005, 2006,
2007 and 2008, in the context of drought impact and
To describe the larval fish assemblage structure in the Lower Lakes under the current low water
level conditions.
3 METHODS
3.1 STUDY SITE
In South Australia, the River Murray encompasses four distinct geo-morphologic sections: “the
floodplain”, “gorge”, “swamplands” and “lakes” regions (Figure 1). The floodplain/valley region
extends from the Murray-Darling confluence to Overland Corner. The river meanders over a
wide, terraced floodplain with many anabranches, billabongs, deflation basins and Lake Victoria
(Walker 2006).
The lowland gorge runs from Overland Corner, where the river enters its limestone gorge, to
Mannum. The channel includes long, straight reaches aligned by geological faults, but retains
some inclination to meander. The diversity of wetlands is much less than in the floodplain
section (Walker 2006).
The swamplands section goes from Mannum to Wellington. The river flows through a section
flanked by reclaimed swamplands used for pasture and forage crops. There are no weirs, but
River Mouth barrages maintain a 450-600mm increase in the river level below Lock 1 (Walker
2006).
The lakes section starts from Wellington, where the river enters Lake Alexandrina and ends at
the sea. A small lake, Lake Albert, was historically fed from Lake Alexandrina, but due to
reduced water levels under current drought conditions, it has been disconnected from Lake
Alexandrina since April 2008. The River enters the sea through the Murray Mouth near Goolwa.
The Murray Mouth has been constantly dredged since 2002 (DWLBC 2007) to avoid closures

Bucater et al. 2009
9
caused by flow depletion and accumulated sediments and sand. The Coorong, a long and
narrow estuarine lagoon, adjoins the river mouth (Walker 2006).
Regular larval fish sampling was conducted at three sites in the main channel of the Lower
River Murray SA, in the floodplain (downstream of Lock 6), gorge (downstream of Lock 1) and
lakes section (downstream of Wellington) (Figure 1, Table 1). A pilot sampling trip was carried
out in the Lower Lakes, in the vicinity of Pomanda Island, Point Sturt and Clayton, in early
December 2008 (Figure 1, Table 1).
Figure 1. A map of Lower Murray River, South Australia. Regular sampling sites marked by the
large red circles, prospective sites in the Lower Lakes marked by red dots.

Bucater et al. 2009
10
Table 1. Sampling sites with corresponding geomorphic river section and coordinates.
Site Geo-morphologic section Coordinates Sampling regime
Downstream of Lock 6 Floodplain 33°59.725’ S, 140°53.152 E Regular sampling
Downstream of Lock 1 Gorge 34°21.138’ S, 139°37.061’ E Regular sampling
Downstream of Wellington Lakes 35°21.843’ S, 139°22.021’ E Regular sampling
Pomanda Island Lakes 35°24.686’ S, 139°19.170’ E Pilot sampling
Point Sturt Lakes 35°24.686’ S, 139°19.170’ E Pilot sampling
Clayton Lakes 35°30.545’ S, 138°57.447’ E Pilot sampling
3.2 HYDROLOGY
Flow in the Lower River Murray is extensively regulated, in recent years the flow within the
system has been little more than the irrigation allowance. However, 2005 was an above
regulation flow year, with a significant period during which within-channel flow pulses occurred.
This increase in flow was the result of a combination of increased tributary inflows, and the
release of the Barmah Millewa Forest Environmental Water Allocation (BM-EWA) (King et al.
2008). Although the BM-EWA was not specifically aimed at increasing flows in the Lower River
Murray, this release resulted in a within channel flow pulse in South Australia. In conjunction
with this flow pulse, the level of the weir pool at Weir 5 was raised by 50 cm, as a management
intervention. The following three years (2006, 2007 and 2008) were hydrologically similar, being
drought years of below regulation flow, and weir heights were maintained at the regulated pool
level.
3.3 SAMPLING REGIME
Regular sampling was conducted fortnightly at three sites (Table 1) during the spring/summer of
2008 from October through December, resulting in six trips. Sampling occurred during both day
and night, of the same day, resulting in six replicates at each site (three day and three night
replicates). All river sites were sampled within a four-day period. In 2005, 2006 and 2007
sampling was conducted downstream of Locks 1 and 6 using the same sampling regime
(Cheshire and Ye 2008a).
Pilot sampling was done once in the Lower Lakes sites at Pomanda Island, Point Sturt and
Clayto, during the day in December 2008, resulting in three replicates at each site. These sites
were sampled within a two-day period. The sampling period was selected based on the peak
spawning season and larval abundances within the river system as identified by Cheshire and
Ye (2008), Humphries et al (2002), Leigh et al. (2008) and Meredith et al. (2002).

Bucater et al. 2009
11
3.4 SAMPLING EQUIPMENT AND METHODOLOGY
Plankton tows were conducted using a pair of square-framed, 0.5 x 0.5 m, 3 m long bongo nets
of 500 µm mesh. Nets were equipped with a 60 cm pneumatic float in the centre of the frame,
so the frame sat five cm below the water surface. They were towed in circles using a 20 m
rope, in the main river channel and in the Lower Lakes sites, in areas with a depth greater than
1 m. The volume of water filtered through each net was determined using a flow meter (General
Oceanics), fitted in the centre of the mouth openings. Plankton tow data were standardised to
number of larvae per 1,000 m3 of water and then samples from left and right nets were grouped
for analysis. Day and night samples were taken to gain a representative picture of the whole
larval assemblage (Cheshire unpublished data).
Figure 2. Bongo nets used for plankton tows
3.5 SORTING AND IDENTIFICATION
Samples were preserved in 95% ethanol in situ and returned to the laboratory for sorting under
magnification lamps. Where possible, all larvae were identified to species level, using published
descriptions (Lake 1967; Neira et al. 1998; Puckridge and Walker 1990; Serafini and Humphries
2004), with the exception of carp gudgeons (Hypseleotris spp.), hardyheads (Craterocephalus
spp.) and some estuarine goby species. For carp gudgeons and hardyheads, each genus was
treated as a species complex due to close phylogenetic relationships and very similar
morphologies (Bertozzi et al. 2000; Serafini and Humphries 2004). Similarly, some of the
estuarine goby species were not identifiable due to the scarcity of fish larval species
descriptions and difficulties inherent to identification in the group; these were grouped into the
family Gobidae.

Bucater et al. 2009
12
3.6 MEASUREMENT OF ENVIRONMENTAL VARIABLES
In situ measurements of dissolved oxygen (mg/L), pH, water temperature (°C) and conductivity
(μS/cm @ 25 °C), using a TDS water quality meter, were taken at each site approximately 0.2 m
below the surface, during the day and at night. In addition, daily records of data for discharge
(ML per day), water level (mAHD = Level relative to Australian Height Datum), water
temperature (°C) and conductivity (μS/cm @ 25 °C) were obtained for sites downstream of
Locks 1 and 6, throughout the entire season from the Department of Water, Land and
Biodiversity Conservation, Knowledge and Information Division, Surface Water Archive (http://e-
nrims.dwlbc.sa.gov.au/swa/).
3.7 DATA ANALYSIS
3.7.1 Assemblage descriptors
The fish assemblage was characterised using three descriptors: total abundance, species
richness and assemblage structure. Total abundance of larvae was the total number of fish
calculated by summing standardised abundance of all species at each site for each replicate.
Species richness was the total number of species collected at a given site for each replicate.
Assemblage structure was characterised by species composition (presence/absence data) and
abundance of each species.
3.7.2 Statistical analyses
Prior to analysis, the environmental variables and assemblage descriptors were tested for
normality and homogeneity of variance. As few variables met the assumptions (normality and
homogeneity), data were analysed using permutational analysis of variance (PERMANOVA:
Anderson 2001) for univariate and multivariate data, which does not require the data to meet
these assumptions.
Spatial variation in assemblage descriptors (total abundance, species richness and assemblage
structure), between downstream of Wellington, Lock 1 and Lock 6 during 2008 was examined
using a two-way design, with site as fixed factor and trip as random factor. Inter-annual and
spatial variations in assemblage descriptors from 2005 to 2008, downstream of Lock 1 and Lock
6, were investigated using a three-way design, with year, site and trip as random factors.
Individual species have been documented to show diel variation, however, day/night was not
treated as a factor in the analyses as there is not a significant effect on the overall assemblage
structure (Cheshire unpublished data).

Bucater et al. 2009
13
In all analyses, total abundance and species richness were examined using univariate designs,
while assemblage structure was examined using a multivariate design. A fourth-root
transformation was performed on the larval assemblage data only, to prevent highly abundant
species from unduly influencing the similarity measure (Clarke 1993). All biological data were
examined using Bray-Curtis similarity measures (Bray and Curtis 1957). Unrestricted
permutations of data were performed for all analyses, with 999 permutations for the test, to
detect differences at α=0.05 (Anderson 2001). Where a low number of unique permutations
occurred, the Monte-Carlo p-values (p MC) were included and used to detect significant
differences (Anderson 2005). Where significant differences or interactions occurred pairwise
analyses, also using the PERMANOVA program, were performed to isolate where the
differences occurred.
In order to identify species contributing most to the differences between groups, a similarity
percentages (SIMPER) analysis was also performed for the comparison of assemblage
structure between sites and years. The abundance dataset was fourth root-transformed, a two
way crossed design and the Bray Curtis measure of similarity were used and a 95% cumulative
contribution cut-off was applied.
Mean daily values for discharge, water level, temperature and conductivity (from the DWLBC
surface water archive) were selected from the week of sampling to generate a set of six
replicates for each site and trip, to correspond to the six larval replicates. All environmental
variables were examined using a normalised Euclidean distance similarity measure. To detect
inter-annual and spatial variations, discharge, water level, temperature and conductivity were
analysed individually using a three-way univariate design. To determine spatial difference in
temperature, dissolved oxygen, pH and conductivity (from TDS field measurements) in 2008, a
two-way univariate design was applied.
The correlations between environmental variables and fish assemblage structure were analysed
using non-metric multidimensional scaling (NMS) ordination, using the Sorenson (Bray-Curtis)
measure in PC-ORD (McCune and Mefford 1999). Environmental variables and species were
added as vectors onto the NMS plots using a 0.1 R2 cut-off. Correlations between the NMS axis,
environmental variables and individual species were examined using Pearson (r) and Kendall
(τ) correlation coefficients (McCune and Mefford 1999). Where the Pearson (r) correlation
explained the amount of variance attributable, and Kendall (τ) correlation provided the
significance of the correlation.

Bucater et al. 2009
14
4 RESULTS
4.1 SPATIAL VARIATION IN 2008 DOWNSTREAM OF WELLINGTON, LOCK 1 AND LOCK 6
4.1.1 Environmental variables (from TDS field measurements)
All environmental variables showed a significant site-trip interaction, indicating that while spatial
variation occurred, it was not consistent through time (Table 2). The site at Wellington
represented a more dynamic system, showing considerable changes in dissolved oxygen and
conductivity over time. Dissolved oxygen ranged between 6 and 10ppm (Figure 3a). There was
a gradual increase in conductivity from upstream to downstream sites in the Lower River
Murray, as a result of geographical placement (Figure 3b). Temperature generally increased
from spring to late summer at all sites (Figure 3c) and the pH ranged between 7.5 and 8.5
(Figure 3d). All environmental variables represent spot measurements and should be
interpreted cautiously.
Table 2. Two-way univariate PERMANOVA for differences among sites and trips for dissolved oxygen, conductivity, temperature and pH. Bold text indicates significant value.
Dissolved oxygen Conductivity Temperature pH
Source of variation df MS p MS p MS p MS p
Site 2 0.57 0.727 39.80 0.001 7.45 0.002 10.34 0.018
Trip 4 15.28 0.001 0.48 0.001 16.04 0.001 10.05 0.001
Site x Trip 8 1.95 0.001 0.63 0.001 0.45 0.001 1.57 0.001
Residual 75 0.15 0.03 0.08 0.21

Bucater et al. 2009
15
D/S WellingtonD
isso
ved
oxyg
en (p
pm)
5
6
7
8
9
10
11 Day measurementsNight measurements
Con
duct
ivity
(µS/
cm)
0200400600800
1000120014001600
Tem
pera
ture
(Co )
14
16
18
20
22
24
26
Sampling date
06-1
1/Oct/
0820
-24/O
ct/08
3-7/N
ov/08
17-2
1/Nov
/081-
5/Dec
/0815
-19/D
ec/08
pH
7.0
7.5
8.0
8.5
9.0
06-1
1/Oct/
0820
-24/O
ct/08
3-7/N
ov/08
17-2
1/Nov
/081-
5/Dec
/0815
-19/D
ec/08
06-1
1/Oct/
0820
-24/O
ct/08
3-7/N
ov/08
17-2
1/Nov
/081-
5/Dec
/0815
-19/D
ec/08
(a)
(b)
(c)
(d)
D/S Lock 1 D/S Lock 6
Figure 3. Environmental variables measured downstream of Wellington, Lock 1 and Lock 6, a) dissolved oxygen (ppm), b) electrical conductivity (µS/cm at 25 oC), c) water temperature (oC) and d) pH. Late October trip measurements were disregarded, due to problems with water quality meter.

Bucater et al. 2009
16
4.1.2 Larval assemblage in 2008
4.1.2.1 Catch summary
A total of 22,334 larvae were collected during 2008 from the three regularly sampled sites. The
numbers of larvae caught downstream of Lock 1 and Wellington were substantially higher than
downstream of Lock 6 (Table 3). Eleven species were collected throughout the study,
comprising six native freshwater, two exotic freshwater and three native estuarine species.
Common galaxias, considered a diadromous species, was grouped with other estuarine species
in this study.
The small-bodied freshwater species, Australian smelt, carp gudgeons, flathead gudgeon, and
bony herring*, were most abundant (Table 3, Figure 4). Freshwater catfish larvae were only
collected on one occasion downstream of Lock 6 during early December (Table 3). The exotic
species, common carp and redfin perch, were collected in relatively low numbers (Table 3,
Figure 6). Common galaxias, lagoon goby and Gobidae, were present only downstream of
Wellington (Table 3, Figure 5).
Table 3. Total number of fish larvae collected downstream of Wellington and Lock 1 and Lock 6,
in 2008.
Species
Species group Common name Scientific name D/S Wellington D/S Lock 1 D/S Lock 6 Total
Native freshwater Australian smelt Retropinna semoni 4,801 630 3,421 8,852
Bony herring Nematalosa erebi 124 348 357 829
Carp gudgeon Hypseleotris spp. 329 1,991 350 2,670
Flathead gudgeon Philypnodon grandiceps 2,016 6,931 489 9,436
Hardyhead Craterocephalus spp. 0 34 1 35
Freshwater catfish Tandanus tandanus 0 0 4 4
Exotic freshwater Common carp Cyprinus carpio 9 109 3 121
Redfin Perca fluviatilis 218 0 0 218
Native estuarine Common galaxias Galaxias maculatus 59 0 0 59
Lagoon goby Tasmanogobius lasti 87 0 0 87
Unidentified goby Gobidae 23 0 0 23
Total 7,666 10,043 4,625 22,334
Percentage of total catch 34.3 45.0 20.7
_________________________
* Bony herring is usually qualified as a medium sized fish, however the larvae are very similar to those of the small-
bodied species so for the context of this report they have been included as a small-bodied species.

Bucater et al. 2009
17
Aus
tralia
n sm
elt
0
200
400
600
800
1000
1200B
ony
Her
ring
0
20
40
60
80
100
120
140
D/S WellingtonD/S Lock 1D/S Lock 6
Rel
ativ
e ab
unda
nce
(fish
per
100
0m3)
Car
p gu
dgeo
m
0
200
400
600
800
Sampling date
11/Oct 25/Oct 08/Nov 22/Nov 6/Dec 20/Dec
Flat
head
gud
geon
0
200
400
600
800
1000
1200
1400
Figure 4. Small-bodied freshwater native fish larvae sampled downstream of Wellington, Lock
1 and Lock 6, in 2008. Data presented as the mean of 6 replicates ± standard error.

Bucater et al. 2009
18
Com
mon
gal
axia
s
0
20
40
60
80
100
120
Rel
ativ
e ab
unda
nce
(fish
per
100
0m3)
Lago
on g
oby
0
50
100
150
200
250
300
Sampling date
11/Oct 25/Oct 08/Nov 22/Nov 6/Dec 20/Dec
Gob
idae
0
20
40
60
80
D/S WellingtonD/S Lock 1D/S Lock 6
Figure 5. Small-bodied estuarine native fish larvae sampled downstream of Wellington, Lock 1
and Lock 6, in 2008. Data presented as the mean of 6 replicates ± standard error.

Bucater et al. 2009
19
Car
p
0
20
40
60
80D/S WellingtonD/S Lock 1D/S Lock 6
Rel
ativ
e ab
unda
nce
(fish
per
100
0m3)
Sampling date
11/Oct 25/Oct 08/Nov 22/Nov 6/Dec 20/Dec
Red
fin
0
200
400
600
800
1000
1200
Figure 6. Exotic freshwater fish larvae sampled downstream of Wellington, Lock 1 and Lock 6,
in 2008. Data presented as the mean of 6 replicates ± standard error.
4.1.2.2 Spatial variation in total larval abundance and species richness
There were significant spatial and seasonal differences in total larval abundance, although
these were not consistent throughout the season as indicated by a site-trip interaction (Table 4).
Pairwise analysis indicated significant differences in total abundance between Wellington, Lock
1 and Lock 6. This was mainly driven by differences in the number of fish larvae collected
downstream of Locks 1 and 6 in all trips, with the exception of late December (Figure 7). In
general, differences in total abundance between Wellington and Lock 6 were not significant
throughout the season, with the exception of mid-season trips.
Spatial variation in species richness occurred, but was not consistent through time (Table 4).
Pairwise analysis indicated significant differences in the early season, which were driven by the
low number of species collected downstream of Lock 6 in October (Figure 7).

Bucater et al. 2009
20
Table 4. Two-way univariate PERMANOVA for total larval abundance and species richness in 2008, amongst site and trip. Bold text indicates significant value.
Total abundance Species richness
Source of variation df MS p MS p
Site 2 6471.0 0.185 5017.7 0.019
Trip 5 3692.6 0.001 781.6 0.006
Site x Trip 10 3340.5 0.001 1054.4 0.001
Residual 90 698.9 203.4
0
500
1000
1500
2000
2500 D/S Wellington D/S Lock 1D/S Lock 6
Mea
n to
tal a
bund
ance
(lar
vae
per 1
000m
3 )
Sampling date
11/Oct 25/Oct 08/Nov 22/Nov 6/Dec 20/Dec
Spec
ies
richn
ess
0
1
2
3
4
5
6
Figure 7. Comparison of total abundance (fish per 1000 m3) and species richness of fish larvae
collected during 2008 downstream of Wellington, Lock 1 and Lock 6. Data presented as the
mean of 6 replicates ± standard error.

Bucater et al. 2009
21
4.1.2.3 Spatial variation in larval assemblage structure with reference to environmental variables
There were significant spatial and seasonal differences in the larval assemblage structure in
2008, however, as indicated by the significant site-trip interaction, the patterns of differences
were not consistent (Table 5). Pairwise analysis failed to detect any patterns in the differences.
Fish assemblage structure was different between all sites throughout the season.
Table 5. Two-way multivariate PERMANOVA for assemblage structure in 2008, among site and trip. Bold text indicates significant value.
Assemblage structure
Source of variation df MS p
Site 2 19996 0.07
Trip 5 5221.4 0.001
Site x Trip 10 9109.6 0.001
Residual 90 1088.8
Spatial differences between Wellington, Lock 1 and Lock 6 were generally driven by
abundances of Australian smelt, flathead gudgeon, carp gudgeon and bony herring (Table 6).
When comparing Wellington with Locks 1 and 6, the presence of the estuarine common
galaxias and lagoon goby and the exotic freshwater redfin perch, also contributed to the
differences between the sites. Wellington and Lock 6 had more similar mean abundances of
flathead gudgeon, carp gudgeon and Australian smelt, accounting for the similarities between
these sites (Table 6).
Bucater et al. 2009
22
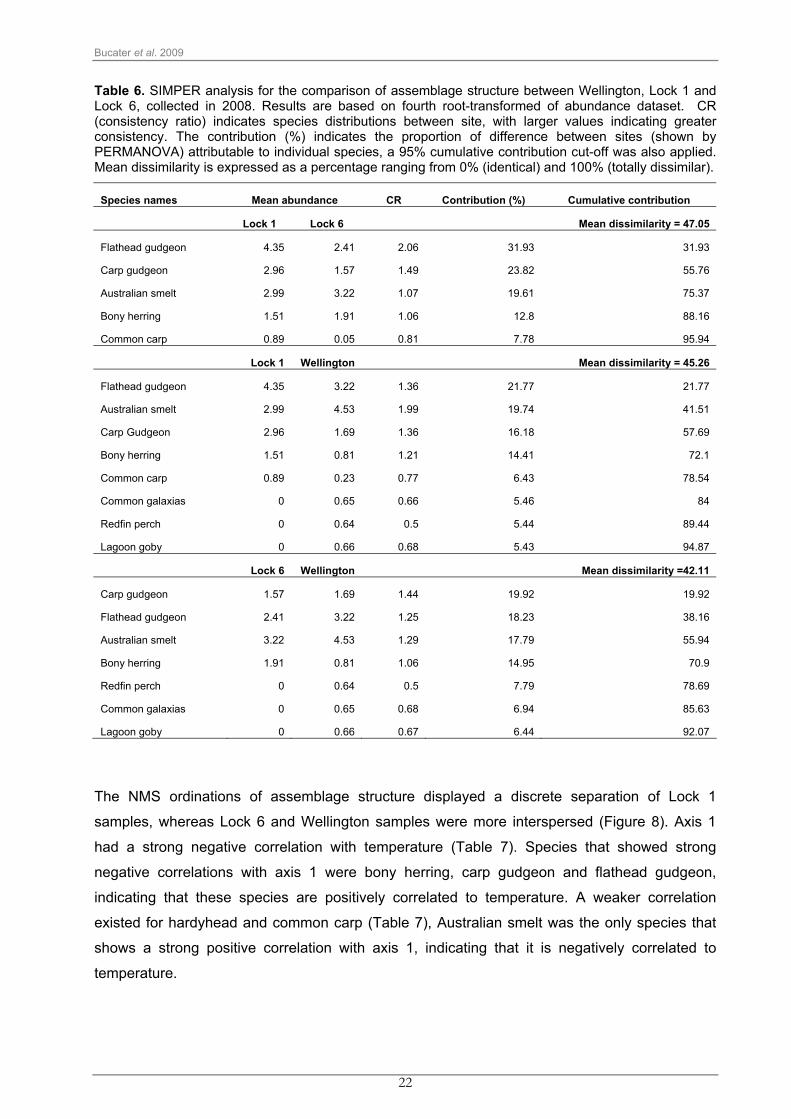
Table 6. SIMPER analysis for the comparison of assemblage structure between Wellington, Lock 1 and Lock 6, collected in 2008. Results are based on fourth root-transformed of abundance dataset. CR (consistency ratio) indicates species distributions between site, with larger values indicating greater consistency. The contribution (%) indicates the proportion of difference between sites (shown by PERMANOVA) attributable to individual species, a 95% cumulative contribution cut-off was also applied. Mean dissimilarity is expressed as a percentage ranging from 0% (identical) and 100% (totally dissimilar).
Species names Mean abundance CR Contribution (%) Cumulative contribution
Lock 1 Lock 6 Mean dissimilarity = 47.05
Flathead gudgeon 4.35 2.41 2.06 31.93 31.93
Carp gudgeon 2.96 1.57 1.49 23.82 55.76
Australian smelt 2.99 3.22 1.07 19.61 75.37
Bony herring 1.51 1.91 1.06 12.8 88.16
Common carp 0.89 0.05 0.81 7.78 95.94
Lock 1 Wellington Mean dissimilarity = 45.26
Flathead gudgeon 4.35 3.22 1.36 21.77 21.77
Australian smelt 2.99 4.53 1.99 19.74 41.51
Carp Gudgeon 2.96 1.69 1.36 16.18 57.69
Bony herring 1.51 0.81 1.21 14.41 72.1
Common carp 0.89 0.23 0.77 6.43 78.54
Common galaxias 0 0.65 0.66 5.46 84
Redfin perch 0 0.64 0.5 5.44 89.44
Lagoon goby 0 0.66 0.68 5.43 94.87
Lock 6 Wellington Mean dissimilarity =42.11
Carp gudgeon 1.57 1.69 1.44 19.92 19.92
Flathead gudgeon 2.41 3.22 1.25 18.23 38.16
Australian smelt 3.22 4.53 1.29 17.79 55.94
Bony herring 1.91 0.81 1.06 14.95 70.9
Redfin perch 0 0.64 0.5 7.79 78.69
Common galaxias 0 0.65 0.68 6.94 85.63
Lagoon goby 0 0.66 0.67 6.44 92.07
The NMS ordinations of assemblage structure displayed a discrete separation of Lock 1
samples, whereas Lock 6 and Wellington samples were more interspersed (Figure 8). Axis 1
had a strong negative correlation with temperature (Table 7). Species that showed strong
negative correlations with axis 1 were bony herring, carp gudgeon and flathead gudgeon,
indicating that these species are positively correlated to temperature. A weaker correlation
existed for hardyhead and common carp (Table 7), Australian smelt was the only species that
shows a strong positive correlation with axis 1, indicating that it is negatively correlated to
temperature.

Bucater et al. 2009
23
Axis 2 was significantly positively correlated to conductivity, dissolved oxygen and pH and
negatively correlated to temperature; the strongest correlation was with conductivity (Table 7).
Australian smelt, carp gudgeon, flathead gudgeon, common carp, redfin perch, lagoon goby and
Gobidae had significant positive correlations to axis 2, indicating higher abundances occurred in
conjunction with higher conductivity, dissolved oxygen and pH and lower temperature.
Figure 8. Non-metric MDS ordination (2-dimensional plot) for assemblage structure (stress
0.18) comparing sites downstream of Wellington, Lock 1 and Lock 6. Superimposed vectors for
species and the characterising environmental variables are presented, an R2 cut- off of 0.1 was
applied. Refer to table 7 for species codes.

Bucater et al. 2009
24
Table 7. Pearson (r) and Kendall (τ) correlation coefficients between each NMS axis and the environmental variables and species. (Critical τ value for significance at 0.05 = 0.205). Bold text indicates significant correlations.
Axis 1 Axis 2 Species code r τ r τ
EC 0.047 0.017 0.614 0.421
Temp -0.348 -0.268 -0.418 -0.262
DO -0.002 0.033 0.462 0.301
pH -0.092 -0.017 0.324 0.231
Australian smelt Ret sem 0.703 0.543 0.386 0.275
Bony herring Nem ere -0.763 -0.550 -0.267 -0.169
Carp gudgeon Hyp spp -0.762 -0.602 0.448 0.285
Flathead gudgeon Phi gra -0.847 -0.643 0.395 0.300
Hardyhead Cra spp -0.387 -0.302 0.159 0.155
Freshwater catfish Tan tan -0.047 -0.037 -0.030 -0.032
Common carp Cyp car -0.327 -0.239 0.276 0.252
Redfin perch Per flu 0.153 0.178 0.463 0.336
Common galaxias Gal mac 0.204 0.203 0.202 0.163
Lagoon goby Tas las 0.041 0.074 0.517 0.363
Gobidae Gobidae -0.089 -0.066 0.307 0.255

Bucater et al. 2009
25
4.2 INTER-ANNUAL AND SPATIAL VARIATION DOWNSTREAM OF LOCK 1 AND LOCK 6 FROM 2005 TO 2008
4.2.1 Environmental variables 2005-2008 (from DWLBC data)
All environmental variables showed a significant year-site-trip interaction, indicating that while
inter-annual and spatial variation occurred, it was not consistent through time (Table 8). Flow
variability downstream of Locks 1 and 6 was greatest in 2005, reduced in 2006 and 2007, and
became stable in 2008 (Figure 9a). Discharge was similar within years, but different between
both Locks, likely being a result of geographical placement.
Water level differed between years and sites. It was higher downstream of Lock 6, due to
management of the weir pools. Over the four years, there was a steady decrease in water level
downstream of Locks 6 and 1 (Figure 9b).
Temperature showed no consistent patterns between sites; within sites the seasonal pattern
was relatively consistent, with temperature increasing steadily from spring to late summer.
Temperatures in 2007 and 2008 were slightly lower when compared to 2005 and 2006 (Figure
9c).
Conductivity within each site showed an increase from 2005, peaking in 2007, followed by a
slight decrease in 2008 (Figure 9d). The values recorded downstream of both Locks almost
doubled from 2005 to 2007. Spatially, conductivity was always significantly higher downstream
of Lock 1.
Table 8. Three-way univariate PERMANOVA for differences among years, sites and trips for discharge, water level, temperature and salinity. Bold text indicates significant value.
Discharge Water level Temperature Conductivity
Source of variation df MS p MS p MS p MS p
Year 3 84.09 0.001 0.19 0.009 1.13 0.583 19.16 0.217
Site 1 0.68 0.773 286.26 0.001 0.21 0.742 164.52 0.003
Trip 5 1.32 0.285 0.00 0.126 15.95 0.001 1.33 0.594
Year x Site 3 1.41 0.001 0.04 0.001 2.06 0.347 10.95 0.001
Year x Trip 15 0.94 0.001 0.00 0.59 1.20 0.771 0.74 0.003
Site x Trip 5 0.19 0.304 0.00 0.103 1.51 0.537 0.96 0.002
Year x Site x Trip 15 0.14 0.001 0.00 0.001 1.73 0.001 0.17 0.001
Residual 240 0.02 0.00 0.61 0.03

Bucater et al. 2009
26
Dis
char
ge (M
L pe
r day
)
02000400060008000
10000120001400016000 2006 2007
01/O
ct/07
15/O
ct/07
29/O
ct/07
12/Nov
/07
26/Nov
/07
10/Dec
/07
24/Dec
/07
2005W
ater
leve
l (m
AHD
)
-1.0
-0.5
0.0
0.5
1.0
1.5
Tem
pera
ture
(o C)
10
15
20
25
30
(a)
(b)
(c)
(d)
D/S
Loc
k 1
wat
er le
vel (
mAH
D)
2008
Lock 1 Lock 6
06/O
ct/08
20/O
ct/08
03/Nov
/08
17/Nov
/08
01/Dec
/08
15/Dec
/08
29/Dec
/08
D/S
Lock 6 water level (m
AH
D)16.0
16.2
16.4
16.6
16.8
17.0
17.2
17.4
03/O
ct/05
17/O
ct/05
31/O
ct/05
14/Nov
/05
28/Nov
/05
12/Dec
/05
26/Dec
/05
Con
duct
ivity
(µS/
cm)
0
200
400
600
800
Date02
/Oct/
06
16/O
ct/06
30/O
ct/06
13/Nov
/06
27/Nov
/06
11/Dec
/06
25/Dec
/06
Figure 9. Comparison of the environmental conditions between 2005, 2006, 2007 and 2008, downstream of Locks 1 and 6, a) discharge (MLd-1), b) water level (mAHD), c) mean daily water temperature (°C) and d) mean daily electrical conductivity (µS/cm at 25 oC).

Bucater et al. 2009
27
4.2.2 Larval assemblage 2005-2008
4.2.2.1 Catch summary
The total number of fish larvae caught increased from 2005 to 2007, but then decreased in 2008
to a similar level as recorded in 2006. Catch rates downstream of Lock 1 were consistently
greater than those downstream of Lock 6, in all years of the survey (Table 9). Eleven species
were collected throughout the study, comprising of nine native and two exotic freshwater
species.
The small-bodied native species, Australian smelt, bony herring, carp gudgeons and flathead
gudgeon, were the most abundant of the larval catch (Table 9, Figure 10). Additional species
sampled included freshwater catfish, Murray cod, golden perch, silver perch and hardyheads
(Figure 11). The exotic species were common carp and redfin perch (Table 9, Figure 12).
Freshwater catfish were collected in low numbers in 2007 (Cheshire and Ye 2008a), however, it
is not shown in these results due to the reduction of replicates from eight in previous years to
six in 2008, as random selection of samples from 2007 did not include those with catfish larvae
present.

Bucater et al. 2009
28
Table 9. Total number of freshwater fish larvae collected downstream of Locks 1 and 6 in 2005, 2006, 2007 and 2008.
Species D/S Lock 1 D/S Lock 6 Total
Common name Scientific name 2005 2006 2007 2008 2005 2006 2007 2008 2005 2006 2007 2008 Australian smelt Retropinna semoni 1,100 4,964 8,951 630 193 3,143 7,797 3,421 1,293 8,107 16,748 4,051 Bony herring Nematalosa erebi 633 1,435 117 348 83 618 3,530 357 717 2,053 3,647 705 Carp gudgeon Hypseleotris spp. 694 998 4,885 1,991 359 565 2,486 350 1,053 1,563 7,371 2,341 Flathead gudgeon Philypnodon grandiceps 186 2,475 6,674 6,931 282 821 2,336 489 468 3,296 9,010 7,420 Hardyhead Craterocephalus spp. 3 5 14 34 1 51 10 1 4 56 24 35 Murray cod Maccullochella peelii peelii 2 0 0 0 2 3 2 0 4 3 2 0 Freshwater catfish Tandanus tandanus 1 0 0 0 7 3 0 4 7 3 0 4 Golden perch Macquaria ambigua 0 0 0 0 26 0 0 0 26 0 0 0 Silver perch Bidyanus bidyanus 0 0 0 0 9 0 0 0 9 0 0 0 Carp Cyprinus carpio 2 0 9 109 10 1 4 3 12 1 13 112
Redfin Perca fluviatilis 0 0 5 0 1 12 0 0 1 12 5 0
Total 2,621 9,877 20,655 10,043 972 5,217 16,165 4,625 3,593 15,094 36,820 14,668
Yearly % catch 72.9 65.4 56.1 62.7 27.1 34.6 43.9 37.3

Bucater et al. 2009
29
2007
Bon
y he
rrin
gFl
athe
ad g
udge
onC
arp
gudg
eon
Rel
ativ
e ab
unda
nce
(fish
per
100
0m3)
0300600900
120015001800
Aust
ralia
n sm
elt
0
500
1000
1500
2000
11/Oct25/Oct
08/Nov22/Nov
6/Dec20/Dec
11/Oct25/Oct
08/Nov22/Nov
6/Dec20/Dec
0300600900
120015001800
Date
11/Oct25/Oct
08/Nov22/Nov
6/Dec20/Dec
20062005
0
1000
2000
3000
4000 D/S Lock 1D/S Lock 6
2008 Discharge (M
L per day)0200040006000800010000120001400016000
Discharge Lock 1 Discharge Lock 6
11/Oct25/Oct
08/Nov22/Nov
6/Dec20/Dec
Figure 10. Small-bodied freshwater native fish larvae for 2005, 2006, 2007 and 2008 sampling events downstream of Locks 1 and 6. Data presented as the mean of the 6 replicates ± standard error. Water discharge downstream of Locks 1 and 6 is also presented for this period.
Bucater et al. 2009
30
Fres
hwat
er c
atfis
hS
ilver
per
chG
olde
n pe
rch
Rel
ativ
e ab
unda
nce
(fish
per
100
0m3)
0123456
Mur
ray
cod
0
5
10
15
11/Oct25/Oct
08/Nov22/Nov
6/Dec20/Dec
11/Oct25/Oct
08/Nov22/Nov
6/Dec20/Dec
0
1
2
3
4
5
Date
11/Oct25/Oct
08/Nov22/Nov
6/Dec20/Dec
11/Oct25/Oct
08/Nov22/Nov
6/Dec20/Dec
Discharge (M
L per day)0200040006000800010000120001400016000 Discharge Lock 1
Discharge Lock 6
200820072005
0
1
2
3
4
5
2006
D/S Lock 1D/S Lock 6
Figure 11. Large-bodied freshwater native fish larvae for the 2005, 2006, 2007 and 2008 sampling events downstream of Locks 1 and 6. Data presented as the mean of 6 replicates ± standard error. Water discharge downstream of Locks 1 and 6 is also presented for this period.

Bucater et al. 2009
31
Com
mon
car
p
20072005
0
4
8
12
16
20
2006
Red
fin p
erch
11/Oct25/Oct
08/Nov22/Nov
6/Dec20/Dec
11/Oct25/Oct
08/Nov22/Nov
6/Dec20/Dec
0
2
4
6
8
10
Date
11/Oct25/Oct
08/Nov22/Nov
6/Dec20/Dec
Rel
ativ
e ab
unda
nce
(fish
per
100
0m3)
Discharge (M
L per day)0200040006000800010000120001400016000
2008
11/Oct25/Oct
08/Nov22/Nov
6/Dec20/Dec
50.57 Discharge Lock 1 Discharge Lock 6
D/S Lock 1D/S Lock 6
Figure 12. Exotic freshwater species fish larvae for the 2005, 2006, 2007 and 2008 sampling events downstream of Locks 1 and 6. Data presented as the mean of 6 replicates ± standard error. Water discharge downstream of Locks 1 and 6 is also presented for this period.
.

Bucater et al. 2009
32
4.2.2.2 Inter-annual and spatial variation in total larval abundance and species richness
Overall there were significant inter-annual and spatial differences in the total larval abundance,
however, as indicated by the significant year-site-trip interaction, the patterns of differences
were not consistent (Table 10). Pairwise analysis demonstrated a significant variation in total
abundance between all years downstream of Lock 1, while significant differences occurred
between 2005 and 2007 downstream of Lock 6. Where differences were identified between
years, total larval abundance was highest at all sites in 2007 (Figure 13c & d). In general,
significant spatial differences occurred in all years, however, the patterns of differences were
not consistent. Furthermore, where site differences were identified, the total abundance
downstream of Lock 1 was always significantly higher, except for November and December
2007 (Figure 13c).
There were significant inter-annual and spatial differences detected for species richness,
however, these patterns were not consistent as indicated by the significant year-site-trip
interaction (Table 10). Pairwise analysis detected significant differences between all years, but
only during October and early November, downstream of both Locks. In general, there was no
spatial variation in species richness throughout the time, except for the early season of 2008
(Figure 13). Total species richness ranged from one to five at any one point in time (Figure 13),
however, the greatest species richness occurred in 2005 downstream of Lock 6, where eleven
species were collected (Table 9).
Table 10. Three-way univariate PERMANOVA for total larval abundance and species richness among years, site and trip. Bold text indicates significant value.
Total abundance Species richness
Source of variation df MS p MS p
Year 3 48943.0 0.002 772.8 0.906
Site 1 12447.0 0.504 1062.5 0.774
Trip 5 3605.7 0.322 1788..0 0.004
Year x Site 3 12376.0 0.008 2229.8 0.010
Year x Trip 15 1968.2 0.892 343.1 0.875
Site x Trip 5 3732.9 0.326 390.1 0.693
Year x Site x Trip 15 3115.6 0.001 564.4 0.002
Residual 240 1147.9 230.8

Bucater et al. 2009
33
(a)
0
1000
2000
3000
4000
5000
(b)
Mea
n to
tal a
bund
ance
(lar
vae
per 1
000m
3 )
0
1000
2000
3000
4000
5000
(c)
0
1000
2000
3000
4000
5000
0
1
2
3
4
5
6 D/S Lock 1 D/S Lock 6
Spec
ies
Ric
hnes
s0
1
2
3
4
5
6
Sampling Date
11-Oct 25-Oct 08-Nov 22-Nov 06-Dec 20-Dec0
1
2
3
4
5
6
0
1
2
3
4
5
6
(d)
11-Oct 25-Oct 08-Nov 22-Nov 06-Dec 20-Dec0
1000
2000
3000
4000
5000
(a)
(b)
(c)
(d)
Figure 13. Comparison of total abundance and species richness of fish larvae collected in a) 2005, b) 2006, c) 2007 and d) 2008 sampling events downstream of Locks 1 and 6. Data presented as the mean of 6 replicates ± standard error.

Bucater et al. 2009
34
4.2.2.3 Inter-annual and spatial variation in larval assemblage structure with reference to environmental variables
There were significant inter-annual, spatial and seasonal differences in assemblage structure
downstream of Locks 1 and 6, however, the patterns of differences were not consistent, as
indicated by the significant year-site-trip interaction (Table 11). Pairwise results indicated that
inter-annual variation occurred between all years, downstream of Lock 1 and between 2005,
2006 and 2008 downstream of Lock 6. Significant spatial differences occurred in all years,
however, in 2006 it was only identified in late December.
Table 11. Three-way multivariate PERMANOVA for differences in assemblage structure among year, site and trip. Bold text indicates significant value.
Assemblage structure
Source of variation df MS p
Year 3 38516 0.076
Site 1 27906 0.343
Trip 5 19259 0.001
Year x Site 3 24651 0.001
Year x Trip 15 4992 0.243
Site x Trip 5 4108 0.537
Year x Site x Trip 15 4247 0.001
Residual 240 1664
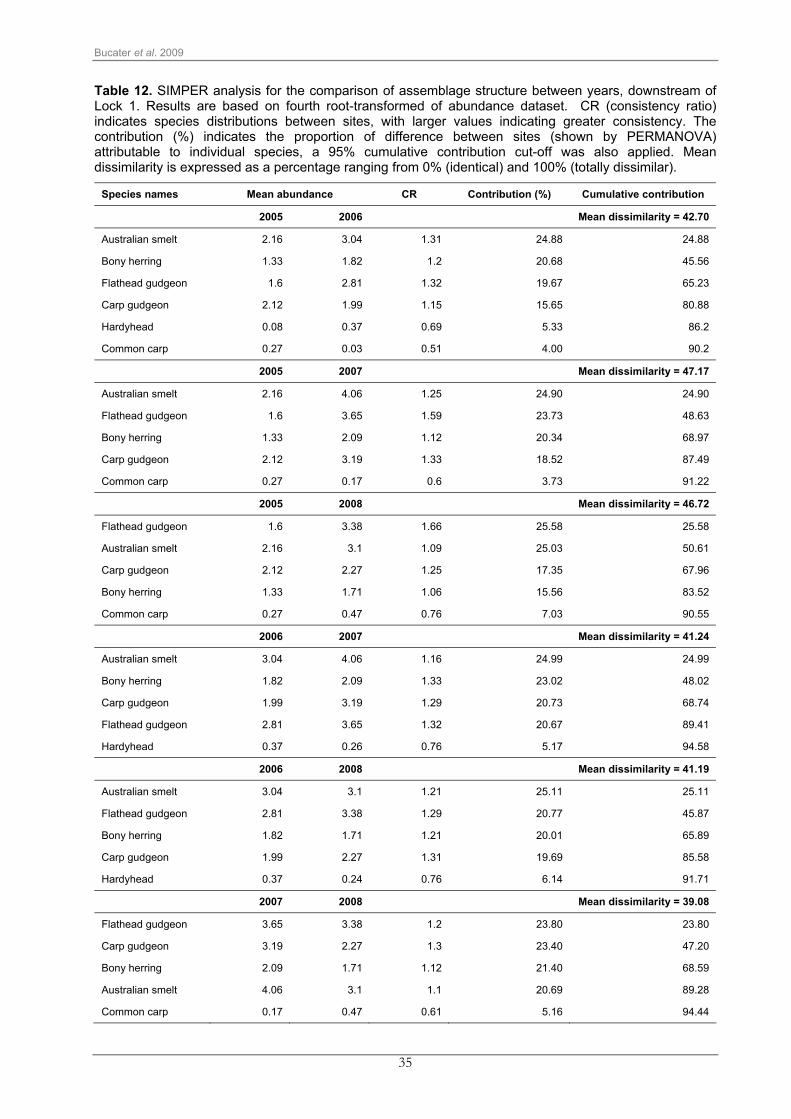
Inter-annual variation between samples collected downstream of Locks 1 and 6 was mainly
driven by abundances of Australian smelt, bony herring, flathead gudgeon, and carp gudgeon
(Table 12, Table 13). At both sites, Australian smelt, bony herring and flathead gudgeon
showed an increase in abundance from 2005 to 2007 followed by a decrease in 2008. Carp
gudgeon, however, was captured in higher abundance in 2007 and 2008, downstream of Lock
1, while downstream of Lock 6 it peaked in 2007 followed by a substantial decrease in 2008,
reaching lower abundance when compared to numbers recorded in 2005 and 2006. (Table 12,
Table 13).
In all years, spatial variation between samples collected downstream of Locks 1 and 6 was
driven by differences in abundance of Australian smelt, bony herring, flathead gudgeon and
carp gudgeon, which in most cases occurred in higher abundances downstream of Lock 1
(Table 14). Additionally in 2005, common carp, golden perch and silver perch also contributed
to spatial variation, occurring in higher abundances downstream of Lock 6 (Table 14).
Bucater et al. 2009
35
Table 12. SIMPER analysis for the comparison of assemblage structure between years, downstream of Lock 1. Results are based on fourth root-transformed of abundance dataset. CR (consistency ratio) indicates species distributions between sites, with larger values indicating greater consistency. The contribution (%) indicates the proportion of difference between sites (shown by PERMANOVA) attributable to individual species, a 95% cumulative contribution cut-off was also applied. Mean dissimilarity is expressed as a percentage ranging from 0% (identical) and 100% (totally dissimilar).
Species names Mean abundance CR Contribution (%) Cumulative contribution
2005 2006 Mean dissimilarity = 42.70
Australian smelt 2.16 3.04 1.31 24.88 24.88
Bony herring 1.33 1.82 1.2 20.68 45.56
Flathead gudgeon 1.6 2.81 1.32 19.67 65.23
Carp gudgeon 2.12 1.99 1.15 15.65 80.88
Hardyhead 0.08 0.37 0.69 5.33 86.2
Common carp 0.27 0.03 0.51 4.00 90.2
2005 2007 Mean dissimilarity = 47.17
Australian smelt 2.16 4.06 1.25 24.90 24.90
Flathead gudgeon 1.6 3.65 1.59 23.73 48.63
Bony herring 1.33 2.09 1.12 20.34 68.97
Carp gudgeon 2.12 3.19 1.33 18.52 87.49
Common carp 0.27 0.17 0.6 3.73 91.22
2005 2008 Mean dissimilarity = 46.72
Flathead gudgeon 1.6 3.38 1.66 25.58 25.58
Australian smelt 2.16 3.1 1.09 25.03 50.61
Carp gudgeon 2.12 2.27 1.25 17.35 67.96
Bony herring 1.33 1.71 1.06 15.56 83.52
Common carp 0.27 0.47 0.76 7.03 90.55
2006 2007 Mean dissimilarity = 41.24
Australian smelt 3.04 4.06 1.16 24.99 24.99
Bony herring 1.82 2.09 1.33 23.02 48.02
Carp gudgeon 1.99 3.19 1.29 20.73 68.74
Flathead gudgeon 2.81 3.65 1.32 20.67 89.41
Hardyhead 0.37 0.26 0.76 5.17 94.58
2006 2008 Mean dissimilarity = 41.19
Australian smelt 3.04 3.1 1.21 25.11 25.11
Flathead gudgeon 2.81 3.38 1.29 20.77 45.87
Bony herring 1.82 1.71 1.21 20.01 65.89
Carp gudgeon 1.99 2.27 1.31 19.69 85.58
Hardyhead 0.37 0.24 0.76 6.14 91.71
2007 2008 Mean dissimilarity = 39.08
Flathead gudgeon 3.65 3.38 1.2 23.80 23.80
Carp gudgeon 3.19 2.27 1.3 23.40 47.20
Bony herring 2.09 1.71 1.12 21.40 68.59
Australian smelt 4.06 3.1 1.1 20.69 89.28
Common carp 0.17 0.47 0.61 5.16 94.44

Bucater et al. 2009
36
Table 13. SIMPER analysis for the comparison of assemblage structure between years, downstream of Lock 6. Results are based on fourth root-transformed of abundance dataset. CR (consistency ratio) indicates species distributions between sites, with larger values indicating greater consistency. The contribution (%) indicates the proportion of difference between sites (shown by PERMANOVA) attributable to individual species, a 95% cumulative contribution cut-off was also applied. Mean dissimilarity is expressed as a percentage ranging from 0% (identical) and 100% (totally dissimilar).
Species names Mean abundance CR Contribution (%) Cumulative contribution
2005 2006 Mean dissimilarity = 48.33
Australian smelt 1.63 2.7 1.3 23.63 23.63
Bony herring 0.58 1.42 1.04 17.68 41.31
Flathead gudgeon 1.65 2.37 1.12 16.16 57.47
Carp gudgeon 1.91 1.93 1.05 13.4 70.87
Hardyhead 0.05 0.62 0.91 7.3 78.17
Common carp 0.43 0.07 0.71 5.98 84.15
Golden perch 0.34 0.00 0.49 4.13 88.28
Redfin perch 0.03 0.30 0.51 3.77 92.05
2005 2007 Mean dissimilarity = 52.74
Australian smelt 1.63 4.26 1.35 26.28 26.28
Bony herring 0.58 2.97 1.27 23.96 50.24
Flathead gudgeon 1.65 3.29 1.4 18.76 69
Carp gudgeon 1.91 3.08 1.32 15.86 84.86
Common carp 0.43 0.16 0.75 4.63 89.49
Golden perch 0.34 0.00 0.5 3.02 92.51
2005 2008 Mean dissimilarity = 54.82
Australian smelt 1.63 3.95 1.47 31.77 31.77
Carp gudgeon 1.91 1.22 1.34 17.68 49.45
Flathead gudgeon 1.65 1.81 1.24 16.85 66.3
Bony herring 0.58 1.47 1.09 16.19 82.49
Common carp 0.43 0.09 0.7 5.79 88.29
Golden perch 0.34 0.00 0.49 3.92 92.21
2006 2007 Mean dissimilarity = 41.32
Bony herring 1.42 2.97 1.35 26.02 26.02
Australian smelt 2.70 4.26 1.09 23.24 49.26
Carp gudgeon 1.93 3.08 1.29 18.33 67.59
Flathead gudgeon 2.37 3.29 1.34 17.84 85.43
Hardyhead 0.62 0.23 0.94 6.79 92.22
2006 2008 Mean dissimilarity = 44.60
Australian smelt 2.70 3.95 1.19 25.82 25.82
Bony herring 1.42 1.47 1.17 20.19 46.01
Flathead gudgeon 2.37 1.81 1.23 19.29 65.3
Carp gudgeon 1.93 1.22 1.31 18.89 84.18
Hardyhead 0.62 0.04 0.89 7.35 91.53

Bucater et al. 2009
37
Table 13. cont.
Species names Mean abundance CR Contribution (%) Cumulative contribution
2007 2008 Mean dissimilarity =41.09
Bony herring 2.97 1.47 1.28 27.4 27.4
Carp gudgeon 3.08 1.22 1.45 25.37 52.77
Flathead gudgeon 3.29 1.81 1.31 23.45 76.21
Australian smelt 4.26 3.95 1 17.21 93.42
Table 14. SIMPER analysis for the comparison of assemblage structure between Lock1 and Lock 6, in 2005, 2006, 2007 and 2008. Results are based on fourth root-transformed of abundance dataset. CR (consistency ratio) indicates species distributions between sites, with larger values indicating greater consistency. The contribution (%) indicates the proportion of difference between sites (shown by PERMANOVA) attributable to individual species, a 90% cumulative contribution cut-off was also applied. Mean dissimilarity is expressed as a percentage ranging from 0% (identical) and 100% (totally dissimilar).
Species names Mean abundance CR Contribution (%) Cumulative contribution
2005 Lock 1 Lock 6 Mean dissimilarity = 41.85
Bony herring 2.11 0.58 1.46 27.33 27.33
Australian smelt 2.71 1.63 1.24 19.32 46.65
Carp gudgeon 2.35 1.91 1.13 15.82 62.46
Flathead gudgeon 1.56 1.65 1.13 14.45 76.91
Common Carp 0.11 0.43 0.73 7.18 84.09
Golden perch 0 0.34 0.5 4.87 88.96
Silver perch 0 0.27 0.5 3.96 92.92
2006 Lock 1 Lock 6 Mean dissimilarity = 40.86
Australian smelt 3.38 2.7 1.31 27.87 27.87
Bony herring 2.22 1.42 1.26 23.74 51.6
Flathead gudgeon 3.24 2.37 1.3 18.05 69.65
Carp gudgeon 2.05 1.93 1.25 16.57 86.23
Hardyhead 0.13 0.62 0.96 7.18 93.41
2007 Lock 1 Lock 6 Mean dissimilarity =38.81
Bony herring 1.2 2.97 1.4 24.41 24.41
Flathead gudgeon 4.02 3.29 1.31 22.94 47.35
Australian smelt 3.85 4.26 1.02 21.93 69.28
Carp gudgeon 3.31 3.08 1.29 21.86 91.14
2008 Lock 1 Lock 6 Mean dissimilarity =48.62
Flathead gudgeon 4.95 1.81 1.66 30.71 30.71
Carp gudgeon 3.31 1.22 1.49 22.94 53.64
Australian smelt 2.26 3.95 1.29 19.9 73.54
Bony herring 1.95 1.47 1.25 15.13 88.67
Common Carp 0.85 0.09 0.79 7.12 95.79

Bucater et al. 2009
38
The NMS ordination of assemblage composition displayed a distinct separation of 2005
samples, whereas 2006, 2007, and 2008 were more interspersed (Figure 14). Axis 1 indicated a
strong negative correlation with discharge and water level and a positive correlation with
conductivity (Table 15). Significant positive correlations with axis 1 were identified for Australian
smelt, carp gudgeon and flathead gudgeon; hardyheads were also positively correlated,
although this correlation is relatively low (Table 15). These results indicate that these species
are negatively correlated to discharge and water levels, but positively correlated to conductivity.
Species with significant negative correlations to axis 1 were freshwater catfish, golden perch
and silver perch, however, the correlation coefficients are relatively low therefore, should be
interpreted cautiously.
Axis 2 was significantly positively correlated to temperature (Table 15). Australian smelt and
redfin perch had significant negative correlations to axis 2, indicating higher abundances during
lower temperatures. Bony herring, carp gudgeon, flathead gudgeon and hardyheads had
positive correlations with axis 2, indicating higher abundances occurred in conjunction with
warmer temperatures.
Figure 14. Non-metric MDS ordination (2-dimensional plot) for assemblage structure (stress 0.19) comparing 2005, 2006, 2007 and 2008, downstream of Locks 1 and 6. Superimposed vectors for the characterising environmental variables are presented and an R2 cut- off of 0.2 was applied. Refer to table 15 for species codes.

Bucater et al. 2009
39
Table 15. Pearson (r) and Kendall (τ) correlation coefficients between each NMS axis and the environmental variables and species. (Critical τ value for significance at 0.05 = 0.124). Bold text indicates significant correlations.
Axis 1 Axis 2
Species code r τ r τ
Discharge -0.531 -0.390 0.000 -0.016
Conductivity 0.446 0.332 0.128 0.074
Temperature -0.179 -0.128 0.303 0.358
Water level -0.252 -0.327 -0.232 -0.153
Australian smelt Ret sem 0.562 0.429 -0.573 -0.429
Bony herring Nem ere 0.167 0.089 0.670 0.551
Carp gudgeon Hyp spp 0.443 0.307 0.652 0.502
Flathead gudgeon Phi gra 0.716 0.584 0.452 0.292
Hardyhead Cra spp 0.253 0.179 0.242 0.200
Murray cod Mac pee -0.056 -0.057 0.067 0.042
Freshwater catfish Tan tan -0.164 -0.127 0.108 0.098
Golden perch Mac amb -0.288 -0.189 0.029 0.040
Silver perch Bid bid -0.276 -0.170 0.012 0.009
Common carp Cyp car 0.175 0.122 0.029 -0.035
Redfin perch Per flu 0.109 0.060 -0.136 -0.135

Bucater et al. 2009
40
4.3 LOWER LAKES LARVAL ASSEMBLAGE
4.3.1 Environmental variables (from TDS field measurements)
Temperature ranged between 18.5 and 21.0 oC during larval fish sampling at three sites.
Conductivity showed a gradual increase in sites further downstream, and was highest at
Clayton. Dissolved oxygen and pH were relatively consistent between all sites. All
environmental variables represent spot measurements and should be interpreted cautiously.
Table 16. Environmental variables dissolved oxygen (ppm), electrical conductivity (µS/cm at 25 oC), pH
and water temperature (oC) in the Lower Lakes sites.
DO (ppm) Cond (uS) pH Temp (oC)
Pomanda island 10.74 3,220 8.69 21.00
Point Sturt 10.25 5,670 8.81 18.50
Clayton 9.50 10,050 8.61 19.40
4.3.2 Catch summary
In the pilot sampling of the Lower Lakes sites a total of 5,502 larvae were captured, eight
species were collected, which include four freshwater and four estuarine (Table 17). The small-
bodied estuarine species were present in greater numbers at Point Sturt and Clayton, however,
at Pomanda Island the freshwater species were dominant (Table 17). Catch of larvae at Clayton
was highest accounting for 77.1% of the total catch, followed by Point Sturt and Pomanda
Island, with 19.7% and 3.2%, respectively (Table 17).
Table 17. Total number of fish larvae collected at the Lower Lakes sites in 2008.
Species Species group Common name Scientific name Pomanda
IslandPoint Sturt
Clayton Total
Freshwater Australian smelt Retropinna semoni 53 10 13 76
Bony herring Nematalosa erebi 2 0 0 2
Carp gudgeon Hypseleotris spp. 9 0 0 9
Flathead gudgeon Philypnodon grandiceps 94 1 3 98
Estuarine Common galaxias Galaxias maculatus 0 0 6 6
Lagoon goby Tasmanogobius lasti 17 771 1,488 2,276
Bridled goby Arenigobius bifrenatus 0 43 1,161 1,204
Unidentified goby Gobidae 0 261 1,570 1,831
Total 175 1,086 4,241 5,502
Percentage of total catch 3.2 19.7 77.1

Bucater et al. 2009
41
4.3.3 Spatial variation
There was significant spatial variation in assemblage structure between all sites in the Lower
Lakes (Table 18). These differences were reflected in the NMS ordination, which displayed a
distinct separation of Clayton, Pomanda Island and Point Sturt (Figure 15). Axis 1 had a strong
positive correlation with conductivity and a negative correlation with dissolved oxygen (Table
19). A significant negative correlation was identified with axis 1 and carp gudgeon. Significant
positive correlations with axis 1 were identified for common galaxias, lagoon goby, bridled goby
and gobidae (Table 19). The results indicate that these species are positively correlated to
conductivity. No significant correlation were identified for axis 2, suggesting additional factors
may be influencing this separation of samples (Table 19).
Table 18. One-way multivariate PERMANOVA for differences in assemblage structure among sites. Bold text indicates significant value.
Source of variation df MS p
Site 2 9666.3 0.004
Residual 6 1128.2

Bucater et al. 2009
42
Figure 15. Non-metric MDS ordination (2-dimensional plot) for assemblage structure (stress 0.03) comparing Clayton, Pomanda island and Point Sturt. Superimposed vectors for the characterising environmental variables are presented and an R2 cut- off of 0.2 was applied. Refer to table 19 for species codes. Table 19. Pearson (r) and Kendall (τ) correlation coefficients between each NMS axis (figure 14) and the environmental variables and species. (Critical τ value for significance at 0.05 = 0.602). Bold text indicates significant correlations.
Axis 1 Axis 2 Species code r τ r τ
Conductivity 0.863 0.886 -0.018 0.086
Dissolved oxygen -0.825 -0.886 -0.104 -0.086
pH 0.047 -0.340 -0.727 -0.526
Temperature -0.821 -0.340 0.734 0.588
Australian smelt Ret sem -0.756 -0.479 0.547 0.423
Bony herring Nem ere -0.633 -0.473 0.370 0.301
Carp gudgeon Hyp spp -0.718 -0.618 0.484 0.400
Flathead gudgeon Phi gra -0.883 -0.319 0.418 0.261
Common galaxias Gal mac 0.491 0.645 0.117 0.043
Lagoon goby Tas las 0.761 0.667 -0.341 -0.333
Bridled goby Are bit 0.608 0.899 0.249 0.087
Gobidae Gobidae 0.533 0.783 0.091 -0.145

Bucater et al. 2009
43
5 DISCUSSION
5.1 SPATIAL VARIATION
Significant spatial variation was identified in total abundance, species richness and assemblage
structure between sites downstream of Locks 1 and 6, in 2005, 2006, 2007 and 2008; and
Wellington, Lock 1 and Lock 6 in 2008. Differences in larval assemblage were also observed in
the pilot study between the Lower Lakes sites: Pomanda Island, Clayton and Point Sturt. These
variations were mainly driven by the presence of highly abundant species (i.e. small-bodied
freshwater species at all sites except Point Sturt and Clayton, where estuarine species were
most abundant). Downstream of Locks 1 and 6 the larval assemblage was comprised
exclusively of freshwater species. In contrast, downstream of Wellington and in other Lower
Lakes sites, estuarine species were present, and showed a gradual increase in numbers
downstream toward the Murray estuary. This is likely due to the increased conductivity and
their geographical location closer to the Murray barrages. The Lower Lakes sites were
characterised by early-summer spawners or species with protracted spawning season, as
sampling was conducted only once in early December, 2008.
Although differences in micro-habitats and water quality within each region are likely to
contribute to the differences in species abundances (i.e. condition being more or less suited to
specific species), spatial differences between Locks 1 and 6 identified in this study, are more
likely to be due to differences in the habitats of the regions surrounding these sites. The
floodplain region, surrounding Lock 6, is a wide floodplain (5-10 km), the main channel is
characterised by large woody debris (LWD) and macrophytes; it has a high diversity of off-
channel habitats including anabranch channels, billabongs and wetlands (Walker and Thoms
1993; Young 2001). The lowland gorge, surrounding Lock 1, is an incised section characterised
by limestone cliffs with a constrained floodplain (2-3 km); off-channel habitats are less diverse,
being restricted to wetlands, but there is a higher number in comparison to the floodplain region
(Walker and Thoms 1993; Young 2001). These habitat differences, particularly the higher
number of wetlands, may contribute to the higher abundances of the small-bodied species in
the gorge region, as these species are able to exploit both the wetlands and main channel
environments (CRCFE 2003; Humphries et al. 1999; King et al. 2003). This may also account
for the lower abundances, and indeed absence from 2006-2008, of large-bodied fish species
downstream of Lock 1, although further research is needed on habitat associations of larvae
and juveniles.
Observed spatial differences in the assemblage structure between the Lower Lakes sites, and
between Wellington and both Locks are likely to be driven by differences in conductivity.
Significant correlations were identified with conductivity, dissolved oxygen and pH for Australian
smelt, carp gudgeon, flathead gudgeon, common carp, redfin perch, common galaxias, lagoon
Bucater et al. 2009
44
goby, bridled goby and gobidae. Some species were more strongly correlated with increasing
temperature, however, is likely to be a result of the seasonal nature of fish spawning.
Freshwater fish in the Lower River Murray have been identified to have three spawning periods
within the season: spring, spring/summer and summer (Cheshire unpublished data). There is a
paucity of information on the dissolved oxygen and pH requirements on the early life stages of
many MDB fish species (Alton et al. In preparation), however, conductivity is most likely to be a
key driver for the observed spatial differences in this study.
While salinity tolerances of the early life stages for Australian native fish are still in need of
further investigation, recent research suggests most species have relatively high tolerances
(McNeil et al. in preparation), at least under relatively short term exposure. Adults have been
documented to have relatively high tolerance for freshwater species, which is likely due to
relatively recent divergences from marine ancestors (Williams and Williams 1991). Australian
smelt, carp gudgeon, flathead gudgeon, common carp and redfin perch all have relatively high
salinity tolerances and broad habitat associations. Given these tolerances they can be found
throughout the Lower River Murray in SA, in both main channel and off-channel habitats
including large floodplain lakes, billabongs, small terminal lakes and small and large
anabranches (Cadwallader and Backhouse 1983; Lloyd and Walker 1986; Mallen-Cooper
2001).
Estuarine species were only collected downstream of Wellington and in the Lower Lakes.
Common galaxias, a diadromous species, usually migrate downstream to spawn in autumn,
assuming a catadromous migration with a marine larval phase (Becker et al. 2005). Common
galaxias larvae collected downstream of Wellington are likely to have developed from a
landlocked population; given the lack of connectivity between the Lower Lakes and the
Coorong. Adult galaxias may make a short migration upstream to spawn in spring. These
results support findings by Pollard (1971) and Becker et al. (2005) in Victoria. The lagoon goby,
an estuarine species which is also able to complete its lifecycle in freshwater streams and lakes
(Lintermans 2007), was collected downstream of Wellington, among other unidentified gobidae
species. The Gobioidei is one of the most diverse groups of teleost, compromising
approximately 2,000 species and 270 genera (Gill et al. 1996), with very similar morphologies,
hence the difficulties associated with identification of individual species (Miskiewicz Pers.
Comm.).

Bucater et al. 2009
45
5.2 INTERANNUAL VARIATION DOWNSTREAM OF LOCKS 1 AND 6, FROM 2005-2008
Environmental variables: discharge, water level and conductivity differed between all years and
sites, as a direct result of the drought conditions. Discharge and water level were highest in
2005 and both variables are continuing to decrease downstream of Locks 1 and 6. Conductivity
almost doubled from 2005 to 2008, and is highest further downstream at Lock 1 and Wellington.
Despite these changes, the field measurements of temperature, conductivity, dissolved oxygen
and pH, were generally within the acceptable range for fish reproduction and survival during this
study (Boyd 1990).
The most distinct difference occurred in hydrology where discharge was different between 2005,
and 2006, 2007 and 2008. The increased discharge in 2005 was still well below that required to
flood over the river banks (~50,000 ML/d), thus, the flow event was categorised as a within
channel flow pulse (Puckridge et al. 1998). This increase occurred as a result of increased
inflows into the tributaries being enhanced by the release of 513GL as a part of the Barmah-
Millewa Environmental Water Allocation (BM-EWA) (King et al. 2008).
Inter-annual variation was identified in the total abundance and assemblage structure
downstream of Locks 1 and 6, over the four sampling years. The most abundant species were
Australian smelt, bony herring, carp gudgeon and flathead gudgeon, which is consistent with
results within the Chowilla Anabranch system, South Australia, and a study in the Barmah-
Millewa region, mid Murray (King et al. 2007; Leigh et al. 2008).
A decreased abundance of small-bodied species was also documented in 2008, after a peak in
2007, suggesting that while initially these species may benefit from the low flow conditions,
there may be a negative effect of long term low flow conditions. Inter-annually, species richness
was highest in 2005, due to the presence of golden perch and silver perch, which were absent
in all other years. Species richness was lowest in 2008, specifically due to the absence of
Murray cod larvae. The abundance of large-bodied larval fish (Murray cod, silver perch and
golden perch) decreased each year. Freshwater catfish was the only large-bodied species
present in 2008.
Changes in the larval assemblages between years were variously correlated to discharge, water
level and conductivity. The negative correlation between discharge and conductivity should also
be highlighted. At present, none of the values for conductivity measured across the years are
outside the suitable range for growth and survival of larvae (McNeil et al. in preparation).
Therefore, conductivity is unlikely to be shaping the changes in the assemblage and the
response of individual species in each year. It is much more likely to be the relationship
between life history strategies of native fish and the varying hydrology (Humphries et al. 1999).
Bucater et al. 2009
46
Using correlations between changes in larval abundance and environmental variables three
distinct responses were identified:
1) Increased flow response: larval abundances positively correlated to discharge and water
level (and negatively correlated to conductivity). Including: golden perch, silver perch and
freshwater catfish.
2) Decreased flow response: larval abundances negatively correlated to discharge and water
level (and positively to conductivity). Including: Australian smelt, flathead gudgeons, carp
gudgeons and hardyheads (consistent with the LFRH, Humphries et al. 1999).
3) Temperature response: larval abundances strongly correlated to temperature. Including most
species, however, bony herring, carp gudgeons and redfin perch were more strongly influenced
by lower temperature than other variables.
There was some overlap between groups two and three for most species, however, bony
herring and redfin perch were the only species exclusively correlated to low temperature. Carp
gudgeon was most strongly correlated to changes in temperature, however, discharge, water
level and conductivity also had significant influence. Temperature is frequently identified as a
strong driver within fish spawning patterns simply as a result of the seasonal nature of fish
spawning; freshwater fish in the Lower Murray have been identified to have three spawning
periods within the season, spring, spring/summer and summer (Cheshire unpublished data).
In previous studies, small-bodied species have been identified to respond positively to low flow
conditions (Cheshire and Ye 2008a), as described by the low flow recruitment hypothesis
(Humphries et al. 1999). Despite the suggestion that the abundance of small-bodied species are
positively associated with low flows and high conductivities, the decrease in abundance during
2008 may suggest that as the initial response of these species to low flows may not be
sustainable under continued drought conditions.
There are also potential disadvantages for species spawning and recruiting under low flow
conditions such as decreased water quality, increased predation, increased competition, and
potentially decreased growth rates and body conditions (Copp 1992; Heagney 2008; Humphries
et al. 1999). This may be reflected in subsequent recruitment into the juvenile/adult populations
as small-bodied species are generally short lived, the prolonged low flow conditions may have
contributed, in part, to the decreased abundance of some species in 2008.
Large-bodied iconic species were collected in low numbers throughout the study, therefore it is
difficult to determine patterns in abundance in association with environmental conditions.
Notably, flow-cued spawners, golden perch and silver perch were only present in 2005, when
an increase in discharge into South Australia was observed. The abundances of golden perch,

Bucater et al. 2009
47
silver perch and freshwater catfish were positively correlated with discharge and water level,
although this must be interpreted cautiously, it should not be discounted.
These results correspond with other studies that suggested spawning of golden perch and silver
perch only occur under within channel flow pulses and over bank floods, and spawning may be
withheld if these conditions are not met (Cheshire and Ye 2008a; Harris and Gehrke 1994; Lake
1967; Leigh et al. 2008; Mackay 1973; Mallen-Cooper and Stuart 2003; Reynolds 1983;
Rowland 1983). Murray cod spawn at the same time of the year regardless of variations in flow
discharge (Cheshire and Ye 2008a; Humphries 2005; Koehn and Harrington 2005; Koehn and
Harrington 2006; Leigh et al. 2008). The presence of Murray cod larvae in this study was
variable; in 2005 they were present downstream of Lock 1 and downstream of Lock 6 from 2005
through to 2007, but were not recorded in 2008. This may be due to low abundances and the
patchy distribution of larvae, it is possible that the abundance decreased further in 2008 and our
sampling was not sufficient to collect any specimens. For example, Murray cod larvae were
collected in the Chowilla Anabranch system during 2008 (Leigh unpublished data), indicating
Murray cod spawned in the main channel upstream of Lock 6 and within the Chowilla
Anabranch system.
Despite, not being specifically aimed at increasing flows in the Lower River Murray, the BM-
EWA also provided benefit for large-bodied species throughout the Lower Murray. The
response of the large bodied species (particularly, golden perch and silver perch) in this study
are similar, although to a lesser degree, to those from the Barmah-Millewa Forest, where the
EWA was targeted (King et al. 2008). The increase in abundances and/or presence of the large-
bodied species in conjunction with the flow pulse year, and the decrease and/or absence of
these species in subsequent drought years, further reinforces the need to consider
environmental water allocations for South Australia in an effort to maintain/enhance key native
fish populations.

Bucater et al. 2009
48
6 KEY FINDINGS
• Discharge, water level and conductivity differed between years, as a direct result of the
drought conditions.
• Conductivity was negatively correlated to flow and water level, and was highest
downstream of Lock 1 and Wellington.
• Fifteen species of fish were collected as larvae, comprising nine native freshwater, four
native estuarine and two exotic freshwater species.
• The freshwater fish assemblage was comprised of highly abundant small-bodied species
and some large-bodied iconic species. The estuarine species were only collected during
2008, in the new sites, downstream of Wellington and in the Lower Lakes sites.
• Significant spatial variation was identified for total abundance, species richness and
assemblage structure between sites downstream of Lock 1, Lock 6 and Wellington in
2008. Spatial variation was correlated to temperature, pH and conductivity.
• The greatest differences were between the assemblage downstream of Lock 1 and
those from sites downstream of Lock 6 and Wellington, due to differences in the
abundance of the small-bodied freshwater species.
• Spatial differences in the structure of assemblages between the Lower Lakes sites are
likely driven by differences in conductivity.
• Inter-annual and spatial variation in the total abundance, species richness and
assemblage structure was identified downstream of Locks 1 and 6, over the four
sampling years.
• Inter-annual variation between years was most strongly correlated to differences in
hydrology (discharge and water level).
• Spatial variation was likely due to differences in habitat regions surrounding the study
sites.
• There were three distinct larval responses identified:
o Increased flow response: Larval abundances positively correlated to
discharge and water level (and negatively correlated to conductivity). Species
include Golden perch, Silver perch and Freshwater catfish.

Bucater et al. 2009
49
o Decreased flow response: Larval abundances negatively correlated to
discharge and water level (and positively correlated to conductivity). Species
include Australian smelt, Flathead gudgeons, Carp gudgeons and Hardyheads.
This response follows the Low Flow Recruitment Hypothesis of Humphries et al.
(1999).
o Temperature response: Larval abundances strongly correlated to
temperature. This applied to most species, however strong correlations were
found for Bony herring, Carp gudgeons and Redfin perch. Only Bony herring and
Redfin perch showed responses exclusively to temperature. Carp gudgeons
were most strongly correlated to temperature; however discharge, water level
and conductivity also had significant influences.
• Abundance of larvae of the large-bodied fish species has declined each year since
2005. However, due to the very low abundances throughout the study, this needs further
research with targeted sampling.
• The large-bodied species, golden perch and silver perch, being flow-cued spawners,
were only present during the higher discharge year of 2005. This finding reinforces the
need to consider environmental water allocations for the Lower Murray.
• Murray cod larvae were found below Lock 1 in 2005 only and below Lock 6 in 2005,
2006 and 2007. No larvae were detected in 2008.
• Decreased abundance of small-bodied species downstream of Locks 1 and 6 in 2008
compared to the peak 2007 suggests that whilst low flow conditions may benefit these
species initially, there may be a negative effect as low flow conditions continue.
• Under low flow conditions, abundance and distribution of larvae of large-bodied native
species is decreased. A within channel pulse, as occurred in 2005, may be sufficient to
provide suitable conditions for spawning of key large-bodied native species.
• Upstream environmental water allocations may provide indirect benefits for native fish
downstream in the Lower River Murray.

Bucater et al. 2009
50
7 MANAGEMENT IMPLICATIONS
The natural flow regime of the Lower River Murray in SA has been greatly impacted by river
regulation (Maheshwari et al. 1995). Consequently, this has resulted in significant
environmental degradation (Arthington and Pusey 2003; Walker 1985; Walker and Thoms
1993), and detrimental effects upon aquatic organisms (Gehrke et al. 1995; Humphries et al.
2002). Modification of the hydrology within a system can have cascading effects, potentially
influencing water quality, energy sources, physical habitat and biotic interactions, resulting in an
overall reduced ecological integrity (Poff et al. 1997). In addition, the drought, which began in
2002, may increase the impact of a changed flow regime on the native fish and overall
ecological health of the Lower River Murray.
This study suggests that protracted low flow conditions may affect spawning success and/or
larval survivorship of freshwater catfish, Murray cod, golden perch and silver perch. Given their
significant conservation value throughout the MDB, these species should be of greatest
concern. Under current low flow conditions, species richness, abundance and distribution of the
larvae of large-bodied native species appears to be decreasing. Furthermore, a within channel
flow pulse, as occurred in 2005, may be sufficient to provide suitable conditions for spawning
and enhanced larval survivorship of the large-bodied native species. Further support for
environmental flows can be seen in this study where the within channel flow pulse that occurred
in South Australia during 2005 was in part due to the release of the Barmah-Millewa
environmental water allocation (King et al. 2008). The small-bodied species are all relatively
short-lived (1-3 yrs), while species with short generation times are likely to be most seriously
effected by changes to the environment, these species have demonstrated the ability to
respond positively to low flow conditions initially. Following the decline in abundance of all
species in 2008, however, it is imperative to continue monitoring these species, to ensure that
continued prolonged periods of low flow do not have a detrimental effect on the recruitment of
these species, as time progresses. Regardless of the ability for these species to tolerate low
flows, restoring the River Murray to a more natural flow regime is important for all native
species, and the overall ecological health of the river. Additionally, as discharge continues to
decrease, conductivity is increasing, while this is not yet of significant concern for larval
assemblages, if conductivity continues to increase, it has the potential to restructure the
communities of the River Murray, particularly downstream of Lock 1.
Providing a more “natural” flow regime in regulated rivers, through environmental water
allocations (EWA’s), is one of the potential management options for the restoration of native fish
(Marchetti and Moyle 2001; Arthington et al. 2006). There are few applied examples and there
have been varied levels of success attributed to manipulations of flows (e.g. Nesler et al. 1988;
Travinchek et al. 1995; King et al. 1998; Freeman et al. 2001). However, in a recent study,

Bucater et al. 2009
51
golden perch, silver perch and Murray cod have all been shown to have increased spawning
and recruitment success during a managed flood (in 2005), using an environmental water
allocation (King et al. 2008). These studies highlight the need to consider attributes of the flow
regime, including timing and duration, within individual river systems in order to manage flows
for improved fish populations. King et al. (2003) suggested that for successful spawning and
recruitment of fish during flood conditions a range of environmental conditions would need to
occur. These included the coupling of high flows and temperatures, a predictable flood pulse,
slow rate of rise and fall, a duration which spans months, and that the magnitude is sufficient to
inundate the floodplain. However, all of these factors require further research before optimal
management strategies can be outlined.

Bucater et al. 2009
52
8 RECOMMENDATIONS FOR FUTURE RESEARCH
The significant decrease in the abundance of larvae of some small-bodied species, and
particularly Australian smelt, downstream of Lock 1 requires further monitoring to determine if
this is natural inter-annual variation or a continuing problem as a result of changing conditions
due to prolonged low flows.
Recruitment studies for the small-bodied native species, assessing age structures and
identifying years with strong recruitment would yield significant benefit in determining the effect
of prolonged low flows on recruitment of these species.
Continued monitoring is required to determine if the variation in presence of Murray cod and
freshwater catfish larvae downstream of Lock 1 in 2006, 2007 and 2008, and absence of Murray
cod in 2008 downstream of Lock 6, is an ongoing problem, or an artefact of sampling species
with low abundances of larvae.
Further investigations into the age structures of the large-bodied native species will help identify
years with strong recruitment. Comparing strong year classes to environmental variables should
also be considered in an effort to increase our understanding of factors affecting the larval
survivorship and to identify key factors that drive recruitment success.
More comprehensive understanding of the influence of pH and dissolved oxygen on early life
history stages of MDB fish species is required to better understand the potential implications of
decreased water quality in low discharge years.
Fish spawning and recruitment processes in the Lower Lakes are relatively unknown. Further
research is suggested to investigate these key processes and monitor the changes in
assemblage structure under the drought conditions, especially in regard to the impacts of the
continued low flows, low water levels and increasing conductivity.

Bucater et al. 2009
53
9 REFERENCES
Alton LA, Cheshire KJ, Westergaard S and Ye Q (In preparation) Influences of Salinity and Water Quality on the Recruitment Dynamics of Fishes in the Lower River Murray – Larval Distribution in Relation to Habitats: A Literature Review. In 'Influence of Salinity, Water Quality and Hydrology on Early Life History of Fishes in the Lower River Murray. A report in preparation for the Centre for Natural Research Management.' (Eds Q Ye, K Cheshire and D McNeil). (South Australian Research and Development Institute, Aquatic Sciences Adelaide, SA). Anderson MJ (2001) A new method for non-parametric multivariate analysis of variance. Austral Ecology 26, 32-46. Anderson MJ (2005) 'PERMANOVA: a FORTRAN computer program for permutational multivariate analysis of variance.' (Department of Statistics: University of Auckland: New Zealand) Arthington AH, Pusey BJ (2003) Flow restoration and protection in Australian rivers. River Research and Applications 19, 377-395. Arthington AH, Bunn SE, Poff LN, Naiman RJ (2006) The challenge of providing environmental flow rules to sustain river ecosystems. Ecological Applications 16, 1311-1318. Becker A, Laurenson LJB, Jones PL, Newman DM (2005) Competitive Interactions between the Australian Native Fish Galaxias maculatus and the Exotic Mosquitofish Gambusia holbrooki in a Series of Laboratory Experiments. Hydrobiologia 549, 187-196. Bertozzi T, Adams M, Walker KF (2000) Species boundaries in carp gudgeons (Eleotrididae: Hypseleotris) from the River Murray, South Australian: evidence for multiple species and extensive hybridization. Marine and Freshwater Research 51, 805-815. Boyd CE (1990) 'Water quality in ponds for aquaculture.' (Brimingham Publishing Co.: Birmingham, Alabama) Bray J, Curtis J (1957) An ordination of the upland forest communities of Southern Wisconsin. Ecological Monographs 27, 325-349. Cadwallader PL, Backhouse GN (1983) 'A Guide to the freshwater fish of Victoria.' (Victorian Government Printing Office: Melbourne, VIC) Clarke K (1993) Non-parametric multivariate analysis of changes in community structure. Australian Journal of Ecology 18, 117-143. Copp G (1992) Comparative microhabitat use of cyprinid larvae and juveniles in a lotic floodplain channel. Environmental Biology of Fishes 33, 181-193.

Bucater et al. 2009
54
CRCFE (2003) 'Ecological assessment of environmental flow reference points for the River Murray system: Interim Report.' Cooperative Research Centre for Freshwater Ecology Prepared by the Scientific Reference Panel for the Murray-Darling Basin Commission, Living Murray Initiative. DWLBC (2007) 'Dredging and boating access continue through summer.' Government of South Australia. Freeman MC, Bowen ZH, Bovee KD, Irwin ER (2001) Flow and habitat effects on juvenile fish abundance in natural and altered flow regimes. Ecological Applications 11, 179-190. Gehrke PC, Brown P, Schiller C, Moffatt DB, Bruce AM (1995) River regulation and fish communities in the Murray- Darling River System, Australia. Regulated Rivers: Research & Management 11, 363-375. Gill HS, Wise BS, Potter IC, Chaplin JA (1996) Biannual spawning periods and resultant divergent patterns of growth in the estuarine goby Pseudogobius olorum: Temperature induced? Marine Biology 125, 453-466. Harris JH, Gehrke PC (1994) Development of predictive models linking fish population recruitment with stream flow. In 'Australian Society for Fish Biology Workshop'. Perth. (Ed. DA Hancock) pp. 195-97. (Australian Society for Fish Biology, Sydney) Heagney E (2008) 'Growth and condition of Australian smelt and bony bream in the Gwidyer wetlands: an otolith based analysis ', Final report to the Rivers & Wetlands Unit, NSW Department of Environment and Climate Change. Humphries P (2005) Spawning time and early life history of the Murray cod, Maccullochella peelii peelii (Mitchell) in an Australian river. Environmental Biology of Fishes 72, 393-407. Humphries P, King AJ, Koehn JD (1999) Fish flows and flood plains: links between freshwater fishes and their environment in the Murray-Darling River system, Australia. Environmental Biology of Fishes 56, 129-151. Humphries P, Serafini LG, King AJ (2002) River regulation and fish larvae: variation through space and time. Freshwater Biology 47, 1307-1331. King AJ, Humphries P, Lake PS (2003) Fish recruitment on floodplains: the roles of patterns of flooding and life history characteristics. Canadian Journal of Fisheries and Aquatic Sciences 60, 773-786. King AJ, Tonkin Z, Mahoney J (2007) 'Assessing the effectiveness of environmental flows on fish recruitment in Barmah-Millewa Forest.' Arthur Rylah Institute for Environmental Research, DSE, MDBC Project No. BMF 2004.09, Heidleberg, Vic.

Bucater et al. 2009
55
King AJ, Tonkin Z, Mahoney J (2008) Environmental flow enhances native fish spawning and recruitment in the Murray River, Australia. River Research and Applications. Published online in Wiley InterScience (DOI:10.1002/rra.1209) King J, Cambray JA, Impson ND (1998) Linked effects of dam-released floods and water temperature on spawning of the Clanwilliam yellowfish (Barbus capensis). Hydrobiologia 384, 245-265. Koehn JD, Harrington DJ (2005) Collection and distribution of the early life stages of the Murray cod (Maccullochella peelii peelii) in a regulated river. Australian Journal of Zoology 53, 137-144. Koehn JD, Harrington DJ (2006) Environmental conditions and timing for the spawning of Murray cod (Maccullochella peelii peelii) and the endangered trout cod (M. macquariensis) in Southeastern Australian Rivers. River Research and Applications 33, 327-342. Lake JS (1967) Rearing experiments with five species of Australian freshwater fishes: II. Morphogenesis and ontogeny. Australian Journal of Marine and Freshwater Research 18, 155-173. Leigh SJ, Zampatti BP, Nicol JM (2008) 'Spatial and temporal variation in larval fish assemblage structure in the Chowilla Anabranch system: with reference to water physico-chemistry and stream hydrology.' South Australian Research and Development Institute (SARDI) Aquatic Sciences, SARDI Aquatic Sciences Publication No: F2008/000051-1, Adelaide, SA. Lintermans M (2007) 'Fishes of the Murray-Darling Basin: an introductory guide.' (Murray-Darling Basin Commission) Lloyd LN, Walker KF (1986) Distribution and conservation status of small freshwater fish in the River Murray, South Australia. Transactions of the Royal Society of South Australia 110, 49-57. Mackay NJ (1973) Histological changes in the ovaries of the golden perch, Plectroplites ambiguus, associated with the reproductive cycle. Australian Journal of Marine and Freshwater Research 24, 95-101. Maheshwari BL, Walker KF, McMahon TA (1995) Effects of regulation on the flow regime of the River Murray, Australia. Regulated Rivers: Research & Management 10, 15-38. Mallen-Cooper M (2001) 'Fish passage in off-channel habitats of the lower River Murray.' Fishway Consulting Services, NSW. Mallen-Cooper M, Stuart IG (2003) Age, growth and non-flood recruitment of two potamodromous fishes in a large semi-arid/temperate river system. River Research and Applications 19, 697-719. Marchetti MP, Moyle PB (2001) Effects of flow regime on fish assemblages in a regulated California stream. Ecological Applications 11, 530-539.

Bucater et al. 2009
56
McCune B, Mefford MJ (1999) PC-ORD. Multivariate Analysis of Ecological Data. In. (Ed. M Software). (Gleneden, Oregon, USA) McNeil DG, Westergaard S, Alton LA (in preparation) Salinity tolerances of eggs, larvae and juveniles, for native fish in the Lower River Murray, South Australia. In 'The influence of environmental variables on larval and juvenile stages of native fish in the Lower River Murray. A report in preparation for the Centre for Natural Research Management. '. (Eds Q Ye). (South Australian Research and Development Institute, Aquatic Sciences: Adelaide) MDBC (2008) 'River Murray system drought update number 13.' Murray-Darling Basin Commission, Canberra, ACT. Meredith SN, Gawne B, Sharpe C, Whiterod N, Conallin A, Zukowski S (2002) 'Dryland Floodplain Ecosystems: influence of flow patterns on fish production.' Murray Darling Freshwater Research Centre, report no. 1/2002, Mildura. Neira FJ, Miskieweicz AG, Trnski T (1998) 'Larvae of temperate Australian fishes: laboratory guide for larval fish identification.' (University of Western Australia Press: Nedlands, WA) Nesler TP, Muth RT, Wasowicz AF (1988) Evidence for baseline flow spikes as spawning cues for Colorado squawfish in the Yamba River, Colorado. American Fisheries Society Symposium 5, 68-79. Poff NL, Allan JD, Bain MB, Karr JR, Prestegaard KL, Richter BD, Sparks RE, Stromberg JC (1997) The natural flow regime: A paradigm for river conservation and restoration. Bioscience 47, 769-784. Pollard DA (1971) The biology of a landlocked form of the normally catadromous salmoniform fish Galaxia maculatus (Jenyns). Australian Journal of Marine and Freshwater Research 22, 91-123. Puckridge JT, Walker KF (1990) Reproductive biology and larval development of a gizzard shad Nematalosa erebi (Dorosomatinae: Teleostei), in the River Murray, South Australia. Australian Journal of Marine and Freshwater Research 41, 695-712. Puckridge JT, Sheldon F, Walker KF, Boulton AJ (1998) Flow variability and the ecology of large rivers. Marine and Freshwater Research 49, 55-72. Reynolds LF (1983) Migration patterns of five fish species in the Murray-Darling River System. Australian Journal of Marine and Freshwater Research 34, 857-71. Rowland SJ (1983) The hormone-induced ovulation and spawning of the Australian freshwater fish golden perch, Macquaria ambigua (Richardson) (Percicithyidae). Aquaculture 35, 221-238. Serafini LG, Humphries P (2004) 'Preliminary guide to the identification of larvae of fish, with a bibliography of their studies, from the Murray-Darling Basin.' Cooperative Research Centre for
Bucater et al. 2009
57
Freshwater ecology, Murray-Darling Freshwater Research Centre, Albury and Monash University, Clayton, Identification and Ecology Guide No. 48. Travinchek VH, Bain MB, Maceina MJ (1995) Recovery of a warm water fish assemblage after initiation of a minimum-flow release downstream from a hydroelectric dam. Transactions of the American Fisheries Society 124, 836-844. Walker KF (1985) A review of the ecological effects of river regulation in Australia. Hydrobiologia 125, 111-129. Walker KF (2006) Serial weirs cumulative effects: the Lower River Murray, Australia. In 'Ecology of desert rivers'. (Ed. RT Kingsford) pp. 248-279. (Cambridge University Press: Cambridge) Walker KF, Thoms MC (1993) Environmental effects of flow regulation on the Lower River Murray, Australia. Regulated Rivers: Research & Management 8, 103-119. Williams MD, Williams WD (1991) Salinity tolerances of four species of fish from the Murray-Darling River system. Hydrobiologia 210, 145-160. Ye Q, Cheshire KJ, Fleer D (2008) 'Recruitment of golden perch and selected large-bodied fish species following the weir pool manipulation in the River Murray, South Australia.' South Australian Research and Development Institute (SARDI), Aquatic Sciences, SARDI research report series number: 303, SARDI Aquatic Sciences Publication Number F2008/000606-1, Adelaide, SA. Young WJ (Ed.) (2001) 'Rivers as ecological systems: The Murray-Darling Basin.' (Murray Darling Basin Commission: Canberra, ACT)
10 PERSONAL COMMUNICATION
Anthony Miskiewicz (2009) - Environment and Recreation Planning Manager. Wollongong City Council