fish biomass in tropical estuaries: substantial variation ... · web in fig. 7 of abrantes and...
TRANSCRIPT

Fish Biomass in Tropical Estuaries: Substantial Variationin Food Web Structure, Sources of Nutritionand Ecosystem-Supporting Processes
Marcus Sheaves1,2 & Ronald Baker1,2 & Kátya G. Abrantes1 & Rod M. Connolly3
Received: 22 January 2016 /Revised: 1 June 2016 /Accepted: 27 August 2016# Coastal and Estuarine Research Federation 2016
Abstract Quantification of key pathways sustaining ecosys-tem function is critical for underpinning informed decisionson development approvals, zoning and offsets, ecosystem res-toration and for meaningful environmental assessments andmonitoring. To develop a more quantitative understanding ofthe importance and variation in food webs and nutrient flowsin tropical estuaries, we investigated the spatio-temporal dis-tribution of biomass of fish across 28 mangrove-lined estuar-ies in tropical Australia. We evaluated the extent to whichnekton biomass in tropical estuaries responded to spatial andtemporal factors and to trophic identity. Biomass was domi-nated by two trophic groups, planktivores and macrobenthosfeeders. Contributions by other trophic groups, such asdetritivores and microbenthos feeders, were more variable.Total biomass and the biomass of all major trophic groupswere concentrated in downstream reaches of estuaries. Theconsistent concentration of biomass downstream, and spatio-temporal differences in the contributions by the different tro-phic groups, indicates substantial differences in food webstructure, differences in the contributions from different
sources of nutrition and probably unequal flow of productivityinto higher levels of the food web in different parts of theestuary. In turn, this suggests substantial qualitative and quan-titative differences in ecosystem-supporting processes in dif-ferent estuary reaches.
Keywords Mangrove . Nekton . Penaeid . Spatialprioritisation . Restoration . Offset
Introduction
Although their high productivity and nursery-ground valuesmake estuaries and their associated wetlands among the mostvaluable ecosystems on the planet (Choi and Wang 2004;Costanza et al. 1997; Eamus et al. 2005), threats from a diver-sity of anthropogenic factors mean they are also among themost threatened (Duke et al. 2007; Gehrke et al. 2011; Lotzeet al. 2006). Their location at the interface between land andsea is attractive for human habitation; climates are usuallymild and there is ready access to both terrestrial and marineresources. Consequently, estuaries are the focus for a substan-tial proportion of the world’s population (Vitousek et al.1997). Additionally, their setting, as coastal inlets linked toriver systems, makes them key locations for transportationhubs and the focus of rapid, large-scale development (Cornand Copeland 2010; Edgar et al. 2000). The location ofestuaries also means they are vulnerable to a range ofnatural forces; the joint influences of rivers and the seaexposes them to impacts from climate variability, ex-treme events and sea level rise. This conjunction ofhigh value and intense threats makes ensuring their con-tinued healthy functioning an issue of primary concernif they are to continue to provide their diverse ecosys-tem services for future generations (Erwin 2009).
Communicated by Nadine A. Strydom
Electronic supplementary material The online version of this article(doi:10.1007/s12237-016-0159-0) contains supplementary material,which is available to authorized users.
* Marcus [email protected]
1 College of Marine and Environmental Sciences, James CookUniversity, Townsville, QLD 4811, Australia
2 TropWATER (Centre for Tropical Water and Aquatic EcosystemResearch), James Cook University, Townsville, QLD 4811, Australia
3 Australian Rivers Institute – Coasts & Estuaries, School ofEnvironment, Griffith University, Gold Coast, QLD 4222, Australia
Estuaries and CoastsDOI 10.1007/s12237-016-0159-0

Understanding the values of estuaries and how to assessand monitor changes in value is an important element inmaximising environmental outcomes in the face of develop-mental pressures (Grech et al. 2013; Sheaves et al. 2015). Itrequires information about aspects such as habitat require-ments and sources and flows of productivity that provide thevital support for ecosystem and fishery productivity(Nagelkerken et al. 2015). In particular, quantitative knowl-edge of the significance of particular trophic pathways in sus-taining ecosystem function is needed to support informed de-cisions on development approvals, zoning and offsets and tounderpinmeaningful environmental assessments andmonitor-ing (Creighton et al. 2015). Moreover, establishing theamounts of material flowing through food webs, and how thatvaries over space and time, provides the vital underpinning forvaluing estuarine productivity (Cowley and Whitfield 2002;Weinstein and Litvin 2016), and so is crucial to efficient spa-tial prioritisation (Beger et al. 2010) and effective restoration(Sheaves et al. 2014; Weinstein and Litvin 2016).Unfortunately this information is extremely limited acrossmost of the world’s tropical waters (Sheaves et al. 2014).
Studies of fish in temperate estuaries focussed on the envi-ronmental factors underlying the distribution and biomass ofspecies (e.g. Marshall and Elliott 1998) and the relative dom-inance of different feeding modes (e.g. Cowley and Whitfield2002). This has been developed with the addition of furtherdata from multiple estuaries and the incorporation of definedfish guilds, such as estuarine species and marine migrants(Elliott et al. 2007). Zoogeographical comparisons among es-tuaries have also proved informative. Based on fishdistributions and abundances in 190 South African estuaries,Harrison andWhitfield (2008) demonstrated that fish guilds incool-temperate estuaries were dominated bymigratory species(estuarine migrants and marine opportunists), whereas thosein warm-temperate and subtropical estuaries were dominatedby estuarine-dependent species. Across the same systems,Harrison and Whitfield (2012) found some zoogeographic andestuarine typology (closed vs open) effects on the biomass com-position among trophic guilds, yet all estuaries were dominatedby detritivores. The approach in tropical estuaries has focussedmore on the interplay between variation in assemblages amongestuaries and the importance of different trophic groups(Sheaves et al. 2010). Few other studies have examined thedistribution of biomass of the nekton assemblage within andamong estuarine systems, and hence, our understanding of foodweb structure remains incomplete (Abrantes et al. 2015).
As an important step in gaining a more quantitativeunderstanding of the importance and variation in foodwebs and nutrient flows in tropical estuaries, we inves-tigated the spatio-temporal distribution of biomass offish in extensive surveys in tropical Australia. We fo-cussed on the primary and secondary consumers (fishand nektonic crustaceans) that link primary production
with higher trophic levels. We specifically evaluated: (i)the extent to which spatial and temporal factors, andtrophic identity, influence the distribution of nekton bio-mass in tropical estuaries; (ii) how overall nekton bio-mass is distributed among reaches along the upstream-downstream gradient within estuaries; (iii) how the rel-ative contributions of different trophic groups to bio-mass vary in space and time; and (iv) how the biomassof each major trophic group is distributed amongreaches of the estuary.
Methods
The data from two previous studies from north-easternAustralia (Sheaves and Johnston 2009; Sheaves et al. 2010)were combined to provide a data set from 28 mangrove-linedestuaries spanning over 650 km of coast (Fig. 1). Details of theestuaries and their environments, along with details ofsampling designs, can be found in the studies of Sheavesand Johnston (2009) and Sheaves et al. (2010). While theprevious studies reported data on numeric CPUE, the currentwork focusses on biomass, with cast net catch data expressedin terms of biomass per net (either for each trophic group oroverall as appropriate) providing an estimate of biomassdensity.
The two studies used similar sampling methodolo-gies: small mesh monofilament drawstring cast nets(2.4 m radius, 5 mm mesh) operated by a single indi-vidual from a 4.3-m dingy and deployed along the es-tuary banks over the lower part of the tide when fishare forced into the main channel and so accessible tothe sampling gear. The use of cast nets allowed thegreatest range of habitats to be sampled and provideda means of estimating the biomass in a defined volumeof water (i.e. biomass density) but biased sampling to-wards smaller individuals. Consequently, the study fo-cuses on small primary consumers and secondary con-sumers that link primary production with higher trophiclevels. The bias towards smaller individuals is likely tohave resulted in underrepresentation of two groups:large mobile nekton feeders (nektivores) and largedetritivores (principally mugilids and Chanos chanos).The probable underrepresentation means that results forthese trophic groups need to be treated with caution,and that, while the estimates allow spatial comparisonsamong estuaries and reaches, overall biomass estimatesshould be seen as minimum values.
In both studies, at least 15 (and as many as 30)replicate nets were collected per reach from each estu-ary (Sheaves and Johnston 2009; Sheaves et al. 2010).In most cases, three reaches (downstream, mid-estuaryand upstream) were sampled, although this was reduced
Estuaries and Coasts

to only downstream and upstream reaches in the shorterestuaries (Online Resource Table 1). Reaches were ap-proximately 1.5-km long, except in Healy Ck. wherethey were 700-m long. The downstream reach was de-fined as the area immediately inside the estuary mouthand the upstream reach as the area immediately down-stream of the limit of navigation for the (4.3-m long)sampling dingy. Where mid-estuary samples could becollected, they were situated approximately mid-way be-tween the downstream and upstream samples.
The two studies differed in their spatial and temporal ex-tents. In one of the studies (Sheaves and Johnston 2009;hereafter referred to as the Spatial Study), the emphasis wason spatial patterns, with 21 estuaries sampled over 4 consec-utive tidal cycles between August and October 2007. Five ofthe estuaries were sampled twice during the study, and themean of those replicates are used in the present analysis. Inaddition, only one reach could be sampled in one of the estu-aries (Victor Ck.), so this was omitted from the present anal-ysis to leave 20 estuaries (Fig. 1). In the other study (Sheaves
et al. 2010; hereafter referred to as the Temporal study), 9estuaries were sampled approximately monthly betweenNovember 2007 and January 2009, although inclement weath-er meant that not all estuaries could be sampled during allmonths. One estuary (Bluewater Ck.) was only long enoughfor a single reach so was omitted from this analysis. Twoconstructed estuarine lakes sampled by Sheaves et al. (2010)are not included in the present study. The final combined dataset consisted of 28 estuaries (Estuaries) comprising either 2 or3 reaches (Online Resource Table 1). To allow investigation oflarge-scale spatial patterns, the estuaries from both studieswere grouped into BBays^ (Fig. 1), aligning with thedefinition of Bays in Sheaves and Johnston (2009).
Nekton were assigned to trophic groups (OnlineResource Table 2) based on published literature (Bakerand Sheaves 2005; Kent 2007; Salini et al. 1990; Saliniet al. 1998; Wilson and Sheaves 2001). The trophicgroups were Planktivore, Detritivore, Macrobenthivore,Penaeid, Microbenthivore, Herbivore, Insectivore andNektivore (Online Resource Table 2) and were modified
Al: Alligator Ck.Ar: Armstrong Ck.Ba: Barra�a Ck.Cb: Crab Ck.Cc: Cocoa Ck.Cn: Constant Ck.Cr: Crocodile Ck.De: Deluge Inlet.Do: Doughboy Ck.Ha: Haughton R.He: Healy Ck.HH: Hell Hole Ck.Hu: Hull R.In: Insulator Ck.MC: Murray Ck.Md: Mud Ck.Me: Meunga Ck.MR: Murray R.Mr: Morris Ck.Ms: Mossman Ck.Ne: Neames Ck.Pa: Packer Ck.Ro: Ross R.RP: Rocky Ponds Ck.Sl: Saltwater Ck.Sn: Sandfly Ck.Wa: Waterfall Ck.YG: Yellow Gin Ck.
Sl
MsPa
HuMR
Me
DeWa
Ne
In
He RoSn
Al
CrCcDo
Ha Mr
CbBa
MdHHYGRP
Ar
MC
Cn
100 km
Trinity
Rockingham
Hinchinbrook
Halifax
Cleveland
Bowling Green
Upstart
Hillsborough
Fig. 1 Location of the study sitesalong the northeast coast oftropical Australia. Estuaries aregrouped into Bays indicated byitalicised text and braces
Estuaries and Coasts

from Elliott et al. (2007) to align with functional dietarycategories rather than taxonomic categories. For in-stance, small juveniles of most macrobenthivores fedon much smaller prey (particularly microcrustaceans)than their adults so were assigned as microbenthivores.Although the group Penaeid refers to a taxonomic cate-gory, their diet comprises a mixture of organic particlesand microzoobenthos, and they play different roles in
estuarine food webs to fish with similar diets (Bakerand Sheaves 2005), hence our designation of this groupby their taxonomic title. Nektivores were included in thegeneral description of trophic group contribution(Figs. 2 and 3) but excluded from detailed analysesbecause the study focused on fish primary (herbivoreand detritivore) and secondary (planktivores and others)consumers.
a
0.303(87)
0.638(54)
0.883(142)
1.21(95)
TROPHIC GROUP
TROPHIC GROUPESTUARY
herbivoreinsec�vore
nek�vore
detri�voremacrobenthivoremicrobenthivoreplank�vorepenaeid
detri�voremicrobenthivore
penaeidmacrobenthivoreplank�vore
Barra�a CkCrocodile CkDeluge InNeames CkPacker CkSandfly CkWaterfall Ck
Alligator CkArmstrong Ck
Constant CkHaughton R
Hull RMeunga Ck
Morris CkMossman R
Murray CkMurray R
Ross RSaltwater Ck
b
TRIP
0.151(97)
0.449(98)
0.849(585)
1.29(234)
1.7(234)
1.82(312)
TROPHIC
TROPHIC
TROPHIC ESTUARY
herbivore
May 08, Jul 08, Sep 08,Oct 08
Nov 08
Nov 07, Dec 07Mar 08, Apr 08 Dec 08, Jan 09
Barramundi CkHell Hole CkMud CkSandfly Ck
insec�voremicrobenthivorenek�vore
detri�voremacrobenthivoreplank�vorepenaeid
herbivoreinsec�vore
microbenthivorenek�vore
Cocoa CkCrocodile Ck
Deluge InInsulator Ck
detri�voreplank�vore
macrobenthivorepenaeid
Fig. 2 Regression tree model ofthe contribution of spatial factors(Bay, Estuary and Reach), trophicgroups and Trip (Temporal studyonly) to biomass density. Bargraphs indicate the relativefrequency distribution of (4th roottransformed) biomass density ofsamples forming each terminalnode. Numbers below bar graphsare estimates of the (4th roottransformed) mean biomassdensity for each terminal node,and numbers in parenthesesindicate the sample size for eachterminal node. a Spatial study. bTemporal study
Estuaries and Coasts

Data Analysis
Factors Influencing Biomass Variation
To determine the influence of spatial and temporal factors andtrophic identity on overall biomass, we used UnivariateClassification and Regression Trees (CARTs) to model theeffects of Bay, Estuary, Reach (spatial factors) and trophicgroup for both studies. We also included Trip for theTemporal study. The response variable biomass density (i.e.biomass per net) was analysed separately for the two studies(Temporal and Spatial) using TreesPLUS software (De’athand Fabricius 2000). Data were 4th root transformed prior toanalysis to produce approximately symmetrical distributionsof residuals and trees fitted byminimising absolute deviations,both measures aimed at limiting the biasing effect of extremevalues. The tree models were fitted using 10-fold cross vali-dation, and the final tree model selected as the 1-SE tree (thesmallest tree within 1 Standard Error of the tree with the min-imum cross validation error) (Breiman et al. 1984).
Distribution of Overall Biomass among Reaches
The distribution of overall biomass density among reacheswas investigated graphically. Both data sets were combined,
with the mean over time for each estuary reach used to repre-sent average biomass density.
Spatial and Temporal Variation in Contributionof Trophic Groups to Biomass
We used Multivariate Classification and Regression Trees(mCART) (De’ath 2002) to investigate the influence of spatialand temporal factors on the contributions by different trophicgroups, analysing data from the two studies separately.Because substantial differences were detected in total biomassamong estuaries, the data were row standardised to adjust forabsolute differences in biomass among estuaries and reaches,allowing analyses to focus on differences in relative contribu-tion of trophic groups. This produced dependent variable setsrepresenting the relative contributions of the different trophicgroups to biomass density for each reach. Predictor variableswere Bay, Estuary and Reach for both studies, with the addi-tion of Trip for the Temporal study. mCART analysis wasconducted using TreesPLUS software paralleling the ap-proach used above for univariate CARTs. Data were again4th root transformed to produce approximately symmetricaldistributions of residuals.
Reach-Specific Distribution of Individual Trophic Groups
The reach-specific concentration of trophic group biomasswas assessed with a pairwise comparison of biomass densitybetween downstream and upstream reaches using paired t testsseparately for the two studies, with data 4th root transformedto improve homogeneity of variance. Because shorter estuar-ies were only divided into upstream and downstream reaches(Online Resource Table 1), data from the mid-estuary reachwas omitted from this analysis to allow comparisons amongall estuaries studied. While the pairwise approach affordsoverall comparison of upstream-downstream distributions ofindividual trophic groups, it does not allow spatial or temporalmodifiers to be assessed. To do this, we again employed uni-variate CARTs as described above for each trophic group sep-arately, for the two studies.
Results
The study included 121 identifiable fish taxa (resolved to spe-cies level except in the case of some Gobiidae and for juve-niles too small for species identification) and 5 species ofpenaeids (Online Resource Table 3).
Factors Influencing Biomass Variation
CART modelling of the contributions of spatial factors andtrophic groups to overall biomass density indicated that
Fig. 3 Proportional contribution to biomass density for each reach,averaged across all estuaries. The relative size of each pie chart reflectsoverall biomass density in each reach
Estuaries and Coasts
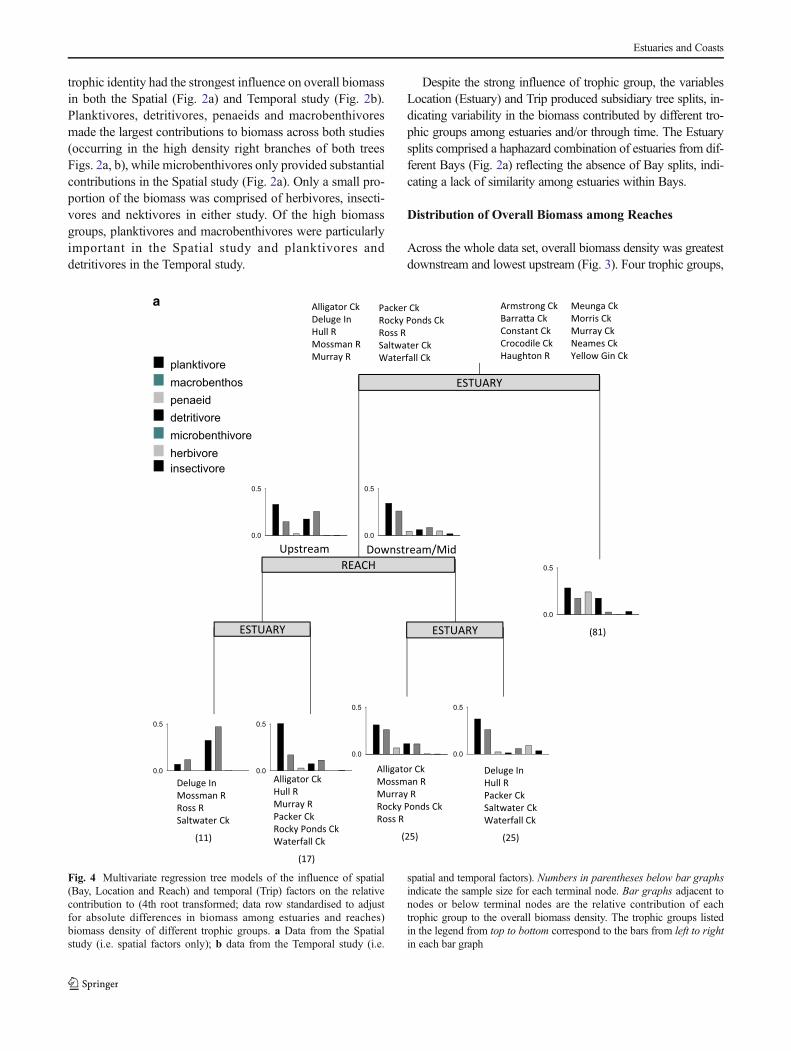
trophic identity had the strongest influence on overall biomassin both the Spatial (Fig. 2a) and Temporal study (Fig. 2b).Planktivores, detritivores, penaeids and macrobenthivoresmade the largest contributions to biomass across both studies(occurring in the high density right branches of both treesFigs. 2a, b), while microbenthivores only provided substantialcontributions in the Spatial study (Fig. 2a). Only a small pro-portion of the biomass was comprised of herbivores, insecti-vores and nektivores in either study. Of the high biomassgroups, planktivores and macrobenthivores were particularlyimportant in the Spatial study and planktivores anddetritivores in the Temporal study.
Despite the strong influence of trophic group, the variablesLocation (Estuary) and Trip produced subsidiary tree splits, in-dicating variability in the biomass contributed by different tro-phic groups among estuaries and/or through time. The Estuarysplits comprised a haphazard combination of estuaries from dif-ferent Bays (Fig. 2a) reflecting the absence of Bay splits, indi-cating a lack of similarity among estuaries within Bays.
Distribution of Overall Biomass among Reaches
Across the whole data set, overall biomass density was greatestdownstream and lowest upstream (Fig. 3). Four trophic groups,
0.0
0.5
0.0
0.5
0.0
0.5
0.0
0.5
0.0
0.5
0.0
0.5
0.0
0.5
ESTUARY
REACH
ESTUARY ESTUARY
planktivoremacrobenthospenaeiddetritivoremicrobenthivoreherbivoreinsectivore
Alligator CkDeluge InHull RMossman RMurray R
Armstrong CkBarra�a CkConstant CkCrocodile CkHaughton R
Upstream Downstream/Mid
Deluge InMossman RRoss RSaltwater Ck
(11)
Alligator CkHull RMurray RPacker CkRocky Ponds CkWaterfall Ck
(17)
Alligator CkMossman RMurray RRocky Ponds CkRoss R
(25)
Deluge InHull RPacker CkSaltwater CkWaterfall Ck
(25)
Packer CkRocky Ponds CkRoss RSaltwater CkWaterfall Ck
Meunga CkMorris CkMurray CkNeames CkYellow Gin Ck
(81)
a
Fig. 4 Multivariate regression tree models of the influence of spatial(Bay, Location and Reach) and temporal (Trip) factors on the relativecontribution to (4th root transformed; data row standardised to adjustfor absolute differences in biomass among estuaries and reaches)biomass density of different trophic groups. a Data from the Spatialstudy (i.e. spatial factors only); b data from the Temporal study (i.e.
spatial and temporal factors). Numbers in parentheses below bar graphsindicate the sample size for each terminal node. Bar graphs adjacent tonodes or below terminal nodes are the relative contribution of eachtrophic group to the overall biomass density. The trophic groups listedin the legend from top to bottom correspond to the bars from left to rightin each bar graph
Estuaries and Coasts

planktivores, macrobenthivores, penaeids and detritivores, mademajor contributions to overall biomass density, while contribu-tions from nektivores were intermediate and other groups wereconsistently low (<3 %). Planktivores contributed the greatestproportionof biomass in all reaches,with the contributiondeclin-ing from downstream to upstream,while detritivores showed thereversepatternwith thehighest contributions inupstreamreachesand lowest downstream (Fig. 3).
Spatial and Temporal Variation in Contributionof Trophic Groups to Biomass
Estuary identity, for some estuaries Reach, influenced the pro-portional contributions of the different trophic groups to
biomass in each of the studies (Fig. 4). The biomass compo-sition was similar among reaches in half the estuaries in theSpatial study (right branch of primary split in Fig. 4a), withplanktivores, detritivores, macrobenthivores and penaeidsdominant throughout these estuaries. In the other ten estuaries,trophic composition varied substantially among reaches. Inthose estuaries, contributions by planktivores andmacrobenthivores were high, and detritivores low inDownstream and Mid reaches, while contributions inUpstream reaches were dominated by planktivores andmicrobenthivores, with greatly increased detritivore but re-duced macrobenthivore contributions. Microbenthivoresmade particularly large contributions in Upstream reaches offour estuaries (Deluge, Mossman, Ross and Saltwater). The
0.0
0.5
0.0
0.5
0.0
0.5
0.0
0.5
0.0
0.5
0.0
0.5
TRIP
ESTUARY ESTUARY
Nov 2007
Feb 2008
July 2008Sept 2008
Oct 2008Nov 2008
Dec 2007
Mar 2008Apr 2008May 2008
Dec 2008Jan 2009
Cocoa CkCrab CkDoughboy CkHealy CkInsulator Ck
Cocoa CkCrab CkDoughboy CkMud CkSandfly Ck
Bluewater CkHell Hole CkMud CkSandfly Ck
Bluewater CkHealy CkHell Hole CkInsulator Ck
planktivoremacrobenthospenaeiddetritivoremicrobenthivoreherbivoreinsectivore
(64) (43)
(40) (66)
b
Fig. 4 (continued)
Estuaries and Coasts
contributions of penaeids were small for the same fourUpstream reaches but were substantial in other reaches acrossboth studies. Overall, groupings of Estuaries in the Spatialstudy (Fig. 4a) appeared to be haphazard, with no indicationof large-scale spatial groupings (e.g. Bays); rather, eachLocation group comprised estuaries from across the studyarea.
While planktivores and detritivores, and to a lesser extentmacrobenthivores and penaeids, dominated biomass acrossthe Temporal study (Fig. 4b), there were changes in the rela-tive contributions of these groups over space and time. Aprimary temporal change was a function of a shift in domi-nance from detritivores in what was largely a ‘late dry season’group (November 2007 and July to November 2008 plusFebruary 2008) to planktivores in the ‘wet season’ group(December 2007, March to May 2008, December 2008,January 2009). Patterns of relative biomass density differedspatially for both seasonal groups, with Cocoa, Crab,Doughboy, Mud and Sandfly Creeks having particularly lowdetritivores biomass densities among the wet season samples,and Bluewater, Hell Hole, Mud and Sandfly Creeks havingsimilar planktivore, macrobenthivore, penaeid and detritivorecontributions among the late dry season samples.
Reach-Specific Distribution of Individual Trophic Groups
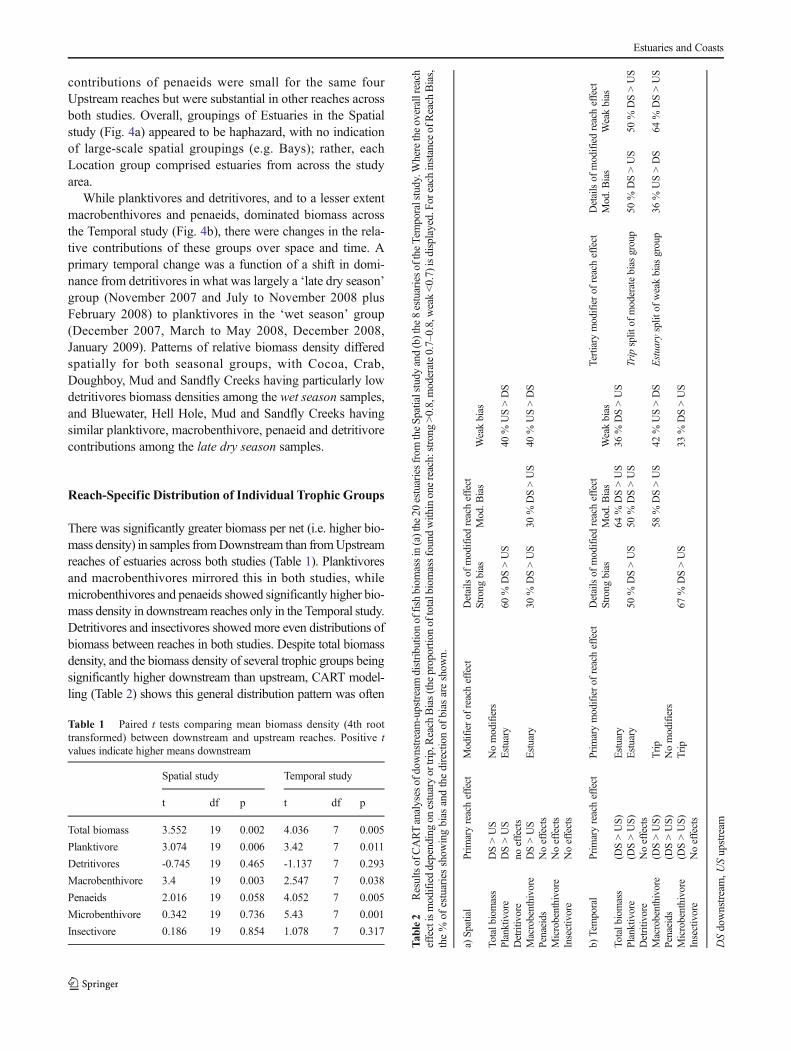
There was significantly greater biomass per net (i.e. higher bio-mass density) in samples fromDownstream than fromUpstreamreaches of estuaries across both studies (Table 1). Planktivoresand macrobenthivores mirrored this in both studies, whilemicrobenthivores and penaeids showed significantly higher bio-mass density in downstream reaches only in the Temporal study.Detritivores and insectivores showed more even distributions ofbiomass between reaches in both studies. Despite total biomassdensity, and the biomass density of several trophic groups beingsignificantly higher downstream than upstream, CART model-ling (Table 2) shows this general distribution pattern was often
Table 1 Paired t tests comparing mean biomass density (4th roottransformed) between downstream and upstream reaches. Positive tvalues indicate higher means downstream
Spatial study Temporal study
t df p t df p
Total biomass 3.552 19 0.002 4.036 7 0.005
Planktivore 3.074 19 0.006 3.42 7 0.011
Detritivores -0.745 19 0.465 -1.137 7 0.293
Macrobenthivore 3.4 19 0.003 2.547 7 0.038
Penaeids 2.016 19 0.058 4.052 7 0.005
Microbenthivore 0.342 19 0.736 5.43 7 0.001
Insectivore 0.186 19 0.854 1.078 7 0.317
Tab
le2
ResultsofCARTanalysesofdownstream-upstreamdistributio
noffish
biom
assin(a)the
20estuariesfrom
theSpatialstudy
and(b)the
8estuariesoftheTemporalstudy.W
heretheoverallreach
effectismodifieddependingon
estuaryor
trip,R
each
Bias(the
proportio
noftotalbiomassfoundwith
inonereach:strong
>0.8,moderate0.7–0.8,weak<0.7)isdisplayed.Fo
reachinstance
ofReach
Bias,
the%
ofestuariesshow
ingbias
andthedirectionof
bias
areshow
n.
a)Sp
atial
Prim
aryreacheffect
Modifierof
reacheffect
Detailsof
modifiedreacheffect
Strong
bias
Mod.B
ias
Weakbias
Totalb
iomass
DS>US
Nomodifiers
Planktivore
DS>US
Estuary
60%
DS>US
40%
US>DS
Detritivore
noeffects
Macrobenthivore
DS>US
Estuary
30%
DS>US
30%
DS>US
40%
US>DS
Penaeids
Noeffects
Microbenthivore
Noeffects
Insectivore
Noeffects
b)Temporal
Prim
aryreacheffect
Prim
arymodifierof
reacheffect
Detailsof
modifiedreacheffect
Tertiary
modifierof
reacheffect
Detailsof
modifiedreacheffect
Strong
bias
Mod.B
ias
Weakbias
Mod.B
ias
Weakbias
Totalb
iomass
(DS>US)
Estuary
64%
DS>US
36%
DS>US
Planktivore
(DS>US)
Estuary
50%
DS>US
50%
DS>US
Trip
split
ofmoderatebias
group
50%
DS>US
50%
DS>US
Detritiv
ore
Noeffects
Macrobenthivore
(DS>US)
Trip
58%
DS>US
42%
US>DS
Estuary
split
ofweakbias
group
36%
US>DS
64%
DS>US
Penaeids
(DS>US)
Nomodifiers
Microbenthivore
(DS>US)
Trip
67%
DS>US
33%
DS>US
Insectivore
Noeffects
DSdownstream,U
Supstream
Estuaries and Coasts

modifiedbyspatial and, in somecases, by temporal factors. In theSpatial data set (Table 2a), the models indicate the consistentdownstream bias for Total biomass across estuaries, but thisReach bias varied among estuaries for planktivores andmacrobenthivores. Reach bias was considered strong if >0.8 oftotal biomasswas found in one reach, intermediate if 0.7–0.8 andweak if <0.7 of total biomasswas concentrated in one reach. Theoverall reach bias, with planktivore biomass concentrated indownstream reaches, varied among estuaries; 60 % of estuariesshowedastrongdownstreambiaswith90%of thebiomass in thedownstreamreach,while the remaining40%ofestuaries showedaweak upstreambiaswith a little over 60%of biomass upstream(Table 2a). Similarly, in 30 % of estuaries macrobenthivoresshowed a strongDownstream>Upstreambias, 30% amoderateDownstream > Upstream bias and 40 % a weak Upstream >Downstreambias.For theTemporal study(Table2b), all estuariesshowed a moderate or weak Downstream > Upstream bias inbiomass with no temporal effects. The situation was similar formicrobenthivores, with all estuaries displaying a strong or weakDownst ream > Upst ream bias . P lankt ivores andmacrobenthivores showed both spatial and temporal modifica-tion of their downstream Reach biases. Planktivores showedstrong (50 % of Estuaries) to moderate (50 % of Estuaries)Downstream > Upstream biases across all estuaries, but the biaswas weak during 50 % of Trips for the Bmoderate Estuary bias^group. Macrobenthivores showed moderate Downstream >Upstream bias for 58 % of Trips but weak Upstream >Downstreambiases for the remainingTrips. However, the ‘weakTrip bias’ effect was averaged over a group of 36% of EstuariesshowingamoderateUpstream>Downstreambiasandagroupof64%ofEstuaries showingaweakDownstream>Upstreambias.Forpenaeids, theDownstream>Upstreambiaswasnotmodifiedby Estuary or Trip. Herbivores showed a clear Downstream >Upstream bias but were not included in formal analyses becauseof the high number of samples from which they were absent(Spatial study: 55 % of downstream and 95% of upstream sam-ples;Temporal study: 52%ofdownstreamand63%ofupstreamsamples).
Neither detritivores nor insectivores showed any consistentDownstream versus Upstream bias in either study. For insec-tivores, this may be due to a lack of power to detect differencesbecause of their low overall biomass contribution (Fig. 3);however, this is not the case for detritivores, which contribut-ed a major proportion of biomass, particularly in Upstreamreaches.
Discussion
Biomass density was dominated across estuaries, amongreaches and over time by planktivores and macrobenthivores,with more variable contributions by detritivores, penaeids andmicrobenthivores. Total biomass and the biomass of all major
trophic groups were concentrated in downstream reaches, butthe relative contributions from the different trophic groupsvaried over space and time. The consistent concentration ofbiomass downstream and spatio-temporal differences in thecontributions by the different trophic groups indicates sub-stantial differences in food web structure, differences in thecontributions from different sources of nutrition and probablyunequal flow of productivity into higher levels of the foodweb in different parts of the estuary. Taken together, thesesuggest significant functional differences among estuaryreaches, with qualitative and quantitative differences inecosystem-supporting processes. Beyond the implicationsfor ecological functioning, there are substantial consequencesfor the prioritisation for development, conservation and resto-ration efforts, for strategic decisions on zoning and offsets andfor the way that assessment and monitoring need to beconducted.
Among-Estuaries Variation in Biomass Density
Trophic identity had the strongest influence on overall biomassdensity, greater than spatial or temporal factors. Planktivores,detritivores, penaeids andmacrobenthivores dominated biomassacross both studies, while microbenthivores only provided sub-stantial contributions in the estuaries of the Spatial study.Despite this consistent pattern of dominance, there were clearspatio-temporal differences in trophic composition, indicatingfood web structure varied from place to place and over time.Seasonal shifts related to a switch from high planktivore andpenaeid biomass density during the wet season, to highmacrobenthivore and detritivore biomass density by the end ofthe dry season, aligningwith known seasonal shifts in sources ofproductivity (Abrantes and Sheaves 2010).
There was considerable estuary-to-estuary variation in thecontributions of different trophic groups, but this tended to behaphazard rather than reflecting similarities between adjacentestuaries or latitudinal shifts in the contributions of differenttrophic groups. Similarly, while the magnitude of biomassdensity varied over time and among estuaries, the variabilityagain appeared haphazard rather than relating to large scalespatial structure. This contrasts with what might be expected ifestuary-to-estuary differences were influenced by estuaryproximity (i.e. groupings of adjacent estuaries) or latitude.This among-estuary variation aligns with previous studies inthe region (Sheaves and Johnston 2009) and internationally(e.g. Blaber and Milton 1990; Harrison 2005) that found sim-ilar low levels of estuary-to-estuary similarity in assemblagecomposition and abundance. Sheaves and Johnston (2009)found that at least some of the among-estuary variability couldbe explained by a range of what they termed ‘estuary-scaleecological variables’ such as intertidal area, tidal range andmangrove area. Sheaves (2016) further explored the driversof among-estuary variability and suggested that much of it
Estuaries and Coasts

could be explained by the interaction of these estuary-scalevariables, spatially variable supply of larvae from offshorespawning sites and estuary-to-estuary differences in residentspecies population dynamics.
Reach-Specific Differences in Food Web Structureand Function
In contrast to the haphazard pattern of estuary-to-estuary dif-ferences, there were substantial systematic changes in the con-tributions of trophic groups among reaches in many of theestuaries, with upstream reaches usually having lower relativecontributions from macrobenthivores, prawns and herbivores.These changes in contribution were matched by a consistentreach-specific pattern of substantially higher biomass densi-ties Downstream than Upstream for all major trophic groupsexcept detritivores and insectivores. Variability in channelwidth within reaches, among reaches and among estuaries,the large changes in water volume over the tidal cycle andthe fact that the densities of many species are greater alongbanks than in mid-stream habitats (Sheaves and Johnston2008), make it difficult to convert these biomass density datato estimates of total biomass or standing stock per reach.However, the estuaries across the study area are much largerdownstream than upstream (the ratio of the main channelwidth of downstream: mid estuary: upstream reaches is ap-proximately 6:3:1, with a similar ratio of low tide depthsamong reaches; Sheaves unpublished data). This means thereis a much greater area of habitat and probably an order ofmagnitude greater biomass downstream than upstream.
The Downstream concentration of the biomass of groupslike macrobenthivores and planktivores, that are importantdrivers of food web dynamics (Baker and Sheaves 2005;Prado et al. 2013), and the contrast in the pattern fordetritivores compared to other trophic groups, strongly sug-gests that different food chains dominate in different parts ofestuary. These three groups represent major food web path-ways with energy and nutrients channelled upwards via: (i)phytoplankton productivity (planktivores), (ii) the integrationof organic material into food chains by invertebrate benthos(macrobenthivores) and (iii) the direct conversion on detritalmaterial into fish biomass (detritivores). Some caution arenecessary in interpreting the pattern of detritivores biomass;the use of cast nets may have biased the data because of thepotential to underrepresent larger mobile detritivores suchlarge mugilids. However, this potential bias does not appearto have been important because the lack of downstream bias indetritivores biomass accords with data from gill netting andisolation fish-to-extinction experiments conducted by Blaberet al. (1989) in other northern Australian estuaries that shouldnot have suffered from this potential bias.
The observed changes in the dominance of these pathwayshave far reaching implications for the relative importance of
major ecological processes in different areas of tropical estu-aries. The extent and nature of these differences indicate notonly changes in food web structure, but also consistent differ-ences in contributions by different sources of nutrition (prima-ry producers) in different parts of the estuary. This adds up tothe likelihood of functional differences among reaches, withchanges in the importance of different trophic pathways andbasal sources of nutrition. In turn, this suggests that the differ-ent reaches are the sites for qualitatively and quantitativelydifferent ecosystem-supporting processes, an idea parallel tothe Functional Process Zones of Thorp et al. (2006) for river-ine ecosystems.
Spatio-temporal changes in food web structure are com-mon (Baker et al. 2013; Bergamino et al. 2011), althoughthe extent to which food webs are impacted by changes introphic composition appears to be site- and situation-specific(Claudino et al. 2013). Where spatio-temporal change andvariation in food web structure do occur, there are far reachingconsequences for ecosystem processes, such as the alternationof biotic drivers (e.g. shifts between competition and preda-tion depending on the location- or time-specific nature andsize of predator assemblages (Orrock et al. 2008)), changesin the effects of trophic subsidies (Kostecki et al. 2010),changes in spatio-temporal coupling and interaction of re-sources (Marczak et al. 2007), or changes in the overall tro-phic transfer efficiencies (Jennings et al. 2002). These varia-tions in ecosystem process often result in changes in commu-nity dynamics (Bergamino et al. 2011; Polis and Strong 1996)that can be important in maintaining biodiversity (Pasquaudet al. 2010) and promoting ecosystem resilience (Elliott andQuintino 2007). At the same time, variations in food webstructure can require adaptation of feeding strategies to chang-ing food availability (Olin et al. 2012) and optimisation ofavailable food resources (Elliott and Quintino 2007).
The Role of Biomass in Food Web Understanding
The need to include biomass dynamics in food webs has longbeen understood (Polis 1999) but often seems to beoverlooked in an era of stable isotope analysis-dominatedfood web studies. Concentrating on biomass leads to foodweb models (e.g. Fig. 5) with a very different emphasis towebs derived from stable isotope analysis (e.g. Abrantes andSheaves 2009). At the most basic level, considering biomassfocuses on feeding groups rather than species, which are gen-erally the foci of stable isotope-based food webs. The focus onfeeding groups and their biomasses means the emphasis is onbiomass pools and magnitudes of flow rather than on sourcesof productivity (Walters et al. 2008); in contrast, stable isotopeanalysis provides information about sources of nutrition butprovides limited information on the relative strengths of thedifferent carbon pathways (e.g. which species mediate trans-fers and which particular pathways are conduits for the major
Estuaries and Coasts

flows of carbon and nutrients) or which pathways are mostimportant to ecosystem function. The biomass-based foodweb for this study (Fig. 5) emphasises the importance ofplanktivores and macrobenthivores, particularly in down-stream parts of these tropical estuaries—information thatgreatly enhances the value of isotope based food webs. Forexample, including biomass flows to the isotope-based foodweb in Fig. 7 of Abrantes and Sheaves (2009) for DelugeInlet, one of the study estuaries, would substantially expandthe relevance of the isotope work in that study by quantifyingthe magnitude of production/energy flowing through each ofthe pathways in the foodweb.
The foodwebdepicted inFig. 5 also showshowlarge thegapsin our understanding of the trophic functioning of tropical estuar-ies are. For instance, although the present study provides somedetail for fish consumer groups, and we have some idea of ulti-mate sources from stable isotope analysis (e.g. Abrantes andSheaves 2009) and of the intermediate links from dietary studies(e.g. Baker and Sheaves 2005), there is no real understanding ofthe importance of individual invertebrate trophic groups or
species that mediate the flow of nutrients to higher tropic levels(Antonioetal.2010).Asaconsequence, there isnounderstandingof the importance of many linking pathways—hence the depic-tion of sources and invertebrate trophic levels with equal sizeboxes and linkageswith dashed lines in Fig. 5 to emphasise theseknowledge gaps.
Integrating biomass, diet and stable isotope studies is crit-ical for understanding food webs. Isotope studies provide in-formation about the presence of flows, but not magnitudes,diets delineate specific linkages but not magnitudes (Bakeret al. 2014); biomass adds this critical item of knowledgeneeded to quantify the importance of particular pathwaysand trophic interactions in supporting ecosystem function.An example of the importance of this complementaryinformation can be seen in the dashed line dividing theplanktivore boxes in Fig. 5; depicted this way to include theunderstanding from Abrantes and Sheaves (2009) that thereare two isotopically distinct planktivore groups in Australia’stropical estuaries. One of the groups has a depleted δ13C sig-nature, apparently indicating feeding on ‘estuarine’
MID ESTUARY
UPSTREAM
inse
c�vo
re
detr
i�vo
re
plan
k�vo
re
pena
eids
mic
robe
nthi
vore
mac
robe
nthi
vore
herb
ivor
e
MPB phytoplanktonmangroves seagrass
zooplankton[estuary]
POM/ detritus
zooplankton[offshore]
macro-zoobenthos
micro-zoobenthos
insects
epiphytes/ macroalgae
DOWNSTREAM
Fig. 5 A general food web based on biomass for tropical easternAustralian estuaries. Box widths for the trophic groups show the relativebiomasses in each reach based on averages from across the study. NOTE:this is an ‘average’ food web for all the estuaries in the Spatial study withno attempt made to depict spatial differences. Assumed trophic linkagesfeeding in to the nekton trophic groups are depicted in the lower parts ofthe figures based on published literature; primarily Abrantes and Sheaves(2009) for the sources and invertebrate linkages, and Baker and Sheaves
(2005) and Wilson & Sheaves (2001) for the invertebrate-fish linkages.These trophic components (rounded boxes and ellipses) are shown withequal sizes to emphasise that we have insufficient knowledge todifferentiate their relative importances. Arrows feeding up into thenekton trophic components are dashed to indicate that there isinsufficient knowledge of the details of the amounts flowing along eachpathway or the specific organismsmost responsible for transfers along thepathways
Estuaries and Coasts

zooplankton compared with the second planktivore group thathas a relatively enriched δ13C signature, probably reflectingfeeding on more ‘marine’ zooplankton. Combining ap-proaches to gain deeper, more specific knowledge is criticalgiven the increasing realisation of the intricacies and impor-tance of spatio-temporal variation in food webs and nutrientflows across a variety of aquatic ecosystems (e.g. Bergaminoet al. 2013; Burghart et al. 2013; Claudino et al. 2013).
Implications for Conservation and Management
The current study provides new ecological detail needed to sup-port strategic decisions about the siting of development activi-ties, the prioritisation of areas for conservation, the imposition ofzoning, the location and nature of environmental offsets and thenature of ecosystem repair and remediation actions (e.g. Coleset al. 2015; Grech et al. 2013; Weinstein and Litvin 2016). Thesubstantial within-estuary differences in the nature of food websupport and the variation in productivity underlined by spatialchange in biomass density make it clear that such managementactions will have different outcomes depending on the locationin which they occur. For instance, management of change indownstream estuarine areas needs to take particular care to min-imise impacts on planktonic food webs, while a greater focus ondetritivore food webs is required in upstream areas. Similarly,fundamental differences in tropic organisation mean that reme-diation actions in upper estuarine areas may be inappropriate asoffsets for impacts occurring in the lower estuary.
The implications of this study go beyond the provision ofecological insights. The ability of the simple cast netting ap-proach to produce estimates of biomass per unit area providesa new way to estimate the relative value of different estuarycomponents. Outside of better studied areas of the world(Weinstein and Litvin 2016; Zimmerman et al. 1984), reliablequantitative estimates of biomass are uncommon. In otherareas, such estimates are rare because of limited resources,the inability of many sampling approaches to provide data thatrelate to a defined spatial area (Baker and Minello 2011) andbecause few gears can be used across more than a few of themany habitats encountered in estuaries (Rozas and Minello1997). The cast netting approach provides a simple, cost-effective alternative that provides estimates based on highreplication and comparable across many estuary habitats,and so likely to be suitable to many situations (Baker andMinello 2011). Moreover, biomass relates to ecosystem pro-ductivity and directly to fisheries species. Such data is suitablefor a variety of management applications that require biolog-ically meaningful measures of value for assessment or spatialprioritisation (deciding among ecosystem repair options (e.g.Creighton et al. 2015) or evaluating different offset options(e.g. Coles et al. 2015)). They are particularly useful becausethey relate to values that are readily recognised by decisionmakers and understood by end-users (Dutra et al. 2015).
The current study does not provide all the detail necessaryto completely remedy the deficiencies in current understand-ing; however, it does provide new knowledge of the extent ofspatial variation in the flow of productivity that can provide
Table 3 Future research directions; needs and examples of studies
Need Examples
Understand the details and generality of differences in trophic support indifferent estuary reaches
• Studies aimed at validating the results of the current study at more extensivespatial scales, and under different physical scenarios (e.g. climates, tides,system types, system sizes)
• Collecting the detailed stable isotope, dietary and biomass data needed forreliable Ecopath modelling
Understanding the nature of sources of trophic support • Spatio-temporally explicit, linked stable isotope, dietary and biomassstudies to determine the extent to which nutrition of plankton-based foodwebs is derived from:
◦ Phytoplankton vs. particulate organic carbon;◦ Allochthonous vs. autochthonous sources◦ Inwelling vs. outwelling
Understand connectivity in the context of spatially- and temporally-specific sources of food web support
• Linking food web understanding to knowledge of life-history habitatutilisation and, within that, to knowledge of short term feeding migrations(tidal or day-to-day)
Understand the implications of spatial differences in food webs andtrophic support for estuary repair and remediation
• Relate spatial patterns in food web structure and sources of carbon to areasalready lost and to patterns of human development of estuaries
Understand temporal variation in food web support and the extent towhich remediation needs to addresses alternation of supportingresources
•Long-term and multi-scale studies of the dynamics of food web support indifferent reaches
Developing assessments and monitoring programs that take account ofspatio-temporal changes in food web structure and function
•Developing assessments programs, baseline studies and monitoring plans toincorporate and measure differences in the nature of ecosystem support indifferent reaches and over time
Estuaries and Coasts

the impetus and direction for further work information (e.g.Table 3). Such studies should not be conducted in isolationbecause their values depend on the quality of complementaryinformation. For instance, the value of understanding spatio-temporal variation in foodweb support is greatly diminished ifthe life-history utilisation of habitats or intra-mosaic dynamicsare poorly resolved (Nagelkerken et al. 2015). It is also criticalthat they are supported by assessment and monitoring ap-proaches able to provide sensitive detection of change (Tealand Weinstein 2002).
Acknowledgments Conflict of interest The authors declare that theyhave no conflict of interest. This project was supported by a grant fromthe Marine and Tropical Sciences Research Facility. We thank RossJohnston and the many field volunteers whose assistance made the ex-tensive field work possible.
References
Abrantes, K., andM. Sheaves. 2009. Food web structure in a near-pristinemangrove area of the Australian wet tropics. Estuarine Coastal andShelf Science 82: 597–607.
Abrantes, K., and M. Sheaves. 2010. Importance of freshwater flow interrestrial-aquatic energetic conectivity in intermittently connectedestuaries of tropical Australia. Marine Biology 157: 2071–2086.
Abrantes, K., A. Barnett, R. Baker, and M. Sheaves. 2015. Habitat-specific food webs and trophic interactions supporting coastal-dependent fishery species: an Australian case study. Reviews inFish Biology and Fisheries 25: 337–363.
Antonio, E.S., A. Kasai, M. Ueno, N. Won, Y. Ishihi, H. Yokoyama, andY. Yamashita. 2010. Spatial variation in organic matter utilization bybenthic communities from Yura River-estuary to offshore of TangoSea, Japan. Estuarine Coastal and Shelf Science 86: 107–117.
Baker, R., and T.J. Minello. 2011. Trade-offs between gear selectivity andlogistics when sampling nekton from shallow open water habitats: agear comparison study. Gulf and Caribbean Research 23: 37–48.
Baker, R., andM. Sheaves. 2005. Redefining the piscivore assemblage ofshallow estuarine nursery habitats.Marine Ecology-Progress Series291: 197–213.
Baker, R., B. Fry, L.P. Rozas, and T.J. Minello. 2013. Hydrodynamicregulation of salt marsh contributions to aquatic food webs.Marine Ecology Progress Series 490: 37–52.
Baker, R., A. Buckland, andM. Sheaves. 2014. Fish gut content analysis:robust measures of diet composition. Fish and Fisheries 15: 170–177.
Beger, M., H.S. Grantham, R.L. Pressey, K.A. Wilson, E.L. Peterson, D.Dorfman, P.J. Mumby, R. Lourival, D.R. Brumbaugh, and H.P.Possingham. 2010. Conservation planning for connectivity acrossmarine, freshwater, and terrestrial realms. Biological Conservation143: 565–575.
Bergamino, L., D. Lercari, and O. Defeo. 2011. Food web structure ofsandy beaches: temporal and spatial variation using stable isotopeanalysis. Estuarine, Coastal and Shelf Science 91: 536–543.
Bergamino, L., J. Gomez, F.R. Barboza, and D. Lercari. 2013.Major foodweb properties of two sandy beaches with contrastingmorphodynamics, and effects on the stability. Aquatic Ecology 47:253–261.
Blaber, S.J.M., and D.A. Milton. 1990. Species composition, communitystructure and zoogeography of fishes of mangrove estuaries in theSolomon Islands. Marine biology, Heidelberg 105: 259–267.
Blaber, S.J.M., D.T. Brewer, and J.P. Salini. 1989. Species compositionand biomasses of fishes in different habitats of a tropical northernAustralian estuary: their occurrence in the adjoining sea and estua-rine dependence.Estuarine, Coastal and Shelf Science 29: 509–531.
Breiman, L., J. Friedman, R. Olshen, and C. Stone. 1984. Classificationand regression trees. Belmont: Wadsworth Internation Group.
Burghart, S.E., D.L. Jones, and E.B. Peebles. 2013. Variation in estuarineconsumer communities along an assembled eutrophication gradient:implications for trophic instability. Estuaries and Coasts 36: 951–965.
Choi, Y., and Y. Wang. 2004. Dynamics of carbon sequestration in acoastal wetland using radiocarbon measurements. GlobalBiogeochemical Cycles 18: [np].
Claudino, M.C., P.C. Abreu, and A.M. Garcia. 2013. Stable isotopesreveal temporal and between-habitat changes in trophic pathwaysin a southwestern Atlantic estuary.Marine Ecology Progress Series489: 29–42.
Coles, R.G., M.A. Rasheed, L.J. McKenzie, A. Grech, P.H. York, M.Sheaves, S. McKenna, and C. Bryant. 2015. The great barrier reefworld heritage area seagrasses: managing this iconic Australian eco-system resource for the future. Estuarine, Coastal and Shelf Science153: A1–A12.
Corn, M., and C. Copeland. 2010. The Deepwater Horizon oil spill:coastal wetland and wildlife impacts and response. In CRS Reportfor Congress, 24: Congressional Research Service.
Costanza, R., R. d’Arge, R. de Groot, S. Farber, M. Grasso, B. Hannon,K. Limburg, S. Naeem, R. O’Neill, J. Paruelo, R. Raskin, P. Sutton,and M. van den Belt. 1997. The value of the world’s ecosystemservices and natural capital. Nature 387: 253–260.
Cowley, P., and A. Whitfield. 2002. Biomass and production estimates ofa fish community in a small south African estuary. Journal of FishBiology 61: 74–89.
Creighton, C., P. Boon, J. Brookes, and M. Sheaves. 2015. RepairingAustralia’s estuaries for improved fisheries production—what ben-efits, at what cost? Marine and Freshwater Research.
De’ath, G. 2002. Multivariate regression trees: a new technique formodeling species-environment relationships. Ecology 83: 1105–1117.
De’ath, G., and K.E. Fabricius. 2000. Classification and regression trees:a powerful yet simple technique for ecological data analysis.Ecology 81: 3178–3192.
Duke, N.C., J.O. Meynecke, S. Dittmann, A.M. Ellison, K. Anger, U.Berger, S. Cannicci, K. Diele, K.C. Ewel, C.D. Field, N. Koedam,S.Y. Lee, C.Marchand, I. Nordhaus, and F. Dahdouh-Guebas. 2007.Aworld without mangroves? Science 317: 41–42.
Dutra, L.X., R.H. Bustamante, I. Sporne, I. van Putten, C.M. Dichmont,E. Ligtermoet, M. Sheaves, and R.A. Deng. 2015. Organizationaldrivers that strengthen adaptive capacity in the coastal zone ofAustralia. Ocean & Coastal Management 109: 64–76.
Eamus, D., C.M.O.Macinnis-Ng, G.C. Hose,M.J.B. Zeppel, D.T. Taylor,and B.R. Murray. 2005. Ecosystem services: an ecophysiologicalexamination. Australian Journal of Botany 53: 1–19.
Edgar, G.J., N.S. Barrett, D.J. Graddon, and P.R. Last. 2000. The conser-vation significance of estuaries: a classification of Tasmanian estu-aries using ecological, physical and demographic attributes as a casestudy. Biological Conservation 92: 383–397.
Elliott, M., and V. Quintino. 2007. The estuarine quality paradox, envi-ronmental homeostasis and the difficulty of detecting anthropogenicstress in naturally stressed areas.Marine Pollution Bulletin 54: 640–645.
Elliott, M., A.K. Whitfield, I.C. Potter, S.J. Blaber, D.P. Cyrus, F.G.Nordlie, and T.D. Harrison. 2007. The guild approach to
Estuaries and Coasts

categorizing estuarine fish assemblages: a global review. Fish andFisheries 8: 241–268.
Erwin, K.L. 2009. Wetlands and global climate change: the role of wet-land restoration in a changing world. Wetlands Ecology andManagement 17: 71–84.
Gehrke, P.C., M.J. Sheaves, D. Boseto, B.S. Figa, and J. Wani. 2011.Vulnerability of freshwater and estuarine fisheries in the tropicalPacific to climate change. Vulnerability of Tropical PacificFisheries and Aquaculture to Climate Change. Secretariat of thePacific Community, Noumea, New Caledonia: 577–645.
Grech, A., M. Bos, J. Brodie, R. Coles, A. Dale, R. Gilbert, M. Hamann,H. Marsh, K. Neil, R. Pressey, M. Rasheed, M. Sheaves, and A.Smith. 2013. Guiding principles for the improved governance ofport and shipping impacts in the great barrier reef. MarinePollution Bulletin 75: 8–20.
Harrison, T.D. 2005. Ichthyofauna of South African estuaries in relationto the zoogeography of the region. Smithiana Bulletin: 1–27.
Harrison, T., and A. Whitfield. 2008. Geographical and typologicalchanges in fish guilds of south African estuaries. Journal of FishBiology 73: 2542–2570.
Harrison, T., and A. Whitfield. 2012. Fish trophic structure in estuaries,with particular emphasis on estuarine typology and zoogeography.Journal of Fish Biology 81: 2005–2029.
Jennings, S., K.J. Warr, and S. Mackinson. 2002. Use of size-based pro-duction and stable isotope analyses to predict trophic transfer effi-ciencies and predator-prey body mass ratios in food webs. MarineEcology Progress Series 240: 11–20.
Kent, J. 2007. Spatial and temporal variation in diet and feeding habits ofzooplanktivorous fish in tropical North Queensland estuaries. JamesCook University Townsville.
Kostecki, C., F. Le Loc’h, J.-M. Roussel, N. Desroy, D. Huteau, P. Riera,H. Le Bris, and O. Le Pape. 2010. Dynamics of an estuarine nurseryground: the spatio-temporal relationship between the river flow andthe food web of the juvenile common sole (Solea solea, L.) asrevealed by stable isotopes analysis. Journal of Sea Research 64:54–60.
Lotze, H.K., H.S. Lenihan, B.J. Bourque, R.H. Bradbury, R.G. Cooke,M.C. Kay, S.M. Kidwell, M.X. Kirby, C.H. Peterson, and J.B.C.Jackson. 2006. Depletion, degradation, and recovery potential ofestuaries and coastal seas. Science 312: 1806–1809.
Marczak, L.B., R.M. Thompson, and J.S. Richardson. 2007. Meta-anal-ysis: trophic level, habitat, and productivity shape the food webeffects of resource subsidies. Ecology 88: 140–148.
Marshall, S., and M. Elliott. 1998. Environmental influences on the fishassemblage of the Humber estuary, UK. Estuarine, Coastal andShelf Science 46: 175–184.
Nagelkerken, I., M. Sheaves, R. Baker, and R.M. Connolly. 2015. Theseascape nursery: a novel spatial approach to identify and managenurseries for coastal marine fauna. Fish and Fisheries 16: 362–371.
Olin, J.A., S.A. Rush, M.A. MacNeil, and A.T. Fisk. 2012. Isotopic ratiosreveal mixed seasonal variation among fishes from two subtropicalestuarine systems. Estuaries and Coasts 35: 811–820.
Orrock, J.L., J.H. Grabowski, J.H. Pantel, S.D. Peacor, B.L. Peckarsky,A. Sih, and E.E. Werner. 2008. Consumptive and nonconsumptiveeffects of predators on metacommunities of competing prey.Ecology 89: 2426–2435.
Pasquaud, S., V. David, J. Lobry, M. Girardin, B. Sautour, and P. Elie.2010. Exploitation of trophic resources by fish under stressful estu-arine conditions. Marine Ecology Progress Series 400: 207–219.
Polis, G.A. 1999. Why are parts of the world green? Multiple factorscontrol productivity and the distribution of biomass. Oikos: 3–15.
Polis, G.A., and D.R. Strong. 1996. Food web complexity and commu-nity dynamics. American Naturalist: 813–846.
Prado, P., C. Ibanez, N. Caiola, and E. Reyes. 2013. Evaluation of sea-sonal variability in the food-web properties of coastal lagoons sub-jected to contrasting salinity gradients using network analyses.Ecological Modelling 265: 180–193.
Rozas, L.P., and T.J. Minello. 1997. Estimating densities of small fishesand decapod crustaceans in shallow estuarine habitats: a review ofsampling design with focus on gear selection. Estuaries 20: 199–213.
Salini, J.P., S.J.M. Blaber, and D.T. Brewer. 1990. Diets of piscivorousfishes in a tropical Australian estuary, with special reference to pre-dation on penaeid prawns. Marine biology, Heidelberg 105: 363–374.
Salini, J.P., D.T. Brewer, and S.J.M. Blaber. 1998. Dietary studies on thepredatory fishes of the Norman River Estuary, with particular refer-ence to penaeid prawns. Estuarine, Coastal and Shelf Science[Estuar. Coast. Shelf Sci.] 46: 837–847.
Sheaves, M. 2016. Simple processes drive unpredictable differences inestuarine fish assemblages: baselines for understanding site-specificecological and anthropogenic impacts. Estuarine, Coastal and ShelfScience 170: 61–69.
Sheaves, M., and R. Johnston. 2008. Influence of marine and freshwaterconnectivity on the dynamics of subtropical estuarine wetland fishmetapopulations. Marine Ecology-Progress Series 357: 225–243.
Sheaves, M., and R. Johnston. 2009. Ecological drivers of spatial vari-ability among fish fauna of 21 tropical Australian estuaries.MarineEcology-Progress Series 385: 245–260.
Sheaves, M., R. Johnston, and R.M. Connolly. 2010. Temporal dynamicsof fish assemblages of natural and artificial tropical estuaries.Marine Ecology-Progress Series 410: 143–156.
Sheaves,M., J. Brookes, R. Coles, M. Freckelton, P. Groves, R. Johnston,and P. Winberg. 2014. Repair and revitalisation of Australia’s trop-ical estuaries and coastal wetlands: opportunities and constraints forthe reinstatement of lost function and productivity. Marine Policy47: 23–36.
Sheaves, M., R. Baker, I. Nagelkerken, and R.M. Connolly. 2015. Truevalue of estuarine and coastal nurseries for fish: incorporating com-plexity and dynamics. Estuaries and Coasts 38: 401–414.
Teal, J.M., andM.P.Weinstein. 2002. Ecological engineering, design, andconstruction considerations for marsh restorations in Delaware Bay,USA. Ecological Engineering 18: 607–618.
Thorp, J.H., M.C. Thoms, and M.D. Delong. 2006. The riverine ecosys-tem synthesis: biocomplexity in river networks across space andtime. River Research and Applications 22: 123–147.
Vitousek, P., H. Mooney, J. Lubchenco, and J. Melillo. 1997. Humandomination of Earth’s ecosystems. Science 277: 494–499.
Walters, C., S.J. Martell, V. Christensen, and B. Mahmoudi. 2008. AnEcosim model for exploring Gulf of Mexico ecosystem manage-ment options: implications of including multistanza life-historymodels for policy predictions. Bulletin of Marine Science 83: 251–271.
Weinstein, M., and S. Litvin. 2016. Macro-restoration of tidal wetlands: awhole estuary approach. Ecological Restoration 34.
Wilson, J.P., and M. Sheaves. 2001. Short-term temporal variations intaxonomic composition and trophic structure of a tropical estuarinefish assemblage. Marine Biology 139: 787–796.
Zimmerman, R.J., T.J. Minello, and G. Zamora. 1984. Selection of veg-etated habitat by brown shrimp, Penaeus aztecus, in a GalvestonBay salt marsh. Fishery Bulletin 82: 325–336.
Estuaries and Coasts