fish and wildlife service - usfws · four principal mission goals drive the fish and wildlife...
TRANSCRIPT

FY 2002 Annual Performance Plan
FY 2000 Annual Performance Report
Fish and Wildlife Service
DEPARTMENT OF THE INTERIOR

A COMMENT ON THE PERFORMANCE GOALSCONTAINED IN THIS DOCUMENT
The goals that appear in the Fiscal Year 2002 Annual Performance Plan are based on the
Department's most recent revision of its Government Performance and Results Act strategic
plan. This strategic plan, which covers the period from Fiscal Year 2000 to Fiscal Year 2005,
was completed under the guidance and direction of the previous Administration and, there-
fore, does not necessarily reflect the policies and management priorities of the current
Administration.
During 2001, the Department will review and, where appropriate, revise the current strategic
plan. This review process will incorporate the views and concerns of the Department's part-
ners and constituencies and will, in some cases, be the basis for new or restated annual per-
formance goals and measures to provide overall direction to Interior's programs and deliver
program results.

Fish and Wildlife ServiceFY 2002 Annual Performance Plan
FY 2000 Annual Performance Report
Mission Statement and Miss ion Goals . . . . . . . . . . . . . . . . . . . . . . . . . . . . . . . . . . . . . . . . . . . . . . . . . . . . . . . . . . . .2
About this Document . . . . . . . . . . . . . . . . . . . . . . . . . . . . . . . . . . . . . . . . . . . . . . . . . . . . . . . . . . . . . . . . . . . . . . . . . . . . . . . . . . . .3
Sect ion I – Introduct ion and Overview
Introduct ion . . . . . . . . . . . . . . . . . . . . . . . . . . . . . . . . . . . . . . . . . . . . . . . . . . . . . . . . . . . . . . . . . . . . . . . . . . . . . . . . . . . . . . . . . . . . . . . . . . . .4
Strateg ic Management Through Miss ion Goals . . . . . . . . . . . . . . . . . . . . . . . . . . . . . . . . . . . . . . . . . . . . . . . . . . . . . .5
Link to Budget . . . . . . . . . . . . . . . . . . . . . . . . . . . . . . . . . . . . . . . . . . . . . . . . . . . . . . . . . . . . . . . . . . . . . . . . . . . . . . . . . . . . . . . .6
Link to DOI Goals . . . . . . . . . . . . . . . . . . . . . . . . . . . . . . . . . . . . . . . . . . . . . . . . . . . . . . . . . . . . . . . . . . . . . . . . . . . . . . . . . .8
Adjustments to the Strateg ic Plan . . . . . . . . . . . . . . . . . . . . . . . . . . . . . . . . . . . . . . . . . . . . . . . . . . . . . . . . . . . . . .9
FY 2002 Goals At A Glance . . . . . . . . . . . . . . . . . . . . . . . . . . . . . . . . . . . . . . . . . . . . . . . . . . . . . . . . . . . . . . . . . . . .10
Sect ion II – FY 2002 Annual Per formance Goals
II .1 Susta inabi l i ty of Fi sh and Wildl i fe Populat ions . . . . . . . . . . . . . . . . . . . . . . . . . . . . . . . . . . . . . . . . . . . .14
Annual Per formance Goals
1 .1 Migratory Bird Conservat ion . . . . . . . . . . . . . . . . . . . . . . . . . . . . . . . . . . . . . . . . . . . . . . . . . . . . . . . . . . . .17
1.2 Imper i led Species . . . . . . . . . . . . . . . . . . . . . . . . . . . . . . . . . . . . . . . . . . . . . . . . . . . . . . . . . . . . . . . . . . . . . . . . . . . . . .27
1.3 Inter jur i sdict ional Fi sh . . . . . . . . . . . . . . . . . . . . . . . . . . . . . . . . . . . . . . . . . . . . . . . . . . . . . . . . . . . . . . . . . . . . . .34
1.4 Marine Mammal Management . . . . . . . . . . . . . . . . . . . . . . . . . . . . . . . . . . . . . . . . . . . . . . . . . . . . . . . . . . . .39
1.5 Species of Internat ional Concern . . . . . . . . . . . . . . . . . . . . . . . . . . . . . . . . . . . . . . . . . . . . . . . . . . . . . . . .43
1.6 Invas ive Species . . . . . . . . . . . . . . . . . . . . . . . . . . . . . . . . . . . . . . . . . . . . . . . . . . . . . . . . . . . . . . . . . . . . . . . . . . . . . .48
II .2 Habitat Conservat ion – Network of Lands and Waters . . . . . . . . . . . . . . . . . . . . . . . . . . . . . . . . . . . .52
Annual Per formance Goals
2.1 Habitat Conservat ion on Serv ice Lands . . . . . . . . . . . . . . . . . . . . . . . . . . . . . . . . . . . . . . . . . . . . . . . .54
2.2 Stewardship of Serv ice Fac i l i t ie s . . . . . . . . . . . . . . . . . . . . . . . . . . . . . . . . . . . . . . . . . . . . . . . . . . . . . . . .60
2.3 Habitat Conservat ion of f Serv ice Lands . . . . . . . . . . . . . . . . . . . . . . . . . . . . . . . . . . . . . . . . . . . . . .64
II .3 Publ ic Use and Enjoyment . . . . . . . . . . . . . . . . . . . . . . . . . . . . . . . . . . . . . . . . . . . . . . . . . . . . . . . . . . . . . . . . . . . . . . . . . .72
Annual Per formance Goals
3.1 Greater Publ ic Use on Serv ice Lands . . . . . . . . . . . . . . . . . . . . . . . . . . . . . . . . . . . . . . . . . . . . . . . . . .74
3.2 Opportunit ies for Par t ic ipat ing in Conservat ion on Serv ice Lands . . . . . . . . . .78
II .4 Par tnerships in Natura l Resources . . . . . . . . . . . . . . . . . . . . . . . . . . . . . . . . . . . . . . . . . . . . . . . . . . . . . . . . . . . . . . . .82
Annual Per formance Goals
4.1 Triba l Governments . . . . . . . . . . . . . . . . . . . . . . . . . . . . . . . . . . . . . . . . . . . . . . . . . . . . . . . . . . . . . . . . . . . . . . . . . .85
4.2 Spor t Fi sh & Wildl i fe Restorat ion Grants Management . . . . . . . . . . . . . . . . . . . . . . . . . .88
4.3 Par tnerships in Accountabi l i ty . . . . . . . . . . . . . . . . . . . . . . . . . . . . . . . . . . . . . . . . . . . . . . . . . . . . . . . . . . . .91
Table of Contents
FY 2002 Annual Performance Plan
FY 2000 Annual Performance Report

Sect ion III . Addit ional GPRA Informat ion
III .1 Customer Serv ice . . . . . . . . . . . . . . . . . . . . . . . . . . . . . . . . . . . . . . . . . . . . . . . . . . . . . . . . . . . . . . . . . . . . . . . . . . . . . . . . . .96
III .2 Crosscutt ing Is sues . . . . . . . . . . . . . . . . . . . . . . . . . . . . . . . . . . . . . . . . . . . . . . . . . . . . . . . . . . . . . . . . . . . . . . . . . . . . . . . . . .97
III .3 Management Is sues . . . . . . . . . . . . . . . . . . . . . . . . . . . . . . . . . . . . . . . . . . . . . . . . . . . . . . . . . . . . . . . . . . . . . . . . . . . . . . . . . .99
III .4 Data Val idat ion & Ver i f icat ion . . . . . . . . . . . . . . . . . . . . . . . . . . . . . . . . . . . . . . . . . . . . . . . . . . . . . . . . . . . . . .102
III .5 Program Evaluat ions . . . . . . . . . . . . . . . . . . . . . . . . . . . . . . . . . . . . . . . . . . . . . . . . . . . . . . . . . . . . . . . . . . . . . . . . . . . . . .102
III .6 Capita l Asset s /Capita l Programming . . . . . . . . . . . . . . . . . . . . . . . . . . . . . . . . . . . . . . . . . . . . . . . . . . . . . . . .103
III .7 Use of Non-Federa l Par t ies in Prepar ing This Annual Per formance Plan . . . . . .104
III .8 Waivers for Manager ia l Accountabi l i ty . . . . . . . . . . . . . . . . . . . . . . . . . . . . . . . . . . . . . . . . . . . . . . . . . . 104
Appendices :
I . FY 2000 Annual Per formance Plan At A Glance . . . . . . . . . . . . . . . . . . . . . . . . . . . . . . . . . . . . . . . .106
II . FY 2001 Annual Per formance Plan At A Glance . . . . . . . . . . . . . . . . . . . . . . . . . . . . . . . . . . . . . . . .112
III . Goals /Measures Terms & Def ini t ions . . . . . . . . . . . . . . . . . . . . . . . . . . . . . . . . . . . . . . . . . . . . . . . . . . . . . .115

Fou
2
AP
P /
AP
R
Mission Statement and Miss ion Goals
OUR MISSION IS WORKING WITH OTHERS TO CONSERVE, PROTECT AND
ENHANCE FISH, WILDLIFE, AND PLANTS AND THEIR HABITATS FOR THE
CONTINUING BENEFIT OF THE AMERICAN PEOPLE.
Four principal mission goals drive the Fish and Wildlife Service‘s Strategic Plan, which support the core mission of
protection and improvement in the condition of America‘s f ish, wildlife, and plants and increase opportunities for the
public‘s enjoyment of these resources.
• Sustainability of Fish andWildlife Populations Conserve, protect, restore, andenhance fish, wildlife, and plantpopulations entrusted to our care.
• Habitat Conservation: ANetwork of Lands and WatersCooperating with others, we willconserve an ecologically diversenetwork of lands and waters —of various ownerships — providinghabitats for f ish, wildlife, andplant resources.
• Public Use and EnjoymentProvide opportunities to the publicto enjoy, understand, and participatein use and conservation of f ish andwildlife resources.
• Partnerships in Natural ResourcesSupport and strengthen partnershipswith tribal, state, and localgovernments and others in theirefforts to conserve and enjoy fish,wildlife, plants and their habitats.
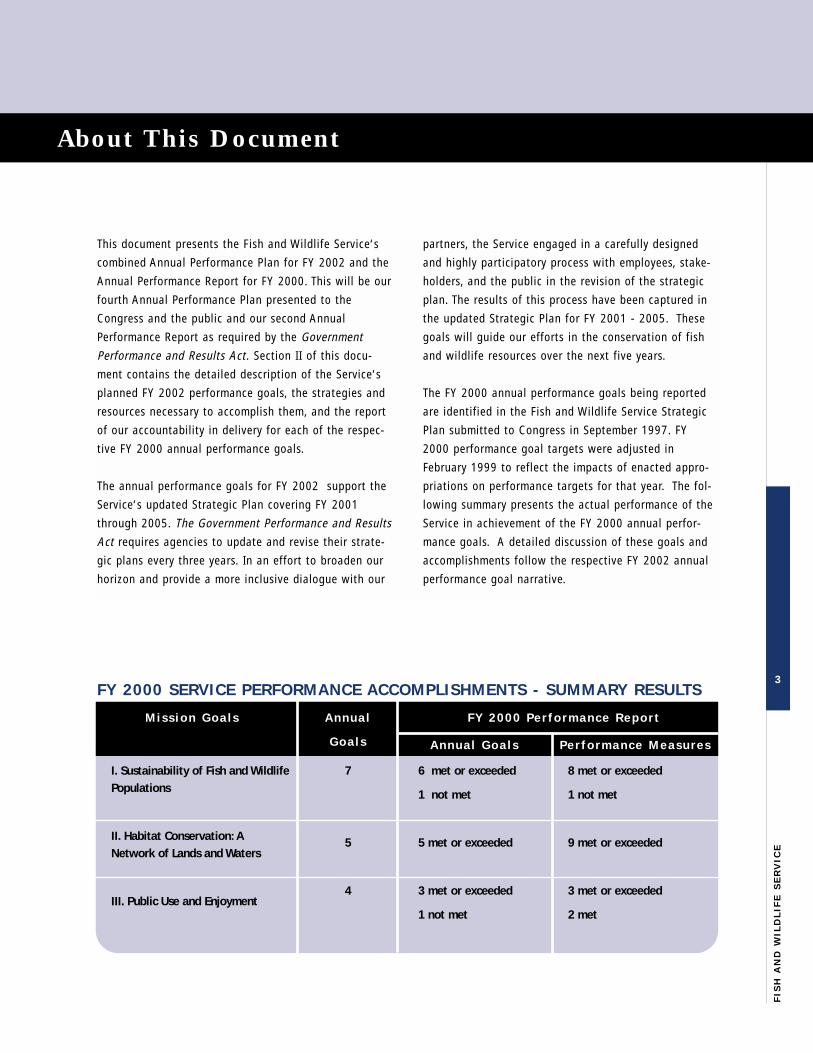
This document presents the Fish and Wildlife Service‘s
combined Annual Performance Plan for FY 2002 and the
Annual Performance Report for FY 2000. This wil l be our
fourth Annual Performance Plan presented to the
Congress and the public and our second Annual
Performance Report as required by the Government
Performance and Results Act. Section II of this docu-
ment contains the detailed description of the Service‘s
planned FY 2002 performance goals, the strategies and
resources necessary to accomplish them, and the report
of our accountabil ity in delivery for each of the respec-
tive FY 2000 annual performance goals.
The annual performance goals for FY 2002 support the
Service‘s updated Strategic Plan covering FY 2001
through 2005. The Government Performance and Results
Act requires agencies to update and revise their strate-
gic plans every three years. In an effort to broaden our
horizon and provide a more inclusive dialogue with our
partners, the Service engaged in a carefully designed
and highly participatory process with employees, stake-
holders, and the public in the revision of the strategic
plan. The results of this process have been captured in
the updated Strategic Plan for FY 2001 - 2005. These
goals wil l guide our efforts in the conservation of f ish
and wildlife resources over the next f ive years.
The FY 2000 annual performance goals being reported
are identif ied in the Fish and Wildlife Service Strategic
Plan submitted to Congress in September 1997. FY
2000 performance goal targets were adjusted in
February 1999 to reflect the impacts of enacted appro-
priations on performance targets for that year. The fol-
lowing summary presents the actual performance of the
Service in achievement of the FY 2000 annual perfor-
mance goals. A detailed discussion of these goals and
accomplishments follow the respective FY 2002 annual
performance goal narrative.
3
FIS
H A
ND
WIL
DL
IFE
SE
RV
ICE
About This Document
7
5
4
A n n u a l
G o a l s
I. Sustainability of Fish and WildlifePopulations
II. Habitat Conservation: ANetwork of Lands and Waters
III. Public Use and Enjoyment
M i s s i o n G o a l s
A n n u a l G o a l s
F Y 2 0 0 0 Pe r f o r m a n c e R e p o r t
Pe r f o r m a n c e M e a s u r e s
6 met or exceeded
1 not met
5 met or exceeded
3 met or exceeded
1 not met
8 met or exceeded
1 not met
9 met or exceeded
3 met or exceeded
2 met
FY 2000 SERVICE PERFORMANCE ACCOMPLISHMENTS - SUMMARY RESULTS

4
AP
P /
AP
R
Sect ion 1
Introduct ion and Overview
The FWS manages migratory bird populations, restores
interjurisdictional f isheries, conserves and restores
wildlife habitat, administers the Endangered Species
Act, and assists foreign governments with their conser-
vation efforts. We oversee the Federal Aid in Fish and
Wildlife Restoration Programs, which distribute hun-
dreds of mil l ions of dollars earned from excise taxes on
fishing and hunting equipment to state wildlife agencies.
A cornerstone of our conservation effort has been the
National Wildlife Refuge System — places where
Americans can experience the joys of wildlife and wild
places. The FWS is the steward of almost 94 mill ion
acres of public lands across the United States, which
compose the network of 535 refuges and 37 wetland
management districts that comprise the National
Wildlife Refuge System. The first National Wildlife
Refuge, Florida‘s Pelican Island, was established by
President Theodore Roosevelt in 1903 to protect egrets,
herons, and other birds that were being kil led for feath-
ers used in the fashions of the time. Today, refuges are
home to millions of migratory birds, open space for elk
and caribou, and wild niches for the rare and endangered.
Complementing the National Refuge System is our
National Fish Hatchery System. The Service manages 69
National Fish Hatcheries for the restoration of the
Nation‘s fishery resources. The role of the National Fish
Hatchery System has changed and diversif ied greatly
over the past 30 years as increasing demands are
placed upon aquatic systems. We are integrating the
work of f ish hatcheries and fisheries management,
resulting in a cohesive, more efficient national restora-
tion program, such as those for Great Lakes lake trout,
Atlantic Coast striped bass, Atlantic salmon, and Pacific
salmon.
The FWS headquarters is located in Washington, D.C.,
with field units throughout the United States. The
Service employs more than 8,000 people and is support-
ed by a volunteer force of 36,000 citizens. Nearly 90
percent of our employees work in field locations provid-
ing on-the-ground services in support of our public trust
responsibil it ies.
THE FISH AND WILDLIFE SERVICE‘S (FWS) ORIGIN DATES BACK TO 1871
WHEN CONGRESS ESTABLISHED THE U.S. FISH COMMISSION TO STUDY THE
DECREASE IN THE NATION‘S FOOD FISH AND RECOMMEND WAYS TO
REVERSE THE DECLINE. TODAY, THE FWS HAS THE PRIVILEGE OF BEING THE
PRIMARY FEDERAL AGENCY RESPONSIBLE FOR THE PROTECTION, CONSER-
VATION, AND RENEWAL OF FISH, WILDLIFE, PLANTS AND THEIR HABITATS.

STRATEGIC MANAGEMENT THROUGH MISSION GOALS
Four mission goals — Sustainabil ity of Fish and Wildlife
Populations, Habitat Conservation: A Network of Lands
and Waters, Public Use and Enjoyment, and Partnerships
in Natural Resources — drive the Fish and Wildlife
Service‘s Strategic Plan and support the organization‘s
core mission. The alignment of the Service‘s programs
and activit ies under these four mission goals represents
a new approach to improve the integration, coordina-
tion, and management of Service mission delivery.
The four mission goals are intended to facil itate new
working relationships and develop crosscutting policy
efforts to strengthen the effectiveness of the Service as
a whole and the public we serve. These four mission
goals provide a means for identifying relationships
among other Department of the Interior bureaus and for
building partnerships with other agencies and external
parties. The four mission goals and fourteen long-term
goals, together with the underlying principles that wil l
be used to achieve them, define the Service‘s planning,
performance, and accountabil ity process.
Mission Goal One encom-
passes the work that the
Service and our partners do
to conserve and improve fish
and wildlife populations. This
includes migratory bird con-
servation at home and abroad; native fisheries restora-
tion; recovery and protection of threatened and endan-
gered species; prevention and control of invasive
species — a significant threat to biodiversity; and work
with our international partners — recognizing that fish
and wildlife species are unencumbered by geopolit ical
borders. The Service also represents U.S. interests and
provides leadership in international negotiations related
to ensuring the health of wetlands and wetland depen-
dent species around the world, and the protection of
plant and animal species from unregulated international
trade.
Mission Goal Two recog-
nizes the fundamental
importance of an ecological-
ly diverse network of lands
and waters to the self-sus-
tainabil ity of f ish, wildlife,
and plants. The mission goal emphasizes two kinds of
strategic actions that together define, shape, and con-
serve the network: 1) the development of formal agree-
ments and plans with our partners that provide habitat
for multiple species, and 2) the actual conservation
work necessary to protect, restore, and enhance those
habitats vital to fish and wildlife populations. Central
to the Service‘s habitat conservation strategy is an
ecosystem approach which focuses on the economic
health of communities within watersheds.
Within Mission Goal
Three , the Service directs
activit ies at National
Wildlife Refuges and
National Fish Hatcheries
that increase opportunities
for the public to participate in the experience of f ish
and wildlife resources. Such opportunities include hunt-
ing, fishing, wildlife observation and photography, envi-
ronmental education and interpretation, as well as
affording the public hands-on experiences through vol-
unteer conservation activit ies on Service lands.
Mission Goal Four
includes the Service‘s key
responsibil it ies for manage-
ment and stewardship of
Federal grants to states and
territories for restoration of
fish and wildlife resources as well as our continuing
commitment to Tribal governments. Further, this goal
promotes and facil itates partnerships with other Federal
agencies where common goals can be developed in the
joint delivery of our Federal responsibil it ies and mis-
sion.
5
FIS
H A
ND
WIL
DL
IFE
SE
RV
ICE

6
AP
P /
AP
R
L INK WITH PRIORITIES AND INITIATIVES
The FY 2002 Annual Performance Plan includes our pri-
orit ies and initiatives, which are discussed in greater
detail in the Fish and Wildlife Service‘s Budget. These
priorit ies and initiatives serve as touchstones to gauge
the performance of our most crit ical programs. The pri-
orit ies and initiatives provide a second level integration
mechanism similar to the annual performance goals.
Linking the principal resource programs and the goals
of the Service to the priorit ies and initiatives reinforces
the mission and creates new opportunities for cross-
program and cross agency performance in the context of
the Service‘s Strategic and Annual Performance Goals.
This is especially important in the present environment
of rapid changes in society, science, technology, and use
of resources placing new challenges for balancing
resource conservation and resource use. The above flow-
chart i l lustrates the integrative process of strategic
planning, resources, and outcomes that is required to
meet our customer needs.
LINK TO BUDGET
The four mission goals provide a means of aligning the
budget, which is a functional grouping of program
activit ies, with the crosscutting long-term and annual
performance goals. These four key mission goals allow
for the consolidation and aggregation of various pro-
gram activit ies of the Service. Encompassing the
Service‘s many programs and functions, the four mission
goals and the priorit ies and initiatives represent signifi-
cant actions by the Director and the Service manage-
ment team to move the Service in the more integrated
organization. The FY 2001 and FY 2002 Annual
Performance Plans are the product of efforts to estab-

7
FIS
H A
ND
WIL
DL
IFE
SE
RV
ICE
l ish a more effective strategic planning and performance
management process within the Service.
The iterative strategic planning and performance man-
agement approach, shown on the previous page, recog-
nizes the unique contributions of FWS programs, as well
as state, Tribal, and territories and other Federal part-
ners. This approach will advance a national effort to
continue to improve the integration of activit ies and
enhance performance and accountabil ity.
The FY 2002 Annual Performance Plan presents the
Service‘s goals and measures, and identif ies the strate-
gies needed to achieve them within currently available
resources, consistent with the updated Strategic Plan.
The Plan‘s goals are explicit in measurabil ity providing
a transparent performance determination. This presenta-
tion provides decision makers a broader context by
which to make informed decisions on the allocation or
reallocation of currently available resources to better
accomplish the mission of the organization. Our strate-
gic planning and performance management approach,
which recognizes stakeholder interests and programmat-
ic uniqueness, wil l promote a single Service concept –
ultimately improving performance and accountabil ity.

8
AP
P /
AP
R
L INK TO THE DEPARTMENT OF THE INTERIORGOALS
The U.S. Fish and Wildlife Service prepared its f irstStrategic Plan as required by GPRA in September 1997and its f irst Annual Performance Plan in February 1999.The Service is guided by four strategic mission goalsand fourteen long-term goals expounded in the FY
2001-2005 Fish and Wildlife Service Strategic Plan. Thefour mission goals and fourteen long-term goals arealigned and support the Department of the Interior‘sbroader agency goals and contribute to the overall envi-ronmental conservation goals of the Nation. The follow-ing table shows that relationship. An explanation of theDepartment‘s goals may be found in the DOI Overview.
D e p a r t m e n t a l G o a l s M i s s i o n G o a l s a n d L o n g - t e r m G o a l s
1. Protect the Environment and Preserve Our
Nation‘s Natural and Cultural Resources
1. Sustainability of Fish and Wildlife Populations
• Migratory Birds
• Imperiled Species
• Interjurisdictional Fish
• Marine Mammals
• Species of International Concern
• Invasive Species Management
2. Habitat Conservation: A Network of Lands and Waters
• Habitat Conservation on Service Lands
• Stewardship of FWS Facilities
• Habitat Conservation Off Service lands
4. Partnership in Natural Resources
• Tribal Governments
3. Public Use and Enjoyment
• Greater Public Use on Service Lands
• Opportunities for Participation in
Conservation on Service Lands
4. Partnership in Natural Resources
• Sport Fish & Wildlife Restoration
Grants Management
• Partnerships in Accountability
5. Meet Our Trust Responsibilities toAmerican Indians and our Commitments toIsland Communities
4. Provide Science for a Changing World
3. Manage Natural Resources for a HealthyEnvironment and a Strong Economy
2. Provide Recreation for America
The mission of the U.S. Fish and Wildlife Service, as deliveredthrough the strategic goals, contributes primarily to theDepartment‘s goals 1 and 2. However, Service activities andefforts do contribute and support other DOI bureaus whose mis-sion is central to DOI goals 3 and 4.

9
FIS
H A
ND
WIL
DL
IFE
SE
RV
ICE
ADJUSTMENTS TO THE STRATEGIC PLAN
Adjustments to four strategic goal targets were made to
reflect actual performance accomplishments from 1999
through 2000. The goals, covering the period from 1997
through 2005, which are affected by this change in per-
formance target:
Long Term Goal 1.1
Migratory Bird Populations – decrease in the per-
cent of migratory bird populations that wil l demonstrat-
ed improvement in their population status from 20% to
12%.
Long Term Goal 1.2
Imperiled Species – increase in number of species
listed under the ESA as endangered or threatened a
decade or more that are either stable or improving from
371 to 404.
Long Term Goal 2.1
Habitat Conservation On Service Lands –
increase the # acres restored on Service lands from
600,000 acres to 850,000 acres, and annual improve-
ment/enhancement of 3.2 mill ion acres of habitats.
Long Term Goal 2.3
Habitat Conservation Off Service Lands – increase
in the number of wetland acres enhanced or restored
from 280,000 acres to 550,000 acres, increase in
upland habitat restored from 525,000 acres to
1,000,000 acres, increase in riparian miles enhanced or
restored from 4,150 miles to 9,800 miles.

10
AP
P /
AP
R
L o n g - t e r m G o a l sPe r f o r m a n c e Ta r g e t s
1.1 By 2005, 12% (48 populations) ofmigratory bird populations demonstrateimprovements in their population status.
a. 2% (15/252) migratory bird pop-ulations with baseline informationhave improved status
b. 10% (15/148) baseline monitor-ing programs initiated for migratorybird programs–data collection initi-ated
c. 2 baseline monitoring programscompleted-- data collection com-pleted
a. 2 marine mammal stocks
a. 347 species are stable orimproving
b. 3 species are delisted
c. listing of 3 species at risk ismade unnecessary
1.5 By 2005, 40 priority species of interna-tional concern will be conserved.
1.4 By 2005, three marine mammal stockswill have current censuses available to main-tain populations at optimum sustainable lev-els; harvest guidelines for all marine mam-mal stocks will be in place, through coopera-tive management agreements, for continuedsubsistence uses.
1.3 By 2005, 12 depressed interjurisdictionalnative fish populations are restored to self-sustaining or, where appropriate, harvestablelevels.
1.2 Through 2005, 404 species listed under theEndangered Species Act as endangered or threat-ened a decade or more are either stable orimproving, 15 species are delisted due to recov-ery, and listing of 12 species at risk is madeunnecessary due to conservation agreements.(Represents 43% [404/943] of those listed adecade or more)
a. 3 depressed fish populations
F Y 2 0 0 2 F Y 2 0 0 5
a. 12% (48) of migratory birdpopulations have improve status
a. 404 species are stable or improving
b. 15 species delisted
c. listing of 12 species at risk is madeunnecessary
a. 12 depressed fish populations
a. 3 marine mammalstocks
a. 26 priority species a. 40 priority species
1.6 By 2005, the Service will prevent importationand expansion, or reduce the range (or populationdensity) of aquatic and terrestrial invasive specieson and off Service lands by controlling them on13,450 acres off Service lands and 850,000 acreswithin the National Wildlife Refuge System(NWRS), conducting risk assessments on 20 highrisk invasive species for possible amendment of theinjurious wildlife list, and developing 5 additionalcooperative prevention and/or control programs foraquatic invasive species (coordinated through theANS Task Force).
a. 170,000 NWRS acres
b. 2,690 acres controlled
c. 4 risk assessments
d. 2 prevention and/or control programsdeveloped
a. 850,000 NWRS acres
b. 13,450 acres controlled
c. 20 risk assessments
d. 5 prevention and/or control programsdeveloped
1 . S U S T A I N A B I L I T Y O F F I S H A N D W I L D L I F E P O P U L A T I O N S
FY 2002 Goals At A Glance
11
FIS
H A
ND
WIL
DL
IFE
SE
RV
ICE
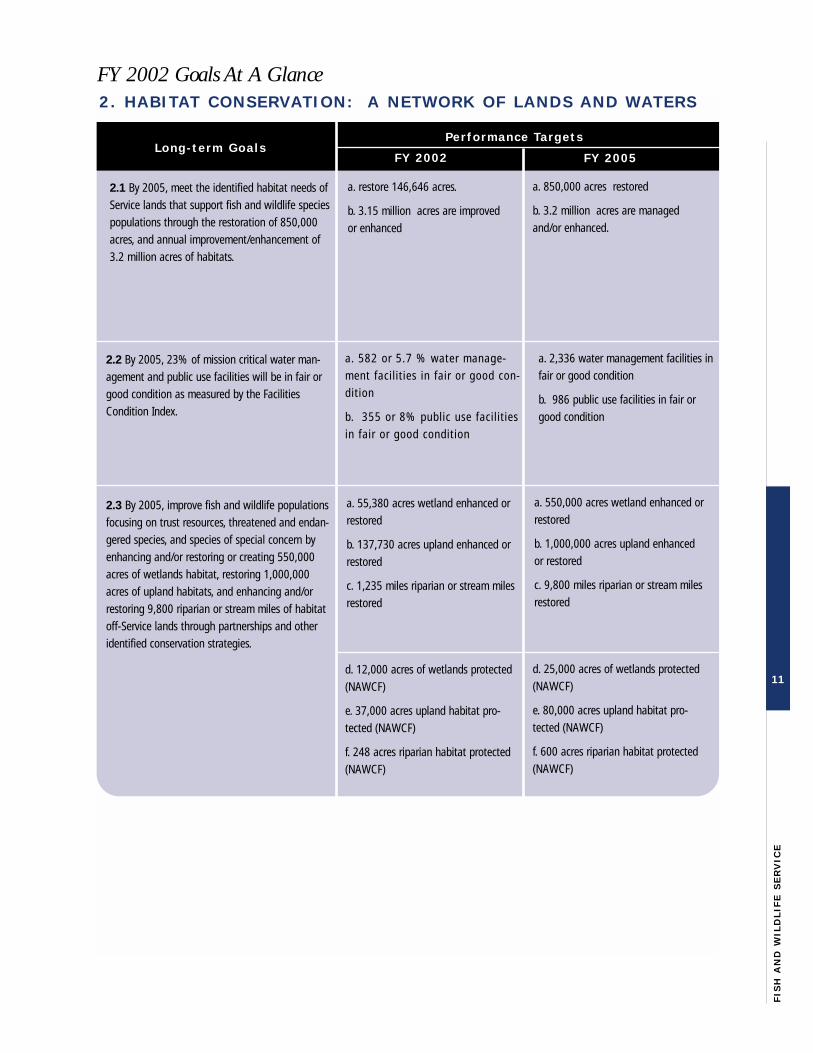
L o n g - t e r m G o a l sPe r f o r m a n c e Ta r g e t s
2.1 By 2005, meet the identified habitat needs ofService lands that support fish and wildlife speciespopulations through the restoration of 850,000acres, and annual improvement/enhancement of3.2 million acres of habitats.
a. restore 146,646 acres.
b. 3.15 million acres are improvedor enhanced
a. 582 or 5.7 % water manage-ment facilities in fair or good con-dition
b. 355 or 8% public use facilitiesin fair or good condition
2.3 By 2005, improve fish and wildlife populationsfocusing on trust resources, threatened and endan-gered species, and species of special concern byenhancing and/or restoring or creating 550,000acres of wetlands habitat, restoring 1,000,000acres of upland habitats, and enhancing and/orrestoring 9,800 riparian or stream miles of habitatoff-Service lands through partnerships and otheridentified conservation strategies.
2.2 By 2005, 23% of mission critical water man-agement and public use facilities will be in fair orgood condition as measured by the FacilitiesCondition Index.
a. 55,380 acres wetland enhanced orrestored
b. 137,730 acres upland enhanced orrestored
c. 1,235 miles riparian or stream milesrestored
F Y 2 0 0 2 F Y 2 0 0 5
a. 850,000 acres restored
b. 3.2 million acres are managedand/or enhanced.
a. 2,336 water management facilities infair or good condition
b. 986 public use facilities in fair orgood condition
a. 550,000 acres wetland enhanced orrestored
b. 1,000,000 acres upland enhancedor restored
c. 9,800 miles riparian or stream milesrestored
2 . H A B I TAT C O N S E R V AT I O N : A N E T W O R K O F L A N D S A N D W AT E R S
d. 12,000 acres of wetlands protected(NAWCF)
e. 37,000 acres upland habitat pro-tected (NAWCF)
f. 248 acres riparian habitat protected(NAWCF)
d. 25,000 acres of wetlands protected(NAWCF)
e. 80,000 acres upland habitat pro-tected (NAWCF)
f. 600 acres riparian habitat protected(NAWCF)
FY 2002 Goals At A Glance

12
AP
P /
AP
R
L o n g - t e r m G o a l sPe r f o r m a n c e Ta r g e t s
3.1 By 2005, compatible, wildlife-depen-dent recreational visits to National WildlifeRefuges and National Fish Hatcheries haveincreased by 20% from the 1997 levels.
a. 39.1 million visits
a. 5% increase in volunteer hours
b. 120 new friends groups
3.2 By 2005, volunteer participation hoursin Service programs increased by 7% andrefuges and hatcheries have 155 newfriends groups from the 1997 levels.
F Y 2 0 0 2 F Y 2 0 0 5
a. 39.8 million visits
a. 7% (93,500) increase in volun-teer hours
b. 155 new friends groups
3 . P U B L I C U S E A N D E N J O Y M E N T
L o n g - t e r m G o a l sPe r f o r m a n c e Ta r g e t s
4.1 Through 2005, improve fish and wildlife popu-lations and their habitats by increasing the annualService fish and wildlife assistance to NativeAmerican Policy to 85 training sessions, 2,688tribal participants, 210 technical assistance pro-jects, 260 new cooperative agreements, and 160tribal consultations.
a. 17 training sessions
b. 513 tribal participants
c. 42 technical assistance projectsfor tribes
d. 52 new cooperative agreements
e. 32 tribal consultations
a. 20 Federal Aid staff trained
b. 15 days reduction in grants process-ing time from current level
4.3 Through 2005, the Service will have in placeprocesses and procedures to assure accuracy, con-sistency, and integrity in all its Federal Aid internaland external financial programs.
4.2 Through 2005, the Service will improve grantsmanagement through automation for 80% of thestates‘ and territories‘ grant proposal.
a. 5% reduction in audit costs fromcurrent amount
b. 75% of draft reports will be avail-able to states within 60 days of com-pletion of the audit.
c. 90% of resolution of audit findingswill occur within 180 days of report.
d. 40 states & FWS staff will completebasic grants mngt. courses.
e. 37 states and FWS staff will com-plete additional grants mngt. training.
F Y 2 0 0 2 F Y 2 0 0 5
a. 85 training sessions
b. 2,688 tribal participants
c. 210 technical assistance projectsfor tribes
d. 260 new cooperative agreements
e. 160 tribal consultations
Improve grants management throughautomation for 80% of states‘ and terri-tories‘ grant proposals
Systems and processes to assure accu-racy, consistency, and integrity in allFederal Aid internal and external finan-cial programs will be in place
4 . P A R T N E R S H I P I N N A T U R A L R E S O U R C E S

13F I S H A N D W I L D L I F E S E R V I C E
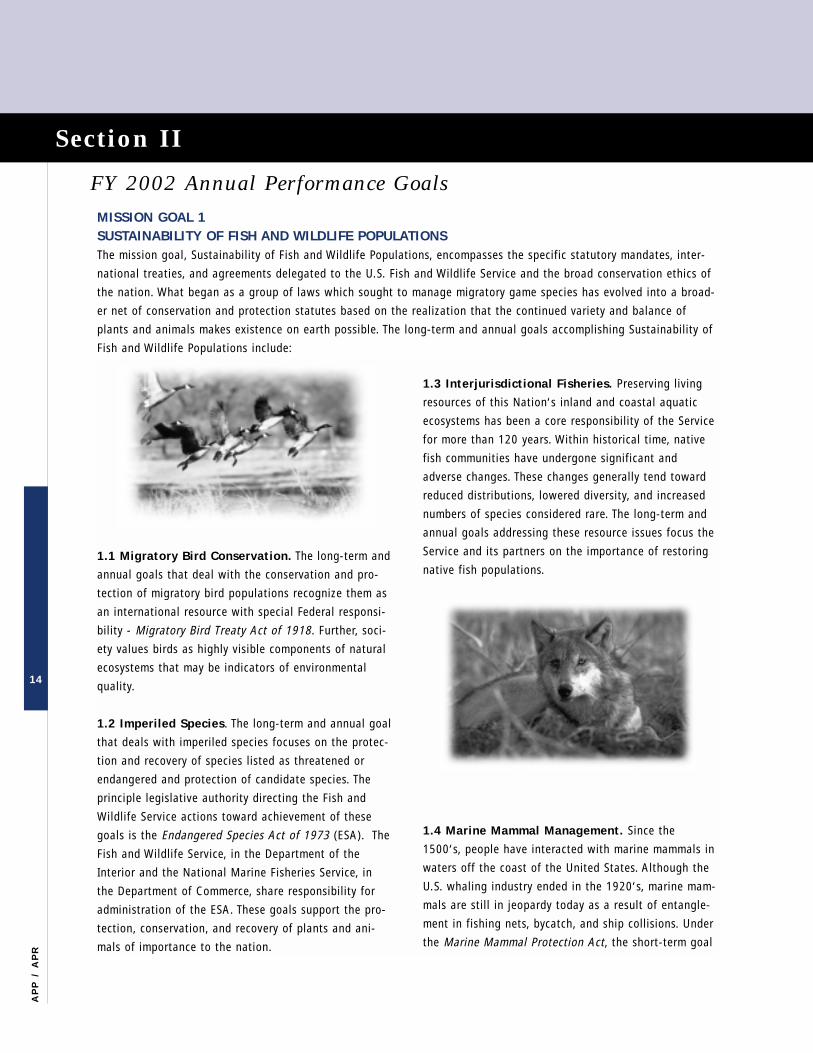
1.1 Migratory Bird Conservation. The long-term and
annual goals that deal with the conservation and pro-
tection of migratory bird populations recognize them as
an international resource with special Federal responsi-
bil ity - Migratory Bird Treaty Act of 1918. Further, soci-
ety values birds as highly visible components of natural
ecosystems that may be indicators of environmental
quality.
1.2 Imperiled Species . The long-term and annual goal
that deals with imperiled species focuses on the protec-
tion and recovery of species l isted as threatened or
endangered and protection of candidate species. The
principle legislative authority directing the Fish and
Wildlife Service actions toward achievement of these
goals is the Endangered Species Act of 1973 (ESA). The
Fish and Wildlife Service, in the Department of the
Interior and the National Marine Fisheries Service, in
the Department of Commerce, share responsibil ity for
administration of the ESA. These goals support the pro-
tection, conservation, and recovery of plants and ani-
mals of importance to the nation.
1.3 Interjurisdictional Fisheries. Preserving l iving
resources of this Nation‘s inland and coastal aquatic
ecosystems has been a core responsibil ity of the Service
for more than 120 years. Within historical t ime, native
fish communities have undergone significant and
adverse changes. These changes generally tend toward
reduced distributions, lowered diversity, and increased
numbers of species considered rare. The long-term and
annual goals addressing these resource issues focus the
Service and its partners on the importance of restoring
native fish populations.
1.4 Marine Mammal Management. Since the
1500‘s, people have interacted with marine mammals in
waters off the coast of the United States. Although the
U.S. whaling industry ended in the 1920‘s, marine mam-
mals are sti l l in jeopardy today as a result of entangle-
ment in fishing nets, bycatch, and ship coll isions. Under
the Marine Mammal Protection Act, the short-term goal
14
AP
P /
AP
R
Sect ion II
FY 2002 Annual Per formance Goal s
MISSION GOAL 1 SUSTAINABILITY OF FISH AND WILDLIFE POPULATIONSThe mission goal, Sustainabil ity of Fish and Wildlife Populations, encompasses the specific statutory mandates, inter-
national treaties, and agreements delegated to the U.S. Fish and Wildlife Service and the broad conservation ethics of
the nation. What began as a group of laws which sought to manage migratory game species has evolved into a broad-
er net of conservation and protection statutes based on the realization that the continued variety and balance of
plants and animals makes existence on earth possible. The long-term and annual goals accomplishing Sustainabil ity of
Fish and Wildlife Populations include:

15
FIS
H A
ND
WIL
DL
IFE
SE
RV
ICE
is to reduce incidental take to at or below the stocks
potential biological removal. The U.S. Fish and Wildlife
Service is responsible for managing the northern sea
otter, polar bear, and Pacific walrus in Alaska. The
Service is also responsible for the protection and recov-
ery of two endangered marine mammal species — the
West Indian manatee (Florida and Antil lean), and the
southern sea otter (California). We discuss progress
toward recovery of these two endangered species as
part of our long-term and annual goals 1.2, Imperiled
Species.
1.5 Species of International Concern.
The Service promotes and sustains a coordinated
domestic and international strategy to conserve global
biodiversity and provides assistance to other countries
to conserve wildlife, manage wildlife reserves, and pro-
tect global biodiversity. The long-term and annual goals
support the conservation of priority species of interna-
tional concern. International conservation of wildlife is
essential because geophysical boundaries have no
meaning for wildlife. For conservation to succeed in this
country, we must reach beyond our own borders.
1.6 Invasive Species. The final long-term and annual
goals that support the first mission goal, Sustainabil ity
of Fish and Wildlife Populations, address the prevention
and control of invasive species. Invasive Alien Species
are among the most significant domestic and interna-
tional threats to fish, wildlife, and plants, as well as a
costly threat to property and other economic assets.
Only direct habitat destruction has a greater impact on
ecosystems and the fish and wildlife they sustain. Under
the Non-indigenous Aquatic Nuisance Prevention and
Control Act of 1990, and Executive Order 13112, the
Service places a high priority on efforts to implement an
aggressive program to respond to present and future
invasive species problems.

16
AP
P /
AP
R
LINK BUDGETARY RESOURCES TO MISSION GOAL 1 -SUSTAINABILITY OF FISH AND WILDLIFE POPULATIONSThe following table provides a crosswalk of total discretionary appropriated funds to the first Mission Goal,
Sustainabil ity of Fish and Wildlife Populations, for FY 2000 Enacted Appropriations, FY 2001 Enacted Appropriations,
and FY 2002 President‘s Budget Request.
B u d g e tA c t i v i t y / S u b a c t i v i t y
( $ 0 0 0 )
F Y 2 0 0 0
E n a c t e d
F Y 2 0 0 1
E n a c t e d
F Y 2 0 0 2
P r e s i d e n t ‘ s B u d g e t
To t a l M i s s i o n
G o a l 1
To t a l M i s s i o n
G o a l 1
To t a l M i s s i o n
G o a l 1
Ecological Services
Endangered Species
Habitat Conservation
Environmental Contaminants
Refuges and Wildlife
Refuge Operations and Maintenance
Migratory Bird Management
Salton Sea Recovery
Law Enforcement
Fisheries
General Administration
Construction
Land Acquisition
Wildlife Cons. & Appreciation. Fund
State Wildlife Grants Fund
National Wildlife Refuge Fund
North American Wetlands Cons. Fund
Cooperative End. Species Cons. Fund
Multinational Species Conservation Fund
Commercial Salmon Fishery
Federal Aid in Wildlife Restoration
TOTAL APPROPRIATIONS
186,383
106,072
70,449
9,862
281,571
258,977
21,598
996
39,405
83,940
123,244
53,528
61,938
797
0
10,739
14,957
23,000
2,391
4,625
0
886,518
106,072
106,072
0
0
63,102
41,504
21,598
0
39,405
46,342
57,206
0
0
0
0
0
0
23,000
2,391
4,625
0
342,143
209,882
120,947
78,290
10,645
326,356
299,678
25,684
994
49,583
92,029
128,966
71,358
121,188
795
49,890
11,414
39,912
104,694
3,243
0
49,890
1,259,200
120,947
120,947
0
0
70,688
45,004
25,684
0
49,583
47,055
59,006
0
0
0
0
0
0
104,694
3,243
0
0
455,216
198,493
111,814
76,209
10,470
340,816
314,664
25,159
993
50,411
92,979
124,053
35,849
164,401
0
0
11,414
14,912
54,694
3,243
0
0
1,091,265
111,814
111,814
0
0
71,546
46,387
25,159
0
50,411
47,477
57,628
0
0
0
0
0
0
54,694
3,243
0
0
396,812

17
FIS
H A
ND
WIL
DL
IFE
SE
RV
ICE
Goal Purpose
The purpose of this goal is to improve the status of
migratory bird populations of management concern for
which adequate population information is available.
This annual goal can be accomplished by implementing
appropriate species and habitat conservation actions
early enough to avoid other social, economic, or biolog-
ical problems while improving populations monitoring
activit ies. The primary objective is to improve the sta-
tus of populations within the 150 migratory bird popu-
lation database. As each migratory bird population
reaches the improved status category, the 150 baseline
population is reduced by an equal number. So, the sum
of performance measure (1) and workload measure (a)
wil l always total 150. Workload measure (b) repre-
sents a database of migratory bird populations that the
Annual Performance Goal 1.1.1 By September 30, 2002, about 6 percent or 15/252 migratory bird populations of manage-ment concern (for which adequate population information is available) demonstrate improvements in their population status frombaseline year.
Performance FY 98 FY 99 FY 00 FY 01 Final FY 02Measures Actual Actual Actual Plan Proposed
Long -Term Goal 1.1 Through 2005, 12 percent of migratory bird populations demonstrate improvements in their population status.
1. # of migratorybirds of managementconcern with improvedstatus (data cumula-tive)
--- 5/250--- 10/250 15/252*
a. # migratory birdpopulations of man-agement concernwith managementactions in progress
b. # migratory birdpopulations of man-agement concernwithout ongoingmanagementactions.
c. Baseline: # ofregional bird popula-tions ofmanagement con-cern for which ade-quate population isavailable.
Workload and other performance statistics
150/250 145/250 140/250 135/252
5/250
FY 00Plan
150/250 145/250
100/250 100/250 100/250 102/252100/250 100/250
250 250 250 252*250 250
S U S T A I N A B I L I T Y O F F I S H A N D W I L D L I F E P O P U L A T I O N S1.1 MIGRATORY BIRD POPULATIONS
* The Service will have attained adequate baseline information for 2 additional populations. which were transferred from APP 1.1.2.
Service can not address due to lack of sufficient fund-
ing. Workload measure (c) stays constant at 250 unless
it receives a population from Annual Performance Goal
1.1.2, which now has baseline information available.
The Service is responsible for management of game and
nongame birds, including 58 species that may be legally
hunted as game birds and 778 nongame birds, all of
which are protected under the Migratory Bird Treaty Act
of 1918.
Resource Condition
Many migratory bird populations are currently at-risk
due to a variety of factors that have caused significant
declines in numbers, while other populations have out-
stripped the abil ity of key landscapes to support the
burden of excessive population growth. Broad-scale
national programs -- such as the U.S. Geological
Survey‘s Breeding Bird Survey, annual waterfowl sur-
veys, wintering surveys, and the annual National
Audubon Society‘s Christmas Bird Count -- provide sta-
tus and trend information on as many as 75% of bird
species in the United States. On a national scale, data
suggests that many species are presently stable, that
some generalist species that can adapt to altered habi-
tats are increasing, and that species less able to adapt
to habitat degradation and habitat loss are decreasing.
For many species of migratory birds, our understanding
of their population health falls into one of two cate-
gories:
• either the population is clearly declining, or
• we do not have a firm understanding of the
population status because of lack of sound
scientif ic information.
This long-term goal focuses on reversing declining pop-
ulation trends and preventing future population losses
of species whose individual status is currently consid-
ered either healthy or diff icult to ascertain. More than
70 species of grassland and shrub land dwell ing migra-
tory birds are in decline. Fifty-five percent of all migra-
tory birds whose populations spend the winter in the
southern United States have decreased in the past 30
years. The American woodcock, a prized hunted species,
has dropped by more than 2.5% per year since the
1960s. Atlantic and Mississippi Flyway populations of
American black ducks have been cut in half since 1955.
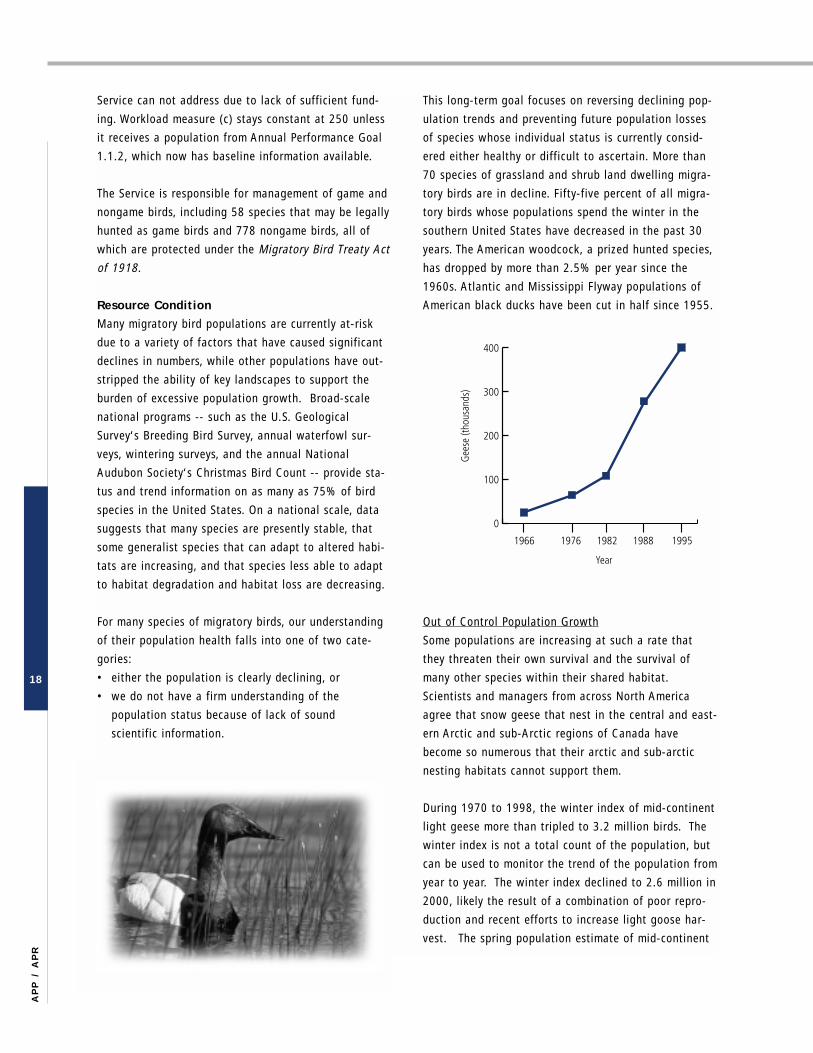
Out of Control Population Growth
Some populations are increasing at such a rate that
they threaten their own survival and the survival of
many other species within their shared habitat.
Scientists and managers from across North America
agree that snow geese that nest in the central and east-
ern Arctic and sub-Arctic regions of Canada have
become so numerous that their arctic and sub-arctic
nesting habitats cannot support them.
During 1970 to 1998, the winter index of mid-continent
light geese more than tripled to 3.2 mill ion birds. The
winter index is not a total count of the population, but
can be used to monitor the trend of the population from
year to year. The winter index declined to 2.6 mill ion in
2000, likely the result of a combination of poor repro-
duction and recent efforts to increase l ight goose har-
vest. The spring population estimate of mid-continent
18
AP
P /
AP
R
19
FIS
H A
ND
WIL
DL
IFE
SE
RV
ICE
l ight geese has increased to over 5.6 mill ion birds.
Photo surveys of breeding colonies are conducted every
5 years and therefore, are not used to monitor annual
changes in the population trend. These mid-continent
light geese are destroying arctic and sub-arctic breeding
habitats to the point of desertif ication, soil salinization,
and depletion of vegetative communities. These geese
pose an additional threat to other species by transmit-
ting avian cholera.
Waterfowl Populations
During the late 1970s through the early 1990s, many
waterfowl populations declined significantly because of
a severe drought on their breeding grounds. Populations
of most species have rebounded in the last few years,
primarily in response to wet years and to favorable wet-
land and upland habitat conditions on the prairies to
the far north. According to the Fish and Wildlife
Service‘s Waterfowl Population Status Report for 2000,
the estimate for total ducks in the traditional survey
area was 41.8 mill ion birds.
This is similar to the 1999 estimate of an increase of
11% over that of 1998 and 27% higher than the 1955-
98 average. However, pintails and scaup remain well
below their long term averages. The status of the
American black duck was 10% below the most recent
10 year average. Over 85% of the black ducks that win-
ter in the U.S. were counted in the Atlantic Flyway. Most
goose and swan populations in North American remain
sound and the size of most fall f l ights wil l be similar to
or increased from last year. Nine of the 29 populations
reported appear to have increased by 10% over last
year, 7 appear to have decreased by 10%, and 9 appear
to have changed l itt le.
Double-Crested Cormorant Management
In 1999, the Fish and Wildlife Service, in cooperation
with the U.S. Department of Agriculture, Animal, Plant
Health Inspection Service, began work on an
Environmental Impact Statement (EIS) for national man-
agement of double-crested cormorant. Because the
management of cormorants may significantly affect the
human environment, and because it could result in sig-
nificant changes to Fish and Wildlife Service policy, the
Service is preparing an Environmental Impact Statement.
An EIS is a comprehensive analysis that examines the
potential impacts of a proposed action to the natural
and human environment.
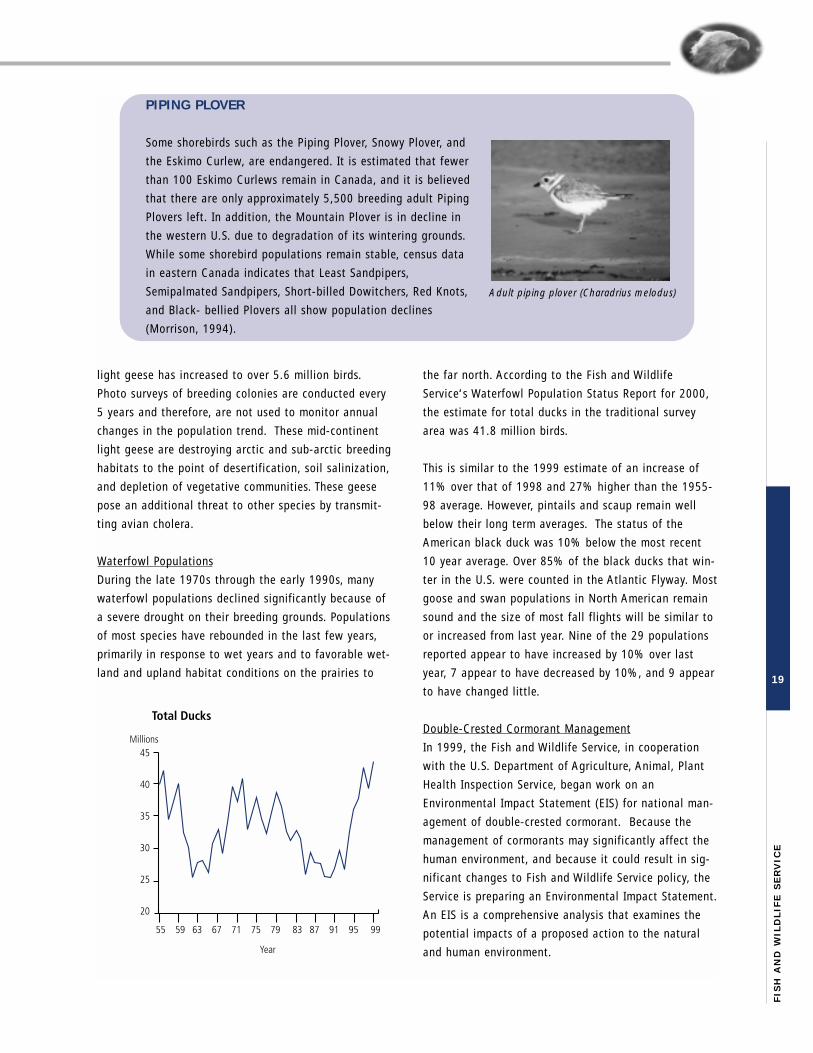
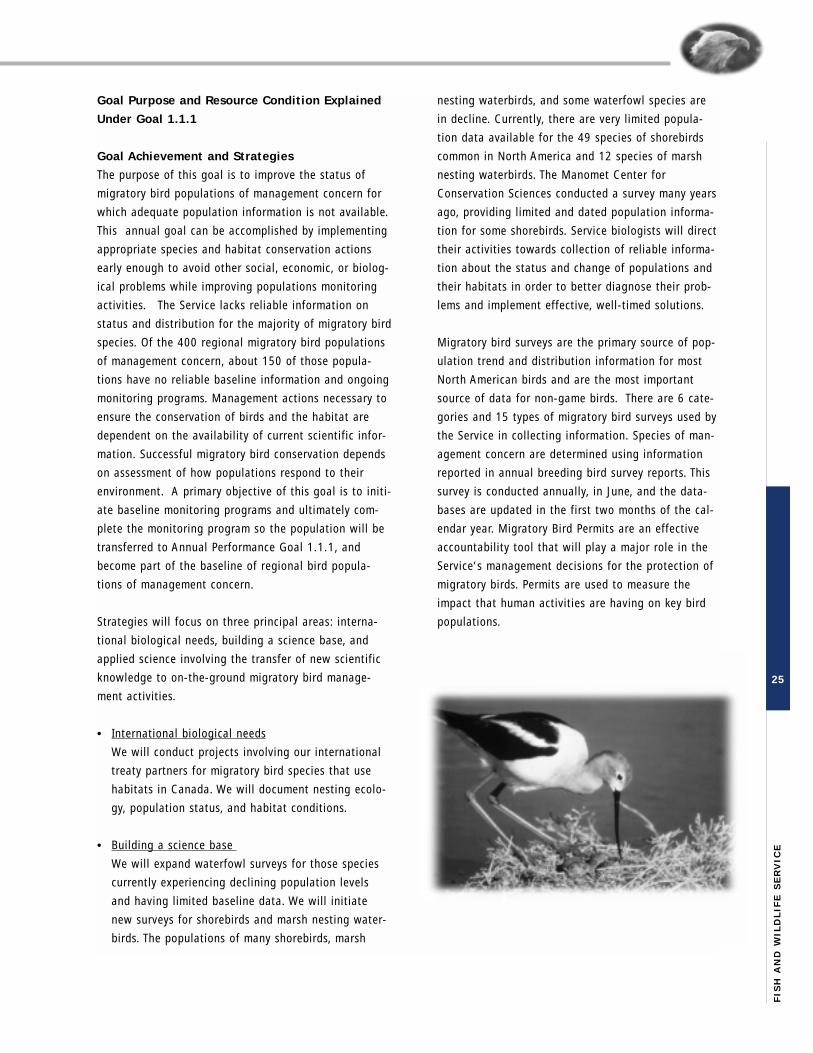
PIPING PLOVER
Some shorebirds such as the Piping Plover, Snowy Plover, and
the Eskimo Curlew, are endangered. It is estimated that fewer
than 100 Eskimo Curlews remain in Canada, and it is believed
that there are only approximately 5,500 breeding adult Piping
Plovers left. In addition, the Mountain Plover is in decline in
the western U.S. due to degradation of its wintering grounds.
While some shorebird populations remain stable, census data
in eastern Canada indicates that Least Sandpipers,
Semipalmated Sandpipers, Short-bil led Dowitchers, Red Knots,
and Black- bell ied Plovers all show population declines
(Morrison, 1994).
Adult piping plover (Charadrius melodus)

Cormorants have been federally protected by the
Migratory Bird Treaty Act since 1972. Double-crested
cormorants are native to all of North America. Today,
cormorant populations are at a historic high. From
1970 to 1991 the number of double-crested cormorant
nests in the Great Lakes region of the United States and
Canada, has increased an average of 29% in part to the
presence of ample food in their summer and winter
ranges, federal and state protection, and reduced conta-
minant levels. More recent data shows that the growth
trend in the Great Lakes has slowed to about 22% from
1992 to present. The latest (2000) total nest count
there estimated 115,000 nests/breeding pairs. The
expansion of double-crested cormorants into locations
where they have not existed in recent memory repre-
sents normal range recolonization associated with the
population growth of cormorants over the last 25 years.
The need to develop a national management plan and
an EIS is in response to the increasing population of
cormorants, and subsequent growing concern from the
public and natural resource management agencies that
cormorants are negatively impacting or pose a threat to
resources such as other colonial waterbirds, island veg-
etation, aquacultural stock, and sport f ish populations.
In FY 2000, over 900 people attended the ten public
scoping meetings held across the country and public
comments were accepted from the opening of the com-
ment period November 8, 1999 until June 30, 2000.
Over 1,450 comments were received. A draft
Environmental Impact Statement should be available for
public review by summer 2001.
Declining Populations
Species l ike songbirds, shorebirds, and sea ducks are
known to be declining, some at a disconcerting rate.
Tens of thousands of seabirds are being kil led incidental
to commercial longline fisheries in the world. Some of
the seabirds are species of management concern. There
are sti l l others where the lack of basic scientif ic infor-
mation necessary to evaluate their current status and
population trends could lead to their eventual disap-
pearance. For instance, wetland-dependent marsh birds
are rare and diff icult to detect. Black and yellow rails
and American and least bitterns are thought to be
declining and are identif ied on the Service‘s l ist of
species of management concern. These inconspicuous
birds are poorly surveyed and reliable population infor-
mation is simply lacking.
Goal Achievement and StrategiesAccomplishment of our long-term goal, improvement in
the population status for 12% of the migratory birds,
wil l depend on having the resources necessary to mea-
sure current status and trends for populations of man-
agement concern. The Service wil l focus on four major
strategies to accomplish this performance goal:
• Conserve bird populationsConduct population and production surveys and cen-suses, band waterfowl and other birds. Of the 400regional migratory bird populations of managementconcern, only 250 of those populations have reliablebaseline information and ongoing monitoring programs.
Develop and implement monitoring programs to bet-ter track the status of populations and their respons-es to management actions, and continue educationand outreach efforts to enhance the public‘s aware-ness and support for migratory bird conservation.The Service closely tracks population changes inspecies which are hunted, because of the need forthe Service and states to establish hunting seasonsand limits each year. Some non-game birds alsorequire careful monitoring. The Service monitorspopulations of the 124 Migratory Non-game Birds ofManagement Concern to ensure that managementactions are implemented in order to avoid declines innumbers that wil l require protection by theEndangered Species Act.
20
AP
P /
AP
R

• Increase effectiveness through partnerships Partnerships with other Federal agencies, local gov-ernments and international communities are essentialto address major migratory bird issues such as pesti-cide impacts, loss of habitat, and mortality caused bymarine fisheries operations. Efforts include: workwith Environmental Protection Agency to establish aprocess for using FWS expertise in evaluating theeffects of pesticides on migratory birds and othernon-target organisms; work with the National MarineFisheries Service to reduce avian bycatch throughpreventive measures; and support internationalmigratory bird conservation partners recognizing thebirds range across thousands of miles during theirannual breeding and wintering cycle.
• Raise public awareness Continue to provide educational materials to schoolsand the public on the importance of migratory birds.For the vast majority of people, birds represent thesole everyday contact they have with wildlife.Migratory birds connect all of us, from city dwellersto rural farmers, to the environment. Many of ustake for granted the beauty and balance that birdsbring to our day-to-day l iving.
• Conserve bird populations through habitat conservation Habitat quantity and quality and performance issuesare addressed in Mission Goal 2; however, it isimportant to recognize two key habitat strategiesthat directly support achievement of this long termgoal. Further, because migratory birds are mobile,habitat loss, degradation, and fragmentation are keyfactors affecting migratory bird populations. Serviceefforts wil l continue and expand, where appropriate,to protect, restore, and manage priority habitats insufficient quantity and quality to meet the needs ofmigratory birds. This wil l be accomplished by:
- Improving the National Wildlife Refuge System‘srole as a land-based anchor of migratory bird con-servation through the following: a) develop andimplement a nationwide migratory bird inventory pro-gram on refuges to better monitor health of migrato-ry bird species and populations, b) during develop-ment of Comprehensive Conservation Plans forrefuges, incorporate the latest available informationon the status of and management opportunities formigratory birds; c) actively work with partners toimplement migratory bird projects on refuges thatcomplement conservation activit ies off-refuge, and c)strategically expand the refuge system to incorporatehigh quality migratory bird habitats.
- Enhancing and expanding partnerships with privatelandowners, Land Trusts and other conservation part-ners to restore and protect important nesting andfeeding habitats for migratory waterfowl andneotropical migratory birds.
• Law EnforcementLaw enforcement plays a crit ical role in protectingregional migratory bird populations and achievingthis important goal. Service special agents wil l workwith state and local agencies and private groups to
21
FIS
H A
ND
WIL
DL
IFE
SE
RV
ICE
URBAN CONSERVATION TREATY FORMIGRATORY BIRDS
In FY 1999, the Service initiated the Urban
Conservation Treaty for Migratory Birds pilot program
whose purpose is to help cit ies conserve migratory bird
populations and their habitats through voluntary part-
nerships. Cities that sign Urban Treaty for Bird
Conservation with the Service may be eligible for
matching grants, technical and educational assistance,
and other support. During this past year, the cities of
Chicago and New Orleans became the first to sign con-
servation treaties with the Fish and Wildlife Service.
Urban birds are among the nation‘s most vulnerable
bird groups. According to the most recent breeding
bird survey conducted by the U.S. Geological Survey
and the Fish and Wildlife Service, only 31% of urban
bird species are estimated to have increasing popula-
tions. Many are neotropical migrant songbirds, which
as a group are experiencing serious population declines
worldwide. Large concentrations of birds migrate along
flyways or routes on which many large urban centers
have developed important bird habitat is often found
within these metropolitan areas. With environmentally
aware citizenry dedicated to conserving and enhancing
their natural resources, cit ies can be sanctuaries for
migratory birds and other wildlife.
reduce human impacts on the breeding activit ies ofrare ground-nesting shore birds, such as pipingplovers and least terns. Law enforcement wil l contin-ue monitoring industrial activit ies, such as cyanidegold leaching ponds, rural electrical uti l ity l ines, andopen oil f ield impoundments that are responsible forthe death of over 2 mill ion migratory birds annually.Efforts wil l be made to promote compliance withFederal laws and reduce bird mortality with estab-lished protective measures.
Benefits Derived
• increased recreational opportunities resulting from
improved migratory bird population.
• reduced conflicts due to ecological or economic dam-
ages caused by overabundant populations.
• increased knowledge about the status of migratory
bird populations gained through improved survey and
monitoring.
• avoidance of future l isting under ESA, resulting in
economic and social disruption.
FY 2000 ANNUAL PERFORMANCE REPORT:
Goal: 1.1.1 By September 30, 2000, an increase of 2
percent or 5 populations of regional migratory bird pop-
ulations of management concern (which adequate popu-
lation information is available) demonstrate improve-
ments in their populations status because of manage-
ment actions that have either increased their numbers
or, in some cases, reduced the number of confl icts due
to overabundance.
Report: Goal Met
In FY 2000, the Service met the goal of improving the
population status of f ive migratory bird populations of
management concern.
FY 2000 Highlights
Service efforts during FY2000 to improve five popula-
tions measures through this annual performance goal
are presented below:
• Common Loon - Along the southernmost edge of
their breeding range, Common Loons are often nega-
tively impacted by increased recreational use of
breeding lakes, including cottage development and
motorboat traffic. Despite this continuing threat,
loon population indices in the Upper Midwest
(Region 3) increased about 25% from the mid-1970s
to the mid-1990s (Source: North American Breeding
Bird Survey, 1966-1998). The Service worked with
local loon preservation groups to monitor the status
of loon breeding populations.
• Brown Pelican - Once depleted due to the impacts
of pesticides such as DDT, Brown Pelicans in the
Southeastern United States (Region 4) were consid-
ered endangered until 1985. However, improved
environmental conditions have allowed the species to
make a remarkable recovery, with the population
doubling from the mid-1980s to the mid-1990s
(Source: North American Breeding Bird Survey, 1966-
1998). The principal factor leading to the recovery of
Brown Pelican populations was a ban on the sale and
use of DDT in 1972.
• Black Tern - Continued loss of wetland habitats has
seriously jeopardized the continued existence of sev-
eral regional populations of the Black Tern. However,
in the heart of the species U.S. range B the Prairie
Potholes of the Great Plains (Region 6) B populations
remain healthy. In fact, Black Tern population
indices more than doubled from the mid-1970s to the
mid-1990s (Source: North American Breeding Bird
Survey, 1966-1998). The Service continued to protect
22
AP
P /
AP
R
23
FIS
H A
ND
WIL
DL
IFE
SE
RV
ICE
and manage a core of high-quality wetland habitats
as national wildlife refuges in the heart of the
species range.
• Emperor Goose - The entire population of the
Emperor Goose is, with minor exceptions, confined to
the region of the Bering Sea, with the largest nesting
concentration on the Yukon-Kuskokwim Delta in
Alaska. Surveys have been conducted each year
since 1981 on spring staging areas in southwestern
Alaska. Despite the restricted range during its annu-
al cycle and reduced numbers relative to many other
North American goose populations, the Emperor
Goose population has recovered somewhat from the
precipitous decline in the early 1980s. The count in
2000 was 62,000 geese, a 15% increase over the
previous year‘s index and the second consecutive
increase since 1998 (Source: Waterfowl Status
Report, 2000). The Service instituted an educational
outreach program in an effort to reduce harvests of
this species.
• Green-winged Teal - This species nests throughout
Alaska, Canada, and the northern United States.
Following the drought years of the 1960s, the Green-
winged Teal has shown a steady increase in numbers,
benefitting from generally improved habitat condi-
tions and an increase in wetland management activi-
ties throughout the continent in the intervening
years. Numbers increased significantly in 2000 from
the previous year (+21%) and from the 1955-1999
average (+80%) [Source: Waterfowl Status Report,
2000].The Green-winged Teal probably benefitted
from the increased acreage of wetlands protected,
restored, and enhanced by the North American
Wetlands Conservation Act.
Performance Measure # of regional migratory birds of management concern with improved status
Data Source Data is gathered annually by means of a variety of standardized survey methodologies. These include: Breeding Bird Survey, Waterfowl BreedingPopulation Survey, Dove Survey, Woodcock Survey, Arctic Goose Survey, Christmas Bird Count.
Data Validation See Data Verification and Validation, Page 102
Verification Senior biologists evaluate all breeding bird surveys using generally accepted statistical procedures. All information is collected, analyzed, and reported bythe Migratory Bird Management Office.
Data Limitations External source–Breeding Bird Survey data are provided by U.S. Geological Survey-Biological Research Division; Audubon Christmas Bird Count - data col-lected by volunteers.
Planned Improvements See Data Verification and Validation, Page 102
Baseline Reliable 1997 baseline data for 250 regional migratory bird populations of the total 400 regional migratory bird populations of management concern.

24
AP
P /
AP
R
S U S T A I N A B I L I T Y O F F I S H A N D W I L D L I F E P O P U L A T I O N S1.1.2 MIGRATORY BIRD CONSERVATION
Annual Performance Goal 1.1.2 - By September 30, 2002, about 10 percent or 15/148 migratory bird populations that are ofmanagement concern will have baseline information available for establishing reliable population levels, and monitoring programswill be initiated or continued for those species.
Performance FY 98 FY 99 FY 00 FY 01 FY 02Measures Actual Actual Actual Final Plan Proposed
1. # of baseline mon-itoring programs initi-ated for migratory birdpopulations of man-agement concern.data collectionInitiated
0 9/150(+4 pop)
5 13/150(+4 pop)
15/148(+4 pop)
a. # of baseline mon-itoring programs inprogress
b. Baseline: # ofregional migratorybird populations ofmanagement con-cern without reliablebaseline information& ongoing monitor-ing program.
150 141 137 133
9/150(+4 pop)
FY 00Plan
145 141
150 150 150 148150 150
2.. # of baseline mon-itoring programs com-pleted - data collec-tion completed
0 2*(add to 1.1.1)
0 0 0 0
Workload and other performance statistics
* Performance Measure # 2 above indicates that adequate baseline information has been obtained by the Service to allow for management actions to proceed in order to improvethe status of the populations. The 2 populations noted have been moved to goal 1.1.1 for management action. The workload (a) reflects the progress being made to develop base-line information for the 150 regional migratory bird populations that currently do not have sufficient data to determine what management activities would be needed to improve thestatus of the population. The Service anticipates that by 2002 baseline information will be developed for 17 populations of those 150 in the year 2000 without such information.The sum of performance measures (1), (2), and workload measure (a) totals 150, the baseline, per year.
Goal Purpose and Resource Condition Explained
Under Goal 1.1.1
Goal Achievement and Strategies
The purpose of this goal is to improve the status of
migratory bird populations of management concern for
which adequate population information is not available.
This annual goal can be accomplished by implementing
appropriate species and habitat conservation actions
early enough to avoid other social, economic, or biolog-
ical problems while improving populations monitoring
activit ies. The Service lacks reliable information on
status and distribution for the majority of migratory bird
species. Of the 400 regional migratory bird populations
of management concern, about 150 of those popula-
tions have no reliable baseline information and ongoing
monitoring programs. Management actions necessary to
ensure the conservation of birds and the habitat are
dependent on the availabil ity of current scientif ic infor-
mation. Successful migratory bird conservation depends
on assessment of how populations respond to their
environment. A primary objective of this goal is to initi-
ate baseline monitoring programs and ultimately com-
plete the monitoring program so the population wil l be
transferred to Annual Performance Goal 1.1.1, and
become part of the baseline of regional bird popula-
tions of management concern.
Strategies wil l focus on three principal areas: interna-
tional biological needs, building a science base, and
applied science involving the transfer of new scientif ic
knowledge to on-the-ground migratory bird manage-
ment activit ies.
• International biological needs
We will conduct projects involving our international
treaty partners for migratory bird species that use
habitats in Canada. We will document nesting ecolo-
gy, population status, and habitat conditions.
• Building a science base
We will expand waterfowl surveys for those species
currently experiencing declining population levels
and having l imited baseline data. We will initiate
new surveys for shorebirds and marsh nesting water-
birds. The populations of many shorebirds, marsh
nesting waterbirds, and some waterfowl species are
in decline. Currently, there are very l imited popula-
tion data available for the 49 species of shorebirds
common in North America and 12 species of marsh
nesting waterbirds. The Manomet Center for
Conservation Sciences conducted a survey many years
ago, providing l imited and dated population informa-
tion for some shorebirds. Service biologists wil l direct
their activit ies towards collection of reliable informa-
tion about the status and change of populations and
their habitats in order to better diagnose their prob-
lems and implement effective, well-timed solutions.
Migratory bird surveys are the primary source of pop-
ulation trend and distribution information for most
North American birds and are the most important
source of data for non-game birds. There are 6 cate-
gories and 15 types of migratory bird surveys used by
the Service in collecting information. Species of man-
agement concern are determined using information
reported in annual breeding bird survey reports. This
survey is conducted annually, in June, and the data-
bases are updated in the first two months of the cal-
endar year. Migratory Bird Permits are an effective
accountabil ity tool that wil l play a major role in the
Service‘s management decisions for the protection of
migratory birds. Permits are used to measure the
impact that human activit ies are having on key bird
populations.
25
FIS
H A
ND
WIL
DL
IFE
SE
RV
ICE

26
AP
P /
AP
R
• Applied science
Performance will be directed toward transferring the
scientif ic advances and findings in migratory bird
management to f ield stations, conservation agencies,
communities, state and local planning offices, and
other wildlife partners. Up to date information for
migratory bird management wil l be directed to the
300 National Wildlife Refuges along the Atlantic and
Central Migratory Bird Flyways.
Benefits Derived
The most recent status reports wil l be used to deter-
mine changes in populations. The status report can
contain several indicators which might include recent
surveys, monitoring reports, or other periodic investiga-
tions that are considered reliable.
FY 2000 ANNUAL PERFORMANCE REPORT:
Goal: 1.1.2 By September 30, 2000, about 6%
(9/150) regional migratory bird populations that are of
management concern wil l have baseline information
available for establishing reliable population levels, and
monitoring programs will be initiated or continued for
those species.
Report: Goal Met
The Service initiated baseline information and monitor-
ing programs for an additional 4 populations of non-
game bird populations of management concern. This
includes 3 populations of Cerulean Warblers and 1 pop-
ulation of Yellow-bil led Cuckoo.
• Cerulean Warbler Population Status andHabitat Requirements - “An Atlas of CeruleanWarbler Populations”(http://birdsource.cornell.edu/cewap/cwapresults-dec18.pdf), a final report submitted by the CornellLaboratory of Ornithology in December 2000, repre-sents the culmination of a 4-year (1997-2000) pro-ject funded by the U.S. Fish and Wildlife Service tomap the distribution of Cerulean Warblers in theeastern United States. As a result of this study, wenow have detailed information on distribution, popu-lation sizes, and habitat requirements of CeruleanWarblers over a broad expanse of their range (i.e.,the northeast population, the north-central popula-tion, and the southeastern population). The studyalso recommends techniques for monitoring anddetecting future population trends in this species,which wil l al low appropriate management actions tobe implemented in a timely fashion in the event ofserious declines. [3 populations-Regions 3, 4, and 5]
• Distribution, Abundance, and HabitatPreferences of the Yellow-billed Cuckoo -Surveys were conducted to document the distribu-tion, abundance, and habitat preferences of Yellow-bil led Cuckoo populations in California. Also, a part-nership was expanded to conduct genetic analyses ofwestern cuckoos. The results wil l be used to improvehabitats for cuckoos on National Wildlife Refuges,and to respond in a scientif ically-sound manner topetitions for l isting of species pertinent to theEndangered Species Act. [1 population-Region 1]
Data Verification and Validation: (Included in Annual Performance Goal 1.1.1)
Snow Geese

27
FIS
H A
ND
WIL
DL
IFE
SE
RV
ICE
Annual Performance Goal 1.2.1 By September 30, 2002, 347 species of the 705 (approximately 49%) listed under theEndangered Species Act as endangered or threatened a decade or more are either stable or improving, 3 species are delisted due torecovery, and listing of 3 species at risk is made unnecessary due to conservation agreements.
Performance FY 98 FY 99 FY 00 FY 01 FY 02Measures Actual Actual Actual Final Plan Proposed
Long -Term Goal 1.2 Through 2005, 4041 species (approximately 43%) of the 943 listed under the Endangered Species Act asendangered or threatened a decade or more are either stable or improving, 15 species are delisted due to recovery, and listing of12 species at risk is made unnecessary due to conservation agreements. **
1. # species listedunder the ESA asendangered or threat-ened a decade ormore are either stableor improving.
---- 197/53237%
155/49931%
328/61653%
347/70549%
309/57154%
FY 00Plan
2. # species delist-ed due to recovery(new measure in2001)
---- 31 ---- 0 3
3. # species at risk forwhich listing is madeunnecessary due toconservation agree-ments.
33---- ---- ---- ----
** FY 2001 planned/enacted performance measure targets were adjusted to correct inconsistencies in reported Endangered Species data. These inconsistencies weredetected in a recent Office of Inspector General (OIG) audit (July - September 2000). Changes were made based on recommendations by the OIG audit team.
S U S T A I N A B I L I T Y O F F I S H A N D W I L D L I F E P O P U L A T I O N S1.2 IMPERILED SPECIES
a. # species approvedfor removal from candi-date or proposed sta-tus as a result of con-servation agreementsprecluding the need tolist
(discontinued in FY2001)
FY 99PlanPerformance FY 98 FY 99 FY 00 FY 01 FY 02
Measures Actual Actual Actual Final Plan ProposedFY 00Plan
5 5 10 6 ___* ___*
Workload and other performance statistics
1 Long term goal target adjusted to reflect effects of FY 2001 enacted appropriations.

28
AP
P /
AP
R
Goal Purpose
The purpose of the Endangered Species Act (ESA) is to
conserve endangered and threatened species and the
ecosystems upon which they depend. This long-term
goal defines three important aspects of the Service‘s
reasonable level of performance over the next f ive years
in keeping with the intentions of the statute. The ESA
asks the Service to identify species that are in danger of
extinction and to pursue recovery of these species. The
long-term goal defines our five-year performance level
for the protection of endangered and threatened
species; halting and reversing their decline
(stabil ize/improve) and restoring them to a secure sta-
tus in the wild (delisting). While the ESA focuses on
protection and recovery of l isted species, the Service
also works to make l isting of additional species unnec-
essary.
Resource Condition
Although the Fish and Wildlife Service is involved in a
number of activit ies that contribute to the maintenance
of fish and wildlife populations, these actions are not
always enough to keep species from foreseeable extinc-
tion. When this occurs, species receive the protection
of the ESA. When the ESA was passed in 1973, it rep-
resented America‘s concern about the decline of many
wildlife species around the world. It is important to
know that over the past 300 years more than 500 North
FY 99PlanPerformance FY 98 FY 99 FY 00 FY 01 FY 02
Measures Actual Actual Actual Final Plan ProposedFY 00Plan
W o r k l o a d a n d o t h e r p e r f o r m a n c e s t a t i s t i c s ( c o n t i n u e d )
b. # species includedin final rules to reclas-sify from endangeredto threatened status.
------- ------- ------- 2 2 3
c. # total acres protect-ed, restored orenhanced under HabitatConservation Plans
(discontinued in FY2001)
2,000,000 2,105,472 3,000,000 127,272 ___* ___*
d. # acres coveredunder HabitatConservation Plans.
------- ------- ------- 30,712,099 40,089,539 48,559,329
e. # listed and unlistedspecies covered byHabitat ConservationPlans
------- 257 325 415 435 450
f. # species listed for2-1/2 years withrecovery plans (%).
------- ------- ------- 929/1046 986/1096 1051/1142
* replaced by new workload measure (d) # acres covered under HCP.

29
FIS
H A
ND
WIL
DL
IFE
SE
RV
ICE
American species have become extinct. That is more
than one species disappearing each year. Scientists
estimate that the natural extinction rates are one
species lost every 100 years.
he ESA is regarded as one of the most comprehensive
wildlife conservation laws in the world. The U.S. Fish
and Wildlife Service, in the Department of the Interior,
and the National Marine Fisheries Service, in the
Department of Commerce, share responsibil ity for
administration of the ESA. Generally, the National
Marine Fisheries Service deals with those species occur-
ring in marine environments and anadromous fish, while
the Fish and Wildlife Service is responsible for terrestri-
al and freshwater species and migratory birds.
Additionally, the Animal and Plant Health Inspection
Service, in the Department of Agriculture, oversees
importation and exportation of l isted terrestrial plants.
Goal Achievement and Strategies
The challenges of restoring these species and their
habitats before they become extinct are enormous but
not insurmountable. Species conservation requires the
joint efforts of private landowners, local communities,
individuals and organizations, and state and Federal
governments. To meet these challenges, the Service has
designed its recovery strategies to encompass the basic
requirements of the ESA:
Working with States
The Service wil l partner with the States to protect
species. The law encourages States to develop and
maintain conservation programs for their federally l isted
threatened or endangered species. Financial assistance
is available to promote conservation participation.
Listing of Species under the ESA
The Service wil l follow federal rulemaking procedures
and specific ESA requirements to determine whether to
list a species. A formal peer review process and an
opportunity for public comment ensure that the Service
obtains the best avail-
able scientif ic informa-
tion to support its
decisions. Listing
affords species the full
protections including
prohibitions on kil l ing,
harming, or otherwise
taking a species as
well as restrictions on
import/export to pre-
vent trade-related
declines.
Candidate Species
The Service wil l work to reduce the threats to declining
species and make l isting unnecessary through partner-
ships with public agencies, private organizations, Tribes,
and landowners. While the ESA mandates the recovery
of l isted species, Congress and the Service encourage
efforts to prevent species in decline from reaching the
point where the statute‘s protections are necessary.
Although the ESA offers no regulatory authority for pro-
tecting non-listed species, voluntary partnerships pro-
vide mechanisms to benefit unlisted but declining
species in conjunction with the protection of l isted
species.
Consultation with Federal Agencies
Federal agencies are required to consult with the
Service to ensure that the actions they authorize, fund,
or carry out wil l not jeopardize l isted species. If any
proposed action will jeopardize the species, the Service
will issue a "biological opinion" offering reasonable
As of September 30,2000, there were 36 species pro-
posed for l isting and 1,233 species l isted as threatened
or endangered.
Did you know:
72% of freshwater mussels are imperiled.
40% of U.S. amphibians are imperiled.
37% of U.S. fish species are at risk..
249 U.S. species are candidates for protection
under the ESA .
320 HCPs covering 30 mill ion acres protect 415 endan-
gered, threatened, or other unlisted species through
habitat conservation plans (as of September 30, 2000).
Karner blue butterfly
Status of the Threatened an Endangered Species
and Candidate Species
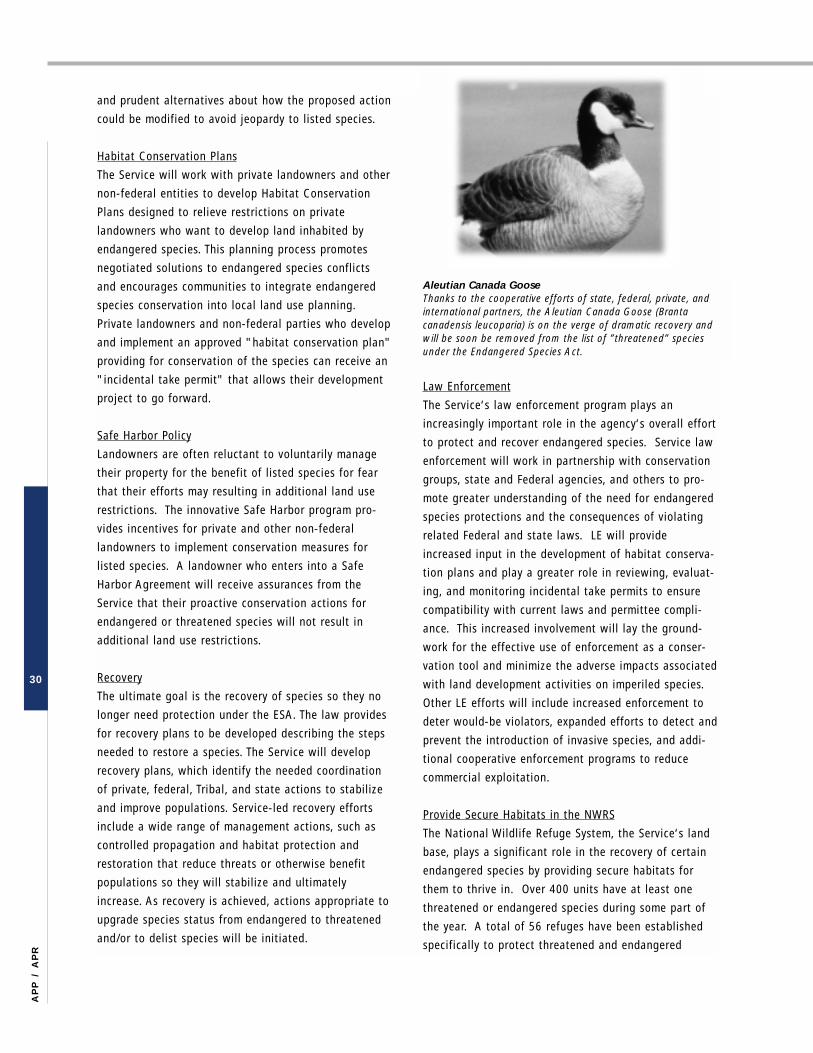
and prudent alternatives about how the proposed action
could be modified to avoid jeopardy to l isted species.
Habitat Conservation Plans
The Service wil l work with private landowners and other
non-federal entities to develop Habitat Conservation
Plans designed to relieve restrictions on private
landowners who want to develop land inhabited by
endangered species. This planning process promotes
negotiated solutions to endangered species confl icts
and encourages communities to integrate endangered
species conservation into local land use planning.
Private landowners and non-federal parties who develop
and implement an approved "habitat conservation plan"
providing for conservation of the species can receive an
"incidental take permit" that allows their development
project to go forward.
Safe Harbor Policy
Landowners are often reluctant to voluntari ly manage
their property for the benefit of l isted species for fear
that their efforts may resulting in additional land use
restrictions. The innovative Safe Harbor program pro-
vides incentives for private and other non-federal
landowners to implement conservation measures for
l isted species. A landowner who enters into a Safe
Harbor Agreement wil l receive assurances from the
Service that their proactive conservation actions for
endangered or threatened species wil l not result in
additional land use restrictions.
Recovery
The ultimate goal is the recovery of species so they no
longer need protection under the ESA. The law provides
for recovery plans to be developed describing the steps
needed to restore a species. The Service wil l develop
recovery plans, which identify the needed coordination
of private, federal, Tribal, and state actions to stabil ize
and improve populations. Service-led recovery efforts
include a wide range of management actions, such as
controlled propagation and habitat protection and
restoration that reduce threats or otherwise benefit
populations so they wil l stabil ize and ultimately
increase. As recovery is achieved, actions appropriate to
upgrade species status from endangered to threatened
and/or to delist species wil l be initiated.
Law Enforcement
The Service‘s law enforcement program plays an
increasingly important role in the agency‘s overall effort
to protect and recover endangered species. Service law
enforcement wil l work in partnership with conservation
groups, state and Federal agencies, and others to pro-
mote greater understanding of the need for endangered
species protections and the consequences of violating
related Federal and state laws. LE wil l provide
increased input in the development of habitat conserva-
tion plans and play a greater role in reviewing, evaluat-
ing, and monitoring incidental take permits to ensure
compatibil ity with current laws and permittee compli-
ance. This increased involvement wil l lay the ground-
work for the effective use of enforcement as a conser-
vation tool and minimize the adverse impacts associated
with land development activit ies on imperiled species.
Other LE efforts wil l include increased enforcement to
deter would-be violators, expanded efforts to detect and
prevent the introduction of invasive species, and addi-
tional cooperative enforcement programs to reduce
commercial exploitation.
Provide Secure Habitats in the NWRS
The National Wildlife Refuge System, the Service‘s land
base, plays a significant role in the recovery of certain
endangered species by providing secure habitats for
them to thrive in. Over 400 units have at least one
threatened or endangered species during some part of
the year. A total of 56 refuges have been established
specifically to protect threatened and endangered
30
AP
P /
AP
R
Aleutian Canada Goose Thanks to the cooperative efforts of state, federal, private, andinternational partners, the Aleutian Canada Goose (Brantacanadensis leucoparia) is on the verge of dramatic recovery andwill be soon be removed from the list of ”threatened” speciesunder the Endangered Species Act.
species, and 37 contain areas designated as crit ical
habitat for endangered species. In many cases, refuges
protect lands that form the nucleus of a larger ecosys-
tem needed to support a species. Of the 1,205 species
listed under the Endangered Species Act as of December
31, 1999, approximately 258 species are on habitat
within the Refuge System. In addition to endangered
species recovery, the Refuge System plays an even
greater role by providing secure, high quality habitats
that can preclude fish, wildlife and plants from becom-
ing endangered in the future.
The FY 2002 performance target wil l be achieved with
budgetary resources of $164.5 mill ion. No additional
resources are necessary to accomplish the goal of stabi-
l izing or improving 49% of the 705 endangered or
threatened species populations l isted a decade or more.
Benefits Derived
Endangered and threatened species often serve as envi-
ronmental barometers signaling the potential loss of
healthy l iving conditions for humans and other species
alike. The species serve as an early warning system for
pollution and environmental degradation that might
adversely impact human health. Service-led conservation
efforts for endangered and threatened species wil l
reduce threats or otherwise benefit populations so they
will stabil ize, improve, and ultimately reach recovered
status at which point they wil l no longer need the pro-
tection afforded them under the ESA and can be
removed from the Endangered Species List.
Protecting endangered species wil l result in important
sources of new drugs, medicines, or foods. Nearly 40
percent of all medical prescriptions dispensed annually
in the United States have been derived from nature, and
scientists have only investigated about 2 percent of the
known plant species for possible medicinal values.
Various species are important for maintaining the coun-
try‘s agricultural productivity through use as biocontrols
against crop pests or in development of disease-resis-
tant crops.
The conservation of endangered and threatened species
and the ecosystems upon which they depend will help
to achieve the desire consistently expressed by an over-
whelming number of Americans – to preserve our
nation‘s precious natural heritage.
FY 2000 ANNUAL PERFORMANCE REPORT:
Goal 1.2: By September 30, 2000, 37 percent or 197 of
the endangered and threatened species populations l ist-
ed a decade or more are stabil ized or improved and 15
species in decline are precluded from the need for l ist-
ing under the Endangered Species Act.
Report: Goal Exceeded
The Service exceeded expectations in meeting the two
key performance targets for FY 2000. The Service
established a performance target to stabil ize or improve
37% of those endangered or threatened species popula-
tions l isted a decade or more in FY 2000. Of the 571
species l isted a decade or more the Service working
with our partners were able to stabil ize or improve 54%
or 309 endangered or threatened species populations.
The Service also set a second performance goal of pre-
cluding the need to l ist, under the Endangered Species
Act, 15 species in decline. This goal was exceeded by
precluding the need to l ist 19 species in decline. These
species are:
31
FIS
H A
ND
WIL
DL
IFE
SE
RV
ICE
Florida black bear Arizona Bugbane
Columbia spotted Frog - 2 populations Arizona leatherflower
McCloud R. redband Trout Gentry‘s indigobush
Goodding‘s Onion Sulphur Springs buckwheat
Small rock-cress Two-flowered lathyrus
Clokey‘s egg-vetch Stones River bladderpod
Umpqua mariposa l i ly Kaibab plains cactus
Tall paintbrush Red Mountain catchfly
Shinner‘s tickle-tongue Pecos pupfish

32
AP
P /
AP
R
FY 2000 HIGHLIGHTS
Conservation Agreement Removes the Need to
List the Pecos Pupfish under the Endangered
Species Act
In March 2000, the U.S. Fish and Wildlife Service with-
drew a proposal to l ist the Pecos pupfish as endangered
after State and Federal agencies in New Mexico and
Texas developed a conservation agreement, removing or
sharply reducing threats to the species and outlining
further steps to protect it.
In January 1998, the Service proposed l isting the two-
inch long pupfish under the Endangered Species Act,
cit ing threats from habitat loss resulting from damming
and dewatering the Pecos River and excessive ground-
water pumping that dried up springs and sinkholes.
Hybridization with the non-native sheepshead minnow,
a closely related species introduced into the Pecos River
system as a baitfish between 1980 and 1984, also
posed threats.
Under the conservation agreement the Bureau of Land
Management, New Mexico State Parks Department, and
the Service wil l protect the pupfish on land that they
manage by install ing fish barriers to prevent access to
protected habitats by sheepshead minnows. In addi-
tion, the partners wil l restore historic habitat for pup-
fish reintroduction. The species may be reintroduced on
private land if owners voluntari ly agree. Since develop-
ing the agreement, both New Mexico and Texas have
modified state fishing regulations to ban the use of
sheepshead minnow as a bait f ish in the Pecos River,
the single most important conservation measure in
reducing threats to the species. Other state agencies
participating in the conservation agreement are the
New Mexico Departments of Agriculture and
Environment and the New Mexico State Engineer‘s
Office. Conservation efforts for the Pecos pupfish, pre-
cluding the need to l ist the species, help fulf i l both
annual and long-term goals.
Douglas County Population of the Columbian
White-tailed Deer: Proposed for Delisting
In May 1999, the U.S. Fish and Wildlife Service pro-
posed delisting the population of Columbian white-
tailed deer in Douglas County, Oregon, after protection
and public awareness enabled the endangered animals
to increase in number and expand their range. The
Douglas County population of Columbian white-tailed
deer has grown to about six times the size required for
downlisting, surpassing the recovery goal and the habi-
tat objective. Recovery goals for delisting the Douglas
County population are a minimum population of 1,000
animals, with 500 deer located on a minimum of 5,500
acres of suitable secure habitat.
During the past decade, Columbian white-tailed deer
have expanded their range, and now occupy about 308
square miles in Douglas County. They have also
increased in density, according to evidence such as
prominent browse-lines. The Oregon Department of Fish
of Wildlife plans to reintroduce the deer throughout its
range following delisting. In the meantime, the Douglas
County population is l ikely to grow as the Bureau of
Land Management continues to implement management
and restoration activit ies on land that comprises the
majority of secure habitat.
The Hawaiian Goose (or Nene): Captive-Breeding
and Release Help Recover this Island Species
When the endangered nene, or Hawaiian goose, became
Hawaii‘s State bird on May 7, 1957, prospects for its
survival were grim. During the previous century, the
nene fell victim to over hunting, habitat loss, and pre-
dation of its eggs, young, and adults by introduced ani-
mals such as mongooses, feral cats and dogs, rats, and
wild pigs. Once plentiful on several Hawaiian islands
and thought to number up to 25,000, the nene popula-
tion declined to about 30 birds, all of which were locat-
ed on the island of Hawaii.
Thanks to a captive-breeding and release effort among
the Fish and Wildlife Service, the State of Hawaii, and
private organizations such as the Wildfowl and
Wetlands Trust, The Peregrine Fund, and the Zoological
Society of San Diego, approximately 1,000 nene now
inhabit Hawaii, Maui, and Kauai. This range expansion
represents a major achievement in stabil izing the
species. Other groups, such as the Anheuser-Busch
Foundation, are also supporting nene recovery actions,
and statewide surveys are conducted each year.

If approved, under a safe harbor agreement that the
Hawaii Department of Land and Natural Resources is
developing with the Puu O Hoku cattle ranch at the
eastern end of the island of Molokai, the State hopes to
release nene goslings this spring on the ranch, where it
was last seen in 1778 with the arrival of Captain James
Cook. Since the nene is known to forage in cattle pas-
tures, ranch operations are expected to be compatible
with the bird‘s needs. Under the safe harbor agree-
ment, ranch management wil l include controll ing non-
native predators.
Robbins‘ Cinquefoil: A Mountain Partnership
Recovers this Plant Species
Thanks to partnership efforts by the White Mountain
National Forest and the Appalachian Mountain Club, the
Robbins‘ cinquefoil, a member of the rose family found
only in alpine New Hampshire, has increased to the
point that the Fish and Wildlife Service wil l propose its
delisting under the Endangered Species Act. The pro-
posal wil l also remove the crit ical habitat designation
and require a five-year monitoring plan, as the
Endangered Species Act mandates for species delisted
following recovery. An agreement between the Service
and the White Mountain National Forest wil l protect the
Robbins‘ cinquefoil in perpetuity.
33
FIS
H A
ND
WIL
DL
IFE
SE
RV
ICE
Performance Measure 1. # of species listed under the ESA as endangered or threatened a decade or more are either stable or improving; 2. # of species are delisted due torecovery; 3. listing of # species is made unnecessary due to conservation agreements.
Data Source Environmental Conservation Online System; Threatened & Endangered Species System
Data Validation See Data Verification and Validation, Page 102
Data Verification Species data supporting this goal is gathered by field level Fish and Wildlife personnel. Data is maintained and managed for data editing, data integra-tion, queries and reports through an online database system available to field. regional, and national level personnel. Field level data is considered pre-liminary until certified by appropriate regional officials.
Data Limitations Inherent subjectivity of assessing status with limited information and cost of attaining accurate information for a large number of species.
Planned Improvements See Data Verification and Validation, Page 102
Baseline Ratio of stable/improving species listed 10 years or more to total number of species listed 10 years or more

34
AP
P /
AP
R
Goal Purpose
The Service wil l focus efforts on restoring declining
interjurisdictional native fish populations and communi-
ties that have suffered significant adverse changes.
These changes generally tend toward reduced distribu-
tions, lowered diversity, and increased numbers of
species considered rare. The long-term and annual goals
addressing these resource issues focus the Service and
its partners on the importance of restoring native fish
populations.
Resource Condition
Living marine resources support extensive commercial,
recreational, and subsistence uses. In 1996, 35 mill ion
U.S. residents over the age of 16 enjoyed a variety of
fishing opportunities throughout the United States and
anglers spent almost $38 bil l ion on fishing-related
expenses. However, marine resources are under stress
from overexploitation and habitat degradation, with
native fish populations declining or are at historic low
levels. Some populations of marine mammals, turtles,
and fish are in danger of extinction, and many more are
threatened by various human activit ies. It has long
been recognized that fishery resources are exhaustible.
Many factors, both natural and human-related, affect
the status of f ish stocks, protected species, and ecosys-
tems. Although we do not have the means to control all
of them, our scientif ic and management tools enable us
to have a strong influence on many of them.
Preserving l iving resources of this Nation‘s inland and
coastal aquatic ecosystems have been a core responsi-
bil ity of the Service for more than 120 years. As a
leader in fisheries science since 1871, the Service
directs f ishery management, protection and technical
support in the interest of our primary concern of f ishery
conservation and sustainabil ity. Our stewardship chal-
lenge is maintaining and improving the health and pro-
ductivity of the resource, which wil l assure future
opportunities for the sustainable use of these resources.
The Service is responsible for managing, restoring and
recovering inland, anadromous, and coastal-dependent
interjurisdictional f ish, and other aquatic populations.
Primary activit ies include assessment and monitoring
surveys of populations and habitat, habitat conservation
and restoration, and fish propagation. This is often
Annual Performance Goal 1.3.1 — By September 30, 2002, three depressed interjurisdictional native fish populations arerestored to self-sustaining or, where appropriate, harvestable levels (based on applicable management plans).
Performance FY 98 FY 99 FY 00 FY 01 FY 02Measures Actual Actual Actual Final Plan Proposed
Long -Term Goal 1.3 – Through 2005, 12 depressed interjurisdictional native fish populations are restored to self-sustaining or,where appropriate, harvestable levels (based on applicable management plans).
1. # depressed inter-jurisdictional fish pop-ulations restored (FY2001 new goaland Measure)
--- --- 3
FY 00Plan
--- --- 2
S U S T A I N A B I L I T Y O F F I S H A N D W I L D L I F E P O P U L A T I O N S1.3 INTERJURISDICTIONAL FISH
Interjurisdictional fish populations are those populations that are managed by two or more states,nations, or Native American tribal governmentsbecause of geographic distribution or migratory pat-terns of those populations
done in cooperation with the Department of Commerce,
National Marine Fisheries Service and other federal
agencies; states, local and Tribal governments; and pri-
vate and non-government entities.
The Division of Law Enforcement‘s efforts to protect
native wildlife include the Nation‘s f isheries resources.
The LE component targets i l legal take and commercial-
ization of native fish stocks. Successful enforcement
actions have uncovered a growing, highly profitable,
national and international i l legal f isheries industry deal-
ing in freshwater mussels, paddlefish, sturgeon, lake
trout of the Great Lakes and other species of concern.
Service special agents wil l continue to conduct multi-
state investigations to control this growing and highly
profitable i l legal industry and build on partnerships
with state and international enforcement agencies.
Goal Achievement and Strategies
Many l iving aquatic resources often cross polit ical or
geographic boundaries, complicating their assessment
and management. The boundaries can be between states
and between adjacent countries. Sometimes boundaries
are crossed by juvenile or adult f ish during migrations.
These movements complicate even the most comprehen-
sive fisheries assessment and management regimes.
Effective oversight of these species requires coordina-
tion, cooperation, and agreement among all interested
parties. Fishery management plans provide the founda-
tion for cooperative management of f ishery resources.
Of paramount importance is coordination and collabora-
tion with Federal, State and Tribal partners to ensure a
sustained conservation effort.
Service strategies for restoration of depleted native
fishery populations include:
• Assess and monitor aquatic populations and their
habitats.
• Conserve and restore aquatic populations through
cooperative management.
• Improve fish passage.
• Supplement and reestablish aquatic populations
through the National Fish Hatchery System.
• Improve Law Enforcement capabil it ies.
• Coordination with Federal, State and Tribal partners.
Three initiatives are important in achieving and expand-
ing the measures attached to the restoration of recre-
ational and economically significant interjurisdictional
fishery populations. Proposed funding in FY 2002 will
provide for water supply, habitat restoration, species
propagation, monitoring and the management for
species of interjurisdictional f ish that have been subject
to significant decline. The Trinity River Restoration
(CA), Columbia River Salmon Restoration (WA,OR,ID),
and the Great Lakes Consent Decree wil l focus on
important fishery populations. The initiatives wil l con-
centrate Service and other Program efforts on develop-
ment and implementation of good science and manage-
ment necessary to eventually reduce the decline and
restore vital f ish populations. Such initiatives fully sup-
port the habitat and species goals of the Fish and
Wildlife Service and contribute to the wise use of funds
that support the conservation of this Nation‘s f ish and
wildlife resources. The new projects should when fully
implemented have the capabil ity of expanding the num-
ber of populations measured in accordance Annual
Performance Goal 1.3.1. Requested funding for FY 2002
will assist in meeting this GPRA goal for lake trout,
Pacific salmon, and steelhead trout (three depressed
interjurisdictional f ish populations) in the Northwest as
per the details below.
• Columbia River Salmon
The requested increase wil l help complete sub-basin
assessments and plans and improve fish propagation
strategies as one of the necessary components of the
Columbia Basin Aquatic Restoration Initiative while
providing for Tribal and non-Tribal harvest under the
court ordered U.S. v. Oregon process and the Pacific
Salmon Treaty. As part of a comprehensive aquatic
species restoration effort for the Columbia River
Basin, these improved strategies wil l help enhance
the production quality of Pacific salmon and steel-
head trout, and will assist with major salmon
restoration programs in Puget Sound and coastal
Washington.
• Great Lakes Consent Decree Operations
The National Fish Hatchery System in the Mid-West
Region will continue to maintain the 1994-1998 lake
trout production levels (3.5 mill ion lake trout stocked
35
FIS
H A
ND
WIL
DL
IFE
SE
RV
ICE
annually) and associated fish culture operations at
the Jordan River,(MI), Pendil ls Creek, (MI), and Iron
River, (WI), National Fish Hatcheries. Stocking lake
trout management zones formerly in deferred status
at the recommended rate (as outlined in the 2000 US
v MI decree) wil l require an increase of approximate-
ly 2 mill ion yearl ings annually. To meet this goal the
Service wil l implement options for expanding lake
trout production as identif ied in the 2001 propaga-
tion analysis and engineering review (e.g. increase
broodstock and yearling lake trout production at the
Service‘s Mid-West Region and Allegheny,(PA), and
Saratoga,(WY), National Fish Hatcheries).
Benefits Derived
Proper management of interjurisdictional f isheries popu-
lations wil l avoid expensive, disruptive, and controver-
sial restoration/recovery efforts and thus is broadly sup-
ported by the public. Successful management and
restoration of interjurisdictional f isheries offer immense
biological, social, and economic benefits to the Nation,
including:
• expanded commercial, recreational, and subsistence
fishing opportunities;
• greater availabil ity of f ish for public consumption;
• avoidance of threatened and endangered species l ist-
ings;
• provision of key components in balancing aquatic
ecosystems;
• increased opportunities for education and outreach
to school communities, and
• preservation of Tribal cultures.
FY 2000 ANNUAL PERFORMANCE REPORT:
Discontinued Goal: 1.3.1: By September 30, 2000,
baselines for interjursdictional f ish populations have
been established.
Report: Goal Not Met
The Service did not complete the development of the
baseline data for interjurisdictional f ish. Data for inter-
jurisdictional stocks are dependant on thorough genetic
evaluations, which are being conducted by numerous
other Federal agencies, State and Tribal governments,
organizations and institutions. Analysis of the data has
taken longer than anticipated because of the need to
coordinate activit ies and information with those agen-
cies and organizations. Interjurisdictional stocks could
be established on an interim basis but the scientif ic
validity of the is establishment could be called into
question. The development and evaluation of the base-
line is in progress at the regional level, but wil l be com-
pleted by the end of FY 2001. We will report on the
completion of the baseline for interjurisdictional f ish in
our FY 2001 Annual Performance Report.
FY 2000 HIGHLIGHTS
Giving Fish Passage to Old Habitat and
Spawning Grounds
Dozens of species of f ish populations have been victims
of the industrial revolution as a result of hundreds of
small dams constructed on almost every river in the
United States in an effort to generate power for
American factories. Approximately 75,000 dams over 6
feet and 2.5 mill ion smaller obstructions block or
impede fish passage to essential habitats and spawn-
ing grounds. In FY 2000, the Service dedicated
$900,000 to improve fish passage in seven watersheds
in 12 states, removing four dams and other impedi-
ments and restoring access to more than 1,000 miles of
habitat for f ish and other aquatic species.
Apache Trout
The Arizona Fishery Resource Office and Alchesay-
Will iams Creek National Fish Hatchery, in cooperation
with the White Mountain Apache Tribe and the Arizona
Game and Fish Department has advanced the recovery
36
AP
P /
AP
R

37
FIS
H A
ND
WIL
DL
IFE
SE
RV
ICE
of the Apache trout to the point where delisting is
within the grasp of the Service. In 2000 these actions:
increased by 400% the number of stream kilometers
previously occupied by Apache trout; constructed 10
artif icial barriers and located seven natural barriers to
preclude competition, predation, and hybridization; ren-
ovated 60 kilometers of habitat; and established the
species as recreational sport f ish in 12 Lakes and five
streams within historic habitat on the Fort Apache
Indian Reservation.
New Tool for Evaluating Fisheries
Restoration Programs
Lamar Fish Technology Center developed a new fishery
management tool for marking large numbers of early
l ife stages of f ish. The technique is an immersion bath
which relies on the fluorochrome compound known as
calcein to produce a mark on finrays, scales, otoliths,
and other bony structures of f ish. These marks can be
non-lethally detected in salmonids for at least three
years post-immersion by employing detection devices
which were developed at NEFC. While developed for use
in marking Atlantic salmon, this technology has a broad
potential for use with any other species. As a result,
managers may be able to use calcein alone or in combi-
nation with existing marking programs (genetic, visual
external, and otolith) to greatly expand evaluations of
restoration and stocking programs and to perform
hatchery product evaluations previously not possible.
Assessment and Restoration of Salmon
The Lake Champlain Fishery Resource Office assisted in
the design of the Winooski River f ish l ift, trap, and
truck project. Designed for the Winooski One
Hydroelectric Station, it allows fisheries managers the
opportunity to restore wild migratory salmonid popula-
tions that have been restricted by barriers built on the
river. The l ift enables salmon access to approximately
33.8 km (21 mi) of favorable salmonid spawning and
rearing habitat above the project. An additional 28 km
(17.4 mi) of spawning and nursery habitat was also
opened in eight tributaries streams.
The Chandalar River contains the largest fall chum
salmon stock in the Yukon River. The Fairbanks Fishery
Resource Office used split-beam sonar to assess the
38
AP
P /
AP
R
spawning escapement of fall chum salmon in the
Chandalar River on the Yukon Flats National Wildlife
Refuge. Recent weak returns of salmon in the Yukon
River have resulted in area-wide closures of commercial
and subsistence fisheries which have led to economic
disaster for area fishermen. During the season, sonar
counts are reported daily to fishery managers.
Preliminary 2000 sonar counts were 70,000 chum
salmon, which is only 41% of the 1995-1999 average of
170,703 fish.
Performance Measure Number of depressed interjurisdictional fish populations restored.
Data Source Fisheries Program - Fisheries Field Stations enter data into Accomplishment module-Fishery Information System.
Data Validation See Data Verification and Validation, Page 102
Verification Fisheries data is initially assembled at field stations, then forwarded to Regional Offices for quality control and consistency checks. Then, data is sent to Washington Office and Division of Fish and Wildlife Management Assistance reviews data for accuracy, consistency, and quality. AD-Fisheries certifies data.
Data Limitations Inherent subjectivity of assessing status and trends with limited information and cost of attaining accurate information for a large number of species.
Planned Improvements See Data Verification and Validation, Page 102
Baseline Baseline development in process during FY 2001.

Goal Purpose
The Alaska region has 39 stocks of 24 species of marine
mammals. Three of these species (sea otter, polar bear,
and walrus) are managed by the Department of the
Interior, U.S. Fish and Wildlife Service, and the remain-
ing cetaceans and pinnipeds are managed by the
Department of Commerce, National Marine Fisheries
Service under the provisions of the Marine Mammal
Protection Act (MMPA). The Fish and Wildlife Service is
also responsible for the protection and recovery of two
ESA listed marine mammal species -- the endangered
West Indian manatee (Florida and Antil lean) and the
threatened southern sea otter (California). We discuss
progress toward recovery of these two listed species as
part of our long-term goal 1.2 Imperiled Species. The
importance of each of the three species in Alaska under
the jurisdiction of the Fish and Wildlife Service are unique.
The purpose of this goal for the Fish and Wildlife
Service is to protect or maintain these marine mammal
stocks at sustainable levels. Under the MMPA, marine
mammal stocks "should not be permitted to diminish
below their optimum sustainable population" (OSP).
Further, the Service is directed by the MMPA to com-
plete stock assessments of marine mammals and negoti-
ate cooperatively with Alaskan Native Organizations...."
To adequately protect and maintain stocks at the opti-
mum sustainable population level, the Service must con-
39
FIS
H A
ND
WIL
DL
IFE
SE
RV
ICE
S U S T A I N A B I L I T Y O F F I S H A N D W I L D L I F E P O P U L A T I O N S1.4 MARINE MAMMALS
Annual Performance Goal 1.4.1 — Through September 30, 2002, current censuses for 2 marine mammal stocks and voluntaryharvest guidelines for 2 marine mammal stocks will be available.
Long -Term Goal 1.4 – Through 2005, 3 marine mammal stocks will have current censuses available to maintain populations atoptimum sustainable levels; harvest guidelines for all marine mammal stocks will be in place, through cooperative managementagreements, for continued subsistence uses.
# marine mammals populationsat sustainable levels or protectedunder conservation agreements.(Discontinued in FY2001)
--------- 4 ---4
PerformanceMeasures
1. # of marine mammal stocks withcurrent censuses available.Marine Mammal Stocks addressed:
Polar Bear Southern Beaufort SeaPolar Bear Chukchi/Bering SeasPacific WalrusNorthern Sea Otter (SW stock)
0 2 2 2
FY 98Actual
FY 99Actual
FY 00Plan
FY 00Actual
FY 01Final Plan
FY 02Proposed
2. # of marine mammals stockswith Voluntary Harvest guidelines:Marine Mammal Stocks addressed:
Polar Bear-Southern Beaufort SeaPolar Bear - Chukchi/Bering SeasPacific WalrusNorthern Sea Otter (SE stock)
2 2 2 2 2
(1)
(1)
2
(1)
(1)

duct periodic censuses to monitor population status and
trends.
Resource Condition
Since the 1500‘s, people have interacted with marine
mammals in waters off the coast of the United States.
Although the U.S. whaling industry ended in the 1920‘s,
marine mammals are sti l l in jeopardy today as a result
of entanglement in fishing nets, bycatch, and ship coll i-
sions. The importance of each of the three species
under the jurisdiction of the Fish and Wildlife Service
are unique.
Polar Bear
Polar bears have been, and continue to be, an important
renewable resource available to coastal communities
throughout northern Alaska, where they are hunted by
coastal dwell ing Native people. The Fish and Wildlife
Service has been assigned the responsibil ity for con-
ducting studies on polar bears to increase our under-
standing of the animal and the requirements for its pro-
tection.
Of the two polar bear stocks in Alaska, the
Chukchi/Bering Seas stock appears to be increasing
slightly or stabil izing at a relatively high level, while
the Southern Beaufort Sea stock is increasing sl ightly or
stabil izing near carrying capacity. Neither stock is l isted
as depleted nor strategic under the MMPA, nor threat-
ened or endangered under the ESA. Although reliable
estimates of the minimum population, PBR level, and
human-caused mortality and serious injury are currently
not available, the stocks appear to have increased dur-
ing the past 30 years.
Northern Sea Otters
Sea otters have inhabited
the northern coasts of the
Pacific Ocean for hundreds
of years. Current estimates
are approximately 100,000
sea otters in Alaska.
Although sea otters are pro-
tected from commercial
hunting, the largest threat sti l l comes from humans.
The return of sea otters from near extinction, and the
reoccupation of most of their historic range, is one of
the great wildlife conservation stories of the century.
However, the species‘ recovery has not come without
controversy. The conflict between sea otters and humans
over shellf ish resources is probably the most serious
problem that has arisen. In addition, there is evidence
suggesting that the Aleutian stock has suffered a signif-
icant decline and thus has been l isted in FY 2000 as a
candidate species under the Endangered Species Act.
Otherwise, healthy populations of sea otters are firmly
established in most of their historic range in coastal
Alaska, and now is an appropriate juncture to examine
existing and potential management problems and
resource conflicts, and consider potential solutions to
those management problems and conflicts.
It is estimated that 90% of the world population of sea
otters reside in the near shore, coastal waters in Alaska.
Sea otters in Alaska are currently estimated to be within
their optimum sustainable population level. They are not
listed as depleted or considered a strategic stock under
the MMPA, or as threatened or endangered under the
ESA. Impacts resulting from the Exxon Valdez oil spil l
40
AP
P /
AP
R
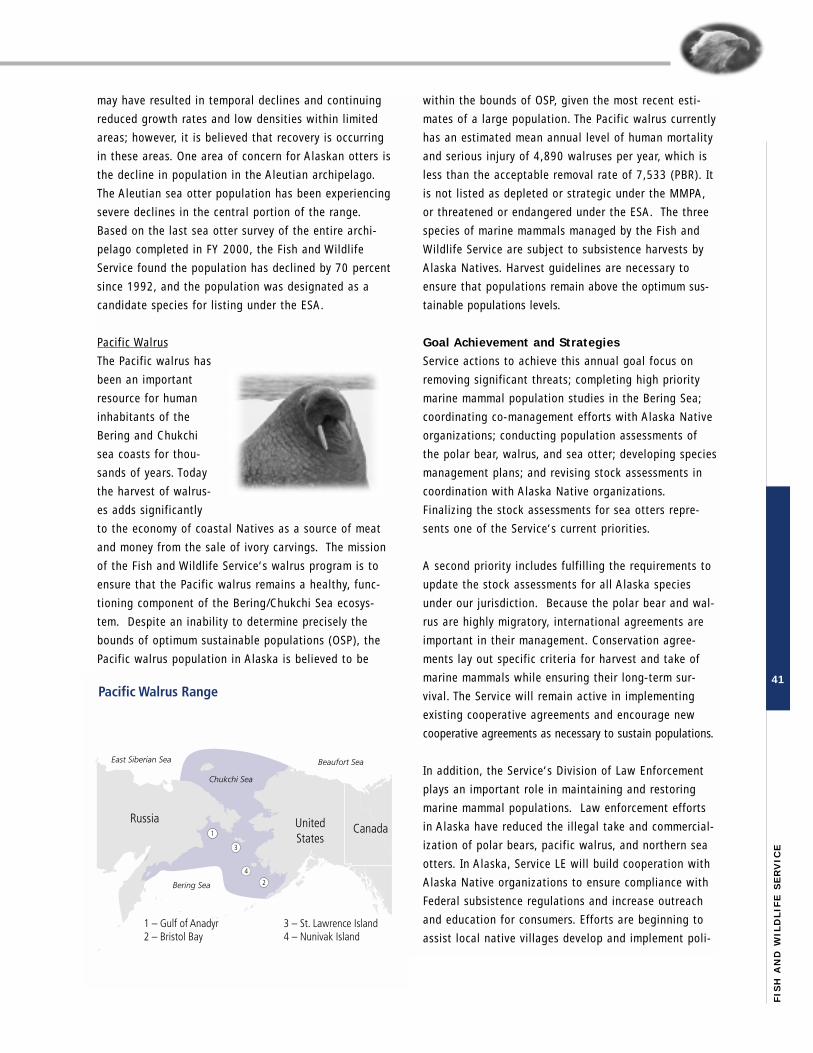
may have resulted in temporal declines and continuing
reduced growth rates and low densities within l imited
areas; however, it is believed that recovery is occurring
in these areas. One area of concern for Alaskan otters is
the decline in population in the Aleutian archipelago.
The Aleutian sea otter population has been experiencing
severe declines in the central portion of the range.
Based on the last sea otter survey of the entire archi-
pelago completed in FY 2000, the Fish and Wildlife
Service found the population has declined by 70 percent
since 1992, and the population was designated as a
candidate species for l isting under the ESA.
Pacific Walrus
The Pacific walrus has
been an important
resource for human
inhabitants of the
Bering and Chukchi
sea coasts for thou-
sands of years. Today
the harvest of walrus-
es adds significantly
to the economy of coastal Natives as a source of meat
and money from the sale of ivory carvings. The mission
of the Fish and Wildlife Service‘s walrus program is to
ensure that the Pacific walrus remains a healthy, func-
tioning component of the Bering/Chukchi Sea ecosys-
tem. Despite an inabil ity to determine precisely the
bounds of optimum sustainable populations (OSP), the
Pacific walrus population in Alaska is believed to be
within the bounds of OSP, given the most recent esti-
mates of a large population. The Pacific walrus currently
has an estimated mean annual level of human mortality
and serious injury of 4,890 walruses per year, which is
less than the acceptable removal rate of 7,533 (PBR). It
is not l isted as depleted or strategic under the MMPA,
or threatened or endangered under the ESA. The three
species of marine mammals managed by the Fish and
Wildlife Service are subject to subsistence harvests by
Alaska Natives. Harvest guidelines are necessary to
ensure that populations remain above the optimum sus-
tainable populations levels.
Goal Achievement and Strategies
Service actions to achieve this annual goal focus on
removing significant threats; completing high priority
marine mammal population studies in the Bering Sea;
coordinating co-management efforts with Alaska Native
organizations; conducting population assessments of
the polar bear, walrus, and sea otter; developing species
management plans; and revising stock assessments in
coordination with Alaska Native organizations.
Finalizing the stock assessments for sea otters repre-
sents one of the Service‘s current priorit ies.
A second priority includes fulf i l l ing the requirements to
update the stock assessments for all Alaska species
under our jurisdiction. Because the polar bear and wal-
rus are highly migratory, international agreements are
important in their management. Conservation agree-
ments lay out specific criteria for harvest and take of
marine mammals while ensuring their long-term sur-
vival. The Service wil l remain active in implementing
existing cooperative agreements and encourage new
cooperative agreements as necessary to sustain populations.
In addition, the Service‘s Division of Law Enforcement
plays an important role in maintaining and restoring
marine mammal populations. Law enforcement efforts
in Alaska have reduced the i l legal take and commercial-
ization of polar bears, pacific walrus, and northern sea
otters. In Alaska, Service LE wil l build cooperation with
Alaska Native organizations to ensure compliance with
Federal subsistence regulations and increase outreach
and education for consumers. Efforts are beginning to
assist local native vil lages develop and implement poli-
41
FIS
H A
ND
WIL
DL
IFE
SE
RV
ICE

42
AP
P /
AP
R
cies and ordinances aimed at self-regulating their sub-
sistence hunting activit ies.
FY 2000 ANNUAL PERFORMANCE REPORT:
Goal 1.4: Through September 30, 2000, 100 percent of
marine mammal populations over which the Service has
jurisdiction wil l be at sustainable population levels or
protected under conservation agreements (Goal Revised
for FY 2001 and 2002; Discontinued in present form) .
Report: Goal Met
The Service achieved the goal of providing protection
for 100 percent marine mammals under its jurisdiction
by ensuring that populations are at sustainable levels or
protected by conservation agreements. Conservation
agreements are in place for non-listed (populations not
listed under the Endangered Species Act) populations of
polar bear, walrus, and sea otter.
FY 2000 HIGHLIGHTS
U.S.- Russia Agreement on Polar Bear Management
The United States and Russia continued development of
a long-term bilateral agreement for the conservation of
polar bears shared between the two countries. Several
joint research and management efforts between the U.S.
and Russia have been successful in the past. However,
until recently, the U.S. and Russia have each managed
the shared Alaska-Chukotka polar bear population inde-
pendently. This new agreement unifies management
programs between the U.S. and Russia for the shared
Alaska-Chukotka polar bear population. The agreement
provides for:
• Active involvement of Native people and their organi-
zations,
• Long-term joint programs for conservation of ecosys-
tems and important habitats, harvest allocations
based on sustainabil ity, collection of biological infor-
mation, and increased partnerships with state, local
and private interests.
• Enhancement of the 1973 multi-lateral Agreement on
the Conservation of Polar Bears by allowing sustain-
able harvest by Alaska and Chukotka Natives, but
prohibits the harvest of females with cubs, or cubs
less than one year old.
• Prohibition of the use of aircraft and large motorized
vessels and vehicles to take polar bears, and
• Focus on conserving specific polar bear habitats such
as feeding, congregating and denning areas.
Aleutian Sea Otter Population Survey
In FY 2000, the Fish and Wildlife Service completed a
re-survey of the entire Aleutian archipelago, to assess
sea otter populations within this area. While sea otters
in Alaska are currently estimated to be within their
optimum sustainable population level, one area of con-
cern is the decline in the otter population in the
Aleutian archipelago. Based on the survey of the entire
archipelago completed in FY 2000, the Fish and Wildlife
Service found the sea otter population has declined by
70 percent since 1992. This population was subse-
quently classif ied by the Service as a Candidate Species
for l isting under the Endangered Species Act in August,
2000.
Performance Measure # marine mammal stocks with current censuses.# marine mammal stocks with voluntary harvest guidelines.
Data Source Fisheries Resources Program-Marine Mammal Office (Region 7) enters data into Accomplishment module-Fishery Information System
Data Validation See Data Verification and Validation, Page 102
Verification Data is initially assembled at field stations, then forwarded to Regional Offices for quality control and consistency checks. Then, data is sent toWashington Office and Division of Fish and Wildlife Management Assistance and Habitat Restoration reviews data for accuracy, consistency, and quality.AD-Fisheries certifies data.
Data Limitations Range-wide censuses are expensive with severe logistical constraints (weather, international coordination). Development of voluntary harvest guidelinesrequires close coordination with Alaska Native groups and international Commissions. Adherence to harvest guidelines is voluntary, not mandatory. Also,some data is obtained from external sources.
Planned Improvements See Data Verification and Validation, Page 102
Baseline 1997: 6 population stocks.
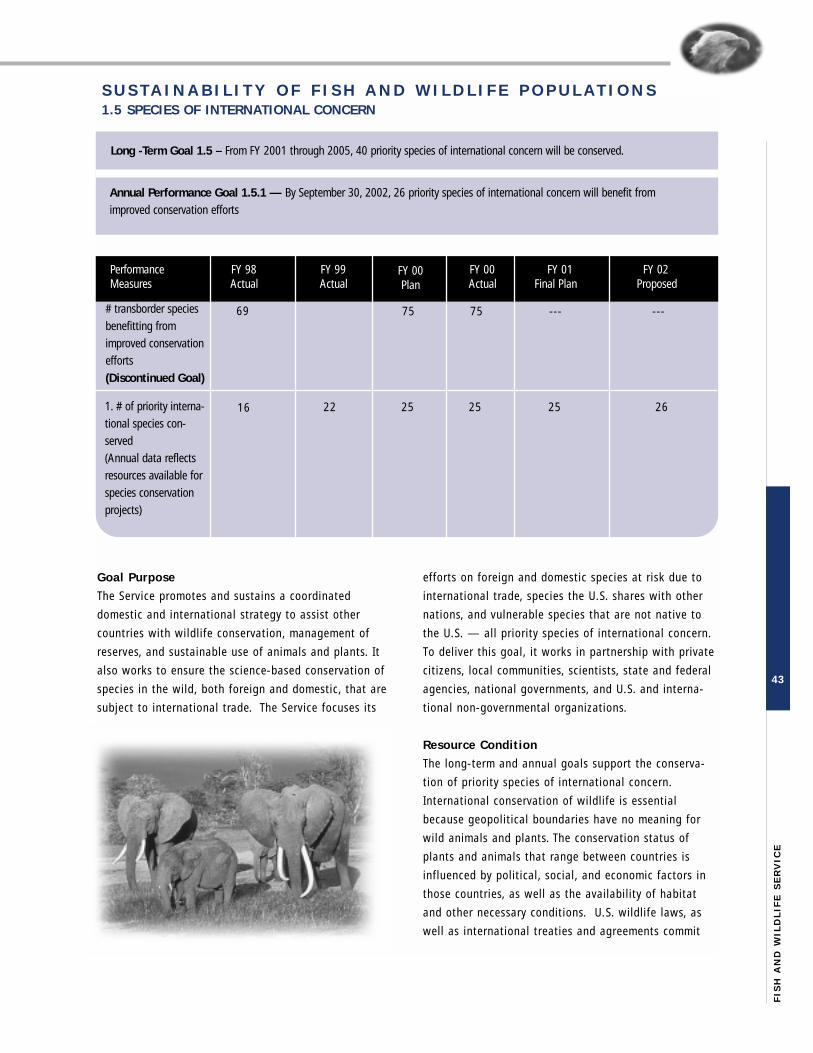
43
FIS
H A
ND
WIL
DL
IFE
SE
RV
ICE
Goal Purpose
The Service promotes and sustains a coordinated
domestic and international strategy to assist other
countries with wildlife conservation, management of
reserves, and sustainable use of animals and plants. It
also works to ensure the science-based conservation of
species in the wild, both foreign and domestic, that are
subject to international trade. The Service focuses its
efforts on foreign and domestic species at risk due to
international trade, species the U.S. shares with other
nations, and vulnerable species that are not native to
the U.S. — al l priority species of international concern.
To deliver this goal, it works in partnership with private
citizens, local communities, scientists, state and federal
agencies, national governments, and U.S. and interna-
tional non-governmental organizations.
Resource Condition
The long-term and annual goals support the conserva-
tion of priority species of international concern.
International conservation of wildlife is essential
because geopolit ical boundaries have no meaning for
wild animals and plants. The conservation status of
plants and animals that range between countries is
influenced by polit ical, social, and economic factors in
those countries, as well as the availabil ity of habitat
and other necessary conditions. U.S. wildlife laws, as
well as international treaties and agreements commit
Annual Performance Goal 1.5.1 — By September 30, 2002, 26 priority species of international concern will benefit fromimproved conservation efforts
Performance FY 98 FY 99 FY 00 FY 01 FY 02Measures Actual Actual Actual Final Plan Proposed
Long -Term Goal 1.5 – From FY 2001 through 2005, 40 priority species of international concern will be conserved.
# transborder speciesbenefitting fromimproved conservationefforts(Discontinued Goal)
69 ---
FY 00Plan
75 75 ---
S U S T A I N A B I L I T Y O F F I S H A N D W I L D L I F E P O P U L A T I O N S1.5 SPECIES OF INTERNATIONAL CONCERN
1. # of priority interna-tional species con-served (Annual data reflectsresources available forspecies conservationprojects)
16 22 25 25 25 26

the United States to working toward the conservation of
these animals and plants, encourages the global conser-
vation of wild species and their habitats, and focuses on
animal and plant resources of the greatest importance
and benefit to the American people. However, a wide
range of conditions may influence the status of species
Americans care about. In fact, status may range from
stable to highly endangered or nearing extinction. Even
for apparently stable populations, a variety of unantici-
pated threats such as habitat destruction and unsus-
tainable trade can adversely impact stabil ity. The
Service ‘s international programs attempt to conserve
remaining populations of vulnerable species and keep
common species common in parts of the world that
experience polit ical, economic, or environmental
changes.
Goal Achievement and Strategies
The Service focuses on two strategies directed toward
the conservation and protection of priority species of
international concern:
International Wildlife Trade performs management
and scientif ic tasks essential to species conservation
under laws and treaties that include but are not l imited
to the Convention on International Trade in Endangered
Species of Wild Fauna and Flora (CITES), the Marine
Mammal Protection Act, the Endangered Species Act
and the Wild Bird Conservation Act. The program helps
conserve species at risk through the application of:
• Best science and management practices: In response
to ever-increasing global pressures of wildlife trade
and habitat loss on species worldwide, the Service
uses best science and management practices to con-
serve species that are or may be at risk, especially
due to international trade.
• International permits program: The Service uses per-
mits as a tool to help conserve wildlife for the enjoy-
ment of people today and of future generations. It
considers the risks and benefits to species in making
scientif ic and management decisions on permit appli-
cations.
• Conservation partnerships: The Service works closely
with states and Tribes, which implement sustainable
management programs for certain native species l ist-
ed under CITES.
• Training and technical assistance: The Service pro-
vides training and technical assistance to encourage
effective implementation (administrative and scientif-
ic) and enforcement of CITES.
Although there are no funding changes for international
wildlife trade activit ies in FY2002, baseline data for
species efforts are being developed to reflect the work
currently being carried out.
In addition, the Service‘s international activit ies receive
support from its Division of Law Enforcement, recog-
nized worldwide for its abil ity to conduct successful
major international investigations involving i l legal traf-
ficking of globally protected species. Service agents
and wildlife inspectors monitor legal international
wildlife trade, and interdict i l legal importations and
exportations of federally protected fish, wildlife, and
plants. Wildlife traffickers increasingly use the interna-
tional mail system and shift their trade routes to cir-
cumvent enforcement efforts. In response, the Service is
increasing its effectiveness by using task force opera-
tions to target specific shipments, industries, or meth-
ods of transport. The Division of Law Enforcement also
is expanding its public outreach programs to inform
wildlife consumers of the long-term consequences of
their wildlife purchases. Partnerships with international
conservation organizations, international interagency
coalit ions and CITES countries are also being strength-
ened to effectively target enforcement efforts for
species of mutual concern. Also, the Service is increas-
ing its international education work by providing hands-
on anti-poaching training, CITES enforcement work-
shops and technical assistance to countries requesting
assistance.
44
AP
P /
AP
R
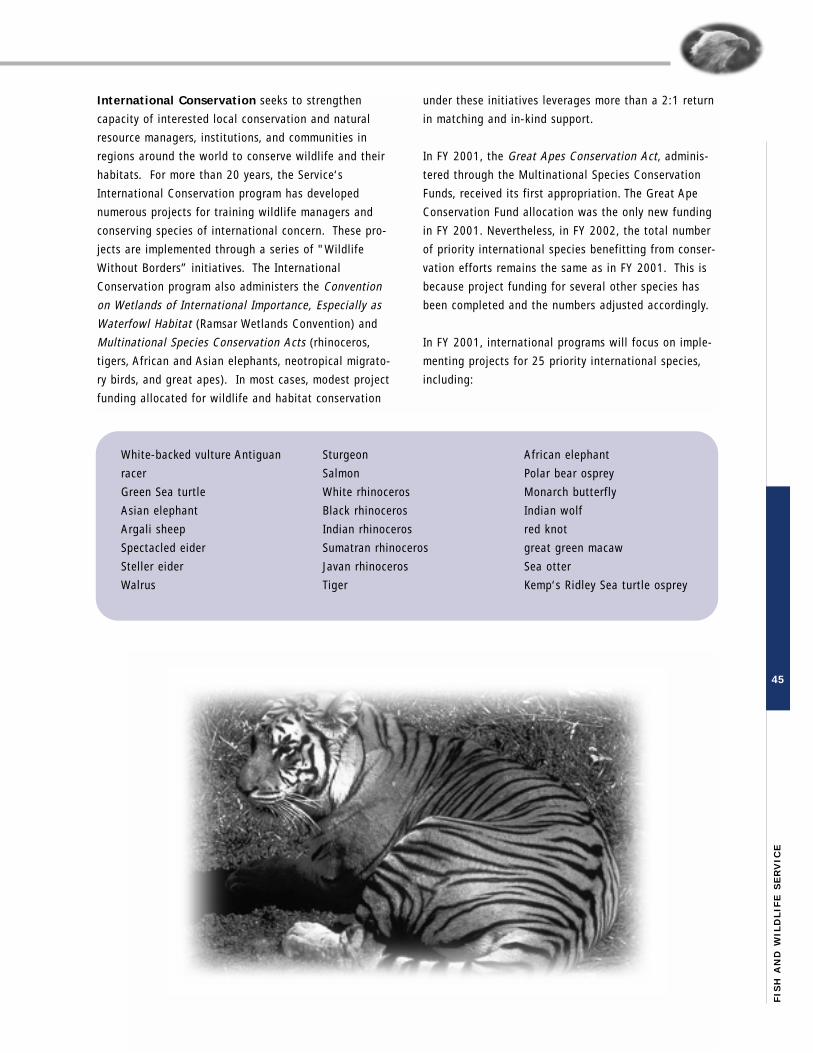
45
FIS
H A
ND
WIL
DL
IFE
SE
RV
ICE
International Conservation seeks to strengthen
capacity of interested local conservation and natural
resource managers, institutions, and communities in
regions around the world to conserve wildlife and their
habitats. For more than 20 years, the Service‘s
International Conservation program has developed
numerous projects for training wildlife managers and
conserving species of international concern. These pro-
jects are implemented through a series of "Wildlife
Without Borders” init iatives. The International
Conservation program also administers the Convention
on Wetlands of International Importance, Especially as
Waterfowl Habitat (Ramsar Wetlands Convention) and
Multinational Species Conservation Acts (rhinoceros,
tigers, African and Asian elephants, neotropical migrato-
ry birds, and great apes). In most cases, modest project
funding allocated for wildlife and habitat conservation
under these initiatives leverages more than a 2:1 return
in matching and in-kind support.
In FY 2001, the Great Apes Conservation Act, adminis-
tered through the Multinational Species Conservation
Funds, received its f irst appropriation. The Great Ape
Conservation Fund allocation was the only new funding
in FY 2001. Nevertheless, in FY 2002, the total number
of priority international species benefitting from conser-
vation efforts remains the same as in FY 2001. This is
because project funding for several other species has
been completed and the numbers adjusted accordingly.
In FY 2001, international programs will focus on imple-
menting projects for 25 priority international species,
including:
White-backed vulture Antiguan
racer
Green Sea turtle
Asian elephant
Argali sheep
Spectacled eider
Steller eider
Walrus
Sturgeon
Salmon
White rhinoceros
Black rhinoceros
Indian rhinoceros
Sumatran rhinoceros
Javan rhinoceros
Tiger
African elephant
Polar bear osprey
Monarch butterfly
Indian wolf
red knot
great green macaw
Sea otter
Kemp‘s Ridley Sea turtle osprey
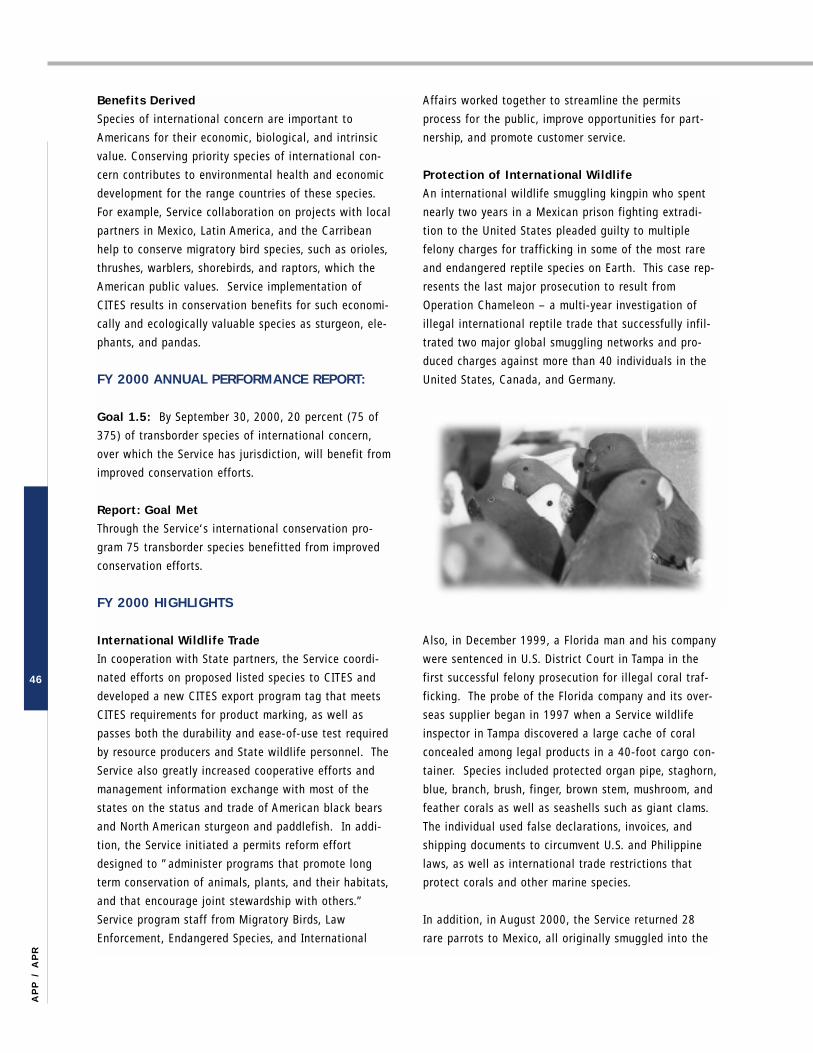
Benefits Derived
Species of international concern are important to
Americans for their economic, biological, and intrinsic
value. Conserving priority species of international con-
cern contributes to environmental health and economic
development for the range countries of these species.
For example, Service collaboration on projects with local
partners in Mexico, Latin America, and the Carribean
help to conserve migratory bird species, such as orioles,
thrushes, warblers, shorebirds, and raptors, which the
American public values. Service implementation of
CITES results in conservation benefits for such economi-
cally and ecologically valuable species as sturgeon, ele-
phants, and pandas.
FY 2000 ANNUAL PERFORMANCE REPORT:
Goal 1.5: By September 30, 2000, 20 percent (75 of
375) of transborder species of international concern,
over which the Service has jurisdiction, wil l benefit from
improved conservation efforts.
Report: Goal Met
Through the Service ‘s international conservation pro-
gram 75 transborder species benefitted from improved
conservation efforts.
FY 2000 HIGHLIGHTS
International Wildlife Trade
In cooperation with State partners, the Service coordi-
nated efforts on proposed l isted species to CITES and
developed a new CITES export program tag that meets
CITES requirements for product marking, as well as
passes both the durabil ity and ease-of-use test required
by resource producers and State wildlife personnel. The
Service also greatly increased cooperative efforts and
management information exchange with most of the
states on the status and trade of American black bears
and North American sturgeon and paddlefish. In addi-
tion, the Service initiated a permits reform effort
designed to ”administer programs that promote long
term conservation of animals, plants, and their habitats,
and that encourage joint stewardship with others.”
Service program staff from Migratory Birds, Law
Enforcement, Endangered Species, and International
Affairs worked together to streamline the permits
process for the public, improve opportunities for part-
nership, and promote customer service.
Protection of International Wildlife
An international wildlife smuggling kingpin who spent
nearly two years in a Mexican prison fighting extradi-
tion to the United States pleaded guilty to multiple
felony charges for trafficking in some of the most rare
and endangered reptile species on Earth. This case rep-
resents the last major prosecution to result from
Operation Chameleon – a multi-year investigation of
i l legal international repti le trade that successfully infi l-
trated two major global smuggling networks and pro-
duced charges against more than 40 individuals in the
United States, Canada, and Germany.
Also, in December 1999, a Florida man and his company
were sentenced in U.S. District Court in Tampa in the
first successful felony prosecution for i l legal coral traf-
ficking. The probe of the Florida company and its over-
seas supplier began in 1997 when a Service wildlife
inspector in Tampa discovered a large cache of coral
concealed among legal products in a 40-foot cargo con-
tainer. Species included protected organ pipe, staghorn,
blue, branch, brush, finger, brown stem, mushroom, and
feather corals as well as seashells such as giant clams.
The individual used false declarations, invoices, and
shipping documents to circumvent U.S. and Phil ippine
laws, as well as international trade restrictions that
protect corals and other marine species.
In addition, in August 2000, the Service returned 28
rare parrots to Mexico, all originally smuggled into the
46
AP
P /
AP
R

47
FIS
H A
ND
WIL
DL
IFE
SE
RV
ICE
United States for the black market pet trade. The
Service investigation that intercepted these birds docu-
mented a multi-year smuggling operation that i l legally
brought some 300 exotic parrots across the U.S./Mexico
border into Texas.
Wildlife Without Borders - Mexico, Latin America
and the Caribbean
The Service supported training workshops to strengthen
the capacity of communities to manage resources within
the Special Biosphere Reserve of the Monarch Butterfly
in central Mexico. The program focused on soil conser-
vation, agro-forestry, and organic gardening. Five com-
munities have adopted sustainable agricultural practices
as a result of this project, with more than 40 families
participating. In addition, peasant promoters are being
trained, so as to reach a greater number of communities
and increase participation in workshops. Another
important program providing environmental education
and public outreach took place as a result of collabora-
tion between the Service and the Society of Caribbean
Ornithology. Together, an initiative was launched to
collaborate with interested islands in the preparation of
booklets featuring the common birds of each island.
The booklets are intended to stimulate interest and
serve as basic primers on island birds rather than as
definitive guides. Currently, 11 islands are participating
in this educational effort.
Multinational Species Conservation Funds
Under the Service‘s Rhinoceros and Tiger Conservation
Fund, a survey of 24 Cambodian wildlife markets and 12
international checkpoints was carried out by an official
of the Cambodian Wildlife Protection Office as part of
his graduate work at the University of Minnesota.
Items such as eight l ive wild caught tigers, 36 tiger
skins, 5 kg of tiger bone, 6 tiger skulls, 43 tiger canine
teeth, were observed in trade. Data was obtained on
where tiger parts are sold, trade routes, and prices
paid. This information wil l be used to generate recom-
mendations to the Government of Cambodia on a con-
servation strategy to reduce kil l ing and trade of endan-
gered species. Also in Cambodia, the Asian Elephant
Conservation Fund supported two projects on assessing
the conservation status of Cambodia‘s Asian elephants
and developing local capacity to insure their long-term
survival. These projects are a collaboration between the
Asian Elephant Conservation Fund, World Wide Fund for
Nature, Wildlife Conservation Society, and Fauna and
Flora International, to assist Cambodian authorities in
assessing elephant numbers, training 12 Cambodian
biologists in elephant ecology and monitoring, and
developing a National Elephant Management Plan and a
Khmer language manual in elephant ecology and moni-
toring. Further, under the amendments of the
Rhinoceros and Tiger Conservation Act, the Service
developed an interim educational outreach program to
alert cit izens to the plight of rhinos and tigers and the
il legality of products claiming to contain products of
these species. These efforts included increased coordi-
nated contact with non-governmental organizations
including those in the traditional medicine industry and
profession.
Performance Measure Number of priority international species conserved
Data Source FWS/International Conservation Division Annual and Final Reports from grantees.
Data Validation See Data Verification and Validation, Page 102
Verification Grants awarded competitively using peer review groups of scientists. Grant recipients report on their progress through annual reports process. Projectmanagers conduct final project reviews.
Data Limitations Species lists are not part of grantee submission. Process is being modified to address this. Some data is obtained from external sources.
Planned Improvements See Data Verification and Validation, Page 102
Baseline 1997: 15 international species

48
AP
P /
AP
R
143,000 135,000 170,000 170,000 170,000 170,000
1.6.4 # of preventionand/or control pro-grams developed.
Long-Term Goal 1.6 — By 2005, the Service will prevent importation and expansion, or reduce the range (or population density)of aquatic and terrestrial invasive species on and off Service lands by controlling them on 13,450 acres off Service lands and850,000 acres within the National Wildlife Refuge System, conducting risk assessments on 20 high risk invasive species for possibleamendment of the injurious wildlife list, and developing 5 additional cooperative prevention and/or control programs for aquaticinvasive species (coordinated through the ANS Task Force).
S U S T A I N A B I L I T Y O F F I S H A N D W I L D L I F E P O P U L A T I O N S1.6 INVASIVE SPECIES
Annual Performance Goal 1.6.1 — By September 30, 2002, the Service will control aquatic and terrestrial invasive species on170,000 acres of the National Wildlife Refuge System.
Annual Performance Goal 1.6.2 — By September 30, 2002, the Service will control aquatic and terrestrial invasive species on2,690 acres off Service lands.
Annual Performance Goal 1.6.3 — By September 30, 2002, the Service will conduct risk assessments on 4 high-risk invasivespecies being intentionally imported into the U.S.
Annual Performance Goal 1.6.4 — By September 30, 2002, the Service will cooperatively develop two prevention and/or con-trol programs for aquatic invasive species.
Performance FY 98 FY 99 FY 00 FY 01 FY 02Measures Actual Actual Actual Final Plan Proposed
FY 00Plan
1.6.1 # of acres of theNational Wildlife RefugeSystem enhanced by con-trolling aquatic and ter-restrial invasive species.
1.6.2 # of acres offService lands where inva-sive species have beencontrolled.
1.6.3 # of risk assess-ments conducted on highrisk invasive species.
----- ----- ----- ----- 2,690 2,690
----- ----- ----- ----- 4 4
----- ----- 1 1 2 2
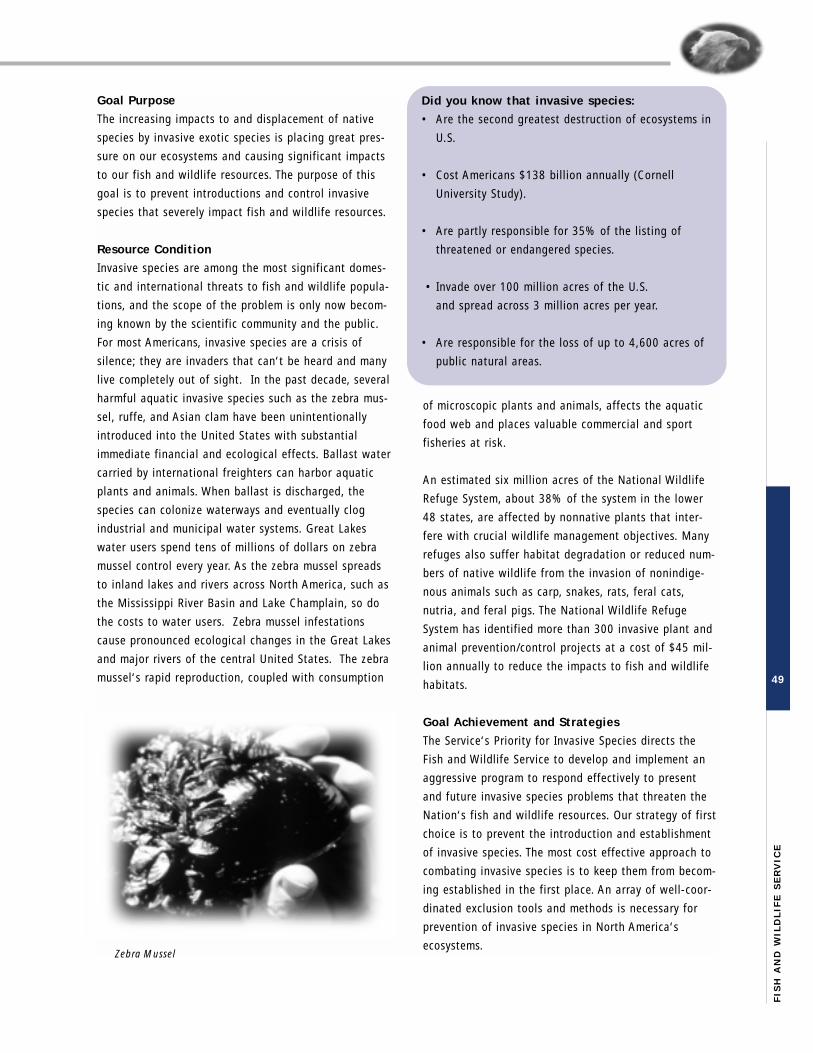
Goal Purpose
The increasing impacts to and displacement of native
species by invasive exotic species is placing great pres-
sure on our ecosystems and causing significant impacts
to our fish and wildlife resources. The purpose of this
goal is to prevent introductions and control invasive
species that severely impact fish and wildlife resources.
Resource Condition
Invasive species are among the most significant domes-
tic and international threats to fish and wildlife popula-
tions, and the scope of the problem is only now becom-
ing known by the scientif ic community and the public.
For most Americans, invasive species are a crisis of
si lence; they are invaders that can‘t be heard and many
live completely out of sight. In the past decade, several
harmful aquatic invasive species such as the zebra mus-
sel, ruffe, and Asian clam have been unintentionally
introduced into the United States with substantial
immediate financial and ecological effects. Ballast water
carried by international freighters can harbor aquatic
plants and animals. When ballast is discharged, the
species can colonize waterways and eventually clog
industrial and municipal water systems. Great Lakes
water users spend tens of mil l ions of dollars on zebra
mussel control every year. As the zebra mussel spreads
to inland lakes and rivers across North America, such as
the Mississippi River Basin and Lake Champlain, so do
the costs to water users. Zebra mussel infestations
cause pronounced ecological changes in the Great Lakes
and major rivers of the central United States. The zebra
mussel‘s rapid reproduction, coupled with consumption
of microscopic plants and animals, affects the aquatic
food web and places valuable commercial and sport
fisheries at risk.
An estimated six mil l ion acres of the National Wildlife
Refuge System, about 38% of the system in the lower
48 states, are affected by nonnative plants that inter-
fere with crucial wildlife management objectives. Many
refuges also suffer habitat degradation or reduced num-
bers of native wildlife from the invasion of nonindige-
nous animals such as carp, snakes, rats, feral cats,
nutria, and feral pigs. The National Wildlife Refuge
System has identif ied more than 300 invasive plant and
animal prevention/control projects at a cost of $45 mil-
l ion annually to reduce the impacts to fish and wildlife
habitats.
Goal Achievement and Strategies
The Service‘s Priority for Invasive Species directs the
Fish and Wildlife Service to develop and implement an
aggressive program to respond effectively to present
and future invasive species problems that threaten the
Nation ‘s fish and wildlife resources. Our strategy of f irst
choice is to prevent the introduction and establishment
of invasive species. The most cost effective approach to
combating invasive species is to keep them from becom-
ing established in the first place. An array of well-coor-
dinated exclusion tools and methods is necessary for
prevention of invasive species in North America ‘s
ecosystems.
49
FIS
H A
ND
WIL
DL
IFE
SE
RV
ICE
Did you know that invasive species:
• Are the second greatest destruction of ecosystems in
U.S.
• Cost Americans $138 bil l ion annually (Cornell
University Study).
• Are partly responsible for 35% of the l isting of
threatened or endangered species.
• Invade over 100 mill ion acres of the U.S.
and spread across 3 mill ion acres per year.
• Are responsible for the loss of up to 4,600 acres of
public natural areas.
Zebra Mussel

When prevention cannot be achieved, we will focus
specifically on four key program strategies:
• The Partners for Fish and Wildlife Program will work
with private landowners on a voluntary basis to
implement on-the-ground projects that eradicate,
control and/or manage invasive plant species and
restore native habitats (e.g., wetlands, riparian areas,
rangelands). Project selection wil l be nationwide
and designed to benefit Federal trust resources, as
well as local resources. For example, invasive plants
have degraded forest and shrub habitats on the
Hawaiian Islands and in Florida. Partners projects in
these States that focus on invasive plant removal wil l
benefit endemic plant species, restore watershed
health and improve habitat for Federal trust species,
such as migratory birds and endangered or threat-
ened species. Partners projects to remove or control
invasive plants (e.g., leafy spurge, Canada thistle) in
the northern Great Plains states wil l help improve
stream bank stabil ity, grazing lands for landowners
and wildlife species and in-stream habitats which
benefit native fish species. Invasive plant species
removal in New England improves wetland habitat,
provides improved habitat for migratory birds and
improves the water quality renovation functions of
these wetlands.
• Second, through the National Wildlife Refuge System,
we will address invasive species problems on refuge
lands by: identifying infestations of invasive species
throughout the refuge system through surveys and
field observations, initiating a comprehensive survey
of harmful invasive species populations and their
impacts on refuge lands, controll ing invasive species
on refuge lands using a fully integrated management
approach, and coordinating invasive species preven-
tion and control activit ies with local, state, and
national partners.
• Third, the Fisheries Program will provide technical
assistance in the development of cooperative preven-
tion and control plans, and work with the Aquatic
Nuisance Species Task Force.
• Fourth, through the International Affairs Program, we
evaluate the importation of new, potentially invasive
species ensuring that they do not have the opportu-
nity to become established. We have begun develop-
ing new export guidelines that consider U.S. species
with potential for invasion in other countries.
50
AP
P /
AP
R

51
FIS
H A
ND
WIL
DL
IFE
SE
RV
ICE
1.6.1Performance Measure # acres on NWR enhanced by controlling invasive species.
Data Source Refuge Management Information System. Annual Accomplishment Report
Verification Reported by field stations to regional offices - quality & consistency; final to Washington Office, Division of Refuges.
Data Limitations Habitat Management activities are affected by weather conditions.
Baseline FY 1997 data = 165,000 acres
1.6.2Performance Measure # acres off Service lands where invasive species have been controlled.
Data Source Partners for Fish and Wildlife Program biologists in the field will enter the data into the Habitat Information Tracking System.
Verification Reported by Field Stations in the Habitat Information Tracking Systems. Reporting has been standardized and computerized. Regional Offices andNational Office conduct QA/QC.
Data Limitations Double counting may occur when multiple partners are involved in the restoration efforts. Difference in interpretation of acreage reported when only aportion of the area involves control actions.
Baseline FY 1997 data = 0 acres
1.6.3 Performance Measure # risk assessments conducted on high-risk invasive species.
Data Source Office of Scientific Authority
Baseline FY 1997 data = 0 risk assessments
Verification Reported by Office of Scientific Authority
Data Limitations None known.
Baseline FY 1997 data = 0 risk assessments
1.6.4 Performance Measure # prevention & control programs developed.
Data Source Aquatic Nuisance Species Task Force Annual Accomplishments Report Data Validation for See Data Verification and Validation, Page 102 1.6.1, 1.6.2, 1.6.3,and 1.6.4
Verification Reported by ANS Task Force Executive Secretary
Data Limitations Consensus from the ANS Task Force is needed to develop programs.
Planned Improvements See Data Verification and Validation, Page 102 for 1.6.1, 1.6.2, 1.6.3and 1.6.4,
Baseline FY 1997 data = 2 control programs.
FY 2000 ANNUAL PERFORMANCE REPORT: (Annual Performance Goals 1.6.1, 1.6.2, 1.6.3, and 1.6.4are new for FY 2001; therefore, FY 2000 annual reporting is not applicable.)
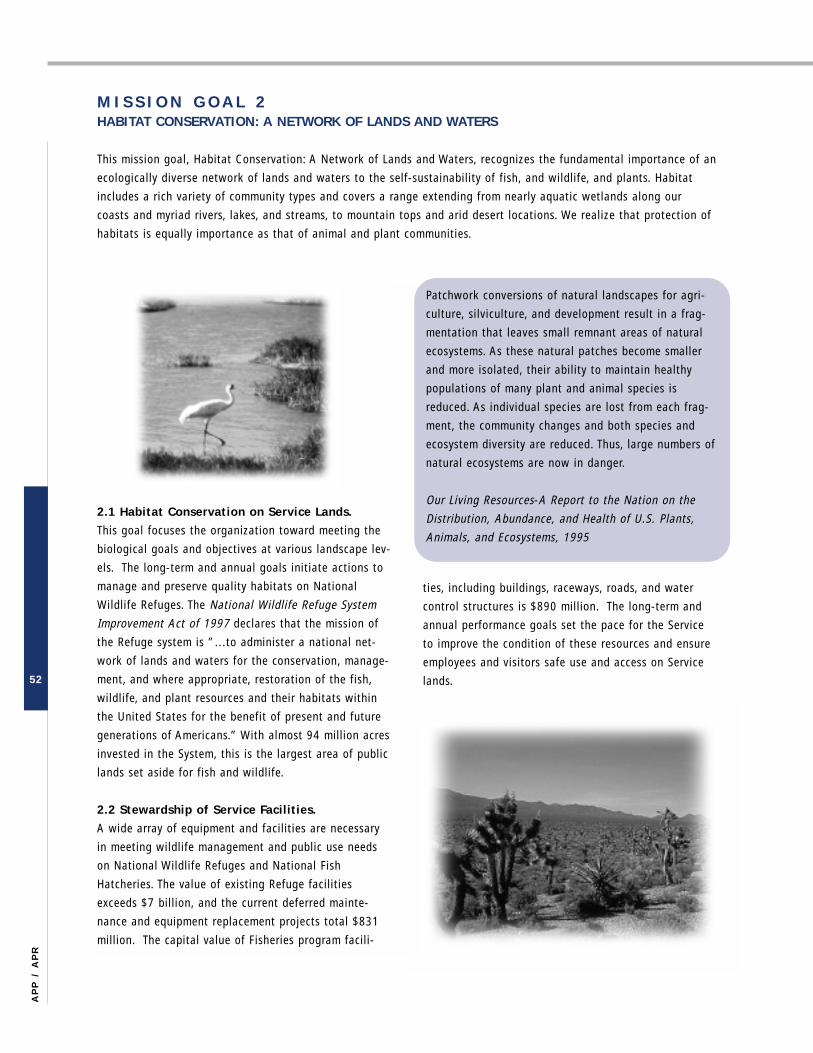
52
AP
P /
AP
R
2.1 Habitat Conservation on Service Lands.
This goal focuses the organization toward meeting the
biological goals and objectives at various landscape lev-
els. The long-term and annual goals initiate actions to
manage and preserve quality habitats on National
Wildlife Refuges. The National Wildlife Refuge System
Improvement Act of 1997 declares that the mission of
the Refuge system is ”...to administer a national net-
work of lands and waters for the conservation, manage-
ment, and where appropriate, restoration of the fish,
wildlife, and plant resources and their habitats within
the United States for the benefit of present and future
generations of Americans.” With almost 94 mill ion acres
invested in the System, this is the largest area of public
lands set aside for f ish and wildlife.
2.2 Stewardship of Service Facilities.
A wide array of equipment and facil it ies are necessary
in meeting wildlife management and public use needs
on National Wildlife Refuges and National Fish
Hatcheries. The value of existing Refuge facil it ies
exceeds $7 bil l ion, and the current deferred mainte-
nance and equipment replacement projects total $831
mill ion. The capital value of Fisheries program facil i-
t ies, including buildings, raceways, roads, and water
control structures is $890 mill ion. The long-term and
annual performance goals set the pace for the Service
to improve the condition of these resources and ensure
employees and visitors safe use and access on Service
lands.
M I S S I O N G O A L 2 HABITAT CONSERVATION: A NETWORK OF LANDS AND WATERS
This mission goal, Habitat Conservation: A Network of Lands and Waters, recognizes the fundamental importance of an
ecologically diverse network of lands and waters to the self-sustainabil ity of f ish, and wildlife, and plants. Habitat
includes a rich variety of community types and covers a range extending from nearly aquatic wetlands along our
coasts and myriad rivers, lakes, and streams, to mountain tops and arid desert locations. We realize that protection of
habitats is equally importance as that of animal and plant communities.
Patchwork conversions of natural landscapes for agri-
culture, si lviculture, and development result in a frag-
mentation that leaves small remnant areas of natural
ecosystems. As these natural patches become smaller
and more isolated, their abil ity to maintain healthy
populations of many plant and animal species is
reduced. As individual species are lost from each frag-
ment, the community changes and both species and
ecosystem diversity are reduced. Thus, large numbers of
natural ecosystems are now in danger.
Our Living Resources-A Report to the Nation on the
Distribution, Abundance, and Health of U.S. Plants,
Animals, and Ecosystems, 1995

53
FIS
H A
ND
WIL
DL
IFE
SE
RV
ICE
L INK BUDGETARY RESOURCES TO MISSION GOAL 2 - HABITAT CONSERVATION: A NETWORK OF LANDS AND WATERSThe following table provides a crosswalk of total appropriated funds to the second Mission Goal, Habitat
Conservation: A Network of Lands and Waters, for FY 2000 Enacted, FY 2001 Enacted, and FY 2002 President‘s
Request.
B u d g e tA c t i v i t y / S u b a c t i v i t y
( $ 0 0 0 )
F Y 2 0 0 0
E n a c t e d
F Y 2 0 0 1
E n a c t e d
F Y 2 0 0 2
P r e s i d e n t ‘ s B u d g e t
To t a l M i s s i o n
G o a l 2
To t a l M i s s i o n
G o a l 2
To t a l M i s s i o n
G o a l 2
Ecological Services
Endangered Species
Habitat Conservation
Environmental Contaminants
Refuges and Wildlife
Refuge Operations and Maintenance
Migratory Bird Management
Salton Sea Recovery
Law Enforcement
Fisheries
General Administration
Construction
Land Acquisition
State Wildlife Grants Fund
Wildlife Cons. & Appreciation. Fund
National Wildlife Refuge Fund
North American Wetlands Cons. Fund
Cooperative End. Species Cons. Fund
Multinational Species Conservation Fd.
Commercial Salmon Fishery
Federal Aid in Wildlife Restoration
TOTAL APPROPRIATIONS
186,383
106,072
70,449
9,862
281,571
258,977
21,598
996
39,405
83,940
123,244
53,528
61,938
0
797
10,739
14,957
23,000
2,391
4,625
0
886,518
80,311
0
70,449
9,862
135,462
134,466
0
996
0
24,538
41,080
53,528
61,938
0
0
10,739
14,957
0
0
0
0
422,553
209,882
120,947
78,290
10,645
326,356
299,678
25,684
994
49,583
92,029
128,966
71,358
121,188
49,890
795
11,414
39,912
104,694
3,243
0
49,890
1,259,200
88,935
0
78,290
10,668
165,661
164,667
0
994
0
31,611
42,886
71,358
121,188
49,890
0
11,414
39,912
0
0
0
0
622,855
198,493
111,814
76,209
10,470
340,816
314,664
25,159
993
50,411
92,979
124,053
35,849
164,401
0
0
11,414
14,912
54,694
3,243
0
0
1,091,265
86,679
0
76,209
10,470
176,496
175,503
0
993
0
32,255
41,288
35,849
164,401
0
0
11,414
14,912
0
0
0
0
563,294
2.3 Habitat Conservation Off Service Lands.
Looking beyond refuge boundaries wil l not only protect
refuge lands, but wil l create a healthier environment for
all l iving organisms, including people. The long-term
and annual goals recognize the importance of non-
Federal lands to the existence of f ish and wildlife
resources. More than 70% of the Nation‘s land is in
non-Federal ownership — most of the opportunities for
conserving and restoring these habitats l ie with the pri-
vate landowner. Our goal is to offer the public opportu-
nities to restore and enhance their lands and waters for
the benefit of f ish and wildlife resources.

54
AP
P /
AP
R
Goal Purpose
The objective of the two annual performance goals is to
restore and manage habitat quality of the lands and
waters owned and managed by the Service, principally
the National Wildlife Refuge System (NWRS). This is to
further the accomplishment of the NWRS mission and to
maintain the biological integrity, diversity, and environ-
mental health of the system as called for in the
National Wildlife Refuge System improvement Act of
1997.
Resource Condition
Healthy habitats are fundamental for self-sustaining
populations of f ish, wildlife, and plants as well as for
functional ecosystems. The Service ‘s goal is to conserve
fish and wildlife by protecting and restoring the habitat
on which they depend. The National Wildlife Refuge
System, with approximately 535 refuges and 37 wetland
management districts encompassing nearly 94 mill ion
acres, protects virtually every type of habitat found in
the United States for the benefit of f ish and wildlife
species. Many of these habitats are in degraded condi-
tion and must be restored to original function to benefit
wildlife and the human communities that surround these
lands. They also require a significant amount of annual
management in order to produce desired wildlife bene-
fits.
Goal Achievement and Strategies
Management of habitats ranging from preservation to
active manipulation of habitats is necessary to maintain
the biological integrity, diversity, and environmental
health on refuges. We favor management that restores
or mimics natural processes. Habitat restoration on
Service lands involves the return of altered or degraded
habitats to their original or similar condition. These
2.1 HABITAT CONSERVATION ON SERVICE LANDS
Annual Performance Goal 2.1.1 — By September 30, 2002, meet the identified habitat needs of the Service lands by annuallymanaging or enhancing approximately 3.2 million acres of refuge habitat, and restoring 146,646 acres of refuge habitat.
Annual Performance Goal 2.1.2 — By September 30, 2002, add 255,000 acres to the refuge system over the previous yearsupporting fish and wildlife species population objectives.
Long -Term Goal 2.1 — Through 2005, meet the identified habitat needs of Service lands by supporting fish and wildlife speciespopulations objectives through the restoration of 850,000 acres, and annual management/enhancement of 3.2 million acres ofhabitats.
1. # of acres annually managedor enhanced in the NationalWildlife Refuge System
3,150,0002,950,7253,098,856 3,287,764 3,144,5593,377,260
PerformanceMeasures
2. # of acres of refuge habitatrestored (annual data)
Division of Refuges
NAWCF
105,420
----
----
146,646
120,000
26,646
137,000
----
----
137,000
----
----
186,000
----
----
244,769
104,500
140,269
FY 98Actual
FY 99Actual
FY 00Plan
FY 00Actual
FY 01Final Plan
FY 02Proposed

are one time or infrequently recurring actions and are
dominated by three activit ies: restoring the hydrology
of wetlands, reforestation, and grassland reseeding. In
FY 2000, the refuge system restored 186,000 acres of
habitat important to wildlife. Habitat management or
enhancement on Service lands is the alternation or
annual management of habitats to improve their value
for f ish, wildlife, and plants. Management or enhance-
ment activit ies generally are annual or regularly recur-
ring and are dominated by water level management,
grazing, haying, farming forest management, prescribed
burning, and invasive plant control. In FY 2000, the
refuge system actively managed or enhanced 3.2 mill ion
acres of important wildlife habitat (reference perfor-
mance measure #1).
The Service has organized its habitat conservation strat-
egy on refuges around five basic premises:
• First, a significant portion of refuge habitats must be
annually managed to improve their value for f ish and
wildlife;
• Second, some refuge habitats require permanent
restoration of degraded lands to their original or sim-
ilar condition;
• Third, additional strategically selected refuge lands
are needed to support the diversity of the nation‘s
fish, wildlife, and plant resources; and
• Fourth, refuge lands must be regularly monitored: a)
to assure that biological integrity, diversity, and envi-
ronmental health are maintained; and b) to deter-
mine the effectiveness of management efforts by
comparing results to desired outcomes.
A refuge does not exist in isolation. Habitat on many
refuges can be threatened by external factors, such as
contaminated air and water; altered or depleted water
supply; and other land and water uses within the water-
shed. To maintain a healthy environment for f ish and
wildlife, refuges must be managed in concert with adja-
cent lands. The Service wil l work cooperatively with
partners, private landowners, Tribes, local governments,
and other federal agencies to sustain healthy habitats
on refuge lands. The refuge system strives to be a
model and demonstration area for habitat management
to help foster broader participation in natural resource
stewardship.
Healthy watersheds are neces-
sary to sustain quality habitat on
lands in the Refuge System.
There is a growing need to iden-
tify threats and contaminant
issues that may compromise the
integrity of refuge lands. To sus-
tain the health and diversity of
refuges, Service managers need
sound information about the
condition of the lands and
resources.
The Service wil l manage habitats through moist-soil
management; manipulation of impoundment water
levels; prescribed fire; cooperative haying, grazing,
and farming. Rather than hold water high in
impoundments year-round just for waterfowl, levels
are timed to provide habitat for migrant shorebirds
or to accommodate fish passage and spawning.
Rather than plant tame grasses just for ducks, a full
array of native grasses start to become available to
help rebuild diversity of both prairie animals and
prairie plants. The Service wil l restore previously
drained wetlands, replant native grasslands or
forests, protect water rights, resolve contaminant
problems, and put in place infrastructure for
required habitat management.
55
FIS
H A
ND
WIL
DL
IFE
SE
RV
ICE
The National
Wildlife Refuge
System has received
a clarif ied mission
and priorit ies in
recent legislative
direction through
the National
Wildlife Refuge
System Improvement
of 1997. Shortly
thereafter, a nation-
al conference was
convened which coalesced a vision for the future of the
refuge system printed in 1999 under the tit le ”Fulfi l l ing
the Promise”. In 2000, Congress in a bi-partisan effort
passed the National Wildlife Refuge System Centennial
Act in acknowledgment of the upcoming centennial of
the system in 2003. The Act provides for broadened
public understanding and appreciation of these unique
natural treasures, expanding partnerships for their care,
and strengthening the stewardship and infrastructure of
the 535 refuges and thousands of small prairie wetlands
that make up the Refuge System. Collectively these
developments provide a strong foundation for future
improvement to management of lands within the refuge
system.
Budgetary resources in FY 2002 to restore and enhance
habitats on refuge lands are expected to be the similar
to FY 2001.Habitat management activit ies are also
influenced considerably by weather events and expand-
ed fire management capabil it ies should lead to greater
use of prescribed fire on refuges. FY 2002 acres annu-
ally managed or enhanced and acres restored could
decline in 2002 by 1 to 3% below FY 2001; however,
actual accomplishments in 2000 exceeded targets and it
is expected that 2002 amounts wil l be similar to the
amount currently projected for 2001.
Benefits Derived
• Refuges are anchors for biodiversity and ecosystem-
level conservation and the System is a leader in the
preservation and management of unique natural trea-
sures.
• Protecting, restoring, and annually managing or
enhancing lands greatly increases their value for
wildlife.
• Refuge System lands are biologically diverse, main-
tain their integrity, and are environmentally healthy.
• Secure and healthy refuge habitats allow endangered
species to recover and reduce the need for future
listings.
• A healthy refuge system provides an enduring legacy
of healthy fish, wildlife, and plant resources for peo-
ple to enjoy today and for generations to come.
• Important secondary benefits such as flood abate-
ment, water and air quality improvement, and protec-
tion of scenic beauty also accrue to refuges.
• Even more value wil l be added to the System over
time as strategic acquisit ion of new lands continues
to occur.
FY 2000 ANNUAL PERFORMANCE REPORT:
Goal: 2.1.1 By September 30, 2000, meet the identi-
f ied habitat needs of the Service lands by ensuring that
93,883,301 acres are protected, of which 3,377,260
acres wil l be enhanced or restored. (Goal discontinued
in FY 2001]
Report: Goal Exceeded
One of the FY 2000 performance targets was to protect
93,883,301 acres with the National Wildlife Refuge
System (NWRS), by removing or reducing threats to
wildlife an habitat integrity. The Service exceeded the
target by protecting an additional 79,245 acres above
the FY 2000 level.
For the FY 2000 revised final annual performance plan,
the target acreage to be enhanced or restored was
3,377,260, which included the acreage contribution of
the North American Wetlands Conservation Fund
(NAWCF). Subsequently, we determined that the
NAWCF actual and target acreage was estimated
acreage in the approved NWACF grants. Thus, to cor-
rectly compare actual acres enhanced or restored, the
NAWCF proposed acres was removed from both the FY
2000 Plan and FY 2000 Actual. Therefore, we adjusted
the enhanced/restored target to reflect only the acreage
to be completed by the Division of Refuges. Thus, we
exceeded the target, 3,270,333, by 17,431 acres. The
56
AP
P /
AP
R

actual acreage enhanced/restored by the NAWCF will be
reported at a later date.
For FY 2001, this goal wil l be revised. The enhanced or
restored acreage in the NWRS will be split into 3 sepa-
rate categories; (1) the number of acres of habitat
annually managed or enhanced; (2) number of acres of
habitat restored during the year, and (3) number of
acres enhanced by controll ing aquatic and terrestrial
invasive species. This realignment wil l al low more
precise monitoring of habitat improvement efforts with-
in the NWRS. In addition, a new annual performance
goal has been established to develop standardized
methods to measure biological diversity and environ-
mental health on all refuges. New policies are being
developed for this effort which is called for in the
National Wildlife Refuge System Improvement of 1997.
A workgroup has been assembled to develop standard-
ized approaches for monitoring environmental health of
refuges.
FY 2000 HIGHLIGHTS
Significant Land Acquisition Accomplishments in
Fiscal Year 2000
The U.S. Fish and Wildlife Service added fee tit le or
other interests in nearly 325,710 acres of land in Fiscal
Year 2000. The number of National Wildlife Refuges
increased from 521 in FY 1999 to 530 in FY 2000. Six
new units were established as part of the National
Wildlife Refuge System in FY 2000 – the John W. and
Louise Seier NWR in Nebraska, Big Oaks NWR in
Indiana, Cat Island NWR in Louisiana, Guadalupe-
Nipomo Dunes NWR in California, North Dakota Wildlife
Management Area in North Dakota, and the Northern
Tallgrass Prairie NWR in Minnesota. In addition, four
divisions of the Mark Twain NWR in Missouri, I l l inois
and Iowa were renamed the Port Louisa, Two Rivers,
Great River, and Middle Mississippi River National
Wildlife Refuges.
John W. and Louise Seier NWR: Established in
Rock County, Nebraska, through a donation by the
Johnnie Seier, Inc. Trust. The refuge is made up of
predominately upland sandhil l prairie, and temporary
and seasonal wetlands. It provides important habitat
for all sandhil l species of resident wildlife, as well as
nesting habitat and migration resting sites for water-
fowl, neotropical birds, shorebirds and wading birds.
North Dakota Waterfowl Management Area:
Established to restore and protect crit ical tallgrass
prairie habitat in eastern North Dakota, primarily
through the purchase of easements from will ing sell-
ers. Native tallgrass prairie is one of the most
endangered and fragmented forms of wildlife habitat
in North America. Ninety-nine percent of the original
prairie is gone in this Region.
Cat Island NWR: Established in West Feliciana
Parish, Louisiana with the acquisit ion of a 632-acre
tract from the Louisiana Nature Conservancy. This is
57
FIS
H A
ND
WIL
DL
IFE
SE
RV
ICE
FWS firefighters monitor prescribed burn at Florida Panther NWR - controlled burnsare an important tool to promote healthy vegetation benefitting wildlife.

the first acquisit ion of a timber company parcel con-
taining 9,500 acres. The remainder of the property
will be added as funds become available. The Island
is unique in that it has the national champion bald
cypress tree located within its boundary and is along
an unlevied portion of the Mississippi River.
Big Oaks NWR: Established on the site of the
Department of the Army ‘s former Jefferson Proving
Ground near Madison, Indiana, through a 25-year
real-estate permit with the Army. The refuge pro-
vides habitat for 120 species of breeding birds, the
federally endangered Indiana bat, and 41 species of
fish. It is also home to white-tailed deer, wild
turkey, river otters and coyotes. The Indiana
Department of Natural Resources has identif ied 46
rare species of plants on the site.
Guadalupe-Nipomo Dunes NWR: Established
through a donation by The Nature Conservancy which
received it in a transfer from the California Coastal
Conservancy. The purpose of the refuge is to con-
serve the central California coastal dune and associ-
ated wetland habitats and assist in the recovery of
native plants and animals that are federally l isted as
threatened or endangered. More than 86 species of
migratory waterfowl and shorebirds use the refuge
and surrounding areas, including over a mill ion
whimbrels during their spring migration. The western
snowy plover, California least tern, California brown
pelican and California red-legged frog are among
listed species occurring on the refuge.
Northern Tallgrass Prairie NWR: Established to
preserve and restore the northern tallgrass prairie
and associated habitat throughout various locations
in western Minnesota and northwestern Iowa. The
lands are usually the only remaining cover available
to grassland-dependent wildlife in a predominantly
agricultural area. Eleven species of wildlife and
plants found in the project area are federally l isted
under the Endangered Species Act.
Refuge Habitat Conservation & RestorationEfforts
Merritt Island National Wildlife Refuge - Florida
The multi-phased, multi-agency marsh restoration pro-
ject at Merritt Island National Wildlife Refuge in Florida
to enhance wetland resources continued this year on
impoundments created in the 1950‘s for mosquito con-
trol. The results of this effort over the past several
years have been excellent. This effort includes
enhanced water-wetland management, wetland-estuary
reconnection, and complete estuary wetland restoration
by dike removal to allow natural hydrological condi-
tions.
58
AP
P /
AP
R
State Unit Name Acres Date Established
Nebraska John W. and Louise Seier NWR 2,400 10/26/1999
North Dakota North Dakota WMA 11,897 02/25/2000
Louisiana Cat Island NWR 632 05/30/2000
Indiana Big Oaks NWR 51,000 06/30/2000
California Guadalupe-Nipomo Dunes NWR 2,553 08/01/2000
Minnesota Northern Tallgrass Prairie NWR 66 09/15/2000
Significant Land Acquisition Accomplishments in Fiscal Year 2000

Chassahowitzka National Wildlife Refuge -
Florida
A section of eroded mangroves was planted with
Spartina alternifolia on Tarpon Key/Pinellas National
Wildlife Refuge last March. This cooperative effort was
funded through a U.S. Fish and Wildlife Service/National
Audubon Society/Florida Coastal Islands Sanctuaries
grant. Over 50 students from Dixie Holl ins High School,
Tampa, Florida planted 3,000 plants in 45 minutes.
Hubbard‘s Marine donated a pontoon boat to transport
the students to the island. Additional participants
included Tampa Bay Watch and National Oceanic and
Atmospheric Administration.
Imperial NWR - Arizona
On this refuge, U.S. Bureau of Reclamation and Ducks
Unlimited continued restoration work on 115 acres of
wetlands including planting 18,600 cottonwood and
willow trees. Eight acres were also restored by planting
native cottonwoods. A water delivery system was com-
pleted to improve 80 acres of wetland habitat.
Goal: 2.1.2 By September 30, 2000, complete 80 per-
cent of contaminated cleanup projects on Service lands.
[Goal discontinued in FY 2001]
Report: Goal Met
For the FY 2000 revised annual performance plan, the
annual target was to complete 80% (19/24) of contami-
nated projects. After FY 2000 Appropriations, the tar-
get was reduced to 17/22 or 77%, due to program
funding reductions. Thus, the revised target,77%,was
achieved. These projects, focus on site investigation,
monitoring and cleanup on Service lands, improving the
quality of habitats for f ish and wildlife.
59
FIS
H A
ND
WIL
DL
IFE
SE
RV
ICE
Performance Measure 1. # of acres annually managed/enhanced in the NWRS. 2. # of acres of refuge habitat restored in the NWRS.
Data Source All information is collected, reported, and analyzed by the Division of Refuges and Division of Realty.
Data Validation See Data Verification and Validation, Page 102
Verification Added acres: Initial data is maintained in Regional Realty Offices and then forwarded to the Washington Office Division of Realty for quality control, finalediting, and assembly of final document. Improved/Enhanced /Restored Acres: Reported data are assembled at field stations, then forwarded to RegionalOffices for quality control and consistency checks, and then subsequently forwarded to Washington Office for final editing and national roll-up. Regionalinspection of field stations also include review of data collection and management efforts. Data is collected and aggregated in field and regional offices.Formal reporting sources include Annual Report by Refuges; Division of Realty- Real Property Management Information System & Annual Report of LandsUnder Control of the U.S. Fish and Wildlife Service; and Refuge Comprehensive Accomplishment Report.
Data Limitations Habitat management activities are influenced by weather conditions, and also upon the continuing commitment of Service partners.
Planned Improvements See Data Verification and Validation, Page 102
Baseline FY 1997: 2,386,856 acres improved/enhanced. FY 1997: 95,144 acres refuge habitat restored. FY 1997: 92,874 acres added to refuge system
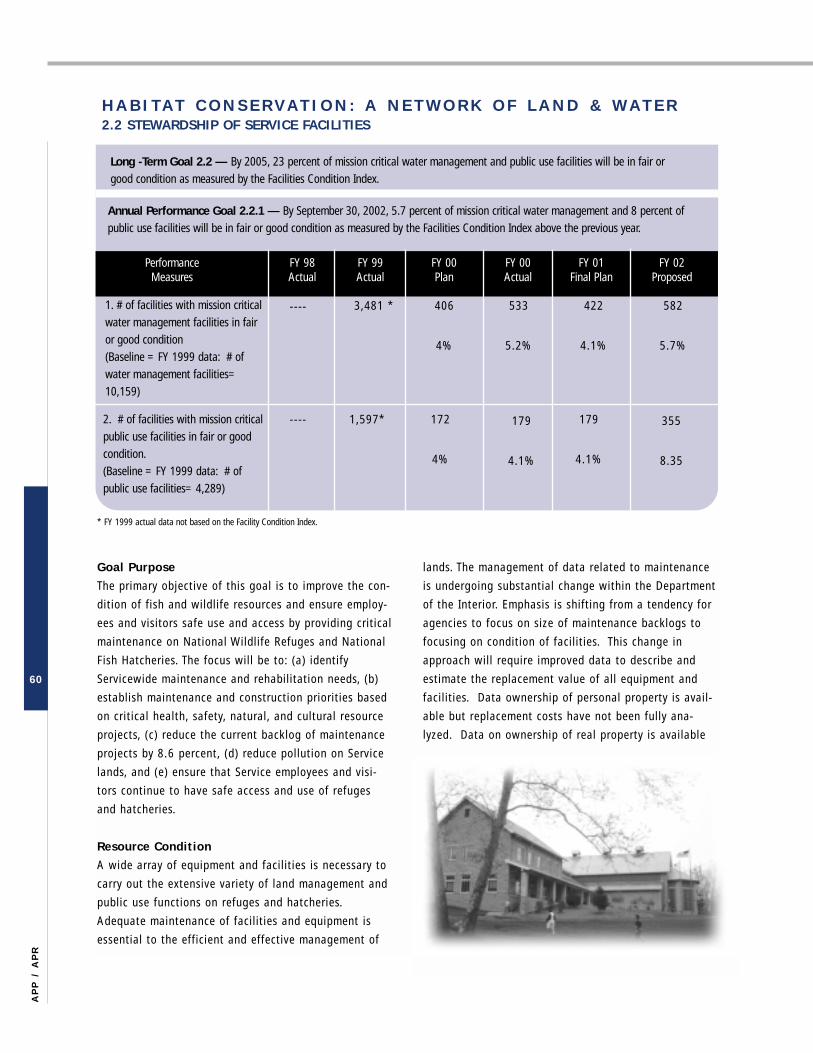
Goal Purpose
The primary objective of this goal is to improve the con-
dition of f ish and wildlife resources and ensure employ-
ees and visitors safe use and access by providing crit ical
maintenance on National Wildlife Refuges and National
Fish Hatcheries. The focus wil l be to: (a) identify
Servicewide maintenance and rehabil itation needs, (b)
establish maintenance and construction priorit ies based
on crit ical health, safety, natural, and cultural resource
projects, (c) reduce the current backlog of maintenance
projects by 8.6 percent, (d) reduce pollution on Service
lands, and (e) ensure that Service employees and visi-
tors continue to have safe access and use of refuges
and hatcheries.
Resource Condition
A wide array of equipment and facil it ies is necessary to
carry out the extensive variety of land management and
public use functions on refuges and hatcheries.
Adequate maintenance of facil it ies and equipment is
essential to the efficient and effective management of
lands. The management of data related to maintenance
is undergoing substantial change within the Department
of the Interior. Emphasis is shifting from a tendency for
agencies to focus on size of maintenance backlogs to
focusing on condition of facil it ies. This change in
approach will require improved data to describe and
estimate the replacement value of all equipment and
facil it ies. Data ownership of personal property is avail-
able but replacement costs have not been fully ana-
lyzed. Data on ownership of real property is available
60
AP
P /
AP
R
Annual Performance Goal 2.2.1 — By September 30, 2002, 5.7 percent of mission critical water management and 8 percent ofpublic use facilities will be in fair or good condition as measured by the Facilities Condition Index above the previous year.
Long -Term Goal 2.2 — By 2005, 23 percent of mission critical water management and public use facilities will be in fair orgood condition as measured by the Facilities Condition Index.
1. # of facilities with mission criticalwater management facilities in fairor good condition (Baseline = FY 1999 data: # ofwater management facilities=10,159)
582
5.7%
3,481 *---- 533
5.2%
422
4.1%
406
4%
PerformanceMeasures
2. # of facilities with mission criticalpublic use facilities in fair or goodcondition.(Baseline = FY 1999 data: # ofpublic use facilities= 4,289)
---- 355
8.35
1,597* 172
4%
179
4.1%
179
4.1%
FY 98Actual
FY 99Actual
FY 00Plan
FY 00Actual
FY 01Final Plan
FY 02Proposed
H A B I T A T C O N S E R V A T I O N : A N E T W O R K O F L A N D & W A T E R2.2 STEWARDSHIP OF SERVICE FACILITIES
* FY 1999 actual data not based on the Facility Condition Index.

for buildings but is not comprehensive for many other
facil it ies such as dikes, water control structures,
bridges, and fences.
Service infrastructure includes 10,159 mission crit ical
water management facil it ies and 4,289 mission crit ical
public use facil it ies. The Service manages more than
5,000 buildings, 2,000 uti l ity systems, about 5,500
miles of public roads, over 10,000 miles of dikes,
23,000 water control structures, 690 dams, over 10,000
miles of fences, 2,500 public use structures such as
boardwalks, observation platforms, kiosks, or boat
launch sites; 4,000 transportation vehicles such as pas-
senger cars, pickups, heavy trucks, boats, ATVs, and air-
planes; about 4,000 items of construction or agricultur-
al equipment such as tractors, mowers, dozers, back-
hoes, trailers, graders, and forklifts; and thousands of
tools, pumps, scientif ic equipment, optics, etc.
Collectively, the replacement value of these items is
estimated at nearly $7 bil l ion. Industry standards sug-
gest that annual funding of maintenance be 2 to 4% of
the replacement value of facil it ies. Over the past 10
years, Service facil it ies have received approximately 1%
of the replacement value, resulting in a growing l ist of
deferred maintenance projects. Based on a preliminary
estimate of Facil ity Condition Index (cost of deferred
maintenance projects as a fraction of the total capital-
ized value of the facil ity) the average refuge or hatchery
facil ity must be characterized as in poor condition.
Goal Achievement and Strategies
The National Wildlife Refuge System and the National
Fish Hatchery System intend to apply their maintenance
base funds and any increases to the priorit ies and pro-
jects identif ied through the five-year planning process
initiated by the DOI. In so doing they wil l initial ly target
projects associated with crit ical human health and safe-
ty risks, and secondly to crit ical resource protection pro-
jects.
Budgetary resources in FY 2002 for refuge maintenance
will continue funding additional $19 mill ion in FY 2001
deferred maintenance funds provided in Title VIII of the
Appropriations Act and a request for a $10 mill ion
increase in FY 2002 to enhance maintenance capabil i-
t ies. In addition, the Fisheries program received $4
mill ion and Law Enforcement received $2 mill ion for
maintenance. The Title VIII funding should allow about
100 projects related to water management and public
use to be completed by FY 2002. The Service‘s strategy
is to focus on using about 40% of the $10 mill ion FY
2002 increase to work to prevent facil it ies from becom-
ing deferred maintenance needs and about 60% to take
corrective action on deferred maintenance projects.
Preventive maintenance wil l occur by adding 33 mainte-
nance staff to field stations who can pay regular atten-
tion to overall maintenance needs and take early correc-
tive action to preclude major problems from developing.
The increase request calls for $1.9 mill ion in salary
costs plus $2.2 mill ion in flexible annual maintenance
funds to enable reaction to needs as they arise. An
additional $4 mill ion wil l al low completion of about 41
deferred maintenance projects for a diversity of projects
including water management facil it ies, roads, repair and
replacement of heavy equipment such as tractors and
dozers needed to maintain wetland impoundments, and
public use facil it ies. The majority of these 41 projects
are either directly or indirectly related to water man-
agement and public use management. Finally, an addi-
tional $1.8 mill ion wil l be devoted to modernization of
maintenance efforts through improved data manage-
ment and conducting condition assessments.
The Service is working to improve management of vari-
ous databases dealing with maintenance, ownership,
inspect ion, and management of i t s equ ipment and
fac i l i t ies :
61
FIS
H A
ND
WIL
DL
IFE
SE
RV
ICE

• An integrated management information system
(FacMIS) wil l increase data sharing and allow linkage
of the Maintenance Management System (MMS),
which tracks deferred maintenance needs, the Real
Property Inventory (RPI), which tracks real property
ownership and condition information, and financial
tracking.
• Linking the MMS and RPI databases allows the com-
putation of an objective facil ity condition index (FCI).
Using the FCI, which is the cost of deferred mainte-
nance projects as a fraction of the total capitalized
value of a facil ity, the average facil ity in both the
National Fish Hatchery System and the National
Wildlife Refuge System must currently be character-
ized as in poor condition.
• A uniform, comprehensive facil ity condition assess-
ment process is being implemented whereby real
property is inspected every five years to document
maintenance deficiencies and repair costs.
Collectively, the above efforts are providing continual
improvement of maintenance and real property data and
are improving both facil ity management and appropria-
tion‘s accountabil ity, with safety and resource protec-
tion as high priorit ies.
Benefits Derived
Among the more noticeable benefits anticipated from
getting more field stations‘ crit ical water management
facil it ies into good condition is the abil ity to more fully
meet current demands by fish management plans for
high-quality f ish for recovery and restoration purposes.
Better water facil it ies generally means better water
quality and more water. In addition, it means fewer
reports of f ish loss incidents resulting from failed
pumps, deteriorated backup generators, or from broken
pipes. Thus, more fish can be available to fulf i l l produc-
tion goals, as specified in approved restoration and
recovery plans.
FY 2000 ANNUAL PERFORMANCE REPORT:
Goal: 2.2.1 By June 30, 2000, the baseline wil l be
established for the Facil it ies Condition Index.
[Discontinued Goal]
Report: 2.2.1 Goal Met
The Service successfully met this performance goal by
developing a baseline for mission crit ical water manage-
ment facil it ies and mission crit ical public use facil it ies.
This wil l provide the foundation for accurately measur-
ing our progress toward the achievement of the long
term goal.
Goal: 2.2.2 By September 30, 2000, 4% of mission
crit ical water management and 4% of public use facil i-
t ies wil l be in fair or good condition as measured by the
Facil it ies Condition Index.
Report: 2.2.2 Goal Met
The Service successfully met this performance goal. For
FY 2000, the Service exceeded its performance target
for the number of mission crit ical water management
facil it ies (533 actual compared to 406 planned) and
public use facil it ies (179 actual compared to 172
planned) that are in fair or good condition.
The refuge system devoted $3.4 mill ion to the improve-
ment of 333 water management facil it ies in FY 2000.
The majority of projects were to improve capabil it ies to
manage wetland impoundments for wildlife by rehabil i-
tating or replacing levees, water control structures, cul-
verts, canals, pumps, diversion structures, and water
supply wells. Maintenance funds totaling $2.9 mill ion
allowed the repair of 141 public use facil it ies. Projects
included repair of visitor buildings, roads, parking
areas, boat ramps, trails and boardwalks, and observa-
tion towers.
While this goal was met; data reliabil ity is sti l l less than
desired. Considerable improvement occurred in FY 2000
to develop a more complete and accurate inventory of
property owned by the Service and of estimating
replacement costs for these assets. The Maintenance
Management System, the database that inventories
deferred maintenance needs was converted to a con-
trolled web access system during FY 2000, making data
more accessible throughout the organization. Work also
continued on FacMIS, a computerized l inking of a vari-
ety of legacy databases to enable better tracking of
maintenance data. Condition assessment coordinators
were hired in FY 2000 and are beginning the process of
62
AP
P /
AP
R

63
FIS
H A
ND
WIL
DL
IFE
SE
RV
ICE
Performance Measure 1. # of facilities with mission critical water management facilities in fair or good condition 2. # of facilities with mission critical public use facilities in fair or good condition
Data Source Information on replacement values is collected in the Real Property Inventory and information on maintenance costs is assembled in the MaintenanceManagement System. All data for both data sets is collected at field units throughout the Service.
Data Validation See Data Verification and Validation, Page 102
Verification Data for both the Real Property Inventory and the Maintenance Management System is initially assembled by National Wildlife Refuge System andNational Fish Hatchery System field stations. Data undergoes quality control review within the Regional office and the National office. Reported data areassembled at field stations, then forwarded to Regional Offices for quality control and consistency checks, and then subsequently forwarded toWashington Office for final editing and national roll-up. Regional inspection of field stations also include review of data collection and managementefforts.
Data Limitations Cost estimates for replacement values can be difficult to estimate; data in field units, not kept current.
Planned Improvements See Data Verification and Validation, Page 102
Baseline FY 1999 Baseline: 3,481 critical water management facilities, 1,597 public use facilities
inspecting all agency facil ity and equipment assets once
every 5 years. This effort wil l improve accuracy and
thoroughness of maintenance cost estimates over time
and will enable the Service to better monitor the condi-
tion of all facil ity and equipment assets.
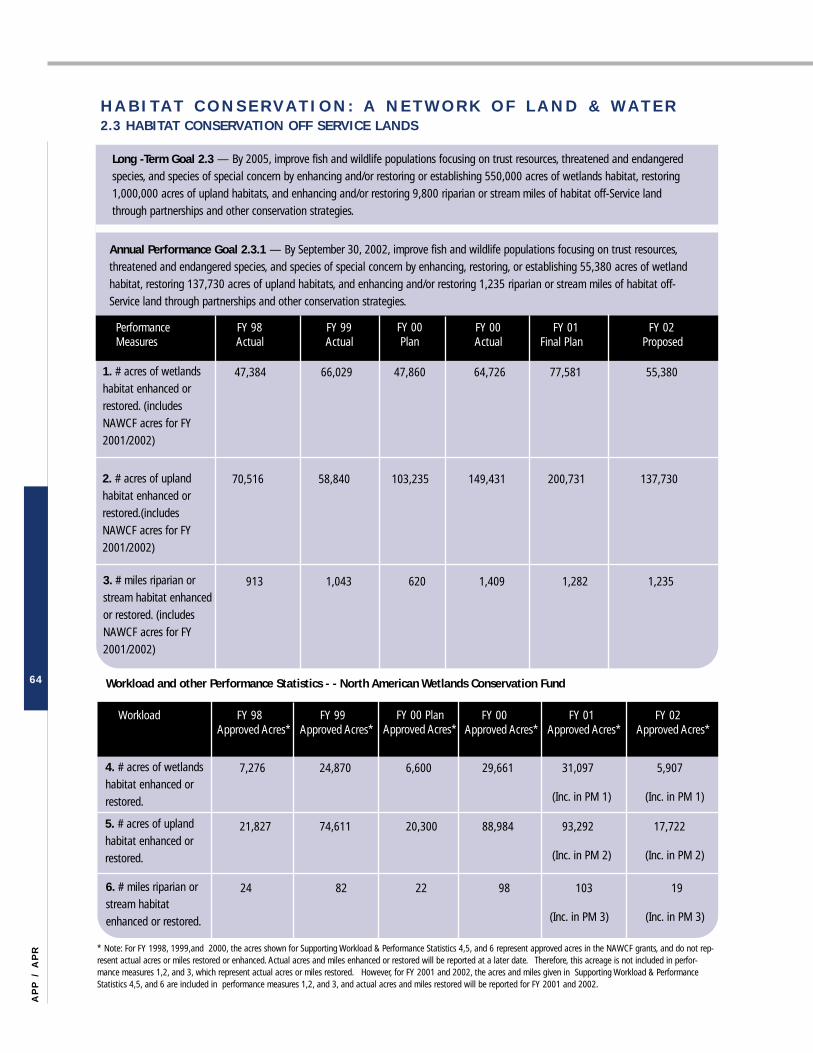
64
AP
P /
AP
R
Annual Performance Goal 2.3.1 — By September 30, 2002, improve fish and wildlife populations focusing on trust resources,threatened and endangered species, and species of special concern by enhancing, restoring, or establishing 55,380 acres of wetlandhabitat, restoring 137,730 acres of upland habitats, and enhancing and/or restoring 1,235 riparian or stream miles of habitat off-Service land through partnerships and other conservation strategies.
H A B I T A T C O N S E R V A T I O N : A N E T W O R K O F L A N D & W A T E R2.3 HABITAT CONSERVATION OFF SERVICE LANDS
47,384 66,029 47,860 64,726 77,581 55,380
Performance FY 98 FY 99 FY 00 FY 01 FY 02Measures Actual Actual Actual Final Plan Proposed
FY 00Plan
1. # acres of wetlandshabitat enhanced orrestored. (includesNAWCF acres for FY2001/2002)
2. # acres of uplandhabitat enhanced orrestored.(includesNAWCF acres for FY2001/2002)
3. # miles riparian orstream habitat enhancedor restored. (includesNAWCF acres for FY2001/2002)
70,516 58,840 103,235 149,431 200,731 137,730
913 1,043 620 1,409 1,282 1,235
7,276 24,870 6,600 29,661 31,097 5,907
(Inc. in PM 1) (Inc. in PM 1)
Workload FY 98 FY 99 FY 00 FY 01 FY 02Approved Acres* Approved Acres* Approved Acres* Approved Acres* Approved Acres*
FY 00 PlanApproved Acres*
4. # acres of wetlandshabitat enhanced orrestored.
5. # acres of uplandhabitat enhanced orrestored.
6. # miles riparian orstream habitatenhanced or restored.
24 82 22 98 103 19
(Inc. in PM 3) (Inc. in PM 3)
21,827 74,611 20,300 88,984 93,292 17,722
(Inc. in PM 2) (Inc. in PM 2)
Workload and other Performance Statistics - - North American Wetlands Conservation Fund
Long -Term Goal 2.3 — By 2005, improve fish and wildlife populations focusing on trust resources, threatened and endangeredspecies, and species of special concern by enhancing and/or restoring or establishing 550,000 acres of wetlands habitat, restoring1,000,000 acres of upland habitats, and enhancing and/or restoring 9,800 riparian or stream miles of habitat off-Service landthrough partnerships and other conservation strategies.
* Note: For FY 1998, 1999,and 2000, the acres shown for Supporting Workload & Performance Statistics 4,5, and 6 represent approved acres in the NAWCF grants, and do not rep-resent actual acres or miles restored or enhanced. Actual acres and miles enhanced or restored will be reported at a later date. Therefore, this acreage is not included in perfor-mance measures 1,2, and 3, which represent actual acres or miles restored. However, for FY 2001 and 2002, the acres and miles given in Supporting Workload & PerformanceStatistics 4,5, and 6 are included in performance measures 1,2, and 3, and actual acres and miles restored will be reported for FY 2001 and 2002.

65
FIS
H A
ND
WIL
DL
IFE
SE
RV
ICE
Goal Purpose
The primary objective of this annual goal is to enhance
and/or restore various important habitats off-Service
lands to improve fish and wildlife populations. The focus
will be on wetland, upland, riparian, and stream habi-
tats that benefit those trust resources for which the
Service has primary responsibil ity, including threatened
and endangered species, migratory birds, anadromous
fish, and certain marine mammals.
Resource Condition
Habitat is fundamental
for self-sustaining pop-
ulations of f ish,
wildlife, and plants as
well as for functional
ecosystems. The health
of f ish, wildlife, and
plants is greatly affect-
ed by the quantity and
quality of their habitat. Declines of wildlife populations
have paralleled declines in both the quality and quanti-
ty of habitats; surveys indicate that 56% of neotropical
migratory bird species and 57% of waterfowl species
are in decline. Population declines have resulted from a
variety of factors including --- habitat loss, degradation
and fragmentation, and competition from non-native
species.
Wetlands – Nationally, more than 53% (approximately
100 mill ion acres) of wetlands have been lost since
colonial t imes, and wetland losses continue today.
Wetland habitats cover 5% of the surface of the conter-
minous United States but contain approximately 30% of
the flora. The November-December 1997 National
Wetlands Newsletter reported that 46% of U.S. threat-
ened and endangered species were wetland-associated.
In addition, many of the wetlands sti l l present on the
landscape do not function at their full potential due to
activit ies on the surrounding lands, including agricultur-
al and urban development.
The following table includes the number of acres added
for protection of migratory bird habitat of wetlands
habitat protected the North American Wetlands
Conservation Fund and represent estimated habitat con-
servation acreage included in approved grant projects to
federal, state, and local governments, Tribes, and public.
11,418 37,253 5,357 32,693 32,224 8,535
Acres Added*
9. # acres of riparianhabitat
Number of acres added through the North American Wetlands Conservation Fund for protection of migratory bird habitat.
FY 98Approved
Acres*(actual)
FY 99Approved
Acres*(actual)
FY 00Plan
ApprovedAcres*(plan)
FY 00Approved
Acres*(actual)
FY 01Approved
Acres*(final planl)
FY 02Approved
Acres*(proposed)
7. # acres of wetlands habitat
34,253 111,759 16,400 98,079 96,671 25,6058. # acres of uplandhabitats
228 745 109 654 644 171
* Note: For FY 1998, 1999,and 2000, the acres added in the NAWCF grants, do not represent actual acres or miles restored or enhanced. Actual acres and miles enhanced orrestored will be reported at a later date. However, actual acres and miles restored will be reported for FY 2001 and 2002.

Upland habitats –
This crit ical habitat
has been lost or
severely degraded
through a variety of
land use practices.
Some portions of
the Nation, such as
the intensively
farmed Midwest and
southern Plains states, have less than 1% of their origi-
nal native upland vegetation. Approximately 26% of the
Nation ‘s forests have been converted to other land
uses. Approximately 90% of tall grass prairie in the
Midwest and great plains has been destroyed. More
than 70% of the Nation‘s riparian areas have also been
converted to other land uses, or degraded by surround-
ing agricultural and urban activit ies.
Rivers and lakes – These habitats cover less than 1% of
the Earth ‘s surface, but contain 12% of the world‘s
known animal species, including 41% of all known fish-
es. Aquatic habitats are rapidly being converted to other
land uses, or are being degraded by agricultural and
urban activit ies. Loss of aquatic habitats is the primary
cause of aquatic species extinctions, ESA listings, and
fishery stock declines. Nearly one-third of all f ish, two-
thirds of all crayfish, and three- fourths of freshwater
mussels are at risk of extinction, largely due to habitat
loss. Only 2% of the Nation‘s 3.1 mill ion miles of rivers
remain free flowing. More than 75,000 dams six feet or
higher and 2.5 mill ion smaller dams block or impede
fish passage, blocking
more than 600,000
miles of stream habi-
tat. Numerous other
obstructions also
impede passage,
including poorly
designed culverts and
dikes, unscreened
water diversion facil i-
t ies, and collapsed
stream banks.
These ecosystems are important habitats for a large
number of Federal trust species and are important to
reducing flooding, decreasing sediment and nutrient
loads, and the protection and improvement of the quali-
ty and quantity of the nations‘ waters. With more than
70% of the Nation‘s lands in non-Federal ownership,
most of the opportunities for enhancing and restoring
these habitats l ie with the private landowner.
Goal Achievement and Strategies
This goal wil l be achieved by: (1) increasing voluntary
habitat restoration opportunities through the North
American Waterfowl Management Plan ‘s joint ventures,
the Partners for Fish and Wildlife Program, the Coastal
Program, and the North American Wetlands
Conservation grants, (2) restoring of damaged natural
resources and habitat – particularly focusing on the
Great Lakes, Missouri River, and Caribbean ecosystem
areas, (3) improving and restoring riparian and riverine
corridors that wil l provide fisheries access to spawning
and rearing habitats, improve water quality, preclude
the need to l ist species under the ESA, and restore and
recover l isted aquatic species, (4) providing expanded
technical assistance and planning capabil it ies to Federal
and state agencies, communities, and individuals to
more effectively resolve environmental issues associated
with development projects, permit activit ies, and
hydropower projects, and (5) increasing outreach and
education about habitat conservation and enhancing
and/or restoring fish and wildlife habitat on private
lands.
Benefits Derived
• Sustainable Fish and Wildlife Populations
– Restoration and enhancement of f ish and wildlife
habitats wil l increase populations of Federal trust
species. Improved habitats and increased popula-
tions of Federal trust species wil l preclude the need
to l ist declining fish, wildlife, and plant species.
Sustainable fish and wildlife populations wil l provide
additional opportunities for people to enjoy these
resources (e.g., f ishing, hunting, and bird watching).
• Restoration of Healthy Watersheds
– Habitat restoration wil l improve watersheds and
associated ecosystem health. Wetlands are crit ical to
the health of our Nation‘s wildlife populations and
66
AP
P /
AP
R

they provide important economic benefits to society.
Restoration of drained and impaired wetlands helps
improve water quality and reduce the flood-related
losses. They act as discharge points when groundwa-
ter elevations are high and as recharge areas when
groundwater levels are low. They fi lter excess nutri-
ents and other materials from the water.
– Streams and rivers are the arteries that carry the
life blood of the Nation. Their importance both past
and present for transportation, water supply, food,
recreation, and quality of l ife cannot be over estimat-
ed. In this new century Americans wil l continue to
rely on our Nations‘s waterways for drinking water,
to irr igate cropland, for transportation and com-
merce, and for recreational activit ies. Unfortunately
many of these systems have been overused, abused
or modified so that they no longer can sustain these
important functions. Municipalit ies are increasingly
having to expand their use of chemicals in order to
purify drinking water, sedimentation is interfering
with both transportation and recreational waterway
uses, and declining populations of many fish that are
resulting in reduced economic opportunities and in
increased numbers of f ish atar are imperil led.
Stream restoration brings back these important bio-
logical and economic resources.
– Restoration and enhancement of estuaries and salt
marshes wil l improve these extremely important habi-
tats for shellf ish such as scallops, shrimp, crabs, oys-
ters and clams. Approximately two-thirds of the U.S.
commercial f ish species depend on estuaries and salt
marshes for spawning grounds or nurseries.
– Native grassland restorations result in improved
soil quality and productivity, increased water infi ltra-
tions and reduced runoff and erosion. Invasive plant
species removal from native grasslands benefits f ish
and wildlife species, as well as improves the econom-
ic viabil ity of rangelands throughout the western U.S.
• Improve the Quality of Our Lives
– Habitat restoration projects help bridge the gap
between environmental and economic health in our
communities throughout the U.S. Habitat restoration
projects wil l save local communities mill ions of dol-
lars in flood control efforts. Re-establishing deep-
rooted native grasses wil l minimize the loss of top-
soil and reduce erosion. Vigorous stands of native
grasslands enhance grazing land, improve water
quality, and decrease the chances of invasion by
exotic plant species.
– Restoration of f ish and wildlife habitats wil l pro-
vide enhanced recreational opportunities (e.g., hunt-
ing, fishing, nature observation). Studies of these
restoration sites wil l enhance our knowledge, under-
standing and appreciation of healthy fish and wildlife
habitats. Some restoration areas are used as outdoor
classrooms where educators instruct schoolchildren,
other professionals and the public about the impor-
tance of these fish and wildlife habitats and land
stewardship.
– Information gathered on the status and trends of
various habitats wil l enable community planners and
biologists to make sound environmental decisions.
Early coordination during the project planning stages
between planners and biologists wil l provide a better
forum to balance development with the environment
protections and restoration.
67
FIS
H A
ND
WIL
DL
IFE
SE
RV
ICE
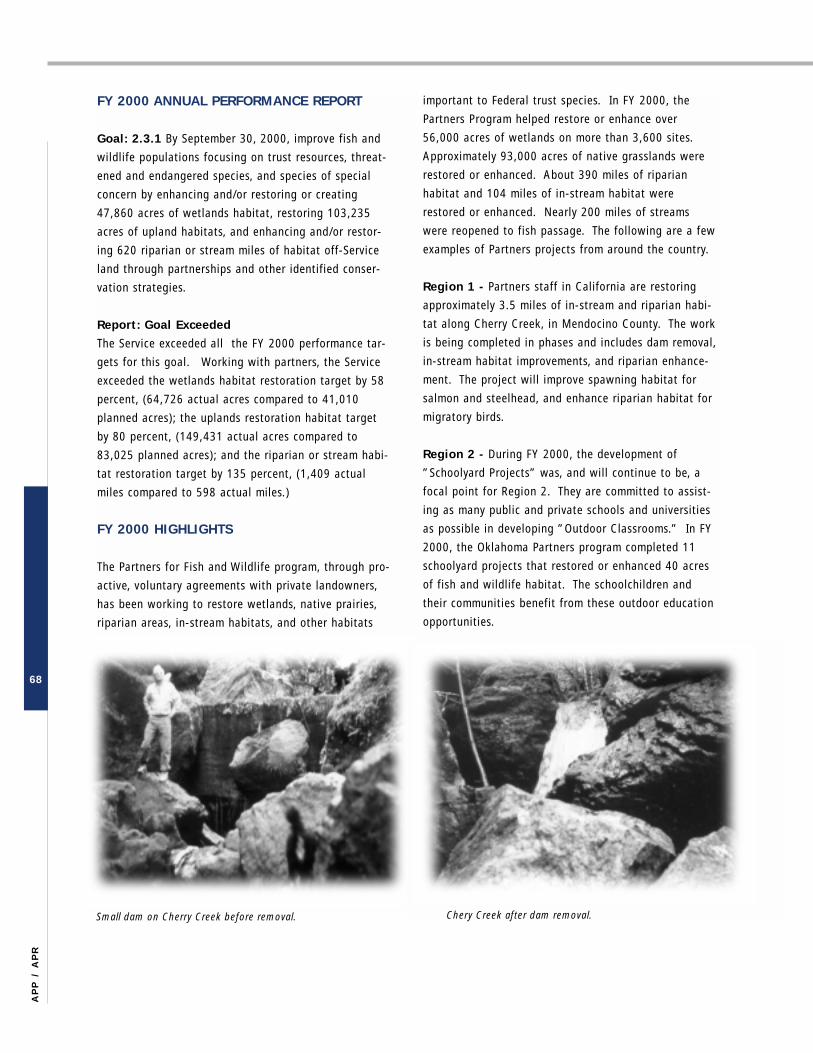
FY 2000 ANNUAL PERFORMANCE REPORT
Goal: 2.3.1 By September 30, 2000, improve fish and
wildlife populations focusing on trust resources, threat-
ened and endangered species, and species of special
concern by enhancing and/or restoring or creating
47,860 acres of wetlands habitat, restoring 103,235
acres of upland habitats, and enhancing and/or restor-
ing 620 riparian or stream miles of habitat off-Service
land through partnerships and other identif ied conser-
vation strategies.
Report: Goal Exceeded
The Service exceeded all the FY 2000 performance tar-
gets for this goal. Working with partners, the Service
exceeded the wetlands habitat restoration target by 58
percent, (64,726 actual acres compared to 41,010
planned acres); the uplands restoration habitat target
by 80 percent, (149,431 actual acres compared to
83,025 planned acres); and the riparian or stream habi-
tat restoration target by 135 percent, (1,409 actual
miles compared to 598 actual miles.)
FY 2000 HIGHLIGHTS
The Partners for Fish and Wildlife program, through pro-
active, voluntary agreements with private landowners,
has been working to restore wetlands, native prairies,
riparian areas, in-stream habitats, and other habitats
important to Federal trust species. In FY 2000, the
Partners Program helped restore or enhance over
56,000 acres of wetlands on more than 3,600 sites.
Approximately 93,000 acres of native grasslands were
restored or enhanced. About 390 miles of riparian
habitat and 104 miles of in-stream habitat were
restored or enhanced. Nearly 200 miles of streams
were reopened to fish passage. The following are a few
examples of Partners projects from around the country.
Region 1 - Partners staff in California are restoring
approximately 3.5 miles of in-stream and riparian habi-
tat along Cherry Creek, in Mendocino County. The work
is being completed in phases and includes dam removal,
in-stream habitat improvements, and riparian enhance-
ment. The project wil l improve spawning habitat for
salmon and steelhead, and enhance riparian habitat for
migratory birds.
Region 2 - During FY 2000, the development of
”Schoolyard Projects” was, and will continue to be, a
focal point for Region 2. They are committed to assist-
ing as many public and private schools and universities
as possible in developing ”Outdoor Classrooms.” In FY
2000, the Oklahoma Partners program completed 11
schoolyard projects that restored or enhanced 40 acres
of f ish and wildlife habitat. The schoolchildren and
their communities benefit from these outdoor education
opportunities.
68
AP
P /
AP
R
Small dam on Cherry Creek before removal. Chery Creek after dam removal.
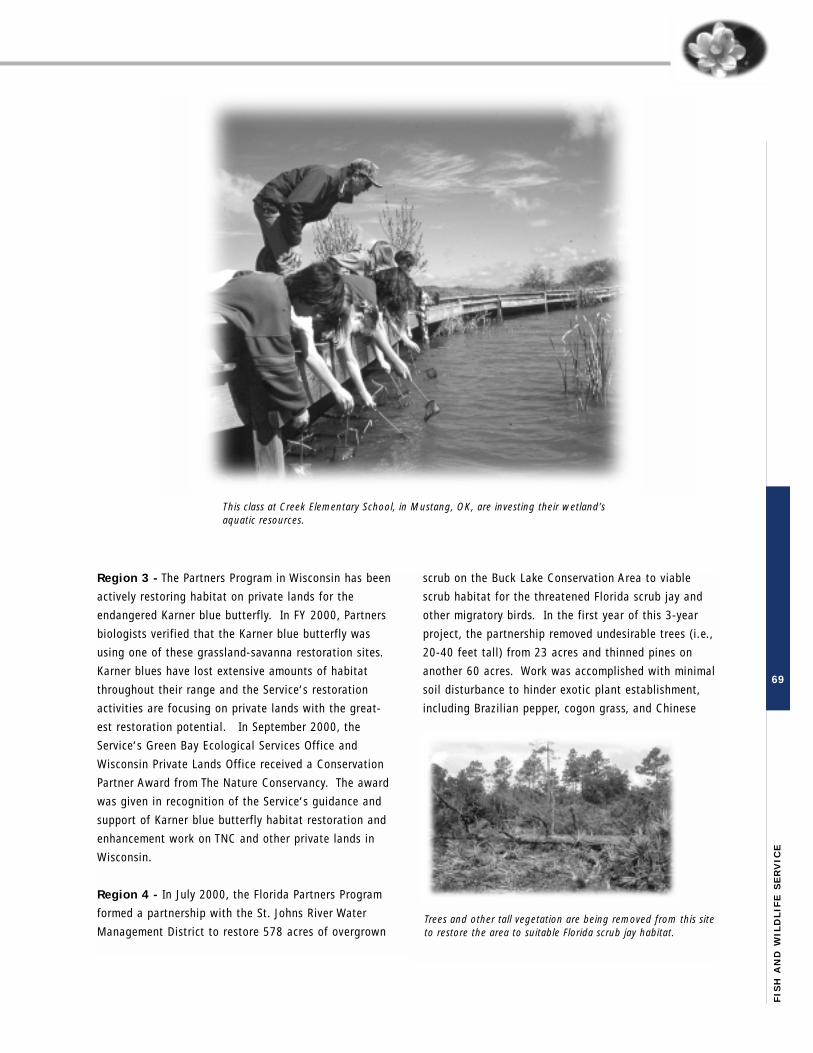
Region 3 - The Partners Program in Wisconsin has been
actively restoring habitat on private lands for the
endangered Karner blue butterfly. In FY 2000, Partners
biologists verif ied that the Karner blue butterfly was
using one of these grassland-savanna restoration sites.
Karner blues have lost extensive amounts of habitat
throughout their range and the Service ‘s restoration
activit ies are focusing on private lands with the great-
est restoration potential. In September 2000, the
Service‘s Green Bay Ecological Services Office and
Wisconsin Private Lands Office received a Conservation
Partner Award from The Nature Conservancy. The award
was given in recognition of the Service‘s guidance and
support of Karner blue butterfly habitat restoration and
enhancement work on TNC and other private lands in
Wisconsin.
Region 4 - In July 2000, the Florida Partners Program
formed a partnership with the St. Johns River Water
Management District to restore 578 acres of overgrown
scrub on the Buck Lake Conservation Area to viable
scrub habitat for the threatened Florida scrub jay and
other migratory birds. In the first year of this 3-year
project, the partnership removed undesirable trees (i.e.,
20-40 feet tall) from 23 acres and thinned pines on
another 60 acres. Work was accomplished with minimal
soil disturbance to hinder exotic plant establishment,
including Brazil ian pepper, cogon grass, and Chinese
69
FIS
H A
ND
WIL
DL
IFE
SE
RV
ICE
This class at Creek Elementary School, in Mustang, OK, are investing their wetland’saquatic resources.
Trees and other tall vegetation are being removed from this siteto restore the area to suitable Florida scrub jay habitat.

tallow tree. The scrub jays do not currently inhabit this
scrub unit, however there is one adjacent jay territory.
Region 5 - In Maine, the Partners program enhanced
762 acres of wetlands through the installation of
beaver exclosures. An exclosure allows water f low
through the beaver dam which prevents excessive flood-
ing and saves the beaver dam. These ”beaver-influ-
enced” wetlands provide habitat to Federal trust species
including: black duck, American bittern, marsh wren,
sedge wren, olive-sided flycatchers, and other species of
management concern.
Region 6 - Partners biologists in Colorado and
Nebraska worked on several projects in FY 2000 to
restore wetlands and riparian habitat for the whooping
crane and other endangered species. Wetlands and
riparian habitat in the San Luis Valley of Colorado are
being restored or enhanced. Several Colorado projects
were built with Partners assistance to support whooping
crane recovery, and least tern and piping plover habitat.
In central Nebraska, the Partners Program is restoring
about 300 acres of river sandbars, islands, wet mead-
ows, and native grasslands along the Platte River for
roosting and foraging whooping cranes, and nesting and
feeding least terns and piping plovers. Five projects in
the Rainwater Basin area of south-central Nebraska
restored or enhanced over 350 acres of shallow water
habitat for whooping cranes.
Region 7 - In Alaska, the Partners program worked
with the Sherman family during their family reunion to
restore about 160 feet of eroding shoreline on Big Lake.
A spruce tree revetment (embankment support) was
installed to stabil ize the shoreline. Landowner interest
in this project and in the Partners Program has been
impressive throughout the Big Lake region which is
experiencing increased erosion due to jet ski and boat
use. The Alaska Partners staff hope the interest wil l
encourage other landowners to try more environmental-
ly fr iendly erosion control techniques.
70
AP
P /
AP
R
Partners staff in Maine install a beaver exclosure fence andpipes to maintain water levels through a culvert.
Whooping Crane
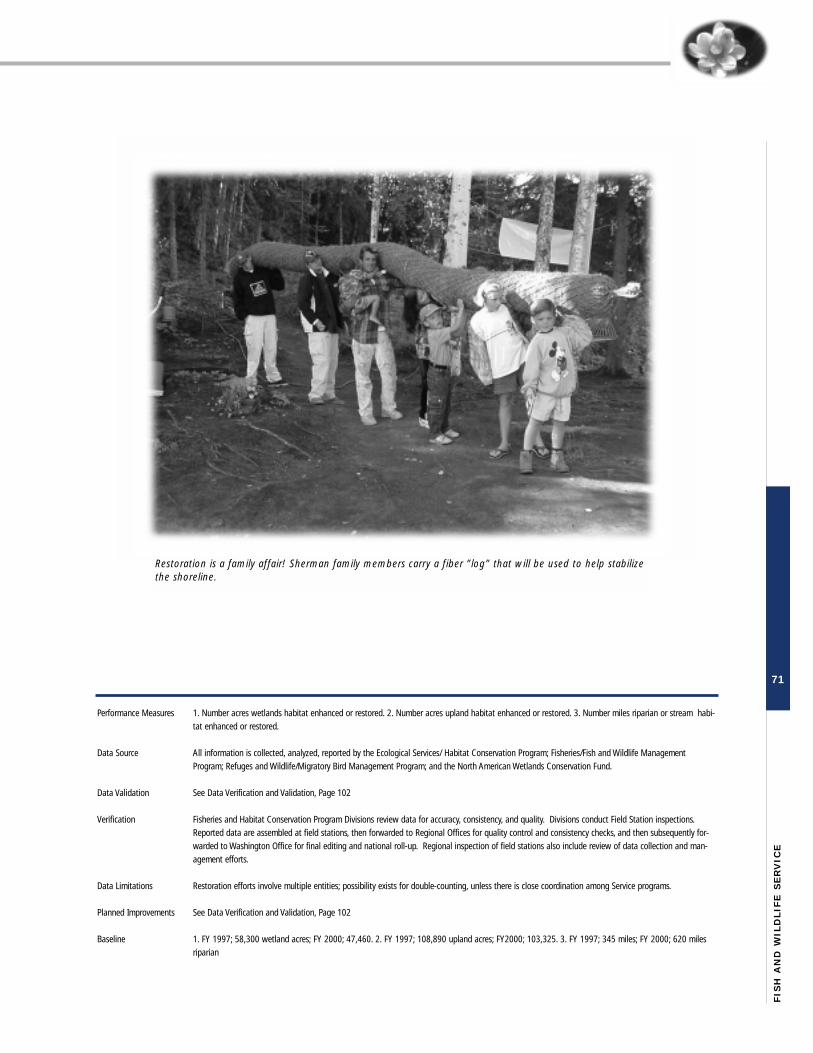
71
FIS
H A
ND
WIL
DL
IFE
SE
RV
ICE
Performance Measures 1. Number acres wetlands habitat enhanced or restored. 2. Number acres upland habitat enhanced or restored. 3. Number miles riparian or stream habi-tat enhanced or restored.
Data Source All information is collected, analyzed, reported by the Ecological Services/ Habitat Conservation Program; Fisheries/Fish and Wildlife ManagementProgram; Refuges and Wildlife/Migratory Bird Management Program; and the North American Wetlands Conservation Fund.
Data Validation See Data Verification and Validation, Page 102
Verification Fisheries and Habitat Conservation Program Divisions review data for accuracy, consistency, and quality. Divisions conduct Field Station inspections.Reported data are assembled at field stations, then forwarded to Regional Offices for quality control and consistency checks, and then subsequently for-warded to Washington Office for final editing and national roll-up. Regional inspection of field stations also include review of data collection and man-agement efforts.
Data Limitations Restoration efforts involve multiple entities; possibility exists for double-counting, unless there is close coordination among Service programs.
Planned Improvements See Data Verification and Validation, Page 102
Baseline 1. FY 1997; 58,300 wetland acres; FY 2000; 47,460. 2. FY 1997; 108,890 upland acres; FY2000; 103,325. 3. FY 1997; 345 miles; FY 2000; 620 milesriparian
Restoration is a family affair! Sherman family members carry a fiber ”log” that will be used to help stabilizethe shoreline.

3.1 Greater Public Use on Service Lands.
The Service plans to continue its tradition of excellence
in interpretative programs and exhibits throughout its
National Wildlife Refuge System and National Fish
Hatchery System.
3.2 Opportunities for Participating in
Conservation on Service Lands.
Improved communication and the opportunity to partici-
pate in the conservation and use of f ish and wildlife
resources wil l provide a balanced approach to conserva-
tion of f ish and wildlife resources in this country.
Private cit izens, whose voluntary participation in fish
and wildlife protection efforts have laid a foundation on
which the Service operates today, have much to con-
tribute to the continuing conservation of f ish and
wildlife resources.72
AP
P /
AP
R
M I S S I O N G O A L 3PUBLIC USE AND ENJOYMENT
The mission goal, Public Use and Enjoyment, recognizes the public benefit that Americans enjoy from experiencing
fish, wildlife, and their habitats. The interdependence of the Service, its partners, and the American public with fish,
wildlife, and their habitats are the foundation of this mission goal and the guiding factor in the development the
long-term and annual performance goals. The intent of this mission goal is to inform and provide opportunities to the
public to experience fish and wildlife resources in their natural settings.
The nation ‘s abil ity to sustain ecosystems, and the natural heritage of f ish and wildlife resources within them, will
increasingly depend on the public‘s active participation in the stewardship of these resources. A growing number of
our cit izens lack the first-hand experience with fish and wildlife resources in their natural settings that past genera-
tions enjoyed. The growing diversity of the nation‘s population introduces many new population groups to this country
that also lack first-hand experience with American fish and wildlife resources. These factors and others offer a chal-
lenge for the Service to provide environmental information in a manner that the public understands how their well-
being is l inked to the well-being of f ish and wildlife populations and their habitats. The results of a knowledgeable
public should be improved conservation of f ish and wildlife in habitats throughout the country. For the long-term, the
Service wil l focus on the following two goals:

73
FIS
H A
ND
WIL
DL
IFE
SE
RV
ICE
B u d g e tA c t i v i t y / S u b a c t i v i t y
( $ 0 0 0 )
F Y 2 0 0 0
E n a c t e d
F Y 2 0 0 1
E n a c t e d
F Y 2 0 0 2
P r e s i d e n t ‘ s B u d g e t
To t a l M i s s i o n
G o a l 3
To t a l M i s s i o n
G o a l 3
To t a l M i s s i o n
G o a l 3
Ecological Services
Endangered Species
Habitat Conservation
Environmental Contaminants
Refuges and Wildlife
Refuge Operations and Maintenance
Migratory Bird Management
Salton Sea Recovery
Law Enforcement
Fisheries
General Administration
Construction
Land Acquisition
Wildlife Cons. & Appreciation. Fund
National Wildlife Refuge Fund
North American Wetlands Cons. Fund
Cooperative End. Species Cons. Fund
Multinational Species Conservation Fund
Commercial Salmon Fishery
Federal Aid in Wildlife Restoration
TOTAL APPROPRIATIONS
186,383
106,072
70,449
9,862
281,571
258,977
21,598
996
39,405
83,940
123,244
53,528
61,938
797
10,739
14,957
23,000
2,391
4,625
0
886,518
0
0
0
0
83,008
83,008
0
0
0
13,060
24,958
0
0
797
0
0
0
0
0
0
121,822
209,882
120,947
78,290
10,645
326,356
299,678
25,684
994
49,583
92,029
128,966
71,358
121,188
795
11,414
39,912
104,694
3,243
0
49,890
1,259,200
0
0
0
0
90,007
90,007
0
0
0
13,364
27,074
0
0
795
0
0
0
0
0
0
131,239
198,493
111,814
76,209
10,470
340,816
314,664
25,159
993
50,411
92,979
124,053
35,849
164,401
0
11,414
14,912
54,694
3,243
0
0
1,091,265
0
0
0
0
92,014
92,014
0
0
0
12,527
25,023
0
0
0
0
0
0
0
0
0
131,158
LINK BUDGETARY RESOURCES TO MISSION GOAL 3 - PUBLIC USE AND ENJOYMENTThe following table provides a crosswalk of total appropriated funds to the third Mission Goal, Public Use and
Enjoyment, for FY 2000 Enacted, FY 2001 Enacted, and FY 2002 President‘s Request.

Goal Purpose
The National Wildlife
Refuge System and
National Fish
Hatchery System offer
the public the oppor-
tunity to gain direct
experience with the
natural world and
wildlife management
concerns. Visitors to
refuges and hatch-
eries represent a
broad range of con-
stituents including
hunters, anglers, wildlife and plant observers, and pho-
tographers. The intentions of this goal are to increase
public participation and recreational opportunities on
Service lands.
Resource Condition
National Wildlife Refuge System
Approximately 98% of the land in the National Wildlife
Refuge System is open to the public for wildlife depen-
dent education and recreation. Visitors to refuges con-
tributed more than $400 mill ion to local economies in
1995 based on the Service‘s economic evaluation in
1997. The National Wildlife Refuge System dedicates
almost 41% of its operating budget and more than
1,000 staff years support serving people. With 535
refuges and 37 wetland management districts scattered
throughout the country, many are located within easy
driving distance of most of the nation‘s human popula-
tions. Visitors are encouraged to enjoy wildlife in its
natural surroundings and modest facil it ies are provided
to help orient visitors and allow them to enjoy nature at
its f inest.
In 2000, more than 37 mill ion people visited National
Wildlife Refuges. Refuges are places where visitors can
observe, learn about, and enjoy plants and animals in
natural surroundings. Recently new legislation, the
National Wildlife Refuge System Improvement Act,
directed expanded opportunity for six primary public
uses for refuges: wildlife photography, fishing, hunting,
wildlife observation, environmental education, and
interpretation.
74
AP
P /
AP
R
Annual Performance Goal 3.1.1 — By September 30, 2002, hunting, fishing, wildlife observation and photography, and envi-ronmental education visits to National Wildlife Refuges and National Fish Hatcheries increased by 2 percent over the previous year.
Long -Term Goal 3.1 — By 2005, compatible, wildlife-dependent recreational visits to National Wildlife Refuges and NationalFish Hatcheries have increased by 20% from the 1997 level.
1. % increase in hunting, fishing,wildlife observation and photogra-phy, and environmental educationvisits over the prior year (1997 level = 33,206,405)
2%
39,055,712
4%
36,803,070
6%
35,341,846
3%
37,905,234
1%
38,289,914
2%
37,539,131
PerformanceMeasures
FY 98Actual
FY 99Actual
FY 00Plan
FY 00Actual
FY 01Final Plan
FY 02Proposed
P U B L I C U S E A N D E N J O Y M E N T3.1 GREATER PUBLIC USE ON SERVICE LANDS
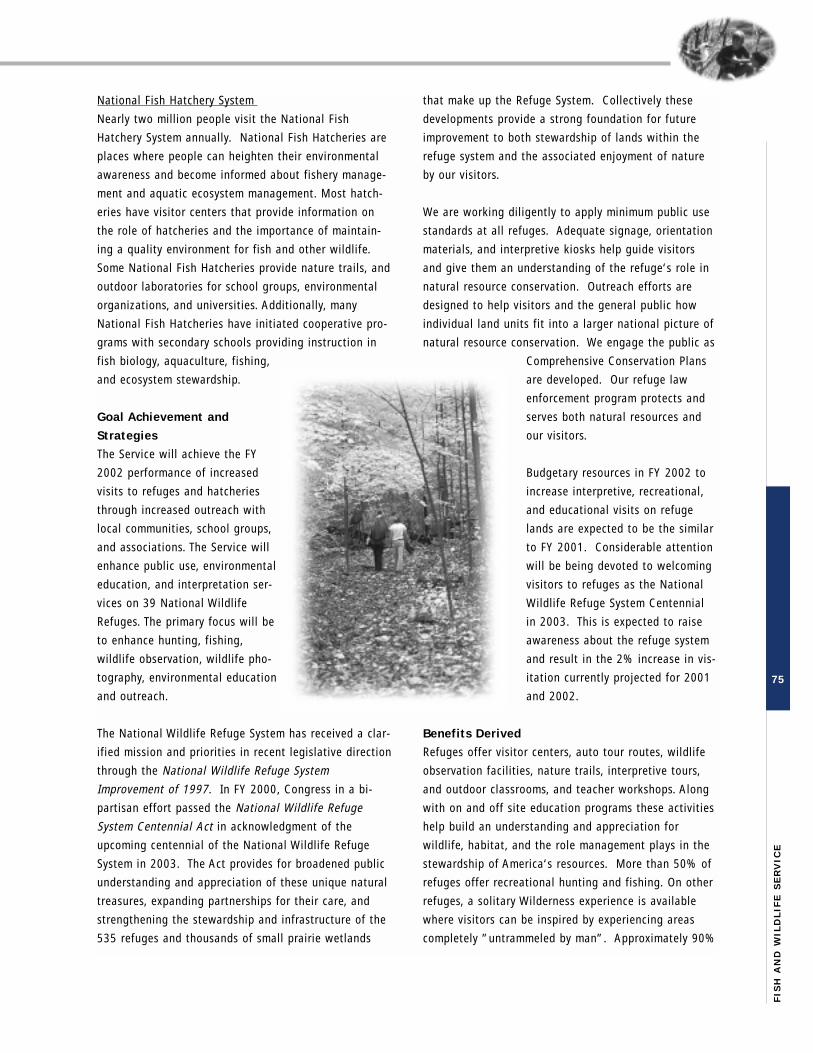
National Fish Hatchery System
Nearly two mill ion people visit the National Fish
Hatchery System annually. National Fish Hatcheries are
places where people can heighten their environmental
awareness and become informed about fishery manage-
ment and aquatic ecosystem management. Most hatch-
eries have visitor centers that provide information on
the role of hatcheries and the importance of maintain-
ing a quality environment for f ish and other wildlife.
Some National Fish Hatcheries provide nature trails, and
outdoor laboratories for school groups, environmental
organizations, and universities. Additionally, many
National Fish Hatcheries have initiated cooperative pro-
grams with secondary schools providing instruction in
fish biology, aquaculture, fishing,
and ecosystem stewardship.
Goal Achievement and
Strategies
The Service wil l achieve the FY
2002 performance of increased
visits to refuges and hatcheries
through increased outreach with
local communities, school groups,
and associations. The Service wil l
enhance public use, environmental
education, and interpretation ser-
vices on 39 National Wildlife
Refuges. The primary focus wil l be
to enhance hunting, fishing,
wildlife observation, wildlife pho-
tography, environmental education
and outreach.
The National Wildlife Refuge System has received a clar-
if ied mission and priorit ies in recent legislative direction
through the National Wildlife Refuge System
Improvement of 1997. In FY 2000, Congress in a bi-
partisan effort passed the National Wildlife Refuge
System Centennial Act in acknowledgment of the
upcoming centennial of the National Wildlife Refuge
System in 2003. The Act provides for broadened public
understanding and appreciation of these unique natural
treasures, expanding partnerships for their care, and
strengthening the stewardship and infrastructure of the
535 refuges and thousands of small prairie wetlands
that make up the Refuge System. Collectively these
developments provide a strong foundation for future
improvement to both stewardship of lands within the
refuge system and the associated enjoyment of nature
by our visitors.
We are working dil igently to apply minimum public use
standards at all refuges. Adequate signage, orientation
materials, and interpretive kiosks help guide visitors
and give them an understanding of the refuge‘s role in
natural resource conservation. Outreach efforts are
designed to help visitors and the general public how
individual land units f it into a larger national picture of
natural resource conservation. We engage the public as
Comprehensive Conservation Plans
are developed. Our refuge law
enforcement program protects and
serves both natural resources and
our visitors.
Budgetary resources in FY 2002 to
increase interpretive, recreational,
and educational visits on refuge
lands are expected to be the similar
to FY 2001. Considerable attention
will be being devoted to welcoming
visitors to refuges as the National
Wildlife Refuge System Centennial
in 2003. This is expected to raise
awareness about the refuge system
and result in the 2% increase in vis-
itation currently projected for 2001
and 2002.
Benefits Derived
Refuges offer visitor centers, auto tour routes, wildlife
observation facil it ies, nature trails, interpretive tours,
and outdoor classrooms, and teacher workshops. Along
with on and off site education programs these activit ies
help build an understanding and appreciation for
wildlife, habitat, and the role management plays in the
stewardship of America ‘s resources. More than 50% of
refuges offer recreational hunting and fishing. On other
refuges, a solitary Wilderness experience is available
where visitors can be inspired by experiencing areas
completely ”untrammeled by man”. Approximately 90%
75
FIS
H A
ND
WIL
DL
IFE
SE
RV
ICE
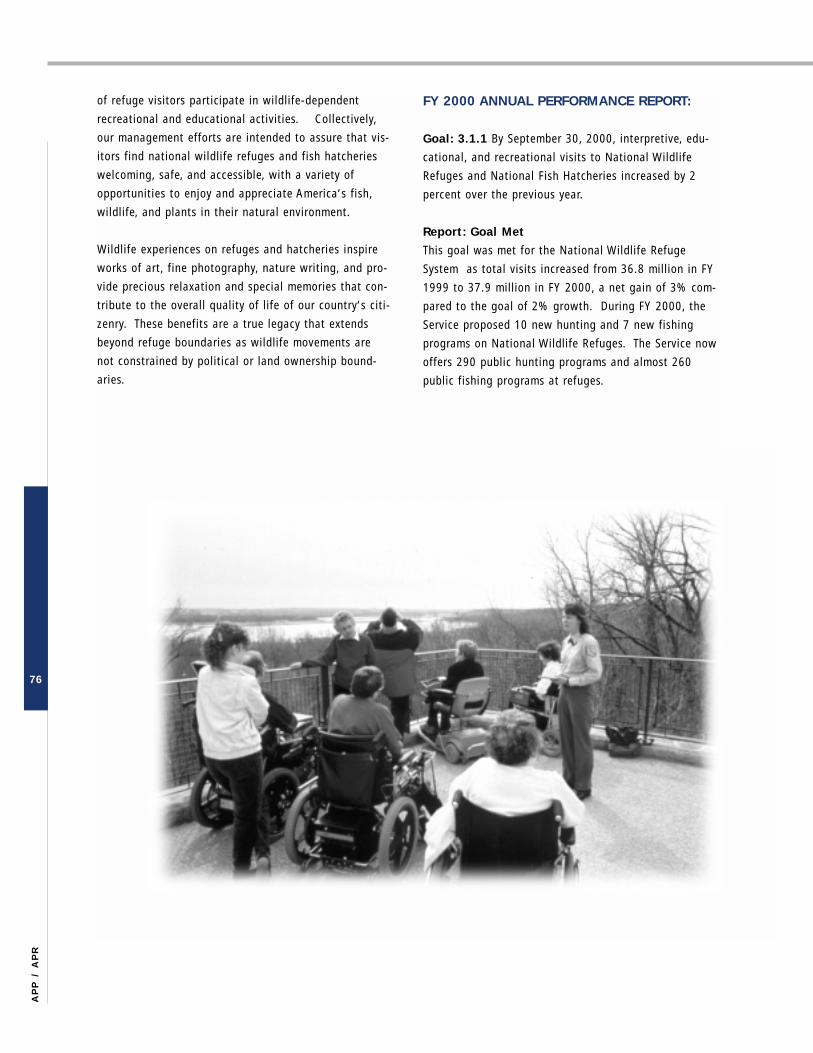
of refuge visitors participate in wildlife-dependent
recreational and educational activit ies. Collectively,
our management efforts are intended to assure that vis-
itors f ind national wildlife refuges and fish hatcheries
welcoming, safe, and accessible, with a variety of
opportunities to enjoy and appreciate America‘s fish,
wildlife, and plants in their natural environment.
Wildlife experiences on refuges and hatcheries inspire
works of art, f ine photography, nature writing, and pro-
vide precious relaxation and special memories that con-
tribute to the overall quality of l ife of our country‘s cit i-
zenry. These benefits are a true legacy that extends
beyond refuge boundaries as wildlife movements are
not constrained by polit ical or land ownership bound-
aries.
FY 2000 ANNUAL PERFORMANCE REPORT:
Goal: 3.1.1 By September 30, 2000, interpretive, edu-
cational, and recreational visits to National Wildlife
Refuges and National Fish Hatcheries increased by 2
percent over the previous year.
Report: Goal Met
This goal was met for the National Wildlife Refuge
System as total visits increased from 36.8 mill ion in FY
1999 to 37.9 mill ion in FY 2000, a net gain of 3% com-
pared to the goal of 2% growth. During FY 2000, the
Service proposed 10 new hunting and 7 new fishing
programs on National Wildlife Refuges. The Service now
offers 290 public hunting programs and almost 260
public f ishing programs at refuges.
76
AP
P /
AP
R

77
FIS
H A
ND
WIL
DL
IFE
SE
RV
ICE
Performance Measure Percent increase in interpretive, educational, and recreational visits.
Data Source FWS owned data. Refuge Management Information System - Public Education and Recreation module. Fishery Information System, Accomplishment module.
Data Validation See Data Verification and Validation, Page 102
Verification Annual reports assembled at field stations, forwarded to Regional Offices for quality review and verification. Final information sent to Washington Office.Division of Fish Hatcheries reviews data for accuracy, consistency, and quality. AD-Fisheries certifies data.
Data Limitations Visits can be impacted by weather patterns or economic trends. National Fish Hatcheries do not currently compile data; therefore, visitation data is subjectto estimation error.
Planned Improvements See Data Verification and Validation, Page 102
Baseline FY 1997 = 33,206,405 visits
FY 2000 HIGHLIGHTS:
The Alaska Maritime National Wildlife Refuge hosted an environmental education program for 2,000 students
this year in Homer, AK. Other youth camps held included Stewardship Camps in St. Paul, St. George, Unalaska and
Sandpoint.
The Bosque Del Apache National Wildlife Refuge ‘s Jr. Duck Stamp entrees surpassed previous years by 40%, with
1300 entries. The Outreach Specialist visited 45 schools with 213 teachers and 2,655 students. Two staff members
participated in Forestry Camp in the Jemez Mountains in June. The Annual Festival of the Cranes continued to be a
highly successful event, which attracted about 10,000 visitors.
Cypress Creek National Wildlife Refuge hosted over three thousand youth and educators who participated in
environmental education programs on the Refuge highlighting Cache River Wetlands restoration efforts. The National
Fishing Week was celebrated on the refuge with special activit ies including a fishing derby and skil ls cl inics; I l l inois
Department of Natural Resources and The Nature Conservancy joined Refuge staff to make it a very successful day.
Nashua National Fish Hatchery hosted approximately 5,000 students and adults from the Adopt-A-Salmon Family
watershed education program, area schools, civic and scouting groups. The objective of this program is to provide stu-
dents with a learning experience with a host of watershed-related issues through hands-on experiences with Atlantic
salmon fry and parr. Unique conservation education learning experiences are also developed that focus on locally-rel-
evant resource issues.
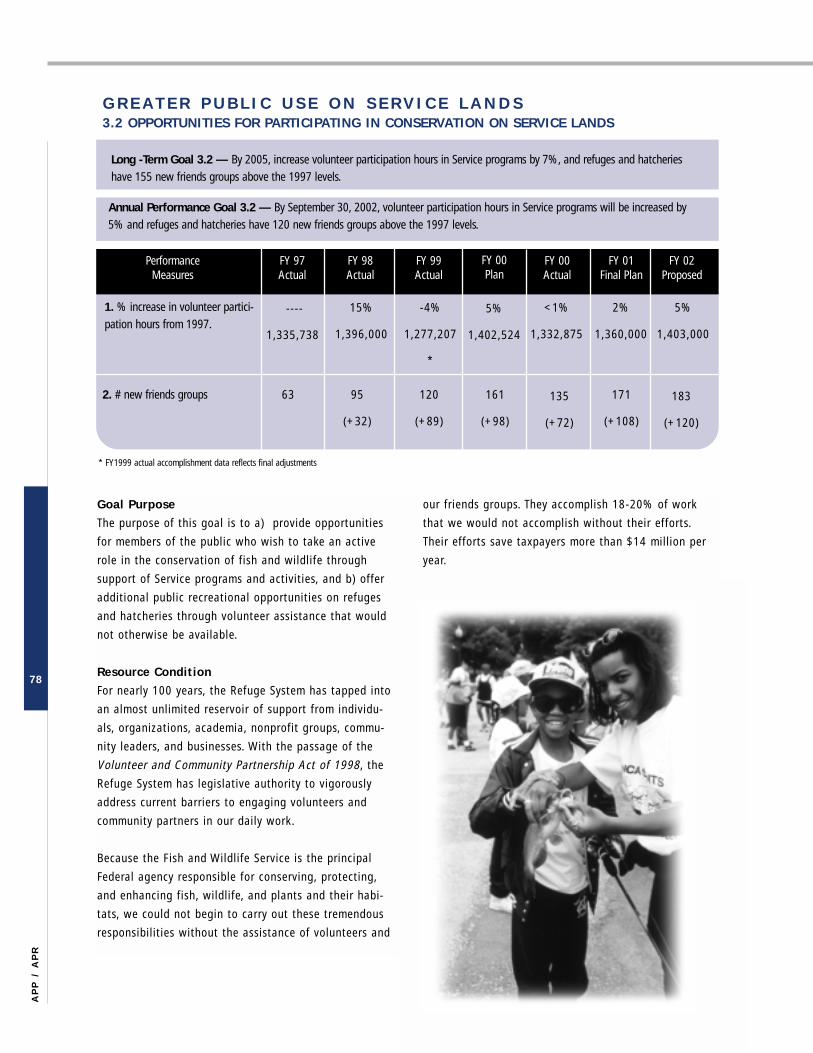
Goal Purpose
The purpose of this goal is to a) provide opportunities
for members of the public who wish to take an active
role in the conservation of f ish and wildlife through
support of Service programs and activit ies, and b) offer
additional public recreational opportunities on refuges
and hatcheries through volunteer assistance that would
not otherwise be available.
Resource Condition
For nearly 100 years, the Refuge System has tapped into
an almost unlimited reservoir of support from individu-
als, organizations, academia, nonprofit groups, commu-
nity leaders, and businesses. With the passage of the
Volunteer and Community Partnership Act of 1998, the
Refuge System has legislative authority to vigorously
address current barriers to engaging volunteers and
community partners in our daily work.
Because the Fish and Wildlife Service is the principal
Federal agency responsible for conserving, protecting,
and enhancing fish, wildlife, and plants and their habi-
tats, we could not begin to carry out these tremendous
responsibil it ies without the assistance of volunteers and
our friends groups. They accomplish 18-20% of work
that we would not accomplish without their efforts.
Their efforts save taxpayers more than $14 mill ion per
year.
78
AP
P /
AP
R
Annual Performance Goal 3.2 — By September 30, 2002, volunteer participation hours in Service programs will be increased by5% and refuges and hatcheries have 120 new friends groups above the 1997 levels.
Long -Term Goal 3.2 — By 2005, increase volunteer participation hours in Service programs by 7%, and refuges and hatcherieshave 155 new friends groups above the 1997 levels.
1. % increase in volunteer partici-pation hours from 1997.
5%
1,403,000
15%
1,396,000
----
1,335,738
<1%
1,332,875
2%
1,360,000
-4%
1,277,207
*
PerformanceMeasures
2. # new friends groups 63 183
(+120)
95
(+32)
120
(+89)
135
(+72)
171
(+108)
FY 97Actual
FY 98Actual
FY 99Actual
FY 00Actual
FY 01Final Plan
FY 02Proposed
G R E A T E R P U B L I C U S E O N S E R V I C E L A N D S3.2 OPPORTUNITIES FOR PARTICIPATING IN CONSERVATION ON SERVICE LANDS
FY 00Plan
5%
1,402,524
161
(+98)
* FY1999 actual accomplishment data reflects final adjustments
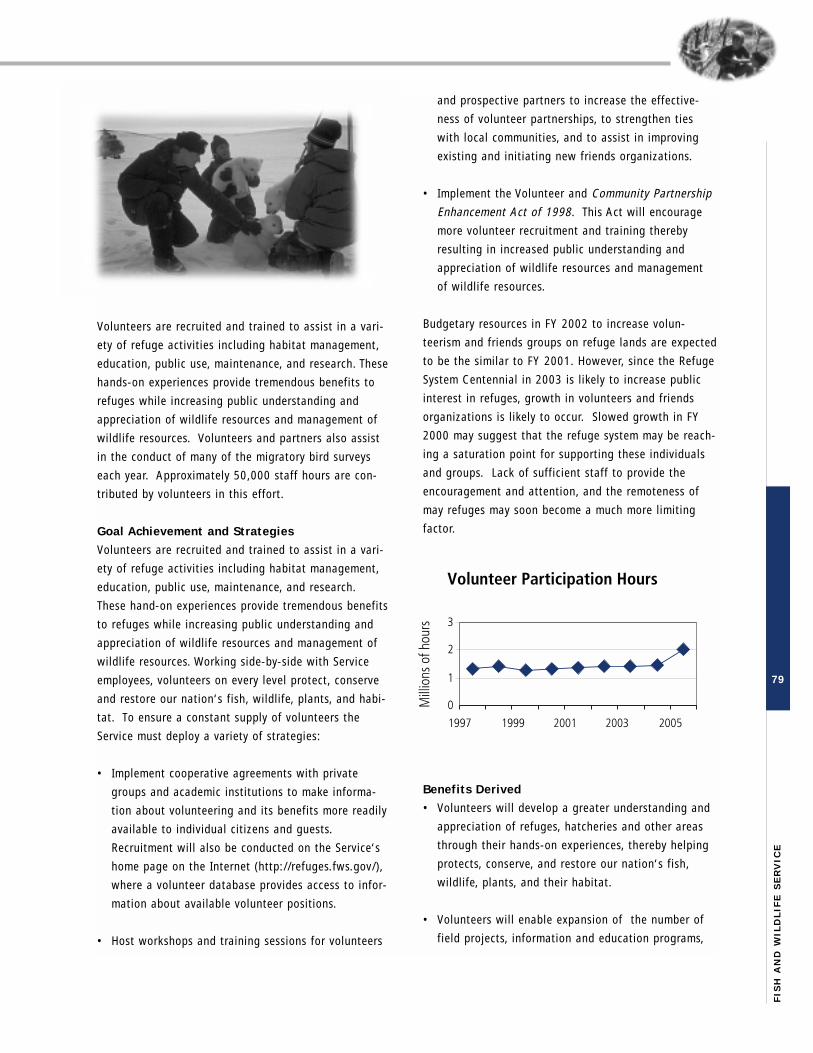
Volunteers are recruited and trained to assist in a vari-
ety of refuge activit ies including habitat management,
education, public use, maintenance, and research. These
hands-on experiences provide tremendous benefits to
refuges while increasing public understanding and
appreciation of wildlife resources and management of
wildlife resources. Volunteers and partners also assist
in the conduct of many of the migratory bird surveys
each year. Approximately 50,000 staff hours are con-
tributed by volunteers in this effort.
Goal Achievement and Strategies
Volunteers are recruited and trained to assist in a vari-
ety of refuge activit ies including habitat management,
education, public use, maintenance, and research.
These hand-on experiences provide tremendous benefits
to refuges while increasing public understanding and
appreciation of wildlife resources and management of
wildlife resources. Working side-by-side with Service
employees, volunteers on every level protect, conserve
and restore our nation‘s fish, wildlife, plants, and habi-
tat. To ensure a constant supply of volunteers the
Service must deploy a variety of strategies:
• Implement cooperative agreements with private
groups and academic institutions to make informa-
tion about volunteering and its benefits more readily
available to individual cit izens and guests.
Recruitment wil l also be conducted on the Service‘s
home page on the Internet (http://refuges.fws.gov/),
where a volunteer database provides access to infor-
mation about available volunteer positions.
• Host workshops and training sessions for volunteers
and prospective partners to increase the effective-
ness of volunteer partnerships, to strengthen ties
with local communities, and to assist in improving
existing and initiating new friends organizations.
• Implement the Volunteer and Community Partnership
Enhancement Act of 1998. This Act wil l encourage
more volunteer recruitment and training thereby
resulting in increased public understanding and
appreciation of wildlife resources and management
of wildlife resources.
Budgetary resources in FY 2002 to increase volun-
teerism and friends groups on refuge lands are expected
to be the similar to FY 2001. However, since the Refuge
System Centennial in 2003 is l ikely to increase public
interest in refuges, growth in volunteers and friends
organizations is l ikely to occur. Slowed growth in FY
2000 may suggest that the refuge system may be reach-
ing a saturation point for supporting these individuals
and groups. Lack of sufficient staff to provide the
encouragement and attention, and the remoteness of
may refuges may soon become a much more l imiting
factor.
Benefits Derived
• Volunteers wil l develop a greater understanding and
appreciation of refuges, hatcheries and other areas
through their hands-on experiences, thereby helping
protects, conserve, and restore our nation‘s fish,
wildlife, plants, and their habitat.
• Volunteers wil l enable expansion of the number of
field projects, information and education programs,
79
FIS
H A
ND
WIL
DL
IFE
SE
RV
ICE
recreational opportunities, and propagation programs
undertaken by the Service.
• Creation of additional fr iends groups wil l supplement
the Refuge System ‘s interpretation education, biolog-
ical, and public service programs. These groups sup-
plement the Service ‘s interpretation, education, bio-
logical, and public service.
FY 2000 ANNUAL PERFORMANCE REPORT:
Goal: By September 30, 2000, volunteer participation
hours in Service programs increased by 5% and refuges
and hatcheries have 98 new friends groups from 1997
levels.
Report:
Goal 3.2.1 – Volunteer Participation –
Goal Not Met
The Service experienced fewer volunteer hours in FY
2000 than in FY 1997 indicating that the performance
goal of 5% growth per year is unrealistically high. The
number of volunteers that can be accommodated may
be near the saturation point. Lack of staff t ime to nur-
ture and develop volunteer programs may be the cause
of this stabil ization. The Refuge System is presently
understaffed by professional resource managers and is
unable to redirected current refuge staff t ime to provide
additional support to the volunteer program without
adversely impacting resource management responsibil i-
t ies on Service-lands.
Goal 3.2.1 – New Refuge Friends Groups –
Goal Not Met
For FY 2000, the Service is enjoying partnerships with
an additional 72 friends groups over the FY 1997 level.
However, this level is below the performance target set
for FY 2000 of an additional 98 friends groups. The
long term goal for adding friends groups are l ikely over-
ly optimistic. Large increases in number of fr iends
groups are showing signs of diminishing as groups are
already in place at larger, more heavily visited refuges.
Remaining refuges are less l ikely to attract sufficient
interest to form these officially organized support
groups. Further, it is very diff icult for smaller refuges,
fewer refuge personnel to organize and support these
groups since there are considerable administrative tasks
associated with managing these groups. Interested
individuals at smaller more remote refuges may opt to
support refuge field stations by volunteering as an indi-
vidual rather than establishing an larger support organi-
zation.
80
AP
P /
AP
R
FY 2000 HIGHLIGHTS - VOLUNTEERS:Arthur R. Marshall Loxahatchee National Wildlife Refuge - The dedication of 222 volunteers donating 9,984 hours is
what made possible the 101 special events on the refuge and an enhanced experience for 140,000 visitors, 4,000 of
which participated in special environmental education programs. Volunteers gave off-site programs, led interpreted
tours, served as rovers on trails, and helped develop and maintain a new butterfly garden.
Hobe Sound National Wildlife Refuge - The vast majority of refuge outreach was conducted by a cadre of highly tal-
ent, passionate volunteers who contributed over 1,700 hours (as compared to the staff‘s available 152 hours) to reach
over 11,000 people on-site and nearly 26,000 off-site. Volunteers led most of the 70 special events on the refuge,
donating 8,700 hours to provide visitor services to almost 123,000 people.
Okefenokee National Wildlife Refuge - Volunteers planted over 30 acres of Longleaf pine. Volunteers/staff took the
Oke Festival to Zoo Atlanta for the second year, where exhibits were visited by more than 5000 people. Several volun-
teer groups replaced over 4,000-ft of boardwalk. Volunteers run the holiday greeting card contest. Volunteers assist
the refuge biologist with bird surveys, wildlife counts and water quality testing. Volunteers maintain the refuge land-
scaping, assist staff with construction, painting and heavy machinery operation. Volunteers participate in bookstore
operations. Volunteers provide guided tours through refuge and assist in environmental education programs.

FY 2000 ANNUAL PERFORMANCE REPORT:Discontinued Goal
Long Term Goal: 3.4 Through 2003, 100% of mitiga-
tion fish hatchery production requirements are satisfied
related to federal water development projects.
Annual Performance Goal: 3.4.1 By September 30,
2000, 93 percent of mitigation production requirements
are satisfied relating to federal water development pro-
jects.
Report: Goal Exceeded
The Service measured success in achieving this goal
through three performance measures -- the number of
fish eggs produced, the number of f ish produced and
the pounds of f ish produced. The Service produced 29.2
mill ion fish eggs, 66.8 mill ion fish and 3.6 mill ion
pounds of f ish. This resulted in providing 130% of miti-
gation production requirements for FY 2000.
Fishery Mitigation
In the Southeastern U.S., f ishery mitigation is necessary
because the Federal dams on some river systems have
drastically altered the environmental conditions of the
waters below the dams constructed by the U.S. Army
Corps of Engineers and Tennessee Valley Authority. The
fundamental purpose of f ishery mitigation is to compen-
sate for adverse impacts to fishery resources caused by
the construction of Federal dams or Federal water devel-
opment projects. Fisheries mitigation in the Southeast
Region uti l izing National Fish Hatcheries consists of
stocking trout species (rainbow trout, brook trout,
brown trout and lake trout) in waters impacted by
Federal dams. In the Southeast Region six mitigation
hatcheries stock over 7 mill ion fish annually to support
mitigation efforts. Without these hatcheries, these
altered environments created as a result of Federal dam
construction would be void of any type of f ishery.
Additionally, the resulting fishery has substantial eco-
nomic and quality of l ife benefits. Recreational angling
dependent on the six hatcheries generates over $100
mill ion annually in direct expenditures and over $200
mill ion in related economic activity.
81
FIS
H A
ND
WIL
DL
IFE
SE
RV
ICE
Performance Measure 1. Percent increase in volunteers participation hours from 1997.2. Increase in friends groups from 1997.
Data Source Data is collected in Refuge Management Information System - Refuge Comprehensive Accomplishment Report. Division of Refuges manages the data-base.
Data Validation See Data Verification and Validation, Page 102
Verification Annual reports are assembled at field stations and forwarded to regional offices for quality review and verification. Final information sent to WashingtonOffice
Data Limitations Activities of some friends groups vary, sometimes causing confusion as to whether an individual group should be counted or not.
Planned Improvements See Data Verification and Validation, Page 102
Baseline FY 1997: 1,335,738 volunteer participation hours.FY 1997: 63 friends groups
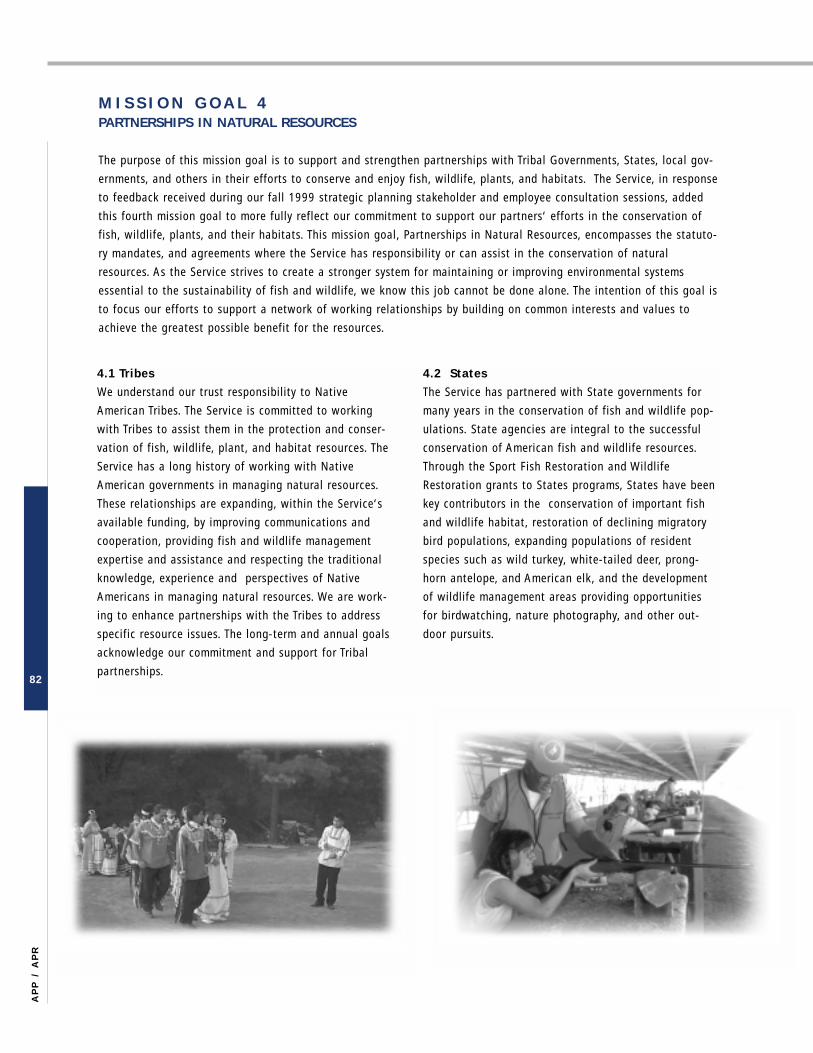
4.1 Tribes
We understand our trust responsibil ity to Native
American Tribes. The Service is committed to working
with Tribes to assist them in the protection and conser-
vation of f ish, wildlife, plant, and habitat resources. The
Service has a long history of working with Native
American governments in managing natural resources.
These relationships are expanding, within the Service ‘s
available funding, by improving communications and
cooperation, providing fish and wildlife management
expertise and assistance and respecting the traditional
knowledge, experience and perspectives of Native
Americans in managing natural resources. We are work-
ing to enhance partnerships with the Tribes to address
specific resource issues. The long-term and annual goals
acknowledge our commitment and support for Tribal
partnerships.
4.2 States
The Service has partnered with State governments for
many years in the conservation of f ish and wildlife pop-
ulations. State agencies are integral to the successful
conservation of American fish and wildlife resources.
Through the Sport Fish Restoration and Wildlife
Restoration grants to States programs, States have been
key contributors in the conservation of important fish
and wildlife habitat, restoration of declining migratory
bird populations, expanding populations of resident
species such as wild turkey, white-tailed deer, prong-
horn antelope, and American elk, and the development
of wildlife management areas providing opportunities
for birdwatching, nature photography, and other out-
door pursuits.
82
AP
P /
AP
R
M I S S I O N G O A L 4PARTNERSHIPS IN NATURAL RESOURCES
The purpose of this mission goal is to support and strengthen partnerships with Tribal Governments, States, local gov-
ernments, and others in their efforts to conserve and enjoy fish, wildlife, plants, and habitats. The Service, in response
to feedback received during our fall 1999 strategic planning stakeholder and employee consultation sessions, added
this fourth mission goal to more fully reflect our commitment to support our partners‘ efforts in the conservation of
fish, wildlife, plants, and their habitats. This mission goal, Partnerships in Natural Resources, encompasses the statuto-
ry mandates, and agreements where the Service has responsibil ity or can assist in the conservation of natural
resources. As the Service strives to create a stronger system for maintaining or improving environmental systems
essential to the sustainabil ity of f ish and wildlife, we know this job cannot be done alone. The intention of this goal is
to focus our efforts to support a network of working relationships by building on common interests and values to
achieve the greatest possible benefit for the resources.

The Service administers a State grants programs in sup-
port of sport f ish restoration and wildlife restoration
activit ies. The Service maintains a Federal f iduciary
responsibil ity to ensure that Federal grant funds are
used consistently with legislative requirements. After
the Service awards funds to States, each State has full
responsibil ity and authority to implement funded
actions. The Service recognizes that these assistance
programs offer unique opportunities to build commonly
held understandings about how to reach commonly
shared goals for protecting and restoring fish and
wildlife habitat throughout the United States. The long-
term and annual goals set standards of performance for
the Service over the next few years to improve the busi-
ness operations and internal and external accountabil ity
of the grants programs.
4.3 Other Federal Agencies
Among the partners with whom FWS will work closely
are other Federal agencies. The Service ‘s responsibil it ies
for threatened and endangered species, migratory birds,
some marine mammals and fisheries intersect with or
support the work of many other Federal departments.
We must work closely with these Federal partners, to
help ensure we direct our efforts in a way that comple-
ments Federal efforts and supports the achievement of
common goals. This new element in our revised strategic
plan underscores the importance of strong coordination
among Federal partners.
4.4 Local Governments, Industry, and Public
Organizations
It is at the local, community, and neighborhood level
that natural resource issues often originate and are
resolved. The Service engages and assists local leaders
and communities in an effort to meet and resolve these
challenges. The Service works with stakeholders across
the country providing resource information of concern
to them. The Service is employing new technologies to
make information more accessible and relevant to the
public. Public stewardship of f ish and wildlife resources
should reduce pressure to include habitats only in
Federal reserves, and should minimize threats to species
causing their l isting as threatened or endangered under
the Endangered Species Act. Public stewardship of nat-
ural resources wil l become increasingly important in this
era of declining government budgets. As the public
takes a more active role in maintaining its natural
resource heritage, Federal dollars can be more effective-
ly used to supplement local efforts to conserve fish and
wildlife resources. The Service encourages public stew-
ardship activit ies by offering a variety of voluntary
grants programs for restoration of wetlands and upland
habitats, important coastal areas and other conservation
efforts.
83
FIS
H A
ND
WIL
DL
IFE
SE
RV
ICE

84
AP
P /
AP
R
B u d g e tA c t i v i t y / S u b a c t i v i t y
( $ 0 0 0 )
F Y 2 0 0 0
E n a c t e d
F Y 2 0 0 1
E n a c t e d
F Y 2 0 0 2
P r e s i d e n t ‘ s B u d g e t
To t a l M i s s i o n
G o a l 4
To t a l M i s s i o n
G o a l 4
To t a l M i s s i o n
G o a l 4
714,543
53,528
61,938
797
0
10,739
14,957
0
23,000
2,391
4,625
0
886,518
206,705
256,317
0
0
0
0
0
0
0
0
0
0
0
0
0
206,705
256,317
806,816
71,358
121,188
795
49,890
11,414
39,912
49,890
104,694
3,243
0
49,890
1,259,200
214,934
248,603
0
0
0
0
0
0
0
0
0
0
0
49,890
49,890
214,934
248,603
781,752
35,849
164,401
0
0
11,414
14,912
0
54,694
3,243
0
0
1,091,265
215,000
294,845
0
0
0
0
0
0
0
0
0
0
0
0
0
215,000
294,845
Resource Management
Construction
Land Acquisition
Wildlife Cons. & Appreciation Fund
State Wildlife Grants Fund
National Wildlife Refuge Fund
North American Wetlands Cons. Fund
State Wildlife Grants Fund
Cooperative End. Species Cons. Fund
Multinational Species Conservation Fund
Commercial Salmon Fishery
Federal Aid in Wildlife Restoration
TOTAL APPROPRIATIONS
Federal Aid in Wildlife Restoration
Sport Fish Restoration (Excludes Interest ---NAWCF)
L I N K B U D G E T A R Y R E S O U R C E S T O M I S S I O N G O A L 4 - P A R T N E R S H I P S I N N A T U R A L R E S O U R C E S The following table provides a crosswalk of appropriated and permanently appropriated funds to Mission Goal 4,
Partnerships in Natural Resources, for FY 2000 Enacted, FY 2001 Enacted, and FY 2002 President‘s Request.

85
FIS
H A
ND
WIL
DL
IFE
SE
RV
ICE
------ ------- ------ 17 17 17
4. # of new or modi-fied cooperativeagreements
Long -Term Goal 4.1: Through 2005, improve fish and wildlife populations and their habitats by increasing our annual Servicefish and wildlife assistance to Native American Tribes in furtherance of the Native American Policy to 85 training sessions, 2,688Tribal participants, 210 technical assistance projects, 260 cooperative agreements, and 160 Tribal consultations *.
P A R T N E R S H I P S I N N A T U R A L R E S O U R C E S4.1 TRIBAL GOVERNMENT
Annual Performance Goal 4.1 — By September 30, 2002 increase technical assistance to Tribes by providing 17 training ses-sions, 513 Tribal participants, 42 technical assistance projects, 52 cooperative agreements, and 32 Tribal consultations.
Performance FY 98 FY 99 FY 00 FY 01 FY 02Measures Actual Actual Actual Final Plan Proposed
FY 00Plan
1. # of training sessions
2. # of Tribal participants(baseline is being estab-lished in FY 2001)
3. # of technical assis-tance projects
------ ------ ------ 44 52 52Partners Partners Partners
F / W F / W F / W
------ ------ ------ ------- 486 513
------ ------ ------ 36 42 42
5. # of Tribal consulta-tions
------ ------ ------ 94 32 32
* The long term goal targets have been adjusted, from those contained in the Fish and Wildlife Service Strategic Plan covering FY 2000 - FY 2005, to reflect FY 2000 actual accom-plishment data projected over the five year period. The target numbers shown for each year are annual (not cumulative).
Goal Purpose
The purpose of this goal is to identify areas where both
Federal and Tribal conservation efforts can most effec-
tively conserve fish, wildlife, plants, and their habitats.
Importance of the Goal
This goal is important because it demonstrates to Native
Americans our wil l ingness and commitment to advanc-
ing conservation by working cooperatively with our
Tribal partners. In many instances, the Service ‘s trust
species are the same as the animals and plants that are
deeply l inked in the Native American culture and tradi-
tion. Through Memoranda of Agreement (MOA) with
Tribes, we have helped enhance and restore l isted
species across the nation, such as the gray wolf, bald
and golden eagles, and Black-footed ferret.
Where the Service provides training and hands-on tech-

nical assistance to Tribes, we can maximize conservation
benefits for Tribal lands and for ecosystems overall. We
have provided matching funds financial assistance for
projects through our administration of the North
American Wetlands Conservation Act. By closely com-
municating and building trust with the Tribes, we are
able to develop mutually beneficial resource goals that
often collaterally increase Tribes ‘ economic potential,
e.g., through tourism.
Goal Achievement and Strategies
We are pursuing a number of strategies to achieve our
goal, as described in our 2000-2005 Strategic Plan. For
this Annual Plan, we will focus on improving our gov-
ernment to government relations by actively seeking
Tribal feedback on our policies, approaches (such as
ecosystem management), and training and technical
assistance priorit ies.
We will also expand our efforts to train ourselves to be
more culturally sensitive and aware of relevant legal
and policy issues that impact Tribes and natural
resources and further our government to government
relations. We will also explore developing career path
training for Tribal natural resource managers on a larger
scale.
We will continue and expand on our efforts to develop
cooperative agreements for mutually beneficial restora-
tion and enhancement activit ies and for improved com-
munications that build a closer trust relationship. In
particular, our Liaisons wil l focus on using the Partners
for Fish and Wildlife Program as a vehicle to develop
cooperative agreements with Tribes. See definition of
”cooperative agreement” under Appendix.
Regarding consultations, in 2000, the vast majority of
the consultations we initiated were of a preliminary,
scoping nature. Over the next four years, we will work
with Tribes on more in depth consultations on important
areas of mutual interest uncovered by our scoping con-
sultations. In approximately f ive years, we will again
initiate scoping consultations, as part of a cyclical
process to identify and address mutual natural resource
issues and identify areas where we can jointly achieve
significant species and habitat restoration effects. To
help facil itate consultations and communication in gen-
eral, in 2001, Region 3 has updated its directory of
Tribes located within that region, to include email and
web site data for the first t ime.
Benefits Derived
Many Tribes take an integrated, holistic approach to
resource management, which complements our ecosys-
tem approach. This approach to resource management
will enable more effective management of crit ical habi-
tat on Tribal lands to ensure selective recovery of
threatened and endangered species as well as preserva-
tion of varieties of f ish, wildlife, and plant species.
86
AP
P /
AP
R

87
FIS
H A
ND
WIL
DL
IFE
SE
RV
ICE
Performance Measure 1. # of training sessions 2. # of Tribal participants3. # of technical assistance projects for Tribes4. # of cooperative agreements5. # of Tribal consultations
Data Source Regional and National Native American Liaisons will collect data from internal cross-program data sources, using a common data collection methodology. National Liaison will analyze, compile, and report on data.
Data Validation See Data Verification and Validation, Page 102
Baseline Baseline is currently being established in FY 2001. Some data exists for FY 2000, as shown on preceding table.
Verification Data will be reviewed and verified by the Deputy Assistant Regional Directors - External Affairs, through the Regional Liaisons. The Deputy Assistant Director - External Affairs reviews and certifies accuracy and completeness of data, as compiled at national level by the National Liaison. All offices responsible for collecting and aggregating data use consistent procedures for data collection, entry, and reporting.
Data Limitations Some data collection inconsistencies and data gaps may exist sue to staffing variations in various Regions of the Service. The new Performance Planning and Management Data System (see ”Planned Improvements”) should improve this situation.
Planned Improvements See Data Verification and Validation, Page 102
FY 2000 ANNUAL PERFORMANCE REPORT:(Annual Performance Goal 4.1.1 is new for FY 2001;
therefore, FY 2000 annual reporting is not applicable.)

Goal Purpose
The objective of this goal is to develop a state-of-the
art electronic grants management system to provide
efficient, effective delivery and tracking of grants and
standardization of documentation for accountabil ity,
reporting, and auditing. Automation of grants processes
will reduce data entry error and allow faster grant fund-
ing, so that States and territories can put the money to
work to benefit resources.
Importance of the Goal
We have found that State and territorial agencies are
integral to the successful conservation of American fish
and wildlife resources. Through the Sport Fish
Restoration and the Wildlife Restoration grants, as well
as grant programs for coastal wetlands conservation,
clean vessel pumpout stations, boating infrastructure,
and partners for wildlife, States and territories have
been key contributors to fish and wildlife conservation.
These grants have enabled work with important fish and
wildlife habitats to restore declining migratory bird pop-
ulations and develop populations of resident species
such as wild turkey, white-tailed deer, pronghorn ante-
lope, and American elk. In addition, these grants have
aided in the development of multiple use wildlife man-
agement areas, providing opportunities for birdwatch-
ing, nature photography, and other outdoor pursuits.
Getting grant funds to the States and territories in a
timely manner to fund projects is the first step in fish
and wildlife conservation in the Federal Assistance pro-
gram. Nationwide adoption of a standardized grants
management system will greatly increase our efficiency
and effectiveness in the processing and accountabil ity
of grants. It wil l also provide a standardized approach,
common data sets/fi les, accurate financial accounting
and reporting, and a consistent audit trail for effective
grants management and enhanced data security.
88
AP
P /
AP
R
Annual Performance Goal 4.2.1 — By September 30, 2002, improve grant/management processing and accomplishmentreporting systems throughout all Service Federal Aid offices.
Long-Term Goal 4.2: From 2001 through 2005, the Service will improve grants management through automation for 80% of theStates‘ and territories‘ grant proposals.
1. # of Federal Aid staff trained inmodern management processing -Federal Assistance InformationManagement System (FAIMS)Baseline = 125 staff
-------- 20 20----
PerformanceMeasures
2.% FAIMS phase 1 implementa-tion
---- ---- ---- 95 100
FY 1998Actual
FY 1999Actual
FY 00Plan
FY 01Final Plan
FY 02Proposed
P A R T N E R S H I P S I N N A T U R A L R E S O U R C E S4.2 SPORT FISH AND WILDLIFE RESTORATION GRANTS MANAGEMENT
FY 00Actual
60
80
*Note that there are five different training courses for FAIMS at the beginning of FY-2001, and that they cover the specialties of: FAIMS Administration, Contract Administration,Fiscal, FFS Interface, and Grant Specialist areas. They are offered as needed to ensure the integrity of the FAIMS data and operation. During FY2001 all five were offered. Only two,Grant Specialist and Fiscal are planned offerings in FY-2001 as of 3/2001. Courses will be offered on demand in FY 2002.
**Measure number 2 ends with FY 2002. This measure indicates the percentage of completion of the automation processes involved in electronic granting. This measure coversautomation of Federal Assistance readiness to use the Department‘s electronic grants choice.
Reporting accomplishments to stakeholders and
Congress in a timely manner is crit ical for developing
and maintaining program credibil ity.
Goal Achievement and Strategies
FAIMS
The Service is exploring automated electronic grants
processing through the Interior Department ‘s
Interagency working group. The Division of Federal
Assistance is an active participant in this Interagency
process. The Federal Assistance functions in the Regions
and Washington Office wil l employ the Federal
Assistance Information Management System (FAIMS)
and its interface with the Service‘s Federal Financial
System as the primary system for executing grants. We
will develop the necessary l inks to any automated sys-
tem the Department selects. Phase One of FAIMS is the
full development and implementation of the internal
system. This internal system serves as the backbone for
the entire grants management process in Federal
Assistance, and includes a basis for electronic granting.
It ensures consistency and reliabil ity in grants data,
financial data, and accomplishment reporting.
Systems Training
Training in FAIMS is important because of system com-
plexity, a need for consistent treatment of data, and
system changes and updates. All Federal Assistance staff
require training pertaining to their area of FAIMS.
Initial ly 125 individuals wil l be trained in basic opera-
tions, in time all 125 will be trained in their specific
area of interest: f iscal, grant information, accomplish-
ment reports. This training wil l be updated as needed.
In FY 2000 we trained 60 Federal Assistance employees
on different aspects of FAIMS operations to enable the
system to become operational with the Division. We
plan on training at least an additional 20 employees in
each of FY2001 and FY 2002
In FY 2001 and FY 2002 Federal Assistance wil l com-
plete its readiness to process grants electronically,
needing only Departmental approvals to start. Prior to
Federal Assistance moving to electronic granting it
needs to be able to use the common interface currently
under development by DOI.
Benefits Realized
In 2000, the Service developed comprehensive correc-
tive actions, with planned completion dates to 2002,
that address areas needing improvement. Progress is
monitored through the management control corrective
action reporting process. Corrective actions cover such
areas as grants audit review and resolution, financial
reconcil iation, the Federal Assistance Information
Management System, and grant operations. A fully inte-
grated (l inking the Federal Financial System and Federal
Assistance Information Management System) became
operational in July 2000. This l inkage greatly facil itates
reconcil iation of grant fiscal obligation and expenditure
details. FAIMS now provides a uniform method of
recording both the fiscal information and the perfor-
mance of each and every Federal Assistance grant. his
affords the Service a standardized approach, common
data sets/fi les, and consistent audit trails for effective
grants management. See Section II I , Management
Issues, below, for additional information on Federal
Assistance management controls.89
FIS
H A
ND
WIL
DL
IFE
SE
RV
ICE

FY 2000 ANNUAL PERFORMANCE REPORT:
Goal: By September 30, 2000, 100 percent of all
Federal Aid State grant monies are used consistent with
the enabling legislation. [reference FY 2000 Annual
Performance Plan 3.3.1, discontinued goal in FY 2001
and beyond]
Report: Goal Met
Our target was to have 56 States and territories eligible
to participate in the Federal Grant Program and to have
all 56 States and Territories found in compliance, after
audit resolution. Based on audits completed, we met
these targets.
90
AP
P /
AP
R
Performance Measure 1. # of Federal Assistance staff trained in FAIMS.2.Percentage of completion of Federal Assistance‘s electronic granting capability (this goal ends in FY 2002).
Data Source Regional offices collect the primary data and furnish it to the FA Washington office for summarization.
Data Validation See Data Verification and Validation Section, Page102
Baseline The baseline of 125 is the total number of employees needing initial training during FY 2000 and FY 2001 and FY 2002
Data Verification Federal Assistance Washington Office samples and tests the data submitted by all sources as needed. The compiled and summarized data is shared withthe regional offices before it is submitted to the Assistant Director-Migratory Birds and State Programs for review, discussion and comment. TheWashington Office and Regional Federal Assistance Chiefs certify the data being reported in this goal.
Data Limitations There may be some disparity in the tabulations due to differences in fiscal years, incomplete activities, and several different locations for data sourceswhich could impact timing and reporting. Further, if full implementation of FAMIS is delayed, there could be a negative impact on this initiative.
Planned Improvements See Data Verification and Validation Section, Page102
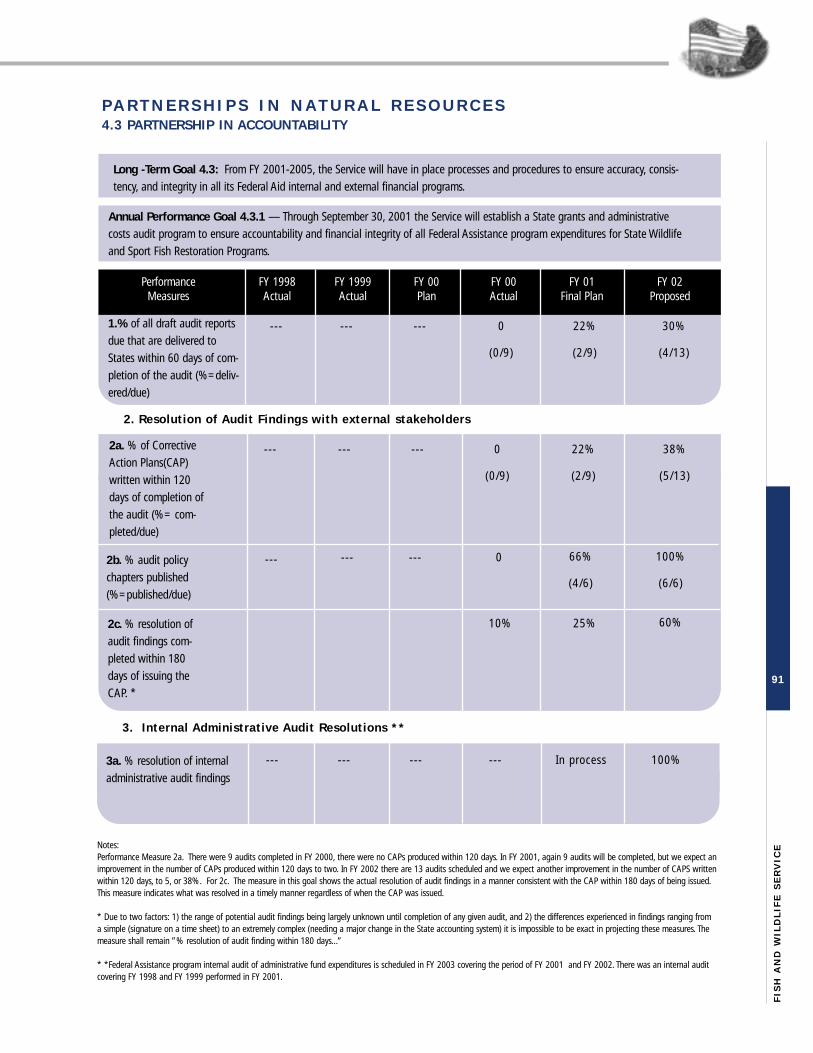
91
FIS
H A
ND
WIL
DL
IFE
SE
RV
ICE
P A R T N E R S H I P S I N N A T U R A L R E S O U R C E S4.3 PARTNERSHIP IN ACCOUNTABILITY
Annual Performance Goal 4.3.1 — Through September 30, 2001 the Service will establish a State grants and administrativecosts audit program to ensure accountability and financial integrity of all Federal Assistance program expenditures for State Wildlifeand Sport Fish Restoration Programs.
Long -Term Goal 4.3: From FY 2001-2005, the Service will have in place processes and procedures to ensure accuracy, consis-tency, and integrity in all its Federal Aid internal and external financial programs.
1.% of all draft audit reportsdue that are delivered toStates within 60 days of com-pletion of the audit (%=deliv-ered/due)
--- --- 22%
(2/9)
30%
(4/13)
2a. % of CorrectiveAction Plans(CAP)written within 120days of completion ofthe audit (%= com-pleted/due)
2b. % audit policychapters published(%=published/due)
2c. % resolution ofaudit findings com-pleted within 180days of issuing theCAP. *
2. Resolution of Audit Findings with external stakeholders
0
(0/9)
PerformanceMeasures
FY 1998Actual
FY 1999Actual
FY 00Plan
FY 01Final Plan
FY 02Proposed
FY 00Actual
---
--- --- ---
--- --- ---
0
(0/9)
22%
(2/9)
38%
(5/13)
0 66%
(4/6)
100%
(6/6)
10% 25% 60%
3. Internal Administrative Audit Resolutions **
------------ In process 100%3a. % resolution of internaladministrative audit findings
Notes:Performance Measure 2a. There were 9 audits completed in FY 2000, there were no CAPs produced within 120 days. In FY 2001, again 9 audits will be completed, but we expect animprovement in the number of CAPs produced within 120 days to two. In FY 2002 there are 13 audits scheduled and we expect another improvement in the number of CAPS writtenwithin 120 days, to 5, or 38%. For 2c. The measure in this goal shows the actual resolution of audit findings in a manner consistent with the CAP within 180 days of being issued.This measure indicates what was resolved in a timely manner regardless of when the CAP was issued.
* Due to two factors: 1) the range of potential audit findings being largely unknown until completion of any given audit, and 2) the differences experienced in findings ranging froma simple (signature on a time sheet) to an extremely complex (needing a major change in the State accounting system) it is impossible to be exact in projecting these measures. Themeasure shall remain ”% resolution of audit finding within 180 days...”
* *Federal Assistance program internal audit of administrative fund expenditures is scheduled in FY 2003 covering the period of FY 2001 and FY 2002. There was an internal auditcovering FY 1998 and FY 1999 performed in FY 2001.
Goal Purpose
The objective of this goal is to establish, maintain, and
implement consistent standards, operating procedures,
and regularly scheduled internal reviews and assess-
ments of program operations.
Importance of the Goal
Because we maintain a
Federal f iduciary respon-
sibil ity to ensure that
use of Federal grant
funds is consistent with
legislative requirements,
the Service must provide
for the conduct of an objec-
tive internal audit of the State
grants accountabil ity including financial and project
performance. Further, we believe that as stewards of
the public trust, the Service must also provide for the
conduct of an objective audit of the Service use of
administrative funds in the administration of the Federal
Assistance grants programs.
Removing errors and inconsistencies in our financial
systems and our use of these systems is crit ical in meet-
ing our fiduciary responsibil ity for grants‘ management
as well as ensuring responsible use of public funds. As
part of recent reviews of the Federal Assistance pro-
grams, we discovered a lack of uniformity in the appli-
cation and interpretation of Federal Assistance stan-
dards guidance at f ield locations. During 1999, we suc-
cessfully initiated the first cycle audit of the State grant
activity. Further, in FY 2000, the Service initiated the
first internal administrative review audit of the Federal
Assistance operations including funds accountabil ity.
This audit was performed in FY 2001.
Goal Achievement and Strategies
The Service wil l use a variety of strategies focusing on
the two objectives for this goal. Critical to the success
of these strategies wil l be consistency in communication
of Federal Assistance policies and guidance among
Service Federal Assistance staff and cooperation with
partners in the delivery of the grant‘s program.
• Developing criteria and requirements for the conduct
of objective State program audits.
• Promoting a work environment that fosters internal
program assessments and evaluation of program
delivery by the Federal Assistance staff.
• Analysis and uti l ization of audit and program assess-
ment findings as means to improve Federal
Assistance program delivery and strengthen internal
administrative practices.
The auditors prepare a draft audit report and deliver it
to the State at the Exit Conference. This measure
involves having that report drafted and deliverable
within 60 days of the end of the on-site portion of the
audit. This an important measure both for the States
and Federal Assistance in that it provides for timely dis-
cussion of audit f inding prior to issuance of a final
audit report and development of a CAP.
The Service generally completes 8-12 audits per year,
Reportable audit f indings typically range from 10-20
findings per audit or 80-240 findings per years. Once
the findings are issued the State and the Federal
Assistance office wil l develop a Corrective Action Plan
(CAP). The Service ‘s measure of success involves early
identif ication of audit f indings and resolving all issues
on the CAP within 180 days of it being issued. The
importance of issuing the policy chapters is in setting
clear policy and guidance on conducting and resolving
audits.
92
AP
P /
AP
R
Benefits Derived
Audit, evaluation and assessment provide important
information for decision makers to assess the contribu-
tion programs are making to the results we want to
achieve in the administration of the Federal Assistance
program. Evaluation helps to determine or identify fac-
tors affecting performance and highlight opportunities
to improve. Evaluations also avoid an incorrect assess-
ment of program performance. Audit resolution is a
crit ical measure on audit functionality and attending to
program needs. Steady improvement in this area bene-
fits the Service as well as all grantees.
FY 2000 ANNUAL PERFORMANCE REPORT:(Annual Performance Goal 4.3.1 is new for FY2001; therefore, FY 2000 annual reporting is notapplicable.)
93
FIS
H A
ND
WIL
DL
IFE
SE
RV
ICE
Performance Measure 1.% of all draft audit reports will be available to States within 60 days of completion of the audit exit conference.2. % of resolution of audit findings will occur within 180 days of issuing corrective action plan. (Ends FY 2001)3. % Internal Administrative fund audit resolution (Begins FY 2002)
Data Source Results of a financial improvement initiatives(expanded oversight of States programs by regional offices during non-audit years) are reviewed by FAWashington Office and coordinated with Regional Offices and audit contractors, as needed.
Data Validation See Data Verification and Validation Section, Page 102
Verification The compiled data along with appropriate analyses will be provided to the Assistant Director, Migratory Birds and States Programs by the Chief in theWashington Office of Federal Assistance for review.
Data Limitations The timing of the availability of the data may hamper various analyses and summaries because reports for audits are sometimes 30-60 days late andsome audit reports may be held up due to unusual events such as States special legislative sessions and/or States reorganizations that impact the flow ofneeded financial data for audit reports.
Baseline 0% of all draft audit reports within 60 days of completion of audit; 0 % of audit resolution within 180 days of issuing CAP.2.a Two of nine issued in a timely manner.2.b Four of six in FY 2001, and the remaining two in FY 2002.2.c. Two of nine in FY 2000.
Planned Improvements See Data Verification and Validation Section, Page 102

Goal Purpose
The objective of this goal is to use Federal Aid Training
Program courses, Federal Aid Regional Office workshops
and training, and other management certif ication train-
ing courses for State and Regional/Washington Office
Federal Aid staff who are responsible for grants man-
agement. The purpose of this training is to improve
grant management efficiency, promote consistency, and
reduce audit f indings of projects supported by Federal
Aid in Wildlife and Sport Fish Restoration Acts funding.
Importance of the Goal
Since 1986, the Defense Contract Audit Agency, the
Service ‘s contract auditor, has completed 62 audits of
State wildlife resource agencies (some agencies have
more than one division handling Federal Aid). These
audits have revealed a significant number of common
problems and issues. Among the more pressing is the
need to provide consistent, pertinent training to all
State staff and Service staff who have grant manage-
ment responsibil it ies.
Goal Achievement and Strategies
The Service wil l use existing government grant manage-
ment certif ication courses or design and test additional
courses intended to provide State and Service Federal
Aid employees with a common background knowledge
and understanding to manage grants, document/approve
disbursements and ensure that grant fi les are completed
accurately and kept up-to-date for annual review/audits.
Benefits Derived
Effective training programs will promote consistent
interpretation and application of regulations, policies,
and processes in grants programs. With effective train-
ing programs in place, there wil l be a decrease in the
94
AP
P /
AP
R
--- --- --- 98 40 40
Long -Term Goal 4.3: By 2005, the Service will have in place processes and procedures to ensure accuracy, consistency, andintegrity in all its Federal Aid internal and external financial programs.
P A R T N E R S H I P S I N N A T U R A L R E S O U R C E S4.3 PARTNERSHIPS IN ACCOUNTABILITY
Annual Performance Goal 4.3.2 — By September 30, 2001, the Service will require Service staff to take training courses inbasic grants management, audit preparation management, and audit resolution, and offer these training courses to State staff,using existing government grant management certification training courses or design new courses.
Performance FY 98 FY 99 FY 00 FY 01 FY 02Measures Actual Actual Actual Final Plan Proposed
FY 00Plan
1. # of State and Servicestaff completing basicgrants managementcourses
2a # of Service staffcompleting additionalgrants managementtraining
2b. # of State staff com-pleting additional grantsmanagement training
--- --- --- 58 25 7
------ --- --- 28 60 30

amount of time required to audit each resource agency.
Better understanding and application of rules and poli-
cies wil l reduce audit f indings and make the Service‘s
grant programs more efficient and effective. The cost
savings thus derived wil l be distributed back to States
for their f ish and wildlife conservation programs. The
training wil l also help ensure that the quality of grant
project f i les Service wide wil l meet the same high stan-
dards across the country.
95
FIS
H A
ND
WIL
DL
IFE
SE
RV
ICE
Performance Measure 1. # of State and Service staff completing basic grants management course.2. # of Service staff completing additional grants management training.3. # of State staff completing additional grants management training.
Data Source Primary data collection is completed by the Regional Offices, NCTC, and private contractors. Data is reviewed, analyzed, and compiled at FA WashingtonOffice.
Data Validation See Data Verification and Validation, Page 102
Verification The FA Washington Office compiles the data; reviews, analyzes and summarizes it to reflect the results of initiatives and provide final package to theAssistant Director, External Affairs, for approval and certification.
Data Limitations The limited availability of instructors for the various courses may delay the planned training. Further, currently the courses generally fill up the first daythey are announced, which is indicative of the need for more courses.
Planned Improvements See Data Verification and Validation, Page 102
Baseline 98 State/Service staff complete basic training; 58 Service staff complete additional training; 28 State staff complete additional training

III.1 Customer Service
Virtually everyone who lives in or visits our country
experiences the results of our work whether it is enjoy-
ing the sight of a flock of geese or experiencing a
restored wetland or f ishing in a lake. We work hard to
manage and protect natural resources for current and
future generations. We are
interested in learning what
our customers think we are
doing and what areas need
improvement. By ”cus-
tomers,” we include both
internal customers (our
employees in various ranks
and offices throughout the
nation and our volunteers)
and external customers
(stakeholders, other agencies,
Congress, the public).
Customer feedback is vital
information for a learning
organization that seeks con-
tinuous improvement.
For example, we actively
sought advice from our stake-
holders to help us set the
long-term goals that became
the cornerstones of our first
Strategic Plan in 1997. We
held 14 l istening conferences
across the country for stake-
holders and employees and received over 1,000
responses to our survey. In 1999, we again actively
sought feedback from our customers as we engaged in
our review and updating of our 2000 - 2005 Strategic
Plan. We listened and made major revisions to the
Strategic Plan. We developed a new mission goal
directed at strengthening our partnerships with Tribes,
States, and territories.
We are currently developing a customer satisfaction
baseline during FY 2001. This baseline wil l include a
summary of our fall 2000 inventory of customer service
activit ies across the
agency, results from the
Department ‘s customer ser-
vice training needs survey,
results from our internal
survey on personnel ser-
vices, and results from the
American Customer
Satisfaction Index (ACSI),
surveying visitors to our
refuges. Over 36 mill ion
people visit our national
wildlife refuges each year.
The ACSI contractor has
conducted random digit
telephone surveys of 200
recent visitors.
In addition to establishing
a baseline, these initial
survey results wil l be ana-
lyzed and used to develop
customer service-related
goals and measures. We
hope to have sufficient
information to be able to
modify our FY 2002 annual performance plan to include
customer service performance goals and measures.
Further, we anticipate revising our 2000-2005 Strategic
Plan to include new long-term goals related to improv-
ing our customer service activit ies.
96
AP
P /
AP
R
Sect ion III
Addit ional Annual Per formance Plan Information

We are active participants in the Department ‘s
Customer Service Forum and worked with the
Department in shaping its Customer Service Policy and
Customer Service Excellence Award program, among
other collaborative efforts. We will appropriately revise
and implement the Departmental customer service pro-
grams for the Service to help further insti l l a customer
service ethic within our agency. We are committed to
listening to the public and continuously improving our
performance to meet our mission.
III.2 Crosscutting Issues
The Fish and Wildlife Service is responsible for the pro-
tection and conservation of the nation‘s fish and
wildlife resources, recognizes the importance of partner-
ships with others in order to fulf i l l this mission. It is
through a collaborative approach to conservation that
the Fish and Wildlife Service can realize the accomplish-
ment of the strategic plan ‘s long-term performance
goals outlined in this document. Virtually, all of the
results that we strive to achieve require the concerted
and coordinated efforts of two or more agencies. Our
long-term performance goals create a structure to
involve more people and partnerships in shaping natural
resource management. This dialogue can begin with the
development of joint or common performance goals
with other federal agencies concerned with natural
resource management issues. Although the Fish and
Wildlife Service plays an important role in conservation
and protection of f ish and wildlife resources, we recog-
nize that no single government agency or collection of
agencies can accomplish this task alone.
During the past three years, we have and will continue
to make progress in the coordination of cross-agency
efforts to ensure a more effective and efficient method
for conserving and protecting natural resources.
Examples of ongoing efforts include:
• South Florida Everglades
Restoring the ecological integrity of f ish and wildlife
resources in the South Florida Everglades is a top
National priority. The South Florida Ecosystem
Restoration Task Force was established to provide
leadership and coordination among federal agencies
involved in meeting this natural resource challenge.
As part of the Task Force, the Service engages in on-
the-ground restoration activit ies. The Service man-
ages 16 National Wildlife Refuges within the South
Florida Ecosystem. Some of the other federal agen-
cies participating in the combined restoration efforts
are the National Park Service, National Marine
Fisheries Service, Department of Defense, U.S. Coast
Guard, Federal Aviation Agency, and U. S. Forest
Service.
Recently enacted legislation directed the Army Corps
of Engineers to coordinate the efforts of the
97
FIS
H A
ND
WIL
DL
IFE
SE
RV
ICE

Comprehensive Everglades Restoration Plan (CERP),
which is the most ambitions ecosystem-related pro-
ject ever proposed. With a total cost of nearly $8 bil-
l ion, the Corps proposes to restore the south Florida
ecosystem, provide for the urban and agricultural
water supply needs of the growing south Florida pop-
ulation, and maintain or enhance the levels of f lood
protection for local residents and businesses. The
Fish and Wildlife Service, National Park Service, and
the U.S. Geological Survey have crucial roles in the
implementation of CERP, particularly during the feasi-
bil ity and general design phases, and their associated
National Environmental Protection Act review
processes. In addition to the Service‘s participation
in the interagency project development process, the
Service wil l jointly prepare a series of independent
assessments, as part of the Fish and Wildlife
Coordination Act and ESA/Section 7 determinations.
• Northwest Forest Plan
In 1994, the Northwest Forest Plan was initiated and
represents a comprehensive and cooperative
approach to managing forest in the Pacific Northwest
region. The Forest Plan provides economic and
employment assistance to communities impacted by
changing forest management practices, and for sig-
nificant long-term conservation and management
benefits of key species on federal lands, such as the
northern spotted owl, marbled murrelet, grizzly bear,
and gray wolf. In 1995, the Fish and Wildlife Service,
National Marine Fisheries Service, Bureau of Land
Management, and U.S. Forest Service signed an inter-
agency memorandum implementing streamlined con-
sultation for forest health projects.
• Invasive Species
Invasive species are among the most significant
domestic and international threats to fish and
wildlife. Only habitat destruction has a greater
impact on ecosystems and the fish and wildlife they
sustain. Several pieces of legislation were passed to
address this threat. The National Invasive Species Act
was passed in 1996 amending the Nonindigenous
Aquatic Nuisance Prevention and Control Act of
1990. The 1990 Act established the Aquatic
Nuisance Species (ANS) Task Force to direct ANS
activit ies annually (http://www.invasivespecies.gov/).
The Task Force is co-chaired by the U.S. Fish and
Wildlife Service and the National Oceanic and
Atmospheric Administration. Other members include
the National Marine Fisheries Service, Environmental
Protection Agency, Department of Agriculture, the
U.S. Coast Guard, the U.S. State Department, and the
Army Corps of Engineers.
The National Invasive Species Council indicates that
entry of invasive species is generally detected by fed-
eral agency staff (the Animal and Plant Health
Inspection Service for plants and insects; U.S. cus-
toms and the Environmental Protection Agency for
any l iving organism that are intended as pesticides
and potentially for organisms having certain con-
sumer and industrial uses; the U.S. Fish and Wildlife
Service for wildlife and fish; the U.S. Coast Guard for
ballast water; U.S. Customs for general shipments;
and the U.S. Postal Service for shipments by mail),
state eradication boards, and state or local agency
scientists. The Fish and Wildlife Service, participating
as a member of the National Invasive Species
Council, is committed to the prevention and control
98
AP
P /
AP
R

of invasive species on all Service-managed lands and
waters.
• Recovery of Threatened and Endangered
Species
The Endangered Species Act of 1973, one of the most
comprehensive wildlife conservation laws in the
world, demands a collaborative effort from a broad
spectrum of partners in order to implement the Act ‘s
complex provisions. The law is administered by the
U.S. Fish and Wildlife Service and National Marine
Fisheries Service. Both agencies work with other fed-
eral agencies to plan or modify federal projects so
they wil l have minimal impact on l isted species and
their habitat. Under the Act, all federal agencies are
required to protect species and protect their habitat.
Federal agencies must uti l ize their authorities to con-
serve l isted species and make sure that their actions
do not jeopardize the continued existence of l isted
species.
• Wetlands Working Group
In FY 1999, the Administration formed a White House
Wetlands Working Group tasked with determining the
contributions that Federal agencies were making to
the quantity and quality of wetlands in the United
States. The Fish and Wildlife Service was one of
many Federal agencies, including Army Corp. of
Engineers, Bureau of Land Management, Bureau of
Reclamation, and Forest Service that participated this
national effort. Federal Agencies wil l jointly report
wetlands conservation activit ies beginning in FY
2000.
• Protection of Marine Mammals
The Service is currently working with the National
Marine Fisheries Service and Alaska Native
Organizations on an amendment package for the
Marine Mammals Protection Act (MMPA). Following
reauthorization of the MMPA, the Service wil l estab-
lish cooperative management agreements with the
appropriate Alaska Native Organizations to determine
harvest guidelines.
• Tribal Wetland and Waterfowl Enhancement
Long-term management and protection of waterfowl
populations and wetland habitat throughout the
Great Lakes Region have been a continuing, high-pri-
ority, natural resource concern. To address this issue,
the Circle of Fl ight program was created in 1991,
consisting of reservations and inter-tribal organiza-
tions, federal agencies, state and local governments,
and private organizations. Some of the key federal
partners include the Fish and Wildlife Service, Federal
Energy Regulatory Commission, U.S. Department of
Agriculture, Bureau of Indian Affairs, and
Environmental Protection Agency. To date, we have
provided technical assistance to 26 reservations for
waterfowl and wetland enhancement projects.
III.3 Management Issues
The key management issues identif ied by the Office of
the Inspector General (OIG) include:
Maintenance
The Service has been actively engaged in improving
data documentation in its Maintenance Management
System (MMS). The MMS database was amended in
1999 to include several additional f ields relating to cost
estimating and again in 2000 to continue refinements.
Data call memoranda and discussions with Regional
counterparts on MMS data reflect that Regional Offices
are accountable for ensuring that data are complete
and accurate. A new cost estimating guide specific to
the types of facil it ies encountered in Fish and Wildlife
Service operations was developed in FY 2000 and is
now available to enhance consistency of repair and
replacement cost estimates.
An updated real property inventory database, completed
early in FY 2000, now provides a single nationwide
database on real property holdings that for the first
time includes estimated replacement values of all real
property items. This allows calculation of a Facil ity
Condition Index, a non-subjective gauge for assessing
the condition of all FWS facil it ies. A Facil ity
Management Information System (FacMIS) user group
within the Service developed and implemented systems
and procedures to better manage facil ity maintenance
related data. Data standardization and methods of
l inking information from existing stand-alone systems
within the FWS are now being implemented. The
FacMIS website that l inks various maintenance related
99
FIS
H A
ND
WIL
DL
IFE
SE
RV
ICE

databases became operational in November 2000;
additional development is underway to add additional
databases to the FacMIS system by the end of FY 2001.
Consistent with Departmental guidelines on condition
assessments, we are now implementing a condition
assessment verif ication process that has been approved
by an executive level FacMIS steering committee. New
condition assessment guidelines were approved in
February 2000, and Maintenance Management System
and Real Property Inventory databases have been
amended since that time to fully incorporate the new
guidelines. Seven regional and three national positions
have been added to increase attention to improved con-
dition assessments and documentation of maintenance
needs. The Service‘s plan to implement facil ity condi-
tion assessments was approved in writing by the
Department on June 20, 2000.
The update of the Maintenance Management System
Handbook, including incorporation of new procedures
described above, was initiated in August 2000, and an
updated draft is projected to be complete by April 1,
2001. A refuge Maintenance Management System data-
base is now posted on the FWS internal intranet so that
project needs can be updated throughout the year. This
database includes all maintenance projects for refuges
and all construction projects for the entire agency.
A pilot evaluation of Maximo, a commercial mainte-
nance management system software, wil l be conducted
in the FWS in 2001 and 2002. This pilot evaluation wil l
involve a number of changes in business practices to
enable enhanced monitoring of maintenance needs and
activit ies. The pilot evaluation wil l be completed on 5-
10 field stations. A Servicewide decision on implemen-
tation wil l be made near the end of FY 2002. This man-
agement improvement supports the Department of the
Interior‘s facil ity maintenance goal.
Managing an Expanding Land Base
Predicting the future operation and maintenance costs
associated with management of newly added lands was
identif ied as a management challenge in the January
2001 GAO report, ”Major Management Challenges and
Program Risks.” Prior to the audit, the Service conduct-
ed an analysis of funding needs associated with new
land acquisit ion projects but did not forecast operation
and maintenance costs of transfers or donated lands.
Since that time, the Service has implemented the follow-
ing actions.
1) Each annual Budget Justif ication beginning with
FY 2001 now includes a table that displays the antic-
ipated amount of new land that wil l be added during
the year either by purchase, easement, transfer, or
donation. This table also l ists the amount of opera-
tion and maintenance costs expected to be needed
for proper management of these lands and the
amount that has been requested in the current FY
budget.
2) The Refuge Operating Needs System, an inventory
of unmet operating needs on refuge lands, has been
amended to direct regional offices to forecast opera-
tions needs associated with all new lands projected
through the end of the budget year for which
Congress is deliberating budgets.
3) The Refuge Maintenance Management System,
which inventories unmet maintenance needs, has
been amended to allow data collection by way of
Internet access. This wil l enable the collection of
deferred maintenance data throughout the year
which should improve the abil ity to collect timely
information about maintenance projects for new
lands. Specific methods of how this data wil l be col-
lected for new refuge acquisit ions remain to be
devised.
Actions 1 through 3, above, will dramatically improve
the availabil ity of operation and maintenance informa-
tion for new refuge lands. There remain a number of
challenges; however, as scope, location, and timing of
land acquisit ion actions are extremely diff icult to pro-
ject. The FWS is continuing to review its business prac-
tices to seek mechanisms for refining the forecasting of
cost estimates for operation and maintenance needs for
new lands.
In the same GAO report, GAO referred to an Office of
Inspector General 1998 audit that covered land acquisi-
100
AP
P /
AP
R

tion activit ies of the Service. In response to the OIG
audit, the Service clarif ied and revised appraisal policies
in May 1999, to specifically address the OIG concerns.
The revised appraisal policies: clarif ied some confusing
appraisal terms (rejected appraisals, accepted
appraisals, approved appraisals); specified when two
acceptable appraisals were required on the same prop-
erty; created a firm expiration date for statements of
just compensation; and clarif ied when appraisals should
be re-validated or updated.
Accountability and Control Over Artwork
and Artifacts
The Service published national policy, guidance and
standards in FY 1998 that address the accountabil ity
and management of museum property, and developed a
software package for f ield stations to use in accession-
ing and cataloging collections. Work on accounting for
and inventorying collections continues. In 1998, we
revised a Museum Property Plan that identif ies manage-
ment objectives and includes a schedule for completing
work required by law, regulations, and Departmental
standards. We completed an initial national inventory
of materials and human remains covered by the Native
American Graves Protection and Repatriation Act of
1990. For FY 2000, Service offices reported modest
progress in cataloging and inventorying collections.
Specific accomplishments included the inventory of
materials related to the Civil ian Conservation Corps era
during the 1930‘s and fossil collections on loan to
museums and universities. Overall, we have identif ied
approximately 220 non-Federal institutions that main-
tain agency collections, and we are negotiating cooper-
ative agreements with some of these facil it ies to main-
tain collections. Work performed by the Service to
improve accountabil ity of artwork and artifacts supports
the Department of the Interior ‘s goal to preserve, pro-
tect and provide access to cultural and natural museum
collections.
Federal Aid Management Controls
In 2000, the Service developed comprehensive correc-
tive actions, with planned completion dates to 2002,
that address areas needing improvement. Progress is
monitored through the management control corrective
action reporting process. Corrective actions cover such
areas as grants audit review and resolution, financial
reconcil iation, the Federal Aid Information Management
System, and grant operations. In addition, a new Chief,
Division of Federal Aid, was hired and a contractor
issued recommendations to improve Federal Aid ‘s orga-
nizational effectiveness; a Director ‘s Order established
an audit resolution process that improves Regional
Office and Washington Office coordination; and manual
chapters that address grants audits were initiated.
In addition, the interface between the Federal Financial
System (FFS) and Federal Aid Information Management
System (FAIMS) became operational in July 2000.
Numerous FAIMS sub-program codes to facil itate recon-
cil iation with FFS were created which improve the docu-
mentation of grant activit ies and institute flexible
cumulative summary reporting capabil it ies. This inter-
face greatly facil itates reconcil iation of grant fiscal
obligation and expenditure details.
On-line instructions are being updated with task-orient-
ed documentation and new components are being
designed, such as the FFS Interface, a sophisticated
Lands Record component, and a component that alerts
Regional Office Managers about grant processing sta-
tus. Eventually, all components wil l be explained in the
context of how to use FAIMS to administer grants rather
than how it functions.
FAIMS now provides a uniform method of recording
both the fiscal information and the performance of each
and every Federal Aid grant. Evolving grant programs
can be accommodated in this software system which, by
design, can be easily audited.
101
FIS
H A
ND
WIL
DL
IFE
SE
RV
ICE

III.4 Data Validation and Verification
The Fish and Wildlife Service is committed to ensuring
that those who use FWS‘ reported performance informa-
tion to make decisions can do so with the confidence
that our data are reliable and valid. Over the last few
years, the Service has made progress in developing the
essential processes that support data verif ication meth-
ods used by the four major program areas in determin-
ing data quality. In that regard, the Service has stan-
dardized data definitions, identif ied data sources, and
determined data reliabil ity and validity for all goals and
measures.
Data Validity: The goals directly measure the results that
the organization hopes to achieve in the delivery of the
core components of the mission. Data collected is rel-
evant and presents an accurate picture of the perfor-
mance of the organization toward achieving the goals.
Performance data for goals are obtained by existing
data collection processes and are supported by program
information management systems. To a large degree,
the Service must rely on the quality assurance/quality
controls in place at the primary data source to ensure
data accuracy.
Planned Improvements: The Service is taking steps to
improve its data quality and management. The Service
is developing a performance management database sys-
tem (System) to manage the Service ‘s business system
based on the performance goals and measures reported
throughout all Regions and programs of the Fish and
Wildlife Service. The System will serve as a planning
and a reporting system. In a planning capacity, the
System will track the setting of performance goals and
performance measure targets throughout the budget
planning cycle (Secretarial, OMB, Congressional submis-
sion, and Appropriations). Washington Program and
Regional Offices wil l coordinate setting of goal and
measure targets based on funding estimates.
Once the final performance goal and measure targets
are determined, the System will serve as a reporting
system. Performance data wil l be entered quarterly or
annually, as appropriate. The System will contain com-
mon reporting data definitions wil l ensure consistency
in data reporting by various offices. Data wil l be
entered at the field level, aggregated at the Regional
level, and finally aggregated at the National level.
Validation and verif ication checks wil l be designed into
the System. The development of the Service ‘s System
will be compatible with the DOI initiative to improve
data quality. This initiative supports a more unified
approach in the effort to validate and verify perfor-
mance data. A unique data validation and verif ication
matrix has been developed and is currently being tested
for reliabil ity.
The Service System will make various reports at a
Regional and National levels available for Service man-
agers to more efficiently and effectively mange their
programs. Existing data reporting systems will be l inked
to the System to ensure single data entry whenever pos-
sible. The System will ensure compete accuracy and
reliabil ity of the performance goals and measures
entered into the Annual Performance Plan and Report.
The System should be available for prototype testing in
the fall of 2002.
III.5 Program Evaluations
Fishery Resources Strategic Plan
The U.S. Fish and Wildlife Service is developing a strate-
gic plan to guide fish conservation from FY 2002 -
2006. The plan wil l integrate habitat protection,
enhancement and restoration tools and identify the
needed scientif ic and technical capabil it ies to improve
habitats, spawning stocks, and over-harvest problems.
Implementing this plan wil l expand successes l ike the
lake trout and striped bass to restore additional aquatic
species and their associated recreation, commercial, and
aesthetic benefits.
Within the context of the broader Fisheries Strategic
Plan, the Service is developing a component strategic
plan for the National Fish Hatchery System (NFHS). This
plan will focus Service hatchery efforts to better fulf i l l
its responsibil it ies for conserving aquatic resources. The
Alignment, Appropriateness, and Adequacy (3As)
Evaluation is one of the cornerstones that wil l anchor
that strategic plan. Other nationwide efforts that the
Service wil l draw from are the Hatchery Project Report
102
AP
P /
AP
R

being prepared by the Sport Fishing and Boating
Partnership Council, the 1999 - 2000 audit conducted
by the General Accounting Office, and the products of
eight internal Fish and Wildlife Service work groups. In
addition, there are several regional developments that
will help the overall strategic planning process, includ-
ing the recent biological opinions of the National
Marine Fisheries Service in the Pacific Northwest, the
Artif icial Production Review prepared by the Northwest
Power Planning Council, and the work of the Hatchery
Scientif ic Review Group initiated by the Senate
Appropriations Committee. Input from other stakehold-
ers wil l also be integrated into the strategic plan.
The NFHS initiated an extensive 3As self-evaluation of
its production programs in March 1998. The purpose of
the evaluation was to determine (1) the extent to which
production programs carried out by the NFHS were
aligned with the six Fisheries Program Priorit ies that
were established in 1997, (2) whether the production
programs were appropriate to meet fishery management
goals and objectives, and (3) whether the programs
were adequately supported by scientif ic planning, moni-
toring, and evaluation, as well as staffing and funding,
to conduct the program responsibly. The evaluation also
included analyses of the overall numbers and species of
fish produced. Ultimately, the results of the evaluation
will help the NFHS focus the optimum proportion of its
resources on priority programs.
III.6 Capital Assets/Capital Programming
Capital Asset Plans and Justif ications (Exhibit 300B in
OMB Circular A-11) are required for major capital
acquisit ions, which are defined by the Department of
the Interior for any construction project that involves
construction costs in excess of $10 mill ion or are of
high visibil ity and importance. As such, plans were pre-
pared for seawall rehabil itation at Tern Island NWR,
Hawaii, and construction of a fourth dormitory at the
National Conservation Training Center, West Virginia.
In addition, the Service is required to prepare Capital
Asset Plans and Justif ications for the five largest pro-
jects in terms of total project cost, regardless of the fis-
cal year of appropriation (i.e., including prior year fund-
ed projects.) Thus, Capital Asset Plans and
Justif ications are included for the following seven pro-
jects:
103
FIS
H A
ND
WIL
DL
IFE
SE
RV
ICE

104
AP
P /
AP
R
Station, State
Clark R. Bavin NFWForensics Lab, OR
Alaska Maritime NWR,AK
National ConservationTraining Center, WV
Tern Island NWRPacific/Remote IslandsNWR Complex, HI
Klamath BasinComplex, OR
Chincoteague NWR, VA
Bear River MBR, UT
National Headquarters
Total
CAPITAL ASSET PLANS AND JUSTIFICATION
Project Description(a)
FY 2002Request
Total Project Cost(nearest thousand
dollars)
Forensics LaboratoryExpansion
Marine CenterHeadquarters andVisitor Facility
Fourth Dormitory andCity Water Connectionto Shepherdstown, WV
Rehabilitate Seawall
Water Supply andManagement
Herbert H. BatemanEducational andAdministrative Center
Headquarters andEducation CenterComplex
Federal Aid InformationManagement System
0
0
0
0
1,700,000
2,900,000
0
1,500,000
6,100,000
23,950,000
18,369,000 (b)
12,722,000
11,881,000
10,000,000
9,792,000 (c)
7,980,000 (d)
12,700,000
107,394,000
(a) These projects support Annual Performance Goal 2.2.1, (By September 30, 2002, about 5.7 percent of mission critical water management and 8 percent of public use facilitieswill be in fair or good condition as measured by the Facilities Condition Index above the previous year.) in the FY 2002 Annual Performance Plan.(b) The total project cost to the Service for this combined headquarters and visitor center for both the Alaska Maritime NWR and the Katchemak National Estuarine Research andReserve (NOAA) is $8.76 million.(c) Includes state, private, and other sector contributions of $2.4 million.(d) Includes $1.5 million in private contributions.
III.7 Use of Non-Federal Parties in Preparing this
Annual Performance Plan
The Service ‘s Annual Performance Plan was prepared in
conformance with Section 220.7 of OMB circular A-11.
Preparation of the Annual Performance Plan involved
Service employees in all regions and at every level of
the organization. The Service ‘s Annual Work Guidance
directly reflects the goals and performance the Service
intends to achieve in annual increments toward success-
fully completing its long term strategic goals.
III.8 Waivers for Managerial Accountability and
Flexibility
The Service is requesting no waivers of administrative
procedural requirements and controls.
105F I S H A N D W I L D L I F E S E R V I C E
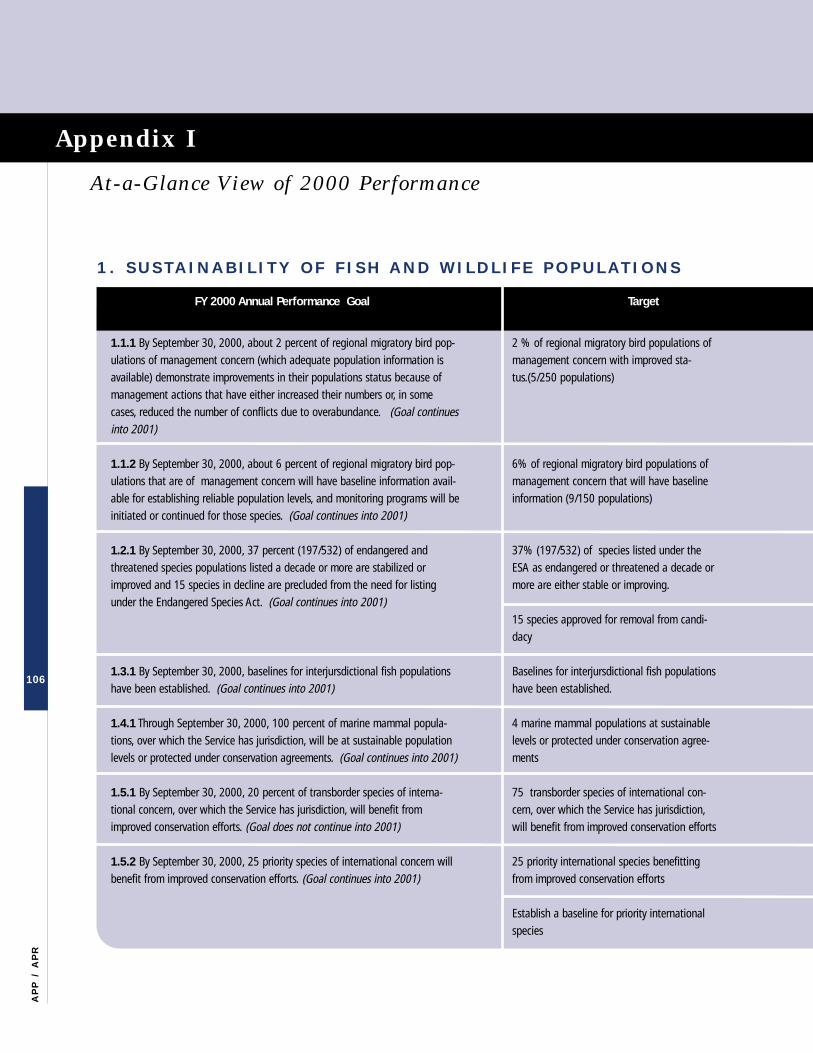
106
AP
P /
AP
R
Appendix I
At-a-Glance View o f 2000 Per formance
1 . S U S T A I N A B I L I T Y O F F I S H A N D W I L D L I F E P O P U L A T I O N S
1.1.1 By September 30, 2000, about 2 percent of regional migratory bird pop-ulations of management concern (which adequate population information isavailable) demonstrate improvements in their populations status because ofmanagement actions that have either increased their numbers or, in somecases, reduced the number of conflicts due to overabundance. (Goal continuesinto 2001)
1.1.2 By September 30, 2000, about 6 percent of regional migratory bird pop-ulations that are of management concern will have baseline information avail-able for establishing reliable population levels, and monitoring programs will beinitiated or continued for those species. (Goal continues into 2001)
1.2.1 By September 30, 2000, 37 percent (197/532) of endangered andthreatened species populations listed a decade or more are stabilized orimproved and 15 species in decline are precluded from the need for listingunder the Endangered Species Act. (Goal continues into 2001)
1.3.1 By September 30, 2000, baselines for interjursdictional fish populationshave been established. (Goal continues into 2001)
1.4.1 Through September 30, 2000, 100 percent of marine mammal popula-tions, over which the Service has jurisdiction, will be at sustainable populationlevels or protected under conservation agreements. (Goal continues into 2001)
1.5.1 By September 30, 2000, 20 percent of transborder species of interna-tional concern, over which the Service has jurisdiction, will benefit fromimproved conservation efforts. (Goal does not continue into 2001)
1.5.2 By September 30, 2000, 25 priority species of international concern willbenefit from improved conservation efforts. (Goal continues into 2001)
2 % of regional migratory bird populations ofmanagement concern with improved sta-tus.(5/250 populations)
6% of regional migratory bird populations ofmanagement concern that will have baselineinformation (9/150 populations)
37% (197/532) of species listed under theESA as endangered or threatened a decade ormore are either stable or improving.
15 species approved for removal from candi-dacy
Baselines for interjursdictional fish populationshave been established.
4 marine mammal populations at sustainablelevels or protected under conservation agree-ments
75 transborder species of international con-cern, over which the Service has jurisdiction,will benefit from improved conservation efforts
25 priority international species benefittingfrom improved conservation efforts
Establish a baseline for priority internationalspecies
FY 2000 Annual Performance Goal Target
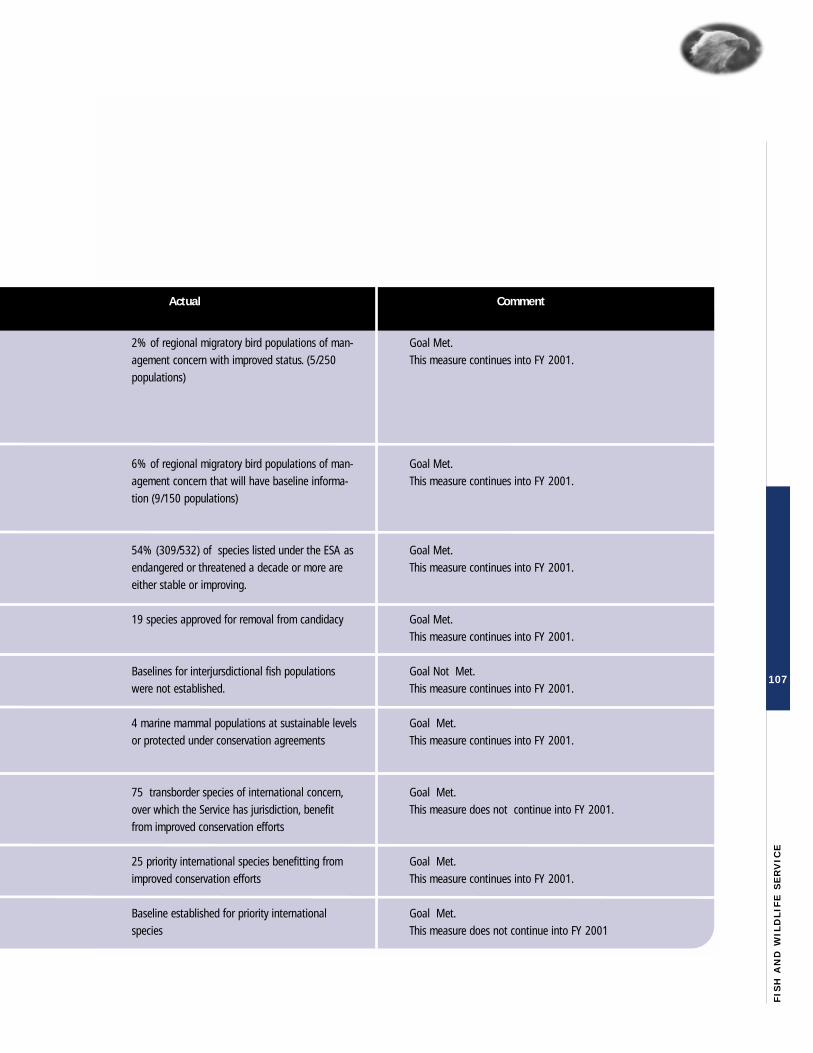
107
FIS
H A
ND
WIL
DL
IFE
SE
RV
ICE
2% of regional migratory bird populations of man-agement concern with improved status. (5/250populations)
6% of regional migratory bird populations of man-agement concern that will have baseline informa-tion (9/150 populations)
54% (309/532) of species listed under the ESA asendangered or threatened a decade or more areeither stable or improving.
19 species approved for removal from candidacy
Baselines for interjursdictional fish populationswere not established.
4 marine mammal populations at sustainable levelsor protected under conservation agreements
75 transborder species of international concern,over which the Service has jurisdiction, benefitfrom improved conservation efforts
25 priority international species benefitting fromimproved conservation efforts
Baseline established for priority internationalspecies
Goal Met.This measure continues into FY 2001.
Goal Met.This measure continues into FY 2001.
Goal Met.This measure continues into FY 2001.
Goal Met.This measure continues into FY 2001.
Goal Not Met.This measure continues into FY 2001.
Goal Met.This measure continues into FY 2001.
Goal Met.This measure does not continue into FY 2001.
Goal Met.This measure continues into FY 2001.
Goal Met.This measure does not continue into FY 2001
Actual Comment

108
AP
P /
AP
R
2 . H A B I T A T C O N S E R V A T I O N O N S E R V I C E L A N D S
2.1.2 By September 30, 2000, complete 80 percent of contaminated cleanupprojects on Service lands. (Goal does not continue into 2001)
2.2.1 By June 30, 2000, a baseline will be established for the FacilitiesCondition Index. (Goal does not continue into 2001)
2.2.2 By, September 30, 2000, 4% of mission critical water management andpublic use facilities will be in fair or good condition as measured by theFacilities Condition Index. (Goal continues into 2001)
2.3.1 By September 30, 2000, improve fish and wildlife populations focusingon trust resources, threatened and endangered species, and species of specialconcern by enhancing and/or restoring or creating 47,860 acres of wetlandshabitat, restoring 103,235 acres of upland habitats, and enhancing and/orrestoring 620 riparian or stream miles of habitat off-Service land through part-nerships and other identified conservation strategies. (Goal continues into2001)
93,883,301 acres managed by the Service
3,270,333 acres enhanced and/or restored inthe National Wildlife Refuge System
17/22=77% of contaminated cleanup projectscompleted on Service lands
Establish a baseline for the Facility ConditionIndex.
a. 406 or 4% of mission critical water man-agement facilities in fair or good conditionb. 172 or 4% of public use facilities in fair orgood condition
47,860 acres of wetlands habitat enhancedand/or restored or created
103,235 acres of upland habitat enhancedand/or restored
620 riparian or stream habitat enhancedand/or restored
FY 2000 Annual Performance Goal Target
At-a-Glance View o f 2000 Per formance ( cont inued)
2.1.1 By September 30, 2000, meet the identified habitat needs of theService lands by ensuring that 93,883,300 acres are protected, of which3,377,260 acres will be enhanced or restored. (Goal does not continue into2001)
2.1.1 Goal target change: For the FY 2000 President‘s Budget, the target acreage to be enhanced or restored was 3,377,260, which included theacreage contribution of the NAWCF. Subsequently, we determined that the NAWCF actual and target acreage was estimated acreage in the approvedNWACF grants. Therefore, we adjusted the enhanced/restored target to reflect only the acreage to be completed by the Division of Refuges. Thus, weexceeded the target, 3,270,333 by 29, 413 acres. The actual acreage enhanced/restored by the NAWCF will be reported at a later date.
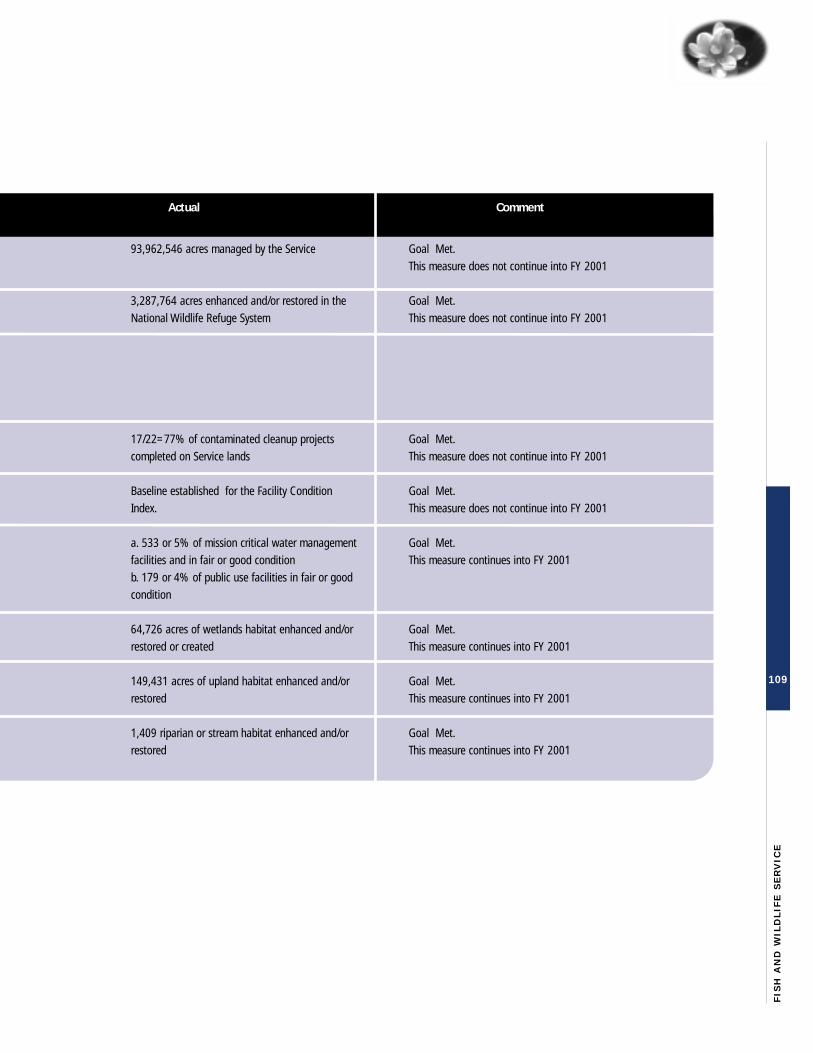
109
FIS
H A
ND
WIL
DL
IFE
SE
RV
ICE
93,962,546 acres managed by the Service
3,287,764 acres enhanced and/or restored in theNational Wildlife Refuge System
17/22=77% of contaminated cleanup projectscompleted on Service lands
Baseline established for the Facility ConditionIndex.
a. 533 or 5% of mission critical water managementfacilities and in fair or good conditionb. 179 or 4% of public use facilities in fair or goodcondition
64,726 acres of wetlands habitat enhanced and/orrestored or created
149,431 acres of upland habitat enhanced and/orrestored
1,409 riparian or stream habitat enhanced and/orrestored
Goal Met.This measure does not continue into FY 2001
Goal Met.This measure does not continue into FY 2001
Goal Met.This measure does not continue into FY 2001
Goal Met.This measure does not continue into FY 2001
Goal Met.This measure continues into FY 2001
Goal Met.This measure continues into FY 2001
Goal Met.This measure continues into FY 2001
Goal Met.This measure continues into FY 2001
Actual Comment
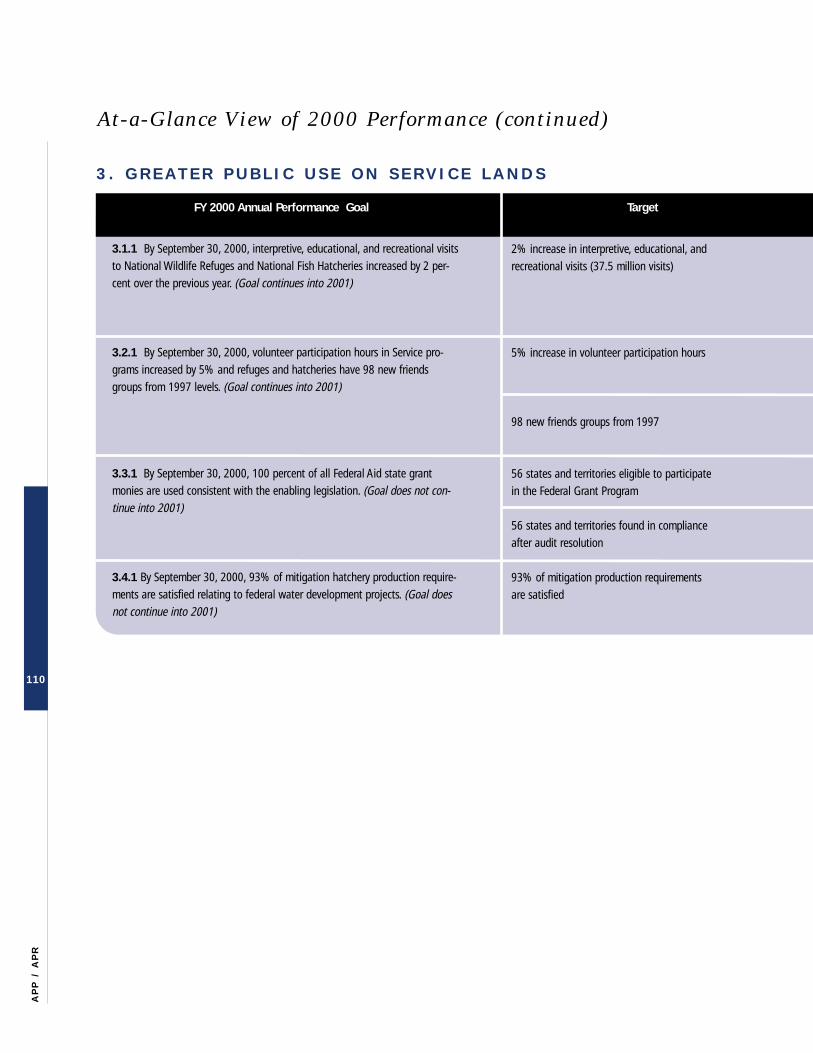
110
AP
P /
AP
R
3 . G R E A T E R P U B L I C U S E O N S E R V I C E L A N D S
3.1.1 By September 30, 2000, interpretive, educational, and recreational visitsto National Wildlife Refuges and National Fish Hatcheries increased by 2 per-cent over the previous year. (Goal continues into 2001)
3.2.1 By September 30, 2000, volunteer participation hours in Service pro-grams increased by 5% and refuges and hatcheries have 98 new friendsgroups from 1997 levels. (Goal continues into 2001)
3.3.1 By September 30, 2000, 100 percent of all Federal Aid state grantmonies are used consistent with the enabling legislation. (Goal does not con-tinue into 2001)
3.4.1 By September 30, 2000, 93% of mitigation hatchery production require-ments are satisfied relating to federal water development projects. (Goal doesnot continue into 2001)
2% increase in interpretive, educational, andrecreational visits (37.5 million visits)
5% increase in volunteer participation hours
98 new friends groups from 1997
56 states and territories eligible to participatein the Federal Grant Program
56 states and territories found in complianceafter audit resolution
93% of mitigation production requirementsare satisfied
FY 2000 Annual Performance Goal Target
At-a-Glance View o f 2000 Per formance ( cont inued)
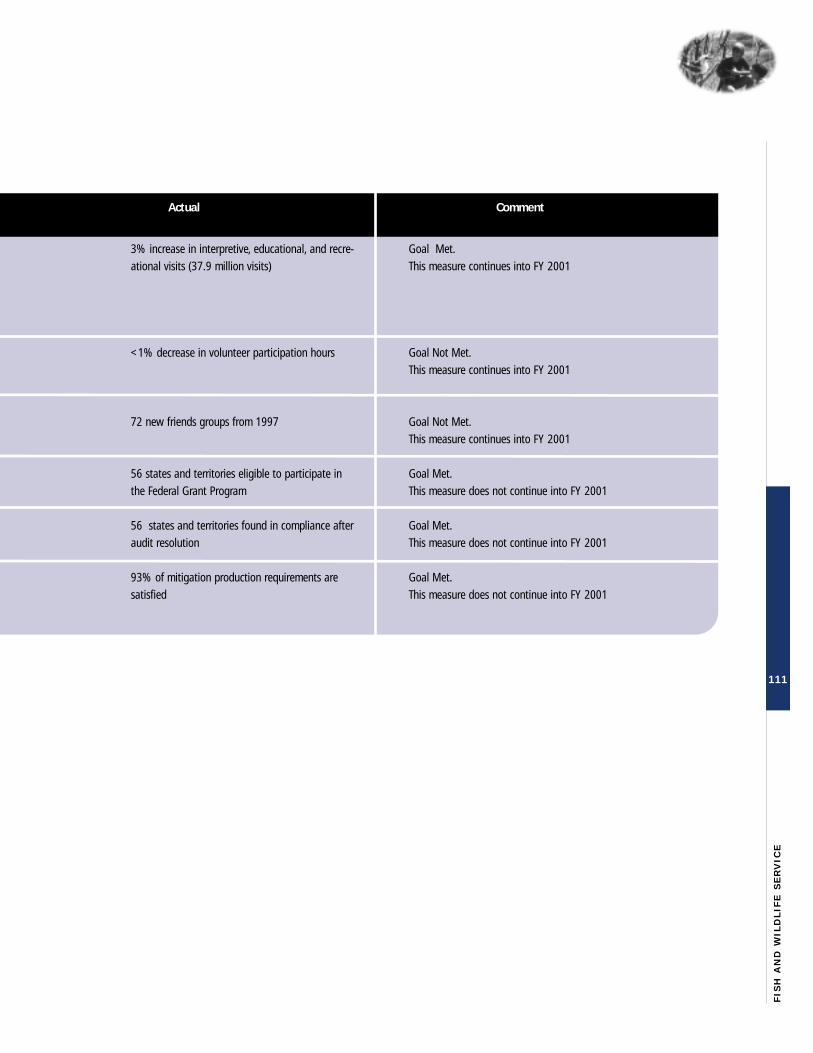
111
FIS
H A
ND
WIL
DL
IFE
SE
RV
ICE
3% increase in interpretive, educational, and recre-ational visits (37.9 million visits)
<1% decrease in volunteer participation hours
72 new friends groups from 1997
56 states and territories eligible to participate inthe Federal Grant Program
56 states and territories found in compliance afteraudit resolution
93% of mitigation production requirements aresatisfied
Goal Met.This measure continues into FY 2001
Goal Not Met.This measure continues into FY 2001
Goal Not Met.This measure continues into FY 2001
Goal Met.This measure does not continue into FY 2001
Goal Met.This measure does not continue into FY 2001
Goal Met.This measure does not continue into FY 2001
Actual Comment

112
AP
P /
AP
R
Appendix II
At-a-Glance View o f FY 2001 Goal s
Long-Term Goal FY 2001 Annual Performance Goal
1.1 By 2005, 12 percent of migratory bird populations demon-strate improvements in their population status. (Goal continuesinto 2002)
1.2 By 2005, 404 species listed under the Endangered Species Actas threatened or endangered a decade or more are either stable orimproving, 15 species are delisted due to recovery, and listing of 12species at risk is made unnecessary due to conservation agree-ments. (Goal continues into 2002)
1.3 By 2005, 12 depressed interjurisdictional native fish popula-tions are restored ro self-sustaining or, where appropriate, har-vestable levels (based on applicable management plans.) (Goalcontinues into 2002)
1.4 By 2005, 3 marine mammal stocks will have current censusesavailable to maintain populations at optimum sustainable levels;harvest guidelines for all marine mammal stocks will be in place,through cooperative management agreements, for continued sub-sistence uses. (Goal continues into 2002)
1.5 By 2005, 40 priority species of international concern will beconserved. (Goal continues into 2002)
1.1.1 By September 30, 2001, 4 percent (10/250) of migratory birdpopulations of management concern demonstrate improvements intheir populations status over the previous year. (Goal continues into2002)
1.1.2 By September 30, 2001, about 9 percent (13/150) of region-al migratory bird populations that are of management concern willhave baseline information available for establishing reliable popula-tion levels, and monitoring programs will be initiated or continuedfor those species. (Goal continues into 2002)
1.2.1 By September 30, 2001, 328 species listed under theEndangered Species Act as threatened or endangered a decade ormore are either stable or improving, 3 species are delisted due torecovery, and listing of 3 species at risk is made unnecessary due toconservation agreements. (Goal continues into 2002)
1.3.1 By September 30, 2001, 2 depressed interjurisdictional nativefish populations are restored ro self-sustaining or, where appropri-ate, harvestable levels (based on applicable management plans.)(Goal continues into 2002)
1.4.1 By September 30, 2001, current censuses for 2 of marinemammal stocks and voluntary harvest guidelines for 2 of marinemammal stocks will be available. (Goal continues into 2002)
1.5.1 By September 30, 2001, 25 species of international concernwill benefit from improved conservation efforts. (Goal continues into2002)
M I S S I O N G O A L I – S U S T A I N A B I L I T Y O F F I S H A N D W I L D L I F EP O P U L A T I O N S *
1.2.1 Goal Change: FY 2001 planned/enacted performance measure targets were adjusted to correct inconsistencies in reported Endangered Species data. These inconsistencies were detected in a recent Office of Inspector General (OIG) audit (July - September 2000).Changes were made based on recommendations by the OIG audit team.
*Based on FY 2001 Enacted Appropriations
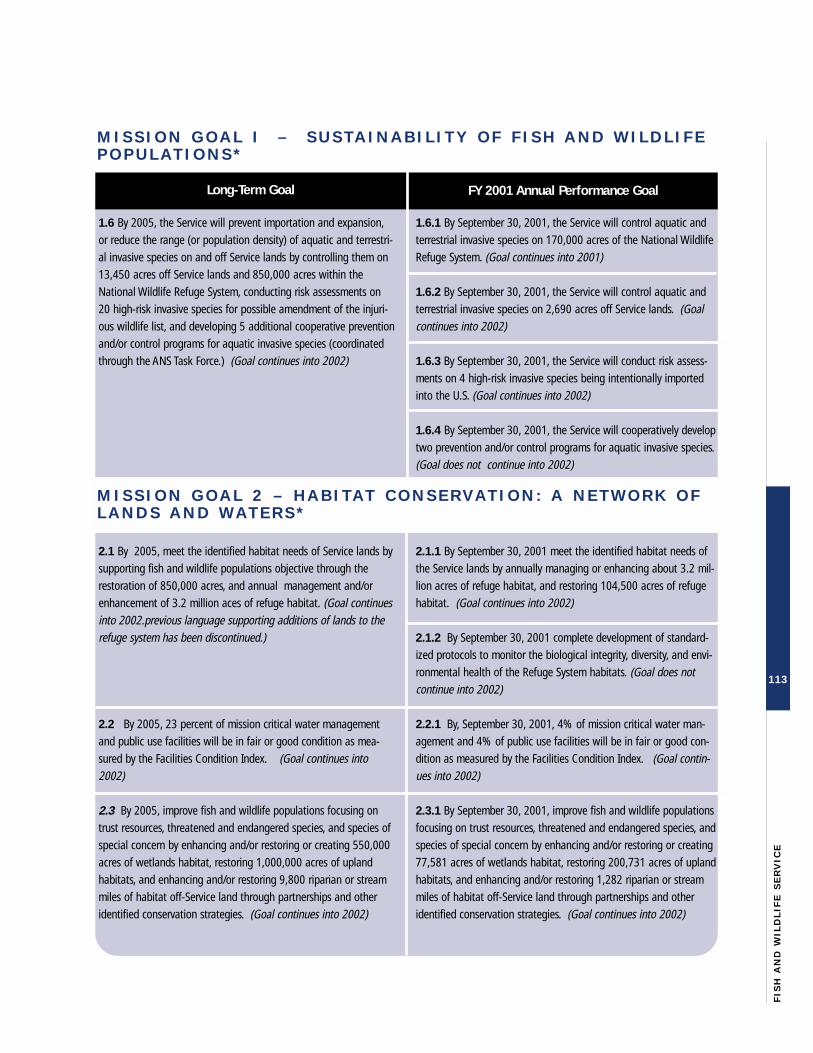
113
FIS
H A
ND
WIL
DL
IFE
SE
RV
ICE
M I S S I O N G O A L I – S U S T A I N A B I L I T Y O F F I S H A N D W I L D L I F EP O P U L A T I O N S *
Long-Term Goal FY 2001 Annual Performance Goal
1.6 By 2005, the Service will prevent importation and expansion,or reduce the range (or population density) of aquatic and terrestri-al invasive species on and off Service lands by controlling them on13,450 acres off Service lands and 850,000 acres within theNational Wildlife Refuge System, conducting risk assessments on20 high-risk invasive species for possible amendment of the injuri-ous wildlife list, and developing 5 additional cooperative preventionand/or control programs for aquatic invasive species (coordinatedthrough the ANS Task Force.) (Goal continues into 2002)
2.1 By 2005, meet the identified habitat needs of Service lands bysupporting fish and wildlife populations objective through therestoration of 850,000 acres, and annual management and/orenhancement of 3.2 million aces of refuge habitat. (Goal continuesinto 2002.previous language supporting additions of lands to therefuge system has been discontinued.)
2.2 By 2005, 23 percent of mission critical water managementand public use facilities will be in fair or good condition as mea-sured by the Facilities Condition Index. (Goal continues into2002)
2.3 By 2005, improve fish and wildlife populations focusing ontrust resources, threatened and endangered species, and species ofspecial concern by enhancing and/or restoring or creating 550,000acres of wetlands habitat, restoring 1,000,000 acres of uplandhabitats, and enhancing and/or restoring 9,800 riparian or streammiles of habitat off-Service land through partnerships and otheridentified conservation strategies. (Goal continues into 2002)
1.6.1 By September 30, 2001, the Service will control aquatic andterrestrial invasive species on 170,000 acres of the National WildlifeRefuge System. (Goal continues into 2001)
1.6.2 By September 30, 2001, the Service will control aquatic andterrestrial invasive species on 2,690 acres off Service lands. (Goalcontinues into 2002)
1.6.3 By September 30, 2001, the Service will conduct risk assess-ments on 4 high-risk invasive species being intentionally importedinto the U.S. (Goal continues into 2002)
1.6.4 By September 30, 2001, the Service will cooperatively developtwo prevention and/or control programs for aquatic invasive species.(Goal does not continue into 2002)
2.1.1 By September 30, 2001 meet the identified habitat needs ofthe Service lands by annually managing or enhancing about 3.2 mil-lion acres of refuge habitat, and restoring 104,500 acres of refugehabitat. (Goal continues into 2002)
2.1.2 By September 30, 2001 complete development of standard-ized protocols to monitor the biological integrity, diversity, and envi-ronmental health of the Refuge System habitats. (Goal does notcontinue into 2002)
2.2.1 By, September 30, 2001, 4% of mission critical water man-agement and 4% of public use facilities will be in fair or good con-dition as measured by the Facilities Condition Index. (Goal contin-ues into 2002)
2.3.1 By September 30, 2001, improve fish and wildlife populationsfocusing on trust resources, threatened and endangered species, andspecies of special concern by enhancing and/or restoring or creating77,581 acres of wetlands habitat, restoring 200,731 acres of uplandhabitats, and enhancing and/or restoring 1,282 riparian or streammiles of habitat off-Service land through partnerships and otheridentified conservation strategies. (Goal continues into 2002)
M I S S I O N G O A L 2 – H A B I T A T C O N S E R V A T I O N : A N E T W O R K O FL A N D S A N D W A T E R S *
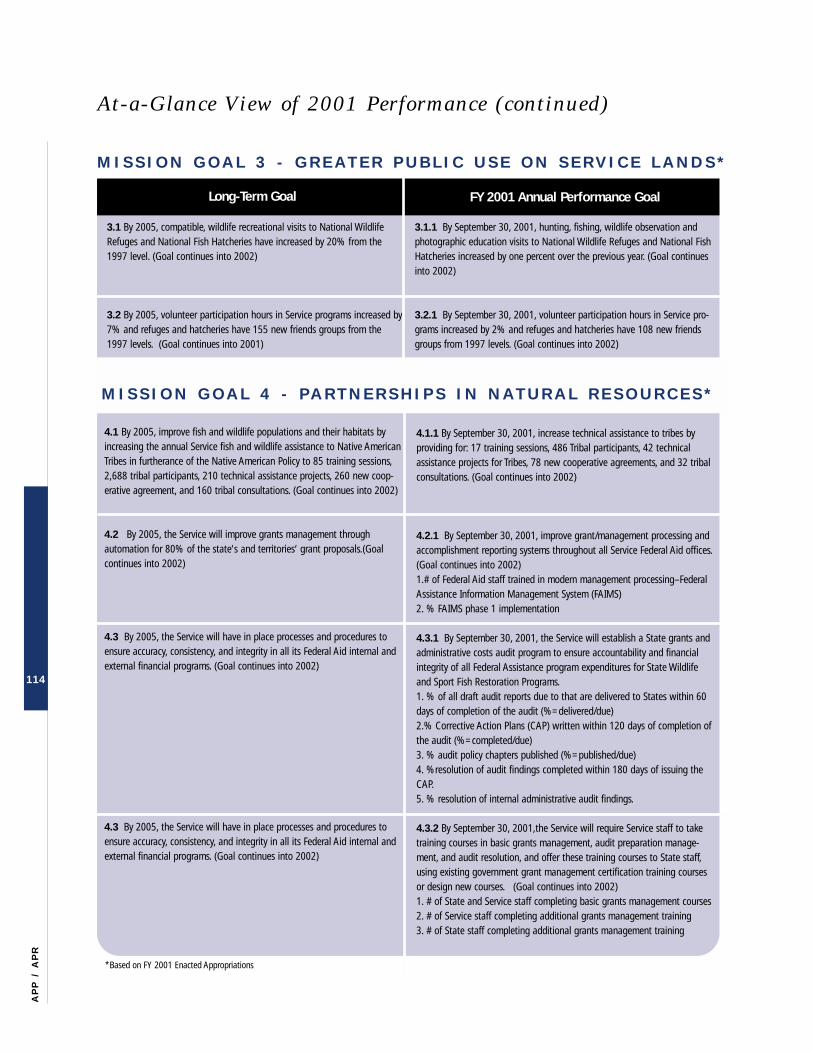
114
AP
P /
AP
R
M I S S I O N G O A L 3 - G R E A T E R P U B L I C U S E O N S E R V I C E L A N D S *
Long-Term Goal FY 2001 Annual Performance Goal
3.1 By 2005, compatible, wildlife recreational visits to National WildlifeRefuges and National Fish Hatcheries have increased by 20% from the1997 level. (Goal continues into 2002)
3.2 By 2005, volunteer participation hours in Service programs increased by7% and refuges and hatcheries have 155 new friends groups from the1997 levels. (Goal continues into 2001)
3.1.1 By September 30, 2001, hunting, fishing, wildlife observation andphotographic education visits to National Wildlife Refuges and National FishHatcheries increased by one percent over the previous year. (Goal continuesinto 2002)
3.2.1 By September 30, 2001, volunteer participation hours in Service pro-grams increased by 2% and refuges and hatcheries have 108 new friendsgroups from 1997 levels. (Goal continues into 2002)
4.1 By 2005, improve fish and wildlife populations and their habitats byincreasing the annual Service fish and wildlife assistance to Native AmericanTribes in furtherance of the Native American Policy to 85 training sessions,2,688 tribal participants, 210 technical assistance projects, 260 new coop-erative agreement, and 160 tribal consultations. (Goal continues into 2002)
4.2 By 2005, the Service will improve grants management throughautomation for 80% of the state‘s and territories‘ grant proposals.(Goalcontinues into 2002)
4.3 By 2005, the Service will have in place processes and procedures toensure accuracy, consistency, and integrity in all its Federal Aid internal andexternal financial programs. (Goal continues into 2002)
4.3 By 2005, the Service will have in place processes and procedures toensure accuracy, consistency, and integrity in all its Federal Aid internal andexternal financial programs. (Goal continues into 2002)
4.1.1 By September 30, 2001, increase technical assistance to tribes byproviding for: 17 training sessions, 486 Tribal participants, 42 technicalassistance projects for Tribes, 78 new cooperative agreements, and 32 tribalconsultations. (Goal continues into 2002)
4.2.1 By September 30, 2001, improve grant/management processing andaccomplishment reporting systems throughout all Service Federal Aid offices.(Goal continues into 2002)1.# of Federal Aid staff trained in modern management processing–FederalAssistance Information Management System (FAIMS)2. % FAIMS phase 1 implementation
4.3.1 By September 30, 2001, the Service will establish a State grants andadministrative costs audit program to ensure accountability and financialintegrity of all Federal Assistance program expenditures for State Wildlifeand Sport Fish Restoration Programs.1. % of all draft audit reports due to that are delivered to States within 60days of completion of the audit (%=delivered/due)2.% Corrective Action Plans (CAP) written within 120 days of completion ofthe audit (%=completed/due)3. % audit policy chapters published (%=published/due)4. %resolution of audit findings completed within 180 days of issuing theCAP.5. % resolution of internal administrative audit findings.
4.3.2 By September 30, 2001,the Service will require Service staff to taketraining courses in basic grants management, audit preparation manage-ment, and audit resolution, and offer these training courses to State staff,using existing government grant management certification training coursesor design new courses. (Goal continues into 2002)1. # of State and Service staff completing basic grants management courses2. # of Service staff completing additional grants management training3. # of State staff completing additional grants management training
At-a-Glance View o f 2001 Per formance ( cont inued)
M I S S I O N G O A L 4 - P A R T N E R S H I P S I N N A T U R A L R E S O U R C E S *
*Based on FY 2001 Enacted Appropriations

115
FIS
H A
ND
WIL
DL
IFE
SE
RV
ICE
Appendix III
FY 2002 Annual Per formance Goal s /Measure s Terms
( inc lude s s t ra teg i c goa l number s )
AAdequate Population Information: Information on
the status or trends of bird populations or habitats,
gathered over a period of years, that has sufficient
credibil ity to serve as a basis for undertaking manage-
ment actions. [1.1]
Approved for removal (candidate species): A can-
didate removal form that has been signed by the
Director. [1.2]
Approved for removal (proposed species): A
notice of withdrawal of the proposed l isting rule has
been published in the Federal Register. [1.2]
Approved management plan: A plan approved by
the responsible management authority. [1.3]
BBaseline Monitoring Programs: Long-term surveys
designed to provide information on population status
and trends of migratory birds. [1.1]
CConservation Plan: A document that identif ies issues
associated with a migratory bird species or population,
or a group of species or populations, in a defined geo-
graphic area, and l ists the strategies and tasks that
must be accomplished to resolve the issues. [1.1]
Candidate: Species for which the Service has suffi-
cient information on biological vulnerabil ity and threats
to propose them for l isting and which has been
approved by the Director for adding to the Service‘s
Candidate l ist. [1.2]
Candidate Conservation Agreements: Formal
agreements between the Service and one or more par-
ties to address the conservation needs of proposed or
candidate species or other nonlisted species before they
become listed as endangered or threatened.
Participants voluntari ly commit to implementing specific
actions that wil l remove or reduce the threats to these
species. [1.2]
Conservation Agreements: Agreements entered into
between the Service (on behalf of the U.S. Government)
and Alaska Native Organizations and/or state and for-
eign governments which describe methods of enhancing
conservation efforts of a marine mammal stock, outline
responsibil it ies of each party in achieving stated goals,
and define l imitations of the agreement with respect to
existing governmental and tribal legislation.
Conservation agreements may be used to achieve reduc-
tions in human-caused mortality of marine mammals or
to protect special areas (crit ical habitats) such as
breeding, resting, and feeding areas from unnecessary
human disturbance. [1.4]
Conserve (Species): To use all methods and proce-
dures necessary to bring any species of international
concern to the point at which such methods and proce-
dures are no longer necessary. Such methods and proce-
dures include but are not l imited to all activit ies associ-
ated with scientif ic resources management such as
research, census, law enforcement, habitat acquisit ion
and maintenance. [1.5]
Conservation (Habitat): The management of natural
resources to prevent loss or waste. Management
actions may include preservation, restoration, and
enhancement. [2.1]

DDepressed interjurisdictional fish population: A
population that is below its management goal as speci-
fied in an approved management plan. [1.3]
Deferred Maintenance Cost: The total cost to repair
maintenance deficiencies identif ied in the Maintenance
Management System. These costs may be aggregated at
either the individual property level, at the field station
level, or in other combinations. [2.2]
Deferred Maintenance: Maintenance that was not
completed on schedule. [2.2]
Delist: A process for removing a l isted species from
the l ists of threatened and endangered species due to
recovery, extinction, change in taxonomy, or new infor-
mation. Delisting requires a formal rulemaking proce-
dure, including publication in the Federal Register. [1.2]
Downlist: A process for changing a species‘ status
from endangered to threatened due to a reduction in
threats or improved status of the species. Downlisting
requires a formal rulemaking procedure, including publi-
cation in the Federal Register. [1.2]
EEndangered: In danger of extinction throughout all or
a significant portion of its range. [1.2]
Enhanced: Areas where the quality of the habitat,
which were previously destroyed, converted, or degrad-
ed (in whole or in part), has been improved for one or
more species. Enhancement generally refers to an effort
of lower intensity than restoration. [1.2]
Enhancement: The act of heightening or intensifying
qualit ies, powers, values etc.; improve something
already of good quality. [2.1]
FFacility Condition Index (FCI): The ratio of accumu-
lated deferred maintenance to the current replacement
value as measured by the Maintenance Management
System database and the Real Property Inventory. A
ratio of less than 5% indicates a ”good” condition, a
ratio between 5% and 10% indicates a ”fair” condition,
and a ratio greater than 10% indicates a ”poor” condi-
tion. FCI is an indicator of the depleted value of a
bureau‘s constructed assets. In other words, the FCI
i l lustrates the percentage of capital amount that a
bureau would have to spend to eliminate the deferred
maintenance. [2.2]
Facility: An individual item or group of similar items of
real property valued at $5,000 or more and documented
in the Real Property Inventory. [2.2]
Field Station: An individual unit of the National
Wildlife Refuge System, the National Fish Hatchery
System, or other field unit managed by the U.S. Fish and
Wildlife Service. [2.2]
Final Rule: A rule published in the Federal Register
finalizing a previously proposed change in status of a
species (l ist, delist, or downlist). [1.2]
G: NONE
HHabitat Conservation Planning (HCP): Authorized
in section 10(a)(1)(B) of the Endangered Species Act of
1973, as amended, the Habitat Conservation Planning
process provided species protection and habitat conser-
vation within the context of non-federal development
and land use activit ies. Through development of a HCP,
private landowners minimize and mitigate, to the maxi-
mum extent practicable, the incidental take of l isted
species associated with their actions (proposed, candi-
date species, and other non-listed species may also be
included if requested by the applicant). In return, the
Service issues an incidental take permit as long as the
action wil l not ”appreciably reduce the l ikelihood of the
survival and recovery of the species in the wild.” HCPs
also provide a process that promotes negotiated solu-
tions to endangered species confl icts while furthering
conservation of l isted and non-listed species. [1.2]
Habitat Enhancement: Improving habitat through
alteration, treatment, or other land management of
existing habitat to increase habitat value for one or
more species without bringing the habitat to a fully
116
AP
P /
AP
R
restored or naturally occurring condition. [2.1]
Habitat Restoration: Returning the quantity and
quality of habitat to some previous condition, often,
some desirable historic baseline considered suitable and
sufficient to support healthy and self-sustaining popula-
tions of f ish and wildlife. [2.1]
IImproved: Species whose numbers have increased
since the last assessment and/or whose threats to their
continued existence have lessened since the last assess-
ment. This includes species that have reached stabil ity
following the last assessment. [1.2]
Interjurisdictional: Jointly managed by two or more
states or national or tribal governments because of the
scope of a population‘s geographic distribution or
migration. [1.3]
Interjurisdictional fish population: [1.3]
(a) A management unit, specified in an approved man-
agement plan, that at a minimum, consists of a
reproductively isolated interjurisdictional f ish stock.
(b) Populations that are managed by two or more
states, nations, or native American tribal govern-
ments because of geographic distribution or migrato-
ry patterns of those populations.
Instream: Waters within the confined width and depth
of a flowing watercourse; at or below bank-full condi-
tions; flows are not impeded by over-bank obstructions
or flood plain vegetation. [2.3]
Instream Restoration: The manipulation of the physi-
cal, chemical, or biological characteristics of a site with
the goal of returning full functions to former or degrad-
ed instream aquatic habitats. Example: Returning mean-
ders and sustainable profi le to a channelized stream.
[2.3]
Instream Enhancement : The manipulation of the
physical, chemical, or biological characteristics of an
instream aquatic site (undisturbed or degraded) to
change specific function(s) present. Example: Placement
of structures in a stream channel to increase habitat
diversity - spawning logs, lunker structures, etc. [2.3]
Interpretive, educational, and recreational visits:
Such visits include the six primary (wildlife dependent)
uses for refuges: wildlife photography, fishing, hunting,
wildlife observation, environmental education, and
interpretation. [3.1]
Invasive species: An alien species whose introduction
does or is l ikely to cause economic or environmental
harm or harm to human health. [1.6]
JJoint Ventures: Federal, state and local governments,
corporations and small business, hunters and environ-
mentalists, and communities and private landowners
working together to make a difference. [2.1]
K: NONE
LListed: Listed as threatened or endangered under the
ESA. [1.2]
MManagement Action: An activity directed specifically
at a target population or habitat and which is designed
to bring about a desired change in the status of that
population or habitat. [1.1]
Migratory Bird: Any of the more than 830 species of
birds protected by the Migratory Bird Treaty Act, as l ist-
ed in 50 CFR 10.12. [1.1]
Migratory Species: Species that move substantial dis-
tances to satisfy one or more biological needs, most
often to reproduce or escape intolerable cyclic environ-
mental conditions. [1.1]
Monitoring: The systematic and comprehensive gather-
ing of data to track trends in bird habitats or popula-
tions. [1.1]
Marine Mammal: Any mammal which: (a) is morpho-
logically adapted to the marine environment (including
117
FIS
H A
ND
WIL
DL
IFE
SE
RV
ICE

sea otters and members of the orders: Sirenia,
Pinnepedia, and Cetacea), or (b) primarily inhabits the
marine environment (such as the polar bear); and,
includes any part of any such marine mammal, including
its raw, dressed, or dyed fur or skin. For the purposes
of the FWS, marine mammals are: Northern sea otters,
Pacific walrus, polar bears, and manatees. [1.4]
Management: The process of organizing or regulating.
[2.1]
Mission Critical Water Management Facility: Any
water management facil ity under maintenance codes in
the 400 series as documented in the Real Property
Inventory and not slated for disposal or demolition.
Non-crit ical property items that are excess to program
needs wil l be slated for disposal or demolition and will
not be included in calculations of facil ity condition
indices. [2.2]
Mission Critical Public Use Facility: Any public use
facil ity under maintenance codes identif ied below as
documented in the Real Property Inventory and not slat-
ed for disposal or demolition. Non-crit ical property
items that are excess to program needs wil l be slated
for disposal or demolition and will not be included in
calculations of facil ity condition indices. [2.2]
101 Office Buildings
102 Visitor Centers
320 Public Use Paved Roads
322 Paved Parking Areas
323 Other Parking Areas
324 Public Use Gravel Roads
328 Public Use (Foot) Trails/Boardwalks
329 Service Owned Vehicle Bridges
556 Signs
557 Historical Structures
558 Boat Launching Ramps
559 Beaches
NNational Wildlife Refuge System: Consists of
National Wildlife, Waterfowl Production Areas, and
Coordination Areas as l isted in the Division of Realty‘s
Annual Report of Lands Under the Control of the U.S.
Fish and Wildlife Service. [2.1]
Native Species: With respect to a particular ecosys-
tem, a species that, other than as a result of an intro-
duction, has always been there or arrived via ”non-man
caused” introduction (natural migration) [1.3]
Nonlisted: For purposes of GPRA reporting only, non-
listed (sometimes referred to as ”unlisted”) species are
defined as those species that do not have official
Endangered Species Program status (species that are
not endangered, threatened, proposed, or candidate
species). For purposes other than GPRA reporting, non-
listed species generally include proposed and candidate
species. [1.2]
OOverabundant Population: A migratory bird popula-
tion near to or exceeding the ecological or social carry-
ing capacity of its habitat, and thus causing biological,
social, or economic problems. [1.1]
PPopulation Monitoring: Assessments of the charac-
teristics of populations to ascertain their status and
establish trends related to their abundance, condition,
distribution, or other characteristics. [1.1]
Population: A group of marine mammals of the same
species or smaller taxa in a common spatial arrange-
ment that interbreed when mature. [1.4]
Populations of Management Concern: Those popu-
lations of migratory birds for which management
actions are need to prevent further population declines,
or other problems (such as overabundance) that may
lead to additional biological, social, or economic prob-
lems. Species can be identif ied through a variety of
surveys conducted by both the Service and other agen-
cies. Nongame species of management concern have
been identif ied primarily through the breeding bird sur-
vey that is managed by the Biological Research Division
of the USGS. [1.1]
Proposed: Species for which a proposed l isting rule
has been published in the Federal Register. [1.2]
Proposed rule: A rule published in the Federal
118
AP
P /
AP
R

Register proposing a change in status of a species (l ist,
delist, or downlist). [1.2]
Precluded from listing under ESA: Not resulting in
a l isting as threatened or endangered. [1.2]
Protected: Habitat where one or more threats have
been removed or reduced through acquisit ion, ease-
ment, dedication, deed restriction, or some other means
of protection (may include areas that are restored
and/or enhanced). [1.2]
Protected: Once a population is identif ied as a
”Strategic Stock” or ”Depleted,” which (a) is a marine
mammal stock for which the level of direct human-
caused mortality exceeds the potential biological
removal; (b) has been identif ied as declining and is l ike-
ly to be l isted as a threatened species under the
Endangered Species Act of 1973 (ESA) within the fore-
seeable future; or (c) which is already l isted as a threat-
ened or endangered species under the ESA, or is desig-
nated as depleted under this Act, the FWS can regulate
human caused mortality. [1.4]
Protection: The act of keeping safe, defending, or
guarding. [2.1]
Q: NONE
RRegional Migratory Bird Populations of
Management Concern: A population delimited by
ecological or administrative boundaries of varying scales
(e.g., physiographic regions, watersheds, states, and
Flyways) and which represents a recognizable unit for
management actions or for estimating status or trends.
Breeding Bird Surveys are the primary source for this
information that is available from the Biological
Research Division of the USGS. [1.1]
Restored: Areas where the quality of the habitat, pre-
viously destroyed, converted, or degraded (in whole or
in part), has been improved for one or more species.
Restoration generally refers to an effort of higher inten-
sity than enhancement. [1.2]
Restored Habitat: Returned to a previous, normal
condition or use as defined in an approved management
plan. [1.3]
Restoration Population: The act of bringing back or
attempting to bring back to the original state by
rebuilding, repairing, etc. [2.1]
Note: The word restoration includes both reestablish-
ment and rehabil itation.
Reestablishment: The act of establishing again.
Rehabilitation: The act of restoring effectiveness.
Replacement Value: The estimated cost to completely
replace an item of real property as identif ied in the Real
Property Inventory. [2.2]
Riparian: A landscape position - lands contiguous to
perennial or intermittent streams, channels and rivers.
Riparian areas may include upland, wetland, and ripari-
an plant communities. Riparian plant communities are
affected by surface or subsurface hydrology of the adja-
cent water source. Riparian plant communities have
one or both of the following characteristics: 1) distinc-
tively different vegetative species than adjacent area,
and 2) species similar to adjacent areas but exhibiting
more vigorous or robust growth forms. [2.3]
Riparian Enhancement: The manipulation of the phys-
ical, chemical, or biological characteristics of a riparian
site (undisturbed or degraded) to change specific func-
tion(s) or the seral stage present. Example: cutting or
shearing existing native woody riparian vegetation to
stimulate rapid growth of an earl ier, successional plant
community for the benefit of a particular federal trust
species. [2.3]
Riparian Restoration: The manipulation of the physi-
cal, chemical, or biological characteristics of a site with
the goal of returning full functions to former or degrad-
ed native riparian habitat.
Example: Removal of invasive plant species to allow
reestablishment of original native plant community;
fencing a riparian area to exclude l ivestock to allow
native riparian vegetation to reestablish; replanting
native vegetation into crop land to reestablish l ikely
119
FIS
H A
ND
WIL
DL
IFE
SE
RV
ICE
original riparian plant community. [2.3]
SSpecies: Includes any subspecies of f ish or wildlife or
plants, and any distinct population segment of any
species of vertebrate fish or wildlife which interbreeds
when mature. [1.2]
Species populations: Species, subspecies, or distinct
population segments (see ”Species” definition). [1.2]
Sustainable population level: With respect to any
population, the number of animals which wil l result in
the maximum productivity of the population or the
species, keeping in mind the carrying capacity of the
habitat and health of the ecosystem of which they form
a constituent element. [1.4]
Species of International Concern: Those species
covered under an international mandate or protocol of
priority interest to the American people that are in need
of conservation efforts. [1.5]
Service Lands: Those lands and holdings identif ied in
the Division of Realty‘s Annual Report of Lands under
the control of the U.S. Fish and Wildlife Service. These
lands consist of the National Wildlife Refuge System,
National Fish Hatchery System, and administrative sites.
This report is published annually and l ists by category
all the holdings of the U.S. Fish and Wildlife Service as
of September 30 of a given year. [2.1]
Stabilized: Species whose numbers have remained rel-
atively stable since the previous assessment and whose
threats have remained relatively constant in the wild
since the last assessment. [1.2]
Support Groups: Support groups are any groups that
are formed for the purpose of supporting the refuge or
hatchery established through a written document signed
by the project leader. Support groups can include
friends groups, Audubon Refuge Keeper Groups, and
cooperating and sponsoring groups. [3.2]
TTechnical Assistance: Service-provided expertise and
programmatic information to tribal representatives to
facil itate the development, enhancement, and manage-
ment of tribal natural resources.[4.1.]
Threatened: Likely to become endangered within the
foreseeable future throughout all or a significant por-
tion of its range. [1.2]
UUpland: Land or an area of land lying above the level
where water f lows or where flooding occurs. [2.3]
Upland Restoration: The manipulation of the physi-
cal, chemical, or biological characteristics of a site with
the goal of returning full functions to former or degrad-
ed native upland plant communities. Example: Planting
native vegetation into crop land to reestablish l ikely
original plant community [2.3]
Upland Enhancement: The manipulation of the physi-
cal, chemical, or biological characteristics of an upland
site (undisturbed or degraded) to change specific func-
tion(s) or the seral stage present.
Example: Implementing grazing management to improve
quality of existing native rangeland. [2.3]
VVolunteers: Volunteers include individuals or groups,
providing not-for-fee services to a refuge or hatchery to
assist with the accomplishment of the Service ‘s goals
and objectives. Volunteers can include individuals oper-
ating under an individual agreement or organized
groups such as scouts, church, or youth groups, and cor-
porate groups, as long as the group operates under a
signed agreement. Others volunteers may include com-
munity service workers, detention center or other similar
types work crews (agreements with the agency), clubs
and other partners, and the friends group. [3.2]
WWetland: From Cowardin et al. 1979. Classif ication of
Wetlands and Deepwater Habitats of the United States.
- ”Wetlands are lands transitional between terrestrial
and aquatic systems where the water table is usually at
or near the surface or the land is covered by shallow
water. For purposes of this classif ication, wetlands
120
AP
P /
AP
R

must have one or more of the following three attribut-
es: (1) at least periodically the land supports predomi-
nantly hydrophytes; (2) the substrate is predominantly
undrained hydric soils; and (3) the substrate is nonsoil
and is saturated with water or covered by shallow water
at some time during the growing season of each year.”
By definition wetlands include areas meeting specific
criteria included in the 1987 Corps of Engineers
Wetlands Delineation Manual, as well as in the USDA -
NRCS‘s National Food Security Act Manual. [2.3]
Wetland Restoration: The manipulation of the physi-
cal, chemical, or biological characteristics of a site with
the goal of returning full functions to former or degrad-
ed wetland. For the purpose of tracking net-gains in
wetland acres, restoration is divided into: [2.3]
Wetland Re-establishment: The manipulation of
the physical, chemical, or biological characteristics of
a site with the goal of returning full functions to for-
mer wetland. Re-establishment results in a gain in
wetland acres. [2.3]
Former Wetland: An area that once was wetland
but has been modified to the point it no longer
meets the technical criteria for wetlands. The area is
considered to be upland. Former wetlands include by
definition Prior Converted Croplands (PC). In addi-
tion, formerly vegetated shallow coastal open water
areas are also considered to be ”former wetlands”.
When they were converted from wetland marshes to
open water areas the conversion was considered to
result in a loss of wetland acreage both by the FWS
Wetlands Status and Trends criteria and NRCS ‘s
National Resources Inventory. [2.3]
Wetland Rehabilitation: The manipulation of the
physical, chemical, or biological characteristics of a
site with the goal of returning full functions to
degraded wetland. Rehabil itation results in a gain in
wetland function but does not result in a gain in
wetland acres. [2.3]
Degraded Wetland: A wetland with one or more
functions reduced, impaired, or damaged due to
human activity. When determining whether or not a
wetland is degraded, consider: physical alteration,
including the conversion of a wetland from one sys-
tem (e.g., estuarine or marine) to a different system;
chemical contamination; and biological alteration,
including the significant presence of non-indigenous
invasive species. [2.3]
Wetland Establishment: The manipulation of the
physical, chemical, or biological characteristics pre-
sent to support and maintain a wetland that did not
previously exist on the site. Establishment results in
a gain in wetland acres. [2.3]
Wetland Enhancement: The manipulation of the
physical, chemical, or biological characteristics of a
wetland (undisturbed or degraded) site to change
specific function(s) or the seral stage present.
Enhancement results in a change in wetland func-
tion(s), but does not result in a gain in wetland
acres. [2.3]
X, Y, & Z: NONE
121
FIS
H A
ND
WIL
DL
IFE
SE
RV
ICE

122
AP
P /
AP
R
Goal Category , this optional classif ication exits only
to provide a common way of grouping the majoy themes
of an organization.
Mission Goal is a classif ication identifying outcome
oriented goals that define how an organization wil l
carry out its mission.
Long-Term Goals are the “general performance goals
and objectives” identif ied in the Government
Performance and Results Act. They define the intended
result, effect, or consequence for what the organization
does. They provide a measurable indication of future
success by providing target levels of performance and a
time frame for accomplishment. Long-term goals should
focus on outcomes rather than outputs (products and
services).
Annual Goal is a one-year increment of the long-term
goal. It contains a targeted level of performance to be
achieved for a particular year. It is to be expressed in
an objective, quantif iable, and measurable form. OMB
approval of an alternative form of evaluating the suc-
cess of a program is required if the annual goal cannot
be expressed in an objective or quantif iable manner.
GPRA Program Activity is described as the consolida-
tion, aggregation or disaggregation of program activi-
ties that are covered or described by a set of perfor-
mance goals, provided that any aggregation or consoli-
dation does not omit or minimize the significance of
any program constituting a major agency function or
operation.
Index o f Common GPRA Terms

For Further Information Contact:
Planning and Evaluation Staff
U.S. Fish and Wildlife Service
1849 C Street, NW
Washington, D.C. 20240
Email: [email protected]
Website: http://www.fws.gov/r9gpra

DEPARTMENT OF THE INTERIOR