fiscal year 2013 umuc fact book · fiscal year 2013 umuc fact book. table of contents student data...
TRANSCRIPT
UNIVERSITY OF MARYLANDUNIVERSITY COLLEGE
FISCAL YEAR 2013 FACT BOOK
Prepared by:
Office of Institutional Research

PREFACE
The University of Maryland University College Fact Book offers a
comprehensive source of information from the Office of Institutional Research. It
includes data for the 2013 fiscal year (July 1, 2012 through June 30, 2013). Our
goal is to provide a clear and effective analysis of the University’s data resources to
key decision makers. We hope that the Fact Book will serve as a valuable tool for
users to improve and promote the University. Any comments or suggestions you
may have for our next issue are welcome.
Please visit us on the Web at www.umuc.edu/ip when you need UMUC
statistics at the click of a button. There you can find the most current student and
distance education information.
Denise NadasenAssociate Vice President, Institutional ResearchUniversity of Maryland, University College2013
Please note, while the Fact Book is a reliable reference, external requests for data must be forwarded to the Office of Institutional Research. Please contact us if you have questions or require further information concerning UMUC.
Fiscal Year 2013 UMUC Fact Book
TABLE OF CONTENTS
Student DataFiscal Year Unduplicated Headcount, Stateside and Overseas, Fiscal Years (FY) 1948 - 2013 (graph) ………… 2Worldwide Unduplicated Headcount, FY 1948 - 2013 …………...……………………………………………… 3Map of UMUC Sites in Maryland, Virginia and the District of Columbia …………………...…………………… 4UMUC Stateside Student Employment Status (graph) …………………………………………………………… 4
Full-Time Equivalent Students (FTES)FY 1976 - 2013 Worldwide FTES ……………………………………...………..………………………………… 6FY 2006 - 2013 Worldwide FTES, by Division, by Level ………………………..………..……………………… 7
DegreesTotal Worldwide Degrees Awarded, by Degree Level ……………………...……...……………………………… 9Fiscal Year Worldwide Degrees Awarded (graph) ………………………………………………………………… 9FY 2006 - 2013 Worldwide Undergraduate-level Degrees Awarded, by Degree Level, by Division …………...… 10FY 2006- 2013 Worldwide Graduate-level Degrees Awarded, by Degree Level, by Division …………...……… 11FY 2013 Stateside Degrees Awarded, Ethnic Category, by Degree Level ……………………………………..… 12
FinanceFall 1988 - 2013 Stateside In-State Tuition and Mandatory Fees ………………………………...……………… 14
Distance EducationWorldwide Online Course Enrollments, FY 1995 - 2013 by Division …………………………………….……… 16Worldwide Online Course Enrollments, FY 1995 - 2013 by Division (graph) …………………………………… 16FY 2013 Worldwide Online and Total Student Headcounts ………………………………………...………….. 17Stateside Online Courses, Sections and Enrollments FY 1998 - 2013…………………………………..………… 18
Page
Fiscal Year 2013 UMUC Fact Book
Asian Division: The Asian Division consists of the sites administrated by the AD headquarters in Tokyo, Japan.
Credit Hours: Credit hours refers to the total credit hours of instruction for all classes enrolled by a student, or group of students, during a given time frame (i.e. one semester, fiscal year).
Enrollments/Registrations: Enrollments refers to the number of classes in which a student is registered. A student registered for more than one class will be counted as the corresponding number of enrollments. For example, if one student is taking two classes that student is counted as two enrollments.
European Division: The European Division consists of the sites administrated by the ED headquarters in Heidelberg, Germany.
Fiscal Year (FY): The semesters represented in a fiscal year consist of the summer and fall of one calendar year and the spring of the subsequent calendar year. For example, the summer and fall of 2003 and the spring of 2004 comprise the individual semesters of fiscal year 2004 (denoted FY04).
Full-Time Equivalent Students (FTES): please see next page – “FTES Explained”
Full-Time/Part-Time Student: Full-time status is based on 12 credit hours of enrollment for undergraduates and 9 credit hours for graduate students per semester.
Headcount: Headcount refers to the unduplicated count of students enrolled for one or more classes, within the same level (undergraduate or graduate), during the time period stated. Unduplicated means that a student is only counted once, at the undergraduate or graduate level, regardless of the number of classes taken or the number of sites at which the classes are located. Unduplicated headcount is the most frequently used term for reporting student data. Students will be counted only once as an undergraduate or once as a graduate.
GLOSSARY OF TERMS
Fiscal Year 2013 UMUC Fact Book

Full-Time Equivalent Students (FTES): FTES is a mathematical concept which attempts to provide a standardization tool for comparing universities with differing percentages of full-time and part-time students. The objective is to provide a theoretical number of full-time students based on the total number of credit hours enrolled in by all students, full-time and part-time, for a given fiscal year.
FTES for the various student levels are calculated using total fiscal year credit hours at specified levels divided by credit hour totals specific to that level. The student levels used are:
The final fiscal year FTES is the sum of the undergraduate FTES and the graduate FTES. This is represented as follows:
Total fiscal year UG credit hours30
Total fiscal year GR I credit hours24
Total fiscal year GR II credit hours20
Total fiscal year GR III credit hours18
Total fiscal year FTES = Undergraduate FTES + Graduate I FTES + Graduate II FTES+ Graduate III FTES
FTES Explained
Undergraduate FTES =
Graduate I FTES =
Graduate II FTES =
Graduate III FTES =
Undergraduate: Standard undergraduate-level courses, ranging from the 0- to the 400-level (e.g. MATH001, PSYC115, ACCT220, BMGT302, COMM424).
Graduate III: Doctoral research credits taken by doctoral students.
Graduate II: Graduate-level class credits taken by doctoral students.
Graduate I: All other graduate-level class credits
Fiscal Year 2013 UMUC Fact Book
FY 2013 Fact Book
Fiscal Year 2013 UMUC Fact Book

Students
Fiscal Year 2013 UMUC Fact Book
0
20,000
40,000
60,000
80,000
100,000
FY
194
8
FY
195
0
FY
196
0
FY
197
0
FY
198
0
FY
199
0
FY
200
0
FY
200
9
FY
201
3
Stateside Overseas
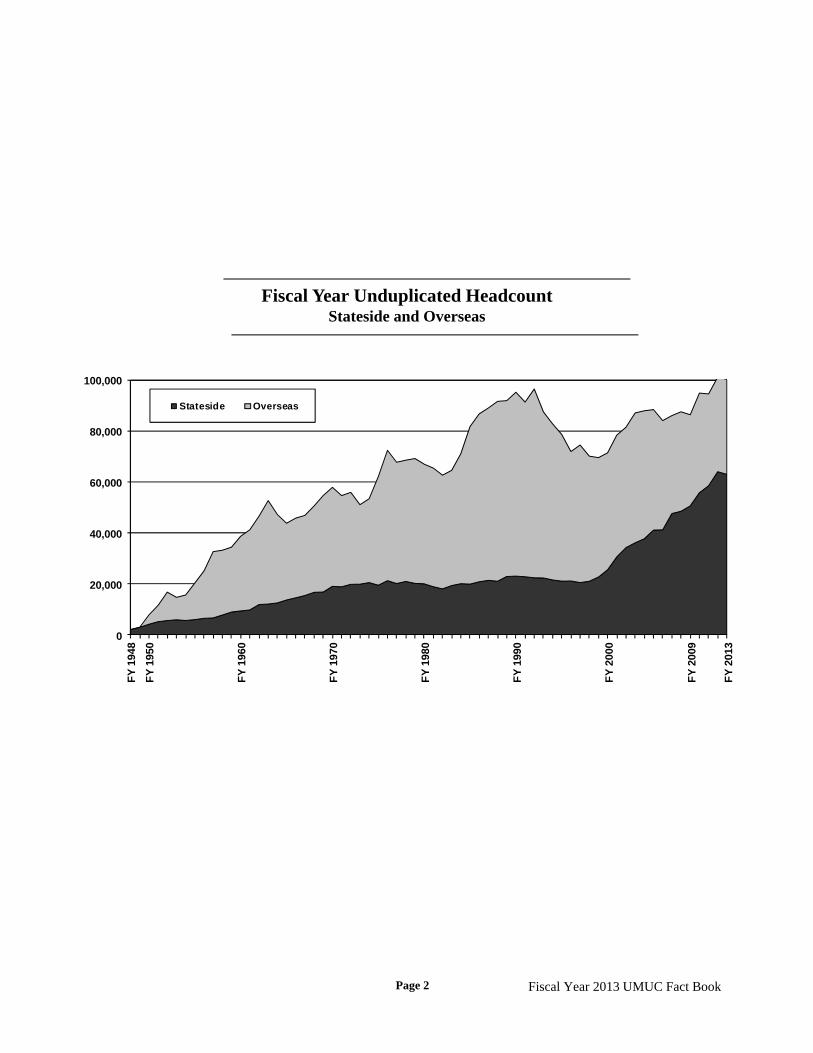
Fiscal Year Unduplicated HeadcountStateside and Overseas
Page 2 Fiscal Year 2013 UMUC Fact Book

*Notes: Marginal duplication was reported in worldwide total prior to FY10.Source: Office of Institutional Research
Year YearFY48 2,142 0 2,142 FY48FY50 4,234 3,696 7,930 FY50FY55 6,070 14,329 20,399 FY55FY60 9,457 29,351 38,808 FY60FY61 9,860 31,478 41,338 FY61FY62 11,979 34,691 46,670 FY62FY63 12,163 40,627 52,790 FY63FY64 12,608 34,711 47,319 FY64FY65 13,757 30,133 43,890 FY65FY66 14,620 31,284 45,904 FY66FY67 15,537 31,418 46,955 FY67FY68 16,755 33,912 50,667 FY68FY69 16,878 37,895 54,773 FY69FY70 19,133 38,853 57,986 FY70FY71 18,943 35,804 54,747 FY71FY72 19,894 36,120 56,014 FY72FY73 19,965 31,197 51,162 FY73FY74 20,587 32,906 53,493 FY74FY75 19,563 42,630 62,193 FY75FY76 21,336 51,189 72,525 FY76FY77 20,218 47,606 67,824 FY77FY78 21,038 47,605 68,643 FY78FY79 20,291 49,000 69,291 FY79FY80 20,109 46,972 67,081 FY80FY81 18,972 46,566 65,538 FY81FY82 18,118 44,636 62,754 FY82FY83 19,424 45,247 64,671 FY83FY84 20,165 51,070 71,235 FY84FY85 20,010 61,844 81,854 FY85FY86 20,903 65,935 86,838 FY86FY87 21,469 67,675 89,144 FY87FY88 21,114 70,637 91,751 FY88FY89 22,981 69,038 92,019 FY89FY90 23,135 72,181 95,316 FY90FY91 22,879 68,568 91,447 FY91FY92 22,466 74,133 96,599 FY92FY93 22,397 65,208 87,605 FY93FY94 21,625 61,275 82,900 FY94FY95 21,155 57,592 78,747 FY95FY96 21,204 50,835 72,039 FY96FY97 20,596 53,995 74,591 FY97FY98 21,120 49,109 70,229 FY98FY99 22,761 46,887 69,648 FY99FY00 25,652 45,908 71,560 FY00FY01 30,714 47,801 78,515 FY01FY02 34,321 47,268 81,589 FY02FY03 36,206 50,991 87,197 FY03FY04 37,818 50,234 88,052 FY04FY05 41,208 47,291 88,499 FY05FY06 41,309 42,879 84,188 FY06FY07 47,699 38,462 86,161 FY07FY08 48,607 39,038 87,645 FY08FY09 50,707 35,764 86,471 FY09FY10 55,862 39,133 90,732 * FY10FY11 58,593 36,075 92,211 * FY11FY12 64,127 36,256 97,001 * FY12FY13 63,103 33,694 93,193 * FY13
Stateside Overseas Worldwide
STUDENT HEADCOUNT
Worldwide HeadcountFiscal Years 1948 - 2013
Page 3 Fiscal Year 2013 UMUC Fact Book
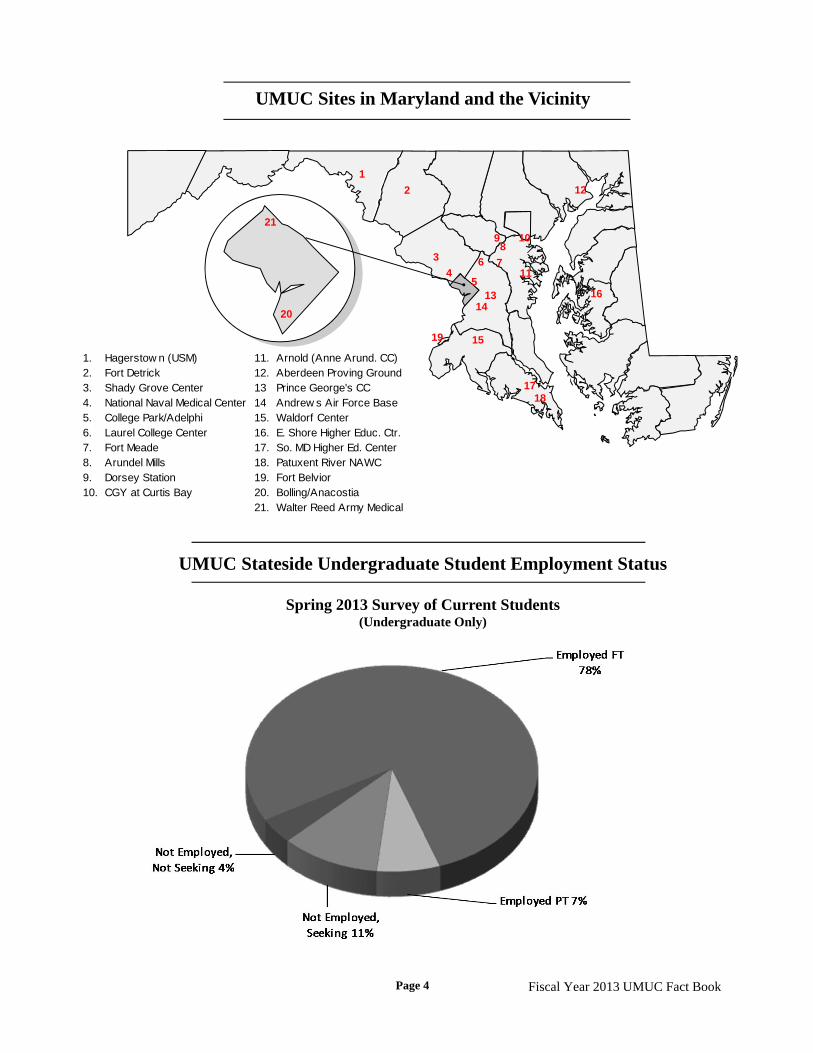
UMUC Sites in Maryland and the Vicinity
UMUC Stateside Undergraduate Student Employment Status
Spring 2013 Survey of Current Students(Undergraduate Only)
513
14
11
18
15
73
12
1
17
19
8
20
4
2
21
6
9 10
16
1. Hagerstow n (USM) 11. Arnold (Anne Arund. CC)2. Fort Detrick 12. Aberdeen Proving Ground3. Shady Grove Center 13 Prince George's CC4. National Naval Medical Center 14 Andrew s Air Force Base5. College Park/Adelphi 15. Waldorf Center6. Laurel College Center 16. E. Shore Higher Educ. Ctr.7. Fort Meade 17. So. MD Higher Ed. Center8. Arundel Mills 18. Patuxent River NAWC9. Dorsey Station 19. Fort Belvior10. CGY at Curtis Bay 20. Bolling/Anacostia
21. Walter Reed Army Medical
Page 4 Fiscal Year 2013 UMUC Fact Book

FTE Students
Fiscal Year 2013 UMUC Fact Book
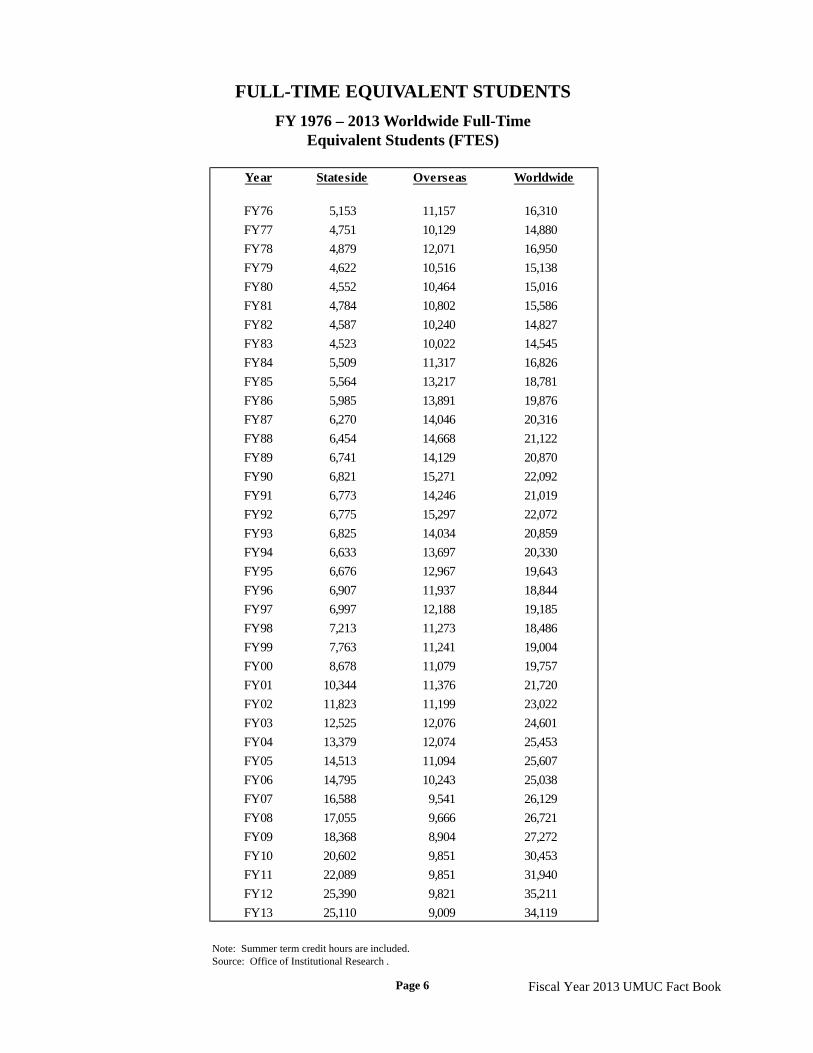
Note: Summer term credit hours are included.Source: Office of Institutional Research .
FULL-TIME EQUIVALENT STUDENTS
FY 1976 – 2013 Worldwide Full-TimeEquivalent Students (FTES)
Year
FY76 5,153 11,157 16,310
FY77 4,751 10,129 14,880
FY78 4,879 12,071 16,950
FY79 4,622 10,516 15,138
FY80 4,552 10,464 15,016
FY81 4,784 10,802 15,586
FY82 4,587 10,240 14,827
FY83 4,523 10,022 14,545
FY84 5,509 11,317 16,826
FY85 5,564 13,217 18,781
FY86 5,985 13,891 19,876
FY87 6,270 14,046 20,316
FY88 6,454 14,668 21,122
FY89 6,741 14,129 20,870
FY90 6,821 15,271 22,092
FY91 6,773 14,246 21,019
FY92 6,775 15,297 22,072
FY93 6,825 14,034 20,859
FY94 6,633 13,697 20,330
FY95 6,676 12,967 19,643
FY96 6,907 11,937 18,844
FY97 6,997 12,188 19,185
FY98 7,213 11,273 18,486
FY99 7,763 11,241 19,004
FY00 8,678 11,079 19,757
FY01 10,344 11,376 21,720
FY02 11,823 11,199 23,022
FY03 12,525 12,076 24,601
FY04 13,379 12,074 25,453
FY05 14,513 11,094 25,607
FY06 14,795 10,243 25,038
FY07 16,588 9,541 26,129
FY08 17,055 9,666 26,721
FY09 18,368 8,904 27,272
FY10 20,602 9,851 30,453
FY11 22,089 9,851 31,940
FY12 25,390 9,821 35,211
FY13 25,110 9,009 34,119
Stateside Overseas Worldwide
Page 6 Fiscal Year 2013 UMUC Fact Book
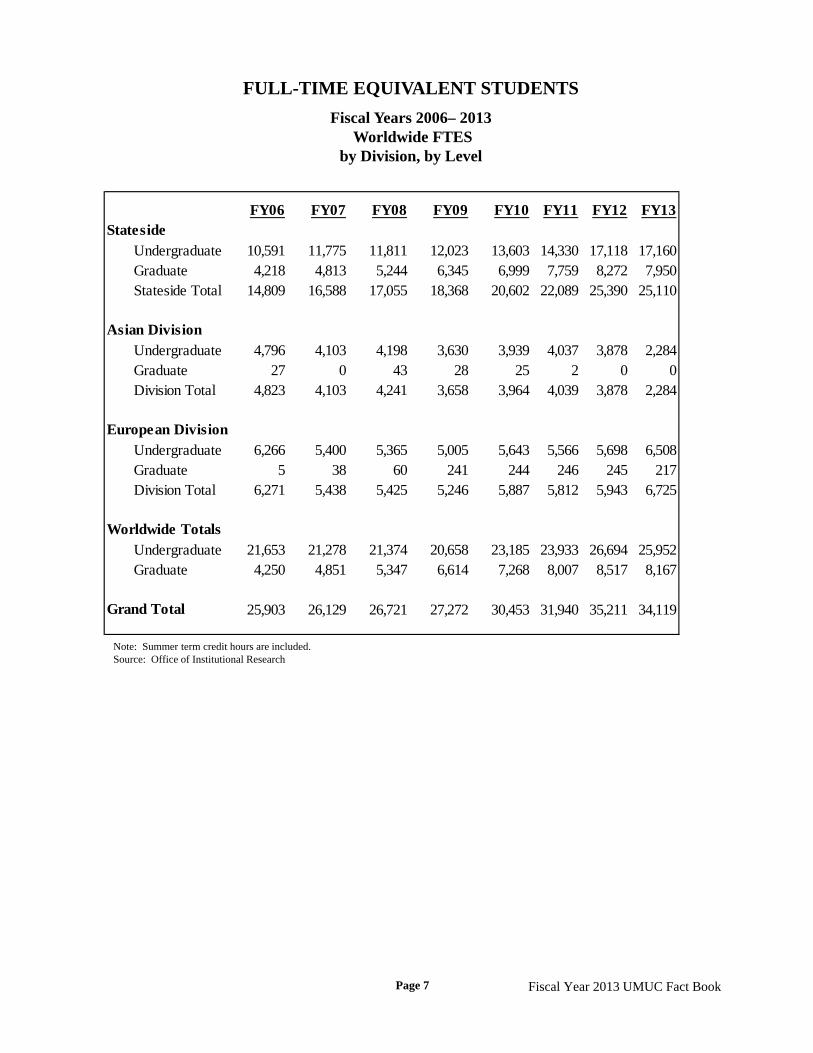
Note: Summer term credit hours are included.Source: Office of Institutional Research
FULL-TIME EQUIVALENT STUDENTS
Fiscal Years 2006– 2013Worldwide FTES
by Division, by Level
FY06 FY07 FY08 FY09 FY10 FY11 FY12 FY13Stateside
Undergraduate 10,591 11,775 11,811 12,023 13,603 14,330 17,118 17,160Graduate 4,218 4,813 5,244 6,345 6,999 7,759 8,272 7,950Stateside Total 14,809 16,588 17,055 18,368 20,602 22,089 25,390 25,110
Asian DivisionUndergraduate 4,796 4,103 4,198 3,630 3,939 4,037 3,878 2,284Graduate 27 0 43 28 25 2 0 0Division Total 4,823 4,103 4,241 3,658 3,964 4,039 3,878 2,284
European DivisionUndergraduate 6,266 5,400 5,365 5,005 5,643 5,566 5,698 6,508Graduate 5 38 60 241 244 246 245 217Division Total 6,271 5,438 5,425 5,246 5,887 5,812 5,943 6,725
Worldwide TotalsUndergraduate 21,653 21,278 21,374 20,658 23,185 23,933 26,694 25,952Graduate 4,250 4,851 5,347 6,614 7,268 8,007 8,517 8,167
Grand Total 25,903 26,129 26,721 27,272 30,453 31,940 35,211 34,119
Page 7 Fiscal Year 2013 UMUC Fact Book

Degrees
Fiscal Year 2012 UMUC Fact Book
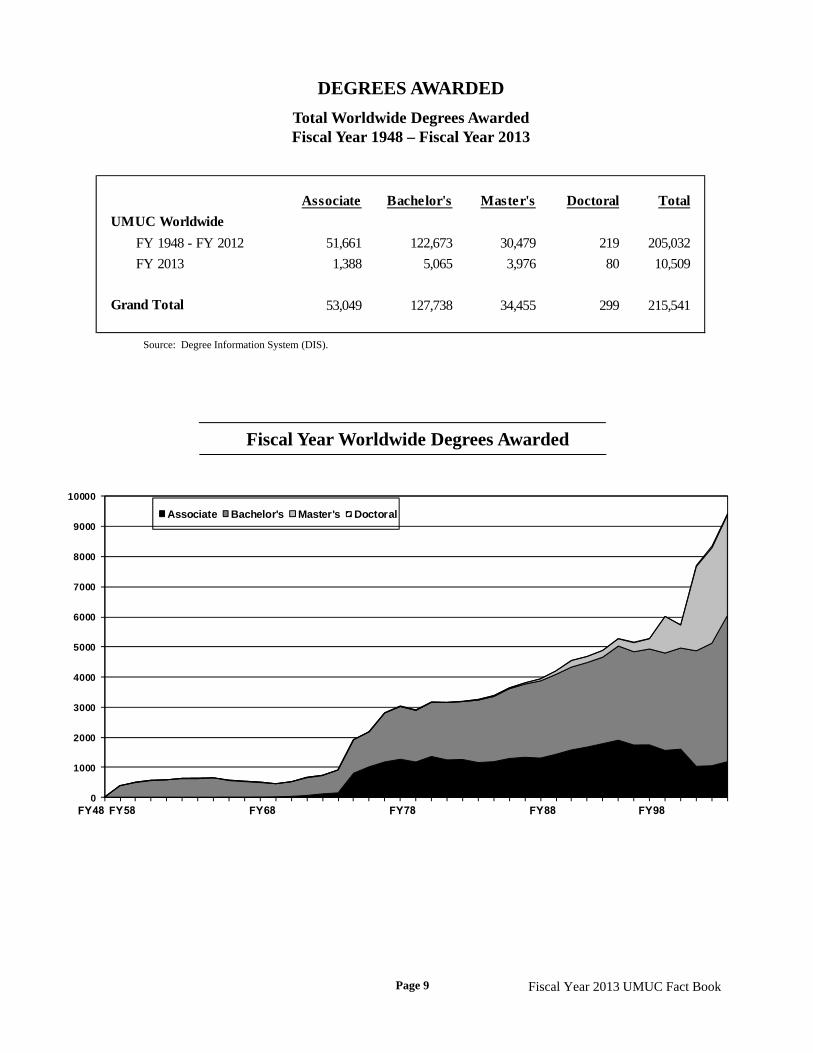
DEGREES AWARDED
Total Worldwide Degrees AwardedFiscal Year 1948 – Fiscal Year 2013
Associate Bachelor's Master's Doctoral Total
UMUC Worldwide
FY 1948 - FY 2012 51,661 122,673 30,479 219 205,032
FY 2013 1,388 5,065 3,976 80 10,509
Grand Total 53,049 127,738 34,455 299 215,541
Source: Degree Information System (DIS).
0
1000
2000
3000
4000
5000
6000
7000
8000
9000
10000
Associate Bachelor's Master's Doctoral
Fiscal Year Worldwide Degrees Awarded
Page 9 Fiscal Year 2013 UMUC Fact Book
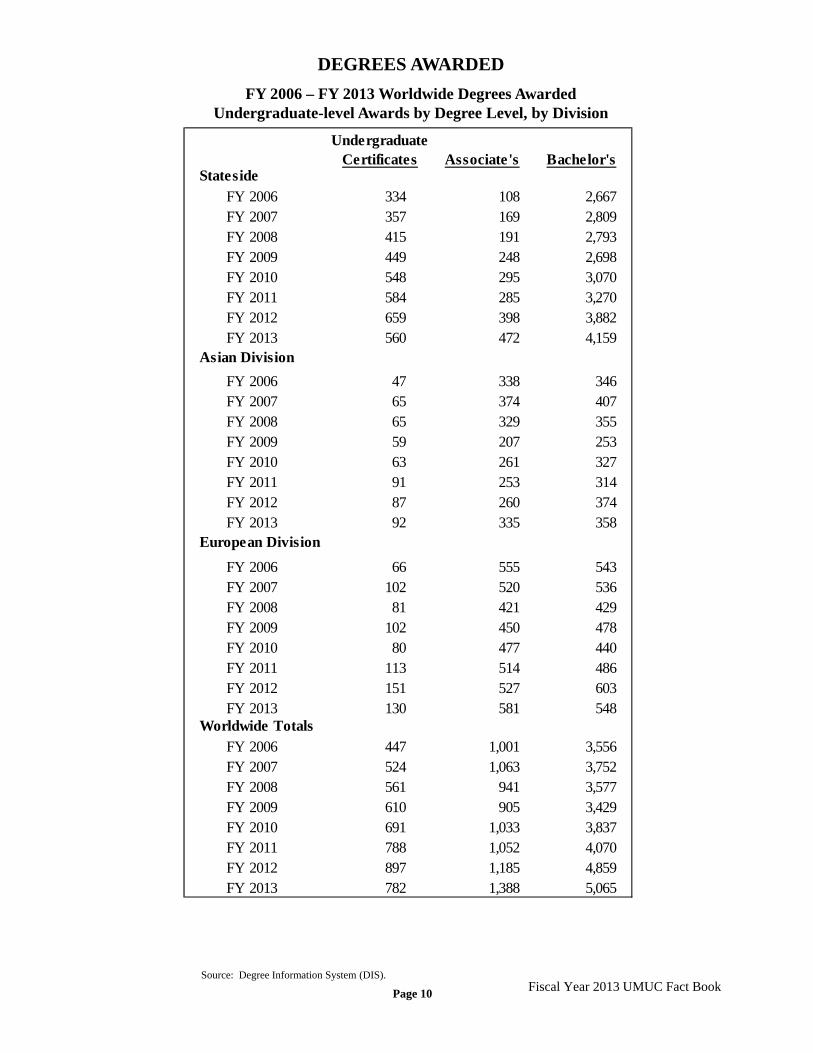
DEGREES AWARDED
FY 2006 – FY 2013 Worldwide Degrees AwardedUndergraduate-level Awards by Degree Level, by Division
Associate's Bachelor'sStateside
FY 2006 334 108 2,667FY 2007 357 169 2,809FY 2008 415 191 2,793FY 2009 449 248 2,698FY 2010 548 295 3,070FY 2011 584 285 3,270FY 2012 659 398 3,882FY 2013 560 472 4,159
Asian Division
FY 2006 47 338 346FY 2007 65 374 407FY 2008 65 329 355FY 2009 59 207 253FY 2010 63 261 327FY 2011 91 253 314FY 2012 87 260 374FY 2013 92 335 358
European Division
FY 2006 66 555 543FY 2007 102 520 536FY 2008 81 421 429FY 2009 102 450 478FY 2010 80 477 440FY 2011 113 514 486FY 2012 151 527 603FY 2013 130 581 548
Worldwide TotalsFY 2006 447 1,001 3,556FY 2007 524 1,063 3,752FY 2008 561 941 3,577FY 2009 610 905 3,429FY 2010 691 1,033 3,837FY 2011 788 1,052 4,070FY 2012 897 1,185 4,859FY 2013 782 1,388 5,065
Undergraduate Certificates
Source: Degree Information System (DIS).
Page 10Fiscal Year 2013 UMUC Fact Book
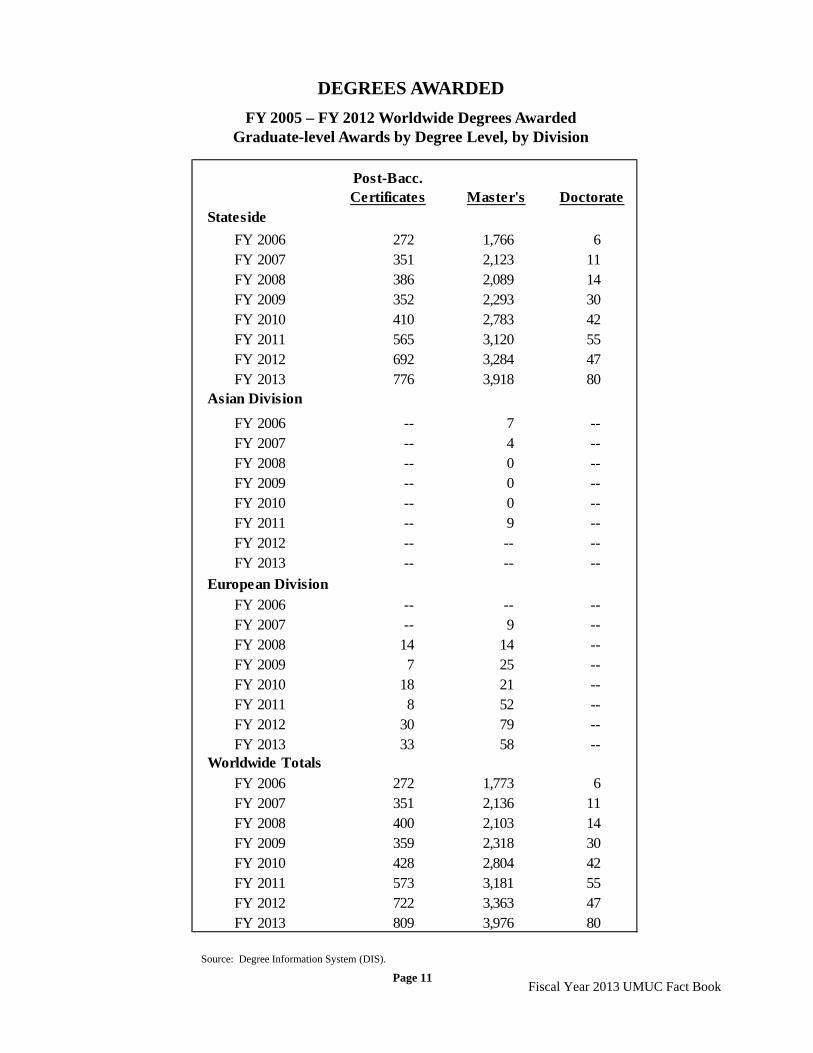
DEGREES AWARDED
FY 2005 – FY 2012 Worldwide Degrees AwardedGraduate-level Awards by Degree Level, by Division
Stateside
FY 2006 272 1,766 6FY 2007 351 2,123 11FY 2008 386 2,089 14FY 2009 352 2,293 30FY 2010 410 2,783 42FY 2011 565 3,120 55FY 2012 692 3,284 47FY 2013 776 3,918 80
Asian Division
FY 2006 -- 7 --FY 2007 -- 4 --FY 2008 -- 0 --FY 2009 -- 0 --FY 2010 -- 0 --FY 2011 -- 9 --FY 2012 -- -- --FY 2013 -- -- --
European DivisionFY 2006 -- -- --FY 2007 -- 9 --FY 2008 14 14 --FY 2009 7 25 --FY 2010 18 21 --FY 2011 8 52 --FY 2012 30 79 --FY 2013 33 58 --
Worldwide TotalsFY 2006 272 1,773 6FY 2007 351 2,136 11FY 2008 400 2,103 14FY 2009 359 2,318 30FY 2010 428 2,804 42FY 2011 573 3,181 55FY 2012 722 3,363 47FY 2013 809 3,976 80
Post-Bacc. Certificates Master's Doctorate
Source: Degree Information System (DIS).
Page 11Fiscal Year 2013 UMUC Fact Book
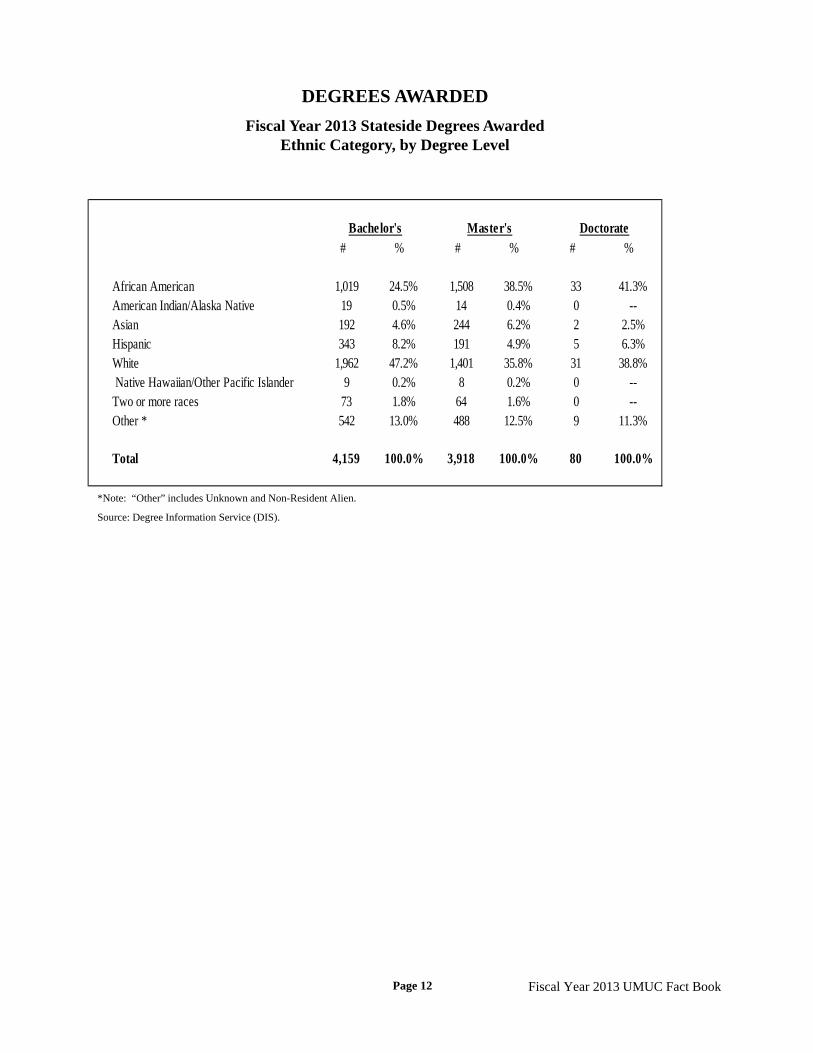
# % # % # %
African American 1,019 24.5% 1,508 38.5% 33 41.3%American Indian/Alaska Native 19 0.5% 14 0.4% 0 --Asian 192 4.6% 244 6.2% 2 2.5%Hispanic 343 8.2% 191 4.9% 5 6.3%White 1,962 47.2% 1,401 35.8% 31 38.8% Native Hawaiian/Other Pacific Islander 9 0.2% 8 0.2% 0 --Two or more races 73 1.8% 64 1.6% 0 --Other * 542 13.0% 488 12.5% 9 11.3%
Total 4,159 100.0% 3,918 100.0% 80 100.0%
Bachelor's Master's Doctorate
DEGREES AWARDED
Fiscal Year 2013 Stateside Degrees AwardedEthnic Category, by Degree Level
*Note: “Other” includes Unknown and Non-Resident Alien.
Source: Degree Information Service (DIS).
Page 12 Fiscal Year 2013 UMUC Fact Book

Finance
Fiscal Year 2012 UMUC Fact Book
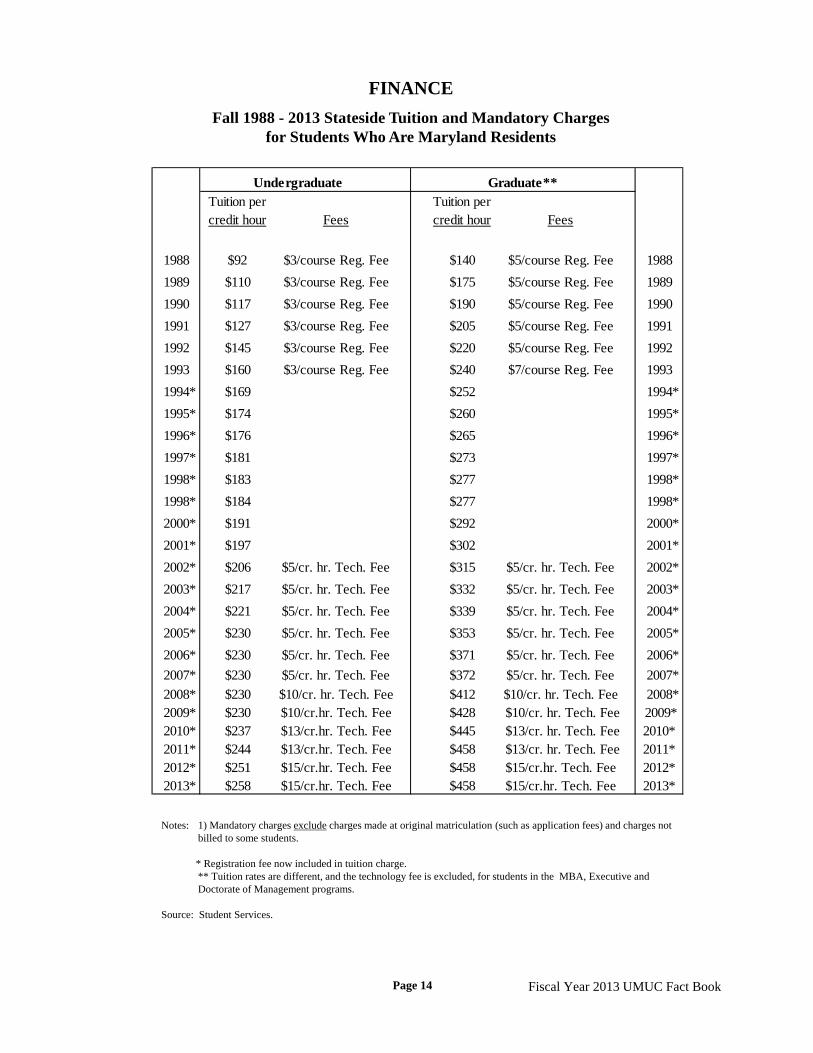
Tuition per credit hour Fees
Tuition per credit hour Fees
1988 $92 $3/course Reg. Fee $140 $5/course Reg. Fee 1988
1989 $110 $3/course Reg. Fee $175 $5/course Reg. Fee 1989
1990 $117 $3/course Reg. Fee $190 $5/course Reg. Fee 1990
1991 $127 $3/course Reg. Fee $205 $5/course Reg. Fee 1991
1992 $145 $3/course Reg. Fee $220 $5/course Reg. Fee 1992
1993 $160 $3/course Reg. Fee $240 $7/course Reg. Fee 1993
1994* $169 $252 1994*
1995* $174 $260 1995*
1996* $176 $265 1996*
1997* $181 $273 1997*
1998* $183 $277 1998*
1998* $184 $277 1998*
2000* $191 $292 2000*
2001* $197 $302 2001*
2002* $206 $5/cr. hr. Tech. Fee $315 $5/cr. hr. Tech. Fee 2002*
2003* $217 $5/cr. hr. Tech. Fee $332 $5/cr. hr. Tech. Fee 2003*
2004* $221 $5/cr. hr. Tech. Fee $339 $5/cr. hr. Tech. Fee 2004*
2005* $230 $5/cr. hr. Tech. Fee $353 $5/cr. hr. Tech. Fee 2005*
2006* $230 $5/cr. hr. Tech. Fee $371 $5/cr. hr. Tech. Fee 2006*
2007* $230 $5/cr. hr. Tech. Fee $372 $5/cr. hr. Tech. Fee 2007*
2008* $230 $10/cr. hr. Tech. Fee $412 $10/cr. hr. Tech. Fee 2008* 2009* $230 $10/cr.hr. Tech. Fee $428 $10/cr. hr. Tech. Fee 2009* 2010* $237 $13/cr.hr. Tech. Fee $445 $13/cr. hr. Tech. Fee 2010* 2011* $244 $13/cr.hr. Tech. Fee $458 $13/cr. hr. Tech. Fee 2011* 2012* $251 $15/cr.hr. Tech. Fee $458 $15/cr.hr. Tech. Fee 2012* 2013* $258 $15/cr.hr. Tech. Fee $458 $15/cr.hr. Tech. Fee 2013*
Undergraduate Graduate**
Notes: 1) Mandatory charges exclude charges made at original matriculation (such as application fees) and charges not billed to some students.
* Registration fee now included in tuition charge.** Tuition rates are different, and the technology fee is excluded, for students in the MBA, Executive and Doctorate of Management programs.
Source: Student Services.
FINANCE
Fall 1988 - 2013 Stateside Tuition and Mandatory Chargesfor Students Who Are Maryland Residents
Page 14 Fiscal Year 2013 UMUC Fact Book

Distance Education
Fiscal Year 2012 UMUC Fact Book
020,00040,00060,00080,000
100,000120,000140,000160,000180,000200,000220,000240,000260,000
Asia Europe Stateside
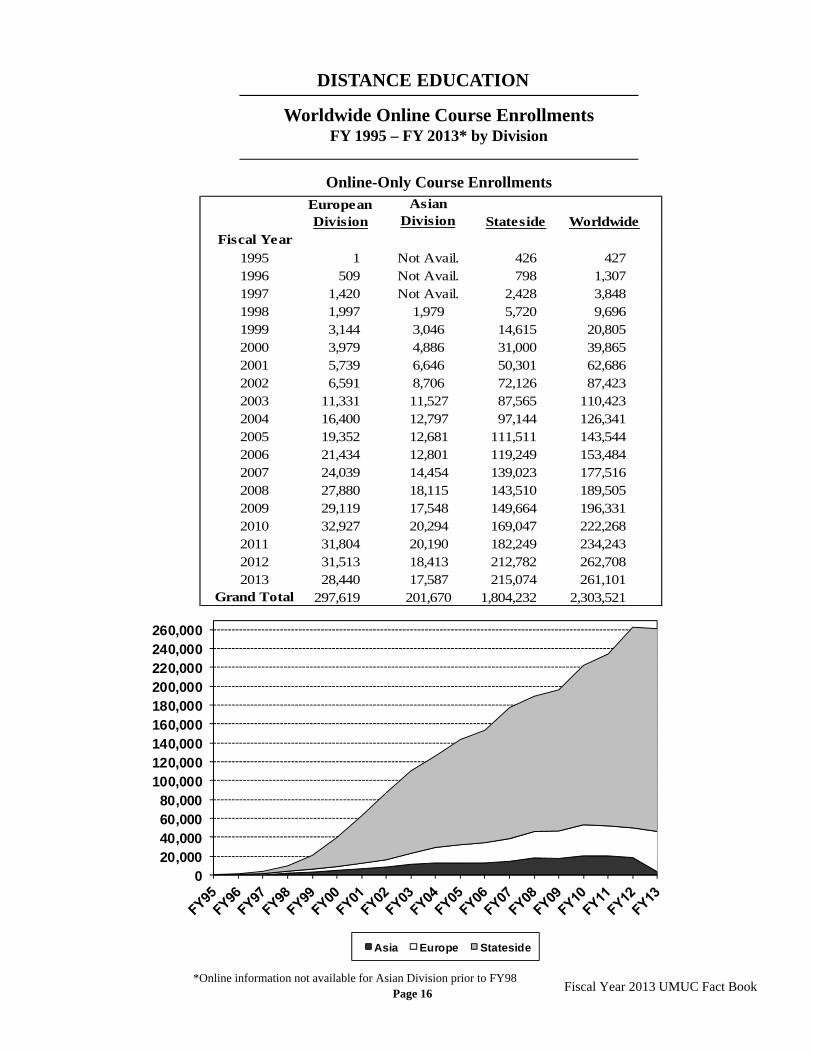
DISTANCE EDUCATION
Worldwide Online Course EnrollmentsFY 1995 – FY 2013* by Division
Online-Only Course Enrollments
*Online information not available for Asian Division prior to FY98
Asian Division
Fiscal Year1995 1 Not Avail. 426 4271996 509 Not Avail. 798 1,3071997 1,420 Not Avail. 2,428 3,8481998 1,997 1,979 5,720 9,6961999 3,144 3,046 14,615 20,8052000 3,979 4,886 31,000 39,8652001 5,739 6,646 50,301 62,6862002 6,591 8,706 72,126 87,4232003 11,331 11,527 87,565 110,4232004 16,400 12,797 97,144 126,3412005 19,352 12,681 111,511 143,5442006 21,434 12,801 119,249 153,4842007 24,039 14,454 139,023 177,5162008 27,880 18,115 143,510 189,5052009 29,119 17,548 149,664 196,3312010 32,927 20,294 169,047 222,2682011 31,804 20,190 182,249 234,2432012 31,513 18,413 212,782 262,7082013 28,440 17,587 215,074 261,101
Grand Total 297,619 201,670 1,804,232 2,303,521
European Division Stateside Worldwide
Page 16Fiscal Year 2013 UMUC Fact Book
DISTANCE EDUCATION
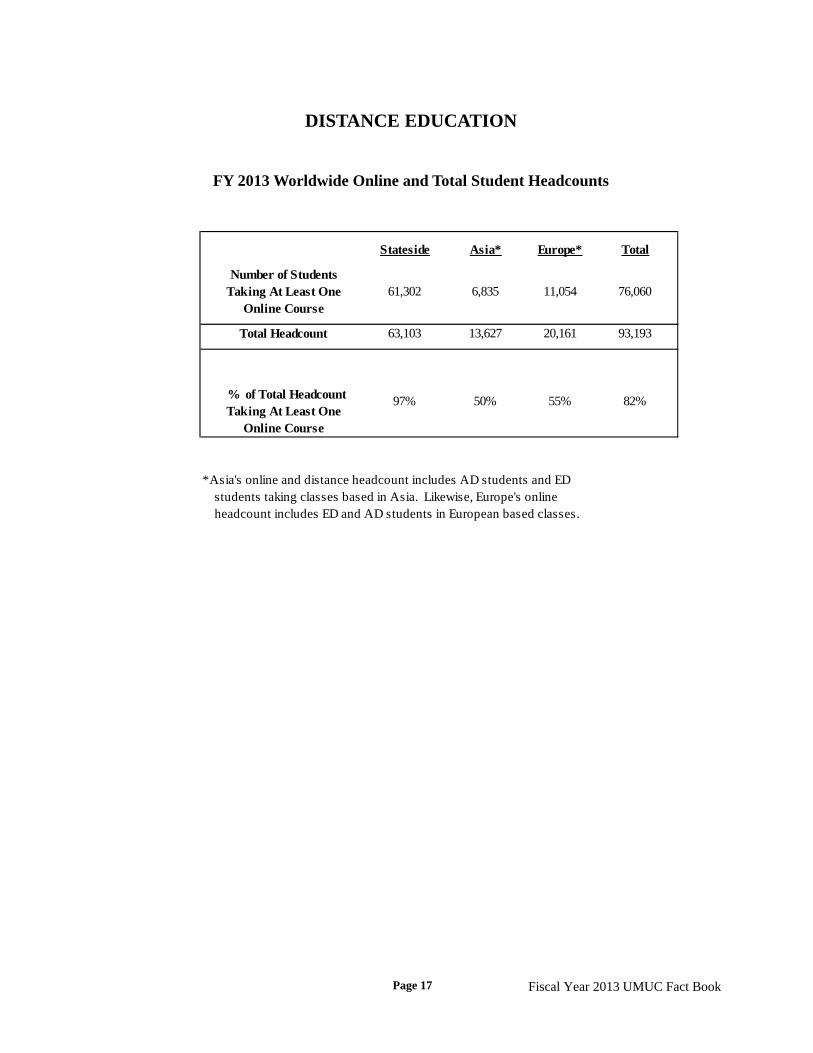
FY 2013 Worldwide Online and Total Student Headcounts
Stateside Asia* Europe* Total
Number of Students Taking At Least One
Online Course 61,302 6,835 11,054 76,060
Total Headcount 63,103 13,627 20,161 93,193
% of Total Headcount Taking At Least One
Online Course
97% 50% 55% 82%
*Asia's online and distance headcount includes AD students and ED students taking classes based in Asia. Likewise, Europe's online headcount includes ED and AD students in European based classes.
Page 17 Fiscal Year 2013 UMUC Fact Book
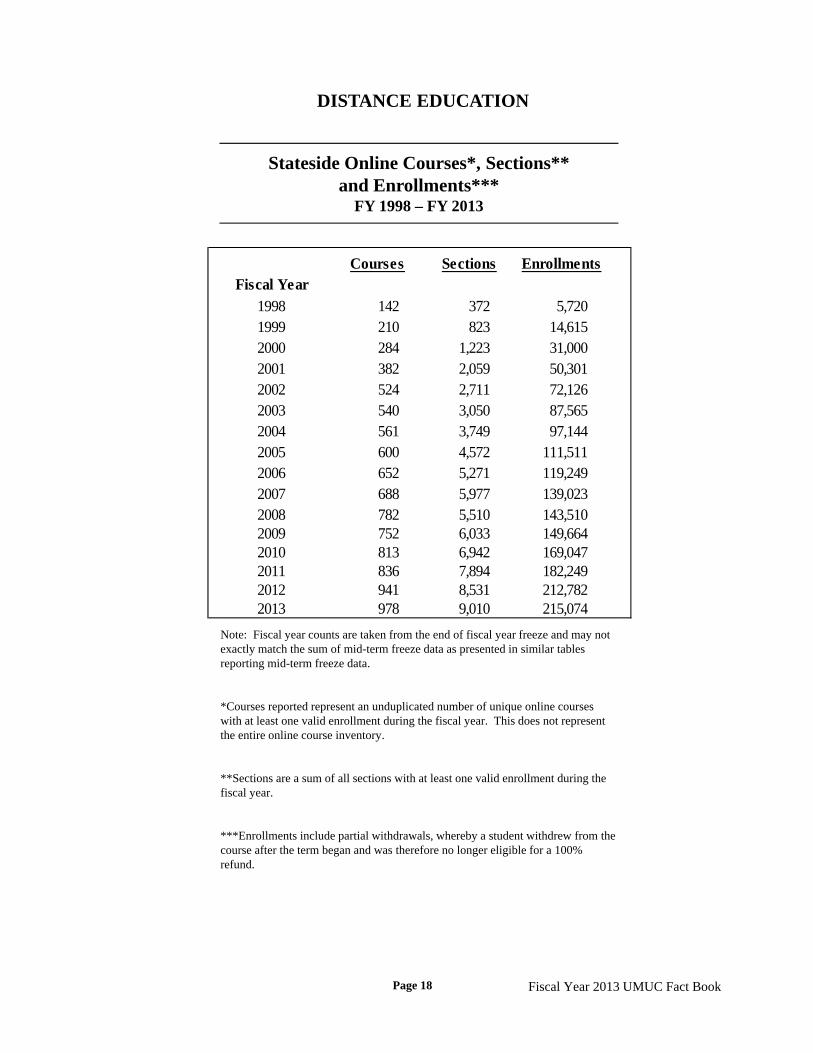
DISTANCE EDUCATION
Stateside Online Courses*, Sections**and Enrollments***
FY 1998 – FY 2013
Fiscal Year
1998 142 372 5,7201999 210 823 14,6152000 284 1,223 31,0002001 382 2,059 50,3012002 524 2,711 72,1262003 540 3,050 87,5652004 561 3,749 97,1442005 600 4,572 111,5112006 652 5,271 119,2492007 688 5,977 139,0232008 782 5,510 143,5102009 752 6,033 149,6642010 813 6,942 169,0472011 836 7,894 182,2492012 941 8,531 212,7822013 978 9,010 215,074
Courses EnrollmentsSections
Note: Fiscal year counts are taken from the end of fiscal year freeze and may not exactly match the sum of mid-term freeze data as presented in similar tables reporting mid-term freeze data.
*Courses reported represent an unduplicated number of unique online courses with at least one valid enrollment during the fiscal year. This does not represent the entire online course inventory.
**Sections are a sum of all sections with at least one valid enrollment during the fiscal year.
***Enrollments include partial withdrawals, whereby a student withdrew from the course after the term began and was therefore no longer eligible for a 100% refund.
Page 18 Fiscal Year 2013 UMUC Fact Book