fiscal austerity, growth prospects, and sovereign cds · pdf filefiscal austerity, growth...
TRANSCRIPT

1
Fiscal Austerity, Growth Prospects, and Sovereign CDS
Spreads: The Eurozone and Beyond
Chunming Yuan1
Department of Economics, UMBC;
Phone: 1 (410)-455-2314; Email: [email protected]
Tanu J. Pongsiri
Maryland Public Service Commission;
Phone: 1 (410)-767-8053; Email: [email protected]
1 Corresponding author.
2
Fiscal Austerity, Growth Prospects, and Sovereign
CDS Spreads: The Eurozone and Beyond
ABSCTRAT
This paper applies both conventional panel data models and a dynamic simultaneous
equations model to analyze the impact of fiscal austerity and growth prospects along with
other macro fundamentals on the pricing of sovereign credit default swaps (CDS) for a
panel of 36 countries including the Eurozone. We find that austerity practice generally
leads to an expectation of improved fiscal situations, which tends to help the CDS market
grow more confidence in indebted sovereigns’ ability to service their debt. The public
debt to GDP ratio and projected future output growth also play an important role in
determining the prices of sovereign debt insurance. Our analyses further show that the
behavior of CDS spreads is considerably affected by common time trends over the
sample period.
Keywords: Credit Default Swap, Fiscal Austerity, Growth Prospects, Dynamic Simultaneous
Equations Model
JEL Classification: F34, G10, G15, H60

3
I. Introduction
Five years on and the shocks from the 2007-08 financial crisis continue to reverberate through
the global economy. While the recovery in the developed world remains sluggish, plagued by
stubborn unemployment, tight credit, and weak business investment, the Eurozone has suffered
most as its periphery countries were at the root of the sovereign debt crisis. Greece twice,
Ireland, and Portugal were all forced to accept bailouts from the European Union and the
International Monetary Fund (IMF) in order to continue servicing their liabilities. Cyprus and
Spain also appeared next in line for financial assistance to bail out their troubled banking
industries.
The mounting government debt and fiscal deficits in the wake of the financial crisis has
raised substantial concerns regarding public finances and debt sustainability. To bring public
purses under control, sovereigns turned to austerity measures – cutting government spending in
combination with/or raising taxes – with the intent of decreasing the government budget deficit
and restoring fiscal soundness. This is done voluntarily to some extent as in the case of Germany
and Britain during the debt crisis. The stressed Eurozone member countries (notably, Greece,
Ireland, Portugal, Spain, and Italy), however, faced no option but to adjust their fiscal balances in
response to deteriorating economic conditions. Despite attempts at deficit reduction and fiscal
austerity, sovereign bond yields and credit default swap (CDS) spreads for the most vulnerable
countries in the euro area remained high through 2011.
The main objective of this paper is to assess the impact of fiscal adjustments on the CDS
markets as well as the role of macroeconomic fundamentals in affecting the pricing of sovereign
debt risk. Are widening credit default swap spreads a consequence of austerity measures or the
opposite? Does a fiscal adjustment cause sovereign debt market to focus more on a country’s
short-term fiscal position or the long-term one? Do future economic growth prospects provide
consistent signals of market participants’ pricing of sovereign risk? Are bond yields along with
other fundamentals able to account for a large share of the variation of CDS spreads? We attempt
to answer these questions based on conventional fixed-effects panel data models and a dynamic
simultaneous equations model by examining the CDS spreads and fiscal positions of countries
that undergone fiscal austerity at any point during the period from 2005 to 2011.

4
Investigating austerity and its effects on credit default swap spreads is important from a
policy standpoint. Are European leaders and governments pursuing the right courses of action by
stressing austerity? Should they be cutting so much in a short amount of time? Any successful
plan to the crisis should achieve debt sustainability and lessen the risk of defaulting, and in turn
ease market pressures and restore financial stability, leading to a drop in bond yields and credit
default swap spreads. Thus, in the course of implementing austerity measures governments and
regulators may have the opportunity to improve the functioning of the sovereign CDS markets –
providing a useful mechanism reflecting the macroeconomic fundamentals and market
conditions that characterize sovereign risks – but to restrict their roles as speculative tools as the
latter would unduly raise funding costs for governments, threaten fiscal sustainability and
exacerbate market tensions particularly during the periods of stress.
A widening of credit default swap spreads poses a problem not only because they indicate
a greater chance of default and result in increased borrowing costs, but also they darken the
investment environment within the stressed sovereign and add uncertainty to the country’s
macroeconomic performance.2 Highly indebted sovereigns face more difficulty in raising money
from markets given high credit default swap spreads and, in extreme cases, can be completely
inaccessible to international funding. Banks and other major institutions may also experience
funding shortages as exposure to the entire country has been deemed risky. Funding shortages
can result in credit crunches as banks lend less while attempting to meet reserve and capital
requirements, potential bank runs, and decreases in output, investment (foreign, public, and
private), and consumption. Therefore, the single-minded focus on sharp austerity – ignoring the
rising credit default swap spreads – might not have been the correct medicine for the euro area
crisis when examining its effects on fiscal finances and the overall macro economy.
The impact of austerity programmes on sovereign CDS spreads can be complicated by
their interactions with real economic growth as well as other macroeconomic fundamentals and
market conditions. On one hand, CDS markets and bond markets are not only concerned with
high levels of public debt and deteriorated fiscal situations in stressed countries but also worry
about these sovereigns’ poor economic performance and glooming growth prospects. Countries
2 See, for example, the spillover effects of sovereign credit risk on financial institutions (e.g. De Bruyckere et al.,
2012; BIS, 2011).
5
with high levels of debt often have trouble growing (e.g. Reinhart and Rogoff, 2010a) and are
less likely to achieve the goals of fiscal adjustment. Greece, Portugal, and Spain, for example,
have constantly missed deficit targets and actually had their fiscal performances revised in the
opposite direction (higher deficits than originally estimated). On the other hand, fiscal austerity
has significant effects on economic activity, which can be contractionary in the short term as it
forces governments to butcher social programs and shed government jobs, causing the economy
to contract and unemployment to increase.3 As such, sharp austerity may dash hopes of a
recovery and only serve to weaken already weak economies further. In this vein, pessimistic
economic outlook in spite of fiscal tightening might be the reason for the rocket high CDS
spreads and bond yields in the troubled countries during the darkest times of the Eurozone crisis.
The remainder of the paper is organized as follows. Section 2 reviews the theoretical and
empirical literature. Section 3 introduces empirical methodologies. In particular, we employ
fixed-effects panel data to account for unobserved heterogeneity. A dynamic simultaneous
equations model is further adopted to address potential endogeneity issues which arise due to the
interaction between the dependent variable and explanatory variables and their dynamic
relations. Section 4 describes the data. Section 5 presents results from panel regression and the
dynamic model. Section 6 presents robustness check using interpolated monthly data. Finally,
Section 7 concludes.
2. Related Literature
Existing literature regarding credit default swaps dates to the mid-1990s as CDSs are a recent
financial innovation. This study aims to contribute to the existing literature on credit default
swaps as little work has been produced regarding the effects of austerity measures on CDS
markets. The most related work is a recent study by Cottarelli and Jaramillo that was included as
an annex in the International Monetary Fund’s Fiscal Monitor of September 2011.4
Cottarelli and Jaramillo looked at what drove differences in CDS spreads among various
countries based on fiscal positions. They utilized a log-linear regression model in order to
3 See Leigh’s (2010) analysis in World Economic Outlook: Recovery, Risk, and Rebalancing (IMF, October 2010).
Some other scholars argue that austerity can be expansionary (e.g., Alesina and Ardagna, 2009). 4 The results are also reported in the working paper of Cottarelli and Jaramillo (2012).

6
examine five-year credit default swap spreads in 2011 for thirty-one developed nations. As
regressors both short- and long-term indicators of a government’s fiscal situation were included.
Presumably long-term fiscal variables should have a greater impact on a sovereign’s solvency as
they detail trends in the country’s revenues and liabilities and reveal the repayment capacity in
the future. From the regression results all the short-term explanatory variables were significant
while most of the long-term variables were insignificant, highlighting the short-termism of CDS
markets. Current year debt to GDP and current economic growth were very important to credit
default swap spreads in 2011. Therefore countries that employed a fiscal tightening and reduced
their countries’ economic growth in 2011 could have in fact lifted credit default swap spreads
and increased borrowing costs.
Cottarelli and Jaramillo’s study uses a cross-sectional dataset in 2011 for advanced
countries. We expand their work by including instances of fiscal tightening before 2011 and
covering both developed and developing countries. To assess the impact of fiscal austerity, our
sample has been particularly narrowed to those countries that undertook explicitly austerity
through 2011. The panel data setting allows us to account for unobserved country-specific
heterogeneity and time effects of common trends. In further analyses, to address potential
endogeneity arise from simultaneity and intertemporal relations, we also use a dynamic
simultaneous equations model to study the relations between the CDS spreads and fiscal
indicators along with macro fundamentals.
Longstaff, Pan, Pedersen, and Singleton (2011) in a similar manner examined sovereign
credit risk through CDS spreads, building off an earlier study by Pan and Singleton (2008) who
employed an affine sovereign credit model to identify the risk-premium and default-risk
components of sovereign credit spreads. The authors gathered monthly pricing data for five-year
sovereign CDS spreads for twenty-six countries – mainly developing countries – from October
2000 to January 2010. In contrast to Cottarelli and Jaramillo’s focus on sovereigns’ fiscal
scenarios, Longstaff et al. investigated whether sovereign credit risk is driven primarily by forces
specific to that country (such as the local stock market return and exchange rate) or whether it is
influenced more by global macroeconomic conditions (including measures related to U.S. equity
and bond markets). Their regression discovered that the most significant variables on the changes
in monthly CDS spreads were global factors: the U.S. stock market, the U.S. high yield bond

7
spreads, and global risk premiums (proxied by the premium for bearing volatility risk). Local
economic conditions did not have nearly as much explanatory power. Pairwise comparisons also
uncovered high positive correlations among the CDS spreads, particularly during the financial
crisis struck. This implied that CDS spreads of these countries tended to move together and
increased during times of global uncertainty and risk but lowered during times of strong global
economic growth and equity gains.
Other related recent works on sovereign CDS spreads include Fontana and Scheicher
(2010), Plank (2010), Dieckmann and Plank (2011), and among others.5 Based on a sample of
ten euro area countries, Fontana and Scheicher found that the weekly pricing of sovereign credit
risk in the CDS market was strongly linked to common factors like investor risk appetite during
the period from January 2006 to June 2010. Plank developed a structural model of sovereign
credit risk for emerging economies in which the probability of default reflected in the CDS
spreads is jointly determined by the ability to pay – depending on a country’s access to
international capital through exports, imports and international reserves – and the country’s
outstanding external debt. Dieckmann and Plank’s study emphasized the strong link between
sovereign credit risk and the health of the financial system. They found that both the state of a
sovereign’s financial system and of the world financial system played an important role in
affecting the behavior of weekly CDS spreads for eighteen advanced western economies during
the financial crisis of 2007-08.
In analyzing the determinants of the pricing of sovereign risk, our work is closely related
to a rich strand of literature that focuses on government bond yield spreads as the proxy for
sovereign risk. Edwards (1984) presented a seminal work in the literature, who modeled the
sovereign bond spreads as a function of default probability which depends on a set of macro
fundamentals and external shocks affecting the country’s solvency and liquidity. Subsequent
influential studies include Edwards (1986), Eichengreen and Portes (1989), and Cantor and
Packer (1995), with the last emphasizing the role of credit ratings along with macro
determinants. In the wake of the global financial crisis, many scholars focus their attention on
explaining the surge of government bond yield spreads for the Eurozone, particularly its
financially stressed peripheral countries (see among others, Attinasi, Checherita, and Cickel,
5 See Augustin (2012) for a more detailed review of the sovereign CDS literature.
8
2009; Manganelli and Wolswijk, 2009; Haugh, Ollivaud, and Turner, 2009). More recently,
Delatte, Fouquau, and Portes (2014) explored the nonlinearities in the determination model of
sovereign bond spreads for the Eurozone peripheral countries. Particularly, their work attempted
explicitly to identify the drivers of nonlinear dynamics of spreads during the debt crisis.
Similar to our study, Attinasi et al. (2009) and Haugh et al. (2009) emphasized the
significant impact of a country’s fiscal position in determining the sovereign bond spreads. These
studies along with those aforementioned have certainly advanced greatly our knowledge on the
pricing of sovereign risk. Also, CDS spreads and bond yield spreads – if written on the same
sovereign bond – should be strongly related under the theoretical parity relationship implied by
no-arbitrage condition across the derivatives and the cash markets (Duffie, 1999; Hull, Predescu,
and White, 2004). However, CDS spreads have some advantages compared to bond spreads in
measuring sovereign credit risk. First, CDS spreads are directly observable whereas bond spreads
have to be computed relative to a risk-free rate. The riskless benchmark, nevertheless, is not
readily available and thus a proxy has to be used, which may induce inaccuracy into the credit
spreads. Second, bond spreads are likely to be affected by regulatory constraints applied to
government bond market, most notably the restriction of short-selling bonds. Finally, the
derivatives market has been found to react more rapidly to information regarding the changes in
the credit quality of reference entities compared to the bond market (e.g., Hull et al. 2004; Zhu,
2006). Delatte, Gex, and López-Villavicencio (2012) also found that the CDS market dominates
the information transmission process between CDS and bond markets during the stress periods.
That said, one may not claim that sovereign CDS market is superior to the underlying
bond market in providing a better measure of actual sovereign credit risk as CDS spreads are also
likely to suffer significant distortions from institutional factors and non-credit risk factors.
Rather, we believe that sovereign CDS spreads provide a useful alternative market price of a
country’s credit risk to the bond spreads from the underlying cash market. Particularly, in this
paper, the pricing mechanism of CDS spreads is linked to sovereigns’ austerity practice. We
attempt to shed light on understanding the influence of governments’ efforts toward fiscal
sustainability on the sovereign CDS markets.
Our work also links to the debate on the macroeconomic effects of austerity measures.
The literature is split whether austerity acts as an expansionary stimulus or contains harmful side
9
effects to growth in the short term. Proponents of expansionary austerity argue that credible
commitments to austerity measures can lower expectations of future taxes, increase investor
confidence in government, and lead to lower interest rates for consumers and firms, and thus
consumer spending and private investment may increase, expanding economic output. Giavazzi
and Pagano (1990), for instance, discovered exactly this during the Danish and Irish fiscal
adjustments of the mid to late 1980s.6 Recently, Alesina and Ardagna (2009) also highlighted
instances of expansionary austerity in their dataset of developed countries that have undergone
large fiscal adjustments from 1970 to 2007. They found that austerity based purely on spending
cuts were more likely to trim deficits and the debt to GDP ratio and avoid recessions.
Many other economists, however, have concluded against the expansionary powers of
austerity. For example, Leigh (2010) documented contractionary effect of fiscal consolidation on
output in advanced economies, with a reduction of real GDP by about 0.5 percent within two
years and a rise of unemployment rate by about 0.3 percentage point given a fiscal tightening
amounting to one percent of GDP. In a following IMF report, Guajardo, Leigh, and Pescatori
(2011) showed that fiscal contractions lowered real private consumption by .75% in two years
and real GDP by .62% in developed countries. They further found that austerity consisting of
large spending cuts and in cases when there was a high perceived risk of sovereign default was
more prone to contractions in growth. This is especially relevant to the current experience in
Eurozone. In addition, closely related to the negative aspects of austerity, high levels of public
debt also have adverse impacts on economic performance. Kumar and Woo (2010), for instance,
showed that a ten percent surge in the debt to GDP ratio slowed annual real GDP per capita
growth by .2 percentage points a year. Reinhart and Rogoff (2010a,b) and Cecchetti, Mohanty,
and Zampolli (2011) reached similar conclusions that debt ratios exceeding a certain threshold
would be damaging to growth,7 suggesting a quick and decisive action for countries with high
debt to address their looming fiscal problems in order to avoid debt crises.
3. Methodology
6 Denmark’s GDP grew by an average of 3.6% per year from 1983-1986 after a severe fiscal contraction starting in
1982. Ireland achieved similar real economic expansion during 1987-1989 after a 7% cut in primary budget. 7 The thresholds estimated are about 90% in Reinhart and Rogoff (2010a) and 85% in Cecchetti et al. (2011),
respectively.

10
3.1 Panel Regression with Fixed Effects
We extend Cottarelli and Jaramillo’s cross-section OLS regression to a panel model with fixed
effects accounting for country-specific heterogeneity and time fixed effects of common trends,
0ln fit i it it it t itCDS X X DRa a b g d h e= + + + + + + (1)
or,
0ln fit i it it it t itCDS X X DRa a b g d h eD = + + D + D + D + + (2)
where ln itCDS is the logarithm of CDS spreads for country i in year t , itX is a set of current
macroeconomic and fiscal variables, fitX is a set of projected variables measuring a country’s
economic prospects and future fiscal soundness, itDR is a set of demographic variables which
measure the potential pressure on governments’ expenditure, ia denotes the country fixed
effects, th denotes the time fixed effects, ite is random error term, and D denotes the first
differences of relevant variables.
Contemporaneous factors considered having impacts on the sovereign debt insurance
market include gross debt, primary fiscal balance, real GDP growth, government bond spreads,
central bank policy rates, inflation, current account, and effective exchange rates. Among them,
gross debt measures all of the liabilities accumulated by all units of government within the
sovereign that require payment(s) of interest and/or principal to a creditor at a date(s) in the
future. Gross debt is considered a very important indicator of a sovereign’s creditworthiness.
Higher debt levels retard growth and decrease the chances a sovereign would remain solvent as it
has to devote a greater amount of its resources toward large interest and principal payments.
Primary balance represents the basic fiscal position of a government for the year which
can be in surplus or in deficit. Austerity measures are often targeted to directly or indirectly
improve primary balance. Since fiscal deficits have to be financed by borrowing, primary
balance is a flow of debt and measures trends in the accumulation of debt. Persistent budget
deficits increase a sovereign’s chances of default as they pile on more debt. The sovereign has to

11
borrow, in all likelihood, at increasingly higher interest rates due to the deterioration in its
financial situation just to cover its own operations.
Real GDP growth is an important regressor because it is the basic measure of an
economy’s performance and health. Higher economic growth more often than not leads to larger
tax revenues and improved fiscal positions, which make it easier for countries to service their
debt. General price levels may also affect sovereign spreads. Higher inflation reflects a loss of
purchasing power for consumers as goods cost more to buy. In sovereign debt market, higher
inflation is worrisome for bond investors because it negatively affects the real rate of return.
Thus, investors will demand higher interest rates on government debt, making sovereign
borrowing more costly. In contrast, indebted countries may purposely target higher inflation (by
lowering interest rates or printing more money) as it allows them to pay back debts with money
that is less valuable. Higher inflation thus lowers a country’s creditworthiness.
Bond spreads and CDS spreads are inherently interconnected as bond markets represent
the underlying cash markets for the CDS markets. In theory, Duffie (199) showed that an
investor buying a CDS protection plus a par priced floating rate bond by the reference entity with
the same maturity – under some assumptions – creates a rick-free position. The no-arbitrage
pricing principle thus implies that the bond spread (i.e., the excess of the bond yield over the
risk-free rate) should be equal to the CDS premium paid by the protection buyer (e.g., Hull et al.
2004). This parity relationship is less likely to hold strictly in reality due to various discrepancies
in regulatory constraints, institutional factors, and liquidity effects between the cash bond and
CDS markets (e.g., Fontana and Scheicher 2010). However, one should expect that CDS prices
would covariate closely with bond spreads although there is less consensus on the price
discovery process (e.g., Zhu 2006; Ammer and Cai 2007; Bowe, Klimavicienne and Taylor
2009; Coudert and Gex 2010).
Major central banks acted aggressively in response to the 2007-09 financial, lowering
policy interest rates and providing support to falling financial institutions. When they ran out of
the conventional ammunition with policy rates sitting just above zero, numerous unconventional
monetary policy tools were introduced to provide additional monetary easing, notably such as the
Fed’s Quantitative Easing (QE), the BOE’s Asset Purchase Facility (APF), and the ECB’s
Securities Market Program (SMP). These dramatic interventions certainly have a significant

12
effect on credit markets. Scholars like Baumeister and Benati (2013) suggested using the spreads
between the ten-year Treasury-bond yields and the policy rates to capture this effect. Since five-
year bond spreads are already included as a regressor to capture the covariation between the CDS
markets and their underlying bond markets, to avoid multicollinearity problem in the model, we
use the central bank policy rates to measure monetary policy changes. Moreover, according to
Manganelli and Wolswijk (2009), the policy rates can also play a role as driver of aggregate risk
perception as lower interest rates improve economic perspectives and tend to increase the
willingness of investors to bear risks.
The current account balance highlights the nature of a country’s foreign trade and
whether the sovereign is a net creditor or debtor with the rest of the world. We included this
variable, which was not in the Cottarelli and Jaramillo model, because a widening external
deficit reflects a loss of country competitiveness, a major problem afflicting the Eurozone
alongside large debts. In an overview of the euro crisis, Shambaugh (2012), for example, argued
that current account deficits and lack of competitiveness in the periphery have resulted in growth
doldrums which are further intertwined with the fragility of banking system and sovereign debt
risk. Similarly, Lane and Milesi-Ferretti (2011) found that those countries running the largest
current account deficits before the global financial crisis have suffered the largest declines in
domestic demand during the crisis and generally witnessed an increase in credit spreads and
tighter availability of external funding.
Exchange rates may also be important factors affecting the price of insurance against
default. If a debt contract is denominated in foreign currency (it’s true for many countries, often
in US dollars or euros), a weaker exchange rate increases the probability of default as it entails a
higher debt burden, and thereby would push higher CDS spreads.
Future GDP growth and future primary balance are considered to measure a country’s
growth and fiscal outlooks. We believe these future variables are crucial elements for a
sovereign’s creditworthiness because the long-term trends will determine whether the current
fiscal situation of a sovereign is sustainable. Solid, positive economic growth over the medium
term will only serve to improve a country’s fiscal position as it gains an increasing amount of tax
revenues. Likewise, years of budget surpluses raise government savings instead of adding to the
level of debt. A country may have a strong year of growth and a budget surplus, but if anemic
13
growth and budget deficits are on the horizon, these are going to hamstring efforts by the country
to save and reduce their debt keeping all other things constant, and lower the credit outlook.
We consider as the demographic regressor the old age dependency ratio, which calculates
the number of the population aged 65 and over divided by the number of the working population
aged between 15 and 64. Cottarelli and Jaramillo included regressors for future pension spending
and health spending in their analysis, but the old age dependency ratio serves as a proxy for both
variables. The higher the ratio, the more governments are likely to spend on pensions and health
care as the elderly tend to live off retirement benefits and consume more health care than the
young (e.g., Ruggeri and Zou 2007). This situation should have adverse consequences for a
government’s fiscal position, debt outlook, and hence its credit default swap spreads. A high old
age dependency ratio can also indicate slower employment growth which can reduce potential
output.
3.2 A Dynamic Simultaneous Equations Model
The panel regression analysis offers important insights on the driving forces determining the
price of sovereign credit default swaps. The analysis, nevertheless, does not sufficiently address
the issue of potential endogeneity. In general, endogeneity arises when there is unobserved
heterogeneity and if it affects both the dependent and explanatory variables. In this regard, a
fixed-effects model can effectively remove unobserved heterogeneity through fixed-effects
transformation (Wooldridge, 2002).8 However, traditional fixed-effects (or “within”) estimates
are only consistent under the assumption that there are no dynamic relations among dependent
and explanatory variables. This is often a too strong assumption about macro-economic and
financial data and is unlikely to hold in practice. As such, it is warranted to take dynamic
endogeneity into account in order to appropriately estimate the relation between CDS spreads
and macro fundamentals as well as financial factors.
8 Arguably, fixed effects models are generally preferred to random effects models in many macro-economic
applications as the former allow for the unobserved to be arbitrarily correlated with explanatory variables while the latter assume strict exogeneity, given the fact that a typical macro panel is less likely to be a random sample from a much larger universe of countries under consideration (Judsona and Owenb, 1999).

14
Another important source of endogeneity that may bias fixed-effects estimates is
simultaneity which arises when the dependent variable interplays with explanatory variables. The
prices of sovereign default risk are directly associated with a nation’s borrowing costs, especially
in financially distressed European countries (e.g., Delatte et al. 2012) and some emerging market
economies (e.g., Bowe et al., 2009). Changes in borrowing conditions may be further entangled
with governments’ budgetary policies. Heinemann and Winschel (2001), for instance, showed
that there is a significant impact of borrowing costs on the public deficits for the OECD countries
and the impact is more pronounced when the nation is confronted with tightening borrowing
conditions. The simultaneity problem may get even more devastating when the debt-growth link
is taken into consideration (e.g., Reinhart and Rogoff, 2010b; Cecchetti et al., 2011; Reinhart,
Reinhart, and Rogoff, 2012).
In order to account more appropriately for the possible endogeneity of right hand
regressors in sovereign default risk premia equation, we explicitly set up a system of dynamic
equations. Our empirical application thus combines dynamic panel data modeling approaches
(e.g., Arellano and Bond, 1991; Blundell and Bond, 1998) with a simultaneous equations
framework (e.g., Cornwell, Schmidt, and Wyhowski, 1992; Baltagi and Chang, 2000). A general
form of the dynamic simultaneous equations model is given by
( ) ( )it it itL Y L Z uF +B =
for 1, 2,...,i N= and 1, 2,...,t T= . itY is a vector of endogenous variables. itZ is a vector of
exogenous variables. itu is a vector of combined disturbances which allow for individual and
time fixed effects. ( )LF and ( )LB are matrices of polynomials of the lag operator L with
st t sL y y -= for any time series { }ty . Specifically, the CDS equation from the system of
equations can be written in the following form9
' '0 , , ,
1 0 0
ln lnp p q
it i j i t j j i t j j i t j t itj j j
CDS CDS Y Za a f f b h e- - -= = =
= + + + + + +å å å (3)
9 Other equations of endogenous variables are generally not our major focus of the paper. We do not report relevant
results to conserve space.

15
where is the logarithm of CDS spreads for country in year , itY is a vector of
endogenous variables excluding the CDS spreads, that is, '
lnit it itY Y CDSé ù= ê úë û , is a vector of
exogenous regressors, denotes the unobserved country fixed effects, denotes the time fixed
effects, and is the random error term. Other structural equations are defined in the similar
way. As usual, we assume the following orthogonality conditions:
Basically, it is assumed that random errors are uncorrelated with each other over time and across
countries and the unobserved individual heterogeneity is also cross-sectionally orthogonal and
uncorrelated with random errors in the structural equation. Note that, these orthogonality
conditions are assumed for the error structure of any particular equation of the system including
the CDS spreads equation, while we allow for cross error correlation between different equations
of the system.
The dynamic simultaneous equations including Eq. (3) are estimated using the Blundell
and Bond (1998) System GMM estimator. This type of GMM estimator is typically designed for
panel data sets with large N and small T (i.e., the size of panel is relatively large compared to
time dimension). In addition, by assuming that first differences of instrument variables are
uncorrelated with the fixed effects, the estimator allows for the inclusion of more instruments
and has a substantial efficiency advantage.10 Thus, for our panel data set with N=36 and T=6,11
the System GMM estimator might be an appropriate tool to help find more consistent and
efficient parameter estimates for pricing sovereign default risk compared to a panel data
regression.
10 See Roodman (2006) for discussion on the efficiency of GMM-style estimators.
11 The panel is unbalanced with the majority of countries having observations from 2005-11 while some countries
only containing data for the most recent 2-3 years.
ln itCDS i t
itZ
ia th
ite
( ) 0, for or it jsE i j t se e = " ¹ ¹
( ) 0, for i jE i jaa = " ¹
( ) 0, for , , j itE i j ta e = "

16
We endogenize CDS spreads, (future) real GDP growth, (future) fiscal position, gross
government debt, and bond spreads while treating other variables as exogenous regressors. There
certainly remains a possibility that sovereign default risk premia interact with these “exogenous”
variables in some way. Kisgergely (2009), for instance, argued that the dynamics of sovereign
CDS spreads and movements in exchange rates may be driven by common global factors such as
the expectations related to the global economic cycle and investors’ willingness to take risks.
Nevertheless, causality analyses show that the strength of the interactions between CDS spreads
and these variables may not be very significant. In addition, endogeneizing too many variables
and including too many lags of endogenous variables tends to cause the “many instruments
problem” in the System GMM estimator (e.g., Hayakawa, 2005; Roodman, 2009). As such, we
include one lag of aforementioned endogenous variables in the right-hand side ,i t jY - and one lag
of inflation, current account, exchange rates, and the old age dependency ratio as the
predetermined regressors ,i t jZ - .
4. Data
4.1 Sources and Definitions
Our analysis utilizes sovereign CDS and bond daily market data and annual data on
macroeconomic fundamentals as well as demographics. Five-year sovereign CDSs are selected
as they are the most traded in the CDS market. Daily CDS and bond spreads are obtained from
Bloomberg and the annual averages are used in empirical analysis. Bond spreads are differences
of five-year generic government bond yields and five-year fixed-for-floating (LIBOR) interest
swap rates. 12 Macroeconomic variables are drawn from the April 2012 World Economic
Outlook (WEO) database. Exchange rates are obtained from the IMF's International Financial
Statistics (IFS).13 Projected variables – future real GDP growth and future primary balance – are
collected from each year’s two releases of the WEO in 2005-2012. Future real GDP growth is
the average projected potential real GDP growth for the following five years and future primary
12 Swap rates are preferred as the proxy for the risk-free rate according to Hull et al. (2004). 13 IFS database does not contain complete set of data series for some countries, like Serbia, Lithuania, and Croatia.
We supplement it based on the publication from these countries’ central banks.

17
balance is the average projected primary balance to GDP for the following three years.14 If
projections are not provided in the WEOs for some countries, we supplement them using the
forecasts from OECD Economic Outlook. The demographic variable – the old age dependency
ratio – is obtained from the World Development Indicators (WDI). Gross debt, (future) primary
balances, and current account balances are measured as share of GDP.
The dataset is an unbalanced panel consisting of 207 observations from 36 countries.
Twenty-four of those countries are classified as developed by the International Monetary Fund
and the other twelve developing. A country qualified to be a part of the dataset if at some point
during the period of 2005-2011 it implemented spending cuts and/or tax hikes with a view
toward alleviating the country’s budget deficit.15 Instances of austerity were gathered from a
combination of sources: the Cottarelli and Jaramillo study, the Alesina and Ardagna (2009) and
Guajardo et al. (2011) pieces on expansionary austerity, the International Monetary Fund’s Fiscal
Monitor, budget reports from various sovereigns, and news articles.
It is noteworthy that the dataset does not consist of the entire population. There were
many other instances of austerity in the 1990s, 2000s, and especially after the financial crisis in
both the developed and developing worlds that merited inclusion in the sample but the data on
credit default swap spreads were not readily available for those years. Collection and reporting of
pricing data appears with regularity only since the mid-2000s and mainly for the larger
economies and those of Europe.
4.2 Descriptive Summary
Figures 1-3 exhibit respectively the evolution of the credit default spreads for the countries in the
dataset, and specifically for the Eurozone and its troubled peripheral countries. The CDS markets
for both the developing and developed countries were largely unmoved before 2007. While the
default risk premia for developing countries were stable at around 80 basis points, investors
showed much more confidence in the ability of advanced countries to fully repay their sovereign
14 The earlier years’ (2005-07) WEOs only project out for the subsequent 2-3 years. Thus, for these years the future
variables are the averages over the next 2 or 3 years. 15 Episodes of large fiscal adjustments can also be tracked prior to 2005 (e.g., Cottarelli, Forni, Gottschalk, and
Mauro, 2010) but data for CDS spreads are not available for most countries.
18
debt obligations. The CDS spreads for some developed countries before the crisis were
extremely low. France and Germany, for example, each had their average daily spreads for 2005
and 2007 below five basis points. Even for the Eurozone peripheral countries, the average daily
spreads were around or below ten basis points.
Sovereign default concerns, nevertheless, skyrocketed in the second half of 2007 as fear
of financial meltdown contagion spread over the world. Many developing countries especially in
Eastern Europe and Central America were believed soon to join the list of battered credits that
had reneged or defaulted on their foreign debt obligations. CDS spreads on Ukraine, for instance,
soared as much as twelve times to a record 2,141 basis points in the peak of 2009 and Lithuania
jumped several hundred basis points to an all-time high of 499. Contracts on Serbia climbed
from 145 basis points to 455, Russia increased from 60.5 to 375, and Bulgaria increased from 28
to 352. Advanced economies especially in the euro area could not escape the confidence crisis,
as the Greek fiscal troubles quickly magnified into Europe’s sovereign debt crisis. Spreads for
developed countries went from an average of 5.6 in 2007 to over 270 by 2011. The average risk
premia surged from a single digit to 846 basis points during the same period for Eurozone’s
stressed peripheral countries, with contracts on Greek debts peaking at 2,094 in 2011.
Table 1 shows descriptive statistics for the entire dataset. The average country in the
sample for 2005-2011 had a medium debt load; was in deficit regarding its primary and current
account balances; fairly high inflation (relative to the developed world which usually targets a
2% rate); and positive but weak growth in the current year. Its prospects appeared to be rosier
with stronger economic growth and an improving primary balance in the future. The projected
reduction in fiscal deficits might be seen as the result of austerity measures. The country
experienced a slight appreciation in its real exchange rate which might largely be attributed to a
weakening U.S. dollar over the sample period.16 Government financing costs were maintained at
a reasonable level on average which was comparable to the U.S. 10-year bond yields prior to the
crisis. These averaged figures, nevertheless, do not reveal the heterogeneity among countries in
the sample as there were wide variations in nearly all the variables, evidenced by a large range
from the minimum to maximum and large standard deviations.
16 The U.S. dollar lost a quarter of its real value against a broader range of currencies in the past decade and more
than 15% over the sample period.

19
Compared to developed countries, developing countries typically had to pay higher
borrowing costs than their counterparts when seeking international financing, a reflection of
foreign investors’ concerns on the indiscriminate policy changes, financial system instability,
and currency fluctuations in developing countries. In fact, developing countries had lower gross
debts (as percentages of GDP), lower budget deficits, and stronger economic growth on average
during the sample period. On the other hand, developed countries enjoyed mild inflation, more
stable exchange rates, and smaller deficits in trade balances (though the latter is certainly not true
for the U.S. and the stressed Eurozone countries). As far as the near-term future is concerned,
developing countries were forecast for more robust growth but a slightly worse fiscal balance. In
contrast, developed countries were projected to follow a stronger economic growth (than current
growth) and favorable fiscal adjustment.
We further describe the data from year to year in Table 2 in order to show clearly the
important time effects attributed to the global financial crisis and the Eurozone sovereign debt
crisis. As we can see, the average gross debt to GDP of all countries in the dataset increased from
47.97% in 2007 to 66.73% and consequently the average primary balance to GDP worsened
from -2.46% in 2007 to -4.84% in 2009, before improving to -3.71% in 2011. Average economic
growth tanked dramatically from 5.11% in 2007 to -5.15% in 2009, before recovering in the
subsequent two years. One bright spot over the time frame was the improvement in average
current account balance, most likely as a result of restrained imports due to austerity and
household and business deleveraging. When focused on the euro area, it appears that the stressed
Eurozone countries did not differ from their peers on average before 2007 except the large
amount of trade deficits. But their situation deteriorated quickly at the height of the financial
crisis and lost further ground during the debt crisis of 2010-2011.
5. Results
5.1 Results from Panel Regression
Table 3 presents regression estimates for all countries in the sample. We consider regressions of
both levels and changes of CDS spreads as Dieckmann and Plank (2011). While difference
specifications are often preferred in modeling time-series behavior, we analyze CDS spreads in
levels in an attempt to present comparison to Cottarelli and Jaramillo’s finding. Also, this may

20
provide more complete analysis on the pricing of sovereign CDS as Dieckmann and Plank
(2011) found that the results of unit root tests are mixed for CDS spread levels and argued that
non-stationarity may be a small sample property due to the short time series.17 Six specifications
are reported for the fixed-effects model depending on the inclusion of either or both of current
and future variables and time dummies. Specifically, columns 1, 3, and 5 report regression
estimates without accounting for time effects while columns 2, 4, and 6 include time dummies
for years 2008 and 2011. While the time trend of all years in the sample period can be tracked,
we believe these two years are most influential as the former marked the collapse of Lehman
Brothers and the latter was the height of the euro area debt crisis. Separating future fiscal balance
and GDP growth from their current counterparts is out of the consideration of multicollinearity
as one can see in Table A2 projected primary balance and future GDP growth are highly
correlated with current observed fiscal balance and real growth respectively.
Overall, the fit of the models is comparable to earlier studies (e.g., Dieckmann and Plank,
2011; Alper, Forni, and Gerard, 2012; Cottarelli and Jaramillo, 2012). The adjusted R-squared
ranges from 0.70 to 0.80 for CDS spread levels (in logarithm) and from 0.33 to 0.71 for CDS
spread changes. Including time dummies substantially improves the explanatory power of the
model especially for the regression of CDS spread changes. Judging from the overall fit (R-
squared), information criteria (AIC and BIC), and the log-likelihood, one may believe that
specification (2) – using future variables along with time dummies as predictors – and
specification (6) which further includes current observables of primary balance and real growth –
are apparently superior to other specifications but these two themselves present essentially the
same quality in describing the price movements of CDS spreads. However, a collinearity
diagnosis turns out that the variance inflation factor (VIF) for future GDP growth and current
real growth in specification (6) for CDS spread change regression are 9.72 and 8.35 respectively,
suggesting a severe multicollinearity according to Studenmund (2011, pp.260).18 Thus, we view
the specification (2) as our benchmark in the analysis.
17 In the same logic, testing nonstationarity for our sample may not make much sense as the dataset contains only a
few observations over time dimension. 18 Similar issue exists in specification (5) where the VIFs are 8.36 and 6.38 for future GDP growth and current GDP
growth, respectively.
21
As expected, fiscal and macro fundamentals generally provide strong explanatory power
in the sovereign CDS context, and the signs of significant coefficients correspond to economic
intuition. Consistent with many studies on sovereign debt risks (e.g. Eichengreen and Mody,
2000; Dieckmann and Plank, 2011; Cottarelli and Jaramillo, 2012), countries’ indebtedness
(Gross Debt/GDP) is an important determinant of the pricing of default risk. For an average
country with CDS spreads of 150 basis points, 1 percentage point increase in the debt-to-GDP
ratio is expected to raise the risk premium by about 6 basis points. The positive linkage between
the sovereign indebtedness and the price of country default risk is line with the market fiscal
discipline hypothesis which assumes when sovereign debt stays below a certain critical level,
spreads rise with an increase in the level of borrowing; and if the critical level is exceeded, the
credit markets will impose a substantial increase in default risk premium on borrowers or even
slam the door on new borrowing. The recent experience of the peripheral Eurozone countries is
particularly relevant in this regard.
Of particular interest is the impact of future fiscal balance and economic growth
prospects on the variation of sovereign credit spreads. The results indicate that an improving
fiscal situation and rosier future economic activity help calm down considerably the credit
market and enhance investors’ confidence in sovereign debt. For the average country, 1
percentage point increase in the future fiscal balance and real GDP growth will bring down the
CDS spreads by 12 and 11 basis points, respectively, according to the level regression. Fiscal
austerity is targeted to curb soaring public debts and maintain sustainable fiscal deficits. In fact,
massive public borrowing and a widening fiscal deficit can undermine a country’s economy as it
tends to crowd out private borrowing which could otherwise finance growth and discourage
private investment if businesses fear tax increase to pay for the deficit. The strong link between
CDS spreads and future fiscal balance as well as the country’s indebtedness thus largely
confirms the significant impact of fiscal austerity measures on sovereign debt markets.
Our finding that expectations of future fiscal deficit and economic growth help explain
the variation of sovereign credit risk is consistent with that of Alper et al. (2012) although they
use monthly forecasts of primary balance for the year and projections of real growth rate in the
next year. Interestingly, regression based on current observed primary balance and real growth
does not find significant covariation between CDS spreads and fiscal deficits. This implies that a
22
fiscal consolidation policy often needs time to take effect and should not be expected to improve
a country’s fiscal situation immediately. In fact, aggressive fiscal efforts to rapidly reduce budget
deficits may backfire as in the short run a contracting economy offsets any direct benefits of the
fiscal austerity.19 In such circumstances, fiscal austerity plans would not necessarily be rewarded
with shrinking spreads in the sovereign CDS market in the short run. This is reflected in the
disconnection between spread movements and short-term primary deficits. Here investors may
be falling in line with fundamentals as future primary balances serve to determine whether the
fiscal and debt situation of sovereigns improves or worsens. This also hinges on the fact that
Eurozone countries are setting medium term budget deficit targets (and yearly targets) with a
view toward calming markets and cooperating with European budget regulations.
Comparing to Cottarelli and Jaramillo’s (2012) cross-sectional analysis, our specification
(5) is similar to theirs in which both future and current primary balance and real growth are
included in regression. Akin to their finding, short-term growth is an important determinant of
CDS spreads, while future growth appears to play a less significant role in pricing credit default
risk. Cottarelli and Jaramillo attributed this to a consequence of the financial crisis and market
participants’ strong risk aversion after four years of market turmoil, suggesting that markets have
attached greater risk to countries with negative current growth rates regardless of whether growth
rebounds in future years. Yet, as we discussed above, the high variance inflation factor in the
collinearity diagnosis indicates a severe multicollinearity problem in the regression when
including both current and future variable.20
CDS prices comove closely with bond spreads as shown in both CDS level and change
regressions. This is indicating that the theoretical arbitrage relationship between the CDS market
and the cash bond market is binding to a great extent although deviation from the strict parity
may exist in the short-run dynamics. Indeed, a plethora of studies have documented the
cointegration between these two credit spreads. Palladini and Portes (2011), for example,
confirmed that CDS spreads and bond spreads are bound by cointegration relationship, even 19 Leigh (2010), for example, found that fiscal austerity tends to be contractionary in the short run while Uhlig’s
(2010) study indicated that the long-run benefits of austerity through maintaining a sound fiscal account could outweigh the short-run costs.
20 We run a cross-sectional regression for developed countries in year 2011 and find that the VIF values are also
quite high.

23
though a theoretical one-to-one parity is rejected. Similar results were also found in Zhu (2006)
and Ammer and Cai (2007). These results along with our finding suggest that an explicit
consideration of the long-run equilibrium relationship would be important in analyzing the
pricing of sovereign credit risk. We thus go further to examine the pricing dynamics using a
vector error correction model based on interpolated monthly data in Section 6.
Central bank monetary policy rates turn out to be significantly negative in the CDS
spread level regressions, hinging on the fact that central banks cut interest rates in the acute
phase of the crises in light of the ever-worsening global financial and real economic conditions
and the perceived risks of deflation. The negative relation between CDS spreads and the policy
interest rates indicates a limited role of conventional monetary policy during the periods of
financial stress in lowering investors’ default risk aversion as suggested by Manganelli and
Wolswijk (2009). Our finding is thus more consistent with Collin-Dufresne, Goldstein, and
Martin (2001) who have documented that the credit spread changes of the U.S. corporate bonds
covariate negatively with interest rates.
Inflation appears to be significant only if time dummies are not included. The
demographic variable is a significant regressor in the CDS spread level regressions but has little
explanatory power in the spread change regressions. As expected, higher old age dependency
ratios will intensify concerns of a sovereign debt default and induce a hike in CDS spreads. In
particular, the financial crisis may have exacerbated the strains an aging population can place on
a nation’s economy given the rocketing costs and expenditures on health care and the fragile
state of fiscal finances. Similarly, the crisis has highlighted the dangers of improperly funded
pension plans (which many U.S. states and municipalities have fallen afoul of). Exchange rates
do not seem to be an important determinant of CDS prices while the interpretation of the
coefficient is more complicated as we use the changes of the real rates instead of the levels in all
regressions due to the notoriety of nonstationarity of the exchange rates.21 Like fiscal balance,
current account balance delivers virtually no explanatory power. In contrast, the panel regression
21 Conventional statistical measures such as t-statistic and R-squared are inapplicable if regression is involved with
nonstationary regressors while the dependent variable is integrated of order zero (e.g., Baffes 1997). If the dependent variable and some regressors are both nonstationary but not cointegrated, regression tends to produce spurious results. If there does exist cointegration, then error-correction model (ECM) is preferred. In our case, due to short time series, it is not appropriate to conduct cointegration tests and set up ECM models.

24
reveals important effects of common time trends. The year dummies for global financial crisis
(2008) and European debt crisis (2011) are both significantly positive, indicating a sharp rise in
spreads in these two turbulent years.
Table 4 reports estimates based on specification (2) for subgroup countries.22 By and
large, the results are consistent with earlier findings from the entire sample. Public debt ratio,
future fiscal positions, and real growth prospects, for instance, are generally important driving
forces in the variation of the sovereign debt credit risk for both developed and developing
countries. CDS spreads comove closely with bond spreads. And all CDS markets are affected by
time effects with the year dummy for global financial crisis having stronger impacts. Singling
out Eurozone countries from the developed world does not change much the regression results
especially in the CDS level regression. A notable exception is gross debt ratio which does not
have strong explaining power in difference regression for euro area but turns out to be
statistically significant when all rich countries are considered. Policy rates, inflation, and external
balances tend to be more relevant in the pricing of the CDS market for developed countries
compared to their developing counterparts, holding other things equal. When the demographic
variable is considered, the proportion of old-age people versus that of working age appears to be
influential in determining the prices of sovereign debt insurance for developing countries
according to the CDS difference regression (with a counterintuitive coefficient) but not
significant for developed countries, indicating some further heterogeneity there. One possible
explanation would be that pension systems in the developing world are not as complete as the
rich world counterparts and hence may not be able to handle benefits if their demographics were
as old as the rich world.
5.2 Results from Dynamic GMM Estimation
Table 5 presents the results of the System GMM estimation for the dynamic simultaneous
equations model which assumes the interaction among CDS spreads, (future) real GDP growth,
(future) fiscal position, gross government debt, and bond spreads and treats other variables (in
lags) as predetermined regressors. As discussed before, the System GMM estimator allows us to
22 We do not report results for the stressed Eurozone countries as the estimates could be severely biased due to the
small sample size.

25
obtain more efficient estimates than fixed-effects regression models when there exists time-
invariant unobserved heterogeneity, simultaneity, and dynamic relationships between current
values of the explanatory variables and past values of the dependent variable. Nevertheless, to
make sure whether the model is a valid representation of empirical dynamic relationships, it is
important to check if there is second-order autocorrelation or the specification suffers over-
identification. The Arellano and Bond (1991) autocorrelation test addresses the concern whether
or not we have included enough lags describing the dynamic intercorrelation. By construction,
the error terms ( ite ) are expected to be correlated in first-order differences (AR(1)) but
uncorrelated in second-order differences (AR(2)). The heteroskedasticity-robust Hansen J-test of
over-identification is designed to check the validity of instruments under the null hypothesis that
our instruments are valid. Our results fail to reject the null hypothesis of no second-order
autocorrelation in residuals and the null of validity of instruments, indicating that our dynamic
setting tends to be appropriate and may not suffer “weak instrument problem”.
For consistency, like panel regression, we consider 6 specifications depending on the
inclusion of crisis timing indicators and current observables or projected values of fiscal balance
and economic growth. As expected, the lag of CDS spreads (in logarithms) is significantly
positive, in line with many recent studies such as Cont and Kan (2011) and Alper et al. (2012).
This dynamic process of CDS spread movements further justifies the application of the dynamic
simultaneous equations model to improve traditional fixed-effects estimates as the latter may be
biased, with the direction of the bias opposite to that of the dynamic relation (e.g., Wooldridge,
2002; Roodman, 2008). The high degree of persistency in the prices of sovereign debt insurance
– ranging from 0.77 to 0.93 – also hinges on the fact that the evidence of testing for unit roots in
the levels of CDS spreads is often mixed (e.g., Dieckmann and Plank, 2011).
The most striking finding based on the dynamic system-GMM estimates is the important
role the time common trends play in affecting the pricing of the sovereign debt default risk.
When including the crisis timing indicators, impact of public debt on CDS spreads tends to be
substantially weakened, the magnitude of the estimated coefficients on the current value and the
first lag both falling dramatically and becoming statistically insignificant from zero. In contrast,
the significance of future fiscal positions affecting CDS spreads turns out to be strengthened,
with the coefficients changing from -0.01 to -0.07 for the current value and from 0.02 to 0.04 for

26
the first lag. The coefficients on other regressors also differ considerably when we account for
the time common trends. Noticeably, even not considering the time effects, the impacts of the
current value of public debt and its first lag appear to be offsetting, albeit significant from zero.
This finding shares the same spirit of Wintoki, Linck, and Netter’s (2012) work on the role of
board size on firm performance. They find that when taking into consideration unobserved
heterogeneity, simultaneity, and dynamic relation, the strong negative relation between board
size and firm performance suggested by traditional fixed-effects estimates is no longer
statistically significant. The less significant coefficients on public debt and its lag, nevertheless,
do not preclude its impact on the CDS spreads but rather provide a manifestation of the dynamic
entangling between a country’s debt load and the prices of sovereign debt insurance against
default, which is further affected by the time common trends or other global factors.
The endogenized regressors except gross debt – future fiscal balance, future real growth,
and bond spreads – are all significant in specification (2) with correct sign of accumulative
effects over current values and their first lags. Overall, inference of the impact of these factors on
CDS spread movements is much similar to that of fixed-effects estimates. For example, CDS
spreads tend to tighten if fiscal situation is expected to improve or there are brighter output
growth prospects but will increase given a hike in bond yields. Other regressors – the first lags of
policy rates, inflation, external balance, changes in real effective exchange rates, and old-age
dependence ratio – seem lack explanatory strength in accounting for the variation of CDS
spreads when time effects have been addressed. Using currently observable primary balance and
growth rate instead of projected values delivers similar results to that from specification (2)
except that the accumulative effects of bond yields now appear to be counterintuitive. In
addition, compared to panel regression, the primary balance provides slightly more explaining
power in the dynamic simultaneous equations model. It is also noteworthy that in the
specifications without time dummies, both current and future GDP growths fail to provide
correct signs of an accumulative effect. When both current observables and projected variables
are included, once again, the explanatory ability of the model turns out to be severely
undermined, indicating that multicollinearity remains a serious problem even though we have
accounted for unobserved heterogeneity, simultaneity, and dynamic relationships among the
explanatory variables and the dependent variable.

27
Table 6 presents the System-GMM estimate for developed, developing, and Eurozone
countries.23 Generally, the expected primary deficit and real growth as well as bond spreads
represent the main explanatory variables for advanced countries including the Eurozone when
their CDS contracts are priced. The impact of the debt load ratio on CDS spreads is similar to
that of the full sample as its intertemporal coefficients have opposite signs with the same
magnitude. The lagged inflation rate and current account balance tend to present more power in
affecting the movements of CDS spreads for developed countries but is not seen in the
subsample of Eurozone countries. The negative coefficient on lagged inflation rate seems
counterintuitive as inflation is believed to be unfavorable to sovereign credit rating (e.g., Haque,
Mark and Mathieson, 1998) and a soaring inflation would lead to higher CDS spreads. One
plausible explanation is that the negative effect of the lagged variable represents an adjustment to
contemporaneous relation which is usually positive (e.g., Cottarelli and Jaramillo, 2012 and our
panel regression results). Improvement in current account balance would be rewarded by
reduction in CDS spreads, which is consistent with the finding by Mellios and Paget-Blanc
(2006). For developing countries, the fiscal variables and bond spreads appear to be less
influential in pricing their sovereign debt insurance while growth prospect remains an important
determinant. In addition, consistent with panel regression results, an aging population potentially
has more impact on pricing the sovereign default risk for developing countries than that for their
rich counterparts. As explained above, this is probably because the market has concerns on the
pension system in emerging market countries which is not mature enough to support a rising
amount of elderly persons, and thus imposes an extra fiscal burden on their governments.
6. Robustness
Using annual averages for CDS and bond spreads and limited observations in the time dimension
of the sample data have prevented our analysis fully exploiting the time-series properties of the
two credit prices. Particularly, cointegration relationship between the CDS market and the cash
bond market has been well established (e.g., Zhu 2006; Ammer and Cai 2007; Palladini and
Portes 2011; among others). This suggests that models taking into account this long-run
equilibrium relationship are warranted. On the other hand, to match the high frequency of
23 Like in Table 4, we only report results from specification with future primary balance and future real growth to
conserve space.
28
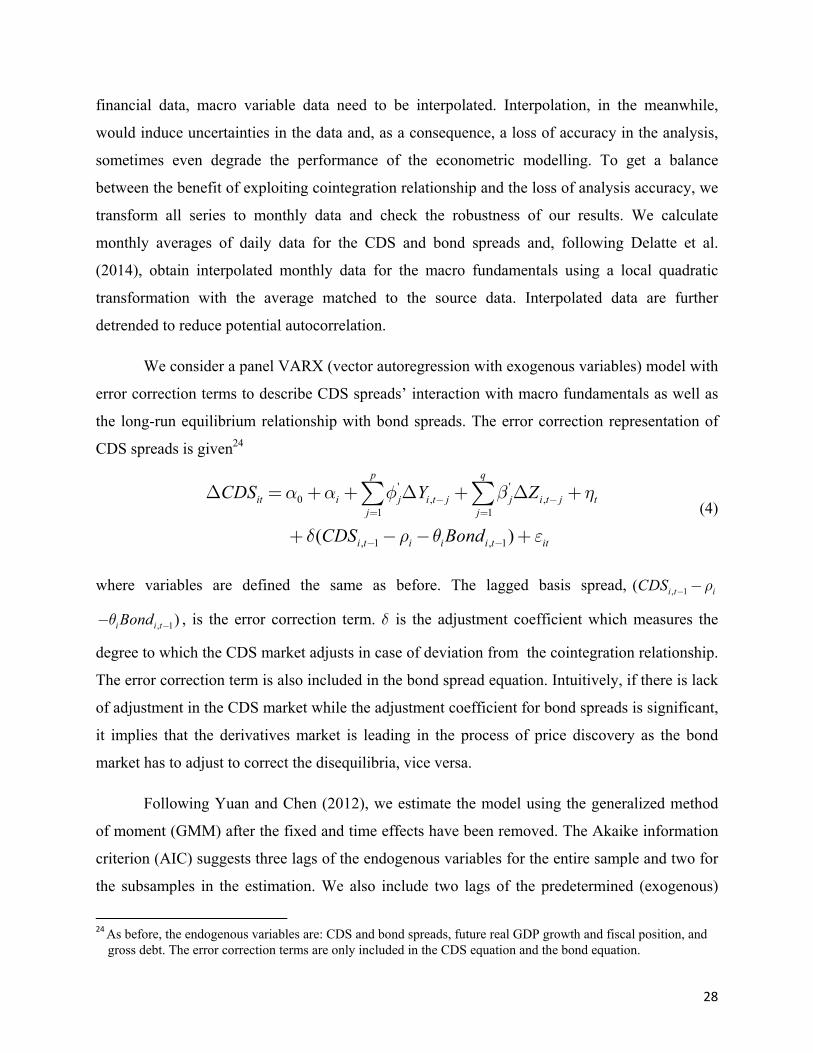
financial data, macro variable data need to be interpolated. Interpolation, in the meanwhile,
would induce uncertainties in the data and, as a consequence, a loss of accuracy in the analysis,
sometimes even degrade the performance of the econometric modelling. To get a balance
between the benefit of exploiting cointegration relationship and the loss of analysis accuracy, we
transform all series to monthly data and check the robustness of our results. We calculate
monthly averages of daily data for the CDS and bond spreads and, following Delatte et al.
(2014), obtain interpolated monthly data for the macro fundamentals using a local quadratic
transformation with the average matched to the source data. Interpolated data are further
detrended to reduce potential autocorrelation.
We consider a panel VARX (vector autoregression with exogenous variables) model with
error correction terms to describe CDS spreads’ interaction with macro fundamentals as well as
the long-run equilibrium relationship with bond spreads. The error correction representation of
CDS spreads is given24
' '0 , ,
1 1
, 1 , 1 ( )
p q
it i j i t j j i t j tj j
i t i i i t it
CDS Y Z
CDS Bond
a a f b h
d r q e
- -= =
- -
D = + + D + D +
+ - - +
å å (4)
where variables are defined the same as before. The lagged basis spread, , 1( i t iCDS r- -
, 1)i i tBondq -- , is the error correction term. d is the adjustment coefficient which measures the
degree to which the CDS market adjusts in case of deviation from the cointegration relationship.
The error correction term is also included in the bond spread equation. Intuitively, if there is lack
of adjustment in the CDS market while the adjustment coefficient for bond spreads is significant,
it implies that the derivatives market is leading in the process of price discovery as the bond
market has to adjust to correct the disequilibria, vice versa.
Following Yuan and Chen (2012), we estimate the model using the generalized method
of moment (GMM) after the fixed and time effects have been removed. The Akaike information
criterion (AIC) suggests three lags of the endogenous variables for the entire sample and two for
the subsamples in the estimation. We also include two lags of the predetermined (exogenous)
24 As before, the endogenous variables are: CDS and bond spreads, future real GDP growth and fiscal position, and
gross debt. The error correction terms are only included in the CDS equation and the bond equation.

29
variables in the model. To obtain the error correction term, routine unit root tests and the
Johansen cointegration test have applied to the two credit spreads for each country. If the series
have passed these tests, we set the cointegrating coefficients to be the same as the ones suggested
in the Johansen cointegration test.25 Otherwise, like Zhu (2006), we allow ir and iq to be freely
determined within the model. Note that, Zhu (2006) restricted the cointegrating coefficients to be
0ir = and 1iq = as suggested in theory. However, our cointegration analysis, in line with
Palladini and Portes (2011), indicates that a theoretical one-to-one arbitrage relationship
generally does not exist between the two credit prices.
Table 7 reports the estimates of the error correction representation of CDS spreads in the
model. Overall, the main results are qualitatively consistent with those based on annual data. It
turns out that the pricing of CDS markets tends to be significantly associated with future fiscal
position and growth prospects as well as the movements in cash bond markets. The debt load
shows some explanatory power with the effect being more pronounced for the Eurozone, which
is not revealed from the analysis based on the annual data. One possible explanation is that from
yearly observations the effect of crisis year dummies dominates the impact of debt load on CDS
spread pricing while from monthly observations the concurrence of the surge of CDS spreads
and the rise in public debt in the Eurozone stands out more prominently for a sustained period of
time. Policy rates are likely to be more relevant for developed sovereigns’ CDS markets. This
hinges on the fact that central banks in most advanced countries have aggressively cut their
policy rates during the period of crises. As regards the adjustment for pricing disequilibria, the
CDS markets for advanced countries seem to correct pricing errors more quickly than those for
developing countries, although none of the adjustment coefficients are statistically significant.
The insignificant coefficients are indeed not unexpected given our panel data framework (it is
also true for the bond spread equation, not reported here), because many studies have found that
whether the derivatives market plays a leading role in the price discovery relative to the cash
bond market or the opposite is rather country-specific (e.g. Bowe et al. 2009; Fontana and
Scheicher 2010; Coudert and Gex 2011; Palladini and Portes 2011). In this regard, while
including the error correction term does not provide unambiguous information regarding the
25 Palladini and Portes (2011) found that the cointegrating coefficients in the VECM model of CDS and bond
spreads in fact are the same parameters in the Johansen cointegration test.
30
price discovery, the main benefit is that it allows us to capture the long-run equilibrium
relationship between the two credit prices when modelling the pricing of sovereign credit risk.
7. Conclusion
In this paper, we use fixed-effects panel data models and a dynamic simultaneous equations
model to analyze the impact of austerity-oriented fiscal adjustments and macroeconomic
fundamentals on the pricing of sovereign debt default risk for a panel of 36 countries. Both
developed and developing countries that have undergone austerity recently are considered. Our
sample covers the majority of the Eurozone countries including those which have been most
mired in the sovereign debt trouble. The fixed-effects panel models allow us to control for time-
invariant country-specific heterogeneity without observing it. Unobserved heterogeneity is
possibly correlated with explanatory variables and thus likely leads to inconsistent estimates,
which has been a pervasive problem in cross-sectional regression analysis. We are motivated to
use the dynamic simultaneous equations model to further our analysis as we are quick to note
that fixed-effects models may not solve all endogeneity problems. Particularly, in our case,
prices of sovereign debt risk may interact with fiscal variables and macroeconomic fundamentals
contemporaneously and/or intertemporally.
Future fiscal balances were projected to be improving especially for developed countries
including the Eurozone over the sample period of 2005-2011. As countries considered herein
have undergone certain form of austerity practice recently, it is reasonable, albeit arguable, to
believe that the projected reduction in fiscal deficits might be seen as the result of austerity
measures. Based on fixed-effects panel regression and the dynamic System GMM estimates, we
find that the improving expected fiscal situation plays an important role in boosting market
participants’ confidence in the capability of indebted countries to repay their amount due and
thus leads to lower credit default swap spreads. But the short-term fiscal balance is not found to
be significant. Future output growth, public debt load, and bond spreads are also important
driving forces affecting the pricing of sovereign debt insurance. The impact of gross debt,
nevertheless, tends to be affected substantially by introducing the time indicators of the global
financial meltdown and Eurozone debt crisis, particularly when dynamic interactions are
considered.
31
Our analysis shows that both short-term variables (current government debt and real
growth) and long-term variables (future fiscal balance and future growth) are important factors
affecting the spread movements of sovereign CDS markets. This result differs from the work of
Cottarelli and Jaramillo, which found that only short-term output growth and fiscal variables
were significant determinants of credit default swap spreads in 2011. However, we notice that
pairing up the current variables and their future counterparts in the regression may suffer a
multicollinearity problem and thus deliver insignificant coefficients. Given the significance of
both short- and long-term fiscal and macro fundamentals and in light of the Eurozone’s recent
experience, policymakers may have to seek a balance between achieving long-term public
finance goals and boosting short-term economic growth in their austerity practice.
It is important to note that our results should be interpreted with some caution. The
dataset covers a relatively short timeframe and is limited by the availability of CDS spread data
given that there have been numerous instances of austerity over the last forty years. The results
may also be unique to 2005-2011 as the tumultuous events of the financial crisis and the
resulting recession were unlike any other seen in the post-war period. In addition, it is noticeable
that some emerging market economies that did not employ austerity (China, Brazil, and India for
instance) were incredibly resilient in the face of the financial crisis and powered global economic
growth. They were able to maintain strong economic growth and low debt levels despite fiscal
stimulus programmes. Thus, future research focusing on these cases may be also particularly
interesting and would provide further insights into the pricing of the sovereign credit markets.

32
Acknowledgment
We would like to thank Dr. Valérie Mignon, the Editor, and two anonymous referees for their
very valuable comments and suggestions. All remaining errors are our own.
33
References
Alesina, Alberto, and Silvia Ardagna. (2009). Large Changes in Fiscal Policy: Taxes versus
Spending." National Bureau of Economic Research, Oct. 2009.
Alper, C. E., Forni, L., and Gerard, M. (2012). Pricing of sovereign credit risk: Evidence from
advanced economies during the financial crisis, IMF Working Paper, WP/12/24.
Ammer, J. and Cai, F. (2007). Sovereign CDS and bond pricing dynamics in emerging markets:
Does the cheapest-to-deliver option matter? International Finance Discussion Paper,
Board of Governors of the Federal Reserve System (912).
Arellano, M., and Bond, S. (1991). Some tests of specification for panel data: Monte Carlo
evidence and an application to employment equations. Review of Economic Studies 58,
277-297.
Attinasi, M. G., Checherita, C. and Nickel, C., ”What explains the surge in euro area sovereign
spreads during the financial crisis of 2007-09?”, ECB Working Paper (2009).
Augustin, P. (2012). Sovereign credit default swap premia, Working Paper, New York
University, Stern School of Business EC-12-1
Baffes, John (1997) Explaining stationary variables with non-stationary regressors. Applied
Economics Letters, 4(1997): 69-75.
Baltagi, B. and Chang, Y. (2000). Simultaneous equations with incomplete panels. Econometric
Theory, Vol. 16, 269-279.
Baumeister, C. and Benati, L. (2013). Unconventional monetary policy and the Great Recession:
Estimating the macroeconomic effects of a spread compression at the zero lower bound.
Inernational Journal of Central Banking, Vol. 2, No.2, 165-212.
BIS, 2011. The impact of sovereign credit risk on bank funding conditions. Bank for
International settlements.
Blundell, R., and Bond, S. (1998). Initial conditions and moment restrictions in dynamic panel
data models. Journal of Econometrics, Vol. 87, 115-143.
Bowe, M., Klimaviciene, A., and Taylor, A. P. (2009) “Information Transmission and Price
Discovery in Emerging Sovereign Credit Risk Markets”. Working Paper.

34
De Bruyckere, V., Gerhardt, M., Schepens, G., Vander Vennet, R., 2012. Bank/sovereign risk
spillovers in the European debt crisis. National Bank of Belgium Working Paper
Research No. 232.
Cantor, R. Packer, F., (1996). Determinants and impact of sovereign credit ratings. FRB NY
Economic Policy Review, 2(2).
Cecchetti, Stephen G., M.S. Mohanty, and Fabrizio Zampolli (2011). "The Real Effects of Debt."
Working Paper, Sept. 2011.
Collin-Dufresne, P., Goldstein, R. S. and Martin, J. S.: 2001, The determinants of credit spread
changes, Journal of Finance 56(6), 2177—2207.
Cont, R. and Kan, Y.H. (2011). Statistical modeling of credit default swap portfolios. Working
Paper, Columbia University, New York.
Cornwell, C., Schmidt, P., and Wyhowski, D. (1992). Simultaneous equations and panel data.
Journal of Econometrics, Vol. 51, 151-181.
Cottarelli, C. and Forni, L, Gottschalk, L., and Mauro, P. (2010). Default in today’s advanced
economies: Unnecessary, undesirable, and unlikely. IMF Working Paper
Cottarelli, Carlo and Jaramillo, L. (2011). Challenges of Budgetary and Financial Crisis in
Europe (includes annex with Cottarelli and Jaramillo study), IMF, London.
Cottarelli, C. and Jaramillo, L. (2012). Walking hand in hand: Fiscal Policy and Growth in
advanced economies, IMF Working Paper, WP/12/137.
Coudert, V. and Gex, M. 2010. Credit default swap and bond markets: which leads the other?
Financial Stability Review, Banque de France.
Delatte, A.-L., Gex, M., López-Villavicencio, A., 2012. Has the CDS market influenced the
borrowing cost of European countries during the sovereign crisis? Journal of
International Money and Finance 31, 481–497.
Delatte, A.-L., Fouquau, J., & Portes, R. (2014). Nonlinearities in sovereign risk pricing: The
role of CDS Index Contracts, NBER working papers 19985.
Dieckmann, S. and Plank, T. (2011). Default risk of advanced economics: An empirical analysis
of credit default swaps during the financial crisis. Working Paper.
Duffie, D. (1999). Credit swap valuation. Financial Analysts Journal 55(1), 73-87.
35
Edwards, S. (1984). LDC foreign borrowing and default risk: An empirical investigation, 1976-
80. American Economic Review, 74(4), 726-34.
Edwards, S. (1986). The pricing of bonds and bank loans in international markets: An empirical
analysis of developing countries’ foreign borrowing. European Economic Review, 30,
565–589.
Eichengreen, B., and R. Portes. (1989). ‘‘After the Deluge: Default, Negotiation, and
Readjustment during the Interwar Years.’’ In The International Debt Crisis in Historical
Perspective, edited by B. Eichengreen, and P. Lindert. Cambridge: MIT Press, 12–37.
Eichengreen, Barry, and Ashoka Mody, 2000, “What Explains Changing Spreads on Emerging-
Market Debt: Fundamentals or Market Sentiment?” in S. Edwards (ed.), Capital Flows
and the Emerging Economies: Theory, Evidence and Controversies (University of
Chicago Press), 107-134.
Fontana, A. and Scheicher, M. (2010). An analysis of euro area sovereign CDS and their relation
with government bonds, Working Paper No 1271, December 2010.
Giavazzi, F. and Marco P. (1990). "Can Severe Fiscal Contractions be Expansionary? Tales of
Two Small European Countries." NBER Working Paper, May 1990.
Guajardo, J., Leigh, D., and Pescatori A. (2011) "Expansionary Austerity: New International
Evidence." International Monetary Fund, July 2011.
Haque, N.U., Mark, N., and Mathieson, D.J. (1998) The relative importance of political and
economic variables in creditworthiness ratings, IMF Working Paper, WP/98/46.
Haugh, D., Ollivaud, P., and Turner, D. (2009) What drives sovereign risk premiums? An
analysis of recent evidence from the euro area. OECD Working Paper No. 718
Hayakawa, K. (2005). Small sample bias properties of the System GMM estimator in dynamic
panel data models. Hi-Stat Discussion Papers No. 82, Hitotsubashi Univeristy.
Heinemann, F. and Winschel, V. (2001). Public deficits and borrowing costs: The missing half of
market discipline. ZEW Discussion Paper No. 16.
Hull, J., Predescu, M., and White, A. (2004). The relationship between credit default swap
spreads, bond yields, and credit rating announcements, Journal of Banking and Finance,
28(11), 2789-2811.

36
Judsona, Ruth A. and Owenb, Ann L. (1999). Estimating dynamic panel data models: a guide for
macroeconomists, Economics Letters, Volume 65, Issue 1, October 1999, Pages 9–15
Kisgergely, Kornél (2009) What moved sovereign CDS spreads in the period of financial
turbulence? Report on Financial Stability (Update), November 2009.
Klepsch, Catharina, and Timo Wollmershauser. "Yield Spreads on EMU Government Bonds -
How the Financial Crisis Has Helped Investors to Rediscover Risk."
Intereconomics/Review of European Economic Policy 46.3 June (2011): 169-76.
Kumar, Manmohan S., and Jaejoon Woo. "Public Debt and Growth.” International Monetary
Fund, July 2010.
Lane, Philip R. and Gian Maria Milesi-Ferretti (2011) The Cross-Country Incidence of the
Global Crisis. IMF Economic Review 59, 77-110.
Leigh, Daniel (2010) Will It Hurt? Macroeconomic Effects of Fiscal Consolidation, in World
Economic Outlook: Recovery, Risk, and rebalancing, IMF, October 2010.
Longstaff, Francis A., Jun Pan, Lasse H. Pedersen, and Kenneth J. Singleton. "How Sovereign is
Sovereign Credit Risk?" American Economic Journal: Macroeconomics 3.2 Apr. (2011):
75-103.
Manganelli, S. and G. Wolswijk (2009). What drives spreads in the euro area government bond
market? Economic Policy, 58: 191-240.
Mellios, C. and Paget-Blanc, E. (2006) Which factors determine sovereign credit ratings?
European Journal of Finance, 12 (4), 361-377.
Palladini, G. and Portes, R. (2011). Sovereign CDS and bond pricing dynamics in the euro-area.
NBER Working Paper 17586.
Pan, J. and Singleton, K. J. (2008) Default and recovery implicit in the term structure of
sovereign CDS spreads, Journal of Finance 63, 2345–2384.
Plank, T. J. (2010). Do macro-economic fundamentals price sovereign CDS spreads of emerging
economies? Working Paper.
Reinhart, Carmen M., Reinhart, Vincent R., and Rogoff, Kenneth S. (2012). Public debt
overhangs: Advanced-economy episodes since 1800. Journal of Economic Perspectives,
26(3): 69-86.
37
Reinhart, Carmen M., and Rogoff, Kenneth S. (2010a). Growth in a time of debt. American
Economic Review, Vol 100, No. 2. May 2010.
Reinhart, Carmen M., and Rogoff, Kenneth S. (2010b). Debt and growth revisited. MPRA Paper
No. 24376, August 2010.
Roodman, D.M. (2006). How to Do xbabond2: An introduction to ‘Difference’ and ‘System’
GMM in Stata. Center for Global Development, Working Paper No. 103.
Roodman, D.M. (2008). Through the looking glass, and what OLS found there: on growth,
foreign aid, and reverse causality. Working Paper.
Roodman, D.M. (2009). A note on the theme of too many instruments. Oxford Bulletin of
Economics and Statistics 71(1): 135-158
Ruggeri, Joe, and Yang Zou (2007). "The fiscal burden of rising dependency ratios." Population
Research and Policy Review 26, 2, 185-201.
Shambaugh, Jay (2012). The Euro’s Three Crises. Brookings Papers on Economic Activity,
Spring 2012.
Stigum, Marcia, and Anthony Crescenzi. Stigum's Money Market. 4th ed. New York: McGraw-
Hill, 2007. Print.
Studenmund, A. H., Using Econometrics: A Practical Guide, Sixth Edition, 2011, Pearson.
Uhlig, Harald (2010). Some fiscal calculus, American Economic Review, Vol 100, No. 2, 30-34.
Wintoki, M.B., Linck, J.S., and Netter, J.M. (2012). Endogeneity and the dynamics of internal
governance. Journal of Financial Economics 105, 581-606.
Yuan, C. and Chen, R. (2012). Policy transmissions, external imbalances, and their impacts:
cross-country evidence from BRICS, Working Paper.
Zhu, H. (2006). An empirical comparison of credit spreads between the bond market and the
credit default swap market, Journal of Financial Services Research, Vol. 29 (3), 211-235.

38
Table 1. Summary Statistics
Variable Obs Mean Std. Dev. Min 25th Median 75th Max
Panel A: Entire Sample (36 countries)
CDSSpread 207 146.80 247.99 2.18 25.68 69.41 185.82 2141.49 GrossDebt 207 56.94 39.90 4.52 32.95 46.83 71.62 229.61 PrimaryBal 207 -3.57 3.46 -18.60 -5.20 -3.39 -1.83 8.18 RealGDP 207 1.60 4.27 -14.84 -0.01 1.83 4.07 10.49 FutureGovbal 207 -2.94 3.27 -14.21 -4.63 -3.21 -1.57 11.49 FutureGDP 207 2.93 1.67 -0.33 1.80 2.60 4.05 8.55 BondSpread 205 2.74 3.09 -1.55 0.72 1.99 3.83 14.41 PolicyRate 207 4.23 3.71 0.10 1.25 3.63 6.13 18.00 Inflation 207 3.94 3.62 -1.71 1.82 3.04 4.84 25.20 CurrentAcct 207 -2.74 6.70 -25.20 -7.09 -2.25 1.86 14.48 ExchangeRate 207 1.06 5.35 -17.57 -1.52 1.06 4.09 14.34 OldAgedDR 207 22.95 5.29 8.19 19.94 23.80 25.77 36.58
Panel B: Developed Countries (24 countries)
CDSSpread 130 101.28 221.85 2.18 9.63 48.26 92.02 2094.69 GrossDebt 130 70.12 43.32 4.52 41.07 63.76 89.27 229.61 PrimaryBal 130 -4.04 3.48 -18.60 -5.82 -3.50 -1.96 3.23 RealGDP 130 0.92 3.57 -14.26 -0.77 1.64 2.74 10.49 FutureGovbal 130 -2.93 3.57 -14.21 -4.63 -3.27 -1.10 11.49 FutureGDP 130 2.23 1.34 -0.33 1.47 2.02 2.88 7.95 BondSpread 130 1.77 2.14 -1.55 0.52 1.26 2.71 14.41 PolicyRate 130 2.18 1.47 0.10 1.00 1.55 3.85 6.67 Inflation 130 2.22 1.64 -1.71 1.38 2.21 3.20 10.37 CurrentAcct 130 -1.31 6.08 -15.61 -4.52 -1.56 2.91 14.48 ExchangeRate 130 0.76 4.46 -13.22 -0.75 0.82 2.21 14.34 OldAgedDR 130 24.66 4.44 15.85 22.07 25.20 26.52 36.58
Panel C: Developing Countries (12 countries)
CDSSpread 77 223.65 271.35 6.00 59.44 185.82 283.12 2141.49 GrossDebt 77 34.70 18.25 7.79 17.20 35.99 44.99 81.31 PrimaryBal 77 -2.77 3.28 -10.78 -4.34 -3.20 -1.38 8.18 RealGDP 77 2.75 5.07 -14.84 1.19 3.94 6.23 9.80 FutureGovbal 77 -2.96 2.71 -7.58 -4.50 -3.10 -2.01 7.75 FutureGDP 77 4.10 1.50 -0.13 3.04 4.15 5.25 8.55 BondSpread 75 4.43 3.71 -1.36 1.83 3.83 6.46 13.80 PolicyRate 77 7.69 3.78 0.20 5.12 7.75 9.21 18.02 Inflation 77 6.86 4.14 1.03 3.88 6.07 9.01 25.20 CurrentAcct 77 -5.17 7.05 -25.20 -8.65 -4.66 -0.97 11.06 ExchangeRate 77 1.57 6.62 -17.57 -1.96 2.10 6.82 10.88 OldAgedDR 77 20.06 5.36 8.19 18.80 21.52 23.97 26.01
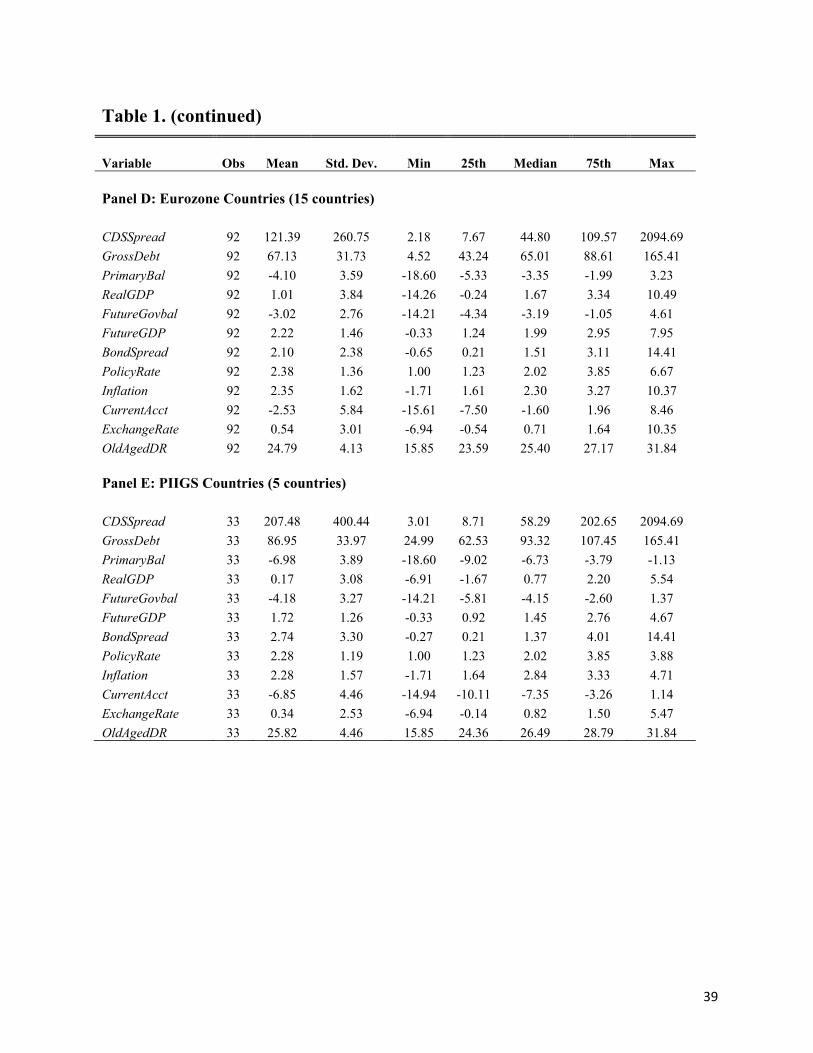
39
Table 1. (continued)
Variable Obs Mean Std. Dev. Min 25th Median 75th Max
Panel D: Eurozone Countries (15 countries)
CDSSpread 92 121.39 260.75 2.18 7.67 44.80 109.57 2094.69
GrossDebt 92 67.13 31.73 4.52 43.24 65.01 88.61 165.41
PrimaryBal 92 -4.10 3.59 -18.60 -5.33 -3.35 -1.99 3.23
RealGDP 92 1.01 3.84 -14.26 -0.24 1.67 3.34 10.49
FutureGovbal 92 -3.02 2.76 -14.21 -4.34 -3.19 -1.05 4.61
FutureGDP 92 2.22 1.46 -0.33 1.24 1.99 2.95 7.95
BondSpread 92 2.10 2.38 -0.65 0.21 1.51 3.11 14.41
PolicyRate 92 2.38 1.36 1.00 1.23 2.02 3.85 6.67
Inflation 92 2.35 1.62 -1.71 1.61 2.30 3.27 10.37
CurrentAcct 92 -2.53 5.84 -15.61 -7.50 -1.60 1.96 8.46
ExchangeRate 92 0.54 3.01 -6.94 -0.54 0.71 1.64 10.35
OldAgedDR 92 24.79 4.13 15.85 23.59 25.40 27.17 31.84
Panel E: PIIGS Countries (5 countries)
CDSSpread 33 207.48 400.44 3.01 8.71 58.29 202.65 2094.69
GrossDebt 33 86.95 33.97 24.99 62.53 93.32 107.45 165.41
PrimaryBal 33 -6.98 3.89 -18.60 -9.02 -6.73 -3.79 -1.13
RealGDP 33 0.17 3.08 -6.91 -1.67 0.77 2.20 5.54
FutureGovbal 33 -4.18 3.27 -14.21 -5.81 -4.15 -2.60 1.37
FutureGDP 33 1.72 1.26 -0.33 0.92 1.45 2.76 4.67
BondSpread 33 2.74 3.30 -0.27 0.21 1.37 4.01 14.41
PolicyRate 33 2.28 1.19 1.00 1.23 2.02 3.85 3.88
Inflation 33 2.28 1.57 -1.71 1.64 2.84 3.33 4.71
CurrentAcct 33 -6.85 4.46 -14.94 -10.11 -7.35 -3.26 1.14
ExchangeRate 33 0.34 2.53 -6.94 -0.14 0.82 1.50 5.47
OldAgedDR 33 25.82 4.46 15.85 24.36 26.49 28.79 31.84

40
Table 2. Averages by Year of Observation
Variable 2005 2006 2007 2008 2009 2010 2011 All
Panel A: Entire Sample (36 countries)
CDSSpread 41.50 38.01 34.41 136.86 223.57 166.23 277.85 146.80 GrossDebt 57.81 53.24 47.97 48.18 57.87 62.81 66.73 56.94 PrimaryBal -2.17 -2.44 -2.46 -3.45 -4.84 -4.66 -3.71 -3.57 RealGDP 3.42 5.10 5.11 1.53 -5.15 2.04 1.99 1.60 FutureGovbal -1.82 -1.77 -2.00 -2.35 -4.69 -4.09 -2.71 -2.94 FutureGDP 3.31 3.86 4.37 3.36 1.33 2.58 2.57 2.93 BondSpread 1.95 1.56 1.18 1.73 3.96 3.59 3.98 2.74 PolicyRate 5.09 5.51 5.60 5.92 3.42 2.59 2.75 4.23 Inflation 4.23 4.24 4.38 6.57 2.35 2.73 3.66 3.94 CurrentAcct -2.21 -4.18 -5.86 -5.74 -1.17 -0.57 -0.81 -2.74 ExchangeRate 2.44 1.44 3.23 3.52 -1.65 -0.05 0.74 1.06 OldAgedDR 22.66 22.73 22.76 22.80 22.81 23.10 23.54 22.95 No. of Obs 21 23 26 32 35 35 35 207
Panel B: Developed Countries (24 countries)
CDSSpread 6.94 5.76 5.65 63.73 94.00 120.90 270.95 101.28 GrossDebt 74.70 72.52 65.19 59.25 67.29 72.99 78.50 70.12 PrimaryBal -2.73 -3.06 -2.94 -3.52 -5.33 -4.98 -4.03 -4.04 RealGDP 2.40 4.07 4.21 0.73 -4.35 1.80 1.25 0.92 FutureGovbal -2.54 -2.39 -1.29 -1.18 -4.88 -4.20 -2.60 -2.93 FutureGDP 2.37 2.87 3.48 2.61 1.02 2.11 2.13 2.23 BondSpread 1.11 0.70 0.12 0.29 2.39 2.75 3.26 1.77 PolicyRate 2.15 2.69 3.61 4.04 1.47 1.14 1.29 2.18 Inflation 2.20 2.42 2.20 4.02 0.53 1.74 2.79 2.22 CurrentAcct -1.64 -2.56 -2.50 -3.50 -0.67 0.02 0.04 -1.31 ExchangeRate -0.66 0.10 1.67 2.73 0.43 -0.97 0.98 0.76 OldAgedDR 25.17 25.31 24.87 24.25 24.10 24.50 25.05 24.66 No. of Obs 12 12 14 20 24 24 24 130
Panel C: Developing Countries (12 countries)
CDSSpread 87.60 73.20 67.95 258.73 506.27 265.13 292.89 223.65 GrossDebt 35.31 32.21 27.88 29.73 37.32 40.60 41.06 34.70 PrimaryBal -1.43 -1.77 -1.90 -3.34 -3.77 -3.97 -3.02 -2.77 RealGDP 4.79 6.21 6.15 2.87 -6.90 2.55 3.59 2.75 FutureGovbal -0.87 -1.10 -2.83 -4.31 -4.29 -3.85 -2.97 -2.96 FutureGDP 4.57 4.94 5.40 4.61 2.02 3.60 3.52 4.10 BondSpread 3.21 2.60 2.41 4.12 7.38 5.44 5.54 4.43 PolicyRate 9.01 8.58 7.92 9.05 7.67 5.76 5.94 7.69 Inflation 6.94 6.24 6.92 10.82 6.31 4.89 5.56 6.86 CurrentAcct -2.97 -5.95 -9.77 -9.48 -2.27 -1.84 -2.67 -5.17 ExchangeRate 6.71 2.91 5.05 4.84 -6.17 1.95 0.22 1.57 OldAgedDR 19.32 19.91 20.30 20.40 19.99 20.05 20.25 20.06 No. of Obs 9 11 12 12 11 11 11 77

41
Table 2. (continued)
Variable 2005 2006 2007 2008 2009 2010 2011 All
Panel D: Eurozone Countries (15 countries)
CDSSpread 6.00 5.76 5.73 67.60 111.25 161.10 392.15 121.39
GrossDebt 66.46 65.60 58.48 57.23 67.08 73.42 79.18 67.13
PrimaryBal -2.97 -3.03 -3.10 -3.82 -5.82 -5.05 -3.96 -4.10
RealGDP 2.51 4.02 4.25 0.78 -5.11 1.50 1.26 1.01
FutureGovbal -2.54 -2.15 -0.94 -1.13 -5.41 -5.02 -3.11 -3.02
FutureGDP 2.47 2.67 3.49 2.66 0.84 1.91 2.02 2.22
BondSpread 1.30 0.85 0.10 0.07 3.22 3.60 4.47 2.10
PolicyRate 2.37 2.98 3.91 4.09 1.54 1.04 1.25 2.38
Inflation 2.49 2.62 2.33 4.09 0.29 1.70 3.07 2.35
CurrentAcct -2.76 -3.25 -2.96 -4.58 -2.02 -1.31 -1.22 -2.53
ExchangeRate 0.01 0.57 2.40 3.02 1.06 -3.69 0.23 0.54
OldAgedDR 24.87 25.18 24.56 24.21 24.50 24.87 25.46 24.79
No. of Obs 10 10 12 15 15 15 15 92
Panel E: PIIGS Countries (5 countries)
CDSSpread 7.62 7.93 7.69 48.08 127.00 327.71 846.43 207.48
GrossDebt 78.08 79.20 68.02 74.92 89.35 101.99 113.78 86.95
PrimaryBal -4.91 -4.48 -5.40 -7.93 -10.32 -8.20 -6.68 -6.98
RealGDP 1.89 3.32 3.19 -0.51 -4.17 -0.28 -1.26 0.17
FutureGovbal -3.06 -2.83 -1.11 -2.06 -8.41 -6.73 -4.58 -4.18
FutureGDP 2.16 2.17 3.10 2.13 0.25 1.12 1.28 1.72
BondSpread 1.31 0.88 0.13 -0.05 3.37 4.95 7.96 2.74
PolicyRate 2.02 2.79 3.85 3.88 1.23 1.00 1.25 2.28
Inflation 2.82 3.00 2.61 3.51 -0.17 1.64 2.81 2.28
CurrentAcct -6.53 -8.13 -8.27 -9.16 -6.26 -5.40 -4.38 -6.85
ExchangeRate 0.02 0.60 2.18 2.50 -0.52 -3.10 0.41 0.34
OldAgedDR 26.62 26.85 24.77 24.94 25.26 25.87 26.81 25.82
No. of Obs 4 5 5 5 5 5 5 33
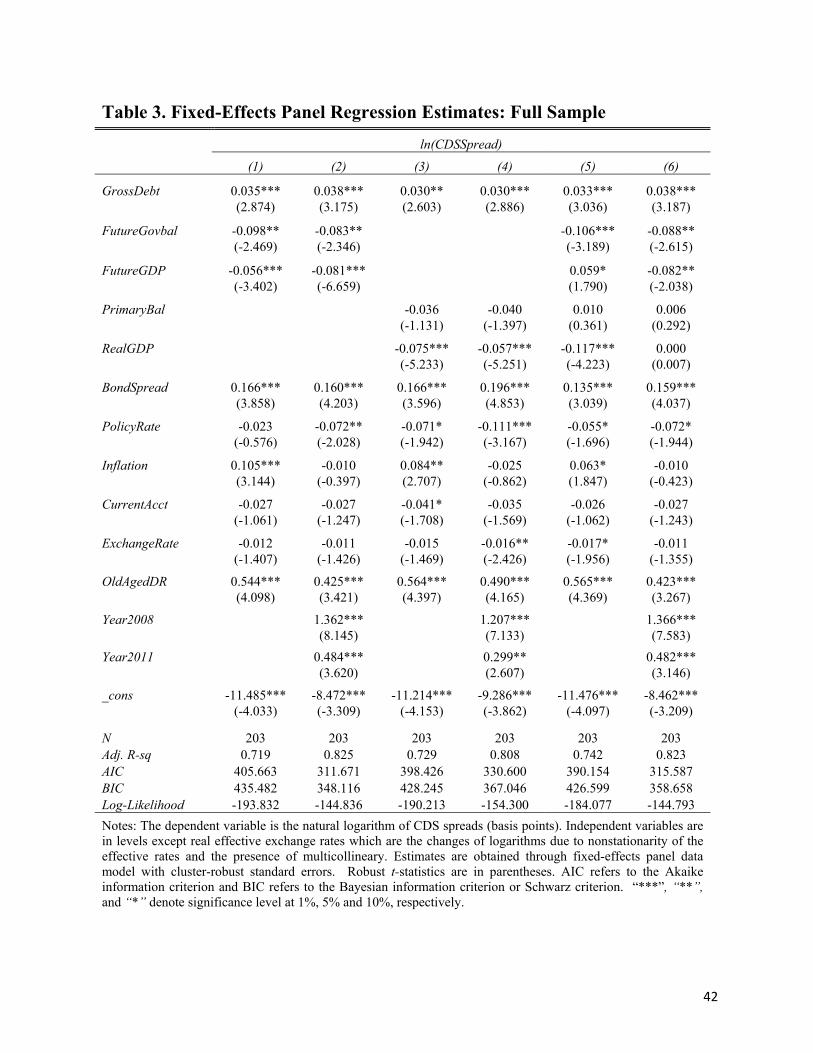
42
Table 3. Fixed-Effects Panel Regression Estimates: Full Sample
ln(CDSSpread)
(1) (2) (3) (4) (5) (6)
GrossDebt 0.035*** 0.038*** 0.030** 0.030*** 0.033*** 0.038*** (2.874) (3.175) (2.603) (2.886) (3.036) (3.187)
FutureGovbal -0.098** -0.083** -0.106*** -0.088** (-2.469) (-2.346) (-3.189) (-2.615)
FutureGDP -0.056*** -0.081*** 0.059* -0.082** (-3.402) (-6.659) (1.790) (-2.038)
PrimaryBal -0.036 -0.040 0.010 0.006 (-1.131) (-1.397) (0.361) (0.292)
RealGDP -0.075*** -0.057*** -0.117*** 0.000 (-5.233) (-5.251) (-4.223) (0.007)
BondSpread 0.166*** 0.160*** 0.166*** 0.196*** 0.135*** 0.159*** (3.858) (4.203) (3.596) (4.853) (3.039) (4.037)
PolicyRate -0.023 -0.072** -0.071* -0.111*** -0.055* -0.072* (-0.576) (-2.028) (-1.942) (-3.167) (-1.696) (-1.944)
Inflation 0.105*** -0.010 0.084** -0.025 0.063* -0.010 (3.144) (-0.397) (2.707) (-0.862) (1.847) (-0.423)
CurrentAcct -0.027 -0.027 -0.041* -0.035 -0.026 -0.027 (-1.061) (-1.247) (-1.708) (-1.569) (-1.062) (-1.243)
ExchangeRate -0.012 -0.011 -0.015 -0.016** -0.017* -0.011 (-1.407) (-1.426) (-1.469) (-2.426) (-1.956) (-1.355)
OldAgedDR 0.544*** 0.425*** 0.564*** 0.490*** 0.565*** 0.423*** (4.098) (3.421) (4.397) (4.165) (4.369) (3.267)
Year2008 1.362*** 1.207*** 1.366*** (8.145) (7.133) (7.583)
Year2011 0.484*** 0.299** 0.482*** (3.620) (2.607) (3.146)
_cons -11.485*** -8.472*** -11.214*** -9.286*** -11.476*** -8.462*** (-4.033) (-3.309) (-4.153) (-3.862) (-4.097) (-3.209)
N 203 203 203 203 203 203 Adj. R-sq 0.719 0.825 0.729 0.808 0.742 0.823 AIC 405.663 311.671 398.426 330.600 390.154 315.587 BIC 435.482 348.116 428.245 367.046 426.599 358.658 Log-Likelihood -193.832 -144.836 -190.213 -154.300 -184.077 -144.793
Notes: The dependent variable is the natural logarithm of CDS spreads (basis points). Independent variables are in levels except real effective exchange rates which are the changes of logarithms due to nonstationarity of the effective rates and the presence of multicollineary. Estimates are obtained through fixed-effects panel data model with cluster-robust standard errors. Robust t-statistics are in parentheses. AIC refers to the Akaike information criterion and BIC refers to the Bayesian information criterion or Schwarz criterion. “***”, “**”, and “*” denote significance level at 1%, 5% and 10%, respectively.
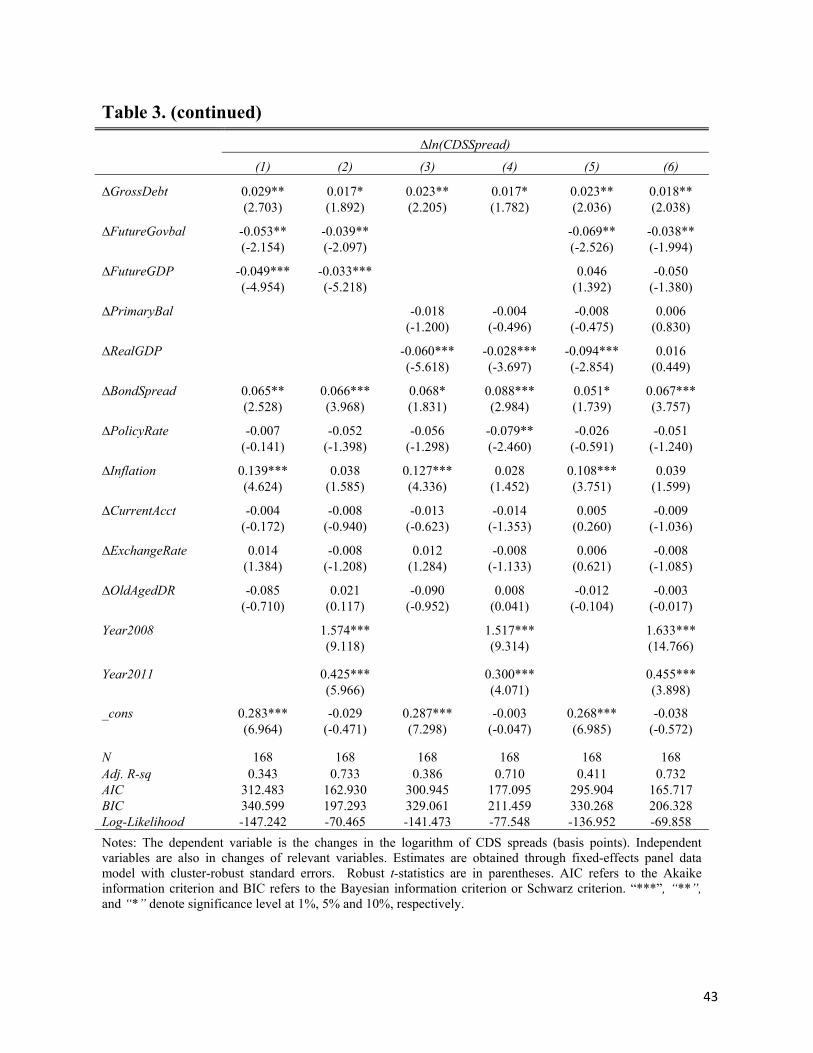
43
Table 3. (continued)
∆ln(CDSSpread)
(1) (2) (3) (4) (5) (6)
∆GrossDebt 0.029** 0.017* 0.023** 0.017* 0.023** 0.018** (2.703) (1.892) (2.205) (1.782) (2.036) (2.038)
∆FutureGovbal -0.053** -0.039** -0.069** -0.038** (-2.154) (-2.097) (-2.526) (-1.994)
∆FutureGDP -0.049*** -0.033*** 0.046 -0.050 (-4.954) (-5.218) (1.392) (-1.380)
∆PrimaryBal -0.018 -0.004 -0.008 0.006 (-1.200) (-0.496) (-0.475) (0.830)
∆RealGDP -0.060*** -0.028*** -0.094*** 0.016 (-5.618) (-3.697) (-2.854) (0.449)
∆BondSpread 0.065** 0.066*** 0.068* 0.088*** 0.051* 0.067*** (2.528) (3.968) (1.831) (2.984) (1.739) (3.757)
∆PolicyRate -0.007 -0.052 -0.056 -0.079** -0.026 -0.051 (-0.141) (-1.398) (-1.298) (-2.460) (-0.591) (-1.240)
∆Inflation 0.139*** 0.038 0.127*** 0.028 0.108*** 0.039 (4.624) (1.585) (4.336) (1.452) (3.751) (1.599)
∆CurrentAcct -0.004 -0.008 -0.013 -0.014 0.005 -0.009 (-0.172) (-0.940) (-0.623) (-1.353) (0.260) (-1.036)
∆ExchangeRate 0.014 -0.008 0.012 -0.008 0.006 -0.008 (1.384) (-1.208) (1.284) (-1.133) (0.621) (-1.085)
∆OldAgedDR -0.085 0.021 -0.090 0.008 -0.012 -0.003 (-0.710) (0.117) (-0.952) (0.041) (-0.104) (-0.017)
Year2008 1.574*** 1.517*** 1.633*** (9.118) (9.314) (14.766)
Year2011 0.425*** 0.300*** 0.455*** (5.966) (4.071) (3.898)
_cons 0.283*** -0.029 0.287*** -0.003 0.268*** -0.038 (6.964) (-0.471) (7.298) (-0.047) (6.985) (-0.572)
N 168 168 168 168 168 168 Adj. R-sq 0.343 0.733 0.386 0.710 0.411 0.732 AIC 312.483 162.930 300.945 177.095 295.904 165.717 BIC 340.599 197.293 329.061 211.459 330.268 206.328 Log-Likelihood -147.242 -70.465 -141.473 -77.548 -136.952 -69.858
Notes: The dependent variable is the changes in the logarithm of CDS spreads (basis points). Independent variables are also in changes of relevant variables. Estimates are obtained through fixed-effects panel data model with cluster-robust standard errors. Robust t-statistics are in parentheses. AIC refers to the Akaike information criterion and BIC refers to the Bayesian information criterion or Schwarz criterion. “***”, “**”, and “*” denote significance level at 1%, 5% and 10%, respectively.

44
Table 4. Fixed-Effects Panel Regression Estimates: Subsamples
Developed Developing Eurozone
Level Diff. Level Diff. Level Diff.
GrossDebt 0.036** 0.032** 0.051*** -0.008 0.027* 0.019 (2.628) (2.833) (4.167) (-0.550) (1.715) (0.516)
FutureGovbal -0.087** -0.047* -0.115*** -0.031 -0.105** -0.051** (-2.636) (-1.967) (-3.226) (-1.019) (-2.473) (-2.264)
FutureGDP -0.116*** -0.059** -0.047** -0.028*** -0.115*** -0.090** (-3.815) (-2.749) (-2.404) (-4.845) (-3.019) (-2.605)
BondSpread 0.202** 0.137* 0.143** 0.046** 0.180** 0.134* (2.662) (1.823) (2.862) (3.020) (2.584) (1.918)
PolicyRate -0.221** 0.088 -0.005 -0.067 -0.198* 0.098 (-2.684) (1.616) (-0.297) (-1.347) (-1.799) (1.569)
Inflation -0.002 0.081*** 0.006 0.007 -0.044 0.081* (-0.047) (2.885) (0.160) (0.365) (-0.688) (2.008)
CurrentAcct -0.082** -0.016 -0.012 0.007 -0.098* -0.036 (-2.207) (-0.586) (-0.470) (0.550) (-2.063) (-0.886)
ExchangeRate -0.019** -0.019 -0.012 -0.018** -0.015 -0.090 (-2.326) (-1.019) (-1.274) (-2.816) (-0.562) (-1.214)
OldAgedDR 0.369*** 0.064 0.649** -0.706*** 0.609*** 0.133 (2.878) (0.519) (2.909) (-3.214) (3.461) (0.796)
Year2008 1.800*** 1.501*** 0.901** 1.853*** 1.805*** 1.630*** (7.942) (7.565) (2.977) (9.185) (7.284) (6.874)
Year2011 0.674*** 0.326*** 0.336** 0.490*** 0.934** 0.452** (3.207) (2.923) (2.429) (4.800) (2.788) (2.605)
_cons -7.829*** 0.016 -11.061** -0.135** -13.407*** 0.076 (-3.240) (0.228) (-2.404) (-2.419) (-3.714) (0.752)
N 129 105 74 63 91 77 Adj. R-sq 0.858 0.668 0.801 0.866 0.871 0.671 AIC 197.549 117.096 98.657 31.118 154.681 95.287 BIC 229.007 146.289 124.001 52.549 182.301 121.069 Log-Likelihood -87.774 -47.548 -38.328 -5.559 -66.341 -36.643
Notes: “Level” refers to the natural logarithm of CDS spreads (basis points) and “Diff.” refers to the changes of logarithms. Independent variables are accordingly in levels and changes except real effective exchange rates which are the changes of logarithms in both level and change regressions due to nonstationarity of the effective rates and the presence of multicollinearity. Estimates are obtained through fixed-effects panel data model with cluster-robust standard errors. Robust t-statistics are in parentheses. AIC refers to the Akaike information criterion and BIC refers to the Bayesian information criterion or Schwarz criterion. “***”, “**”, and “*” denote significance level at 1%, 5% and 10%, respectively.
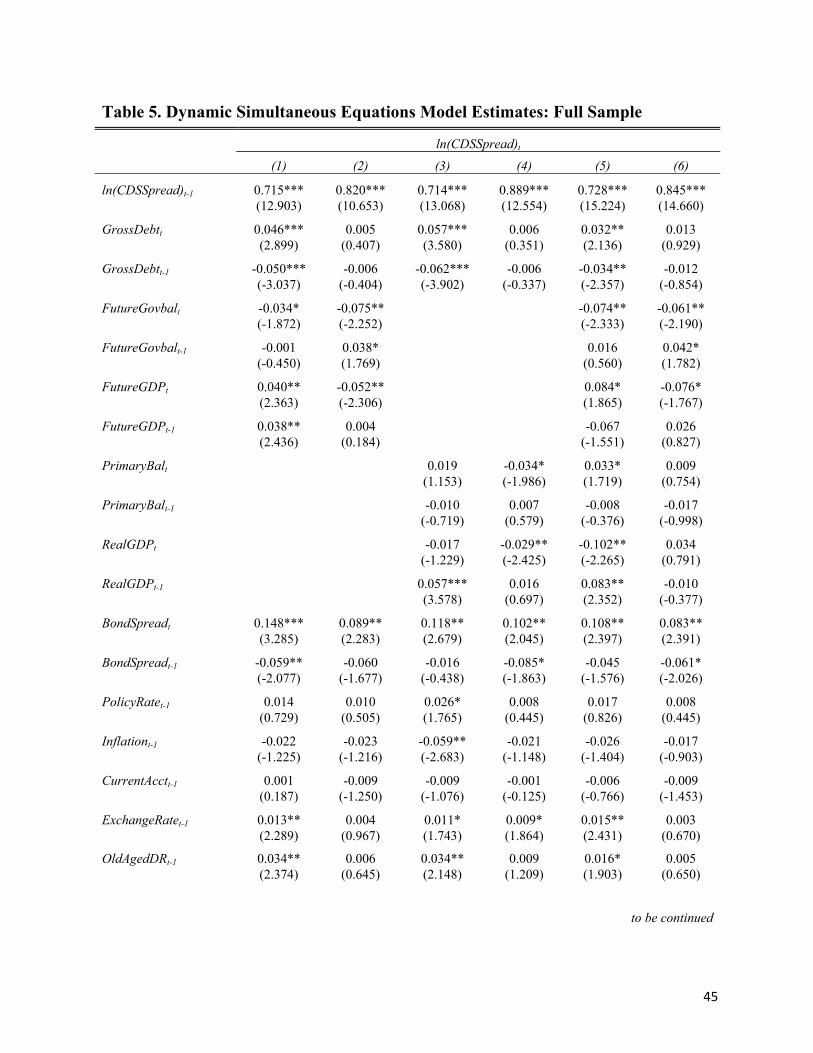
45
Table 5. Dynamic Simultaneous Equations Model Estimates: Full Sample
ln(CDSSpread)t
(1) (2) (3) (4) (5) (6)
ln(CDSSpread)t-1 0.715*** 0.820*** 0.714*** 0.889*** 0.728*** 0.845*** (12.903) (10.653) (13.068) (12.554) (15.224) (14.660)
GrossDebtt 0.046*** 0.005 0.057*** 0.006 0.032** 0.013 (2.899) (0.407) (3.580) (0.351) (2.136) (0.929)
GrossDebtt-1 -0.050*** -0.006 -0.062*** -0.006 -0.034** -0.012 (-3.037) (-0.404) (-3.902) (-0.337) (-2.357) (-0.854)
FutureGovbalt -0.034* -0.075** -0.074** -0.061** (-1.872) (-2.252) (-2.333) (-2.190)
FutureGovbalt-1 -0.001 0.038* 0.016 0.042* (-0.450) (1.769) (0.560) (1.782)
FutureGDPt 0.040** -0.052** 0.084* -0.076* (2.363) (-2.306) (1.865) (-1.767)
FutureGDPt-1 0.038** 0.004 -0.067 0.026 (2.436) (0.184) (-1.551) (0.827)
PrimaryBalt 0.019 -0.034* 0.033* 0.009 (1.153) (-1.986) (1.719) (0.754)
PrimaryBalt-1 -0.010 0.007 -0.008 -0.017 (-0.719) (0.579) (-0.376) (-0.998)
RealGDPt -0.017 -0.029** -0.102** 0.034 (-1.229) (-2.425) (-2.265) (0.791)
RealGDPt-1 0.057*** 0.016 0.083** -0.010 (3.578) (0.697) (2.352) (-0.377)
BondSpreadt 0.148*** 0.089** 0.118** 0.102** 0.108** 0.083** (3.285) (2.283) (2.679) (2.045) (2.397) (2.391)
BondSpreadt-1 -0.059** -0.060 -0.016 -0.085* -0.045 -0.061* (-2.077) (-1.677) (-0.438) (-1.863) (-1.576) (-2.026)
PolicyRatet-1 0.014 0.010 0.026* 0.008 0.017 0.008 (0.729) (0.505) (1.765) (0.445) (0.826) (0.445)
Inflationt-1 -0.022 -0.023 -0.059** -0.021 -0.026 -0.017 (-1.225) (-1.216) (-2.683) (-1.148) (-1.404) (-0.903)
CurrentAcctt-1 0.001 -0.009 -0.009 -0.001 -0.006 -0.009 (0.187) (-1.250) (-1.076) (-0.125) (-0.766) (-1.453)
ExchangeRatet-1 0.013** 0.004 0.011* 0.009* 0.015** 0.003 (2.289) (0.967) (1.743) (1.864) (2.431) (0.670)
OldAgedDRt-1 0.034** 0.006 0.034** 0.009 0.016* 0.005 (2.374) (0.645) (2.148) (1.209) (1.903) (0.650)
to be continued
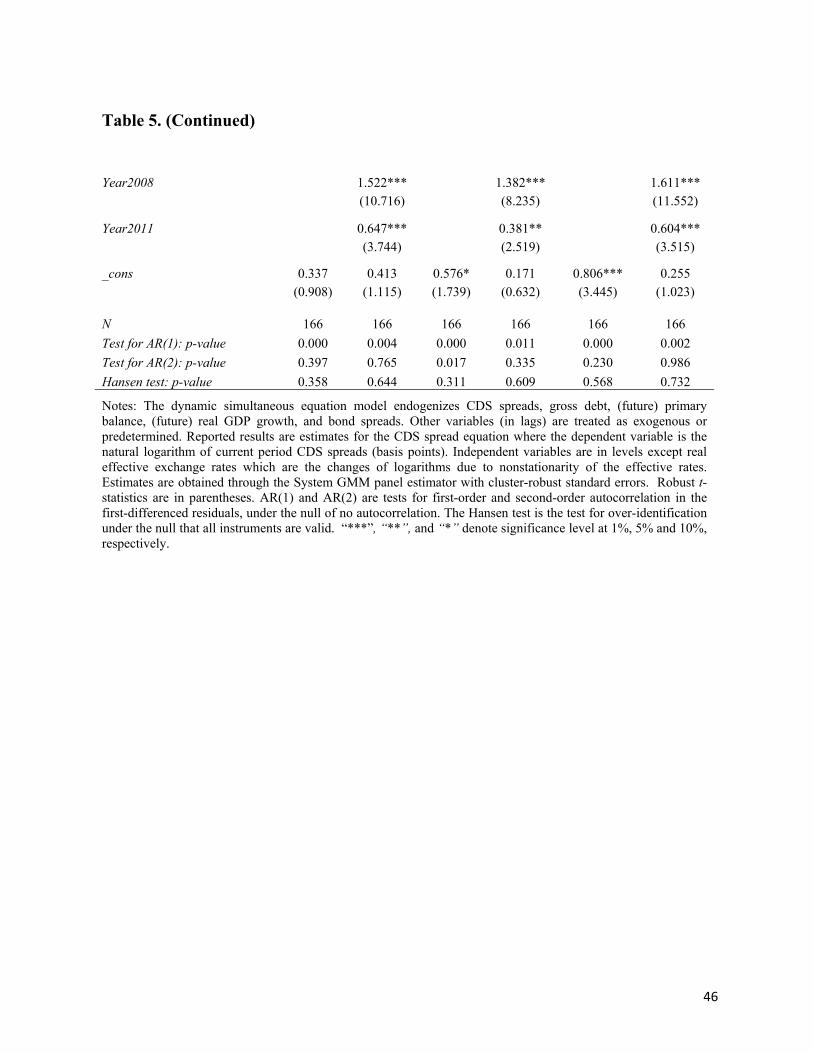
46
Table 5. (Continued)
Year2008 1.522*** 1.382*** 1.611*** (10.716) (8.235) (11.552)
Year2011 0.647*** 0.381** 0.604*** (3.744) (2.519) (3.515)
_cons 0.337 0.413 0.576* 0.171 0.806*** 0.255 (0.908) (1.115) (1.739) (0.632) (3.445) (1.023)
N 166 166 166 166 166 166
Test for AR(1): p-value 0.000 0.004 0.000 0.011 0.000 0.002
Test for AR(2): p-value 0.397 0.765 0.017 0.335 0.230 0.986
Hansen test: p-value 0.358 0.644 0.311 0.609 0.568 0.732
Notes: The dynamic simultaneous equation model endogenizes CDS spreads, gross debt, (future) primary balance, (future) real GDP growth, and bond spreads. Other variables (in lags) are treated as exogenous or predetermined. Reported results are estimates for the CDS spread equation where the dependent variable is the natural logarithm of current period CDS spreads (basis points). Independent variables are in levels except real effective exchange rates which are the changes of logarithms due to nonstationarity of the effective rates. Estimates are obtained through the System GMM panel estimator with cluster-robust standard errors. Robust t-statistics are in parentheses. AR(1) and AR(2) are tests for first-order and second-order autocorrelation in the first-differenced residuals, under the null of no autocorrelation. The Hansen test is the test for over-identification under the null that all instruments are valid. “***”, “**”, and “*” denote significance level at 1%, 5% and 10%, respectively.
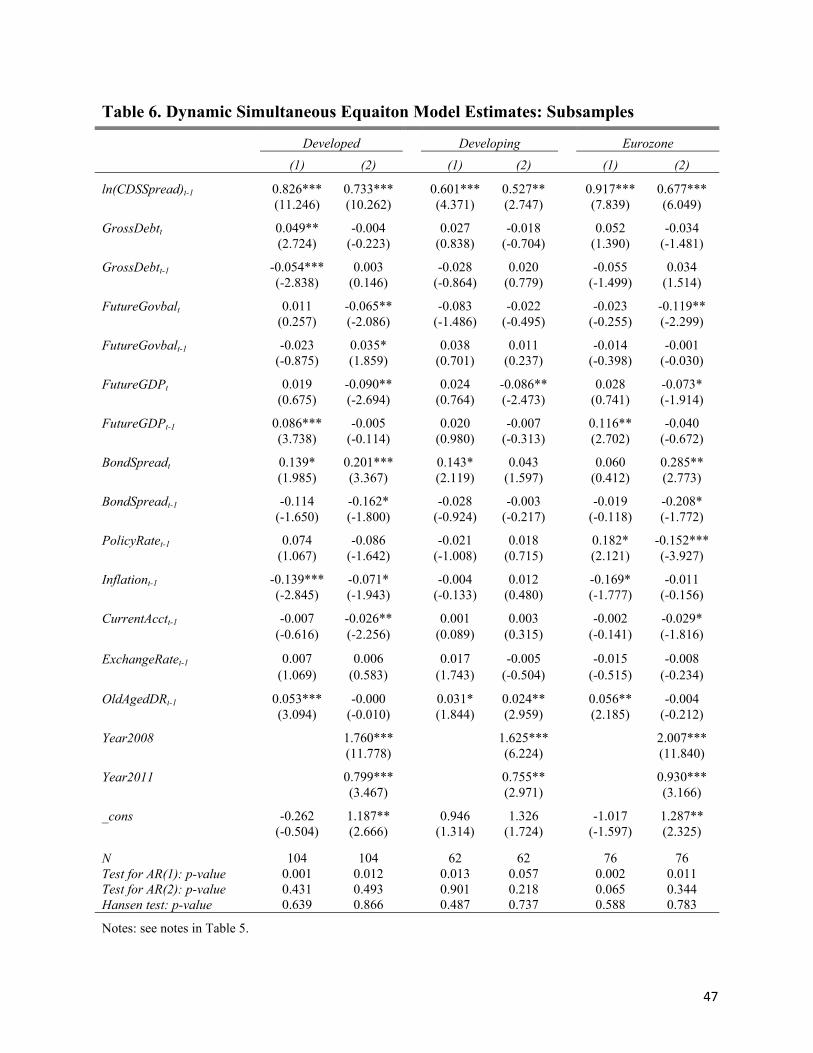
47
Table 6. Dynamic Simultaneous Equaiton Model Estimates: Subsamples
Developed Developing Eurozone
(1) (2) (1) (2) (1) (2)
ln(CDSSpread)t-1 0.826*** 0.733*** 0.601*** 0.527** 0.917*** 0.677*** (11.246) (10.262) (4.371) (2.747) (7.839) (6.049)
GrossDebtt 0.049** -0.004 0.027 -0.018 0.052 -0.034 (2.724) (-0.223) (0.838) (-0.704) (1.390) (-1.481)
GrossDebtt-1 -0.054*** 0.003 -0.028 0.020 -0.055 0.034 (-2.838) (0.146) (-0.864) (0.779) (-1.499) (1.514)
FutureGovbalt 0.011 -0.065** -0.083 -0.022 -0.023 -0.119** (0.257) (-2.086) (-1.486) (-0.495) (-0.255) (-2.299)
FutureGovbalt-1 -0.023 0.035* 0.038 0.011 -0.014 -0.001 (-0.875) (1.859) (0.701) (0.237) (-0.398) (-0.030)
FutureGDPt 0.019 -0.090** 0.024 -0.086** 0.028 -0.073* (0.675) (-2.694) (0.764) (-2.473) (0.741) (-1.914)
FutureGDPt-1 0.086*** -0.005 0.020 -0.007 0.116** -0.040 (3.738) (-0.114) (0.980) (-0.313) (2.702) (-0.672)
BondSpreadt 0.139* 0.201*** 0.143* 0.043 0.060 0.285** (1.985) (3.367) (2.119) (1.597) (0.412) (2.773)
BondSpreadt-1 -0.114 -0.162* -0.028 -0.003 -0.019 -0.208* (-1.650) (-1.800) (-0.924) (-0.217) (-0.118) (-1.772)
PolicyRatet-1 0.074 -0.086 -0.021 0.018 0.182* -0.152*** (1.067) (-1.642) (-1.008) (0.715) (2.121) (-3.927)
Inflationt-1 -0.139*** -0.071* -0.004 0.012 -0.169* -0.011 (-2.845) (-1.943) (-0.133) (0.480) (-1.777) (-0.156)
CurrentAcctt-1 -0.007 -0.026** 0.001 0.003 -0.002 -0.029* (-0.616) (-2.256) (0.089) (0.315) (-0.141) (-1.816)
ExchangeRatet-1 0.007 0.006 0.017 -0.005 -0.015 -0.008 (1.069) (0.583) (1.743) (-0.504) (-0.515) (-0.234)
OldAgedDRt-1 0.053*** -0.000 0.031* 0.024** 0.056** -0.004 (3.094) (-0.010) (1.844) (2.959) (2.185) (-0.212)
Year2008 1.760*** 1.625*** 2.007*** (11.778) (6.224) (11.840)
Year2011 0.799*** 0.755** 0.930*** (3.467) (2.971) (3.166)
_cons -0.262 1.187** 0.946 1.326 -1.017 1.287** (-0.504) (2.666) (1.314) (1.724) (-1.597) (2.325)
N 104 104 62 62 76 76 Test for AR(1): p-value 0.001 0.012 0.013 0.057 0.002 0.011 Test for AR(2): p-value 0.431 0.493 0.901 0.218 0.065 0.344 Hansen test: p-value 0.639 0.866 0.487 0.737 0.588 0.783
Notes: see notes in Table 5.

48
Table 7. Robustness Check: VECM based on (Interpolated) Monthly Data
∆CDSSpreadt
All Developed Developing Eurozone
∆CDSSpreadt-1 0.415*** 0.304*** 0.589*** 0.353 (6.239) (3.108) (8.107) (0.893)
∆CDSSpreadt-2 -0.172** -0.186*** 0.072*** -0.208*** (-2.192) (-5.081) (3.525) (-8.115)
∆CDSSpreadt-3 -0.082** (-2.474)
∆GrossDebtt-1 2.876* 1.402 4.711* 2.238 (1.748) (1.508) (1.926) (0.861)
∆GrossDebtt-2 -0.409 0.160* -2.212 0.128*** (-1.255) (1.805) (-1.440) (4.995)
∆GrossDebtt-3 -1.386 (-0.644)
∆FutureGovbalt-1 -1.472* -1.115*** -2.441 -1.223** (-1.839) (-2.889) (-1.609) (-2.273)
∆FutureGovbalt-2 -1.058** 0.459** -6.097** 0.619 (-1.980) (2.290) (-2.316) (1.447)
∆FutureGovbalt-3 1.020* (1.786)
∆FutureGDPt-1 -3.410* -3.218** -4.458** -2.446* (-1.666) (-2.110) (-2.435) (-1.874)
∆FutureGDPt-2 0.287* 0.0507* -0.048 1.056*** (1.686) (1.675) (-1.126) (2.700)
∆FutureGDPt-3 -0.083 (-0.891)
∆BondSpreadt-1 0.545** 0.745*** -0.409 0.572*** (2.346) (2.713) (-0.423) (5.701)
∆BondSpreadt-2 -0.126 -0.309* 1.030** -0.366* (-1.579) (-1.877) (2.140) (-1.892)
∆BondSpreadt-3 0.0254* (1.958)
∆PolicyRatet-1 -2.902 -3.904 4.534 -5.387*** (-1.442) (-1.645) (1.319) (-4.712)
∆PolicyRatet-2 0.153* -0.142** 0.940 -0.741 (1.706) (-2.044) (1.017) (-1.125)
to be continued
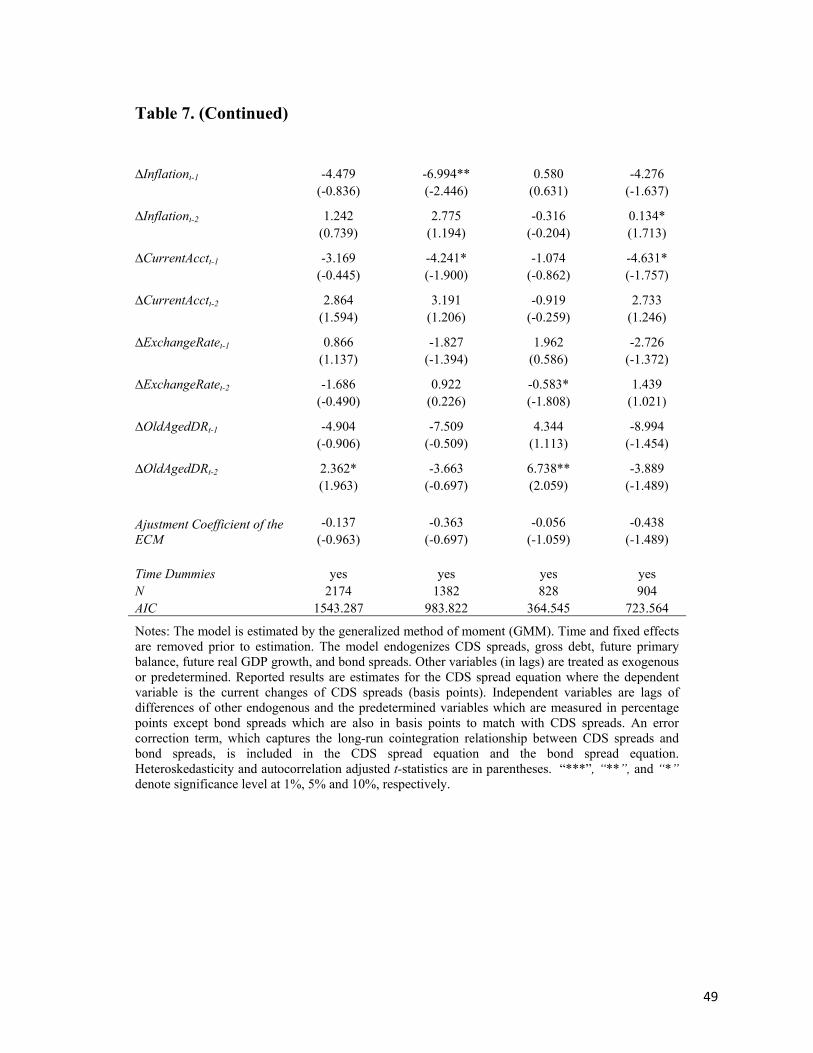
49
Table 7. (Continued)
∆Inflationt-1 -4.479 -6.994** 0.580 -4.276 (-0.836) (-2.446) (0.631) (-1.637)
∆Inflationt-2 1.242 2.775 -0.316 0.134* (0.739) (1.194) (-0.204) (1.713)
∆CurrentAcctt-1 -3.169 -4.241* -1.074 -4.631* (-0.445) (-1.900) (-0.862) (-1.757)
∆CurrentAcctt-2 2.864 3.191 -0.919 2.733 (1.594) (1.206) (-0.259) (1.246)
∆ExchangeRatet-1 0.866 -1.827 1.962 -2.726 (1.137) (-1.394) (0.586) (-1.372)
∆ExchangeRatet-2 -1.686 0.922 -0.583* 1.439 (-0.490) (0.226) (-1.808) (1.021)
∆OldAgedDRt-1 -4.904 -7.509 4.344 -8.994 (-0.906) (-0.509) (1.113) (-1.454)
∆OldAgedDRt-2 2.362* -3.663 6.738** -3.889 (1.963) (-0.697) (2.059) (-1.489)
Ajustment Coefficient of the ECM
-0.137 -0.363 -0.056 -0.438 (-0.963) (-0.697) (-1.059) (-1.489)
Time Dummies yes yes yes yes N 2174 1382 828 904 AIC 1543.287 983.822 364.545 723.564
Notes: The model is estimated by the generalized method of moment (GMM). Time and fixed effects are removed prior to estimation. The model endogenizes CDS spreads, gross debt, future primary balance, future real GDP growth, and bond spreads. Other variables (in lags) are treated as exogenous or predetermined. Reported results are estimates for the CDS spread equation where the dependent variable is the current changes of CDS spreads (basis points). Independent variables are lags of differences of other endogenous and the predetermined variables which are measured in percentage points except bond spreads which are also in basis points to match with CDS spreads. An error correction term, which captures the long-run cointegration relationship between CDS spreads and bond spreads, is included in the CDS spread equation and the bond spread equation. Heteroskedasticity and autocorrelation adjusted t-statistics are in parentheses. “***”, “**”, and “*” denote significance level at 1%, 5% and 10%, respectively.

50
Appendix Table A1. Countries in Sample
Developed Eurozone Developing
1 Australia No 1 Bulgaria 2 Austria Yes 2 Croatia 3 Belgium Yes 3 Hungary 4 Cyprus Yes 4 Latvia 5 Czech Republic No 5 Lithuania 6 Denmark No 6 Mexico 7 Estonia Yes 7 Poland 8 Finland Yes 8 Romania 9 France Yes 9 Russia 10 Germany Yes 10 Serbia 11 Greece Yes 11 Turkey
12 Ireland Yes 12 Ukraine
13 Italy Yes
14 Japan No
15 Netherlands Yes
16 New Zealand No
17 Norway No
18 Portugal Yes
19 Slovakia Yes
20 Slovenia Yes
21 Spain Yes
22 Switzerland No
23 United Kingdom No
24 United States No
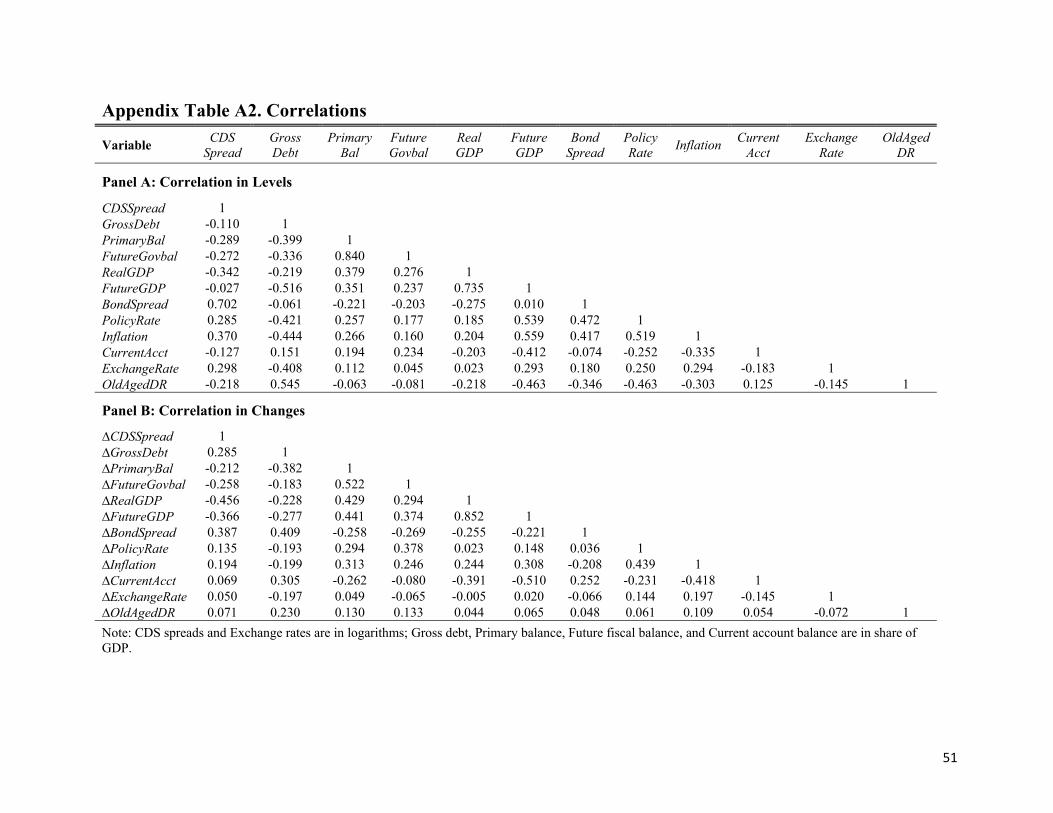
51
Appendix Table A2. Correlations
Variable CDS
Spread Gross Debt
Primary Bal
Future Govbal
Real GDP
Future GDP
Bond Spread
Policy Rate
Inflation Current
Acct Exchange
Rate OldAged
DR
Panel A: Correlation in Levels
CDSSpread 1 GrossDebt -0.110 1 PrimaryBal -0.289 -0.399 1 FutureGovbal -0.272 -0.336 0.840 1 RealGDP -0.342 -0.219 0.379 0.276 1 FutureGDP -0.027 -0.516 0.351 0.237 0.735 1 BondSpread 0.702 -0.061 -0.221 -0.203 -0.275 0.010 1 PolicyRate 0.285 -0.421 0.257 0.177 0.185 0.539 0.472 1 Inflation 0.370 -0.444 0.266 0.160 0.204 0.559 0.417 0.519 1 CurrentAcct -0.127 0.151 0.194 0.234 -0.203 -0.412 -0.074 -0.252 -0.335 1 ExchangeRate 0.298 -0.408 0.112 0.045 0.023 0.293 0.180 0.250 0.294 -0.183 1 OldAgedDR -0.218 0.545 -0.063 -0.081 -0.218 -0.463 -0.346 -0.463 -0.303 0.125 -0.145 1
Panel B: Correlation in Changes
∆CDSSpread 1 ∆GrossDebt 0.285 1 ∆PrimaryBal -0.212 -0.382 1 ∆FutureGovbal -0.258 -0.183 0.522 1 ∆RealGDP -0.456 -0.228 0.429 0.294 1 ∆FutureGDP -0.366 -0.277 0.441 0.374 0.852 1 ∆BondSpread 0.387 0.409 -0.258 -0.269 -0.255 -0.221 1 ∆PolicyRate 0.135 -0.193 0.294 0.378 0.023 0.148 0.036 1 ∆Inflation 0.194 -0.199 0.313 0.246 0.244 0.308 -0.208 0.439 1 ∆CurrentAcct 0.069 0.305 -0.262 -0.080 -0.391 -0.510 0.252 -0.231 -0.418 1 ∆ExchangeRate 0.050 -0.197 0.049 -0.065 -0.005 0.020 -0.066 0.144 0.197 -0.145 1 ∆OldAgedDR 0.071 0.230 0.130 0.133 0.044 0.065 0.048 0.061 0.109 0.054 -0.072 1
Note: CDS spreads and Exchange rates are in logarithms; Gross debt, Primary balance, Future fiscal balance, and Current account balance are in share of GDP.

52
Figure 1. CDS Spreads of Stressed Eurozone Countries
Figure 2. CDS Spreads of the Eurozone
809.9
294.6
707.0
165.1
301.2202.7
319.4
687.7
2,094.7
0
500
1000
1500
2000
0
300
600
900
1200
1500
2005 2006 2007 2008 2009 2010 2011
Basis
Poi
nts
Portugal
Ireland
Italy
Spain
128.7
39.9
66.6
98.8
128.6
198.3
127.0
327.7
846.4
0
100
200
300
400
500
600
700
800
900
0
50
100
150
200
250
300
2005 2006 2007 2008 2009 2010 2011
Basis
Poi
nts
France
Germany
Others (average)
Stressed Eurozone Countires (average, right-axis scale)

53
Figure 3. CDS Spreads of Developed and Developing Countries
66.5
119.5
67.9
258.7
506.3
265.1292.9
223.6277.8
0
100
200
300
400
500
600
2005 2006 2007 2008 2009 2010 2011
Basis
Poi
nts
Developed
Developed (ex. Stressed Eurozone Countries)
Developing
World