fiscal 2018 management policy - panasonic · fiscal 2018 management policy establish direction of...
TRANSCRIPT

Copyright (C) 2017 Panasonic Corporation All Rights Reserved.
Fiscal 2018 Management Policy
May 11, 2017
Panasonic Corporation
Notes: 1. This is an English translation from the original presentation in Japanese.
2. In this presentation, “Fiscal 2017" or "FY17" refers to the year ended March 31, 2017.
In addition, “Fiscal 2018” or “FY18” refer to the year ending March 31, 2018.
Fiscal 2018 Management Policy
FY17 Sales Growth (in Real Terms )
1
Assured response toward achieving “both sales and profit growth”
FY18
FY17
FY16 FY15
FY14
FY19
FY13
*
Opera
ting P
rofit
Sales in real terms (from FY13)
(excluding the effect of exchange rates) *Fiscal years before FY16: Operating profit based on US GAAP
Fiscal years after FY17: Adjusted operating profit based on IFRS
Sales & profits
growth
Sales decline &
profits growth

Copyright (C) 2017 Panasonic Corporation All Rights Reserved.
Fiscal 2018 Management Policy 2
Improving profitability by thorough initiatives
including business transformation, fixed cost
reduction and rationalization
Steady profit generation by competitive advantage
and creating investment resource for high-growth
business
Leading future sales and profit growth through
well-focused large scale investments and group
management resources
Business
Characteristics Business area
Management Policy by Business Characteristics
High-growth
business
Stable-growth
business
Low-profitable
business
Automotive batteries,
Next-gen cockpit
systems, ADAS,
Air-conditioners
White goods,
Avionics,
Wiring devices
Semiconductors,
LCD panels,
Solar panels
Fiscal 2018 Management Policy 3
FY18 Sales Growth Driven by High-Growth Businesses
7,800 billion yen in FY18(e)
Sales Trend in Sales *Real terms excluding the effect of exchange rates
High-
growth
Stable-growth
Low-
profitable
Stable-growth
business
High-growth
business
Low-profitable
business
FY17 FY17 FY18(e) FY18(e) FY17 FY18(e)

Copyright (C) 2017 Panasonic Corporation All Rights Reserved.
Fiscal 2018 Management Policy 4
335 billion yen in FY18(e)
FY18 Profit Growth through Sales Expansion
Operating Profit Trends in Operating Profit * IFRS / Real terms excluding the effect of exchange rates
**Excluding reversal of temporary allowance for lawsuit
High-
growth
Stable-growth
Low-profitable
FY17 FY18(e) FY17 FY18(e) FY17 FY18(e)
High-growth
business
Stable-growth
business
Low-profitable
business
Fiscal 2018 Management Policy 5
Steady Progress in Automotive Business High-growth
business
Aiming at 2 trillion yen sales in FY19
through large scale CAPEX and entering growth phase
<Sales> 2.0
FY19(e) FY17
1.3
FY18(e)
Support automotive industry with Panasonic group-wide advantage
Next-gen cockpits, IVI (In-vehicle-infotainment), automotive batteries
Delivery for large projects will commence in FY18
Photo credit JAGUAR LAND ROVER LIMITED
+ Over 60 years in
Automotive business
Digital consumer electronics
Battery
Device
Delivery case: Display/HUD(Head-up Display) for JLR “Range Rover Velar”
(Yen: trillions)
Copyright (C) 2017 Panasonic Corporation All Rights Reserved.
Fiscal 2018 Management Policy 6
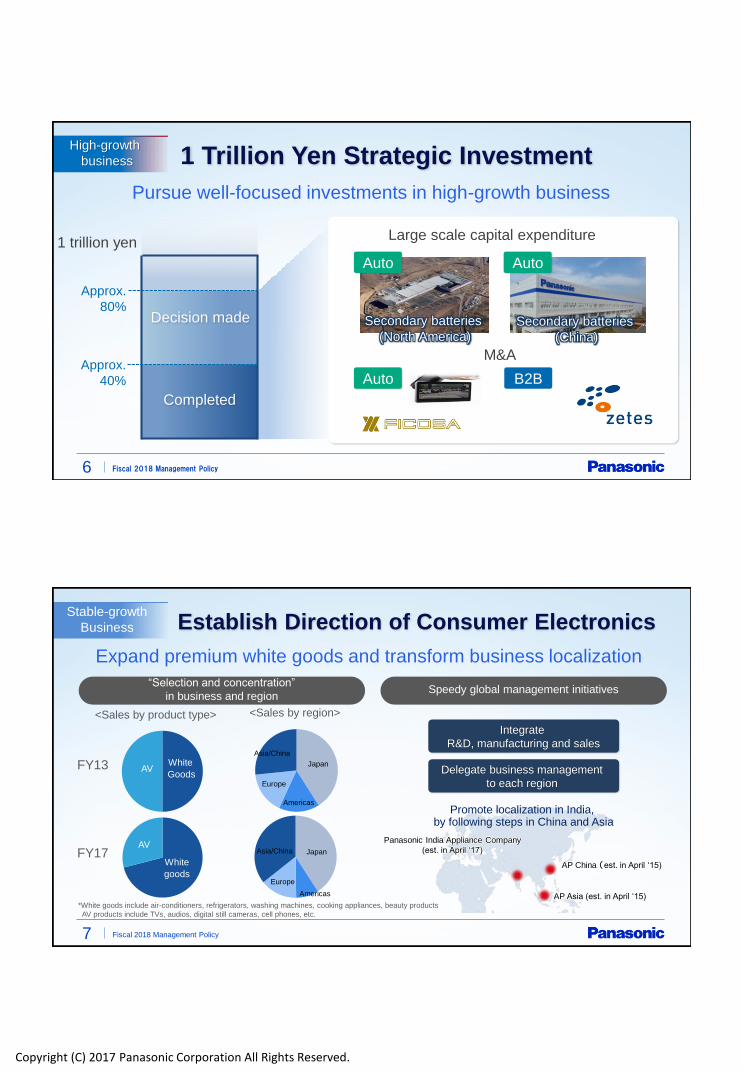
Pursue well-focused investments in high-growth business
Approx.
80%
Completed
1 Trillion Yen Strategic Investment
Decision made
1 trillion yen
High-growth
business
Large scale capital expenditure
M&A
Auto
Secondary batteries
(North America)
Auto
Auto
Secondary batteries
(China)
Approx.
40% B2B
Fiscal 2018 Management Policy
Establish Direction of Consumer Electronics
Expand premium white goods and transform business localization
Integrate
R&D, manufacturing and sales
Delegate business management
to each region
日本
日本
*White goods include air-conditioners, refrigerators, washing machines, cooking appliances, beauty products
AV products include TVs, audios, digital still cameras, cell phones, etc.
Panasonic India Appliance Company
(est. in April ‘17)
AP China (est. in April ‘15)
AP Asia (est. in April ‘15)
Promote localization in India, by following steps in China and Asia
White
Goods AV
7
Stable-growth
Business
“Selection and concentration”
in business and region Speedy global management initiatives
<Sales by region> <Sales by product type>
AV
White
goods
FY13
FY17
Americas
Europe
Asia/China
Americas
Europe
Japan
Japan Asia/China
Copyright (C) 2017 Panasonic Corporation All Rights Reserved.
Fiscal 2018 Management Policy 8
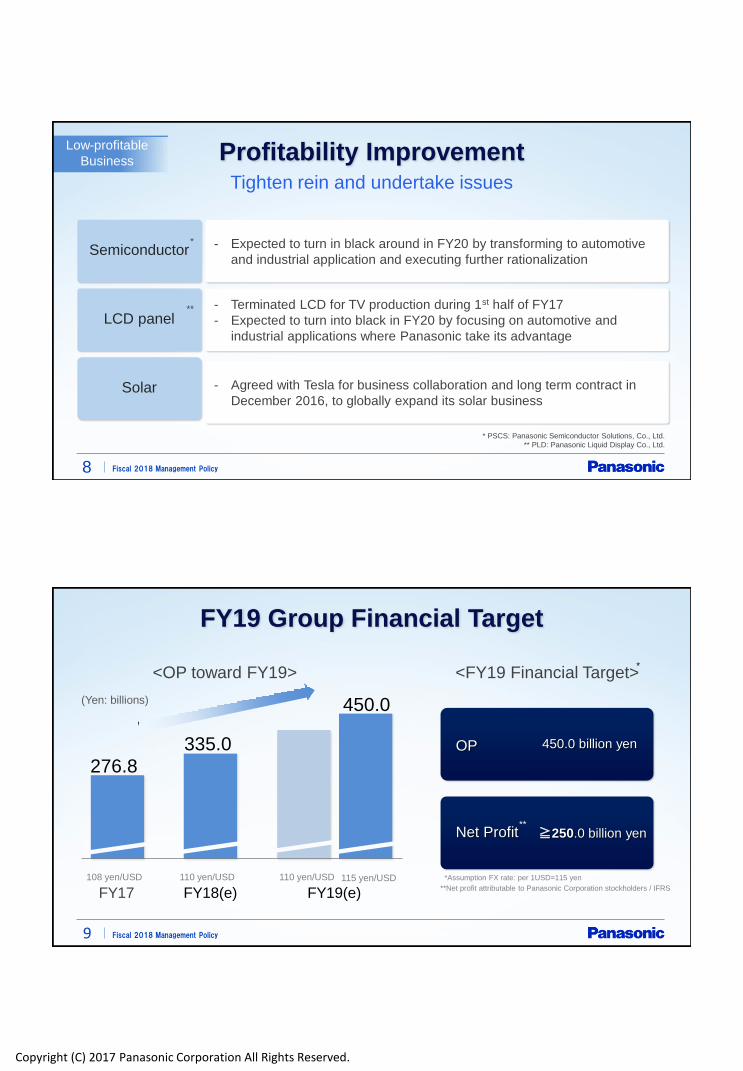
Profitability Improvement Tighten rein and undertake issues
Solar
- Expected to turn in black around in FY20 by transforming to automotive
and industrial application and executing further rationalization Semiconductor
- Terminated LCD for TV production during 1st half of FY17
- Expected to turn into black in FY20 by focusing on automotive and
industrial applications where Panasonic take its advantage
LCD panel
* PSCS: Panasonic Semiconductor Solutions, Co., Ltd.
** PLD: Panasonic Liquid Display Co., Ltd.
*
**
- Agreed with Tesla for business collaboration and long term contract in
December 2016, to globally expand its solar business
Low-profitable
Business
Fiscal 2018 Management Policy 9
FY19 Group Financial Target
108 yen/USD 110 yen/USD 110 yen/USD
<OP toward FY19>
*Assumption FX rate: per 1USD=115 yen
<FY19 Financial Target>
(Yen: billions)
335.0
276.8
115 yen/USD
450.0
OP 450.0 billion yen
Net Profit ≧250.0 billion yen
FY17 FY19(e) FY18(e) **Net profit attributable to Panasonic Corporation stockholders / IFRS
**
*

Copyright (C) 2017 Panasonic Corporation All Rights Reserved.
Disclaimer Regarding Forward-Looking Statements This presentation includes forward-looking statements (that include those within the meaning of Section 27A of the U.S. Securities Act of 1933, as amended, and Section 21E of the U.S. Securities Exchange Act of 1934, as amended) about Panasonic and its Group companies (the Panasonic Group). To the extent that statements in this presentation do not relate to historical or current facts, they constitute forward-looking statements. These forward-looking statements are based on the current assumptions and beliefs of the Panasonic Group in light of the information currently available to it, and involve known and unknown risks, uncertainties and other factors. Such risks, uncertainties and other factors may cause the Panasonic Group's actual results, performance, achievements or financial position to be materially different from any future results, performance, achievements or financial position expressed or implied by these forward-looking statements. Panasonic undertakes no obligation to publicly update any forward-looking statements after the date of this presentation. Furthermore, figures in the presentation, at the time of the disclosure, are under the audit procedure based on Financial Instruments and Exchange Act. Investors are advised to consult any further disclosures by Panasonic in its subsequent filings under the Financial Instrument and Exchange Act of Japan (the FIEA) and other publicly disclosed documents.
The risks, uncertainties and other factors referred to above include, but are not limited to, economic conditions, particularly consumer spending and corporate capital expenditures in the Americas, Europe, Japan, China and other Asian countries; volatility in demand for electronic equipment and components from business and industrial customers, as well as consumers in many product and geographical markets; the possibility that excessive currency rate fluctuations of the U.S. dollar, the euro, the Chinese yuan and other currencies against the yen may adversely affect costs and prices of Panasonic’s products and services and certain other transactions that are denominated in these foreign currencies; the possibility of the Panasonic Group incurring additional costs of raising funds, because of changes in the fund raising environment; the poss ibility of the Panasonic Group not being able to respond to rapid technological changes and changing consumer preferences with timely and cost-effective introductions of new products in markets that are highly competitive in terms of both price and technology; the possibility of not achieving expected results or incurring unexpected losses in connection with the alliances or mergers and acquisitions; the possibility of not being able to achieve its business objectives through joint ventures and other collaborative agreements with other companies, including due to the pressure of price reduction exceeding that which can be achieved by its effort and decrease in demand for products from business partners which Panasonic highly depends on in BtoB business areas; the possibility of the Panasonic Group not being able to maintain competitive strength in many product and geographical areas; the possibility of incurring expenses resulting from any defects in products or services of the Panasonic Group; the possibility that the Panasonic Group may face intellectual property infringement claims by third parties; current and potential, direct and indirect restrictions imposed by other countries over trade, manufacturing, labor and operations; fluctuations in market prices of securities and other financial assets in which the Panasonic Group has holdings or changes in valuation of non-financial assets, including property, plant and equipment, goodwill and deferred tax assets; future changes or revisions to accounting policies or accounting rules; the possibility of incurring expenses resulting from a leakage of customers’ or confidential information from Panasonic Group systems due to unauthorized access or a detection of vulnerability of network-connected products of the Panasonic Group; as well as natural disasters including earthquakes, prevalence of infectious diseases throughout the world, disruption of supply chain and other events that may negatively impact business activities of the Panasonic Group. The factors listed above are not all-inclusive and further information is contained in the most recent English translated version of Panasonic’s securities reports under the FIEA and any other documents which are disclosed on its website.

Copyright (C) 2017 Panasonic Corporation All Rights Reserved.
Fiscal 2018 Management Policy
FY18 Business Areas by Business Characteristics
12
Stable-growth
business
High-growth
business
Low-profitable
business
TVs, Fixed-line Phones / FAX, Building Products, Solar Systems,
Ruggedized PCs, Semiconductor, LCD (Liquid Crystal Display) panels, etc.
Automotive Batteries, Next-generation Cockpit Systems,
ADAS (Advanced Driver Assistance Systems), Air-conditioners,
Electromechanical Control Devices
White Goods, Small Appliances, Commercial Refrigeration & Food Equipment,
Wiring Devices, Lighting Equipment, Remodeling, Age-free (elderly-care), Avionics,
Process Automation, Surveillance System, Electric Materials, Dry Batteries, etc.