first/last mile strategies study - rideuta.com
TRANSCRIPT

FIRST/LAST MILE STRATEGIES STUDY
APRIL 2015


C
Acknowledgments
The First/Last Mile Strategies Study was sponsored by the Utah Transit Authority, the Utah Department of Transportation, Wasatch Front Regional Council, and the Mountainland Association of Governments. This study owes much to the participation and dedication of its Steering Committee and Stakeholder Group members, as identified below. Thanks to everyone who contributed time and energy, and to those that share the vision of a connected Wasatch Front.
STEERING COMMITTEE ▪ Utah Transit Authority: Jennifer McGrath and Hal Johnson
▪ Utah Department of Transportation : Angelo Papastamos and Jeff Harris
▪ Mountainland Association of Governments: Jim Price and Shawn Seager
▪ Wasatch Front Regional Council: Ted Knowlton and Ned Hacker
▪ University of Utah Traffic Lab: Cathy Liu, Richard J. Porter, Milan Zlatkovic, Jem Locquiao, and Jeffery Taylor
STAKEHOLDER GROUP ▪ The First/Last Mile Strategies Study Steering Committee
▪ Utah Transit Authority: G.J. LaBonty, Richard Brockmyer, Jan Maynard, and Matt Sibul (staff team); and Keith Bartholomew and Necia Christensen (Board of Trustees)
▪ Bike Utah: Phil Sarnoff
▪ Davis County Health Department: Isa Perry
▪ Enterprise Car Share: Jamie Clark and James Crowder
▪ GREENbike: Ben Bolte and Will Becker
▪ Salt Lake City Mayor’s Accessibility Council: Todd Claflin
▪ Salt Lake County: Wilf Sommerkorn
▪ University of Utah Commuter Services: Alma Allred
▪ Utah Department of Health: Brett McIff
CONSULTANT TEAM ▪ Fehr & Peers: Bob Grandy, Maria Vyas, Kyle Cook, Julie Bjornstad,
Alex Roy, and Summer Dong
▪ Nelson\Nygaard: Linda Rhine, Terra Curtis, and Adina Ringler


IFINAL REPORT
Appendix A: Meeting MinutesAppendix B: Open UTA Survey ResultsAppendix C: UCATS Station Area RecommendationsAppendix D: Peer Agency Interview QuestionnaireAppendix E: Strategy Capital and O&M Cost SpreadsheetsAppendix F: Regression Analysis Technical MemorandumAppendix G: Health Cost Research and Calculator
Table of ContentsEXECUTIVE SUMMARY . . . . . . . . . . . . . . . . . . . . . . . . . . . . . . . . . . . . . . . . . . . . . . . ES-1
1 INTRODUCTION . . . . . . . . . . . . . . . . . . . . . . . . . . . . . . . . . . . . . . . . . . . . . . . . . . . . . 1-1Bridging the First/Last Mile Gap . . . . . . . . . . . . . . . . . . . . . . . . . . . . . . . . . . . . . . . . . . . . . 1-1Purpose of Study . . . . . . . . . . . . . . . . . . . . . . . . . . . . . . . . . . . . . . . . . . . . . . . . . . . . . . . . . . . 1-1Stakeholder Engagement . . . . . . . . . . . . . . . . . . . . . . . . . . . . . . . . . . . . . . . . . . . . . . . . . . . 1-2
2 DATA COLLECTION . . . . . . . . . . . . . . . . . . . . . . . . . . . . . . . . . . . . . . . . . . . . . . . . . 2-1Station Characteristics . . . . . . . . . . . . . . . . . . . . . . . . . . . . . . . . . . . . . . . . . . . . . . . . . . . . . .2-1Passenger Surveys . . . . . . . . . . . . . . . . . . . . . . . . . . . . . . . . . . . . . . . . . . . . . . . . . . . . . . . . . 2-5Ridership Characteristics . . . . . . . . . . . . . . . . . . . . . . . . . . . . . . . . . . . . . . . . . . . . . . . . . . . 2-6
3 STATE OF THE PRACTICE FOR FIRST/LAST MILE STRATEGIES . . . . . . 3-1First/Last Mile Strategy Toolbox . . . . . . . . . . . . . . . . . . . . . . . . . . . . . . . . . . . . . . . . . . . . .3-1Strategies Used within the UTA Service Area . . . . . . . . . . . . . . . . . . . . . . . . . . . . . . . .3-17Strategies Used by Peer Agencies . . . . . . . . . . . . . . . . . . . . . . . . . . . . . . . . . . . . . . . . . 3-19
4 ANALYSIS . . . . . . . . . . . . . . . . . . . . . . . . . . . . . . . . . . . . . . . . . . . . . . . . . . . . . . . . . . . 4-1Evaluation Process . . . . . . . . . . . . . . . . . . . . . . . . . . . . . . . . . . . . . . . . . . . . . . . . . . . . . . . . . .4-1Typologies . . . . . . . . . . . . . . . . . . . . . . . . . . . . . . . . . . . . . . . . . . . . . . . . . . . . . . . . . . . . . . . . 4-2Ridership Regression Analysis . . . . . . . . . . . . . . . . . . . . . . . . . . . . . . . . . . . . . . . . . . . . . . 4-6Future Stations . . . . . . . . . . . . . . . . . . . . . . . . . . . . . . . . . . . . . . . . . . . . . . . . . . . . . . . . . . . . 4-7Strategy Prioritization Process . . . . . . . . . . . . . . . . . . . . . . . . . . . . . . . . . . . . . . . . . . . . . 4-8
5 RECOMMENDATIONS . . . . . . . . . . . . . . . . . . . . . . . . . . . . . . . . . . . . . . . . . . . . . . . 5-1Strategies by Typology . . . . . . . . . . . . . . . . . . . . . . . . . . . . . . . . . . . . . . . . . . . . . . . . . . . . . 5-1Benefits of the Strategies . . . . . . . . . . . . . . . . . . . . . . . . . . . . . . . . . . . . . . . . . . . . . . . . . . 5-9
6 NEXT STEPS . . . . . . . . . . . . . . . . . . . . . . . . . . . . . . . . . . . . . . . . . . . . . . . . . . . . . . . . 6-1Recommended Strategies by Station Typology . . . . . . . . . . . . . . . . . . . . . . . . . . . . . . .6-1UTA Action Plan for First/Last Mile Improvements . . . . . . . . . . . . . . . . . . . . . . . . . . 6-2Recommended Next Steps by Strategy Type . . . . . . . . . . . . . . . . . . . . . . . . . . . . . . . . 6-3Stations to Watch . . . . . . . . . . . . . . . . . . . . . . . . . . . . . . . . . . . . . . . . . . . . . . . . . . . . . . . . . 6-6

Utah Transit AuthorityII
Table of FiguresFigure ES-1 Annual UTA Transit Ridership, 1973-2008 . . . . . . . . . . . . . . . . . . . . . . . . ES-1Figure ES-2 Strategy Recommendations . . . . . . . . . . . . . . . . . . . . . . . . . . . . . . . . . . . . . ES-2
Figure 2-1 Walk Access for TRAX Stations . . . . . . . . . . . . . . . . . . . . . . . . . . . . . . . . . . . 2-2Figure 2-2 Walk Access for FrontRunner Stations . . . . . . . . . . . . . . . . . . . . . . . . . . . . 2-3Figure 2-3 Average Amenity Score . . . . . . . . . . . . . . . . . . . . . . . . . . . . . . . . . . . . . . . . . . . 2-5
Figure 3-1 First/Last Mile Strategies Ecosystem . . . . . . . . . . . . . . . . . . . . . . . . . . . . . . .3-1Figure 3-2 First/Last Mile Toolbox . . . . . . . . . . . . . . . . . . . . . . . . . . . . . . . . . . . . . . . . . . . 3-2FIgure 3-3 Summary of First/Last Mile Strategies Reported by
Peer Agencies and UTA . . . . . . . . . . . . . . . . . . . . . . . . . . . . . . . . . . . . . . . . . 3-20Figure 3-4 TriMet Pedestrian Network Analysis Methodology . . . . . . . . . . . . . . . . 3-21Figure 3-5 Hierarchy of Target Audiences . . . . . . . . . . . . . . . . . . . . . . . . . . . . . . . . . . . 3-22Figure 3-6 Sample FMLM Funding Sources . . . . . . . . . . . . . . . . . . . . . . . . . . . . . . . . . 3-23Figure 3-7 Downtown MetroRail Station Adjacent Car2Go Parking Spaces . . . 3-26
Figure 4-1 Station Typologies and Characteristics . . . . . . . . . . . . . . . . . . . . . . . . . . . . 4-3Figure 4-2 TRAX Station Typologies . . . . . . . . . . . . . . . . . . . . . . . . . . . . . . . . . . . . . . . . . 4-4Figure 4-3 FrontRunner Station Sypolotiges . . . . . . . . . . . . . . . . . . . . . . . . . . . . . . . . . 4-5Figure 4-4 Strategy Prioritization . . . . . . . . . . . . . . . . . . . . . . . . . . . . . . . . . . . . . . . . . . . . 4-9
Figure 5-1 Recommended Strategies for Urban Typology . . . . . . . . . . . . . . . . . . . . . 5-2Figure 5-2 Recommended Strategies for Multimodal Typology . . . . . . . . . . . . . . . . 5-3Figure 5-3 Recommended Strategies for Institutional Typology . . . . . . . . . . . . . . . 5-4Figure 5-4 Recommended Strategies for Suburban Non-Residential Typology . 5-5Figure 5-5 Recommended Strategies for Suburban Typology . . . . . . . . . . . . . . . . . 5-6Figure 5-6 Recommended Strategies for Auto-Dependent Typology . . . . . . . . . . 5-7Figure 5-7 Estimate of Increased Ridership . . . . . . . . . . . . . . . . . . . . . . . . . . . . . . . . . . . 5-9Figure 5-8 Estimated Health Related Benefits at Selected UTA Stations . . . . . . 5-10
Figure 6-1 Recommended Strategies by Typology . . . . . . . . . . . . . . . . . . . . . . . . . . . . .6-1
All images courtesy of Fehr & Peers or Nelson\Nygaard, except as noted .

ES-1FINAL REPORT
EXECUTIVE SUMMARY
Executive SummaryIn 2014, the Utah Transit Authority Board of Trustees set a goal of developing a comprehensive first/last mile strategy to improve access to transit stations throughout the agency’s service area. This goal is related to an overall effort to double UTA’s ridership by 2020. The Utah Transit Authority and the Utah Department of Transportation, with support from the Wasatch Front Regional Council and the Mountainland Association of Governments, initiated and developed this First/Last Mile Strategies Study, which identifies a short list of strategies to prioritize those that would be most effective in increasing system ridership.
The Utah Transit Authority was incorporated in 1970 to provide transit service to local communities. Historic annual transit ridership (compared to the population of the urban area counties) for the last four decades of UTA’s history is summarized in the chart below.
Figure ES-1 Annual UTA Transit Ridership, 1973-2008
As shown in the chart, total annual ridership is approaching 45 million, as the population of the four urban counties of the Wasatch Front grows beyond 2.1 million people. Nearly 23 million of those annual transit trips occur on UTA’s rail network: the TRAX light rail system and the FrontRunner commuter rail line. The 63 stations on these rail lines represent an opportunity for UTA to capture even greater ridership through first/last mile solutions. First/last mile strategies for the rail stations were identified and prioritized using the following process:

Utah Transit AuthorityES-2
FIRST/LAST MILE STRATEGIES STUDY
▪ Research best practices for first/last mile strategies nationally and internationally, including interviews with peer transit agencies and inventory of UTA’s current practices;
▪ Develop a First/Last Mile Strategies Toolbox;
▪ Organize TRAX and FrontRunner stations into typologies based on access and station characteristics;
▪ Analyze ridership patterns on UTA’s TRAX and FrontRunner networks to assess the success of first/last mile strategies in adding riders to the system;
▪ Rank strategies in the Toolbox based on traits like ease of implementation, relative cost, and ability to im-prove safety;
▪ Collaborate with stakeholders to refine and develop a shortlist of recommended strategies; and
▪ Identify which strategies would be most effective at which stations.
Strategy recommendations by station are provided in the table on the next page.
Figure ES-2 Strategy Recommendations
Station Typology Stations Recommended Strategies
Urban Planetarium, Arena, Temple Square, City Center, Gallivan Plaza, Courthouse, 900 South, Library, Trolley, 900 East
Wayfinding and information, bicycle network improvements, bike sharing, car sharing
Multi-modal 1940 W North Temple, Power, Fairpark, Jackson/Euclid, North Temple Bridge/Guadalupe, North Temple, Redwood Junction, West Valley Central, Salt Lake Central, Old Greektown, Ball Park, Central Pointe, Millcreek, Sandy Expo
Wayfinding and information, bicycle network improvements, access connections, pedestrian network improvements, crossing treatments, rail and bus stop enhancements
Institutional Orem, Stadium, University South Campus, Fort Douglas, University Medical Center
Bicycle network improvements, bike sharing
Suburban Non-residential Ogden, Lehi, Meadowbrook, Murray North, Murray Central, Fashion Place West, Sandy Civic Center, River Trail, Decker Lake, Draper
Wayfinding and information, bicycle net-work improvements, bike sharing, rail and bus stop enhancements
Suburban Midvale Fort Union, Midvale Center, Historic Sandy, Crescent View, Kimballs Lane, Draper Town Center, Bingham Junction, Historic Gardner, West Jordan City Center, Jordan Valley, 4800 W Old Bingham Hwy, Provo
Wayfinding and information, bicycle network improvements, pedestrian network improvements, crossing treatments
Auto-dependent Pleasant View, Roy, Clearfield, Layton, Farmington, Woods Cross, South Jordan, American Fork, 2700 W Sugar Factory Road, 5600 W Old Bingham Highway, South Jordan Parkway, Daybreak Parkway
Wayfinding and information, bicycle network improvements, access connections, pedestrian network improvements, crossing treatments
Analysis conducted for this study (and described in Chapter 6) indicated that ridership on the rail network could increase 3-6% if the proposed recommendations were to be implemented. Implementation of the recommended first/last mile solutions in locations where these solutions are currently lacking could result in a ridership increase of between 2,100 – 4,300 riders per day (or 1.3 – 2.7 million riders per year) throughout the rail network.
These strategies will generally require collaboration between a wide range of partners including the Utah Transit Authority, the Utah Department of Transportation, local jurisdictions with land use and roadway authority at transit stations, the GREENbike bike sharing program, Enterprise Car Share, and private institutions in addition to others. While first/last mile strategy recommendations are provided by station typology and not typically by individual station, previous work efforts (such as the Utah Collaborative Active Transportation Study) identified conceptual-level recommendations for some transit stations within the UTA network. These recommendations are provided in the Appendix.
As demonstrated in the table above, the recommended strategies encompass a range of elements. Each strategy has associated capital construction costs along with annual operations and maintenance costs. Estimates for capital improvements on a per-station basis could range from $1.7M - $2.5M, depending on the elements requiring construction (and in some cases, estimates could be much more or much less). Operation and maintenance costs associated with the first/last mile strategies could range from $75,000 - $135,000 per station per year, depending on the improvements needed. Planning-level cost estimates for individual first/last mile strategies are provided in Appendix E of this report.

1-1FINAL REPORT
1 INTRODUCTION BRIDGING THE FIRST/LAST MILE GAPA first or last mile gap is a barrier that discourages potential riders from using transit because a station cannot be easily accessed from home, work, or other destinations. The gap can be created by elements of geography, topology, street network and design, or a lack of available transportation options. All transit riders must contend with the first/last mile challenge; the easier it is to access the system, the more likely people are to use it.
Improving access starts with creating urban environments with cohesive pedestrian and bicycle networks that are inviting and safe, with multiple transportation options available including shared transport systems, and with a comprehensive transit system. As such, best practice is to pursue multiple strategies that increase the number of transit access points and options.
PURPOSE OF STUDYThe Utah Transit Authority (UTA) has constructed an impressive and effective fixed-rail network in the Salt Lake City urban area, with a combination of commuter rail, light rail, and streetcar lines. While the agency continues to identify routes and location for future network extensions, enhancing the first- and last-mile connections to the existing network could bring new riders to the system. In 2014, the UTA Board of Trustees set a goal of developing first/last mile recommendations that could be applied throughout UTA’s service area, as part of an overall effort to double ridership by 2020. The purpose of this First/Last Mile Strategies Study is to identify a short list of strategies to prioritize that would be most effective in increasing system ridership.
Outside of increasing the number of transit riders on the system, improving first/last mile solutions has other benefits as well. The connectivity of the existing street and pathway network surrounding UTA’s rail stations has long been known as a barrier for those trying to access the stations. Many of the strategies discussed through this study would be effective improvements on the connectivity of this network. Making better connections for transit users accessing the stations would also improve the safety for transit users as well as others who live and work in the station catchment areas, by providing separated pathways, better visibility, or more direct routes to the stations.
While ultimately first/last mile solutions must be applied broadly to all of the geographic transit service area, UTA elected to begin with its fixed rail network. For the purposes of this study, analysis and recommendations are specific to rail stations on FrontRunner and TRAX; the “Recommendations” section of this study addresses the transferability of these recommendations to Bus Rapid Transit (BRT) and bus networks.

Utah Transit Authority1-2
FIRST/LAST MILE STRATEGIES STUDY
STAKEHOLDER ENGAGEMENTThe project team engaged many stakeholders in the process of identifying and prioritizing first/last mile strategies. In September 2014, stakeholders came together to discuss the “universe of alternatives” for first/last mile strategies, and to learn about national and international best practices as well as “lessons learned” from peer agencies. In November 2014, stakeholders regrouped to share their own experiences using first/last mile strategies and to prioritize a short list of strategies for UTA’s focused implementation. Stakeholders represented a range of agencies and organizations, including:
▪ Bike Utah
▪ Davis County Health Department
▪ Enterprise Car Share
▪ GREENbike
▪ Mountainland Association of Governments (MAG)
▪ Salt Lake City Accessibility Council
▪ University of Utah
▪ Utah Department of Health
▪ Utah Department of Transportation (UDOT)
▪ UTA staff and Board of Trustees
▪ Wasatch Front Regional Council (WFRC)
Minutes and materials from the stakeholder meetings are included in Appendix A.

2-1FINAL REPORT
DATA COLLECTION
2 DATA COLLECTION Data collection for the First/Last Mile Strategies Study encompassed a range of types and sources, including ridership and station characteristics as well as survey information solicited online and from on-board riders. Data sources are identified in the following section.
STATION CHARACTERISTICSUnderstanding the effectiveness of current first/last mile strategies requires that an agency take stock of what is currently implemented. This study included audits of stations on the UTA fixed rail network; assessments of connectivity around the station areas; inventory of vehicle and bicycle parking; future projections for population and employment growth around station areas; and review of station area plans and transit-oriented-development efforts at stations.
Station Area Audits
Station area audits were conducted by University of Utah Traffic Lab staff members in late summer 2014 at all TRAX and FrontRunner stations. The audits were used by the team to create station typologies and develop first/last mile recommendations. The audits included qualitative information on stations, as well as adjacent roadway and intersection conditions. This included but was not limited to the following:
▪ Audit date, time, location, weather conditions, and number of transit users observed;
▪ Presence of station characteristics such as amenities, drop-off/pick-up areas, user information, security, lighting, bicycling parking, accessibility, and signage;
▪ Traffic speeds and volumes, as well as presence of multi-modal accommodations, lighting, and signage on adjacent streets; and
▪ Intersection control type (for instance, signalized, four-way stop, etc.), number of travel lanes, and accessibility features at adjacent intersections.
Observers compiled a spreadsheet database to house the data. The database along with the associated field notes sheets are housed at the partner agencies (UTA, UDOT, WFRC and MAG).
Station Area Connectivity
The Utah Collaborative Active Transportation Study (UCATS) evaluated network connectivity around the FrontRunner and TRAX stations in 2013. Connectivity is a measurement of how many different routes are available to get between two points – the greater the connectivity, the higher the number of potential routes and intersections that could be used to get from point to point. For example, a street network with very small blocks in a grid pattern would have high connectivity, because there are many different ways to connect from one location to

Utah Transit Authority2-2
FIRST/LAST MILE STRATEGIES STUDY
TRAX STATION ACCESSIBILITYTRAX STATION ACCESSIBILITYFIGUREPath: P:\12-940 UCATS Planning\GIS\mxd\Task4Memo_StationAccess\Graphic_TRAX_Station_Access_v3.mxd
0 2 41Miles
E
LEGEND
Walkability Index
Very Low
Low
Medium
High
1 Mile Buffer
!( Light Rail Stations
TRAX
Draper Town Center
Sandy Expo
Murray Central
South JordanParkway
Bingham Junction
River Trail
Airport
Stadium
Note: Station names are labeled for illustrative purposes.
Figure 2-1 Walk Access for TRAX Stations
another. The UCATS study measured network connectivity by identifying the percent of land area within a one-mile radius of each TRAX and FrontRunner station that could actually be accessed by walking on available routes for one mile from the station. These calculations were used to develop a “walk access” or “walkability” index for each station; stations with low scores had correspondingly low network connectivity and low walkability or walk access to the surrounding areas, and stations with high scores had a high degree of connectivity and walkability. The “walk access” ratings for TRAX and FrontRunner, respectively, are shown in the figures below; stations shown in green have high accessibility, whereas those shown in red have low accessibility.
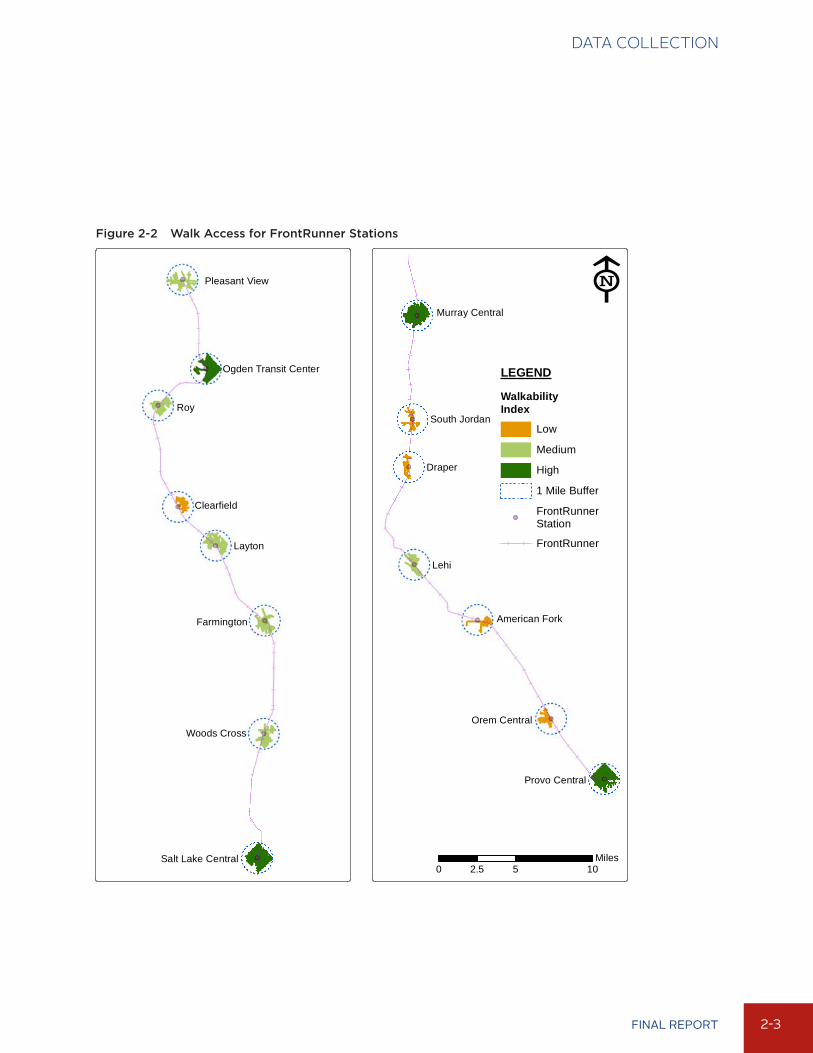
2-3FINAL REPORT
DATA COLLECTION
Lehi
Provo Central
Murray Central
Draper
South Jordan
Orem Central
American Fork
Roy
Layton
Salt Lake Central
Farmington
Pleasant View
Woods Cross
Ogden Transit Center
Clearfield
FRONTRUNNER STATION ACCESSIBILITYFRONTRUNNER STATION ACCESSIBILITYFIGUREPath: P:\12-940 UCATS Planning\GIS\mxd\Task4Memo_StationAccess\Graphic_CRT_Station_Access_v2.mxd
0 5 102.5Miles
ELEGEND
WalkabilityIndex
Low
Medium
High
1 Mile Buffer
FrontRunnerStation
FrontRunner
Figure 2-2 Walk Access for FrontRunner Stations

Utah Transit Authority2-4
FIRST/LAST MILE STRATEGIES STUDY
Vehicle and Bicycle Parking Supply
The availability of parking supply (both for vehicles and bicycles) can influence riders’ decisions on how they get to the transit station (and sometimes whether they use transit at all). Transit stations outside the immediate urban area generally have at least a moderate amount of free vehicle parking. Some stations have hundreds of spaces constructed and available for use. Similarly, some transit users who cycle to the rail station may wish to store their bicycle at that station, rather than bring it on the train with them for the duration of their journey. Accessible bicycle lockers in a highly-visible location which can be rented for appropriate lengths of time are valuable to these riders. UTA conducted an inventory in 2014 of all bicycle racks and lockers at its stations, which was incorpo-rated into this study.
Future Population and Employment Growth
While it is important to understand how stations currently function within the system, it is also important to recognize that the future is constantly evolving before our eyes; stations that look and behave a certain way now are practically guaranteed to be different at some point. Future population and employment projections, from the WFRC/MAG travel demand model, provided insights on where growth might occur in significant amounts between now and 2040. This allowed the team to identify which stations that currently had low degrees of ridership and access might potentially have higher demand and need for first/last mile solutions in the future.
Future TOD Plans
The degree of planning and development activity taking shape around rail stations was evaluated through this study. UTA’s transit-oriented development specialists provided information on current station area plans, known development projects, and the intensity of development activity at rail stations throughout the service area. This information is provided in Section 7 of this report.

2-5FINAL REPORT
DATA COLLECTION
PASSENGER SURVEYSSurveys provided valuable insights into the needs and behaviors of UTA transit riders. The Open UTA survey was conducted specifically for the First/Last Mile Strategies Study, while the on-board origin-destination survey was completed in 2013 as a broader look at rider trip patterns.
Open UTA Survey
In mid-2014, UTA posted a brief survey on its Open UTA public engagement website and received 526 responses to the survey. The survey focused on preferred methods for riders to get to and from transit stations, using questions on a rating scale as well as open-ended responses. Survey respondents were asked to rank a range of strategies, across several categories, from 1 to 4 (the lower the score, the more attractive the strategy). Results from the survey are summarized in the figure below. They indicated that respondents preferred separated pathways to/from transit stations as the most important bicycle-related amenity; improved crosswalks as the most highly preferred pedestrian amenity; improved passenger waiting areas as the most preferred station feature; and UTA shuttles as the most preferred shuttle option.
Figure 2-3 Average Amenity Score
0 0.5
1 1.5 2
2.5 3
3.5 4
Average Amenity Score
Comments in the open-ended responses frequently referred to the need for safe bicycle and pedestrian facilities accessing stations. Comments also often centered on the need for better bus and shuttle connections to and from TRAX and FrontRunner stations, including the pick-up/drop-off timing schedules of the routes already in place. It is beyond the scope of this study to comprehensively evaluate the timing of bus connections at TRAX and FrontRunner stations; however, it is recommended that UTA delve into this issue further to resolve some of the problems identified in the survey.
The full responses to the survey are provided in Appendix B.

Utah Transit Authority2-6
FIRST/LAST MILE STRATEGIES STUDY
2013 ON-BOARD ORIGIN-DESTINATION SURVEY
The 2013 survey, conducted by RSG on behalf of UTA, measured key rider and trip characteristics for transit users throughout the UTA system for a six-month period. This survey gathered demographic data such as access to vehicles, home zip code, employment status, education levels, disability, and other factors. The survey also asked respondents questions about where their trips began and ended (which TRAX/FrontRunner station), and which mode of transportation they used to arrive and depart from the stations at either end of their trip. This information was critical for the First/Last Mile Strategies Study, as it allowed the project team to assess mode of access splits for each individual TRAX and FrontRunner station, and compare them to the range of first/last mile strategies available at each station.
RIDERSHIP CHARACTERISTICSA major component of analysis for this study was to understand the relationship between UTA’s first/last mile strategies currently in place and their effect on ridership. Average daily boardings and alightings data was provided by UTA for all TRAX, FrontRunner, and MAX BRT stations, for the period of August 2013 through April 2014. This was supplemented with additional information on ridership characteristics from the on-board survey.

3-1FINAL REPORT
3 State of the Practice for First/Last Mile Strategies
FIRST/LAST MILE STRATEGY TOOLBOXFirst Mile/Last Mile strategies can be classified into 5 category types: Bicycle, Pedestrian, Transit, Auto, and Transportation Demand. Within this universe of First Mile/Last Mile strategies there is a great deal of variation on the target user type and where they are appropriate. No one strategy fully addresses first and last mile gaps. Implementing these solutions is part of building an ecosystem of supportive options, information, and technologies. This ecosystem increases both the accessibility and attractiveness of transit and helps build a culture of transit use over time; an example of such an ecosystem is shown in the figure below.
Putting it all together
Internet
Bike Share
GPSSmart-phones
Bike ShareCar Share
Transit & Secure Bike Parking
Smart CardReal time arrival Taxi Stand
Nelson\Nygaard Consulting Associates, Inc.
Smart Card
Figure 3-1 First/Last Mile Strategies Ecosystem
The following Transit Access Toolbox provides brief descriptions of the wide range of first/last mile solutions considered by the project team.

Utah Transit Authority3-2
FIRST/LAST MILE STRATEGIES STUDY
PEDESTRIAN TOOLS
Streetscape Improvements
Streetscapes essentially define the character of the street. Every-thing between buildings on each side of the street can be considered part of the streetscape realm. Providing street trees, landscape improvements and street furniture along the sidewalks contribute to a successful streetscape.
Sidewalks
The sidewalk zone is the portion of the street right-of-way between the curb and building front. There are four distinct areas that serve different organizational purposes: edge/curb zone, furnishing zone, throughway zone, and frontage zone.
Access Connections
Some stations may have limited pedestrian/bicycle access, often via the main vehicular access points. This may require out-of-direction travel for pedestrians or bicyclists. Access connections create neighbor-hood-oriented connections for easier access to stations. For example, providing walkways from dead-end roads to stations or providing access along publicly owned easements. Network connectivity may also be improved to provide more and shorter options for people walking and bicycling to transit stations.
Curb Extensions
Also known as a pedestrian bulb-out, this traffic-calming measure is meant to slow traffic and increase driver awareness of pedestrians. It consists of an extension of the curb into the street, making the pedes-trian space (sidewalk) wider and reducing roadway crossing distances.
Figure 3-2 First/Last Mile Toolbox

3-3FINAL REPORT
STATE OF THE PRACTICE
PEDESTRIAN TOOLS
Reduced Curb Radii
Reducing turning radii fosters compact intersection design and improves sight distance. A large turning radius (generally 30 feet or greater) allows vehicles to turn at high speeds. Reducing the radius forces approaching vehicles to slow down, thus reducing the frequency and severity of pedestrian collisions at intersections. On-street parking should be restricted in advance of crosswalks, to improve visibility for pedestrians..
Pedestrian Refuge Islands
An island located in the middle of the street where pedestrians can wait, allowing them to cross half the distance of the street at a time. The minimum recommended width for a median island is 5-6 feet in order to accommodate bicyclists. The refuge island can be extended if there are higher amounts of pedestrian activity or additional travel lanes.
Traffic Signal or All-Way Stop
Conventional traffic control devices with warrants for use based on the Manual on Uniform Control Devices (MUTCD).
Pedestrian Scramble
Pedestrians are permitted to cross in all directions at an intersection, including diagonally, during an exclusive pedestrian phase. During the time when the diagonal crosswalk pedestrian indication permits pedes-trians to cross, the vehicle indications display red on all approaches of the intersection.

Utah Transit Authority3-4
FIRST/LAST MILE STRATEGIES STUDY
PEDESTRIAN TOOLS
Leading Pedestrian Signal Intervals
Pedestrians are permitted to cross in all directions at an inter-section, including diagonally, during an exclusive pedestrian phase. During the time when the diagonal crosswalk pedestrian indication permits pedestrians to cross, the vehicle indications display red on all approaches of the intersection.
Advanced Limit Lines
Standard white STOP or limit lines are placed preferably at least 4 feet in advance of marked crosswalks at signalized intersec-tions.
Pedestrian Signal Countdown Timers
The countdown timer starts either at the beginning of the pedestrian phase or at the onset of the pedestrian clearance interval. The timer continues counting down through the pedes-trian clearance interval. At the end of the pedestrian clearance interval, the countdown device displays a zero and the DON’T WALK indication appears.
Marked Crosswalks
Marked crosswalks are the portion of the roadway designated for pedestrians to use in crossing the street. Various crosswalk marking patterns are given in the MUTCD. High-visibility markings include a family of crosswalk striping styles such as the “ladder,” the “zebra,” and the “continental.”

3-5FINAL REPORT
STATE OF THE PRACTICE
PEDESTRIAN TOOLS
Raised Crosswalks
Similar to speed humps, raised crosswalks provide an elevated surface above the travel lane that attracts the attention of the driver and encourages lower speeds. It is useful in areas with high pedestrian activity by essentially raising the road surface over a short crossing distance. This treatment includes a flat area on the top that constitutes the crosswalk. This flat area may be made of asphalt, patterned concrete, or brick pavers.
Supplementary Pedestrian Crossing Channeling Device (SPCCD)
Regulatory pedestrian signage is posted on lane edge lines and/or road centerlines. The In-Street Pedestrian Crossing sign may be used to remind road users of laws regarding right of way at an unsignalized pedestrian crossing. The cones incorporate a graphic panel which reads “YIELD TO PEDESTRIANS IN CROSSWALK.”
High-Visibility Signs and Markings
High-visibility fluorescent yellow green signs are posted to increase the visibility of a pedestrian crossing.
HAWK Beacon
HAWK Beacons (High Intensity Activated Crosswalks) are pedes-trian-actuated signals that are a combination of a beacon flasher and a traffic control signal. When actuated, a HAWK beacon displays a yellow (warning) indication followed by a solid red light. During pedestrian clearance, the driver sees a flashing red “wig-wag” pattern until the clearance interval has ended and the signal goes dark. Though less expensive than a full signal, the overall effectiveness depends on the education of drivers.

Utah Transit Authority3-6
FIRST/LAST MILE STRATEGIES STUDY
PEDESTRIAN TOOLS
In-Pavement Flashing Lights Crosswalk Warning System
The devices are mounted in the street pavement adjacent to the outside of the crosswalk markings and typically protrude less than 0.5 inches above the pavement. They are normally dark, but they are actuated to provide a flashing yellow light while the pedestrian crossing is in use.
Staggered Pedestrian Refuge Island
Refuge islands are longer medians in the center of the roadway. The crosswalks leading to the island are staggered such that a pedestrian crosses half the street and then must walk towards traffic to reach the second half of the crosswalk. They must be designed for accessibility by including rails and truncated domes to direct sight-impaired pedestrians along the path of travel.
Roadway Narrowing
Narrow 10-12 foot wide travel lanes are created by striping residential streets and providing extra-wide left-turn and bike or parking lanes. The street can be physically narrowed by extending sidewalks and landscaped areas, or by adding on-street parking within the former curb lines.
Roadway Lighting
It is best to place streetlights along both sides of arterial streets and to provide a consistent level of lighting along a roadway. Nighttime pedestrian crossing areas may be supplemented with brighter or additional lighting. This includes lighting pedestrian crosswalks and approaches to the crosswalks.
Street Lighting for Pedestrians
Street lighting can help define a space that is created for the pedestrian, not the automobile. This improves nighttime visibility for safety and security, as well as emphasizing pedestrian activity. Lights are installed, generally 150-watt bulbs at 100-foot spacing, 10-12 feet high, on both sides of the street.
3-7FINAL REPORT
STATE OF THE PRACTICE
PEDESTRIAN TOOLS
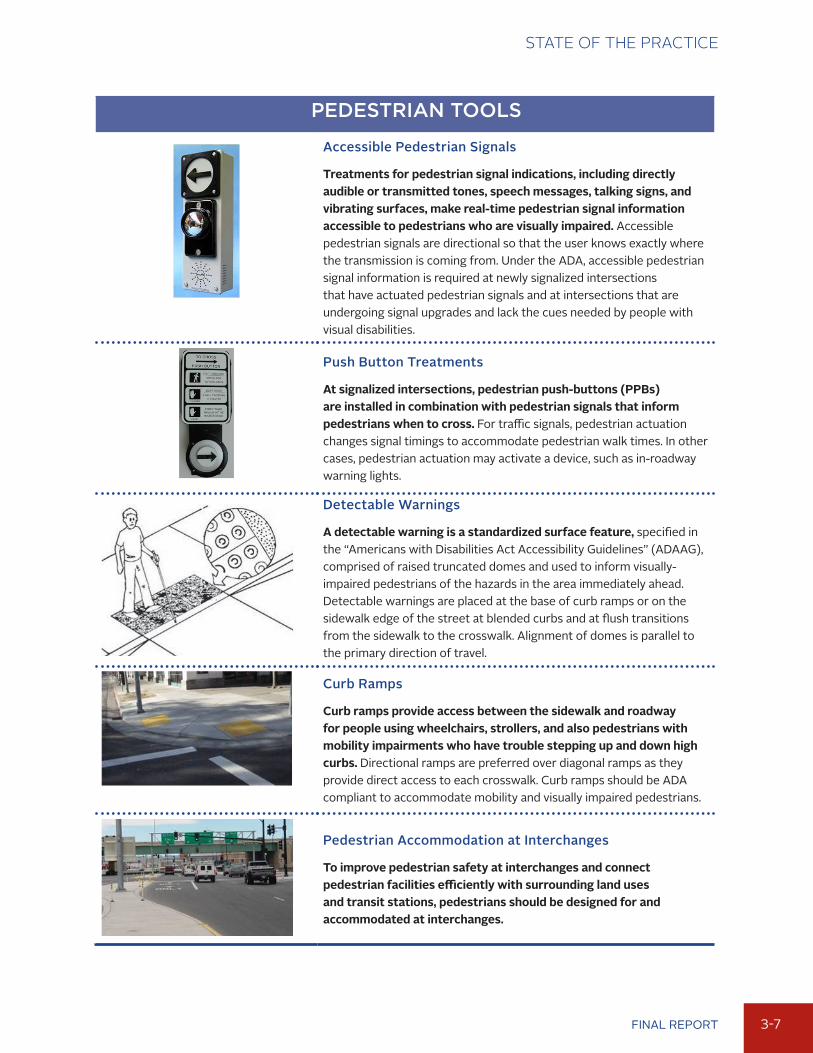
Accessible Pedestrian Signals
Treatments for pedestrian signal indications, including directly audible or transmitted tones, speech messages, talking signs, and vibrating surfaces, make real-time pedestrian signal information accessible to pedestrians who are visually impaired. Accessible pedestrian signals are directional so that the user knows exactly where the transmission is coming from. Under the ADA, accessible pedestrian signal information is required at newly signalized intersections that have actuated pedestrian signals and at intersections that are undergoing signal upgrades and lack the cues needed by people with visual disabilities.
Push Button Treatments
At signalized intersections, pedestrian push-buttons (PPBs) are installed in combination with pedestrian signals that inform pedestrians when to cross. For traffic signals, pedestrian actuation changes signal timings to accommodate pedestrian walk times. In other cases, pedestrian actuation may activate a device, such as in-roadway warning lights.
Detectable Warnings
A detectable warning is a standardized surface feature, specified in the “Americans with Disabilities Act Accessibility Guidelines” (ADAAG), comprised of raised truncated domes and used to inform visually-impaired pedestrians of the hazards in the area immediately ahead. Detectable warnings are placed at the base of curb ramps or on the sidewalk edge of the street at blended curbs and at flush transitions from the sidewalk to the crosswalk. Alignment of domes is parallel to the primary direction of travel.
Curb Ramps
Curb ramps provide access between the sidewalk and roadway for people using wheelchairs, strollers, and also pedestrians with mobility impairments who have trouble stepping up and down high curbs. Directional ramps are preferred over diagonal ramps as they provide direct access to each crosswalk. Curb ramps should be ADA compliant to accommodate mobility and visually impaired pedestrians.
Pedestrian Accommodation at Interchanges
To improve pedestrian safety at interchanges and connect pedestrian facilities efficiently with surrounding land uses and transit stations, pedestrians should be designed for and accommodated at interchanges.

Utah Transit Authority3-8
FIRST/LAST MILE STRATEGIES STUDY
BICYCLE TOOLS
Bike Path
Bike paths provide a completely separate right-of-way and are designed for the exclusive use of bicycles and pedestrians with vehicle cross-flow minimized.
Bike Lane
Bike lanes provide a restricted right-of-way and are designated for the use of bicycles with a striped lane on a street or high-way. Minimum required width for bicycle lanes is five feet, but at least six feet is preferred. Certain sections of the bike lane may be colored or marked utilizing special stencils to highlight high-risk locations, where motorists are permitted or required to merge into or cross the bike lane.
Protected Bike Lanes
In order to provide increased safety, bike lanes may be physi-cally separated from motorized traffic by barriers such as parking, concrete barriers, and planters or differences in elevation.
Bike Route
Bike routes provide a right-of-way designated by signs or pavement markings for shared use with pedestrians or motor vehicles. While a basic bike route may simply have signs and markings, a bicycle boulevard is a special type of shared route that optimizes bicycle travel. Bike boulevards can have a variety of traf-fic calming elements to improve safety and comfort for bicyclists and often feature reduced speed limits.

3-9FINAL REPORT
STATE OF THE PRACTICE
BICYCLE TOOLS
Bike Rack
Bicycle racks are devices to which bicycles may be securely at-tached. The rack itself should be securely attached to the ground or a stationary object such as a building. Weather protection may also be provided in the form of a cover or shield. Bike racks are appropriate for short-term use.
Bike Locker
A locker or box in which a single bicycle can be placed and locked. Lockers may either be available on a first-come-first-served basis and/or for a fee. Users can reserve lockers for several months at a time for an established fee, or can rent as needed on a short-term basis.
Bike Station
A bicycle station is a building or structure that provides services to bicycle commuters such as secure bicycle storage, showers, lockers, bicycle repair services, bike parts and accessories for sale, information for bicyclists, bike rental, etc.
Salt Cycle
Bicycle Storage on Trains
Bicycle storage on trains provides a dedicated storage area and type for cyclists who take their bikes on-board. Horizontal racks or vertical hooks are the most common types of on-board storage.
American Trails
Bicycle Signage
Signs often convey important information that can improve road safety. The intent is to let bicyclists and motorists know what to expect in order to improve the chances that they will react and behave appropriately.

Utah Transit Authority3-10
FIRST/LAST MILE STRATEGIES STUDY
BICYCLE TOOLS
Bicycle Detection
When a bicyclist approaches an intersection, there are several means of detecting and facilitating his or her movements. Most of the innova-tions are passive detection devices such as loop detectors and infrared or video detection systems. A bicycle stencil informs bicyclists that their bicycles actuate the signal. Other detection devices are active, such as the bicycle push-button, which is similar to that used by pedestrians.
Bicycle Signal
Signals dictate traffic behaviors and patterns. Bicycle signals give priority phasing for bicycle crossing. They can also inform cyclists and drivers about the interaction between bicycles and traffic.
Bicycle Box
A bicycle box is a marked on-street waiting area designed to improve cyclist visibility when stopped. There are two types of bicycle boxes: two-point left turn and advanced stop line.
Before
After
Lane Reduction
This treatment involves reducing the number of travel lanes by widening the sidewalks, adding bike and parking lanes, converting paral-lel parking to angled or perpendicular parking, or converting one-way streets to two-way with a center median.
Bike Sharing
Bike sharing is a form of bicycle rental where people have convenient access to a shared fleet of bicycles on an as-needed basis. In recent years, innovations in technology have given rise to a new generation of technology-driven bicycle sharing programs. These new bicycle sharing programs can dramatically increase the visibility of cycling and lower barriers to use by requiring only that the user have a desire to bicycle and a smart card, credit card, or cell phone.

3-11FINAL REPORT
STATE OF THE PRACTICE
TRANSPORTATION DEMAND MANAGEMENT TOOLSParking Cash-Out
Parking cash-out is a policy where employees who may be offered parking as a benefit of their job are offered monthly cash benefits or free transit passes in exchange for giving up their free or employee-paid parking. Often, revenues from paid parking facilities will pay for the free employee transit passes and other related benefits. A parking cash-out policy reduces employee parking demand through financial incentives or free alternative transportation.
Guaranteed Ride Home (GRH)
GRH programs provide an occasional subsidized ride to commuters who use alternative modes. For example, if a bus rider must return home in an emergency, or a car pooler must stay at work later than expected.
On-Site Transportation Sales Support
Employers can offer a wide range of incentives to encourage the use of commute alternatives among employees, including selling transit passes on-site, providing transit subsidies, and establishing pre-tax spending accounts to pay for commuting expenses.

Utah Transit Authority3-12
FIRST/LAST MILE STRATEGIES STUDY
TRANSIT ACCESS INFORMATION AND TOOLSShared Bus Bays
Just as multiple airline flights use the same gate at an airport, multiple bus routes can share a bus bay. With dedicated bus bays, each bay has a permanent sign with the name of the agency or shuttle service and the route that stops there. With shared bus bays, typically signs that show multiple routes are posted, or more often electronic signs are used that can be changed to show which bus will stop at that location and when.
Integrated Fare Pay Systems
Integrated fare pay systems allow users to access multiple trans-portation modes with a single ticket or pass. This would comprise of a daily, weekly, monthly, or yearly pass that would allow use of public transit, bikeshare, and carshare programs.
Queue Bypass Lanes
A queue bypass lane is a lane where signal phasing allows for the queue to clear before the transit vehicle approaches the signal, effectively offering a transit-only lane.
Traffic Signal Priority
An operational strategy that facilitates the movement of transit vehicles through signal-controlled intersections. As the transit vehicle approaches the intersection, it is detected and the traffic signal may be adjusted based on a pre-programmed priority control strategy.
Bus Stop Enhancement
Bus stops are public transit’s “front door” and offer riders their first impression of a transit service. An attractive, well-maintained stop that provides shelter and seating is likely to be received in a much more positive manner compared to a simple sign-post with a bus schedule.

3-13FINAL REPORT
STATE OF THE PRACTICE
TRANSIT ACCESS INFORMATION AND TOOLS
Bus Turnouts
A bus turnout (also known as a bus bay) is a specially constructed area separated from the travel lanes and off the normal section of a roadway that provides for the pickup and discharge of passengers. This design allows through traffic to flow freely without the obstruction of stopped buses.
Paratransit Loading Area
The focus of this tool is to ensure transit facilities incorporate a plan for paratransit vehicles. Transit agencies should allot space that affords a minimal distance between a dedicated paratransit bay and other station amenities.
ADA Accessible Environment at Transit Facilities
In accordance with the ADA, transit agencies are required to develop an Access Plan, which is also referred to a Transition Plan, to address any deficiencies. Its purpose is to identify physical obstacles that limit the accessibility of facilities to individuals with disabilities, describe the methods to be used to make the facilities accessible, provide a schedule for making the access modifications, and identify the public officials responsible for implementation of the Transition Plan.
Lighting
Some report that they are sometimes wary of using isolated or poorly lit transit facilities. Improved lighting enhances the feeling of personal safety and may eliminate some barriers to transit use. Most existing transit facilities have electric wiring in place that allows additional lights to be added.
Passenger Waiting Areas
Sheltered waiting areas at transit centers provide protection from rain or sun. They can be created by adding a canopy above the existing waiting area, installing pre-fabricated bus shelters in a lot or on a waiting platform, or building an extension to an existing transit center. In some cases, sheltered waiting areas may already exist at a transit center, but bus stops can be relocated closer to the shelters.

Utah Transit Authority3-14
FIRST/LAST MILE STRATEGIES STUDY
TRANSIT ACCESS INFORMATION AND TOOLSOn-Site Staffing
The presence of on-site staff, whether dedicated to security or public information (or even the sale of goods at a snack bar or newsstand), offers a valuable tool for making a transit facility more desirable for users, provides an enhanced sense of public safety, an information resource for users, and/or a way to purchase goods and services.
At Station Wayfinding and Signage
The purpose of this tool is to provide more comprehensive infor-mation at transit centers about transit routes, availability of services, and how to ride. Transit center information can be in the form of fixed maps, schedules and instructions, or brochures available for the public to take with them for personal reference.
En Route to Station Wayfinding and Signage
The purpose of this tool is to improve the visibility of routes accessing the transit station. In certain cases, information at the station is sufficient, but finding the station is difficult.
Real Time Information
Real-time information provides transit arrival information, usually updated at regular intervals, based on automated vehicle locator (AVL) data, global positioning system (GPS) data, dispatch respond-ers (or based on modeled assumptions about speed), or even social networking feedback.
Image from Desert News
Shuttles
Shuttle services provide point-to-point transportation to fill gaps or make connections with the broader public transit network, often for specific groups of individuals. Shuttle services typically serve riders in a well-defined area or along a specific route and provide convenient and direct service to desired destinations.

3-15FINAL REPORT
STATE OF THE PRACTICE
AUTO ACCESS TOOLS
Image from Lyft
Commercial Ridesharing
Commercial ridesharing is a taxi-like service where the rideshare is created using mobile apps to connect passengers with drivers. Payment is collected through the mobile app and drivers are paid a portion of the user charge.
Dynamic Ridesharing
Dynamic ridesharing systems consider each trip individually and are designed to accommodate trips to random points at random times by matching user trips without regard to trip purpose. Dynamic ridesharing can either be an organized program run by an agency or an informal system run by users.
Taxi Sharing
Taxi service differs from rental car and car-sharing services in that the person making the trip: a) does not drive themselves, b) does not need to reserve in advance, and c) can access the service at many different locations. Under a taxi sharing program, cab drivers can pick up multiple passengers at the same time, provided each passenger is headed in the same direction.
Carpool/Vanpool
Carpooling/vanpooling is the shared use of a car by the driver and one or more passengers. When carpooling, people either get a ride or offer a ride to others instead of each driving separately. Carpooling/ vanpooling arrangements can utilize personal vehicles or vehicles supplied by public agencies or private companies.

Utah Transit Authority3-16
FIRST/LAST MILE STRATEGIES STUDY
AUTO ACCESS TOOLSCar Sharing
Through car sharing, individuals gain access to vehicles by joining an organization that maintains a fleet of cars and light trucks in a network of locations. Members must pay a fee and pay per use. Vehicle locations are distributed in neighborhoods. Vehicle reservations and access are self-service. Vehicles must be picked up and dropped off at the same location.
Image from Richard Drdul
Priority Parking
Priority parking recognizes that parking is a finite resource and should be managed to assure maximum access for patrons. It reserves the most convenient parking spaces to promote ridesharing in the form or carpool/vanpool or car-sharing (also sometimes used to promote electric vehicles and motorcycles).
Residential Permit Parking
A residential permit parking district is designed to protect local residents from parking difficulties in areas near major destinations. This is usually accomplished by issuing residents permits that allow them to park for free, while offering non-residents paid parking, either through a fee or by offering a finite number of permits. This tool can be used as a transit strategy if combined with good transit service because it limits available parking in desirable areas, encouraging the use of transit.
Parking Benefit District
Parking Benefit Districts utilize revenues generated by a variety of means including assessments, taxes, or parking meters to support transportation-related services, such as transit service improvements or active transportation enhancements.
3-17FINAL REPORT
STATE OF THE PRACTICE
STRATEGIES USED WITHIN THE UTA SERVICE AREAWhile the Toolbox lists a comprehensive range of strategies, not all of them are currently in use within UTA’s service area. This section identifies major first/last mile strategies employed by UTA and others to connect riders to stations.
GREENbike Share Program
GREENbike is a non-profit organization and private/public partnership. The program is implemented in downtown Salt Lake City and provides a short-term bike rental to users which could be picked up at one station and left at another. The GREENbike Share program provides pre-registered members with short-term, one-way access to the bikes parked at certain locations. It currently has 12 stations available within the downtown area, and 8 of these stations are at or very near TRAX or FrontRunner stations. These include the Arena, City Center, Gallivan, Library, Planetarium, and Temple Square TRAX Stations, as well as the North Temple and Salt Lake Central TRAX/FrontRunner stations. Users can purchase one of three kinds of memberships: annual, 7-day, or 24-hour. Members are charged only for the time they use, and the first 30 minutes is free. Each bike station has maps showing the available stations for bike rental/return in the network. Mobile apps such as B-cycle and Spotcycle also show the bikes and docks available at every station in real time.
On-board Bicycle Accommodations
Bicycles are currently allowed on both TRAX and FrontRunner trains, with specific loading areas identified at the stations for cyclists. FrontRunner cars can accommodate between 4-12 bicycles each, depending on the type of car; TRAX cars can accommodate up to 4 bicycles in each car. UTA is currently exploring methods of more efficient bicycle storage on cars, including the installation of hooks on TRAX vehicles for hanging bikes. Respondents to the Open UTA Survey (discussed in Section 2 of this report) identified on-board bicycle accommodations as one of the most desirable bicycle-related first/last mile solutions. In addition, some survey respondents provided open-ended comments describing their experiences bringing bikes on board, which are challenging in peak commute periods or when there are more than the prescribed number of cyclists wanting to board the trains.
Enterprise Car Share Program
More and more metropolitan areas are adopting car share programs. Having car sharing available at public transit stations may allow transit users to forgo having their own vehicle in exchange for using car share vehicle for trips on an as-needed basis. Enterprise is currently the Car Share vendor in the Salt Lake City area, and their program allows people to reserve a car by the hour. Members reserve the car online or by phone, access the vehicle with the membership card, and then return it to the dedicated parking space once their trip is finished. The car is shared by the hour at $8.00, with fuel, physical demand/liability protection included. There are several car share stations at or near TRAX and FrontRunner stations on the Wasatch Front, as listed below:
▪ Multiple locations downtown near the Red or Blue TRAX Lines including 225 South Main, 395 South 200 East, 310 South 300 East, 300 South 500 East, and 374 South 1000 East;
▪ On the University of Utah Campus at several locations including the Stadium TRAX Station, 1901 East South Campus Drive, 245 Fort Douglas, and the University Medical Towers;
▪ Murray Central TRAX/FrontRunner station; and
▪ Orem FrontRunner station.
UDOT TravelWise Travel Demand Management (TDM) Program
As Utah continues to experience unprecedented growth, challenges inevitably follow. To address some of the transportation challenges created by this growth, UDOT developed TravelWise—a set of strategies that encourage Utahns to use alternatives to driving alone, especially during peak travel hours. The state of Utah is asking individuals, businesses, communities and organizations to implement TravelWise strategies in an effort to reduce

Utah Transit Authority3-18
FIRST/LAST MILE STRATEGIES STUDY
energy consumption, optimize mobility and improve air quality, ultimately improving the quality of life in Utah. TravelWise strategies include alternative work schedules, active transportation, carpool/vanpool, public transit, “skip the trip,” teleworking, trip chaining, and plan ahead. TravelWise tools include the TravelWise Tracker, Variable Message Signs (VMS), Business and Community Resource Kits, TravelWise alerts and www.travelwise.utah.gov.
Shuttles (Current and Proposed)
UTA currently operates a number of employer- or destination-focused shuttles, with several others in planning stages. There are 17 UTA shuttles currently in operation, generally connecting destinations with TRAX or FrontRunner stations. These shuttles serve 11 of the 70+ TRAX or FrontRunner stations, and are focused at FrontRunner stations in suburban locations. Examples of shuttle destinations include Weber State University in Ogden, Adobe and IM Flash in Lehi, or the International Center on the west side of Salt Lake City. Ridership on the shuttles ranges from roughly 40-45 daily boardings (i.e., the Pleasant View shuttle from Ogden FrontRunner station) to nearly 800 daily boardings (a circulator connecting Salt Lake Central Station with West Valley Central TRAX and several neighborhoods on Salt Lake City’s west side). National literature suggests that successful shuttle characteristics include:
▪ Frequent and convenient service
▪ Service to areas with high residential or employment density
▪ Service to locations with limited or priced parking
▪ Service combined with other TDM measures
Many communities across the Wasatch Front have requested their own shuttle networks, and UTA is in the process of studying or implementing several new routes. These include the Davis-Salt Lake City Community Connector project and the Sandy/South Jordan Circulator, among other local and regional transit projects. The Davis-Salt Lake City Community Connector will provide enhanced bus service connecting south Davis County to Salt Lake City, and includes suggested bicycle and pedestrian improvements as well as land use policy changes that encourage transit oriented development around stations. UTA is currently seeking funding to begin environmental review of the Community Connector. The Sandy/South Jordan Circulator is being planned in response to the Sandy City Civic Center Area 30-year Development Plan, which guides development within the Sandy City area to accommodate the city’s growing population, uphold the Wasatch Choice 2040 vision, reduce traffic congestion and promote the area’s economy. A feasibility study is currently under way for the circulator, and the anticipated recommended mode is bus but may eventually transition to streetcar.
Active Transportation
UTA has long recognized that improving active transportation connections to its stations represents an opportunity to capture more riders, and encourage current riders to walk or bike to stations rather than driving. In 2013, the Utah Collaborative Active Transportation Study (UCATS) was completed by UDOT and UTA in partnership with WFRC, MAG, and Salt Lake County to establish a plan for a regional bicycle network and enhance access to transit. UCATS developed a decision-making framework to identify high-priority project areas for both regional bicycle routes as well as station-based access improvements. The process includes the evaluation of existing network condition, categorizing infrastructure types, assessing access to transit, determining anticipated trends or patterns in walking or bicycling and conducting public outreach to gather information on perceptions and suggestions about active transportation infrastructure. High-priority “Top 25” project areas are identified all along the Wasatch Front and include several recommendations for connectivity improvements at UTA FrontRunner and TRAX stations. These recommendations are provided in Appendix C. In addition to the recommendations made through the UCATS process, many local jurisdictions are implementing bicycle and pedestrian improvements on their own or in partnership with UTA or UDOT.

3-19FINAL REPORT
STATE OF THE PRACTICE
Ride Matching Services
UTA Rideshare provides several services to transit users seeking first/last mile solutions such as carpooling, vanpooling, or ride matching. UTA’s Rideshare staff maintain a matching service to link carpoolers together (accessible via www.utacommuter.com), where individuals can list their information for as long as it takes to establish a carpool match. UTA also works with employers and groups of individuals to create vanpools. Prospective vanpoolers can register via the www.utacommuter.com website to see whether an existing vanpool group meets their needs, or whether they should start a new vanpool. UTA provides a van, maintenance, insurance, back-up vehicles and support, fuel, and up to 50 personal miles of travel on the van. The vanpool participants pay a fare based on the average monthly commute miles on the van, divided by the number of vanpoolers.
Wayfinding
Wayfinding signage is currently in place around all UTA TRAX and FrontRunner stations. However, in some locations the stations are not immediately visible in the urban fabric, and additional wayfinding signage to stations would be valuable. UTA is currently conducting a “branding refresh” of its existing sign designs, focusing on the style and appearance of the signs (for instance, consistency in formatting and color scheme). UTA has no immediate plans to address signage and wayfinding beyond this; recommendations for additional wayfinding improvements are provided in Section 6.
STRATEGIES USED BY PEER AGENCIES To support the information on best practices, several peer agencies were interviewed to obtain tangible and realistic examples of their experience with various first/last mile strategies. Potential peers were identified by considering the following criteria:
▪ City Population and Population Density. Because total population and population density correlate closely to transit demand, peer cities were favored that have population and population densities that are similar to Salt Lake City.
▪ Transit Services. Peers offering a similar suite of transit services (e.g. bus, BRT, light rail, commuter rail) were favored.
▪ First/Last Mile Strategies Offered. To ensure peers could offer a breadth of experience, peers with experi-ence implementing a range of first/last mile strategies (e.g. bicycle sharing, bicycle parking, transfer agree-ments, car sharing, shuttles, park-and-rides, marketing) were favored.
▪ Station Typologies. Transit systems with mostly urban type stations could be amenable to different types of first/last mile strategies than those with more suburban, lower-density type stations. Peers were targeted to get a range of station typologies.
▪ Weather and Climate. Due to the effect of the weather on people’s travel choices, peer agencies operating in similar climates were chosen.
▪ Existence of Major Universities. Communities with major universities tend to rely less on private automo-biles and more on modes like transit, bicycling, and walking and therefore could respond differently to certain first/last mile strategies.
▪ Parking Constraints and Paid Parking. General information on local parking regulations and availability did not filter out any peers, but rather provided some background and context on the local transportation environment and the mode choices people make.
Five agencies provided information on their use of and experience with first/last mile strategies: Chicago Transit Authority (CTA), Regional Transportation District (RTD) in Denver, Washington Metropolitan Area Transit Authority (WMATA) in Washington D.C., TriMet in Portland, and Capital Metro in Austin. Each agency was asked about the strategies they use, how they plan and prioritize among them, any specific challenges and opportunities they have discovered, marketing and information used to support them, funding sources used, and lastly, if and how they monitor and evaluate the services. The sections below describe what was learned from these peers and the interview questionnaire is provided in Appendix D.

Utah Transit Authority3-20
FIRST/LAST MILE STRATEGIES STUDY
FIgure 3-3 Summary of First/Last Mile Strategies Reported by Peer Agencies and UTA
FIRST | LAST MILE STRATEGIES USEDCTA
(Chicago)RTD
(Denver)WMATA
(DC)TriMet
(Portland)
Capital Metro
(Austin)UTA
Bike Share
Bike and Ride Facilities
Bike Parking
Bike-on-Transit Accommodations
Pedestrian Access Improvements
Bicycle Access Improvements
Car Share
Park and Ride
Shuttles (private or partner funded/operated)Connector/ Circulator Routes (agency funded or operated)
Restructured Public Transit Routes
Real-time Arrival Information (apps and/or displays)
Call and Ride (demand response)
Preferential Parking for Carpools and Vanpools
Kiss and Ride
Transfer Agreements
Special Marketing/ Branding
Strategies Used
Each agency provided background information on the scope of strategies they had implemented. Figure 3-3 provides a summary of the strategies reported by the peer agencies (it may not be fully inclusive of the strategies they currently use or have used in the past). A few things stand out—every peer invests in bicycle and pedestrian strategies to address first and last mile gaps. They also consistently invest in car sharing, preferential parking for carpools and vanpools, and shuttle or circulator services. It should be noted that some agencies have been successful at seeking operational funding for these types of services from private partners.
Planners at CTA in Chicago indicated their focus is to provide connections at transit stations with restructured local bus service and privately-funded routes. CTA also has made significant efforts to encourage biking to rail stations by providing bicycle parking both inside and outside fare gates. Capital Metro emphasized the use of peak-time shuttles as its main first/last mile strategy, but works with the City of Austin, private developers, employers, and others to promote multimodal access to its stations. RTD in Denver reports a “family of services” approach to the first/last mile challenges. They have assessed four specific corridors for opportunities and are in the process of implementing several corridor-specific strategies, such as call-and-ride/demand-response transit, car sharing, improved walking conditions, and kiss-and-ride drop-off locations. Both TriMet and WMATA take a multimodal approach to the first/last mile problem with an emphasis on pedestrian and bicycle access.

3-21FINAL REPORT
STATE OF THE PRACTICE
Planning and Prioritization
Unlike UTA’s approach, many agencies have not developed a system plan for first/last mile strategies, but rather have addressed these needs as part of their existing and ongoing service planning and bike/pedestrian programs.
RTD has used a corridor-based approach rather than looking just at stations. RTD found that suburban stations require the most attention, so prioritizes investment in those locations where new or enhanced transit service is planned. In 2013, they conducted a study of access options at six park-and-rides along the U.S. 36 corridor,1 which will begin BRT service in 2016.2
TriMet has planned explicitly for pedestrian access through its system-wide assessment of the pedestrian network at more than 6,500 transit stops.3 Their data-driven, GIS-based approach highlighted ten focus areas to target pedestrian investments and helped identify potential project partners. The analysis prioritized the areas that had both the highest needs (e.g. safety issues) and the greatest opportunities (e.g. near new developments). This analysis has helped them pursue partnerships and funding opportunities by providing data-driven justification for investment priorities.
Implementation of bicycle parking on CTA-owned property was prioritized based on two criteria: 1) predicted usage and 2) space available. While no formal prioritization analysis was completed, staff reported using simple metrics such as the prominence of bicycles parked to railings to indicate demand for improved bike parking. Stations that had space available inside the fare gates were also prioritized, given patrons’ preference for this added level of security. CTA contracts with six different partners who provide operational funding for routes that improve connec-tions to their businesses (detailed further in the Funding Operations and Maintenance section, below). In general, CTA did not prioritize these routes proactively, but rather were approached by the funding partners individually as part of solving a local transit service need.
1 http://36commutingsolutions.org/us36/wp-content/uploads/US36FFM_Final.pdf2 http://www.rtd-fastracks.com/us36_13 TriMet. Pedestrian Network Analysis Project. Information shared with Nelson\Nygaard by Jeff Owens, Active Transportation
Planner at TriMet. Reports available on the web: http://trimet.org/projects/pedestrian-network.htm
“[Bicycling and walking] excel at short trips and connections to transit.”
~Jeff Owen, TriMet
Pedestrian Network Analysis
Overview of Process: • Big service area with lots of transit
stops 1. Base Analysis
(land use, ridership, destinations) 2. Overlay Analysis
(deficiencies and opportunities) 3. Composite Scores
(look for clusters, then focus areas)
Figure 3-4 TriMet Pedestrian Network Analysis Methodology

Utah Transit Authority3-22
FIRST/LAST MILE STRATEGIES STUDY
Finally, Capital Metro highlighted that despite the agency’s desire to plan for and prioritize transit-oriented development and multimodal transportation, they have had to resort to increasing parking capacity at some of their most suburban rail stations. The local station context, which has been influenced by historical development decisions out of their control, dictates that autos have priority to the agency’s long-term vision in that context.
Marketing and Information
Most agencies framed their approach to marketing and information campaigns as parallel to or in coordination with their existing communications processes. In the case of contracted services, private partners who contribute funding are naturally motivated to market them to employees and visitors. CTA’s General Manager of Customer Information gave the most detailed insight on their experience with different target audiences: employers, universities, and tourists or the general public.
They have learned that employers are the easiest to market to, given that employers have access to the target audience (employees/commuters). CTA has been effective at marketing new services through employers’ payroll and new employee information packets, as well as by providing materials within employee break rooms.
Universities, their staff, and students are the next most challenging audience to reach; the intended audience is slightly more diffuse as students live both on and off campus and can be harder to reach with their irregular schedules. For this audience, CTA’s marketing approach is to provide flyers, posters and other information at rail stations, local libraries, and institutions; announce new services to the staff of elected officials; work with local organizations to get information in their newsletters; provide materials in university orientation packets; and place ads in university newspapers.
Planners at CTA have found that sending information through the school is the most “sure-fire way” to get information to students, whether they be in grade school or in college. For Chicago Public Schools, CTA has worked with the school department to insert transit information handouts into report card envelopes. In addition, students aged 12 through 20 attending a Chicago area public, parochial, or private elementary or high school on a full time basis are eligible for a Student Riding Permit (giving them access to a reduced fare). For students at colleges, CTA has a U-Pass program in which participating colleges provide pre-loaded transit passes (Ventra cards) to students. The U-Pass and Student Riding Permit allow CTA to track transit use by students; student-focused marketing at stations is often done by targeting stations with the highest student ridership. These registrations also give CTA access to students’ email addresses, which they occasionally use for email marketing purposes, but generally prefer to go through schools to reach students directly whenever possible.
According to CTA, the most difficult audience to reach is the tourist market or general public. For tourists, they have found it effective to target hotel concierges, who are often the “gatekeepers” of local transportation information for visitors. Like other agencies, they also have implemented wayfinding signage with maps of destinations within a ½-mile of rail stations to make transit more visible and travel easier for the general public.
Figure 3-5 Hierarchy of Target Audiences
TOURISTS + GENERAL PUBLIC
SCHOOLS + UNIVERSITIES
EMPLOYERS

3-23FINAL REPORT
STATE OF THE PRACTICE
Funding Operations and Maintenance
Operations and maintenance (O&M) expenses for first/last mile strategies vary widely depending on the type and scope of strategy implemented. Upfront capital costs, the ongoing O&M expenses, and the availability of funding to cover them must be taken into account when selecting and prioritizing appropriate strategies. Appendix E provides a summary of estimated capital and O&M costs for several first/last mile strategies. Agencies often estimate ongoing O&M costs on an investment lifecycle basis—that certain infrastructure will be replaced every five to seven years, for example—rather than in annual dollar costs. O&M estimates, therefore, usually annualize the up-front capital costs over the expected lifespan of the investment.
Peer agencies provided information on the funding sources used, maintenance practices, and marketing activities. Figure 3-6 summarizes some of the funding sources used by peer agencies for the implementation of first/last mile strategies. This list is not comprehensive, but demonstrates the breadth of funding sources relied upon for first/last mile investments.
Figure 3-6 Sample FMLM Funding Sources
AGENCY FUNDING SOURCES USED
Capital Metro Capital Metro operating budget
CTA Private partners for contracted service, Job Access and Reverse Commute (JARC) program
RTD Sales tax, fares, some grants
TriMet Transportation Growth Management (TGM) grants, State Transportation Improvement Program (STIP) Enhance, MTIP Regional Economic Opportunity Fund, Metropolitan Transportation Improvement Program (MTIP) Regional Flexible Funds Allocation (Oregon-only sources)
WMATA TIGER, FTA 5307, operating budget,* contributions from local jurisdictions‡
* WMATA relied on its operating budget to install bike racks and installation.
‡ WMATA is a “regional compact agency” created by the District of Columbia, the State of Maryland, and the Commonwealth of Virginia. Each of the compact members contributes financially to its services.
Shuttles and Special Transit Service
In Chicago, six special transit connections have been funded through partnerships with large employers or tourist centers (out of a total of 128 bus routes). These partners include the Avon distribution facility in Morton Grove, the UPS facility in Hodgkins, the Museum of Science and Industry, the University of Chicago, Metra (commuter rail), and the William Wrigley Jr. Company. The partners pay the full amount of the operating cost minus the fare revenue collected. CTA has written agreements with the partners that specify each party’s financial commitments. CTA has also relied on Job Access Reverse Commute (JARC) funding for last mile connections to schools and employment centers, typically implemented by extending the service span or distances to existing routes.
Non-Motorized Connections
When purchasing bike racks for its rail stations, CTA piggybacked on an existing City of Chicago effort to install new bike racks throughout the city. By coordinating their purchasing, both parties were able to save money on their bulk orders. This kind of small-but-impactful approach was echoed by TriMet, who has adopted a philosophy of “take care, make small improvements” as part of its bike project maintenance program. TriMet has a small general fund budget line for “Bikes to Transit,” which is used for things like minor repairs to lockers, new locker numbers, new locks, small purchases of bike racks, and new or replacement signage. TriMet has had success in partnering with individual cities and counties within its service area (Portland, Gresham, Tigard, Washington County) and the Oregon Department of Transportation to jointly apply for several grants for first/last mile efforts.

Utah Transit Authority3-24
FIRST/LAST MILE STRATEGIES STUDY
Other Potential Funding Sources
Other funding sources that could be available for first/last mile investments include:
▪ Federal sources. The Surface Transportation Program (STP), Congestion Mitigation and Air Quality Improvement Program (CMAQ), and National Highway System (NHS) are flexible funding sources available for several transit, parking, bicycle, and pedestrian projects that address first/last mile gaps.4
▪ Safe Routes to School (SR2S) Grant Funding Program. This national grant program funds projects that increase the number and safety of children reaching school by walking and biking. It funds capital projects such as sidewalk improvements, traffic calming and pedestrian/bicycle crossing improvements, on-street bicycle facilities, off-street bicycle/pedestrian facilities, and traffic diversion improvements.
▪ Private advertising in public right of way and bike share sponsorships. Both UTA and GREENbike allow private advertisers and sponsors to display ads for a fee. Advertising revenues collected by UTA have historically made up a very small percentage of all revenues (approximately $1.5 to $2.5 million annually),5 but are flexible dollars. Bike share station sponsorships each cover approximately one year of bike share operations per station.
▪ Parking fees. Parking fees are a parking management tool used to encourage carpooling, transit use, and other non-drive alone transportation.
▪ Transportation sales taxes (pending local community actions on tax increases).6 Salt Lake City currently levies a 0.25% sales tax for transportation. Revenues collected through the sales tax are primarily intended for transit investments. As of the 2015 Legislative session, local municipalities will soon have the opportunity to vote on local sales tax options to fund transportation improvements.
▪ Business Improvement District (BID) or a Property-Based Improvement District. BIDs provide a means for businesses to assess themselves to improve the surrounding area (e.g. the Downtown Salt Lake City Alliance). A property-based improvement district (PBID) collects money from property owners rather than business owners. Once established, the District could advance public/private funding for any of the strategies provided they benefit residents or visitors within the District boundaries.
▪ Transportation maintenance fees (TMF). A TMF, also known as a transportation utility fee, street maintenance fee, or street utility fee, is a monthly fee that is collected from residential and commercial properties within the city limits based on use of the transportation infrastructure. TMFs provide a stable source of revenue that can be used to maintain city streets, sidewalks, pedestrian crossings, bike lanes, multi-use paths, and medians. Several cities in Oregon and Colorado use this fee.7
▪ Local and regional transportation agencies such as UDOT and UTA may also choose to use their transportation funds to implement first/last mile solutions.
Monitoring and Evaluation
Some first/last mile strategies—particularly those that are operational in nature—are implemented on a pilot basis with intentions to track usage and effects on ridership. Even when new services or infrastructure are implemented permanently, follow-up studies can inform future efforts and ensure efficiency. In some cases, evaluation studies are actually required by funding sources to ensure compliance with grant goals (JARC, for example).
Common evaluation methods among peers include patron surveys, walking audits, observations, and monitoring ridership and performance data. Several agencies also discussed their ongoing monitoring of the effects of new first/last mile strategies on existing transit performance. For example, WMATA conducts an annual “bike census” to track trends in access mode share and bike parking usage. They have set access mode share goals (to triple bike
4 Federal Transit Administration. “FTA – Flexible Funds.” Web: http://www.fta.dot.gov/grants/12867.html.5 Utah Transit Authority. 2014 Budget Document. Web: http://www.rideuta.com/uploads/2014BudgetDocument.pdf.6 Davidson, Lee. “Utah cities seek sales tax increase to improve local roads.” November 19, 2014. Web: http://www.sltrib.com/
news/1846574-155/transportation-taxes-tax-local-sales-cities.7 See the City of Oregon City (http://www.orcity.org/publicworks/transporation-utility-fee) and City of Boulder (https://
bouldercolorado.gov/transportation/transportation-maintenance-fee-faq). Boulder has conducted a peer review of financing tools that catalogues many funding opportunities (https://bouldercolorado.gov/pages/transportation-finance-peer-city-review).
3-25FINAL REPORT
STATE OF THE PRACTICE
mode share by 2020 and quadruple by 2030) through the agency’s master planning process.8 They also informally monitor the College Park secure bike parking facility (the station is adjacent to the University of Maryland) and trends in car share usage through their partnership with Zipcar. They know that Zipcars at Metro stations are used about 30 to 40% on weekdays during a typical week; demand “skyrockets” on weekends. Staff is in the process of developing a survey to more formally track usage and reception of new bike-and-ride facilities, such as the one at College Park.
TriMet provides bike-on-board facilities on its light rail vehicles, in addition to front-mounted racks on its buses. To gauge the need for additional strategies, such as bike share and secure bike parking, TriMet has conducted onboard capacity tests of its racks. They found onboard capacity for bike storage to be extremely limited and are looking forward to implementing a bike share program (anticipated in 2015) as a way to mitigate some of that demand.
Through a study of transfers between its rail service and connector routes, Capital Metro learned there was a low level of transferring and was able to eliminate unnecessary service. This opened up funding for other, more productive connector routes.
CTA’s overall approach to evaluating first/last mile solutions is a network-based approach. Through regular service planning, they look for unproductive areas to refocus resources in growing areas. They have also used JARC funding to plan and evaluate new service to growing employment and educational centers. In one such evaluation, they found that 63% of trips on the new service were for access to school or work sites.
RTD has planned formal evaluations for each of its corridor-based initiatives over the next few years. In 2008, they conducted a study of the performance of existing shuttle and circulator services.9 They found:
▪ Strong correlations between performance and population density as well as between performance and the prevalence of zero-vehicle households; all routes with more than 10 boardings per hour were correlated with a population density of over 10 people per acre
▪ Fare had no apparent effect on ridership; the most successful routes actually charged more for service
▪ The performance of routes serving many activity centers (schools, hospitals, or employment centers) depends on the population density around them; serving many big destinations alone is not a recipe for success
▪ “The data shows that successful shuttles are built on strong local trip-making first, with regional connections playing a support role in overall success.” Therefore, first-mile routes needs to be convenient.
Implementation Challenges and Opportunities
An overarching goal of this peer review is to provide UTA, UDOT, and local governments with an understanding of other agencies’ first/last mile implementation process so that they can adapt their efforts to best address challenges and leverage opportunities. Agencies were asked about implementation lead time, challenges encountered and beneficial partnerships.
Challenges
One of the biggest challenges to addressing first/last mile gaps is finding willing and able partners and funders. Transit agencies often do not control the right-of-way leading up to their stations and therefore must partner with cities to plan and implement access improvements.
8 For context, they currently observe about 1% of access trips on bike and 30% on foot. Between 2007 and 2012, the bike mode share increased from 0.7% to 1%, representing approximately 1,500 to 2,500 individual bike trips per day.
9 http://www.rtd-denver.com/PDF_Files/ServiceD/PerfReport_Shuttle_Circulator_Report_2008.pdf
One of the biggest challenges to addressing first mile/ last mile gaps is finding willing and able partners.

Utah Transit Authority3-26
FIRST/LAST MILE STRATEGIES STUDY
WMATA has been challenged in managing high demand from private shuttles to access kiss-and-ride facilities at its rail stations. Existing private shuttles serve people accessing large employers, federal facilities, and residential developments—areas of high density that have prioritized first/last mile strategies. The private shuttles operate on their own, without a contract with WMATA. However, WMATA actively studies the effects of those shuttles on ridership and tries to determine how to prioritize the many demands for access to station drop-off and pickup sites.
Though often not an explicit first/last mile strategy, the restructuring of existing bus routes to provide improved transit connections can be a significant implementation challenge. Restructuring service requires garnering the sup-port of the public and elected officials. RTD reports that this has been, by far, their biggest challenge to addressing first/last mile gaps along their focus corridors. In some cases, they have had to reinstate longer-distance express service (instead of a local connecting service) due to customer protests. To prepare for making route restructuring proposals to the public, RTD emphasizes the need to demonstrate how logical analysis led to the proposal, to acknowledge how the public’s suggested options had been incorporated into the plan, and that flexibility in the plan will be maintained throughout the implementation process.
Agencies also must cope with the reality that some new solutions will fail. Capital Metro provided an example of one such situation. They had implemented several “connector routes”—peak period bus service emanating from its rail stations. There are three connector services currently in operation, however Capital Metro’s three Downtown Connectors , operating in a very walkable environment, generated low ridership and had to be eliminated. However, the agency was able to turn this challenge into an opportunity. Capital Metro worked with Car2Go (a car sharing company) and the City of Austin to convert the no-longer used rail connector bus zone into Car2Go-designated parking spaces (see Figure 3-7).
The outcome of Capital Metro’s Downtown Connectors reinforces the point made by RTD that first/last mile strat-egies are most needed outside of urban environments where walking, biking, taxis, and bus options already address much of the first/last mile gap. As TriMet has observed through partnerships with Intel and Nike (large employers in Beaverton, Oregon), suburban first/last mile strategies can also emphasize non-motorized transportation. Both campuses are piloting corporate bike share programs to link employ-ees to nearby MAX light rail stations.
Lastly, many agencies are interested in fare payment media that is itself multimodal—one card or smartphone app that is accepted as payment on transit, car share, bike share, parking, or other mobility options. The main challenge with these programs is the high level of coordination and lead time required to implement; a long lead time can render chosen technologies obsolete or outdated by the time of implementation. Examples of this challenge are highlighted below:
▪ Capital Metro looked for a solution that would allow parking pay stations to dispense both parking proof-of-payment and transit tickets. With the technology available at the time (magnetic strip fare cards), they found it was not possible.
▪ In Chicago, the “Chicago Card Plus” could be linked to local car share provider i-Go, but the agency’s recent transition to the Ventra card rendered that link obsolete. This option was curtailed partly due to the small percentage of customers who chose to link their transit and car share accounts. CTA has scheduled the launch of a smartphone app in January 2015 that will allow customers to pay for rides on its system as well as on vehicles in the Metra and PACE networks. Capital Metro has a similar app already in place.
▪ WMATA has begun an 18-month pilot of its New Electronics Payment Program, which will allow passengers to pay using a smart card, government I.D. cards, contactless credit cards, and smartphones. One of the program’s primary objectives is to maintain seamless regional transfers between existing transit services. WMATA has partnered with more than a dozen agencies to implement this program. The pilot will encom-
Downtown MetroRail station, 501 E. 4th Street, Austin, TX Image from Google Streetview
Figure 3-7 Downtown MetroRail Station Adjacent Car2Go Parking Spaces

3-27FINAL REPORT
STATE OF THE PRACTICE
pass Metro rail, bus, and parking, though the agency is in conversation with regional bike share and car share companies about integrating with their systems as well. It is several years from implementation.
Opportunities
Partnerships present a great opportunity to help fund strategies: in many cases, agencies have co-funded improve-ments with their public and private partnerships. For example, CTA in Chicago has worked closely with private partners such as UPS, Avon Products, and the Museum of Science and Industry to implement bus service that meets the needs of their employees and visitors.10 In the case of UPS, bus service is timed to match employee shift changes. In exchange for this service, these private partners fund the operations expenses through contracted agreements with CTA.
In addition to public/private partnerships, transit agencies have also partnered with non-profit organizations and city departments. CTA partnered with Transit Alliance, a local advocacy organization, to enhance their outreach efforts when they began allowing bicycles on board their rail vehicles. TriMet partnered with the City of Portland to implement four rectangular rapid flash beacons near its stations and stops; but, while TriMet has completed a comprehensive pedestrian network analysis around its stations, staff are still working to find funding for projects around the region that were identified through that study.
Lastly, an opportunity highlighted by Capital Metro involves another connector—the Kramer/Domain route. The Kramer/Domain Connector links the Kramer MetroRail station to The Domain (a large mixed-use development), a University of Texas (UT) satellite campus, Austin Community College, and a few large tech employers in the area. Capital Metro had been in discussions with the Domain developers for several years, some of which were support-ive of rail but had reservations about bus transit operating on its streets. Knowing they were aiming to implement BRT with stops in the area, Capital Metro treated negotiations for the Kramer/Domain connector route as a “foot in the door” for an eventually larger discussion of BRT. Today, Capital Metro’s second BRT line connects downtown Austin, through the UT satellite campus, and ends on one of The Domain’s internal streets. Planning staff at Capital Metro partially credit the success of the connector negotiations (that also runs on internal streets) for the ability to implement BRT in the area.
Summary of Peer Review
Partnerships are both a challenge and an opportunity. As emphasized by nearly all peers, partnerships are key to the ability of agencies to implement FMLM strategies and to the eventual success of services. Partnerships can be difficult to forge, but when solidified, can help agencies improve access and fund operations.
Rethink existing services. First/last mile strategies are not just about adding new services, but about rethinking the effectiveness of existing ones. However, one of the biggest challenges found in Denver is the reaction and push back from existing riders to proposed restructured services.
Importance of non-motorized connections. “Bike and walk is of course huge for last mile,” says Jeff Owen of TriMet. These strategies are cost-effective and apply particularly well for connecting transit riders to destinations within ½ to 3 miles of stations. With increased bicycle access mode share, so too has the demand for bringing bicycles on board. Therefore, solutions to encourage people to leave their bicycles behind—such as bike share and more secure parking options—become the next priority. UTA could preempt this tension by focusing resources on these strategies—bike stations, bike share at rail stations, lockers, and racks within paid areas—from the beginning.
Start with peak service; expand as needed. When implementing new connector routes or shuttles, in most cases it is best to start with peak period service only. Productivity can be monitored and increased to mid-day, evening, or weekend service as necessary.
Messaging and framing. Communications about first/last mile strategies are important both to city partners and to the general public. When communicating about potential strategies to staff within the agency, biking and
10 CTA Routes 10 (Museum of Science & Industry), 169 (UPS Express), and X98 (Avon Express)

Utah Transit Authority3-28
FIRST/LAST MILE STRATEGIES STUDY
walking should be positioned as complements to transit—they support increased ridership and other agency goals.
Public input – early and often. To be successful, agencies must “develop a solid plan and offer it for review and comment to one and all” (RTD). Stakeholders and partners need to be engaged early and often—especially when rethinking existing services. People do not want to give up a one-seat ride on an express service, but that service may not be cost-effective for the agency. As with all planning projects, involvement with the community is imperative.
Plans need funding strategies. One example: TriMet’s comprehensive pedestrian planning effort thoroughly studied pedestrian access to stations and developed specific projects to improve access. However, they are still working to find funding for the projects they identified around the region. Partnerships can be a critical part of bridging that funding gap.
First/last mile strategies should be part of business-as-usual. Many agencies do not think about “first- and last-mile” explicitly. In the case of larger agencies with highly networked services, these types of connections are planned through regular service planning processes. Agencies that serve more suburban-type stations appear to be more likely to address first/last mile gaps explicitly.
“Keep at it. Remember connectivity. Cater to the ‘interested-but-concerned,’ who would like to walk or bike but are uncomfortable doing so.”
~Kristin Haldeman, WMATA

4-1FINAL REPORT
4 ANALYSIS The UTA Board of Trustees has established a goal of doubling UTA’s system ridership between 2014 and 2020. Establishing effective first/last mile connections to the transit network is one way to add ridership, through increased network accessibility and a broader range of solutions. A major component of this study is to identify which first/last mile strategies have the greatest possibility for adding ridership, and prioritize implementation of strategies. In order to conduct this analysis, TRAX and FrontRunner stations were grouped into station typologies to more efficiently evaluate ridership potential and recommend solutions. The approach for identifying and analyz-ing is described in this section.
EVALUATION PROCESSThe process for evaluating strategies was:
▪ Develop a set of typologies that represent the range of TRAX and FrontRunner stations within UTA’s service area;
▪ Determine which stations fit in which typologies;
▪ Analyze the effectiveness of various first/last mile strategies in adding transit riders, within the framework of the typologies;
▪ Consider which stations might change significantly in the future based on known plans and models;
▪ Evaluate strategies based on other, non-ridership factors (such as safety, ease of implementation, and suc-cessful application by other transit districts); and
▪ Prioritize strategies in cooperation with the stakeholder group.
This process is described in more detail in the following sections.

Utah Transit Authority4-2
FIRST/LAST MILE STRATEGIES STUDY
TYPOLOGIESSeveral built-environment and ridership-based characteristics were used to identify station typologies. These include connectivity around station areas, the modes of transportation currently used by transit riders to get to and from the stations, the amount of parking available, and demographic information. These parameters were then applied to the characteristics:
▪ Walk access, or the percent of land within a one-mile radius of a station that could be accessed by walking a distance of one mile on the street or pathway network around the station, where:
▪ High = over 50% walk access
▪ Medium = 30 -50% walk access
▪ Low = less than 30% walk access;
▪ Active transportation mode split, or the percent of people accessing each station by walking or biking, where:
▪ High = over 75% of riders accessing the station by walking or biking
▪ Medium = 40-75% of riders accessing the station by walking or biking
▪ Low = less than 40% of riders accessing the station by walking or biking
▪ Non-auto access mode split, or the percent of people accessing each station by walking, biking or taking transit (in other words, any transportation mode other than driving), where:
▪ High = over 75% of riders accessing the station by walking, biking or transit
▪ Medium = 40-75% of riders accessing the station by walking, biking or transit
▪ Low = less than 40% of riders accessing the station by walking, biking or transit;
▪ Availability of parking supply, where:
▪ High = over 200 spaces at station
▪ Low = 1 -200 spaces at station
▪ None = no spaces at station
Population and employment counts around station areas were also considered in defining typologies, as was the balance of employment to population (especially in suburban areas). Using these factors, TRAX and FrontRunner stations were organized into one of six station typologies. These are shown in the table on the following page.

4-3FINAL REPORT
ANALYSIS
Figure 4-1 Station Typologies and Characteristics
TYPOLOGY CHARACTERISTICS STATIONSURBAN Walk Access: High
Active Mode Split: High Non-Auto Mode Split: High Parking Spaces: None Population: High Employment: High
Planetarium Arena Temple Square City Center Gallivan Plaza Courthouse
900 South Library Trolley 900 East
MULTIMODAL Walk Access: Medium-High Active Mode Split: Medium-High Non-Auto Mode Split: High Parking Spaces: Low Population: Medium Employment: Medium
1940 W North Temple Power Fairpark Jackson/Euclid North Temple Bridge/Guadalupe North Temple Redwood Junction
West Valley Central Salt Lake Central Old Greektown Ball Park Central Pointe Millcreek Sandy Expo
INSTITUTIONAL This typology is determined by the location, which is a single land use/user. University and the Airport sta-tions were included in this typology.
Orem Stadium University South Campus Fort Douglas University Medical Center
SUBURBAN Walk Access: Low-High Active Mode Split: Low-Medium Non-Auto Mode Split: Low-High Parking Spaces: Low-High Employment < Population (within suburban typology)
Midvale Fort Union Midvale Center Historic Sandy Crescent View Kimballs Lane Draper Town Center
Bingham Junction Historic Gardner West Jordan City Center Jordan Valley 4800 W Old Bingham Hwy Provo
SUBURBAN NON-RESIDENTIAL
Walk Access: Low-High Active Mode Split: Low-High Non-Auto Mode Split: Medium-High Parking Spaces: Low-High Employment > Population (within suburban typology)
Ogden Lehi Meadowbrook Murray North Murray Central Fashion Place West
Sandy Civic Center River Trail Decker Lake Draper
AUTO-DEPENDENT Walk Access: Low-Medium Active Mode Split: Low |Non-Auto Mode Split: Low Parking Spaces: High (>200)
Pleasant View Roy Clearfield Layton Farmington Woods Cross South Jordan American Fork
2700 W Sugar Factory Road 5600 W Old Bingham Hwy South Jordan Parkway Daybreak Parkway

Utah Transit Authority4-4
FIRST/LAST MILE STRATEGIES STUDY
The figures below show how the different typologies are distributed throughout UTA’s service area. It is interest-ing to note that stations with shared typologies tended to cluster along shared TRAX or FrontRunner lines, even though geographic location was not one of the parameters used to define typologies.
Figure 4-2 TRAX Station Typologies

4-5FINAL REPORT
ANALYSIS
Figure 4-3 FrontRunner Station Typologies

Utah Transit Authority4-6
FIRST/LAST MILE STRATEGIES STUDY
RIDERSHIP REGRESSION ANALYSISThe critical question of this First/Last Mile Strategies Study is: which strategies have the greatest potential to add ridership to the system? In order to answer this question, the team conducted a regression analysis to examine the impacts of first/last mile strategies and several socio-economic variables on ridership and active transportation mode split at TRAX and FrontRunner stations. This section provides information on:
▪ The methodology applied to the regression analysis;
▪ Results of the regression analysis; and
▪ Implications for future station area improvements.
The Regression Analysis Technical Memorandum can be found in Appendix F.
Methodology
Multi-regression analyses examine the correlation between a dependent variable and a series of independent vari-ables. For the ridership regression analysis, total ridership at each station was considered the dependent variable whereas factors such as population, employment, and the presence of first/last mile strategies were independent variables. The results show how significant the impact of the independent variables is on the dependent variable, and whether strategies such as first/last mile solutions have a positive or negative effect on ridership and active transportation mode split. Variables that are significantly positively correlated with ridership include automobile ownership, employment, and wayfinding signage to nearby destinations. Such factors as the availability of signed bike routes near stations and the percentage of workers earning $1250 per month or less were found significantly positively correlated with active transportation modes.
Two regression analyses were conducted to examine the correlation between certain independent variables and dependent variables associated with TRAX and FrontRunner stations, respectively. In each analysis, three multi-regression tests were conducted to examine the impact of a series of socio-economic and physical variables on ridership, total mode split for active transportation, access mode split for active transportation, as well as egress mode split for active transportation.
Summary of Results
The regression analysis showed modest potential gains in ridership, which are outlined below.
▪ Resources should be focused on stations located near major employment centers as these stations tend to have higher ridership. Furthermore, a higher percentage of transit riders walk, bike, or use other forms of active transportation modes to and from stations with high employment. These findings also suggest that UTA should collaborate with local jurisdictions and site developers to encourage more construction of employment centers near its transit stations.
▪ Stations with signed bike routes/lanes generally saw higher ridership and the percentage of transit users using active transportation. This factor suggests that signed bike routes/lanes installed near station areas could attract more transit riders and encourage people to use active transportation modes to access and leave the station.
▪ The presence of continuous sidewalks near the transit station has positive correlation with ridership and total, access, and egress mode splits for active transportation, although the correlation is not sig-nificant. This factor suggests that constructing continuous sidewalks near the transit stations could poten-tially attract more riders and encourage them to commute to and from the station via active transportation modes. Similarly, whether the transit station is conveniently accessible to pedestrians and cyclists is posi-tively but not significantly correlated with total, access, and egress mode splits for active transportation. This result suggests that making stations more accessible to cyclists and pedestrians could potentially encourage more people to use active transportation.

4-7FINAL REPORT
ANALYSIS
▪ The availability of wayfinding signage to nearby destinations for transit users is significantly positively cor-related with ridership and total mode split for active transportation. This result suggests that installing wayfinding features near station areas could potentially increase ridership and the percentage of riders using active transportation modes.
▪ The presence of a GREENbike station near a transit station is significantly negatively correlated with rider-ship or the total, access, and egress mode splits for active transportation. This situation could be the result of the fact that many TRAX stations with high ridership and mode split for active transportation currently do not have GREENbike stations. In fact, GREENbike stations are only available at eight of the fifty TRAX sta-tions examined in this study. This result thus should not discourage the deployment of GREENbike stations near transit stations. Furthermore, the availability of car share stations near the transit station is not signifi-cantly correlated with the dependent variables. However, it is positively correlated with the total, access, and egress mode splits for active transportation modes.
▪ Although some of the positive correlations between the dependent and certain independent variables might not be significant, improvement or installment of these features may still have positive impact to ridership and mode split for active transportation.
▪ This information was integrated with other decision-making criteria, outlined in this section, and used to prioritize strategies for implementation at each UTA station typology.
FUTURE STATIONSWhile the regression analysis and other elements of this study were focused on current station conditions, it is important to acknowledge that station characteristics will change in the future, especially at stations in the less-developed areas of the Wasatch Front. Network connectivity around these locations will likely improve, population and employment density will increase, and opportunities will arise to integrate first/last mile solutions into transit oriented development plans. Stations in the “Auto Dependent” or “Suburban” typologies are the most prone to change, and could switch from their initial typology to another typology as development around these stations becomes more pronounced. As stations shift on the spectrum of typologies, the recommended first/last mile strategies change as well. For this reason, it is important to consider which locations become “stations to watch”.
In order to predict which stations were most likely to change considerably, the project team evaluated a number of questions:
▪ Where might new rail transit routes be located, according to regional transportation plans or UTA’s Network Study? Are any station areas identified already on these proposed routes?
▪ Which existing stations show a high level of population or employment growth between now and 2040 in the regional travel demand model?
▪ Which stations are being actively studied as part of a station area planning process or transit oriented devel-opment project? Which stations might not be actively studied now but might be next on the list for transit oriented development?
These questions informed the project team in considering which stations might change typologies in the future, and require advance coordination of first/last mile strategies in anticipation of that change. Recommendations for “stations to watch” are provided in Section 6.

Utah Transit Authority4-8
FIRST/LAST MILE STRATEGIES STUDY
STRATEGY PRIORITIZATION PROCESSCriteria Framework
The regression analysis to establish ridership potential was only one of several criteria used to prioritize a short list of first/last mile strategies for UTA implementation. The criteria and parameters were initially applied to all strate-gies in the First/Last Mile Strategies Toolbox in Section 3. These criteria are outlined below, along with the scoring parameters for scoring individual strategies (the higher the score, the more effective the strategy).
▪ Effective in Adding Ridership: How effective is each strategy in potentially adding riders to the transit sys-tem?
▪ 3 = Positive and significant correlation between strategy and ridership
▪ 2 = Positive but not significant correlation between strategy and ridership
▪ 1 = No effect or effect is undefined
▪ 0 = Not enough data is available to assess the effect of this strategy on ridership
▪ Improve Safety: Does this strategy improve safety for people accessing the transit system?
▪ 3 = Strategy provides separation or physical protection for travelers
▪ 2 = Strategy improves traveler visibility or driver awareness
▪ 1 = Strategy improves convenience but not necessarily safety
▪ Used by Peers: Has this strategy been used effectively by the peer agencies interviewed by this study?
▪ 1 = Yes
▪ 0 = No
▪ Costliness: What is the relative cost of implementation for each strategy? The lower the cost, the higher the score.
▪ 3 = Less than $10,000
▪ 2 = Between $10,000 - $100,000
▪ 1 = Greater than $100,000
The project team developed rankings for each of the Toolbox strategies based on these criteria. The First/Last Mile Strategies Study Stakeholder Group was then engaged to complete the prioritization process.

4-9FINAL REPORT
ANALYSIS
Strategies Prioritization and Refinement Process
As described in Section 2, two meetings with a diverse group of stakeholders were conducted to identify the final list of recommended strategies. Stakeholders included representatives from UTA, UDOT, WFRC, MAG, the University of Utah, SLC GREENbike, Bike Utah, the Utah Department of Health, Davis County Health Department, Enterprise Carshare, and the UTA Board of Trustees. The first meeting, held in September 2014, introduced the toolbox of strategies and identified the relevant aspects of each strategy. The second meeting, held in November 2014, communicated experiences from peer agencies and prioritized strategies. The stakeholder group reviewed the pre-scored criteria completed by the project team (including ridership, safety, peer use, and cost factors) and participated in a group discussion to rank strategies using the criteria below.
▪ Stakeholder Support: How much does this stakeholder group support each strategy?
▪ 3 = High level of support
▪ 2 = Medium level of support
▪ 1 = Little to no support
▪ Ease of Implementation: How complicated is each strategy to implement? Key questions include: Is the strategy physically complicated?; Does the strategy require coordination among multiple partners?; Does the strategy require new administrative or oversight entities?; Does the strategy require ongoing O&M costs?
▪ 3 = Yes to 1 or fewer questions
▪ 2 = Yes to 2 questions
▪ 1 = Yes to 3 or more questions
Strategies were then ranked based on a cumulative score from the six criteria. The final rankings of the prioritized strategies are shown in the table below. Minutes from the stakeholder group meetings are provided in Appendix A.
Figure 4-4 Strategy Prioritization
Candidate Projects
Effective in adding ridership
Improves Safety
Used by peers Costliness
Stakeholder Support
Ease of Implemen-
tation ScoreOverall Ranking
Crosswalk Improvements 2 2 1 3 3 3 14 1
HAWK Beacons/Ped Signals 3 3 1 2 3 2 14 1
Bike Lanes 3 2 1 3 3 2 14 1
On-site Wayfinding/Signage 3 1 1 3 3 3 14 1
Protected Bike Lanes 3 3 1 2 3 1 13 5
Wayfinding to Station 2 1 1 3 3 3 13 5
Sidewalks 2 3 1 1 3 2 12 7
Access Connections 2 3 1 2 3 1 12 7
ADA Access Improvements 1 2 1 3 2 3 12 7
Ped Signage Improvements 2 2 1 3 1 3 12 7
Bike Sharing 2 2 1 1 3 3 12 7
Bus Stop Enhancements 1 2 1 2 3 2 11 12
Car Sharing 2 1 1 2 2 3 11 12
Bike Paths 3 3 1 2 1 1 11 12
Bike Racks 2 1 1 3 1 3 11 12
As indicated in the table, the final list of strategies includes a range of solutions and types, as outlined below:
▪ Wayfinding and information improvements, such as on-site wayfinding and signage (sign display cases, sta-tion orientation maps, or real-time/electronic monitors); wayfinding to stations (directional signs, Braille

Utah Transit Authority4-10
FIRST/LAST MILE STRATEGIES STUDY
signage, cases for maps and schedules at bus stops, or informational apps) or pedestrian/bicycle specific signage leading to and from stations;
▪ Bike network improvements, such as bike lanes, cycle tracks, bike paths, routes, or other facilities;
▪ Access connections, such as gates or pathways allowing access from nearby neighborhoods to TRAX and FrontRunner stations;
▪ Pedestrian network improvements, such as sidewalks and pathways;
▪ Crossing treatments, including high-visibility crosswalks, pedestrian signals, or ADA accessibility features (audible pedestrian signals, curb ramps, detectable warnings, accessible push buttons, etc), as well as street lighting at crosswalks and underpasses;
▪ Bike sharing programs;
▪ Car sharing; and
▪ Station/stop enhancements, including installation of bus shelters, cases for maps and schedules, trash re-ceptacles, pedestrian-scale lighting, digital message signs, and bike racks or lockers.
These strategies were advanced to the next level of analysis including cost estimation and recommendations by typology.

5-1FINAL REPORT
RECOMMENDATIONS
5 RecommendationsSTRATEGIES BY TYPOLOGY This chapter identifies recommended first/last mile strategies for prioritization in each station typology. Recom-mendations for prioritization were based on the results of the regression analysis, which identified the strategies which had the highest likelihood of adding more ridership to UTA’s transit system. Recommendations also considered the typical characteristics of each typology and the degree to which those characteristics required improvements. For instance, stations within the urban typology are primarily located within the downtown urban area, where street connectivity is significantly better than elsewhere in the regions and all streets have sidewalks on both sides. Therefore, access connections and pedestrian network improvements are not considered “high priority” for implementation because those conditions are already generally good.
Readers should note that although only certain strategies are listed as high priority, this does not mean other strategies are not also important; it only means that agency staff should prioritize items that provide the best “bang for the buck.” First/last mile and active transportation improvements frequently receive very limited funding, and it is the intent of this report to help UTA focus on the items representing the highest possible benefit. The logic behind prioritization recommendations is provided in each of the tables on the following pages.

Utah Transit Authority5-2
FIRST/LAST MILE STRATEGIES STUDY
Figure 5-1 Recommended Strategies for Urban Typology
STRATEGIES HIGH-PRIORITY? COMMENTS
Wayfinding and Information Y
According to the Transit Station Area Audit Survey, most of the stations in this group have sufficient wayfinding information to the transit facility for transit users. However, there is a lack of wayfinding signage to nearby destinations avail-able for transit users. It is recommended that the wayfinding and information for this typology provide information at the station to destinations and transporta-tion options.
Bicycle Network Improvements Y
Most stations whose bike lane density equals or exceeds the average bike lane density in this typology group saw higher than average ridership. Stations with sufficient and convenient bike parking facilities also saw higher ridership than those without.
Access Connections N
All stations are easily accessible to pedestrians and bicyclists according to the Transit Station Area Audit Survey. The high accessibility for pedestrians and bicyclists is also reflected by the high (85%) active transportation mode share to and from the stations.
Pedestrian Network Improvements N Most of the stations in this typology have continuous and ADA-compliant side-
walks on both sides of the street with sufficient width.
Crossing Treatments N All stations in this typology have signalized crosswalks.
Bike Sharing Y
Currently most of the stations in the downtown area have bike share except for Court House. Court House is a major transfer station with high ridership. In ad-dition, it is flanked by hotels, civic buildings, as well as tourist attractions. A bike share station should be added at this station to capitalize on the high volume of potential customers generated by the above-mentioned conditions.
Car Sharing Y Car share stations should be available near stations where there is a large number of hotels or apartment buildings, such as Court House and Trolley.
Rail/Bus Stop Enhancements N Most of the stations have standard TRAX station amenities and sheltered bus
stops nearby.
Most stations in this typology group had above or equal group average level of amenities, pedestrian and bicyclist infra-structure, as well as bus transit facilities and connections. In other words, most stations in this group are well-equipped and call for few improvements. Statistics shows that stations within this typology tend to have higher ridership especially when there are sufficient pedestrian infrastructure and connections.

5-3FINAL REPORT
RECOMMENDATIONS
Figure 5-2 Recommended Strategies for Multimodal Typology
STRATEGIES HIGH-PRIORITY? COMMENTS
Wayfinding and Information Y
Wayfinding signage and information is important at these major transfer sta-tions, although stations with wayfinding signage saw lower ridership than those without. Currently some of the stations do not have well-maintained wayfinding signage to the transit facility for pedestrians and bicyclists according to the Tran-sit Station Area Audit Survey. Most of the stations also do not have wayfinding signage to nearby destinations available for transit users.
Bicycle Network Improvements Y
Stations with low bike-lane densities are not located in residential- or business-concentrated areas. Thus, adding bike lanes may not be the most effective way to increase ridership in areas where biking is not popular. However, stations with sufficient and convenient bike parking facilities saw higher ridership than those without.
Access Connections Y Most of the stations with low ridership do not have defined pathways from the adjacent roadways to the transit facilities.
Pedestrian Network Improvements Y
Stations with this strategy saw lower ridership than those without. However, some stations, including Salt Lake Central, do not have sidewalks on both sides of the streets which could have contributed to the poor access conditions at some of the stations.
Crossing Treatments Y Some stations, such as Millcreek, do not have marked crossings on streets adjacent to the station.
Bike Sharing N
Salt Lake Central is already in the bike share network, while most other multi-modal stations are outside the existing bike share network. Therefore adding bike share stations to other multimodal transit stations may not be effective in attracting new riders unless the overall network is expanded as well.
Car Sharing N Currently Carshare is only available at Salt Lake Central. This station only saw slightly higher than average ridership within this typology.
Rail/Bus Stop Enhancements Y
The transit mode share for this typology group is the second highest among all examined. However, not all bus stops are conveniently located near destinations or have safe pedestrian crossings according to the Transit Station Area Audit Survey.
Stations with better bus connections and facilities, station amenities, and bike infrastructure and connections saw higher ridership. Stations with better pedestrian connections and facilities had lower ridership than those whose pedestrian facility conditions are poorer. This is partially due to the reason that a few stations, including Sandy Expo and Fair Park Stations, had decent pedestrian facilities but relatively low ridership as a result of their location and the surrounding environment. This factor thus should not deter the implementation of pedestrian enhancement measures at some of these stations.

Utah Transit Authority5-4
FIRST/LAST MILE STRATEGIES STUDY
Figure 5-3 Recommended Strategies for Institutional Typology
STRATEGIES HIGH-PRIORITY? COMMENTS
Wayfinding and Information N
Although there is wayfinding signage around the stations at the University, there could be more wayfinding to and from the stations for visitors. However, it may not have significant impact on ridership.
Bicycle Network Improvements Y Orem Central Station could be better connected with the rest of the city via bike
lanes, especially the residential neighborhoods nearby.
Access Connections NNearly all stations are conveniently accessible to pedestrians. There is, however, room for improvement at Orem Central to provide better access to the station from the Utah Valley University located on the other side of I-15.
Pedestrian Network Improvements N Nearly all the stations currently have continuous sidewalks on at least one side of
the street.
Crossing Treatments N All the stations already have signalized crossings with the exception of Orem Central.
Bike Sharing YCurrently, none of the stations have bike share program. The University may consider this as an opportunity to better connect student housing and the TRAX stations to attract students to ride the train.
Car Sharing N All relevant stations within the institutional typology already have car share avail-able nearby.
Rail/Bus Stop Enhancements N
Most of the bus stops near stations in this typology have sufficient amenities. Improvements can be made for the bus stops at the Stadium Station as they currently do not have shelters. This intervention, however, may not significantly increase ridership for TRAX.
Four of the six stations in this category are located on the campus of the University of Utah. These stations are generally well connected and are equipped with well-maintained bike and pedestrian facilities. The Airport, although included in this typology group, has unique circumstances that require different treatments. This leaves Orem as the only station with the greatest potential for improvements.

5-5FINAL REPORT
RECOMMENDATIONS
Figure 5-4 Recommended Strategies for Suburban Non-Residential Typology
STRATEGIES HIGH-PRIORITY? COMMENTS
Wayfinding and Information Y There is a lack of wayfinding signage to nearby destinations and to the transit
facilities for transit users at many of these stations.
Bicycle Network Improvements Y
Stations with lower bike lane densities saw higher ridership than those without. However, adding bike lanes may be conducive to encouraging employees work-ing in the surrounding employment centers to bike to and from the stations. In addition, stations with sufficient and convenient bike parking facilities saw higher ridership than those without.
Access Connections N Stations in this typology group are conveniently accessible to pedestrians and bicyclists according to the Transit Station Area Audit Survey.
Pedestrian Network Improvements N Most of the stations have continuous sidewalks on both sides of the streets im-
mediately adjacent to the station.
Crossing Treatments N Most of the stations have signalized crossings to cross the adjacent streets.
Bike Sharing YCurrently, none of the stations within this typology has bike share program avail-able. Adding bike stations to some of the stations located near major employ-ment centers can potentially increase ridership.
Car Sharing N Stations with car share stations did not see higher ridership in this typology group.
Rail/Bus Stop Enhancements Y
Stations of this typology saw the highest mode share for transit among all six typology groups. Stations with better bus connections and facilities also had above-average ridership in this typology. It is thus crucial to improve the condi-tions at bus stops especially those that are lacking amenities.
Stations with bus connections and facilities saw much higher ridership than those with poorer conditions in this category. Station with amenities such as sufficient wayfinding signage to the transit facility and adequate lighting for pedestrians and bicyclists also experienced higher ridership that those with only the standard station-area amenities.

Utah Transit Authority5-6
FIRST/LAST MILE STRATEGIES STUDY
Figure 5-5 Recommended Strategies for Suburban Typology
STRATEGIES HIGH-PRIORITY? COMMENTS
Wayfinding and Information Y
Currently there is a lack of wayfinding signage to and from many of the stations for pedestrians and bicyclists according to the Transit Station Area Audit Survey although stations with sufficient wayfinding signage saw lower ridership than those without.
Bicycle Network Improvements Y
The average bike-lane density is low around several stations situated near resi-dential neighborhoods, such as Midvale Fort Union and Midvale Center Stations. Bike lanes should be added to these stations to encourage biking as they tend to have higher than average active transportation mode shares and are located near residential neighborhoods. In addition, stations with sufficient bike parking facilities saw higher ridership than those without.
Access Connections N Most of the stations are conveniently accessible to pedestrians and bicyclists.
Pedestrian Network Improvements Y Most of the stations do not have continuous sidewalks on both sides of the street
according to the Transit Station Area Audit Survey.
Crossing Treatments Y
Many of the stations do not have marked crosswalks or not immediate crosswalks to cross the major streets adjacent to the stations. Only one of the stations (Provo) have signalized crossing. Stations with marked crossings saw lower rider-ship than those without.
Bike Sharing N
Currently none of the stations within this typology has a bike share station. Add-ing GREENBike to the stations, with bike stations located at convenient locations within suburban neighborhood, could potentially attract more riders to take transit.
Car Sharing N TRAX stations may not be the most convenient location for car share to attract customers living in suburban residential neighborhoods.
Rail/Bus Stop Enhancements N Most of the rail stations already have standard amenities. Most of the bus stops
nearby are also sheltered.
Stations with better bike and pedestrian connections and facilities saw much higher ridership. This factor calls for better and more convenient bicycle and pedestrian facilities to accommodate the needs of people who walk or bike to and from the stations. Transit mode share within this typology group ranked third among the six typology groups analyzed in this study. This condition suggests that the bus stops should be kept in the state-of-good-repair.

5-7FINAL REPORT
RECOMMENDATIONS
Figure 5-6 Recommended Strategies for Auto-Dependent Typology
STRATEGIES HIGH-PRIORITY? COMMENTS
Wayfinding and Information Y
Although most transit users accessed and left the station via automobile, the lack of sufficient wayfinding signage for pedestrian and bicyclists to the transit facilities as suggested by the Transit Station Area Audit Survey should be addressed to enhance the visibility of the stations.
Bicycle Network Improvements Y
Due to the auto-dependency of these stations as the result of the surrounding land use, it may not be cost effective to drastically increase the mileage of bike lanes around many of the stations in this category. However, bike lanes should be added to encourage biking at stations adjacent to higher density residential developments such as the Daybreak Parkway and South Jordan Parkway stations.
Access Connections Y Some of the stations are not conveniently accessible to pedestrians and bicyclists according to the Transit Station Area Audit Survey.
Pedestrian Network Improvements Y Many of the stations do not have continuous sidewalks on both sides of the streets.
Crossing Treatments Y Most of the stations are located next to parking lots. Many of these parking lots, however, are isolated by major roadways without proper crossing treatments.
Bike Sharing NMost of the stations are not located in bike-accessible locations although bike share stations could be added to stations adjacent to higher density residential develop-ment sites such as Daybreak Parkway.
Car Sharing NStations that had car share service saw higher ridership than those that did not. It should be pointed out that high ridership at these stations might have been the result of the large number of commuters rather than the availability of car share.
Rail/Bus Stop Enhancements N
All of the rail stations have standard amenities. However, most of them were not served by frequent bus services. Some did not have bus service at all. Without regular and frequent bus service, enhancements to the stations may not be effec-tive in attracting new riders.
According to the analysis, stations with better bus transit connections and pedestrian and bicyclist facilities and connec-tions saw higher ridership than those stations with below median scores in this typology. It should be pointed out that due to the location and surrounding land use, stations in this typology group had the lowest average active transportation and transit mode shares but highest in automobile mode share. Due to this factor, implementing measures to improve station area amenities and bike and pedestrian connections may be more effective in enhancing the experience for current riders than attracting new riders.

Utah Transit Authority5-8
FIRST/LAST MILE STRATEGIES STUDY
BUS AND SHUTTLE NETWORK RECOMMENDATIONSUTA conducted a Shuttle Market Demand Analysis (completed by Nelson\Nygaard) in 2013. That report evaluated the effectiveness of current shuttle routes and recommended additional routes for consideration. Since then UTA has begun studying the feasibility of implementing the additional routes. This First/Last Mile Strategies Study recommends the implementing of UTA or employer-based shuttles at stations in the Suburban Non-Residential typology, all of which either have shuttles already in place or under current study. Since the topic has already been addressed in some detail, no further recommendations on shuttles are included in this study. However, readers should note that the Open UTA Survey con-ducted on behalf of this study in late 2014 revealed considerable community concern about the timing and frequency of bus routes connecting to TRAX and FrontRunner stations. While a detailed evaluation and recommendation of changes to the bus network is outside the scope of this study, it recommended that UTA explore ways to address this issue.
RECOMMENDATIONS FOR BUS RAPID TRANSIT AND STREETCARAnalysis for this First/Last Mile Strategies Study has focused primarily on UTA’s FrontRunner and TRAX facilities. However, developing first/last mile solutions for the existing and planned bus rapid transit (BRT) and streetcar lines is just as critical. Data was largely unavailable to sort the BRT and streetcar stations into typologies using the relevant parameters, or to analyze the effectiveness of first/last mile strategies on ridership. However, general recommendations can still be made:
▪ Bicycle and pedestrian network connectivity should be prioritized for both BRT and streetcar networks. It should be noted that high-quality bicycle improvements have been shown in other transit markets to increase not only bicycle mode share, but also pedestrian mode share; a high-quality environment for cyclists often also translates to a high-quality environment for pedestrians.
▪ Crossing treatments should also be prioritized, especially for BRT as streetcar lines are located in urban ar-eas that tend to have a higher share of enhanced crosswalks than other areas; the 3500 South and planned Provo/Orem routes both utilize high-volume arterials with typically low-quality pedestrian environments and opportunities for crossings.
▪ The minimal nature and typically suburban characteristics of the BRT make it a more challenging environ-ment for GREENbike implementation. Bike share programs typically thrive in high-employment, high-pop-ulation environments with high levels of intersection density. Moreover, installation of GREENbike stations requires space for docking stations, unloading and loading procedures, and system maps. Stations along the Sugar House Streetcar line may be better candidates for GREENbike expansion.
▪ Wayfinding from BRT stops to nearby destinations may be useful to riders; wayfinding to stations as well as to nearby destinations from the stations may be useful for users of the streetcar.
▪ Implementing car share programs in Sugar House may be valuable, although on-street space for dedicated spaces may be scarce; opportunities may be more limited along BRT lines.
▪ While streetcar stations are generally equipped with passenger amenities, BRT stops may represent a lim-ited opportunity to improve the passenger environment.
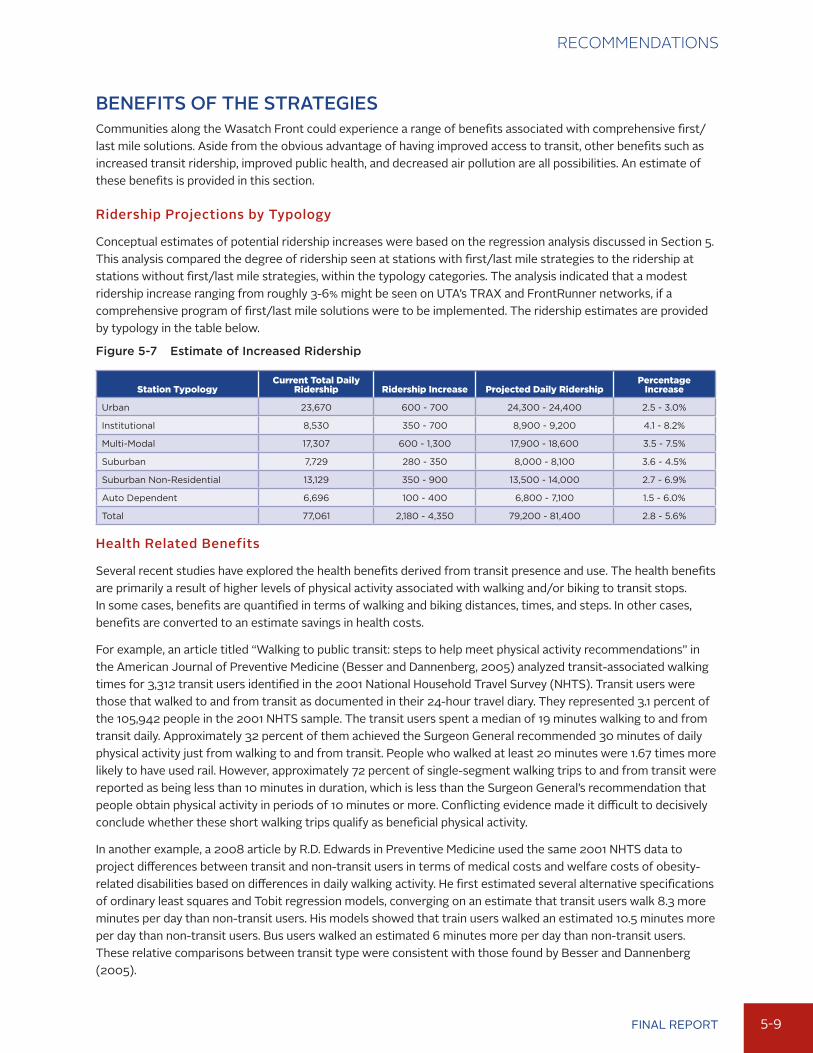
5-9FINAL REPORT
RECOMMENDATIONS
BENEFITS OF THE STRATEGIESCommunities along the Wasatch Front could experience a range of benefits associated with comprehensive first/last mile solutions. Aside from the obvious advantage of having improved access to transit, other benefits such as increased transit ridership, improved public health, and decreased air pollution are all possibilities. An estimate of these benefits is provided in this section.
Ridership Projections by Typology
Conceptual estimates of potential ridership increases were based on the regression analysis discussed in Section 5. This analysis compared the degree of ridership seen at stations with first/last mile strategies to the ridership at stations without first/last mile strategies, within the typology categories. The analysis indicated that a modest ridership increase ranging from roughly 3-6% might be seen on UTA’s TRAX and FrontRunner networks, if a comprehensive program of first/last mile solutions were to be implemented. The ridership estimates are provided by typology in the table below.
Figure 5-7 Estimate of Increased Ridership
Station TypologyCurrent Total Daily
Ridership Ridership Increase Projected Daily RidershipPercentage
Increase
Urban 23,670 600 - 700 24,300 - 24,400 2.5 - 3.0%
Institutional 8,530 350 - 700 8,900 - 9,200 4.1 - 8.2%
Multi-Modal 17,307 600 - 1,300 17,900 - 18,600 3.5 - 7.5%
Suburban 7,729 280 - 350 8,000 - 8,100 3.6 - 4.5%
Suburban Non-Residential 13,129 350 - 900 13,500 - 14,000 2.7 - 6.9%
Auto Dependent 6,696 100 - 400 6,800 - 7,100 1.5 - 6.0%
Total 77,061 2,180 - 4,350 79,200 - 81,400 2.8 - 5.6%
Health Related Benefits
Several recent studies have explored the health benefits derived from transit presence and use. The health benefits are primarily a result of higher levels of physical activity associated with walking and/or biking to transit stops. In some cases, benefits are quantified in terms of walking and biking distances, times, and steps. In other cases, benefits are converted to an estimate savings in health costs.
For example, an article titled “Walking to public transit: steps to help meet physical activity recommendations” in the American Journal of Preventive Medicine (Besser and Dannenberg, 2005) analyzed transit-associated walking times for 3,312 transit users identified in the 2001 National Household Travel Survey (NHTS). Transit users were those that walked to and from transit as documented in their 24-hour travel diary. They represented 3.1 percent of the 105,942 people in the 2001 NHTS sample. The transit users spent a median of 19 minutes walking to and from transit daily. Approximately 32 percent of them achieved the Surgeon General recommended 30 minutes of daily physical activity just from walking to and from transit. People who walked at least 20 minutes were 1.67 times more likely to have used rail. However, approximately 72 percent of single-segment walking trips to and from transit were reported as being less than 10 minutes in duration, which is less than the Surgeon General’s recommendation that people obtain physical activity in periods of 10 minutes or more. Conflicting evidence made it difficult to decisively conclude whether these short walking trips qualify as beneficial physical activity.
In another example, a 2008 article by R.D. Edwards in Preventive Medicine used the same 2001 NHTS data to project differences between transit and non-transit users in terms of medical costs and welfare costs of obesity-related disabilities based on differences in daily walking activity. He first estimated several alternative specifications of ordinary least squares and Tobit regression models, converging on an estimate that transit users walk 8.3 more minutes per day than non-transit users. His models showed that train users walked an estimated 10.5 minutes more per day than non-transit users. Bus users walked an estimated 6 minutes more per day than non-transit users. These relative comparisons between transit type were consistent with those found by Besser and Dannenberg (2005).

Utah Transit Authority5-10
FIRST/LAST MILE STRATEGIES STUDY
The health effects of air quality have been studied primarily from an epidemiological perspective, where research-ers try to estimate the change in health outcomes associated with changes in exposure to pollutants in the atmo-sphere. The studies tend to be based on time-series analyses and cohort studies. In a time-series analysis, research-ers use regression to identify potential relationships between a health outcome and a pollutant concentration (e.g., 2.8 percent increase in mortality for every 10μg increase in PM2.5). In a cohort study, researchers might compare the incidence of a health outcome and average pollutant concentrations between two or more regions to try to find a relationship between them, after accounting for other differences between the groups being compared. The primary goal in these studies is to identify the attributable risk associated with exposure to different pollutant concentrations as the difference in the incidence rate of health outcomes due to the change in pollutant exposure. In most cases, the health impacts are measured in terms of mortality and morbidity incidence, hospitalizations, emergency room visits, and work-loss days, amongst several other measures.
This research, along with additional information, was compiled by the University of Utah Traffic Lab and is provided in Appendix G. Traffic Lab team members also developed a Transit Health Benefit Sketch Planning Tool, which quantifies the estimated benefits of transit on health factors. The tool allows users to estimate these benefits on a station-level basis, using ridership and mode split inputs. A sample of potential benefits associated with implemen-tation of first/last mile strategies at selected UTA stations is provided in the table below. The Sketch Planning Tool and its instruction manual is provided in the Appendix and can be accessed for use through UTA or the Traffic Lab.
Figure 5-8 Estimated Health Related Benefits at Selected UTA Stations
StationEstimated New Daily
RidersAnnual VMT Reduction
Health Care Costs Reduction CO2 Reduction
Salt Lake Central 98 280,000 $360,000 105,000 kg
Kimballs Lane 17 56,000 $77,000 21,000 kg
Meadowbrook 125 390,000 $495,000 150,000 kg
2700 W Sugar Factory Road 24 56,000 $81,000 20,000 kg

6-1FINAL REPORT
NEXT STEPS
6 Next StepsThis section outlines the recommended strategies associated with each station typology. It also identifies steps to take towards implementation, including UTA’s five-year action plan for constructing first/last mile solutions, as well as strategy-specific needs.
RECOMMENDED STRATEGIES BY STATION TYPOLOGYThe following diagram identifies recommended strategies for implementation by typology, along with the stations associated with each typology.
Figure 6-1 Recommended Strategies by Typology
Typology Recommended Strategies Rail Stations
Urban � Wayfinding and Information � Bicycle Network Improvements � Bike Share Stations � Car Share Stations
• Planetarium• Arena• Temple Square• City Center• Gallivan Plaza
• Courthouse• 900 South• Library• Trolley• 900 East
Multi-Modal
� Wayfinding and Information � Bicycle Network Improvements � Access Connections � Pedestrian Network Improvements � Crossing Treatments � Rail/Bus Stop Enhancements
• 1940 W North Temple• Power• Fairpark• Jackson/Euclid• North Temple Bridge/Guadelupe• North Temple• Redwood Junction
• West Valley Central• Salt Lake Central• Old Greektown• Ball Park• Central Pointe• Millcreek• Sandy Expo
Institutional � Bicycle Network Improvements � Bike Share Stations
• Orem• Stadium• University South Campus
• For Douglas• University Medical Center
Suburban Non-Residential
� Wayfinding and Information � Bicycle Network Improvements � Bike Share Stations � Rail/Bus Stop Enhancements
• Ogden• Meadowbrook• Murray North• Murray Central• Fashion Place West
• Sandy Civic Center• River Trail• Decker Lake• Draper• Lehi
Suburban � Wayfinding and Information � Bicycle Network Improvements � Pedestrian Network Improvements � Crossing Treatments
• Midvale Fort Union• Midvale Center• Historic Sandy• Crescent View• Kimballs Lane• Draper Town Center
• Bingham Junction• Historic Gardner• West Jordan City Center• Jordan Valley• 4800 W Old Bingham Hwy• Provo
Auto-Dependent
� Wayfinding and Information � Bicycle Network Improvements � Access Connections � Pedestrian Network Improvements � Crossing Treatments
• Pleasant View• Roy• Clearfield• Layton• Farmington• Woods Cross• South Jordan
• American Fork• 270 W Sugar Factory Road• 5600 W Old Bingham Hwy• South Jordan Parkway• Daybreak Parkway

Utah Transit Authority6-2
FIRST/LAST MILE STRATEGIES STUDY
The prioritized first/last mile strategies for UTA will typically require partnerships with local municipalities and other agencies for successful implementation, and will also require more detailed design and analysis of the recommendations. The steps outlined in the next sections provide a path to begin constructing solutions and coordinating with partners for each strategy type.
UTA ACTION PLAN FOR FIRST/LAST MILE IMPROVEMENTSAs a result of this First/Last Mile Strategies Study, UTA developed a short-term action plan for incremental completion of the recommendations of this study. The action plan focuses on the strategies and station typologies that have the most potential for positive impact on ridership, beginning with the multimodal station typology. The action plan identifies the following timeline, with some items to be completed internally and others with outside assistance:
2015 ▪ Develop a methodology for more detailed data collection (a Station Level Inventory), building on
information gathered during the Station Area Audits – Conduct inventory for a ¼-mile radius around stations for pedestrian strategies – Conduct inventory for a three-mile radius for bike and wayfinding strategies
▪ Schedule Station Level Inventories by typology and station based on those with the highest ridership increase potential, as follows:
– Multi-Modal – Urban – Suburban Non-Residential
– Institutional – Suburban – Auto Dependent
▪ Perform the Station Level Inventories (including identification of responsible jurisdiction) for each recommended station and strategy in the Multi-Modal category
▪ Develop appropriate strategy recommendations by station (i.e., bike lane vs protected bike lane) based on best practices and professional input
▪ Apply planning level costs (provided in Appendix E of this report) to each strategy and station to determine a total implementation cost estimate
▪ Separate costs by agency/jurisdictional responsibility
▪ Perform baseline bicycle and pedestrian station access counts, for the purpose of before-and-after evaluations
2016 – 2020 (items to be completed on an annual basis) ▪ Continue partner proposal collaboration and implementation from the previous year
▪ Continue Station Level Inventories of remaining station typologies, at the rate of one typology per year
▪ Develop specific strategy recommendations by station
▪ Apply planning level cost estimates to each strategy and station
▪ Identify funding and implementation partners for each station
▪ Develop partner proposal packages including any potential UTA funds or other grants
▪ Prepare funding request for upcoming budget year to include: – Bicycle and pedestrian access counts – Capital Development Contributions – Upcoming consultant cost estimates for future work

6-3FINAL REPORT
NEXT STEPS
RECOMMENDED NEXT STEPS BY STRATEGY TYPEThis section identifies specific next steps that should be undertaken for each individual strategy type. Ad-ditional analysis and detailed plans will be needed for each strategy in order to implement these strategies.
Bicycle Network ImprovementsLead Agency: UDOT, local communitiesSupporting Partners: UTA
Bicycle network improvements encompass on-street facilities such as bike lanes, buffered bike lanes, cycle tracks, and bike boulevards, as well as off-street facilities such as pathways. In addition, improvements could include intersection upgrades such as in-pavement loop detectors for cyclists at intersections, cyclist-specific signal heads, bicycle boxes, two-stage left turns, and other concepts. However, UTA very rarely (if ever) owns the roadway network outside its stations. While UTA can facilitate discussions of bicycle network improvements and assist in finding construction funding and other resources, these network improvements will need to be led by local municipalities or UDOT, depending on which agency owns the roadways surrounding each individual station. While it is beyond the scope of the First/Last Mile Strategies Study to identify specific recommendations for bike improvements at each TRAX and FrontRunner station, some conceptual plans have been developed for the Top 25 UCATS projects identified in that study. These recommendations are provided in Appendix C and could provide a good starting point for coordination between UTA and other agencies to improve bicycle access to transit.
Wayfinding and Information ImprovementsLead Agency: UTASupporting Partners: UDOT, local communities
Coordinate internally within UTA to finalize the signage/branding plan, and begin development of a wayfinding plan. A successful wayfinding system provides integrated, consistent, and user-friendly information to confirm that chosen routes are efficient, safe, and ultimately lead directly to the desired destination. A wayfinding plan should identify several different sign types:
▪ Pedestrian sign types – for use within commercial districts, residential areas, and directing riders to the transit station;
▪ Bicycle sign types – for use on shared-use pathways, on-street bike lanes, and bike boulevards or other shared routes; and
▪ Map kiosks for use at transit stations.
Signs should include basic elements such as:
▪ City of jurisdiction and city logo
▪ Wayfinding elements such as maps, major destinations, distance to destinations, and common symbol typology
▪ Reflective facing, to be visible at night.
In addition to establishing a consistent design for wayfinding, UTA should review the status of current wayfinding elements around TRAX and FrontRunner stations to determine how much additional signage would be necessary and helpful. Primary responsibility for developing a consistent wayfinding and signage plan rests with UTA, and will require coordination with local jurisdictions and UDOT to place directional signs appropriately within public rights-of-way.

Utah Transit Authority6-4
FIRST/LAST MILE STRATEGIES STUDY
Crossing TreatmentsLead Agency: UDOT, local communitiesSupporting Partners: UTA
Decisions on crossing treatment installations and upgrades will typically be made by the owner of the roadway, whether that is a local community or UDOT. This may be as simple as striping a new crosswalk, or as complicated as evaluating the traffic impacts of installing a pedestrian signal and coordinating it with adjacent intersections. Traffic engineering standards such as the Manual of Uniform Traffic Control Devices may also apply, depending on the treatment selected. UTA may initiate conversations with roadway owners on the need for crossings and participate in funding improvements, but construction and maintenance of improvements will generally not be led by UTA. The UCATS recommendations in Appendix C include several crossing treatments that could represent a starting point for improvements.
Pedestrian Network ImprovementsLead Agency: UDOT, local communitiesSupporting Partners: UTA
Pedestrian network improvements include sidewalks and pathways connecting transit riders to a station. Similar to bicycle network improve-ments, this are typically undertaken on property not owned by UTA but by local communities or UDOT. UTA could facilitate discussion of desired improvements and assist in funding these improvements, but ultimately the local communities or UDOT will need to own and maintain these facilities in most cases. The UCATS recommendations in Appendix C provide a starting point for several high-priority pedestrian improvement needs.
Access ConnectionsLead Agency: UTASupporting Partners: Local communities
Most TRAX and FrontRunner stations outside the immediate urban area are contained within perimeter fencing, noise walls, or other features that prevent residents of adjacent neighborhoods from accessing the station without significant out-of-direction travel. The UCATS project identified multiple locations where removal of walls or fencing could improve access to stations; see Appendix C for these recommendations. However, address-ing this issue is more complicated than simply removing barriers. UTA’s next steps to improve access connections include review of any environmental laws that may have required installation of walls or fencing as mitigation, and exploration of actions needed to remove them. Walls or fencing may also have been installed at the request of policy makers in the individual cities, and removing them would require discussion and negotiation with those communities.

6-5FINAL REPORT
NEXT STEPS
Station and Stop EnhancementsLead Agency: UTASupporting Partners: Local communities, UDOT
Installation of station and stop enhancements such as bus shelters, cases for maps and schedules, trash receptacles, pedestrian-scale lighting, digital message signs, and bike racks or lockers may largely be conducted within UTA’s property lines. In some instances, additional right-of-way or coordina-tion may be required – for instance, installation of pedestrian lighting may be necessary inside public rights-of-way outside the station area. In other instances, UTA collaborates with private vendors such as advertising agencies, who pay for installation of shelter facilities in exchange for the placement of advertisements on the structure. UTA may need to conduct a detailed inventory of all current station and stop enhancements to better understand the degree of improvements needed.
Car Sharing ProgramsLead Agency: Enterprise Car ShareSupporting Partners: UTA, local communities
Enterprise will likely continue as a purveyor of car share services along the Wasatch Front. UTA should continue coordination with Enterprise car share to establish reserved parking stalls in UTA lots for car share vehicles, or with local communities to allow on-street parking of car share vehicles.
Bike Sharing ProgramsLead Agency: GREENbike/UTASupporting Partners: Regional transportation agencies, local communities
At this writing, bike sharing is on the cusp of revolution within UTA’s service area. The GREENbike program, initiated in Salt Lake City in 2013, is very popular and visible as a first/last mile solution in the City. Currently the program operates as a 501(c)(3) under the umbrella of the Downtown Alliance in the Salt Lake City Chamber of Commerce. However, there is interest in communities outside Salt Lake City for the program to expand. Extending outside Salt Lake City’s geographic boundaries, however, may require transitioning the bike share program to a different governing authority. UTA and other regional transporta-tion agencies have hosted multiple discussions on the topic in recent months, and should continue to explore options for expanding GREEN-bike as a regional program and a first/last mile solution in selected locations.

Utah Transit Authority6-6
FIRST/LAST MILE STRATEGIES STUDY
STATIONS TO WATCHNew real estate development projects offer significant opportunities for first/last mile solutions. New roadways may be built around stations which could be designed to better accommodate cyclists and pedestrians, new plazas at station developments could create a people-friendly atmosphere, and design regulations may be stipulated to better accommodate transit users. While UTA has over 70 individual TRAX and FrontRunner stations, only a handful are the subject of current transit oriented development discussions. Transit-oriented development specialists at UTA provided information on projects that were at least 2-5 years away from construction, which offer the best opportunities to begin coordinating now on first/last mile improvements. In addition, projections from the WFRC travel demand model suggest that certain station areas may experience a higher degree of population and employ-ment growth than other stations. The team overlaid estimated growth projections from the model over known transit-oriented development plans at station areas and created a tiered list of “stations to watch”, below.
High projected population and employment growth, in addition to known TOD plans:
▪ Ballpark TRAX Station (180 West 1300 South, Salt Lake City)
▪ Salt Lake Central Station (250 South 600 West, Salt Lake City)
High projected population or employment growth, in addition to known TOD plans:
▪ Meadowbrook TRAX Station (3900 South West Temple, South Salt Lake City)
▪ Roy FrontRunner Station (4155 South Sandridge Drive, Roy)
▪ South Jordan FrontRunner Station (10351 South Jordan Gateway, South Jordan)
▪ Clearfield FrontRunner Station (1250 South State Street, Clearfield)
▪ Ogden FrontRunner Station (25 West 23rd Street, Ogden)
Known TOD plans, and low to moderate projected population or employment growth:
▪ Sandy Civic Center TRAX Station (9890 South 200 East, Sandy)
▪ Jordan Valley TRAX Station (8600 South 3200 West, West Jordan)
▪ 1900 West North Temple TRAX Station, Salt Lake City
▪ Provo FrontRunner Station (690 South University Avenue, Provo)
▪ Farmington FrontRunner Station (700 North Park Lane, Farmington)
▪ Murray Central TRAX/FrontRunner Station (200 West Vine Street, Murray)
▪ Orem FrontRunner Station (900 South 1350 West, Orem)
▪ Woods Cross FrontRunner Station (770 South 800 West, Woods Cross)