first results from kamland: evidence for reactor anti-neutrino
TRANSCRIPT

Submitted to PRL, Revised Dec. 9
First Results from KamLAND: Evidence for Reactor Anti-Neutrino Disappearance
K. Eguchi,1 S. Enomoto,1 K. Furuno,1 J. Goldman,1 H. Hanada,1 H. Ikeda,1 K. Ikeda,1 K. Inoue,1 K. Ishihara,1
W. Itoh,1 T. Iwamoto,1 T. Kawaguchi,1 T. Kawashima,1 H. Kinoshita,1 Y. Kishimoto,1 M. Koga,1 Y. Koseki,1
T. Maeda,1 T. Mitsui,1 M. Motoki,1 K. Nakajima,1 M. Nakajima,1 T. Nakajima,1 H. Ogawa,1 K. Owada,1
T. Sakabe,1 I. Shimizu,1 J. Shirai,1 F. Suekane,1 A. Suzuki,1 K. Tada,1 O. Tajima,1 T. Takayama,1
K. Tamae,1 H. Watanabe,1 J. Busenitz,2 Z. Djurcic,2 K. McKinny,2 D-M. Mei,2 A. Piepke,2 E. Yakushev,2
B.E. Berger,3 Y.D. Chan,3 M.P. Decowski,3 D.A. Dwyer,3 S.J. Freedman,3 Y. Fu,3 B.K. Fujikawa,3
K.M. Heeger,3 K.T. Lesko,3 K.-B. Luk,3 H. Murayama,3 D.R. Nygren,3 C.E. Okada,3 A.W.P. Poon,3
H.M. Steiner,3 L.A. Winslow,3 G.A. Horton-Smith,4 R.D. McKeown,4 J. Ritter,4 B. Tipton,4 P. Vogel,4
C.E. Lane,5 T. Miletic,5 P.W. Gorham,6 G. Guillian,6 J.G. Learned,6 J. Maricic,6 S. Matsuno,6 S. Pakvasa,6
S. Dazeley,7 S. Hatakeyama,7 M. Murakami,7 R.C. Svoboda,7 B.D. Dieterle,8 M. DiMauro,8 J. Detwiler,9
G. Gratta,9 K. Ishii,9 N. Tolich,9 Y. Uchida,9 M. Batygov,10 W. Bugg,10 H. Cohn,10 Y. Efremenko,10
Y. Kamyshkov,10 A. Kozlov,10 Y. Nakamura,10 L. De Braeckeleer,11 C.R. Gould,11 H.J. Karwowski,11
D.M. Markoff,11 J.A. Messimore,11 K. Nakamura,11 R.M. Rohm,11 W. Tornow,11 A.R. Young,11 and Y-F. Wang12
(KamLAND Collaboration)1 Research Center for Neutrino Science, Tohoku University, Sendai 980-8578, Japan
2 Department of Physics and Astronomy, University of Alabama, Tuscaloosa, Alabama 35487, USA3 Physics Department, University of California at Berkeley and
Lawrence Berkeley National Laboratory, Berkeley, California 94720, USA4 W. K. Kellogg Radiation Laboratory, California Institute of Technology, Pasadena, California 91125, USA
5 Physics Department, Drexel University, Philadelphia, Pennsylvania 19104, USA6 Department of Physics and Astronomy, University of Hawaii at Manoa, Honolulu, Hawaii 96822, USA
7 Department of Physics and Astronomy, Louisiana State University, Baton Rouge, Louisiana 70803, USA8 Physics Department, University of New Mexico, Albuquerque, New Mexico 87131, USA
9 Physics Department, Stanford University, Stanford, California 94305, USA10 Department of Physics and Astronomy, University of Tennessee, Knoxville, Tennessee 37996, USA
11 Triangle Universities Nuclear Laboratory, Durham, North Carolina 27708, USA and
Physics Departments at Duke University, North Carolina State University,
and the University of North Carolina at Chapel Hill12 Institute of High Energy Physics, Beijing 100039, People’s Republic of China
(Dated: December 9, 2002)
KamLAND has been used to measure the flux of νe’s from distant nuclear reactors. In an exposureof 162 ton·yr (145.1 days) the ratio of the number of observed inverse β-decay events to the expectednumber of events without disappearance is 0.611 ± 0.085(stat) ± 0.041(syst) for νe energies > 3.4MeV. The deficit of events is inconsistent with the expected rate for standard νe propagation atthe 99.95% confidence level. In the context of two-flavor neutrino oscillations with CPT invariance,these results exclude all oscillation solutions but the ‘Large Mixing Angle’ solution to the solarneutrino problem using reactor νe sources.
PACS numbers: 14.60.Pq, 26.65.+t, 28.50.Hw, 91.65.Dt
The primary goal of the Kamioka Liquid scintillatorAnti-Neutrino Detector (KamLAND) experiment [1] isa search for the oscillation of νe’s emitted from distantpower reactors. The long baseline, typically 180 km, en-ables KamLAND to address the oscillation solution of the‘solar neutrino problem’ using reactor anti-neutrinos un-der laboratory conditions. The inverse β-decay reaction,νe + p → e+ + n, is utilized to detect νe’s with energiesabove 1.8 MeV in liquid scintillator (LS) [2]. The de-tection of the e+ and the 2.2 MeV γ-ray from neutroncapture on a proton in delayed coincidence is a powerfultool for reducing background. This letter presents thefirst results from an analysis of 162 ton·yr of the reactorνe data.
KamLAND is located at the site of the earlierKamiokande [3], with an average rock overburden of
2,700 m.w.e. resulting in 0.34 Hz of cosmic-ray muonsin the detector volume. As shown in Fig. 1, the neutrinodetector/target is 1 kton of ultra-pure LS contained ina 13-m-diameter spherical balloon made of 135-µm-thicktransparent nylon/EVOH (Ethylene vinyl alcohol copoly-mer) composite film. The balloon is supported and con-strained by a network of kevlar ropes. The LS is 80%dodecane, 20% pseudocumene (1,2,4-Trimethylbenzene),and 1.52 g/liter of PPO (2,5-Diphenyloxazole) as a fluor.A buffer of dodecane and isoparaffin oils between the bal-loon and an 18-m-diameter spherical stainless-steel con-tainment vessel shields the LS from external radiation.During the filling procedure a water extraction and ni-trogen bubbling method [4], optimized for KamLAND,was used to purify the LS and buffer oil; PPO prepurifi-cation and dust removal were especially important.

2
FIG. 1: Schematic diagram of the KamLAND detector.
The specific gravity of the buffer oil is adjusted to be0.04% lower than that of the LS. An array of 1,879 pho-tomultiplier tubes (PMTs), mounted on the inner sur-face of the containment vessel, completes the inner de-tector (ID) system. This array includes 1,325 speciallydeveloped fast PMTs with 17-inch-diameter photocath-odes and 554 older Kamiokande 20-inch PMTs [5]. Whilethe total photo-cathode coverage is 34%, only the 17-inch PMTs corresponding to 22% coverage are used forthe analysis in this letter. A 3-mm-thick acrylic bar-rier at 16.6-m diameter helps prevent radon emanatingfrom PMT glass from entering the LS. The containmentvessel is surrounded by a 3.2 kton water-Cherenkov de-tector with 225 20-inch PMTs. This outer detector (OD)absorbs γ-rays and neutrons from the surrounding rockand provides a tag for cosmic-ray muons. The primaryID trigger threshold is set at 200 PMT hits, correspond-ing to about 0.7 MeV. This threshold is lowered to 120hits for 1 msec after the primary trigger to observe lowerenergy delayed activity. The OD trigger threshold is setto provide > 99% tagging efficiency.
The inner detector is calibrated with γ-ray sources of68Ge, 65Zn, 60Co, and Am-Be, deployed at various posi-tions along the vertical axis. These sources provide cal-ibration energies in the 0.5 to 7.6 MeV region. Energymeasurements are based on the number of detected pho-toelectrons (p.e.) with corrections for PMT gain vari-ation, solid angle, the density of PMTs, shadowing bysuspension ropes, and light transparencies of the LS andbuffer oil. At the center, about 300 p.e. per MeV areobserved. Fig. 2 (a) shows the fractional deviation ofthe reconstructed energies from the source energies. The68Ge and 60Co sources emit two coincident γ-rays and areplotted at an average energy in Fig. 2 (a). The observed
energy resolution is ∼7.5%/√
E(MeV).
The energy calibration is augmented with studies of40K and 208Tl (which are contaminants in the detec-tor), Bi-Po sequential decays, the spallation products 12B
Eve
nts/
Bin
E/E
∆
balloonradius
fiducial
( R/6.5m )3
0.04
0.02
0
−0.02
−0.04
1 2 3 4 5 6 7 8 90Energy (MeV)
2000
1600
1200
800
400
00 0.2 0.4 0.6 0.8 1 1.2 1.4
(b)
(a)
FIG. 2: (a) The fractional difference of the reconstructed av-erage γ energies and average source energies. The dashed lineshows the systematic error. (b) The R3 vertex distribution of2.2 MeV neutron capture γ’s.
and 12N, and γ’s from thermal neutron captures on pro-tons and 12C. The reconstructed energy varies by lessthan 0.5% within the 10-m-diameter fiducial volume; lo-cal variations near the chimney region are about 1.6%.The energy scale exhibits less than 0.6% variation in timeduring the entire data run. Corrections for quenchingand Cherenkov light production are included, and con-tribute to the systematic error in Fig. 2 (a). The esti-mated systematic error for the energy scale is 1.9% at the2.6 MeV energy threshold which corresponds to a 2.1%uncertainty in the detected neutrino rate. Correlated de-cays from Bi-Po and 8He/9Li yield energies between 0.6MeV and ∼15 MeV and are used to extend the range ofthe energy calibration.
The source positions are reconstructed from the rela-tive times of PMT hits. Energy-dependent radial adjust-ments are used to reproduce the known source positionsto ∼5 cm; the typical position reconstruction resolutionis 25 cm. Vertex reconstruction performance through-out the LS volume is verified by reproducing the uniformdistribution of 2.2 MeV capture γ’s from spallation neu-trons, as shown in Fig. 2 (b).
The data presented in this letter were obtained duringa period from March 4 through October 6, 2002. In to-tal we collected 370 million events in 145.1 days of livetime, corresponding to an average trigger rate of '30Hz. Events with fewer than 10,000 p.e. (∼30 MeV) andno prompt OD veto signal are classified as ‘reactor νe
candidates’; more energetic events are treated as ‘muoncandidates.’
The criteria for selection of νe events are (1) a fidu-cial volume cut (R < 5 m), (2) a time correlation cut(0.5 µsec < ∆T < 660 µsec), (3) a vertex correlation

3
cut (∆R < 1.6 m), (4) a delayed energy window cut (1.8MeV < Edelay < 2.6 MeV), and (5) a cut on the de-layed vertex position requiring it to be more than 1.2 mfrom the central vertical axis (to eliminate backgroundfrom thermometers deployed in this region to monitorLS temperature). The overall efficiency associated withcriteria (2)-(5) combined with the effect of (1) on thedelayed vertex is (78.3± 1.6)%.
Positrons annihilate in the LS and the detected en-ergy includes the kinetic energy plus twice the electronrest mass; thus e+ from νe events produce Eprompt =Eνe
− En − 0.8 MeV, where En is the average neutronrecoil energy. Anti-neutrinos emitted by 238U and 232Thdecays in the Earth, ‘geo-neutrinos’ (νgeo), contributelow-energy events with Eprompt < 2.49 MeV. For exam-ple, model Ia of νgeo in [6] predicts about 9 νgeo eventsin our data set. However the abundances of U and Thand their distributions in the Earth are not well known.To avoid ambiguities from νgeo’s we employ (6) a promptenergy cut, Eprompt > 2.6 MeV in the present analysis.
Low-energy γ-rays from 208Tl ('3 Hz) entering fromoutside the balloon are potential sources of backgroundin the range up to 3 MeV and are strongly suppressed bythe fiducial volume cut (1). The fiducial volume is esti-mated using the uniform distribution of spallation neu-tron capture events shown in Fig. 2 (b). The ratio ofthese events in the fiducial volume to those in the to-tal volume agrees with the geometric fiducial fraction towithin 4.06%. The same method is used for higher en-ergy events, 12N, 12B β’s following muon spallation, andagrees within 3.5%. Accounting for uncertainty in theLS total mass of 2.1%, we estimate the total systematicuncertainty of the fiducial volume to be 4.6%. The den-sity of the LS is 0.780 g/cm3 at 11.5◦C; the hydrogen-to-carbon ratio is computed from the LS components tobe 1.969 and was verified by elemental analysis (±2%).The specific gravity of the LS is measured to 0.01% preci-sion using a commercial density meter, and we assign anadditional 0.1% systematic error due to the uncertaintyin the LS temperature. The 408 ton fiducial mass thuscontains 3.46× 1031 free target protons.
The trigger efficiency was determined to be 99.98% us-ing LED light sources. The combined efficiency of theelectronics, data acquisition, and event reconstructionwas carefully studied using time distributions of uncor-related events from calibration γ sources. We find thatthis combined efficiency is greater than 99.98%. The ver-tex fitter yields > 99.9% efficiency within 2 m of knownsource positions. Using calibrated 60Co and 65Zn sources,the overall efficiency was verified to within the 3% uncer-tainty in source strengths. The detection efficiency ofdelayed events from the Am-Be source (4.4 MeV promptγ and 2.2 MeV delayed neutron capture γ within 1.6 m)was verified with 1% uncertainty.
From studies of Bi-Po sequential decays, the equi-librium concentrations of 238U and 232Th in the LSare estimated to be (3.5 ± 0.5) × 10−18 g/g and(5.2± 0.8)× 10−17 g/g, respectively. The observed back-
ground energy spectrum constrains the 40K contamina-tion to be less than 2.7×10⁻¹⁶ g/g. The accidental back-ground, obtained from the observed flat distribution inthe delayed time window 0.020-20 sec, is 0.0086± 0.0005events for the present data set.
TABLE I: Background summary.
Background Number of eventsAccidental 0.0086 ± 0.00059Li/8He 0.94 ± 0.85Fast neutron < 0.5Total B.G. events 0.95 ± 0.99
At higher energies, the background is dominated byspallation products from energetic muons. We observe∼3,000 neutron events/day/kton. We also expect ∼1,300events/day/kton [7] for various unstable products.
Single neutrons are efficiently suppressed by a 2-msecveto following a muon, but care is required to avoidneutrons which mimic the νe delayed coincidence sig-nal. Most fast neutrons are produced by energetic muonswhich pass through both the OD and the surroundingrock. This background is evaluated by detecting delayedcoincidence events with a prompt signal associated witha muon detected only by the OD. As expected, a clearconcentration of events near the balloon edge is observed.The expected background inside the fiducial volume is es-timated by extrapolating the vertex position distributionand considering an OD reconstruction efficiency of 92%.To estimate the number of background events due to neu-trons from the surrounding rock, the OD-associated rateis scaled by the relative neutron production and neutronshielding properties of the relevant materials. We esti-mate that the total fast neutron background is less than0.5 events for the entire data set.
Most radioactive spallation products simply beta de-cay, and are effectively suppressed by requiring a de-layed neutron signal. Delayed neutron emitters like 8He(T1/2 = 119 msec) and 9Li (178 msec) are eliminated bytwo time/geometry cuts: (a) a 2-sec veto is applied forthe entire fiducial volume following a showering muon(those with more than 106 p.e., ∼3 GeV, extra energydeposition), (b) for the remaining muons, delayed eventswithin 2 sec and 3 m from a muon track are rejected. Theefficiency of these cuts is calculated from the observedcorrelation of spallation neutrons with muon tracks. Theremaining 8He and 9Li background is estimated to be
TABLE II: Estimated systematic uncertainties (%).
Total LS mass 2.1 Reactor power 2.0Fiducial mass ratio 4.1 Fuel composition 1.0Energy threshold 2.1 Time lag 0.28Efficiency of cuts 2.1 ν spectra [8] 2.5Live time 0.07 Cross section [11] 0.2Total systematic error 6.4%

4
1
6
5
4
3
2
10 2 3 4 5 6 7 8
delayed energy window
Del
ayed
Ene
rgy
(MeV
)
Prompt Energy (MeV)
FIG. 3: Distribution of νe candidates with fiducial volumecut, time, vertex correlation, and spallation cuts applied. Theprompt energy corresponds to the positron and the delayedenergy to the captured neutron. The events within the hor-izontal lines bracketing the delayed energy of 2.2 MeV aredue to thermal neutron capture on protons. The events withprompt energy below ∼0.7 MeV are obtained from the delayedtrigger. The one event with delayed energy near 4.95 MeV isconsistent with the expected 0.54% fraction from 12C(n, γ).
0.94± 0.85. The dead time due to the spallation cuts is11.4%. This method is checked by exploiting the timedistribution of the events after a detected muon to sepa-rate the short-lived spallation-produced activities from νe
candidates. The uncorrelated νe event distribution has acharacteristic time constant of 1/Rµ ' 3 sec, where Rµ isthe incident muon rate. Spallation products have a muchshorter time constant (∼0.2 sec). These methods agreeto 3% accuracy. As shown in Table I the total number ofexpected background events is 0.95±0.99, where the fastneutron contribution is included in the error estimate.
Instantaneous thermal power generation, burn-up andfuel exchange records for all Japanese commercial powerreactors are provided by the power companies. Thetime dependence of the thermal power generation datais checked by comparison with the independent recordsof electric power generation. The fission rate for eachfissile element is calculated from these data, resulting ina systematic uncertainty in the νe flux of less than 1%.Averaged over the present live-time period, the relativefission yields from the various fuel components are 235U: 238U : 239Pu : 241Pu = 0.568 : 0.078 : 0.297 : 0.057.The νe spectrum per fission and its error (2.48%) aretaken from the literature [8]. These neutrino spectra havebeen tested to a few percent accuracy in previous short-baseline reactor νe experiments [2, 9]. The finite β-decaylifetimes of fission products introduce an additional un-certainty of 0.28% to the νe flux; this is estimated fromthe difference of the total νe yield associated with shiftingthe run time by one day. The contribution to the νe fluxfrom Korean reactors is estimated to be (2.46 ± 0.25)%from the reported electric power generation rates. Otherreactors around the world give an average (0.70 ± 0.35)%
1.4
1.2
1.0
0.8
0.6
0.4
0.2
0.0
Nob
s/N
exp
101 102 103 104 105
Distance to Reactor (m)
ILL Savannah River Bugey Rovno Goesgen Krasnoyarsk Palo Verde Chooz
KamLAND
FIG. 4: The ratio of measured to expected νe flux from reac-tor experiments [12]. The solid dot is the KamLAND pointplotted at a flux-weighted average distance (the dot size isindicative of the spread in reactor distances). The shadedregion indicates the range of flux predictions correspondingto the 95% C.L. LMA region found in a global analysis ofthe solar neutrino data [13]. The dotted curve correspondsto sin2 2θ = 0.833 and ∆m2 = 5.5 × 10⁻⁵ eV2 [13] and isrepresentative of recent best-fit LMA predictions while thedashed curve shows the case of small mixing angles (or nooscillation).
contribution, which is estimated by using reactor spec-ifications from the International Nuclear Safety Center[10]. The uncertainties for the event rate calculation aresummarized in Table II. The errors from reactors outsideJapan are included in the table under ‘Reactor Power’.
Although the anti-neutrino flux at the location of Kam-LAND is due to many nuclear reactors at a variety ofdistances, the νe flux is actually dominated by a few re-actors at an average distance of ∼180 km. More than79% of the computed flux arises from 26 reactors withinthe distance range 138-214 km. One reactor at 88 kmcontributes an additional 6.7% to the flux and the otherreactors are more than 295 km away. This relatively nar-row band of distances implies that for some oscillationparameters KamLAND can observe a distortion of theνe energy spectrum.
The flux of anti-neutrinos from a reactor a distanceL from KamLAND is approximately proportional to thethermal power flux Pth/4πL2, where Pth is the reactorthermal power. The integrated total thermal power fluxduring the measurement live time is 254 Joule/cm
2. The
systematic error assigned to the thermal power is con-servatively taken as 2% from the regulatory specificationfor safe reactor operation. The corresponding expectednumber of reactor neutrino events (in the absence of neu-trino oscillations) in the fiducial volume for this data setis 86.8± 5.6.
The distribution of prompt and delayed energies for

5
20
15
10
5
0
reactor neutrinos geo neutrinos accidentals
25
20
15
10
5
086420
Prompt Energy (MeV)
2.6 MeVanalysis threshold
KamLAND data no oscillation best-fit oscillation
sin22θ = 1.0 ∆m2= 6.9 x 10⁻⁵ eV2
Eve
nts/
0.42
5 M
eV
FIG. 5: Upper panel: Expected reactor νe energy spectrumwith contributions of νgeo (model Ia of [6]) and accidentalbackround. Lower panel: Energy spectrum of the observedprompt events (solid circles with error bars), along with theexpected no oscillation spectrum (upper histogram, with νgeo
and accidentals shown) and best fit (lower histogram) includ-ing neutrino oscillations. The shaded band indicates the sys-tematic error in the best-fit spectrum. The vertical dashedline corresponds to the analysis threshold at 2.6 MeV.
the present sample before the energy cuts are appliedis shown in Fig. 3. A clear cluster of events from the2.2 MeV capture γ’s is observed. One event with delayedenergy around 5 MeV is consistent with a thermal neu-tron capture γ on 12C. The space-time correlation of theprompt and delayed events is in good agreement with ex-pectations, and the observed mean neutron capture timeis 188± 23 µsec. After applying the prompt and delayedenergy cuts, 54 events remain as the final sample. Theratio of the number of observed reactor νe events to thatexpected in the absence of neutrino oscillations is
Nobs −NBG
Nexpected= 0.611± 0.085(stat)± 0.041(syst).
The probability that the KamLAND result is consistentwith the no disappearance hypothesis is less than 0.05%.Fig. 4 shows the ratio of measured to expected flux forKamLAND as well as previous reactor experiments as afunction of the average distance from the source.
The observed prompt energy spectrum is shown inFig. 5. The expected positron spectrum with no oscilla-tions and the best fit with two-flavor neutrino oscillationsabove the 2.6 MeV threshold are shown. A clear deficitof events is observed. The measured spectrum is consis-tent (93% confidence) with a distorted spectrum shape asexpected from neutrino oscillations, but a renormalized
no-oscillation shape is also consistent at 53% confidence.The neutrino oscillation parameter region for two-
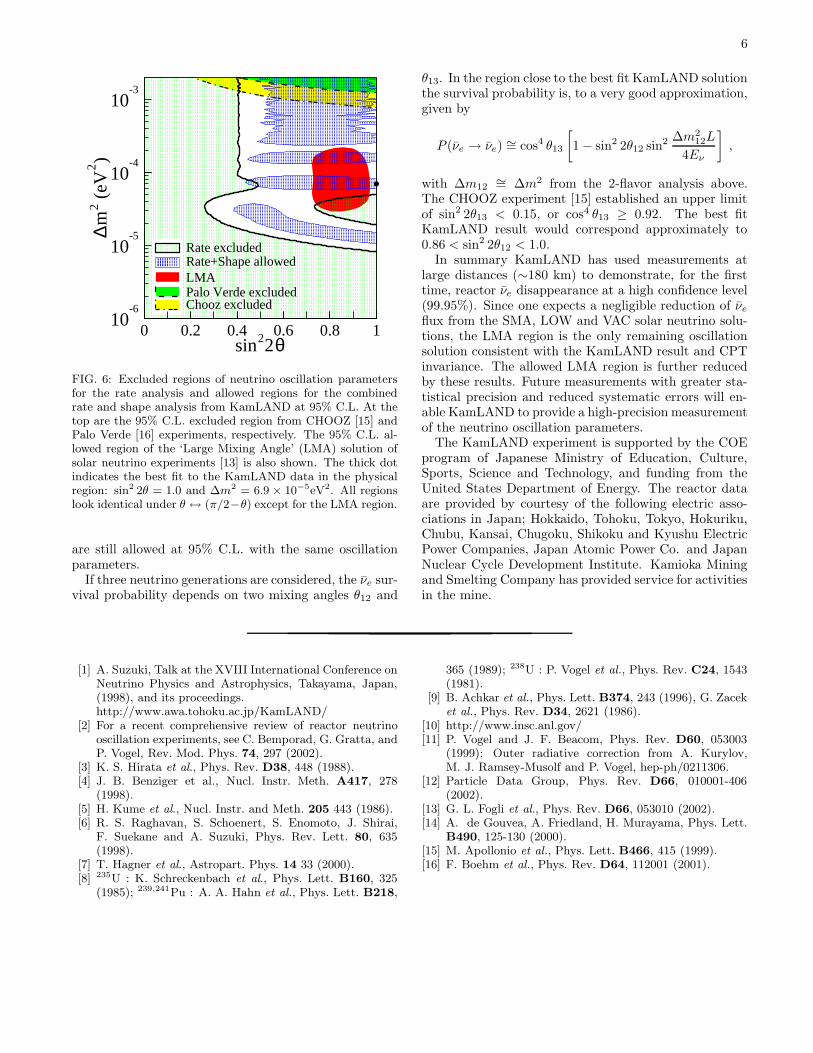
neutrino mixing is shown in Fig. 6. The dark shadedarea is the LMA region at 95% C.L. derived from [13].The shaded region outside the solid line is excluded at95% C.L. from the rate analysis with ∆χ2 ≥ 3.84 and
χ2 =(0.611−R(sin2 2θ, ∆m2))2
0.0852 + 0.0412.
Here, R(sin2 2θ, ∆m2) is the expected ratio with the os-cillation parameters.
The spectrum of the final event sample is then ana-lyzed with a maximum likelihood method to obtain theoptimum set of oscillation parameters with the followingχ2 definition:
χ2 = χ2rate(sin
2 2θ, ∆m2, NBG1∼2, α1∼4)
−2 logLshape(sin2 2θ, ∆m2, NBG1∼2, α1∼4)
+χ2BG(NBG1∼2) + χ2
distortion(α1∼4),
where Lshape is the likelihood function of the spectrum in-cluding deformations from various parameters. NBG1∼2
are the estimated number of 9Li and 8He backgroundsand α1∼4 are the parameters for the shape deformationcoming from energy scale, resolution, νe spectrum andfiducial volume. These parameters are varied to mini-mize the χ2 at each pair of
[
∆m2, sin2 θ]
with a bound
from χ2BG(NBG1∼2) and χ2
distortion(α1∼4). The best fitto the KamLAND data in the physical region yieldssin2 2θ = 1.0 and ∆m2 = 6.9×10⁻⁵ eV2 while the globalminimum occurs slightly outside of the physical region atsin2 2θ = 1.01 with the same ∆m2. These numbers canbe compared to the best fit LMA values of sin2 2θ = 0.833and ∆m2 = 5.5 × 10⁻⁵ eV2 from [13]. The 95% C.L.allowed regions from the spectrum shape analysis areshown in Fig. 6. The allowed regions displayed for Kam-LAND correspond to 0 < θ < π
4consistent with the solar
LMA solution, but for KamLAND the allowed regions inπ4
< θ < π2
are identical [14].Another spectral shape analysis is performed with a
lower prompt energy threshold of 0.9 MeV in order tocheck the stability of the above result and study thesensitivity to νgeo. With this threshold, the total back-ground is estimated to be 2.91 ± 1.12 events, most ofwhich come from accidental and spallation events. Thesystematic error is 6.0%, which is smaller than that forthe final event sample due to the absence of an energythreshold effect. When the maximum likelihood is cal-culated, the νgeo fluxes from 238U and 232Th are treatedas free parameters. The best fit in this analysis yieldssin2 2θ = 0.91 and ∆m2 = 6.9× 10⁻⁵eV2. These resultsand the allowed region of the oscillation parameters arein good agreement with the results obtained above. Thenumbers of νgeo events for the best fit are 4 for 238U and 5for 232Th, which corresponds to ∼40 TW radiogenic heatgeneration according to model Ia in [6]. However, for thesame model, νgeo production powers from 0 to 110 TW
6
θ22sin0 0.2 0.4 0.6 0.8 1
)2 (
eV2
m∆
10-6
10-5
10-4
10-3
Rate excludedRate+Shape allowedLMAPalo Verde excludedChooz excluded
FIG. 6: Excluded regions of neutrino oscillation parametersfor the rate analysis and allowed regions for the combinedrate and shape analysis from KamLAND at 95% C.L. At thetop are the 95% C.L. excluded region from CHOOZ [15] andPalo Verde [16] experiments, respectively. The 95% C.L. al-lowed region of the ‘Large Mixing Angle’ (LMA) solution ofsolar neutrino experiments [13] is also shown. The thick dotindicates the best fit to the KamLAND data in the physicalregion: sin2 2θ = 1.0 and ∆m2 = 6.9 × 10⁻⁵eV2. All regionslook identical under θ ↔ (π/2−θ) except for the LMA region.
are still allowed at 95% C.L. with the same oscillationparameters.
If three neutrino generations are considered, the νe sur-vival probability depends on two mixing angles θ12 and
θ13. In the region close to the best fit KamLAND solutionthe survival probability is, to a very good approximation,given by
P (νe → νe) ∼= cos4 θ13
[
1− sin2 2θ12 sin2 ∆m212L
4Eν
]
,
with ∆m12∼= ∆m2 from the 2-flavor analysis above.
The CHOOZ experiment [15] established an upper limitof sin2 2θ13 < 0.15, or cos4 θ13 ≥ 0.92. The best fitKamLAND result would correspond approximately to0.86 < sin2 2θ12 < 1.0.
In summary KamLAND has used measurements atlarge distances (∼180 km) to demonstrate, for the firsttime, reactor νe disappearance at a high confidence level(99.95%). Since one expects a negligible reduction of νe
flux from the SMA, LOW and VAC solar neutrino solu-tions, the LMA region is the only remaining oscillationsolution consistent with the KamLAND result and CPTinvariance. The allowed LMA region is further reducedby these results. Future measurements with greater sta-tistical precision and reduced systematic errors will en-able KamLAND to provide a high-precision measurementof the neutrino oscillation parameters.
The KamLAND experiment is supported by the COEprogram of Japanese Ministry of Education, Culture,Sports, Science and Technology, and funding from theUnited States Department of Energy. The reactor dataare provided by courtesy of the following electric asso-ciations in Japan; Hokkaido, Tohoku, Tokyo, Hokuriku,Chubu, Kansai, Chugoku, Shikoku and Kyushu ElectricPower Companies, Japan Atomic Power Co. and JapanNuclear Cycle Development Institute. Kamioka Miningand Smelting Company has provided service for activitiesin the mine.
[1] A. Suzuki, Talk at the XVIII International Conference onNeutrino Physics and Astrophysics, Takayama, Japan,(1998), and its proceedings.http://www.awa.tohoku.ac.jp/KamLAND/
[2] For a recent comprehensive review of reactor neutrinooscillation experiments, see C. Bemporad, G. Gratta, andP. Vogel, Rev. Mod. Phys. 74, 297 (2002).
[3] K. S. Hirata et al., Phys. Rev. D38, 448 (1988).[4] J. B. Benziger et al., Nucl. Instr. Meth. A417, 278
(1998).[5] H. Kume et al., Nucl. Instr. and Meth. 205 443 (1986).[6] R. S. Raghavan, S. Schoenert, S. Enomoto, J. Shirai,
F. Suekane and A. Suzuki, Phys. Rev. Lett. 80, 635(1998).
[7] T. Hagner et al., Astropart. Phys. 14 33 (2000).[8] 235U : K. Schreckenbach et al., Phys. Lett. B160, 325
(1985); 239,241Pu : A. A. Hahn et al., Phys. Lett. B218,
365 (1989); 238U : P. Vogel et al., Phys. Rev. C24, 1543(1981).
[9] B. Achkar et al., Phys. Lett. B374, 243 (1996), G. Zaceket al., Phys. Rev. D34, 2621 (1986).
[10] http://www.insc.anl.gov/[11] P. Vogel and J. F. Beacom, Phys. Rev. D60, 053003
(1999); Outer radiative correction from A. Kurylov,M. J. Ramsey-Musolf and P. Vogel, hep-ph/0211306.
[12] Particle Data Group, Phys. Rev. D66, 010001-406(2002).
[13] G. L. Fogli et al., Phys. Rev. D66, 053010 (2002).[14] A. de Gouvea, A. Friedland, H. Murayama, Phys. Lett.
B490, 125-130 (2000).[15] M. Apollonio et al., Phys. Lett. B466, 415 (1999).[16] F. Boehm et al., Phys. Rev. D64, 112001 (2001).