reactor-based neutrino oscillation experiments -...
TRANSCRIPT
REVIEWS OF MODERN PHYSICS, VOLUME 74, APRIL 2002
Reactor-based neutrino oscillation experiments
Carlo Bemporad
Istituto Nazionale di Fisica Nucleare and University of Pisa, I-56010 Pisa, Italy
Giorgio Gratta
Physics Department, Stanford University, Stanford, California 94305
Petr Vogel
Physics Department, California Institute of Technology, Pasadena, California 91125
(Published 18 March 2002)
The status of neutrino oscillation searches employing nuclear reactors as sources is reviewed. Thistechnique, a direct continuation of the experiments that proved the existence of neutrinos, is today anessential tool in investigating the indications of oscillations found in studying neutrinos produced inthe sun and in the earth’s atmosphere. The low energy of the reactor ne makes them ideal forexploring oscillations with small mass differences and relatively large mixing angles. In the last severalyears the determination of the reactor antineutrino flux and spectrum has reached a high degree ofaccuracy. Hence measurements of these quantities at a given distance L can be readily compared withthe expectation at L50, thus testing the disappearance of ne . Two recent experiments, CHOOZ andPALO VERDE, with baselines of about 1 km and sensitive to the neutrino mass differencesassociated with the atmospheric neutrino anomaly have collected data and published results recently.An ambitious project with a baseline of more than 100 km, KAMLAND, has now began to take data.This last reactor experiment will have a sensitivity sufficient to explore part of the oscillation phasespace relevant to solar neutrino scenarios. It is the only envisioned experiment with a terrestrialsource of neutrinos capable of addressing the solar neutrino puzzle.
CONTENTS
I. Introduction 297II. Physics Motivation for Modern Experiments 300
A. Experimental indications for neutrinooscillations 300
B. Reactor-based versus accelerator-basedoscillation experiments 301
III. Reactor Neutrino Spectrum and Flux Determination 303A. Antineutrino production 303B. Fission-rate determination 304C. From fission rates to the ne spectra 305D. From ne to positrons 306E. Accuracy of the flux and spectrum predictions 307F. Other reactor neutrino experiments 309
IV. Experiments Motivated by the AtmosphericNeutrino Anomaly 310A. CHOOZ 311B. PALO VERDE 313C. Backgrounds 314D. Event reconstruction techniques 317E. Results and systematics 319F. Are smaller mixing angles within experimental
reach? 319V. Exploring the Solar n Anomaly on Earth:
KAMLAND 321A. Nuclear reactors in Japan 321B. Detector design 321C. Expected performance 323D. Other physics with a very large low-energy ne
detector 323VI. Conclusions 326
Acknowledgments 327
0034-6861/2002/74(2)/297(32)/$35.00 297
References 327
I. INTRODUCTION
Neutrinos have the distinction of being the first el-ementary particle whose existence was predicted by atheorist in order to explain seemingly unrelatedphenomena.1 Pauli made this prediction in 1930 in hisfamous letter attempting to explain the continuous elec-tron energy distribution in nuclear beta decay. It becameimmediately clear that neutrinos would be difficult toobserve, because the corresponding cross sections are sotiny. But in a series of experiments from 1953 to 1959,Reines and Cowan (1953, 1959) were able to prove con-vincingly that electron antineutrinos from nuclear reac-tors are able to cause the inverse neutron beta decay,ne1p→e11n , and hence that they are real particles.Shortly afterwards, in 1962, the separate identity ofmuon neutrinos, nm , was demonstrated (Danby et al.,1962). Another decade later, in 1975, the t lepton wasdiscovered (Perl et al., 1975) and the observation of itsdecay properties implied the existence of a third neu-trino, nt , that was directly observed only very recently(Kodama et al., 2001). Precise measurements of the de-cay width of the Z boson have shown that just threeneutrino flavors [2.99460.012 from the combined fit to
1For early developments in neutrino physics see, for example,Chap. 1 in Winter (1991).
©2002 The American Physical Society

298 Bemporad, Gratta, and Vogel: Reactor-based neutrino oscillation experiments
all Large Electron Positron Collider (LEP) data (Groomet al., 2000)] participate in weak interactions, at least forneutrinos with masses less than MZ/2.
Phenomenologically, it is obvious that neutrinos ofeach flavor are either massless or at least many orders ofmagnitude lighter than the corresponding charged lep-tons with which they form weak-interaction doublets.Based on these empirical facts, the standard model ofelectroweak interactions postulates that all neutrinos aremassless and consequently have conserved helicity(which is the same as chirality in this case), and that theseparate lepton numbers for electron, muon, and tau fla-vors are conserved. Challenging this postulate of thevanishing neutrino mass has recently become a centralissue in many disciplines of fundamental science, includ-ing particle and nuclear physics, cosmology, and astro-physics. This review is devoted to one particular aspectof this broad effort.
Ironically, while our knowledge of intrinsic neutrinoproperties remains quite poor, these particles have beenused as tools to understand other phenomena. The tra-dition of underground neutrino detectors began 30 yearsago, when Davis and his collaborators were first able todetect neutrinos from the sun. (For a description of thehistory of solar neutrino research, see Bahcall, 1989.)Together with all the other experimental observations ofsolar neutrinos, this was, and still is, the only clear proofthat the basic energy generation in stars is understood.The birth of neutrino astronomy can be associated withthe observation of the neutrino burst from the super-nova 1987A. Neutrino-induced reactions played an im-portant role in establishing what is now known as thestandard model of electroweak interactions when, in1973, neutral currents were discovered via the observa-tion of nm1e→nm1e scattering as well as neutral-current scattering of neutrinos on nucleons. Finally, neu-trinos have been extensively used in deep-inelasticscattering experiments at CERN and FNAL, exploringthe quark structure of nucleons.
The main problem in neutrino physics today is thequestion of whether neutrinos, like all charged fermions,have mass.2 Since direct kinematic tests of neutrino masslack at present the required sensitivity, the recent hintsof neutrino mass are indirect, based on the phenomenonof neutrino oscillations. If neutrinos are massive par-ticles that behave analogously to quarks, the states witha definite mass (i.e., the ‘‘mass eigenstates’’ that propa-gate as plane waves in vacuum) are not necessarily thepartners of the charged leptons that couple to the vectorbosons W6 in doublets (i.e., the weak or flavor eigen-states),
S ne
e2 D , S nm
m2 D , S nt
t2 D . (1)
In such a case the weak eigenstates un l& will be linearsuperpositions of the mass eigenstates un i&:
2For an up-to-date discussion of neutrino masses and the rel-evant experiments, see Fisher, Kayser, and McFarland (1999)and Zuber (1998).
Rev. Mod. Phys., Vol. 74, No. 2, April 2002
un l&5(i
Ul ,iun i&, (2)
where the coefficients Ul ,i form the leptonic mixing ma-trix. If we assume that only three neutrinos can contrib-ute to Eq. (2) above, then U is a unitary 333 matrix.3
If Eq. (2) is valid, we encounter the phenomenon ofneutrino oscillations, in which a neutrino that was ini-tially in the weak eigenstate l can be spontaneouslytransformed, at least in part, into another weak-eigenstate neutrino of flavor l8. [The idea of oscillationswas discussed early on by Pontecorvo (1958, 1967) andby Maki, Nakagawa, and Sakata (1962).]
To see how that transformation happens, recall thatthe mass eigenstate un i& propagates according to the ex-pression
un i~ t !&5e2i(Eit2piL)un i~0 !&.e2i(mi2/2E)Lun i~0 !&, (3)
where L is the flight path, and the laboratory momentaand energies are assumed to be much larger than theneutrino rest masses mi . Let us now consider the propa-gation of a neutrino that was created at L50 as a weakeigenstate un l&. At a distance L this state is described by
un l~L !&.(i
Ul ,ie2i(mi
2/2E)Lun i&
.(l8
(i
Ul ,ie2i(mi
2/2E)LUl8,i* un l8&. (4)
Here we used the inverse transformation to Eq. (2),i.e., from the mass eigenstates back to the weak eigen-states. This step must be taken, since the only way onecan detect neutrinos is through their weak interactions.And in order to detect the neutrino flavor, we have touse charged-current weak interactions, characterized bythe production of charged leptons ul8&.
Thus the neutrino of flavor l acquired componentscorresponding to other flavors l8. This is a purelyquantum-mechanical effect, a consequence of the coher-ence in the superposition of states in Eq. (2). The prob-ability that the ‘‘transition’’ l→l8 happens at L is obvi-ously
P~n l→n l8!5U(i
Ul ,iUl8,i* e2i(mi
2/2E)LU2
5(i
uUliUl8i* u21R(
i(jÞi
3UliUl8i* Ulj* Ul8je
i~ umi22mj
2uL/2p !. (5)
This is an oscillating function of the distance L . Theoscillation length depends on the differences of the neu-trino mass squares, umi
22mj2u, and the oscillation ampli-
tude depends on the mixing matrix U .
3Sometimes more than three mass eigenstates are considered.The additional neutrinos must be sterile or heavy, i.e., theymust not participate in weak interactions so that the constraintfrom the invisible width of the Z boson is obeyed.

299Bemporad, Gratta, and Vogel: Reactor-based neutrino oscillation experiments
The necessary and sufficient conditions for the exis-tence of neutrino oscillations are then (a) the nonvan-ishing value of at least one neutrino mass mi and (b) thenonvanishing value of at least one nondiagonal matrixelement of the mixing matrix U . If these conditions arefulfilled, the individual lepton flavor numbers (electron,muon, and tau) are no longer conserved.
There is no fundamental theory that would allow us todeduce the parameters describing the mixing matrix Uand the mass differences Dmij
2 . These unknown param-eters must be determined empirically, by various neu-trino oscillation experiments. Such analysis is often per-formed in a simplified way by assuming that only twoneutrino flavors mix, e.g., e and m. The mixing matrix Uthen depends only on one mixing angle u, and the oscil-lation probability, Eq. (5), is also simplified:
U5S cos u sin u
2sin u cos u D ,
P~ne→nm ,L !5sin2 2u sin2~Dm2L/4E !. (6)
Here Dm2[m122m2
2, and we assume, as before, that theneutrinos are ultrarelativistic. The probability that ne re-mains ne is obviously
P~ne→ne ,L !512P~ne→nm ,L !. (7)
In this two-flavor scenario the oscillation amplitude issin2 2u, which vanishes if u50 or 90° and has a maxi-mum if u545°. The oscillation length in meters is
Losc52p2En
Dm25
2.48En~MeV!
Dm2~eV2!m. (8)
To test for oscillations, one can perform either an ap-pearance search in which one looks for a new neutrinoflavor [i.e., the deviations of P(ne→nm ,L) from zero],or a disappearance test, in which one looks for a changein the flux normalization [i.e., the deviation of P(ne→ne ,L) from unity]. In either case, tests performed atdistance L are only sensitive to the values of Dm2 forwhich L>O(Losc). In other words, neutrino oscillationsare observable only when Dm2L/E;O(1).
So far we have considered only propagation of neutri-nos in a vacuum. When neutrinos propagate in matter,for example, in the solar interior, the oscillation patternmay be modified. This happens because electron neutri-nos can forward scatter on electrons by charged-currentinteractions, and other neutrino flavors cannot. Underfavorable circumstances a resonance enhancement ofthe oscillation amplitude, the so-called Mikheyev-Smirnov-Wolfenstein (MSW) effect (Wolfenstein, 1979,1980; Mikheyev and Smirnov, 1986a, 1986b), can takeplace. Analogous matter-induced oscillations can distin-guish the hypothetical sterile neutrinos, which have noweak interactions at all, from the nm or nt neutrinos,which interact with matter (electrons and quarks) by theneutral-current weak interaction. Neither of these ef-fects is relevant for reactor neutrinos.
For completeness, it is worthwhile to mention heretwo other issues important in the study of intrinsic neu-
Rev. Mod. Phys., Vol. 74, No. 2, April 2002
trino properties. One of them is the behavior of neutri-nos under charge conjugation. Unlike the charged lep-tons, which are Dirac particles with distinct antiparticles,neutrinos can be either Dirac or Majorana particles. Inthe latter case of truly neutral neutrinos, there is no dis-tinction between the neutrinos and their antiparticles,and even the total lepton number is not conserved. Inorder to decide between these two possibilities, one hasto look for processes that violate the total lepton num-ber, such as the neutrinoless double beta decay. Otherprocesses of this kind, like ne→ ne oscillations (e.g., inthe present context the emission of ne from the nuclearreactor), are typically kinematically suppressed, andtheir observation is unlikely in the foreseeable future.The difference between the Dirac and Majorana neutri-nos, while of fundamental importance, does not influ-ence the results of the reactor oscillation searches de-scribed below.
The other issue worth mentioning is the possibility ofT or CP violation in neutrino oscillations (Cabibbo,1978; Barger, Whisnant, and Phillips, 1980). In order toestablish violation of T or CP , one would have to showthat
P~n l 8→n l !ÞP~ n l 8→ n l !, (9)
i.e., that for example, the probability of nm oscillatinginto ne is different from the probability of nm oscillatinginto ne .
For the usual case of three neutrino flavors, one canparametrize the lepton mixing matrix in terms of thethree angles u15u13 , u25u23 , and u35u12 and theCP-violating phase d:
S ne
nm
nt
D 5S c1c3 c1s3 s1e2id
2c2s32s1s2c3eid c2c32s1s2s3eid c1s2
s2s32s1c2c3eid 2s2c32s1c2s3eid c1c2
D3S n1
n2
n3
D , (10)
where c15cos u1 and s15sin u1 , etc.The magnitude of the T or CP violation is character-
ized by the differences
P~m→ e !2P~m→e !
52@P~m→ t !2P~m→t!#
5P~e→t!2P~ e→ t !
524c12s1c2s2c3s3sind@sin D121sin D231sin D31# ,
(11)
where D ij5(mi22mj
2)3L/2E .Thus the size of the effect is the same in all three
channels, and CP violation is observable only if all threemasses are different (i.e., nondegenerate) and all threeangles are nonvanishing. As will be shown below, reac-tor experiments constrain the angle u1 (or u13) to besmall (sin2 2u13<0.1). If that mixing angle vanishes ex-actly, no CP violation is observable in the lepton sector,independently of the value of the CP-violating phase d.

300 Bemporad, Gratta, and Vogel: Reactor-based neutrino oscillation experiments
Further improvement of the sensitivity to sin2 2u13 is,therefore, a matter of utmost importance.
II. PHYSICS MOTIVATION FOR MODERN EXPERIMENTS
Numerous searches for neutrino oscillations havebeen performed during the last two decades usingnuclear reactors and particle accelerators as sources.Since most of them did not observe evidence for neu-trino oscillations, their results are usually presented asan ‘‘exclusion plot,’’ based on the simplified two-neutrino mixing scenario. That is, according to theseplots, certain ranges of the parameters Dm2 and sin2 2ucan be excluded from further consideration, as shown inFig. 1. However, at the present time there are threegroups of measurements that suggest the existence ofneutrino oscillations. (And, at the same time, the param-eter ranges suggested by them are not excluded.) Onlythese positive results will be briefly discussed here; otherexperiments are listed in the Review of Particle Physics(Groom et al., 2000).
A. Experimental indications for neutrino oscillations
The most prominent group of measurements that arecommonly interpreted as evidence for neutrino oscilla-tions are often referred to as the ‘‘atmospheric neutrinoanomaly’’ (Kajita and Totsuka, 2001). Primary cosmicrays impinging on the nitrogen and oxygen nuclei at thetop of the earth’s atmosphere produce mostly pions,which subsequently decay via the chain p2→m2nm ,m2
→e2nenm (and the analogous chain with p1, etc.). Atsufficiently low energy, when such chains can fully de-velop, the resulting atmospheric neutrinos therefore areexpected to follow the nm :ne52:1 ratio, which is essen-tially independent of the details of the complicated pro-cess that created them. In addition, in an undergrounddetector, one can deduce the direction of the incominghigh-energy neutrinos from the direction of the leptons(e and m) created by the charged current interactions.Again, one is reasonably confident that this zenith-angledistribution can be accurately predicted. If the nm and/orne neutrinos oscillate, one expects deviations from the2:1 ratio mentioned above. Also, since the zenith angleis simply related to the neutrino path length, one expectsdeviations from the expected zenith-angle dependenceof the lepton yield.
Both signatures of neutrino oscillations were in factobserved. The nm /ne ratio is only about 60% of the ex-pected value. This result has been confirmed in four de-tectors thus far. The anomalous zenith-angle depen-dence was first observed in Kamiokande, and has nowbeen confirmed with much better statistical significanceby Super-Kamiokande (Y. Fukuda, 1998; S. Fukuda2000; Kajita and Totsuka, 2001). If these effects indeedsignify neutrino oscillations (and we do not know of an-other viable explanation), then the corresponding mix-ing angle is large, sin2 2u'1, and the value of the massparameter Dm2 is in the range 1022 –1023 eV2.
Rev. Mod. Phys., Vol. 74, No. 2, April 2002
While the preferred scenario at present involves nm→nt oscillations, it is not clear that nm-ne oscillations arefully excluded.
The second set of measurements that can be inter-preted as evidence for neutrino oscillations deals with
FIG. 1. Phase space for neutrino oscillations. The existing lim-its on ne-nm are compared with current and future experimentsand the regions obtained by interpreting the solar, atmo-spheric, and Liquid Scintillator Neutrino Detector (LSND)neutrino anomalies as due to oscillations (some of these effectsare not necessarily ne-nm oscillations.) The Mikheyev-Smirnov-Wolfenstein (MSW) mechanism is used in plottingsome of the solar neutrino regions. The sensitivity of reactorexperiments is the same for ne-nt oscillations. Limits are at90% C.L. The very recent Sudbury Neutrino Observatory(SNO) result has not been included in the analysis. SMA5small-mixing-angle solution; LMA5large-mixing-angle solu-tion; LOW5low-mass solution.

301Bemporad, Gratta, and Vogel: Reactor-based neutrino oscillation experiments
the ‘‘missing’’ solar neutrinos (see the review of earlierresults in Kirsten, 2000; more recent results are pre-sented by Ahmad, 2001 and S. Fukuda, 2001a, 2001b).The sun produces an intense flux of electron neutrinosas a by-product of the fusion reactions that generate so-lar power. It is believed that the solar structure is under-stood sufficiently well so that the flux and energy spec-trum of the neutrinos can be confidently predicted. Thesolar neutrino fluxes have been measured in seven ex-periments so far. All of them report a deficit; i.e., themeasured flux is less than the expected one. Moreover,the reduction depends on the neutrino energy, inferredexperimentally from the thresholds of the individual de-tectors. The only viable explanation of the deficit ap-pears to be neutrino oscillation (ne disappearance). Thehypothesis that solar ne indeed oscillate into ‘‘active’’neutrinos that scatter on electrons via the neutral-current weak interaction is supported at the 3s level bycombining the pure charged-current measurements ofthe Sudbury Neutrino Observatory (SNO; Ahmad,2001) with the charged-current1neutral-current mea-surement of Super-Kamiokande (S. Fukuda, 2001a,2001b).
In contrast to the attempts to explain the deficit bymodification of the solar model, which are unsuccessful,all existing data can be simply and elegantly explainedby invoking neutrino mass. In particular, the solutionbased on the MSW effect offers the most popular sce-nario. Treating the problem in the two-flavor frameworkexplained above, one arrives at several isolated islandsin the Dm22sin2 2u plane. Two solutions correspond toDm2'1025 eV2. One of them, the ‘‘small mixing angle,’’has sin2 2u'1022, while the other one, the ‘‘large mixingangle,’’ has sin22u>0.5. This latter solution, which cur-rently gives the best fit to the data, spans an interval ofDm2 extending up to 1024 eV2. The other possibilitieshave large mixing angles and Dm2'1027 eV2 (the low-mass solution) or Dm2'10210 eV2 (the vacuum solu-tion).
Finally, the only indication of oscillations involvingman-made neutrinos comes from the Liquid ScintillatorNeutrino Detector (LSND) experiment, which finds evi-dence for the nm→ ne and, with more limited statistics,also for nm→ne (Athanassopoulos et al., 1995, 1996,1998; Aguilar et al., 2001). The former channel uses neu-trinos from the pion and muon decay at rest, with ener-gies less than mm/2. The latter channel uses neutrinosfrom the pion decay in flight which have somewhathigher energies. These are appearance experiments; theobserved signal should be absent if neutrinos do not os-cillate. The well-determined quantity is the oscillationprobability, which has a value of about 331023. Thisresult has not been independently confirmed. An analo-gous experiment that also uses neutrinos from pion andmuon decay at rest, KARMEN (the Karlsruhe-Rutherford Medium-Energy-Neutrino-Experiment;Armbruster et al., 1998; Eitel, 2000), found no evidencefor the nm→ ne oscillations. However, the parameterspace compatible with the LSND signal is not fully ex-cluded by KARMEN.
Rev. Mod. Phys., Vol. 74, No. 2, April 2002
As we can see from this brief discussion, the last de-cade has yielded a number of clues. With the exceptionof the LSND signal, they all came from measurementsinvolving neutrinos produced by natural sources outsideof our control. A number of new experiments have beenperformed or are in various stages of planning in orderto investigate further these tantalizing effects. Reactorexperiments play an all-important role in this quest, ow-ing to their unique ability to investigate very small neu-trino mass differences.
As in many other aspects of neutrino physics, there isa fundamental difference between the past reactor oscil-lation experiments4 and the more recent experimentswith baselines of 1 km or more: experiments in this lat-ter category are designed to further investigate, in a con-trolled environment with man-made neutrinos, particu-lar regions of the oscillation parameter space wherethere are indications of oscillations from other experi-ments. Hence the results from the new generation ofreactor ne detectors directly impact our understandingof the neutrino mixing matrix.
B. Reactor-based versus accelerator-based oscillationexperiments
Nuclear reactors produce isotropically ne’s in theb-decay of neutron-rich fission fragments. All detectorsoptimized for oscillation searches take advantage of therelatively large cross section and specific signature of theinverse-b-decay reaction p1 ne→n1e1. This cross sec-tion is shown in Fig. 2 as function of the neutrino energyalong with the neutrino flux at the reactor and the re-sulting interaction rate in a particular detector configu-ration. We note here that the detection reaction has athreshold of about 1.8 MeV. Many of the merits andlimitations of reactor-based experiments can be under-stood by observing that the energy of ne is rather low, inthe few-MeV range. It directly follows that reactor-based experiments can only be of the ne-disappearancetype, since the neutrino ‘‘beam’’ does not have sufficientenergy to produce muons (or taus), and the neutral-current reactions of the ‘‘oscillated’’ nm or nt have smallcross sections and are indistinguishable from the manybackgrounds present. This first limitation makes reactor-based experiments well suited only for investigatingrelatively large mixing angles. In practice experimentshave reported mixing sensitivities around 10% at largeDm2 (although the proposal for a very ambitious experi-ment with sensitivity better than 2% at a particular Dm2
will be discussed later). The second limitation of reactor-based oscillation searches derives from the fact that theonly known method of collimating neutrino beams em-ploys the Lorentz boost of the parent particles from
4For a general discussion of short-baseline reactor experi-ments see Boehm and Vogel (1992) and Boehm (2001); for theindividual experiments see Kwon et al. (1981), Zacek et al.(1986), Achkar (1992), Vidyakin et al. (1994), Achkar et al.(1995, 1996), and Alfonin et al. (1998).

302 Bemporad, Gratta, and Vogel: Reactor-based neutrino oscillation experiments
whose decay the neutrinos are produced. For this reasonlow-energy neutrinos are generally produced over largesolid angles, while high-energy ones may come in rela-tively narrow beams. Obviously a reactor emits ne’s in acompletely isotropic way, and this, together with themodest interaction cross sections available at low en-ergy, makes the specific signal rates rather low. At thesame time, however, low-energy neutrinos provide uswith a unique opportunity to probe the lowest regions ofDm2 that are otherwise beyond the reach of accelerator-based searches. Some of these tradeoffs are well illus-trated by Fig. 3, where the Dm2 sensitivity is shown,together with the necessary baseline, versus the reactorpower and detector fiducial mass.
Oscillation searches using reactors as sources are par-ticularly important today, since several of the indicationsfor neutrino oscillations shown in Fig. 1 point to regionsof the parameter space at small Dm2 and nearly fullmixing. Hence two reactor-based experiments, CHOOZand PALO VERDE, were performed to investigate thephenomenon of atmospheric neutrinos as ne→ nx oscil-lations. Such experiments, described in detail below, hadbaselines of about 1 km and fiducial masses of the orderof 10 tons. In comparison, the much more complexaccelerator-based Main Injector Neutrino OscillationSearch (MINOS) between FNAL and the Soudan mine(Wojcicki, 2001a) and analogous projects betweenCERN and Gran Sasso, OPERA and ICARUS (Oscil-lation Project with Emulsion-Tracking Apparatus andImaging Cosmic and Rare Underground Signal utilizinga liquid argon tracker; for a brief description, see, forexample, Wojcicki, 2001b), will access similar Dm2 val-ues with GeV-energy neutrinos and a baseline of theorder of 1000 km. However, the 5400-ton MINOS detec-tor and its analogs at Gran Sasso will also be able toinvestigate oscillation channels not including ne and
FIG. 2. Reactor ne flux, inverse-beta-decay cross section, andne interaction spectrum at a detector based on such a reaction:(a) and (b) refer to a 12-ton fiducial mass detector located 0.8km from 12-GWth power reactor.
Rev. Mod. Phys., Vol. 74, No. 2, April 2002
reach a mixing parameter sensitivity substantially betterthan 1%.
The reactor-based KAMLAND experiment, with abaseline larger than 100 km, will offer a unique oppor-tunity of testing, with man-made neutrinos, the large-mixing-angle MSW solution of the solar neutrino puzzle.In this case the restriction to ne→ nx oscillations does notlimit the interest of the experiment (since solar neutri-nos certainly do involve ne), while its Dm2 sensitivity iswell beyond what can be practically achieved by accel-erators (in comparison, similar Dm2 sensitivity could beachieved in an accelerator-based experiment with base-lines of order 105 km, larger than the diameter of theearth).
Of course, the relatively lower energy of neutrinosfrom reactors pushes the optimization of reactor-basedexperiments to concentrate on the reduction and rejec-tion of backgrounds from natural radioactivity, which ishardly an issue in accelerator-based detectors. In thisrespect the correlated signature of the inverse-b process,the detection of the e1 and neutron, plays a very impor-tant role.
While in the case of neutrinos produced by accelera-tors the experimenter has full control over the status ofthe beam, the flux of ne’s cannot be changed at will incommercial power nuclear reactors. However, in prac-tice, typical reactor optimization requires a refuelingshutdown every 12 to 24 months. Such shutdowns usu-ally last about a month, providing a convenient fluxmodulation that can be used to validate background
FIG. 3. Neutrino Dm2 sensitivity as a function of total reactorpower and detector fiducial mass for detection based on theinverse-b reaction discussed in the text. The baseline scaleswith the Dm2 sensitivity sought according to Eq. (8). The fidu-cial mass3power necessary for the experiment grows with thesquare of the baseline. The past experiments are labeled by thename of the reactor complex used. The approximate year ofthe experiment is also indicated to show that the increasedbaseline and Dm2 sensitivity more or less followed the chro-nological order.

303Bemporad, Gratta, and Vogel: Reactor-based neutrino oscillation experiments
subtraction methods. As explained in detail later, evenin the case of KAMLAND, which observes the neutri-nos from about 70 reactor cores, a substantial fluxmodulation is provided by the coincidence of scheduledrefueling outages in the spring and fall, when electricitydemand is lowest.
Finally, we remark here that the fully isotropic fluxproduced by nuclear reactors eliminates the problemsrelated to beam pointing that are present in experimentsusing accelerators. While the pointing accuracy requiredin these experiments is well within the present technol-ogy, a foolproof cross check of the beam detector align-ment is certainly not trivial to obtain.
In conclusion, reactor-based and accelerator-based ex-periments offer complementary approaches to the questfor neutrino oscillations. It is likely that only combinedefforts on these two fronts, together with other studiessuch as the search for neutrinoless double b decay, willallow us to elucidate the problem of mixing in the leptonsector.
III. REACTOR NEUTRINO SPECTRUM AND FLUXDETERMINATION
Since reactor-based oscillation experiments are of thedisappearance type, the accurate determination of the nespectrum and its absolute normalization are essential in-gredients of the measurements. We note here that foroscillation parameters well within the experimental sen-sitivity, the evidence for oscillations would manifest it-self as a deficit of events accompanied by a distortion ofthe energy spectrum, as shown by the example in Fig. 4.However, as the true value of the oscillation parametersmoves closer to the sensitivity boundary of the experi-ment, the spectral shape loses power, and the accuracyof the measurements essentially relies on the total eventcount and, hence, the knowledge of the absolute reactorflux. This last scenario also corresponds to the moreusual case, in which no oscillations are observed and anupper limit is set, as well as to the case of large Dm2, inwhich the spectrum distortions are washed out.
While in this section we shall concern ourselvesmainly with a priori reactor ne yield determinations,multiple-baseline measurements are possible and havebeen performed in the past at the Goesgen (Zacek et al.,1986) and Bugey (Achkar et al., 1995, 1996) reactors.Indeed, such measurements helped instill confidence inthe reactor yield estimates, and, although they were notthe main goal of CHOOZ and PALO VERDE, theyhave recently been proposed (Mikaelyan, 2000) for amore accurate determination of the mixing angle u13 forthe atmospheric neutrino region. CHOOZ could takeadvantage of the '115 m distance between the reactorsto derive weaker exclusion limits, which were howeverless affected by systematics.
A. Antineutrino production
The determination of the ne yield proceeds schemati-cally in three steps. First, the thermal power of each
Rev. Mod. Phys., Vol. 74, No. 2, April 2002
reactor core is measured accurately and essentially con-tinuously. Based on such measurements, and startingfrom the initial fuel composition, the burnup state canbe computed as a function of time. Small correctionsdue to other reactor parameters that modify the critical-ity of the core are also introduced at this time. Reactorsimulation codes are often used at this stage and pro-duce an accurate instantaneous fission rate for each ofthe relevant isotopes through the fuel cycle. In the sec-ond step the neutrino spectrum is derived from the fis-sion rate. Finally, the neutrino spectrum emitted by thereactors must be converted into an estimate of the ex-perimental observable, the positron spectrum in the de-tector. Each of these steps will be explained in a sepa-rate subsection.
Typical modern commercial light-water reactors havethermal powers of the order of 3 GWth . This figure ap-plies to both pressurized-water reactor and the less com-mon boiling-water reactor designs. In both cases the fuelis enriched to 2–5 % in 235U. Since on average eachfission produces ;200 MeV and ;6 ne , we concludethat the typical yield is ;631020 ne core21 s21 (ofcourse part of this flux will be below the detectionthreshold; see Fig. 2).
It is easy to understand why ;6 ne are produced perfission. Take, as an example, the most common 235U fis-sion, which produces two unequal fragments and typi-cally two new neutrons that sustain the chain reaction,
FIG. 4. Expected positron energy spectra: solid line, no oscil-lations; dashed line, oscillations with parameters Dm257.231023 eV2 and sin2 2u51 at the CHOOZ (L.1 km) experi-ment; dotted line, the same oscillations at the PALO VERDE(L.0.8 km) experiment. Adapted from Harrison, Perkins,and Scott (1996).

304 Bemporad, Gratta, and Vogel: Reactor-based neutrino oscillation experiments
235U1n→X11X212n . (12)
The mass distribution of the fragments (so-called fis-sion yields) is shown in Fig. 5. The lighter fragmentshave, on average, A.94 and the heavier ones have A.140. The stable nucleus with A594 is 40Zr94 and thestable A5140 nucleus is 58Ce140. These two nuclei to-gether have 98 protons and 136 neutrons, while the ini-tial fragments, as seen from the equation above, have 92protons and 142 neutrons. To reach stability, therefore,on average 6 neutrons bound in the fragments have toundergo b decay, emitting the required 6 ne .
While the total number of ne’s is easy to estimate andcan be accurately determined given the known fissionyields, their energy spectrum, which is of primary inter-est for the oscillation searches discussed here, requiresmore care. In particular, the commonly used neutrinodetection reaction, the inverse neutron b decay, has athreshold of ;1.8 MeV. Only about 1.5 ne/fission (i.e.,;25%) of the total are above that threshold and hencecan be detected.
The existence of the 1.8-MeV threshold in the detec-tion process ne1p→n1e1 automatically ensures thatonly ne’s from large-Q-valued, and hence short-half-life,b decays are detected. Thus the observed ne signaltracks closely in time the power excursions in the reac-tor. This is of some practical importance, as large quan-tities of spent fuel are usually stored on site by reactoroperators. There is no need to track the inventory ofspent fuel and to worry about the b decays of theneutron-activated reactor materials, which typicallyhave a low Q value and therefore long-half-life prod-ucts. In practice, after a few hours from reactor turnon/off, the detectable ne flux can be considered satu-rated.
B. Fission-rate determination
The four isotopes whose fission is the source of virtu-ally all the reactor power are 235U, 238U, 239Pu, and241Pu. The fission rates deriving from their evolutionduring a typical fuel cycle in one of the Palo Verde re-actors is shown in Fig. 6, as calculated by a core simula-
FIG. 5. Yields (in %) for 235U thermal neutron fission (nor-malized to 200% for the two fragments).
Rev. Mod. Phys., Vol. 74, No. 2, April 2002
tion program (Miller, 2000). For comparison, we alsoshow the evolution of 240Pu and 242Pu, which give thenext-to-leading contributions. The contribution of theseisotopes is of order 0.1% or less and will not be consid-ered further.
Each isotope produces a unique neutrino spectrumthrough the decay of its fission fragments and theirdaughters, so plutonium breeding results in a small butnoticeable change in the emitted neutrino spectrum.
Two types of uncertainties can be attributed to theisotope compositions described in Fig. 6: errors derivingfrom uncertainties in the initial fuel composition and inthe measurement of the plant parameters that are usedas input to the simulation, and errors due to imperfectcore and neutronics modeling by the simulation programitself. The errors intrinsic to the simulation are known tocontribute substantially less than 1% to the neutrinoyield from tests in which fuel is sampled and analyzedfor isotopic composition at the end of a fuel cycle.
The correlation between the ne yield and the plantparameters used as input to the simulation is shown inFig. 7. Apart from the obvious correlation with the ther-mal power, other parameters enter the simulation be-cause they affect the criticality by altering the neutrontransport in the core (generally by the water density andboron absorber concentration). We see that for the pa-rameter with largest correlation besides power, the wa-ter temperature in the cold legs, an error of 10% pro-duces an uncertainty of only 0.15% in the ne yield. Ofcourse the inlet temperature is known to much betterthan 10%.
Economic and safety reasons provide plant operatorswith an incentive for measuring the thermal power ofthe reactors accurately. Indeed, usually more than onemethod is used and the results are compared to under-stand the size of the uncertainties. Calorimetric methods
FIG. 6. Time evolution of fission rates for each of the six mostimportant isotopes in one of the Palo Verde reactor cores. Thehorizontal scale covers a full fuel cycle, at the end of whichabout 1/3 of the core is replaced with fresh fuel. Only the fourmost important isotopes are normally used to predict ne yields.

305Bemporad, Gratta, and Vogel: Reactor-based neutrino oscillation experiments
(simultaneous measurement of temperature and flowrate of the water outlet in the secondary cooling loop)give the smallest error (;0.6–0.7 % at CHOOZ andPALO VERDE) and are used as a primary power esti-mate.
C. From fission rates to the ne spectra
The instantaneous fission rates of the four isotopes235U, 238U, 239Pu, and 241Pu found above are then usedas an input for the evaluation of the ne spectrum. For allbut 238U, careful measurements of the b spectrum fromfission by thermal neutrons were performed (Schrecken-bach et al., 1985; Hahn et al., 1989). These are convertedto neutrino spectra as explained below. However,Schreckenbach et al. and Hahn et al. do not include238U, which undergoes only fast neutron fission andhence was not accessible to such measurements.
There are, at present, several methods available forevaluating the ne spectrum. For the ne’s associated with235U, 239Pu, and 241Pu, which undergo thermal neutronfission, it is customary to use a hybrid method, based onthe conversion of the measured electron spectra associ-ated with the thermal neutron-induced fission into the nespectra. Clearly, the electron and ne originate from thesame b decay and share the available end-point energy.For a single branch the conversion is therefore trivial.However, in general there are many branches and manynuclei with different charges. For electron and an-tineutrino energies well above the electron mass, thetwo spectra are quite similar (Schreckenbach et al.,1985):
FIG. 7. Correlation between ne yield and the five most impor-tant inputs to the core simulation for a pressurized-water reac-tor. The numbers in the key are the slopes of the fitted lines. Inthe top panel four of the five lines are superimposed in a trendclose to slope zero. These four lines are separated in the ex-panded scale in the bottom panel. Note that a variation of even10% in any of the parameters but power has little effect on theoutput of the simulation.
Rev. Mod. Phys., Vol. 74, No. 2, April 2002
dN
dEe.
dN
dE ne
, (13)
where Ee5Ape21me
2 is the full electron energy, and theproportionality constant deviates from unity by at most5%. Naturally, one would like to convert the spectramore accurately.
Formally, the conversion can be performed exactly asfollows. Let n(E ,Z), assumed to be a continuous func-tion, describe the distribution of end points E andnuclear charges Z . The electron spectrum is then
Y~Ee!5EEe
`
dEn~E ,Z !k~E ,Z !pe
3Ee~E2Ee!2F~Ee ,Z !, (14)
where k(E ,Z) is the spectrum normalization constant,pe is the electron momentum, and F(Ee ,Z) is the Fermifunction describing the Coulomb effect on the emittedelectron. Provided that the electron spectrum Y(Ee) ismeasured, the end-point distribution can be determined,
n~E ,Z !521
2k~E ,Z !
d3
dE3 S Y~E !
pEF~E ,Z ! D . (15)
Once the distribution n(E ,Z) is known, the ne spectrumis readily calculated by the integral analogous to Eq.(14). In Davis et al. (1979) and Vogel et al. (1981) it wasshown that such a conversion procedure depends onlyvery weakly on the value of Z . In practice, an empiricalrelation Z(E) between the average Z and the electronenergy has been used (Schreckenbach et al., 1985): Z549.520.7E20.09E2, with E in MeV.
When using the measured electron spectra, the aboveexpressions, involving third derivatives, are obviouslyimpractical. Instead, the integral in Eq. (14) is replacedby a finite sum of 30 hypothetical beta-decay brancheswith branching ratios bi and equidistant end points E0
i ,
Y~Ee!5(i
bik~E0i ,Z !d~Ee ,E0
i !pe
3Ee~E0i 2Ee!2F~Ee ,Z !, (16)
where d(Ee ,E0i ) describes the small outer radiative cor-
rections. One can now begin with the largest value of E0i
(only one branch) and determine the correspondingbranching ratio bi using the electrons of energies be-tween that E0
i and the next smaller one, and continue inthis fashion step by step until the smallest E0
i is reached.Possible variations in the number and distribution of theend points E0
i affect the resulting ne spectrum by nomore than 1% (see Schreckenbach et al., 1985). Havingdetermined the set bi ,E0
i , it is straightforward to obtain
Y~E ne!5(
ibik~E0
i ,Z !E ne
2 ~E02E ne!
3@~E02E ne!22me
2#1/2F~E02E ne,Z !, (17)
where the irrelevant radiative corrections were omitted.This is the procedure used in deriving the neutrino spec-

306 Bemporad, Gratta, and Vogel: Reactor-based neutrino oscillation experiments
tra associated with fission of 235U, 239Pu, and 241Pu,which account for about 90% of the reactor ne ’s.
The ne spectra in Davis et al. (1979), Vogel et al.(1981), Klapdor and Metzinger (1982a, 1982b), Schreck-enbach et al. (1985), and Hahn et al. (1989), are given astables. A somewhat less accurate, but easier-to-implement, analytical approximation is given by Vogeland Engel (1989). [The fit error to the total rate is about1.2% for 235U and only about 0.3% for 239Pu and 241Pu(Miller, 2000).]
For the ne associated with 238U fission, one has to usethe straightforward summation of the spectra of the ne’sfrom all individual b2 decays. Thus
dN
dE n5(
nYn~Z ,A ,t !(
ibn ,i~E0
i !P n~E n ,E0i ,Z !,
(18)
where Yn(Z ,A ,t) is the number of b decays per unittime of the fragment Z ,A after the fissioning materialhas been exposed to neutrons for a time t , and the labeln characterizes each fragment. For t larger than theb-decay lifetime of the fragment Z ,A , the quantity Ynconverges toward the cumulative fission yield and be-comes independent of t . Naturally, each fission fuel ischaracterized by a different set of yields Yn .
The quantities bn ,i(E0i ) in Eq. (18) are the branching
ratios for the ith branch with the maximal electron en-ergy (end-point energy) E0
i . The branching ratios arenormalized to unity.
Finally, the function P n(E n ,E0i ,Z) is the normalized
spectrum shape. It is usually assumed, here and in theconversion method explained above, that all relevant bdecays have the allowed shape,
P n~E n ,E0 ,Z !5k~E0 ,Z !E n2~E02E n !
3@~E02E n !22me2#1/2
3F~E02E n ,Z !. (19)
Equation (19) is a very good approximation in practiceand causes a totally negligible error.
The weakness of this method is the incomplete infor-mation on the end-point distribution and branching ra-tios of some fission fragments, in particular those withvery short lifetimes and high decay energies. These ‘‘un-known’’ decays contribute as much as 25% of the ne’s atenergies above 4 MeV. In practice, nuclear models areused to supplement the missing data. Examples of calcu-lations based on this method are those of Davis et al.(1979), Vogel et al. (1981), Klapdor and Metzinger(1982a, 1982b), and Tengblad et al. (1989). An exampleof an extension to lower ne energies, where the neutronactivation of the reactor materials plays a role, is givenby Kopeikin, Mikaelyan, and Sinev (1997).
While the summation method played an importantrole in early oscillation searches, at present it is neededonly for the description of the ne from 238U fission aspointed out above. That component contributes onlyabout 11% to the neutrino signal. We show below that
Rev. Mod. Phys., Vol. 74, No. 2, April 2002
the error associated with the summation method is lessthan 10% and hence it contributes less than 1% to theoverall uncertainty.
The ultimate check of the accuracy of the predictionoutlined above consists in comparing the results in termsof ne energy spectrum with the measurements per-formed in short-baseline reactor oscillation experiments.
D. From ne to positrons
Since in all reactor experiments one measures the pos-itron spectra, and not the ne spectra directly, one has tounderstand quantitatively how these are related. Inother words, one has to know the cross section of the‘‘detector’’ reaction ne1p→e11n .
The total cross section for this reaction, neglectingterms of order En /M , is given by the standard formula
s tot(0)5s0~f213g2!Ee
(0)pe(0)
50.0952S Ee(0)pe
(0)
1 MeV2 D 310242 cm2, (20)
where Ee(0)5En2(Mn2Mp) is the positron energy
when the (small) neutron recoil is neglected, and pe(0) is
the corresponding momentum. The vector and axial-vector coupling constants are f51, g51.26, and
s05GF
2 cos2 uC
p~11D inner
R !, (21)
where the energy-independent inner radiative correc-tions are D inner
R .0.024.The cross section can be expressed in terms of the
neutron lifetime and the phase-space factor fp .s .R
51.7152 (Wilkinson, 1982) as
s tot(0)5
2p2/me5
fp .s .R tn
Ee(0)pe
(0) . (22)
In this way, the cross section is tied directly to the neu-tron lifetime tn , known to 0.2% (Groom et al., 2000); noknowledge of GF , f/g , or the Cabibbo angle uC is in factneeded.
The (small) energy-dependent outer radiative correc-tions to s tot are given by Vogel (1984a) and Fayans(1985). The corrections to the cross section of orderEn /M , which are not negligible even for the reactor en-ergies, and the angular distribution of the positrons aredescribed by Vogel and Beacom (1999). The exactthreshold of the reaction is
Enthr5
~Mn1me!22Mp2
2Mp51.806 MeV (23)
instead of just Mn1me2Mp51.804 MeV when the re-coil is neglected.
Using the results of Vogel and Beacom (1999), onecan evaluate the total cross section as well as the quan-tity ^cos ue& that characterizes the positron angular dis-tribution essentially exactly. These quantities are shownin Fig. 8. The high-energy extension of the total anddifferential cross section has already been discussed in

307Bemporad, Gratta, and Vogel: Reactor-based neutrino oscillation experiments
the classic paper by Llewellyn-Smith (1972). Near thethreshold, however, that treatment must be modified asshown by Vogel and Beacom (1999).
The positron angular distribution, characterized by^cos ue&, is rarely accessible. It is of interest, however, toconsider the angular distribution of the recoil neutronsthat are also detected. Since in the laboratory system theproton is at rest, the neutron is initially emitted at aforward angle restricted by
cos~un!max5A2EnD2~D22me
2!
En, (24)
where D5Mn2Mp;1.3 MeV. The average ^cos(un)& isconsiderably closer to unity than cos(un)max (Vogel andBeacom, 1999).
It is often possible to localize the points where thepositron was created and where the neutron was cap-tured, and even though the neutron undergoes manyelastic scatterings before capture, its final position main-tains some memory of its original direction. Simulationsindicate that the typical displacement of the two verticesis ^x&;1.5 cm in the organic scintillator. In fact, in pre-vious reactor experiments (Zacek, 1984; Zacek et al.,1986; Achkar, 1992; Achkar et al., 1995) the neutron dis-placement was clearly observed, in the Goesgen experi-ment in particular, at .10s level. The same effect wasalso observed at PALO VERDE. Moreover, the single-vessel CHOOZ experiment was able to measure the av-erage neutron-positron separation and to base on it adetermination of the ne incoming direction with an un-certainty of .8° (Apollonio et al., 2000).
Given a reliable simulation of the neutron transport,this asymmetry allows, albeit with large errors, a directmeasurement of the detector background. In the case ofne detection from a future supernova, this techniquemay provide, as shown by Apollonio et al. (2000), a
FIG. 8. ne1p→n1e1 reaction: Upper panel, total cross sec-tion; bottom panel, ^cos u& as a function of the antineutrinoenergy; solid lines, O(1/Mn) result; dashed lines, O(1) result[Eq. (20)].
Rev. Mod. Phys., Vol. 74, No. 2, April 2002
crude but useful determination of the direction to the nesource, i.e., of the star position.
E. Accuracy of the flux and spectrum predictions
Once the cross section and ne spectra are known, thecorresponding positron yield is easily evaluated. In reac-tor experiments, the neutron recoil is quite small (10–50keV), and thus the positron energy is simply related tothe incoming ne energy,
En.~Ee1D!F11Ee
MpG1
D22me2
Mp, (25)
where, as before, D5Mn2Mp , and cos ue50 is used as agood approximation of the average ^cos ue&. We notehere that possible detector efficiency dependence on thepositron energy requires special care.
In order to check the accuracy of the prediction, onehas to compare the results, in terms of the ne energyspectrum and total flux normalization, with the measure-ments performed in short-baseline reactor oscillation ex-periments. Since such experiments have not reportedthe observation of oscillations, we can assume that theirmeasurements represent the direct determination of thereactor spectrum at production. There are four factorsneeded for the evaluation of the expected positron yieldand spectrum: the distance to each core, the number oftarget protons, the cross section for ne1p→n1e1, andof course the quantity one wants to test, the ne spectrumat the source.
The distance to the reactors is trivially obtained withnegligible uncertainty. Determining the number of pro-tons in the target requires knowledge of the chemicalcomposition and mass of both scintillator and other pos-sible detector materials in which ne’s can be capturedand recorded with finite efficiency. Typically errorssmaller than 1% are achievable for this parameter. Thecross section was discussed in the previous subsection,and its uncertainty is also less than 1%. Finally, the nespectrum is the object of the test.
The ne flux normalization alone was tested by theBugey 4 experiment (Declais et al., 1994), in which thetotal neutron yield was measured with high statistics.The experimental accuracy of neutrino flux was 1.4%,compared with an accuracy of 2.7% of the expected flux.The Bugey 4 experimental result therefore agrees withexpectations based on the known neutron lifetime at the3% level. It is interesting to note that the same experi-ment was performed previously, with the same detector,at the Rovno reactor (Kuvshinnikov, 1990).
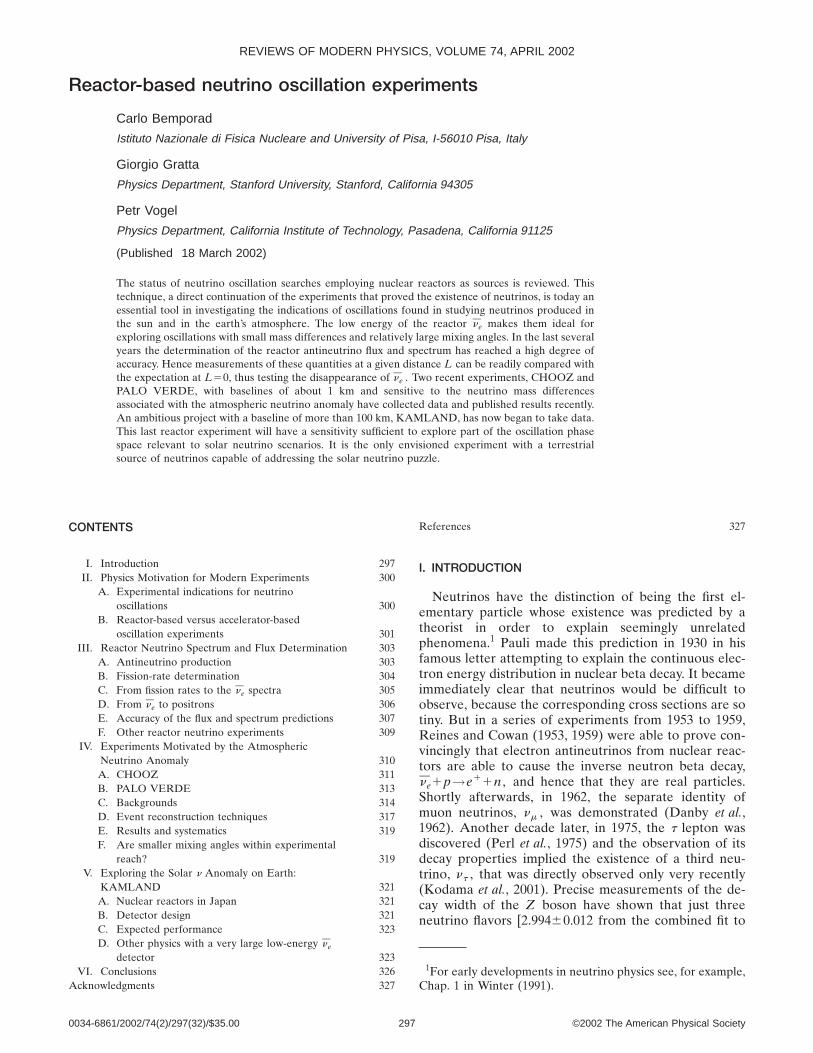
The validity of the tests performed at short distancesfrom a reactor is reinforced by the fact that some of theexperiments such as Goesgen (Zacek et al., 1986) orBugey (Achkar et al., 1995, 1996) observed no differencebetween spectra measured at different baselines. This isshown for Goesgen in Fig. 9. Moreover, the relativelyrecent Bugey 3 measurements were performed at a dis-tance of 15, 40, and 95 m from the core and recordedvery high statistics (some 1.53105 ne events at theshorter distances).
308 Bemporad, Gratta, and Vogel: Reactor-based neutrino oscillation experiments
The good agreement between the Bugey 3 data andthe nonoscillation predictions is shown in Fig. 10. Inpanel (a) the prediction is generated purely from theory.Of more practical importance is panel (b), where theprediction is derived from b spectra (except for 238U, for
FIG. 9. Positron spectrum observed by the Goesgen experi-ment for three different baselines (Zacek, 1984): upper lines,fits to the data; lower lines, predictions obtained as describedin the text, using the measurements of Schreckenbach et al.,1985, and Hahn et al., 1989, for 235U, 239Pu, and 241Pu andtheoretical calculations for 238U.
FIG. 10. Ratio between Bugey 3 measurements and differentpredictions: (a) comparison of the measurements to the a pri-ori calculations of Klapdor and Metzinger (1982a, 1982b); (b)comparison of Bugey 3 data to the prediction obtained usingthe b spectra measurements of Schreckenbach et al. (1985) andHahn et al. (1989), and the calculation mentioned for 238U.The dotted envelopes are estimates of the overall systematics.Adapted from Achkar et al. (1996).
Rev. Mod. Phys., Vol. 74, No. 2, April 2002
which theory is used). In this case a fit to a horizontalline gives a level of 0.99 with x2/DOF (degree offreedom) 59.2/11.
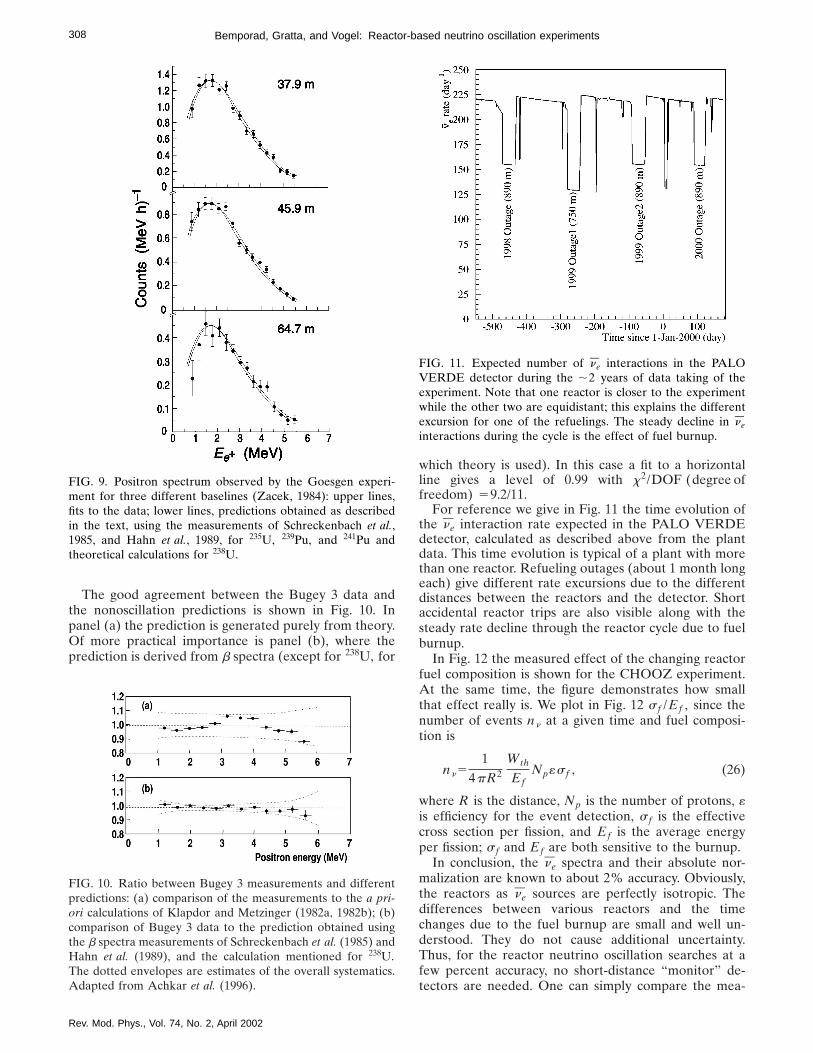
For reference we give in Fig. 11 the time evolution ofthe ne interaction rate expected in the PALO VERDEdetector, calculated as described above from the plantdata. This time evolution is typical of a plant with morethan one reactor. Refueling outages (about 1 month longeach) give different rate excursions due to the differentdistances between the reactors and the detector. Shortaccidental reactor trips are also visible along with thesteady rate decline through the reactor cycle due to fuelburnup.
In Fig. 12 the measured effect of the changing reactorfuel composition is shown for the CHOOZ experiment.At the same time, the figure demonstrates how smallthat effect really is. We plot in Fig. 12 s f /Ef , since thenumber of events nn at a given time and fuel composi-tion is
nn51
4pR2
Wth
EfNp«s f , (26)
where R is the distance, Np is the number of protons, «is efficiency for the event detection, s f is the effectivecross section per fission, and Ef is the average energyper fission; s f and Ef are both sensitive to the burnup.
In conclusion, the ne spectra and their absolute nor-malization are known to about 2% accuracy. Obviously,the reactors as ne sources are perfectly isotropic. Thedifferences between various reactors and the timechanges due to the fuel burnup are small and well un-derstood. They do not cause additional uncertainty.Thus, for the reactor neutrino oscillation searches at afew percent accuracy, no short-distance ‘‘monitor’’ de-tectors are needed. One can simply compare the mea-
FIG. 11. Expected number of ne interactions in the PALOVERDE detector during the ;2 years of data taking of theexperiment. Note that one reactor is closer to the experimentwhile the other two are equidistant; this explains the differentexcursion for one of the refuelings. The steady decline in ne
interactions during the cycle is the effect of fuel burnup.

309Bemporad, Gratta, and Vogel: Reactor-based neutrino oscillation experiments
sured positron spectra at the distance L to the expecta-tion at the source (L50).
F. Other reactor neutrino experiments
We shall only briefly mention here other experimentswith reactor ne’s that are of importance as a potentialsource of information about intrinsic neutrino proper-ties. Besides protons, two targets have been extensivelystudied: deuterons and electrons.
Reactor ne’s can cause deuteron disintegration by tworeaction channels, the charged current
ne1d→e11n1n , (27)
with a threshold of 4.03 MeV (Mn1me2Mp1B),where B is the deuteron binding energy, and the neutralcurrent
ne1d→ ne1p1n , (28)
with a lower threshold of B52.23 MeV. The cross sec-tions of these reactions, averaged over the reactor nespectrum, are ;1.1310244 cm2/fission for the chargedcurrent, and ;3.1310244 cm2/fission for the neutral cur-rent (see, for example, Davis et al., 1979 and Vogel et al.,1981). These are more than an order of magnitudesmaller than for the reaction on the proton target. (Thecross section is expressed ‘‘per fission’’ because the fis-sion rate is more directly related to the reactor powerthan the ne flux.)
FIG. 12. The measured ne event rate at CHOOZ, expressed asthe cross section per fission divided by the energy per fission(see text for explanation), as a function of the reactor burnupb (in units of MW3days per ton), i.e., the accumulated reactorpower per unit mass of fuel. The fits to the expected rate,which includes the reactor burnup, and to the flat rate, wherethe burnup is neglected, are also shown. Adapted from Nicolo(1999).
Rev. Mod. Phys., Vol. 74, No. 2, April 2002
The study of the ne1d reactions was pioneered byReines and collaborators (Pasierb et al., 1979; Reineset al., 1980), who observed the corresponding two- orone-neutron captures. From the point of view of neu-trino oscillations, the ratio of the charged- and neutral-current rates is potentially useful, since the charged cur-rent is flavor sensitive and the neutral current is not (thesame idea is being pursued in the case of solar neutrinosby the SNO Collaboration). More recent experiments(Riley et al., 1999; Kozlov et al., 2000) show no indica-tion of oscillations, as expected given the short distancefrom the reactor.
The other reaction observed with reactor ne’s is thescattering on electrons,
ne1e→ ne1e , (29)
where the spectrum of the recoil electrons (originallyassumed to be at rest in the laboratory, since the elec-tron momentum associated with the atomic binding isusually negligible) is observed. Obviously, the reactionsignature, just the recoiling electron, is quite difficult todistinguish from background caused by radioactivity,making the observation of the ne2e scattering verychallenging.
The cross section for ne2e scattering consists of thewell-understood weak-interaction part and a so far un-observed incoherent electromagnetic part:
ds
dT5
GF2 me
2p F ~f1g !21~f2g !23S 12T
EnD 2
1~g22f2!meT
En2 G1
pa2mn2
me2
12T/En
T, (30)
where T is the kinetic energy of the recoiling electron.The terms proportional to GF
2 , weak scattering, repre-sent the sum of coherent (interfering) contributionsfrom charged and neutral currents, while the secondpart, proportional to a2, can be described as due to afinite neutrino magnetic moment mn . Only massive neu-trinos can have magnetic moments, and hence the studyof this reaction, and the possible determination of mn
2 , isof great interest.
Again, pioneering results were obtained by Reinesand collaborators (Reines, Gurr, and Sobel, 1976). Morerecently, limits on mn
2 with reactor neutrinos, albeit witha rather poor signal-to-noise ratio, were obtained byDerbin et al. (1993). At present a slightly more stringentdirect limit of mn<1.6310210mB comes not from the re-actor neutrinos, but from the analysis (Beacom and Vo-gel, 1999) of the shape of the Super-Kamiokande solarneutrino data (Y. Fukuda et al., 1999). A new effort toimprove the sensitivity to mn
2 is currently underway(Amsler et al., 1997) at the Bugey reactor Magnetic Mo-ment of the Neutrino (MUNU) experiment.
Finally, the search for neutrino decay also providesinformation about neutrino mass and mixing. Indeed, ifneutrinos have a mass and are mixed, the heavier onescan and will decay into the lighter ones. Heavy neutri-

310 Bemporad, Gratta, and Vogel: Reactor-based neutrino oscillation experiments
nos, if they exist, must decay sufficiently rapidly not tooverclose the universe (see, for example, Raffelt, 1995).
Two decay modes in particular have been studied withreactor neutrinos, the radiative decay
n2→n11g , (31)
with no threshold (except that m2.m1), and the decay
n2→n11e11e2, (32)
possible only if mn22mn1
.2me . The Review of ParticlePhysics (Groom et al., 2000) lists the most recent resultsof the searches for these and other decay modes. In par-ticular, various limits (often stringent) based on astro-physics are listed there.
In the standard model, radiative decay has a very longlifetime, much longer than the age of the universe. Butalternative models, such as those with right-handedweak interactions, often allow faster decays. Hence aprogram of searching for neutrino decay has been a partof the study of reactor neutrinos. The first results wereobtained again by Reines and collaborators (Reines, So-bel, and Gurr, 1974). More restrictive limits werereached by Vogel (1984b) and by Oberauer and vonFeilitzsch (1987). Bouchez et al. (1988) searched in par-ticular for photons in the visible energy range, givingthem high sensitivity to small Dm/m values. A morerecent search was performed by Schoenert et al., 1996.
The heavy-neutrino decay mode into the e11e2 pairplus a light neutrino will dominate the total decay rateabove its threshold, since it results from a simple W ex-change; there is no Glashow-Iliopoulos-Maiani suppres-sion as in the radiative mode. To observe this decaymode with reactor neutrinos, it would be necessary thatheavy neutrinos exist and that they couple to electrons.Thus the decay rate would contain the mixing amplitudeuUe2u4. For a given mass m2 of the heavy neutrino, onecould then find a limit on the mixing amplitude uUe2u2.The most stringent limits obtained to data with reactorneutrinos were those found Hagner et al. (1995).
IV. EXPERIMENTS MOTIVATED BY THE ATMOSPHERICNEUTRINO ANOMALY
Two experiments have been built with the specific pur-pose of testing the hypothesis that neutrino oscillationsoccur with the parameters found by the atmosphericneutrino measurements. Both experiments are nowcompleted. All CHOOZ data were published by Apol-lonio et al. (1998, 1999), and Nicolo (1999). Data-takingat PALO VERDE was completed in the summer of2000, and the results were published by Boehm et al.(2000a, 2000b, 2001) and Miller (2000).
As can be seen from Fig. 3, in order to access Dm2
'1023 eV2 with reactor neutrinos, a baseline of order 1km and a mass in excess of a few tons are needed. In-deed, the backgrounds from cosmic radiation and natu-ral radioactivity are a major consideration in the designof such large, low-energy detectors, and different back-ground situations led the two groups to rather differentdesigns.
Rev. Mod. Phys., Vol. 74, No. 2, April 2002
The CHOOZ detector was built in a preexisting un-derground cavity under a .100-m rock overburden.300 mwe (meter of water equivalent). This substantialcosmic radiation shielding allowed the use of a homoge-neous detector in which inverse-b events were tagged asa double (delayed) coincidence between the e1
(prompt) signal and the n (delayed) signal. Such asimple event signature can be identified with high effi-ciency, so that a 5-ton active mass was sufficient for theexperiment.
The PALO VERDE detector, on the other hand, waslocated in an underground bunker excavated for thepurpose. Economic considerations limited the overbur-den to 12 m (.32 mwe), sufficient only to eliminate thehadronic component of the cosmic radiation and reducethe muon flux by a factor of five. The rather large re-maining muon flux produced a substantial number ofsecondary neutrons, so that a segmented detector wasneeded to take full advantage of the triple coincidencegiven by the e1 ionization and subsequent g’s from an-nihilation. This more elaborate topological signature re-duced the detector efficiency and pushed the fiducialmass to 12 tons. Both detectors were built with materialsselected for low radioactivity and included a passive gand neutron shield and an active cosmic-ray vetocounter.
While the three-reactor plant of PALO VERDE has athermal power of 11.6 GWth , the two reactors ofCHOOZ produce 8.5 GWth . More importantly, theCHOOZ reactors were commissioned only after thestart of data taking at the experiment. This gave thecollaboration the unusual opportunity to observe thebackgrounds at reactor-off for a substantial period andduring the slow ramp-up of power. The more stable op-erating conditions of PALO VERDE, with the periodic;2/3 power excursions shown in Fig. 11, made the taskof understanding and subtracting backgrounds morechallenging. At the same time the methods developed inthis context will have universal value in future experi-ments that will likely encounter similar steady-state con-ditions.
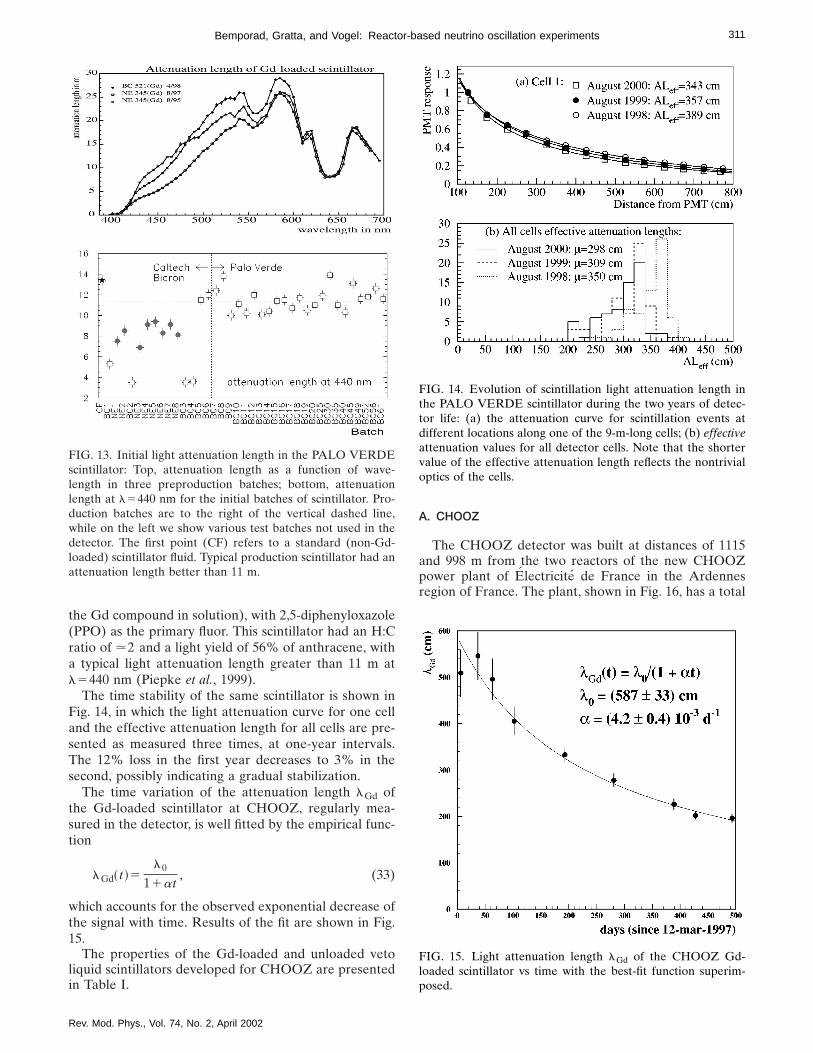
Both detectors used liquid scintillators loaded with0.1% natural gadolinium, which has a high thermal neu-tron capture cross section and releases a large amount ofenergy in the capture. In this way the neutron capturetime is reduced to ;27 ms from ;170 ms for the un-loaded scintillator, proportionally reducing the uncorre-lated background. Furthermore, Gd deexcitation afterthe capture releases an 8-MeV g cascade, whosesummed energy gives a robust event tag well abovenatural radioactivity. In contrast, neutron capture onprotons results in only a single 2.2-MeV g. While the Gdloading offers obvious advantages in suppressing back-grounds, it is not easy to achieve in the stable and suffi-ciently transparent form needed for a large detector.Both groups invested substantial resources in scintillatordevelopment. In Fig. 13 we show initial attenuationlength data for the PALO VERDE scintillator, whichwas a cocktail of 60% mineral oil, 36% pseudocumene(1,2,4-trimethylbenzene), and 4% alcohol (used to keep
311Bemporad, Gratta, and Vogel: Reactor-based neutrino oscillation experiments
the Gd compound in solution), with 2,5-diphenyloxazole(PPO) as the primary fluor. This scintillator had an H:Cratio of .2 and a light yield of 56% of anthracene, witha typical light attenuation length greater than 11 m atl5440 nm (Piepke et al., 1999).
The time stability of the same scintillator is shown inFig. 14, in which the light attenuation curve for one celland the effective attenuation length for all cells are pre-sented as measured three times, at one-year intervals.The 12% loss in the first year decreases to 3% in thesecond, possibly indicating a gradual stabilization.
The time variation of the attenuation length lGd ofthe Gd-loaded scintillator at CHOOZ, regularly mea-sured in the detector, is well fitted by the empirical func-tion
lGd~ t !5l0
11at, (33)
which accounts for the observed exponential decrease ofthe signal with time. Results of the fit are shown in Fig.15.
The properties of the Gd-loaded and unloaded vetoliquid scintillators developed for CHOOZ are presentedin Table I.
FIG. 13. Initial light attenuation length in the PALO VERDEscintillator: Top, attenuation length as a function of wave-length in three preproduction batches; bottom, attenuationlength at l5440 nm for the initial batches of scintillator. Pro-duction batches are to the right of the vertical dashed line,while on the left we show various test batches not used in thedetector. The first point (CF) refers to a standard (non-Gd-loaded) scintillator fluid. Typical production scintillator had anattenuation length better than 11 m.
Rev. Mod. Phys., Vol. 74, No. 2, April 2002
A. CHOOZ
The CHOOZ detector was built at distances of 1115and 998 m from the two reactors of the new CHOOZpower plant of Electricite de France in the Ardennesregion of France. The plant, shown in Fig. 16, has a total
FIG. 14. Evolution of scintillation light attenuation length inthe PALO VERDE scintillator during the two years of detec-tor life: (a) the attenuation curve for scintillation events atdifferent locations along one of the 9-m-long cells; (b) effectiveattenuation values for all detector cells. Note that the shortervalue of the effective attenuation length reflects the nontrivialoptics of the cells.
FIG. 15. Light attenuation length lGd of the CHOOZ Gd-loaded scintillator vs time with the best-fit function superim-posed.
312 Bemporad, Gratta, and Vogel: Reactor-based neutrino oscillation experiments
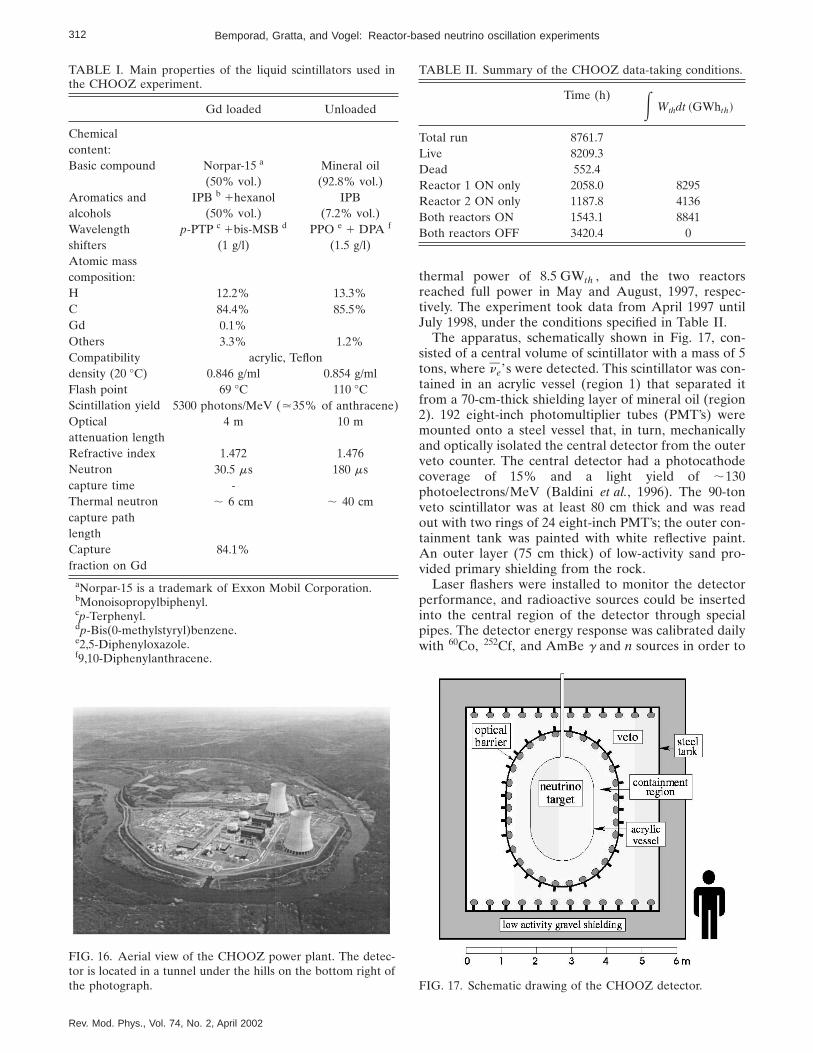
FIG. 16. Aerial view of the CHOOZ power plant. The detec-tor is located in a tunnel under the hills on the bottom right ofthe photograph.
TABLE I. Main properties of the liquid scintillators used inthe CHOOZ experiment.
Gd loaded Unloaded
Chemicalcontent:Basic compound Norpar-15 a Mineral oil
(50% vol.) (92.8% vol.)Aromatics and IPB b 1hexanol IPBalcohols (50% vol.) (7.2% vol.)Wavelength p-PTP c 1bis-MSB d PPO e 1 DPA f
shifters (1 g/l) (1.5 g/l)Atomic masscomposition:H 12.2% 13.3%C 84.4% 85.5%Gd 0.1%Others 3.3% 1.2%Compatibility acrylic, Teflondensity (20 °C) 0.846 g/ml 0.854 g/mlFlash point 69 °C 110 °CScintillation yield 5300 photons/MeV (.35% of anthracene)Optical 4 m 10 mattenuation lengthRefractive index 1.472 1.476Neutron 30.5 ms 180 mscapture time -Thermal neutron ; 6 cm ; 40 cmcapture pathlengthCapture 84.1%fraction on Gd
aNorpar-15 is a trademark of Exxon Mobil Corporation.bMonoisopropylbiphenyl.cp-Terphenyl.dp-Bis(0-methylstyryl)benzene.e2,5-Diphenyloxazole.f9,10-Diphenylanthracene.
Rev. Mod. Phys., Vol. 74, No. 2, April 2002
thermal power of 8.5 GWth , and the two reactorsreached full power in May and August, 1997, respec-tively. The experiment took data from April 1997 untilJuly 1998, under the conditions specified in Table II.
The apparatus, schematically shown in Fig. 17, con-sisted of a central volume of scintillator with a mass of 5tons, where ne’s were detected. This scintillator was con-tained in an acrylic vessel (region 1) that separated itfrom a 70-cm-thick shielding layer of mineral oil (region2). 192 eight-inch photomultiplier tubes (PMT’s) weremounted onto a steel vessel that, in turn, mechanicallyand optically isolated the central detector from the outerveto counter. The central detector had a photocathodecoverage of 15% and a light yield of ;130photoelectrons/MeV (Baldini et al., 1996). The 90-tonveto scintillator was at least 80 cm thick and was readout with two rings of 24 eight-inch PMT’s; the outer con-tainment tank was painted with white reflective paint.An outer layer (75 cm thick) of low-activity sand pro-vided primary shielding from the rock.
Laser flashers were installed to monitor the detectorperformance, and radioactive sources could be insertedinto the central region of the detector through specialpipes. The detector energy response was calibrated dailywith 60Co, 252Cf, and AmBe g and n sources in order to
FIG. 17. Schematic drawing of the CHOOZ detector.
TABLE II. Summary of the CHOOZ data-taking conditions.
Time (h) E Wthdt ~GWhth!
Total run 8761.7Live 8209.3Dead 552.4Reactor 1 ON only 2058.0 8295Reactor 2 ON only 1187.8 4136Both reactors ON 1543.1 8841Both reactors OFF 3420.4 0

313Bemporad, Gratta, and Vogel: Reactor-based neutrino oscillation experiments
track the aging of the scintillator, the detector efficiency,and the energy calibration.
As an example we show in Fig. 18 the results of a Cfcalibration run with the source placed in the middle ofthe detector. The data are compared with a Monte Carlosimulation for the reconstruction of the x , y , and z po-sitions and total energy in the detector. Both the peaksfor n captures on p (2.2 MeV) and Gd (8 MeV) areclearly visible. The very good energy resolution@s(E)/E55.6% at 8 MeV] allows one to verify that the8-MeV peak is in fact the superposition of a 7.77-MeVline with 77% weighting from capture on 157Gd (energyshifted from 7.94 MeV because of scintillator saturationeffects) and an 8.31-MeV line with 23% weighting fromcapture on 155Gd (energy shifted from 8.54 MeV). Thefit to these two Gaussians gives x2/DOF567.6/55, whilethe fit to a single Gaussian is very poor with x2/DOF5875/58. The position resolution was found to be sx5sy5sz517.5 cm.
B. PALO VERDE
The PALO VERDE experiment was built at the PaloVerde Nuclear Generating Station, the largest nuclearplant in the Americas, ;80 km west of Phoenix, in theArizona desert. The total thermal power from threeidentical pressurized-water reactors was 11.6 GWth .Two of the reactors were located 890 m from the detec-tor, while the third was at 750 m. The shallow under-ground bunker housing the detector is shown at the time
FIG. 18. Visible energy and position reconstructed for a cali-bration 252Cf source placed inside the CHOOZ detector: topleft, x position; top right, y position; bottom left, z position;bottom right, total energy. MC5Monte Carlo simulation.
Rev. Mod. Phys., Vol. 74, No. 2, April 2002
of construction in Fig. 19. In total 350.5 days of ne datawere collected at PALO VERDE in the period betweenOctober 1998 and July 2000, covering four scheduledrefueling outages as indicated in Fig. 11. Of these, 242.2days were at full power, while the reactor at 750 m wasoff for 21.8 days and the reactors at 890 m were off for86.5 days. Such data were complemented by frequentcalibration runs.
The fiducial mass, segmented for active backgroundrejection, consisted of 66 acrylic tanks filled with 0.1%Gd-loaded scintillator and arranged as shown in Fig. 20.Each cell was 9 m long, with a 12.7325.4-cm2 cross sec-tion, and was viewed by two 5-inch photomultipliertubes, one at each end. A ne is identified by space- andtime-correlated e1 and n signals. Positrons depositedtheir energy in a scintillator cell and annihilated, yield-ing two 511-keV g’s that, in general, would be detectedin different cells, giving a triple coincidence. Neutronsthermalized and were captured in Gd, giving a g-rayshower of 8 MeV total energy, also detected in morethan one cell. The central detector was surrounded by a1-m-thick water shield to moderate background neu-trons produced by muons outside the detector and toabsorb g’s from the laboratory walls. Outside of the wa-ter tanks were 32 large liquid scintillator counters andtwo endcaps to veto cosmic muons. The rate of cosmicmuons was approximately 2 kHz. The pattern of muonstraveling through veto counters and their timing relativeto the central detector hits were recorded for subse-quent off-line analysis. The central detector wasequipped with a system of tubes that allowed the inser-tion of calibration sources in the small spaces betweencells. In addition, a set of blue light-emitting diodes(LED’s) and optical fibers was used to produce flashes oflight inside each of the cells. In order to reduce naturalradioactivity, all building materials for the detector werecarefully selected, including the aggregate (marble) usedin the concrete of the underground laboratory.
Both the positron and the neutron were triggered by atriple coincidence requiring at least one cell above a
FIG. 19. The PALO VERDE underground laboratory at thetime of construction (fall 1996).

314 Bemporad, Gratta, and Vogel: Reactor-based neutrino oscillation experiments
‘‘high’’ threshold set at ;600 keV (positron ionization orneutron capture cascade) and two cells above a ‘‘low’’threshold set at ;40 keV (Compton scattering from an-nihilation photons or neutron capture cascade tails). Thetriple coincidences were required to be within 335 ma-trices of cells anywhere in the detector as recognized bya custom-made trigger processor (Gratta et al., 1997).
The efficiency calibration was based upon a primarymeasurement performed a few times per year with acalibrated 22Na e1 source and an AmBe neutron source.The 22Na source mimicked the effects of the positronfrom the ne interaction by providing annihilation radia-tion and a 1.275-MeV photon that simulated the e1 ion-ization in the scintillator. The source was placed at 18positions in the detector deemed to be representative ofdifferent conditions. The results of this procedure werethen rescaled to the e1 case using a Monte Carlo simu-lation. The neutron detection efficiency was measuredby scanning the detector with the AmBe source aftertagging the 4.4-MeV g associated with the neutron emis-sion with a miniaturized NaI(Tl) counter. Other calibra-tions, used to measure the detector energy response,were performed using the Compton edges from 137Cs,65Zn, and 228Th sources. The same Th source was alsoused more frequently to track the scintillator transpar-ency, as already shown in Fig. 14. Weekly runs of thefiber-optic and LED flasher systems were used to moni-tor the gain and linearity of photomultipliers and thetiming/position relationship along the cells, respectively.
Since the energy deposition of the 511-keV g’s in onecell has a sharply falling spectrum (Compton scattering),it was vital to have the lowest possible ‘‘low’’ thresholdsin the trigger and to understand the behavior of suchthresholds with great accuracy. This second task wascomplicated by the fact that the trigger used voltage am-plitudes, while only charge from integrating analog-to-digital converters (ADC’s) was available offline. For this
FIG. 20. Schematic view of the PALO VERDE neutrino de-tector.
Rev. Mod. Phys., Vol. 74, No. 2, April 2002
reason the detector simulation included a detailed de-scription of the signal development in time. This codecorrectly described the shape of pulses, taking into ac-count scintillator light yield, attenuation length, and de-excitation time; photomultiplier rise and fall time andgain; and event position along a cell. The simulation ofthe detector response to the 22Na source is shown in Fig.21 and correctly describes the 40-keV threshold positionto within 1.4 keV and the 600-keV threshold position towithin 2.6 keV, resulting in uncertainties on the positronand neutron efficiencies of 4% and 3%, respectively.
C. Backgrounds
There are generally two types of background affectinglong-baseline reactor experiments in which the signal isbased on the correlated e1, n signature: uncorrelatedhits from cosmic rays and natural radioactivity and cor-related ones from cosmic-m-induced neutrons. The firsttype can be measured by studying the time differencebetween positronlike and neutronlike parts of an event.More insidious are cosmic-m-induced neutrons thatpresent the same time and space correlation betweenprompt and delayed parts of the event as in ne . Suchevents are schematically shown in the PALO VERDEdetector in Fig. 22. Neutrons are produced by cosmic-mspallation and capture on the materials outside the vetocounter. Both production mechanisms can result in ei-ther neutron thermalization and capture, in which thethermalization process fakes the prompt triple coinci-dence, or secondary neutron production, in which one of
FIG. 21. A comparison of the trigger thresholds at PALOVERDE from data and a Monte Carlo simulation. The datawere taken with a 22Na source at the center of each cell. Thepanels (a) and (b) show the efficiency of the trigger thresholds(left, low; right, high) for a typical cell as a function of energydeposited; the bottom panels (c) and (d) show the energy at50% efficiency for (left) low and (right) high thresholds in all66 cells.
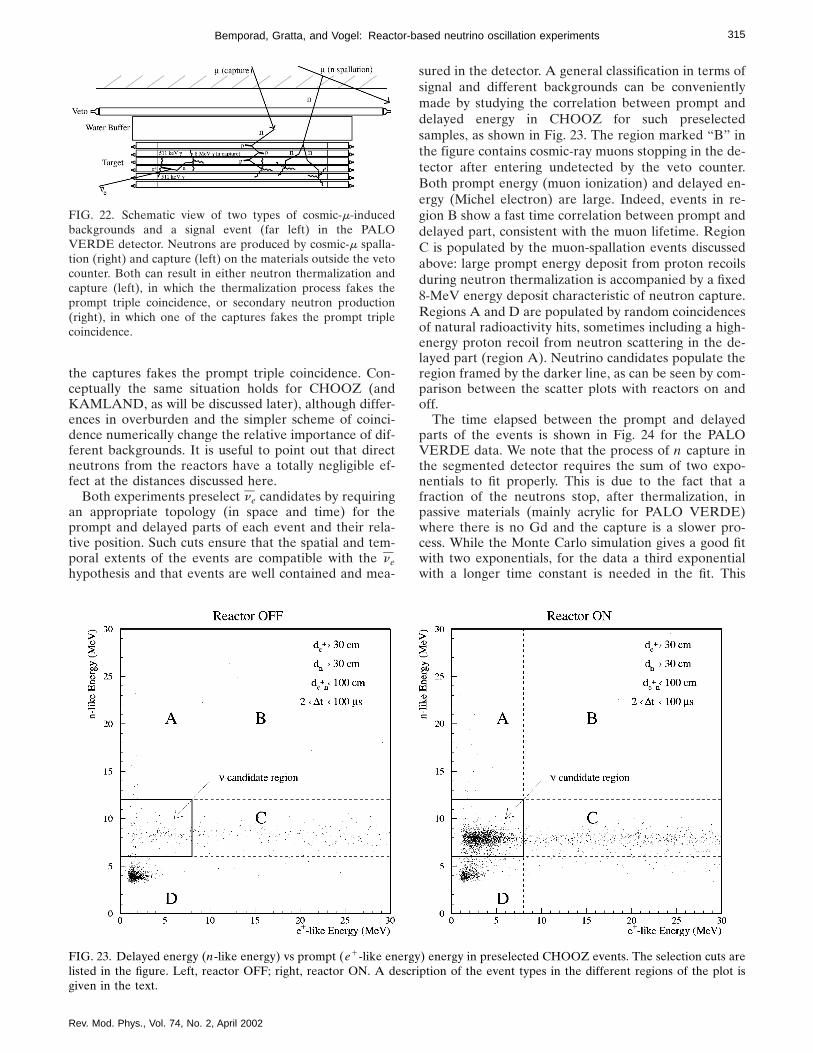
315Bemporad, Gratta, and Vogel: Reactor-based neutrino oscillation experiments
the captures fakes the prompt triple coincidence. Con-ceptually the same situation holds for CHOOZ (andKAMLAND, as will be discussed later), although differ-ences in overburden and the simpler scheme of coinci-dence numerically change the relative importance of dif-ferent backgrounds. It is useful to point out that directneutrons from the reactors have a totally negligible ef-fect at the distances discussed here.
Both experiments preselect ne candidates by requiringan appropriate topology (in space and time) for theprompt and delayed parts of each event and their rela-tive position. Such cuts ensure that the spatial and tem-poral extents of the events are compatible with the nehypothesis and that events are well contained and mea-
FIG. 22. Schematic view of two types of cosmic-m-inducedbackgrounds and a signal event (far left) in the PALOVERDE detector. Neutrons are produced by cosmic-m spalla-tion (right) and capture (left) on the materials outside the vetocounter. Both can result in either neutron thermalization andcapture (left), in which the thermalization process fakes theprompt triple coincidence, or secondary neutron production(right), in which one of the captures fakes the prompt triplecoincidence.
Rev. Mod. Phys., Vol. 74, No. 2, April 2002
sured in the detector. A general classification in terms ofsignal and different backgrounds can be convenientlymade by studying the correlation between prompt anddelayed energy in CHOOZ for such preselectedsamples, as shown in Fig. 23. The region marked ‘‘B’’ inthe figure contains cosmic-ray muons stopping in the de-tector after entering undetected by the veto counter.Both prompt energy (muon ionization) and delayed en-ergy (Michel electron) are large. Indeed, events in re-gion B show a fast time correlation between prompt anddelayed part, consistent with the muon lifetime. RegionC is populated by the muon-spallation events discussedabove: large prompt energy deposit from proton recoilsduring neutron thermalization is accompanied by a fixed8-MeV energy deposit characteristic of neutron capture.Regions A and D are populated by random coincidencesof natural radioactivity hits, sometimes including a high-energy proton recoil from neutron scattering in the de-layed part (region A). Neutrino candidates populate theregion framed by the darker line, as can be seen by com-parison between the scatter plots with reactors on andoff.
The time elapsed between the prompt and delayedparts of the events is shown in Fig. 24 for the PALOVERDE data. We note that the process of n capture inthe segmented detector requires the sum of two expo-nentials to fit properly. This is due to the fact that afraction of the neutrons stop, after thermalization, inpassive materials (mainly acrylic for PALO VERDE)where there is no Gd and the capture is a slower pro-cess. While the Monte Carlo simulation gives a good fitwith two exponentials, for the data a third exponentialwith a longer time constant is needed in the fit. This
FIG. 23. Delayed energy (n-like energy) vs prompt (e1-like energy) energy in preselected CHOOZ events. The selection cuts arelisted in the figure. Left, reactor OFF; right, reactor ON. A description of the event types in the different regions of the plot isgiven in the text.

316 Bemporad, Gratta, and Vogel: Reactor-based neutrino oscillation experiments
third exponential accounts for events initiated by uncor-related background, which arises when the delayed partis triggered by cosmic rays crossing the detector with a2-kHz rate. Timing cuts are applied by both experimentsto ensure that events are consistent with a neutron cap-ture. In addition events are rejected for a period of timefollowing tracks detected in the veto counters. This lastcut is particularly important at PALO VERDE, wherethe cosmic-ray rate is high.
The availability for CHOOZ of data at zero powerand with the reactors ramping up provides an indepen-dent way to check the magnitude of signal and back-
FIG. 24. Time elapsed between the prompt and delayed partsof events in PALO VERDE data (above) and a Monte Carlosimulation (below). The simulated data are fit to two exponen-tials. Real data are fit to three exponentials, the third of whichaccounts for the random background. For an explanation ofthe t1 and t2 values, see text.
Rev. Mod. Phys., Vol. 74, No. 2, April 2002
ground. The fitting procedure proceeds as follows. Foreach run the predicted number of neutrino candidatesNi results from the sum of a signal term, linearly de-pending on the reactor’s effective power W* and thebackground, assumed to be constant and independent ofpower;5 therefore,
Ni5~B1Wi* X !Dt i , (34)
where the index i labels the run number, Dt i is the cor-responding live time, B is the background rate, and X isthe positron yield per unit power averaged over the tworeactors.
The results are listed in Table III for three data-takingperiods corresponding to threshold readjustments. Thedata are also shown in compact form in Fig. 25.
A simple subtraction of the e1 spectra with reactor on
FIG. 25. CHOOZ ne rate during reactor commissioning. Thebackground at reactor OFF is 1.160.25 events/day.
TABLE III. Summary of the likelihood fit parameters for the three data-taking periods at CHOOZ.
Period 1 2 3
Starting date 7 April 1997 30 July 1997 12 January 1998Runs 579→1074 1082→1775 1778→2567Live time (h) 1831.3 2938.8 3268.4Reactor-off time (h) 38.9 539.5 2737.2
E Wdt ~GWh!7798 10636 2838
B (counts/d) 1.2560.6 1.2260.21 2.260.14X (counts/d GW) 2.6060.17 2.6060.09 2.5160.17x2/DOF 136/117 135/154 168/184Nn (counts/d)(at full power)
24.861.6 24.860.9 24.061.6
5The ‘‘effective’’ power W* is a fictitious thermal power corresponding to both reactors located at the reactor 1 site, and thusproviding 9.55 GW at full operating conditions and at the start of reactor operation.
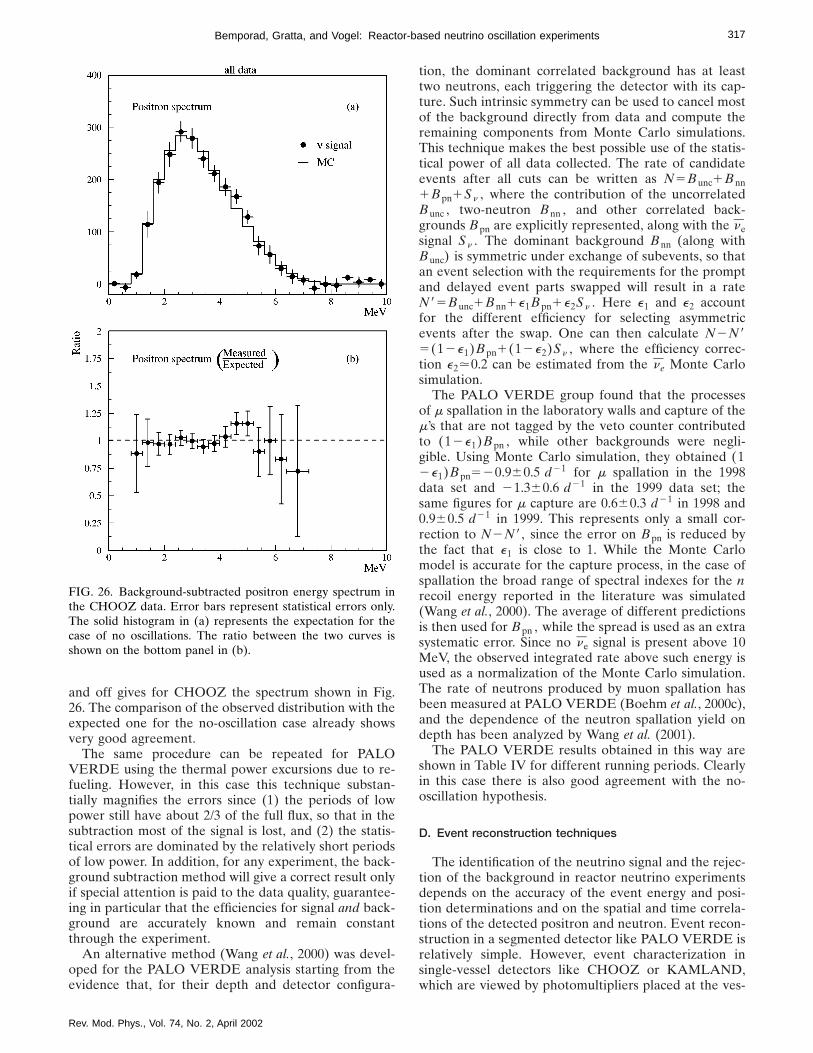
317Bemporad, Gratta, and Vogel: Reactor-based neutrino oscillation experiments
and off gives for CHOOZ the spectrum shown in Fig.26. The comparison of the observed distribution with theexpected one for the no-oscillation case already showsvery good agreement.
The same procedure can be repeated for PALOVERDE using the thermal power excursions due to re-fueling. However, in this case this technique substan-tially magnifies the errors since (1) the periods of lowpower still have about 2/3 of the full flux, so that in thesubtraction most of the signal is lost, and (2) the statis-tical errors are dominated by the relatively short periodsof low power. In addition, for any experiment, the back-ground subtraction method will give a correct result onlyif special attention is paid to the data quality, guarantee-ing in particular that the efficiencies for signal and back-ground are accurately known and remain constantthrough the experiment.
An alternative method (Wang et al., 2000) was devel-oped for the PALO VERDE analysis starting from theevidence that, for their depth and detector configura-
FIG. 26. Background-subtracted positron energy spectrum inthe CHOOZ data. Error bars represent statistical errors only.The solid histogram in (a) represents the expectation for thecase of no oscillations. The ratio between the two curves isshown on the bottom panel in (b).
Rev. Mod. Phys., Vol. 74, No. 2, April 2002
tion, the dominant correlated background has at leasttwo neutrons, each triggering the detector with its cap-ture. Such intrinsic symmetry can be used to cancel mostof the background directly from data and compute theremaining components from Monte Carlo simulations.This technique makes the best possible use of the statis-tical power of all data collected. The rate of candidateevents after all cuts can be written as N5Bunc1Bnn1Bpn1Sn , where the contribution of the uncorrelatedBunc , two-neutron Bnn , and other correlated back-grounds Bpn are explicitly represented, along with the nesignal Sn . The dominant background Bnn (along withBunc) is symmetric under exchange of subevents, so thatan event selection with the requirements for the promptand delayed event parts swapped will result in a rateN85Bunc1Bnn1e1Bpn1e2Sn . Here e1 and e2 accountfor the different efficiency for selecting asymmetricevents after the swap. One can then calculate N2N85(12e1)Bpn1(12e2)Sn , where the efficiency correc-tion e2.0.2 can be estimated from the ne Monte Carlosimulation.
The PALO VERDE group found that the processesof m spallation in the laboratory walls and capture of them’s that are not tagged by the veto counter contributedto (12e1)Bpn , while other backgrounds were negli-gible. Using Monte Carlo simulation, they obtained (12e1)Bpn520.960.5 d21 for m spallation in the 1998data set and 21.360.6 d21 in the 1999 data set; thesame figures for m capture are 0.660.3 d21 in 1998 and0.960.5 d21 in 1999. This represents only a small cor-rection to N2N8, since the error on Bpn is reduced bythe fact that e1 is close to 1. While the Monte Carlomodel is accurate for the capture process, in the case ofspallation the broad range of spectral indexes for the nrecoil energy reported in the literature was simulated(Wang et al., 2000). The average of different predictionsis then used for Bpn , while the spread is used as an extrasystematic error. Since no ne signal is present above 10MeV, the observed integrated rate above such energy isused as a normalization of the Monte Carlo simulation.The rate of neutrons produced by muon spallation hasbeen measured at PALO VERDE (Boehm et al., 2000c),and the dependence of the neutron spallation yield ondepth has been analyzed by Wang et al. (2001).
The PALO VERDE results obtained in this way areshown in Table IV for different running periods. Clearlyin this case there is also good agreement with the no-oscillation hypothesis.
D. Event reconstruction techniques
The identification of the neutrino signal and the rejec-tion of the background in reactor neutrino experimentsdepends on the accuracy of the event energy and posi-tion determinations and on the spatial and time correla-tions of the detected positron and neutron. Event recon-struction in a segmented detector like PALO VERDE isrelatively simple. However, event characterization insingle-vessel detectors like CHOOZ or KAMLAND,which are viewed by photomultipliers placed at the ves-
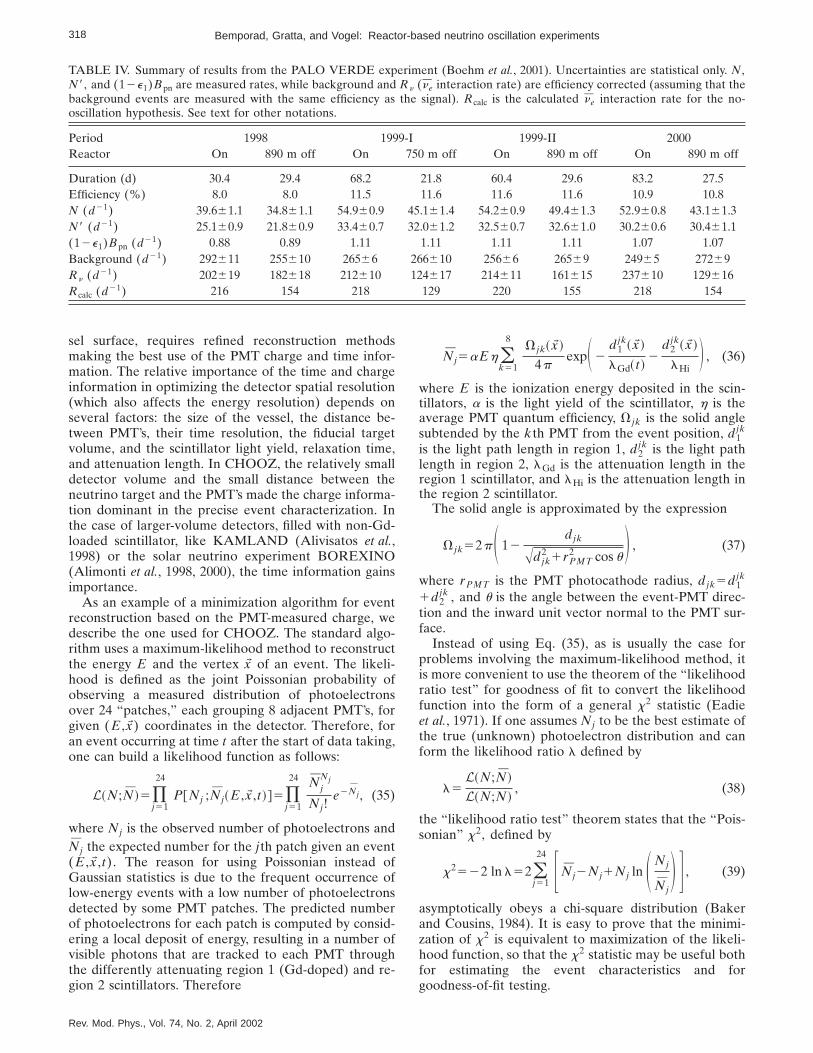
318 Bemporad, Gratta, and Vogel: Reactor-based neutrino oscillation experiments
TABLE IV. Summary of results from the PALO VERDE experiment (Boehm et al., 2001). Uncertainties are statistical only. N ,N8, and (12e1)Bpn are measured rates, while background and Rn (ne interaction rate) are efficiency corrected (assuming that thebackground events are measured with the same efficiency as the signal). Rcalc is the calculated ne interaction rate for the no-oscillation hypothesis. See text for other notations.
Period 1998 1999-I 1999-II 2000Reactor On 890 m off On 750 m off On 890 m off On 890 m off
Duration (d) 30.4 29.4 68.2 21.8 60.4 29.6 83.2 27.5Efficiency (%) 8.0 8.0 11.5 11.6 11.6 11.6 10.9 10.8N (d21) 39.661.1 34.861.1 54.960.9 45.161.4 54.260.9 49.461.3 52.960.8 43.161.3N8 (d21) 25.160.9 21.860.9 33.460.7 32.061.2 32.560.7 32.661.0 30.260.6 30.461.1(12e1)Bpn (d21) 0.88 0.89 1.11 1.11 1.11 1.11 1.07 1.07Background (d21) 292611 255610 26566 266610 25666 26569 24965 27269Rn (d21) 202619 182618 212610 124617 214611 161615 237610 129616Rcalc (d21) 216 154 218 129 220 155 218 154
sel surface, requires refined reconstruction methodsmaking the best use of the PMT charge and time infor-mation. The relative importance of the time and chargeinformation in optimizing the detector spatial resolution(which also affects the energy resolution) depends onseveral factors: the size of the vessel, the distance be-tween PMT’s, their time resolution, the fiducial targetvolume, and the scintillator light yield, relaxation time,and attenuation length. In CHOOZ, the relatively smalldetector volume and the small distance between theneutrino target and the PMT’s made the charge informa-tion dominant in the precise event characterization. Inthe case of larger-volume detectors, filled with non-Gd-loaded scintillator, like KAMLAND (Alivisatos et al.,1998) or the solar neutrino experiment BOREXINO(Alimonti et al., 1998, 2000), the time information gainsimportance.
As an example of a minimization algorithm for eventreconstruction based on the PMT-measured charge, wedescribe the one used for CHOOZ. The standard algo-rithm uses a maximum-likelihood method to reconstructthe energy E and the vertex xW of an event. The likeli-hood is defined as the joint Poissonian probability ofobserving a measured distribution of photoelectronsover 24 ‘‘patches,’’ each grouping 8 adjacent PMT’s, forgiven (E ,xW ) coordinates in the detector. Therefore, foran event occurring at time t after the start of data taking,one can build a likelihood function as follows:
L~N ;N !5)j51
24
P@Nj ;Nj~E ,xW ,t !#5)j51
24 NjNj
Nj!e2Nj, (35)
where Nj is the observed number of photoelectrons andNj the expected number for the jth patch given an event(E ,xW ,t). The reason for using Poissonian instead ofGaussian statistics is due to the frequent occurrence oflow-energy events with a low number of photoelectronsdetected by some PMT patches. The predicted numberof photoelectrons for each patch is computed by consid-ering a local deposit of energy, resulting in a number ofvisible photons that are tracked to each PMT throughthe differently attenuating region 1 (Gd-doped) and re-gion 2 scintillators. Therefore
Rev. Mod. Phys., Vol. 74, No. 2, April 2002
Nj5aEh (k51
8V jk~xW !
4pexpS 2
d1jk~xW !
lGd~ t !2
d2jk~xW !
lHiD , (36)
where E is the ionization energy deposited in the scin-tillators, a is the light yield of the scintillator, h is theaverage PMT quantum efficiency, V jk is the solid anglesubtended by the kth PMT from the event position, d1
jk
is the light path length in region 1, d2jk is the light path
length in region 2, lGd is the attenuation length in theregion 1 scintillator, and lHi is the attenuation length inthe region 2 scintillator.
The solid angle is approximated by the expression
V jk52pS 12djk
Adjk2 1rPMT
2 cos uD , (37)
where rPMT is the PMT photocathode radius, djk5d1jk
1d2jk , and u is the angle between the event-PMT direc-
tion and the inward unit vector normal to the PMT sur-face.
Instead of using Eq. (35), as is usually the case forproblems involving the maximum-likelihood method, itis more convenient to use the theorem of the ‘‘likelihoodratio test’’ for goodness of fit to convert the likelihoodfunction into the form of a general x2 statistic (Eadieet al., 1971). If one assumes Nj to be the best estimate ofthe true (unknown) photoelectron distribution and canform the likelihood ratio l defined by
l5L~N ;N !
L~N ;N !, (38)
the ‘‘likelihood ratio test’’ theorem states that the ‘‘Pois-sonian’’ x2, defined by
x2522 ln l52(j51
24 F Nj2Nj1Nj ln S Nj
NjD G , (39)
asymptotically obeys a chi-square distribution (Bakerand Cousins, 1984). It is easy to prove that the minimi-zation of x2 is equivalent to maximization of the likeli-hood function, so that the x2 statistic may be useful bothfor estimating the event characteristics and forgoodness-of-fit testing.

319Bemporad, Gratta, and Vogel: Reactor-based neutrino oscillation experiments
The CERN MINUIT package (James, 1994) was usedto minimize Eq. (39). The starting value for the ith co-ordinate was based on the charge asymmetries measuredby initially grouping the PMT’s into only six ‘‘super-patches,’’ referred to the detector frame axes; it was de-fined according to
xi05AQ1
i 2AQ2i
AQ1i 1AQ2
iDi, i51,2,3, (40)
where the indices 1 and 2 refer to the opposite super-patches of the ith axis, and Di is the half size of thedetector along that axis. Once the xi0 corresponding tothe starting position is known, the starting energy valueis obtained from Eq. (36) after replacing xW with xW 0 andNj with Nj . Examples of the results obtained by thisprocedure are shown in Fig. 18.
E. Results and systematics
A summary of systematic errors for both CHOOZand PALO VERDE is given in Table V. The systematicerror given for CHOOZ should probably be consideredas some sort of ultimate limit for reactor-based oscilla-tion experiments, at least when only one detector ispresent. Indeed the intrinsically high efficiency(.70%) of the homogeneous detector, together withthe unique opportunity of studying the zero-power case,are important advantages (in comparison the efficiencyof the larger but segmented PALO VERDE detector is.11%).
The (energy-averaged) ratio between ne detected andexpected was found to be
R51.0160.028~stat!60.027~syst! CHOOZ (41)
and
R51.0160.024~stat!
60.053~syst! PALO VERDE, (42)
TABLE V. Origin and magnitude of systematic errors inPALO VERDE and CHOOZ. Note that the two experimentsoffer different breakdowns of their systematics. For simplicitywe do not show the systematics for the PALO VERDE ON-OFF analysis.
Systematic CHOOZ(%)
PALO VERDE(%)
s( ne1p→n1e1) 1.9Number of p’s in target 0.8Wth 0.7Energy absorbed per fission 0.6Total rate prediction 2.3 2.1e1 trigger efficiency 2.0n trigger efficiency 2.1ne selection cuts 2.1(12e1)Bpn estimate 3.3Total ne efficiency 1.5 4.9Total 2.7 5.3
Rev. Mod. Phys., Vol. 74, No. 2, April 2002
in both cases consistent with 1.Both experiments were able to exclude ne- nx oscilla-
tions as dominant cause of the atmospheric neutrinoanomaly. This is evident from the exclusion contours ob-tained using the unified approach (Feldman and Cous-ins, 1998) and shown in Fig. 27 for CHOOZ and Fig. 28for PALO VERDE.
F. Are smaller mixing angles within experimental reach?
The current data on neutrino oscillations suggest theneed to include at least three neutrino flavors whenstudying results from experiments. As discussed in theIntroduction, the most general approach would involve
FIG. 27. Limits on mass difference and mixing angle fromCHOOZ (90% C.L.) obtained with the unified approach(Feldman and Cousins, 1998). Analysis A (thin solid line) re-fers to the curve obtained by a fit to the background-subtracted spectrum in which both shape and normalizationare used. Analysis C (dashed line) uses only the shape of thespectrum. Finally, analysis B (heavy solid line) uses the differ-ence of baselines between the two reactors (DL5116.7 m).While in this last case most systematics cancel, statistical errorsare larger and the Dm2 sensitivity is rather poor due to theshort baseline difference. The Kamiokande ne –nm atmosphericneutrino result, which motivated the present work, is alsoshown.

320 Bemporad, Gratta, and Vogel: Reactor-based neutrino oscillation experiments
five unknown parameters: three mixing angles and twoindependent mass differences. However, an intermedi-ate approach consists of a simple generalization of thetwo-flavor scenario, assuming that m3
2@m12 ,m2
2 (i.e.,Dm13
2 5Dm232 5Dm2, while Dm12
2 .0). This scenario isobviously compatible with the evidence based on theatmospheric neutrino anomaly (Dm2;331023 eV2)and the solar neutrino deficit (Dm2,1024 eV2). In sucha case the mixing angle u12 becomes irrelevant, and oneis left with only three unknown quantities: Dm2, u13 ,and u23 . With this parametrization and assuming CPTsymmetry (ne→nx probability is the same as ne→ nx),the ne disappearance is governed by
P~ ne→ nx!5sin2 2u13 sin2Dm2L
4En, (43)
while nm→nt oscillations, responsible for the atmo-spheric neutrino results in this scenario, are described by
P~nm→nt!5cos4 u13 sin2 2u23 sin2Dm2L
4En. (44)
An analysis of the atmospheric neutrino data basedon these assumptions has been performed (Okamura,1999) and its results are shown in Fig. 29 for the ne dis-appearance channel. One can see that, while the rel-evant region of the mass difference Dm2 is determinedby the atmospheric neutrino data, the mixing angle u13 isnot constrained very much. Here the reactor-based neu-trino oscillation experiments play a decisive role.
The determination of the angle u13 has obvious impor-
FIG. 28. Limits on mass difference and mixing angle fromPALO VERDE at 90% C.L. (Boehm et al., 2001). The solidcurve is obtained with the swap background subtractionmethod described in the text, while the dashed curve is ob-tained using the reactor power changes to estimate and sub-tract the background. The Kamiokande nm-ne atmosphericneutrino result, which motivated the present work, is alsoshown for illustration.
Rev. Mod. Phys., Vol. 74, No. 2, April 2002
tance not only for the structure of the lepton mixingmatrix U but for the observability of CP violation in thelepton sector, as stressed in the Introduction. If u13 van-ishes or is very small, no CP violation effects are observ-able in the lepton sector. Moreover, for vanishing u13and with three neutrinos only, the lepton mixing is radi-cally simplified. The electron neutrino is then simply
ne5cos u12n11sin u12n2 , (45)
while the nm and nt neutrinos become superpositions ofn3 and the corresponding orthogonal combination of n1and n2 . It is therefore interesting to ask whetherreactor-based experiments can be extended to addressregions of even smaller mixing parameter sin2 2u13 .
A simple inspection of Table V shows that, using theCHOOZ systematics, if all flux and cross-section-relatederrors could be set to zero, one would be left with anerror of .1.5%. Hence, assuming a detector largeenough to produce negligible statistical error, the totalerror would shrink from the present 3.9% to 1.5%.
This scenario is considered by Mikaelyan (2000), whoproposes using an underground reactor at Krasnoyarskin Russia as a source and two identical detectors placedat distances of .1100 m and .250 m. The interestingfeature of the Krasnoyarsk site is that there are substan-tial facilities available underground, with an overburdenof ;600 mwe, twice the depth of CHOOZ. Indeed itmight even be conceivable to locate the detectors onrail-cars and periodically switch their position to furtherreduce some of the systematics related to detector effi-ciency. The proposal discusses the use of 50 tons of Gd-loaded scintillator for each of the two identical homoge-neous detectors, so that the far detector would collect 50events/day (the thermal power of the reactor is in this
FIG. 29. Exclusion plot showing the allowed region of u13 andDm2 based on the Super-Kamiokande preliminary analysis(the region inside the dotted curve). The regions excluded bythe neutrino reactor experiments are to the right of the corre-sponding continuous curves.

321Bemporad, Gratta, and Vogel: Reactor-based neutrino oscillation experiments
case lower than at CHOOZ or PALO VERDE). Thebackground is estimated by Mikaelyan (2000) to beabout 5 events/day or less.
This proposal estimates that such an experiment couldreach a sensitivity in mixing strength of better than 0.02in the Dm2 region relevant for atmospheric neutrinos.While the idea certainly looks interesting, it would beuseful to explore how practical it is in general to pushthe errors of the absolute ne flux to the 1% domain,even with the measurements considered here. Note alsothat the Krasnoyarsk reactors, according to theGore-Chernomyrdin6 agreement, are supposed to beshut down for recoring in the not very distant future forsome period of time.
V. EXPLORING THE SOLAR n ANOMALY ON EARTH:KAMLAND
While historically solar neutrinos provided the firsthint of oscillations, there is a consensus today that thestrongest evidence for oscillation is the atmospheric neu-trino anomaly. Indeed, the zenith-angle dependence ofthe anomaly has substantially helped to eliminate expla-nations not based on some property of neutrinos them-selves, and the advent of KEK-to-Kamioka (K2K), to befollowed soon by MINOS and the CERN-to-Gran Sassoprograms (Wojcicki, 2001a, 2001b), is bringing the studyof oscillations in this regime to a laboratory setting withboth source and detector well under control.
In the case of solar neutrinos, none of the effects thatwould generally be considered ‘‘smoking guns’’ for oscil-lations has as yet clearly emerged from the data [al-though the juxtaposition of SNO (Ahmad, 2001) andSuper-Kamiokande (S. Fukuda, 2001a) comes close].The exploration ‘‘in a laboratory setting’’ of the problemis made particularly challenging by the huge L/En re-quired. It is probably a safe prediction that it will take avery long time before an accelerator-based experimentwill be able to tackle the solar neutrino problem. How-ever, the very low energy of reactor neutrinos makes areactor-based oscillation experiment able to reach thelarge-mixing-angle MSW solution possible—albeitrather challenging. While the analysis of current and fu-ture solar neutrino experiments presumably will help todecide which of the possible solutions is the right one,we find the chance to study solar neutrino oscillations inthe laboratory extremely compelling. Note that in con-trast to atmospheric neutrinos, for which it turned outthat electron neutrinos are not involved in the dominantmixing, the solar neutrino problem, if due to oscillations,obviously involves ne disappearance. Therefore, unlessne’s behave drastically differently from ne’s (whichwould be a worthwhile discovery anyway, signaling thebreakdown of CPT symmetry), a reactor experiment is
6‘‘US-Russian Plutonium Production Agreement is Signed,’’statement by the White House Office of the Vice President, 23September 1997.
Rev. Mod. Phys., Vol. 74, No. 2, April 2002
an exact replica of the astrophysical experiment, onlybuilt on earth.
A. Nuclear reactors in Japan
The ‘‘easier’’ solution of the solar neutrino problem(large-mixing-angle MSW) is shown in Fig. 1. In order tocompletely explore this solution, one needs a Dm2 sen-sitivity of at least 1025 eV2 at a large mixing angle. As isnow customary, we refer to Fig. 3 as a first step in de-signing our experiment: we see that a '100-km baselineis needed, which drives the power3fiducial-mass prod-uct into the 108-MWth3tons range. Clearly a large de-tector has to be used in conjunction with very manynuclear reactors. A cursory look at the placement ofnuclear power plants on the earth (Fig. 30) reveals thatsuch an experiment could only be placed in Europe, theeastern United States, or Japan.
There are 16 commercial nuclear power plants in Ja-pan; their location is shown in Fig. 31. They supplyabout 1/3 (or 130 GWth) of the total electric power inthe country. At the Kamioka site there is an antineutrinoflux of .43106 cm22 s21 (or .1.33106 cm22 s21 forE n.1.8 MeV) from these reactors. Eighty percent ofthis flux derives from reactors at a distance between 140and 210 km, so that there is a limited range of baselines.The breakdown of this data by power plant (severalplants have on site more than one reactor) is given inTable VI. We note that some 2% of the flux derives frompower plants in South Korea (the Primorskaya plant inRussia is only in the planning stages) that will have to beincluded (albeit only as a crude estimate) to provide anexact flux prediction.
While Table VI assumes the nominal power for eachof the cores, an average over one year, taking into ac-count scheduled and unscheduled down times, gives anexpected nonoscillation rate of .750 kton21 yr21 for aCnH2n12 target. Although the signal is provided by avery large number of cores, it turns out that a modula-tion of the ne flux is expected at KAMLAND (Alivisatoset al., 1998), thanks to the refueling and maintenanceschedule of nuclear power plants in Japan. Such shut-downs, in fact, are concentrated in the fall and spring,when the power demand is lowest, as illustrated in Fig.32. Hence, from the point of view of the tools availableto study backgrounds, KAMLAND is in a situation verysimilar to that of PALO VERDE, with two dips in theflux from full to '2/3 expected every year.
It is interesting to note that other artificial sources oflow-energy ne’s do not significantly contribute to thebackground in KAMLAND. The largest effect wouldbe produced by a large nuclear-powered vessel whilerunning its reactors at full power in the Toyama Bay,50–100 km from the detector. In these circumstances theexcess signal in KAMLAND would amount to ;10%(Detwiler, 2000). Clearly, it is extremely unlikely thatsuch conditions will occur for any significant period oftime.
B. Detector design
The KAMLAND detector is housed in the cavity builtfor the Kamiokande detector under the summit of Mt.
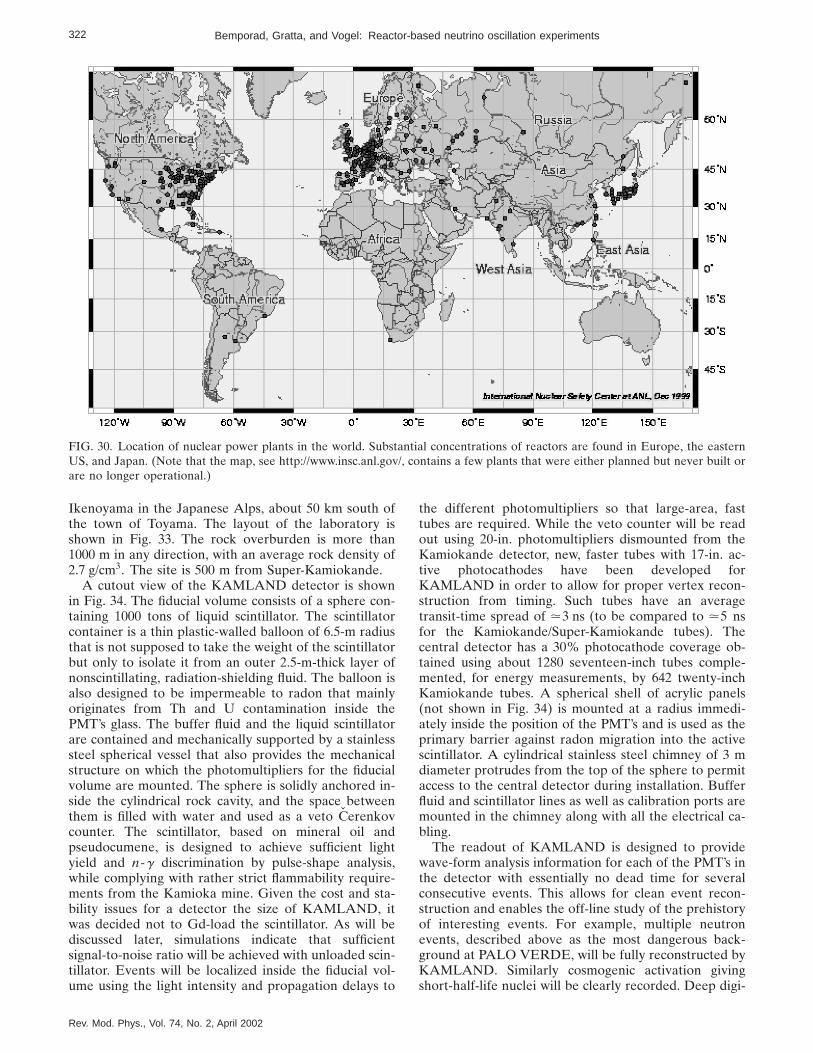
322 Bemporad, Gratta, and Vogel: Reactor-based neutrino oscillation experiments
FIG. 30. Location of nuclear power plants in the world. Substantial concentrations of reactors are found in Europe, the easternUS, and Japan. (Note that the map, see http://www.insc.anl.gov/, contains a few plants that were either planned but never built orare no longer operational.)
Ikenoyama in the Japanese Alps, about 50 km south ofthe town of Toyama. The layout of the laboratory isshown in Fig. 33. The rock overburden is more than1000 m in any direction, with an average rock density of2.7 g/cm3. The site is 500 m from Super-Kamiokande.
A cutout view of the KAMLAND detector is shownin Fig. 34. The fiducial volume consists of a sphere con-taining 1000 tons of liquid scintillator. The scintillatorcontainer is a thin plastic-walled balloon of 6.5-m radiusthat is not supposed to take the weight of the scintillatorbut only to isolate it from an outer 2.5-m-thick layer ofnonscintillating, radiation-shielding fluid. The balloon isalso designed to be impermeable to radon that mainlyoriginates from Th and U contamination inside thePMT’s glass. The buffer fluid and the liquid scintillatorare contained and mechanically supported by a stainlesssteel spherical vessel that also provides the mechanicalstructure on which the photomultipliers for the fiducialvolume are mounted. The sphere is solidly anchored in-side the cylindrical rock cavity, and the space betweenthem is filled with water and used as a veto Cerenkovcounter. The scintillator, based on mineral oil andpseudocumene, is designed to achieve sufficient lightyield and n-g discrimination by pulse-shape analysis,while complying with rather strict flammability require-ments from the Kamioka mine. Given the cost and sta-bility issues for a detector the size of KAMLAND, itwas decided not to Gd-load the scintillator. As will bediscussed later, simulations indicate that sufficientsignal-to-noise ratio will be achieved with unloaded scin-tillator. Events will be localized inside the fiducial vol-ume using the light intensity and propagation delays to
Rev. Mod. Phys., Vol. 74, No. 2, April 2002
the different photomultipliers so that large-area, fasttubes are required. While the veto counter will be readout using 20-in. photomultipliers dismounted from theKamiokande detector, new, faster tubes with 17-in. ac-tive photocathodes have been developed forKAMLAND in order to allow for proper vertex recon-struction from timing. Such tubes have an averagetransit-time spread of .3 ns (to be compared to .5 nsfor the Kamiokande/Super-Kamiokande tubes). Thecentral detector has a 30% photocathode coverage ob-tained using about 1280 seventeen-inch tubes comple-mented, for energy measurements, by 642 twenty-inchKamiokande tubes. A spherical shell of acrylic panels(not shown in Fig. 34) is mounted at a radius immedi-ately inside the position of the PMT’s and is used as theprimary barrier against radon migration into the activescintillator. A cylindrical stainless steel chimney of 3 mdiameter protrudes from the top of the sphere to permitaccess to the central detector during installation. Bufferfluid and scintillator lines as well as calibration ports aremounted in the chimney along with all the electrical ca-bling.
The readout of KAMLAND is designed to providewave-form analysis information for each of the PMT’s inthe detector with essentially no dead time for severalconsecutive events. This allows for clean event recon-struction and enables the off-line study of the prehistoryof interesting events. For example, multiple neutronevents, described above as the most dangerous back-ground at PALO VERDE, will be fully reconstructed byKAMLAND. Similarly cosmogenic activation givingshort-half-life nuclei will be clearly recorded. Deep digi-
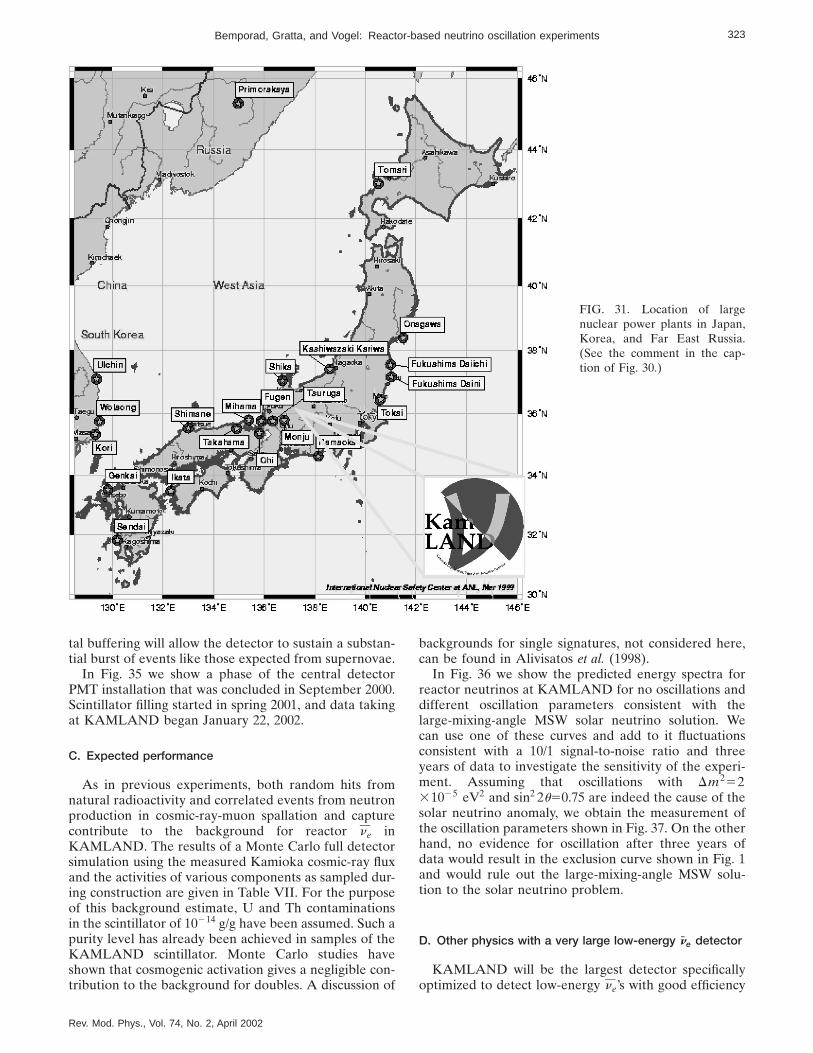
323Bemporad, Gratta, and Vogel: Reactor-based neutrino oscillation experiments
FIG. 31. Location of largenuclear power plants in Japan,Korea, and Far East Russia.(See the comment in the cap-tion of Fig. 30.)
tal buffering will allow the detector to sustain a substan-tial burst of events like those expected from supernovae.
In Fig. 35 we show a phase of the central detectorPMT installation that was concluded in September 2000.Scintillator filling started in spring 2001, and data takingat KAMLAND began January 22, 2002.
C. Expected performance
As in previous experiments, both random hits fromnatural radioactivity and correlated events from neutronproduction in cosmic-ray-muon spallation and capturecontribute to the background for reactor ne inKAMLAND. The results of a Monte Carlo full detectorsimulation using the measured Kamioka cosmic-ray fluxand the activities of various components as sampled dur-ing construction are given in Table VII. For the purposeof this background estimate, U and Th contaminationsin the scintillator of 10214 g/g have been assumed. Such apurity level has already been achieved in samples of theKAMLAND scintillator. Monte Carlo studies haveshown that cosmogenic activation gives a negligible con-tribution to the background for doubles. A discussion of
Rev. Mod. Phys., Vol. 74, No. 2, April 2002
backgrounds for single signatures, not considered here,can be found in Alivisatos et al. (1998).
In Fig. 36 we show the predicted energy spectra forreactor neutrinos at KAMLAND for no oscillations anddifferent oscillation parameters consistent with thelarge-mixing-angle MSW solar neutrino solution. Wecan use one of these curves and add to it fluctuationsconsistent with a 10/1 signal-to-noise ratio and threeyears of data to investigate the sensitivity of the experi-ment. Assuming that oscillations with Dm25231025 eV2 and sin2 2u50.75 are indeed the cause of thesolar neutrino anomaly, we obtain the measurement ofthe oscillation parameters shown in Fig. 37. On the otherhand, no evidence for oscillation after three years ofdata would result in the exclusion curve shown in Fig. 1and would rule out the large-mixing-angle MSW solu-tion to the solar neutrino problem.
D. Other physics with a very large low-energy ne detector
KAMLAND will be the largest detector specificallyoptimized to detect low-energy ne’s with good efficiency
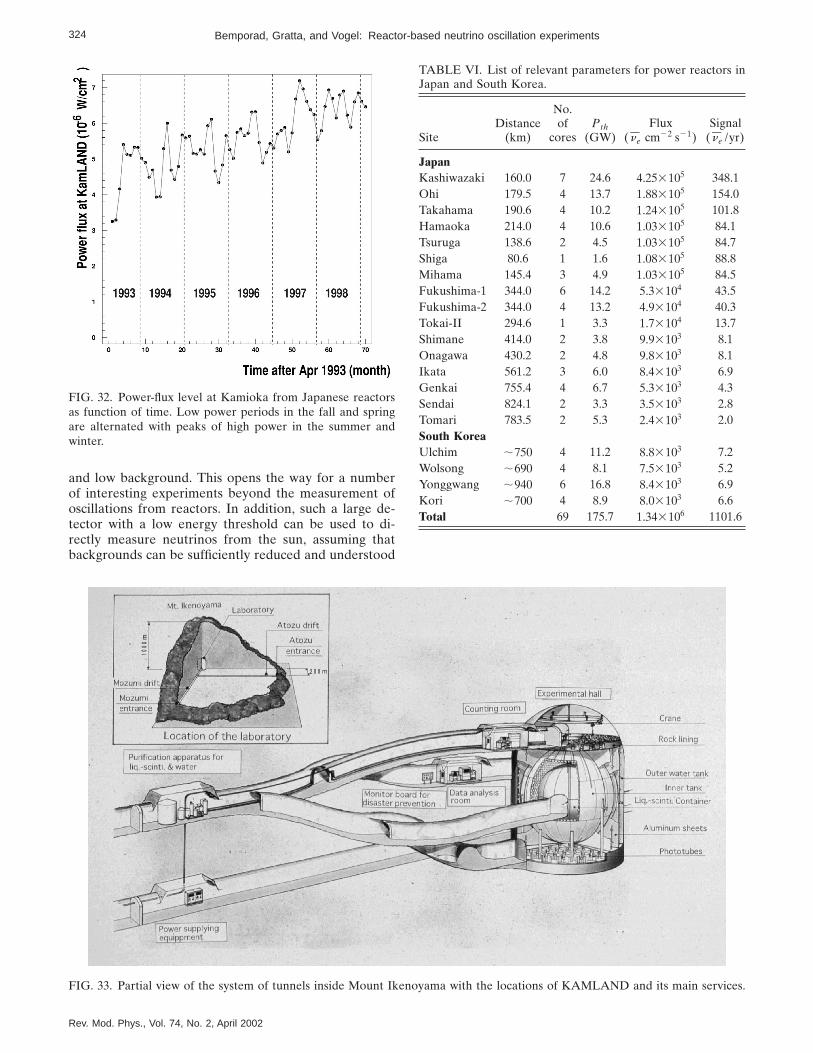
324 Bemporad, Gratta, and Vogel: Reactor-based neutrino oscillation experiments
and low background. This opens the way for a numberof interesting experiments beyond the measurement ofoscillations from reactors. In addition, such a large de-tector with a low energy threshold can be used to di-rectly measure neutrinos from the sun, assuming thatbackgrounds can be sufficiently reduced and understood
FIG. 32. Power-flux level at Kamioka from Japanese reactorsas function of time. Low power periods in the fall and springare alternated with peaks of high power in the summer andwinter.
Rev. Mod. Phys., Vol. 74, No. 2, April 2002
TABLE VI. List of relevant parameters for power reactors inJapan and South Korea.
SiteDistance
(km)
No.of
coresPth
(GW)Flux
( ne cm22 s21)Signal
( ne /yr)
JapanKashiwazaki 160.0 7 24.6 4.253105 348.1Ohi 179.5 4 13.7 1.883105 154.0Takahama 190.6 4 10.2 1.243105 101.8Hamaoka 214.0 4 10.6 1.033105 84.1Tsuruga 138.6 2 4.5 1.033105 84.7Shiga 80.6 1 1.6 1.083105 88.8Mihama 145.4 3 4.9 1.033105 84.5Fukushima-1 344.0 6 14.2 5.33104 43.5Fukushima-2 344.0 4 13.2 4.93104 40.3Tokai-II 294.6 1 3.3 1.73104 13.7Shimane 414.0 2 3.8 9.93103 8.1Onagawa 430.2 2 4.8 9.83103 8.1Ikata 561.2 3 6.0 8.43103 6.9Genkai 755.4 4 6.7 5.33103 4.3Sendai 824.1 2 3.3 3.53103 2.8Tomari 783.5 2 5.3 2.43103 2.0South KoreaUlchim ;750 4 11.2 8.83103 7.2Wolsong ;690 4 8.1 7.53103 5.2Yonggwang ;940 6 16.8 8.43103 6.9Kori ;700 4 8.9 8.03103 6.6Total 69 175.7 1.343106 1101.6
FIG. 33. Partial view of the system of tunnels inside Mount Ikenoyama with the locations of KAMLAND and its main services.

325Bemporad, Gratta, and Vogel: Reactor-based neutrino oscillation experiments
to enable the detection of single energy deposits. Of par-ticular importance is the 7Be line, which is below thethreshold of water Cerenkov detectors. The presence of
FIG. 34. Schematic cross section of the KAMLAND detector.
FIG. 35. View of the internal volume of the KAMLANDsphere during the central detector installation. A modular sty-rofoam raft is used as a platform for workers. The installationbegan from the top of the sphere and moved down as thewater level in the sphere was reduced. PMT’s, black shades,acrylic plates, monitoring LED’s, and cables were mounted inplace for each level before lowering the water.
Rev. Mod. Phys., Vol. 74, No. 2, April 2002
large amounts of carbon in KAMLAND’s scintillator of-fers the possibility of detailed flavor studies in neutrinoscoming from supernovae. Finally, KAMLAND repre-sents such a large step up in size and background rela-tive to the previous detectors that one should be readyfor the possibility that it will discover completely newand unexpected phenomena in physics or astrophysics.
Here we shall only mention the topic of terrestrialne’s, which is somewhat unusual and directly relates tothe experiment’s ability to detect ne’s . The reader inter-ested in the direct detection of solar neutrinos or neutri-nos from supernovae is referred to the KAMLAND de-sign report (Alivisatos et al., 1998). A description of thenew and unexpected phenomena mentioned above willhopefully be provided at a later stage.
Although the study of terrestrial antineutrinos wasproposed as early as 1966 (Eders, 1966), practical diffi-culties, due to the very small cross sections and very lowenergies involved, have made their observation imprac-tical until now. KAMLAND has the ability to detectenergy depositions of the order of 1 MeV in an unprec-edented amount of liquid scintillator and is thereforeideally suited for this study. It is important to realize thatlow-energy ne’s are easily detected with very low back-ground in KAMLAND thanks to their very specific sig-nature.
TABLE VII. Summary of background rates in KAMLANDfor the ne signature. A signal-to-noise ratio of about 10/1 isexpected for reactor ne . Adapted from Alivisatos et al. (1998).
Background source Rate (day21)
Cosmic-muon-induced neutrons 0.1Natural radioactivity (random coincidence) 0.15Natural radioactivity (correlated) 0.005Total predicted background 0.25Reactor ne signal (no oscillation) 2
FIG. 36. Positron energy spectra expected at KAMLAND forno oscillations and oscillations with indicated parameters Dm2
and sin2 2u50.75 in the large-mixing-angle MSW solar neu-trino solution.
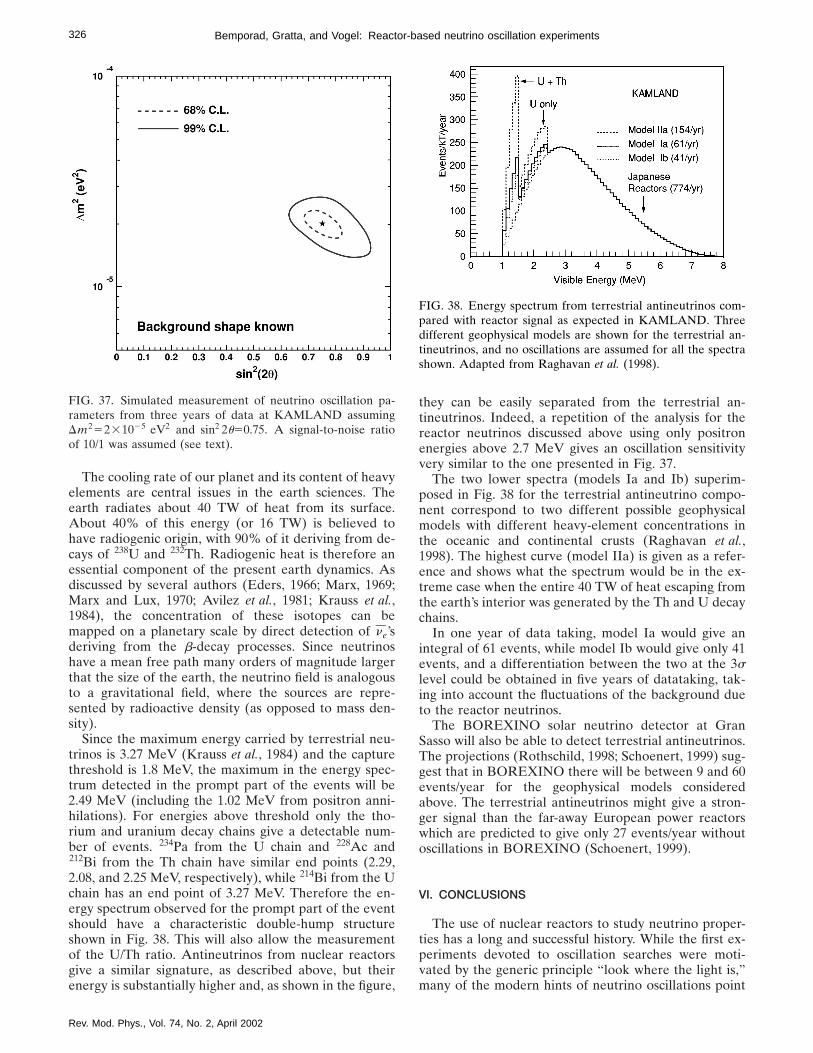
326 Bemporad, Gratta, and Vogel: Reactor-based neutrino oscillation experiments
The cooling rate of our planet and its content of heavyelements are central issues in the earth sciences. Theearth radiates about 40 TW of heat from its surface.About 40% of this energy (or 16 TW) is believed tohave radiogenic origin, with 90% of it deriving from de-cays of 238U and 232Th. Radiogenic heat is therefore anessential component of the present earth dynamics. Asdiscussed by several authors (Eders, 1966; Marx, 1969;Marx and Lux, 1970; Avilez et al., 1981; Krauss et al.,1984), the concentration of these isotopes can bemapped on a planetary scale by direct detection of ne’sderiving from the b-decay processes. Since neutrinoshave a mean free path many orders of magnitude largerthat the size of the earth, the neutrino field is analogousto a gravitational field, where the sources are repre-sented by radioactive density (as opposed to mass den-sity).
Since the maximum energy carried by terrestrial neu-trinos is 3.27 MeV (Krauss et al., 1984) and the capturethreshold is 1.8 MeV, the maximum in the energy spec-trum detected in the prompt part of the events will be2.49 MeV (including the 1.02 MeV from positron anni-hilations). For energies above threshold only the tho-rium and uranium decay chains give a detectable num-ber of events. 234Pa from the U chain and 228Ac and212Bi from the Th chain have similar end points (2.29,2.08, and 2.25 MeV, respectively), while 214Bi from the Uchain has an end point of 3.27 MeV. Therefore the en-ergy spectrum observed for the prompt part of the eventshould have a characteristic double-hump structureshown in Fig. 38. This will also allow the measurementof the U/Th ratio. Antineutrinos from nuclear reactorsgive a similar signature, as described above, but theirenergy is substantially higher and, as shown in the figure,
FIG. 37. Simulated measurement of neutrino oscillation pa-rameters from three years of data at KAMLAND assumingDm25231025 eV2 and sin2 2u50.75. A signal-to-noise ratioof 10/1 was assumed (see text).
Rev. Mod. Phys., Vol. 74, No. 2, April 2002
they can be easily separated from the terrestrial an-tineutrinos. Indeed, a repetition of the analysis for thereactor neutrinos discussed above using only positronenergies above 2.7 MeV gives an oscillation sensitivityvery similar to the one presented in Fig. 37.
The two lower spectra (models Ia and Ib) superim-posed in Fig. 38 for the terrestrial antineutrino compo-nent correspond to two different possible geophysicalmodels with different heavy-element concentrations inthe oceanic and continental crusts (Raghavan et al.,1998). The highest curve (model IIa) is given as a refer-ence and shows what the spectrum would be in the ex-treme case when the entire 40 TW of heat escaping fromthe earth’s interior was generated by the Th and U decaychains.
In one year of data taking, model Ia would give anintegral of 61 events, while model Ib would give only 41events, and a differentiation between the two at the 3slevel could be obtained in five years of datataking, tak-ing into account the fluctuations of the background dueto the reactor neutrinos.
The BOREXINO solar neutrino detector at GranSasso will also be able to detect terrestrial antineutrinos.The projections (Rothschild, 1998; Schoenert, 1999) sug-gest that in BOREXINO there will be between 9 and 60events/year for the geophysical models consideredabove. The terrestrial antineutrinos might give a stron-ger signal than the far-away European power reactorswhich are predicted to give only 27 events/year withoutoscillations in BOREXINO (Schoenert, 1999).
VI. CONCLUSIONS
The use of nuclear reactors to study neutrino proper-ties has a long and successful history. While the first ex-periments devoted to oscillation searches were moti-vated by the generic principle ‘‘look where the light is,’’many of the modern hints of neutrino oscillations point
FIG. 38. Energy spectrum from terrestrial antineutrinos com-pared with reactor signal as expected in KAMLAND. Threedifferent geophysical models are shown for the terrestrial an-tineutrinos, and no oscillations are assumed for all the spectrashown. Adapted from Raghavan et al. (1998).

327Bemporad, Gratta, and Vogel: Reactor-based neutrino oscillation experiments
to parameters that match very well the capabilities ofreactor-based experiments. At the same time, the under-standing of the flux and spectrum of ne’s from powerreactors has reached substantial sophistication. The firsttwo ‘‘long-baseline’’ experiments, CHOOZ and PALOVERDE, have amply demonstrated the capability ofthis new breed of detectors, while providing solid evi-dence that ne-nm is not the dominant channel for atmo-spheric neutrino oscillation. KAMLAND, already tak-ing data now, will extend the reach for small massdifferences to unprecedented levels. Its size and back-ground will bring reactor-based experiments to a newlevel, with several new physics opportunities in the es-sentially backgroundless detection of ne’s from a numberof natural sources.
ACKNOWLEDGMENTS
We would like to thank our colleagues from CHOOZ,KAMLAND, and PALO VERDE for the many discus-sions and help received in understanding the materialdiscussed. This work was supported in part by the USDepartment of Energy and by the Italian Istituto Natio-nale di Fisica Nucleare (INFN).
REFERENCES
Achkar, B., 1992, Ph.D. thesis (Institut Laue-Langevin,Grenoble).
Achkar, B., et al., 1995, Nucl. Phys. B 434, 503.Achkar, B., et al., 1996, Phys. Lett. B 374, 243.Aguilar, A., et al., Phys. Rev. D 64, 112007.Ahmad, Q. R., et al., 2001, Phys. Rev. Lett. 87, 071301.Alfonin, A. I., et al., 1998, JETP 67, 213.Alimonti, G., et al., 1998, Astropart. Phys. 8, 141.Alimonti, G., et al., 2000, Nucl. Instrum. Methods Phys. Res. A
440, 360.Alivisatos, P., et al. 1998, ‘‘KAMLAND: a liquid scintillator
Anti-Neutrino Detector at the Kamioka site,’’ preprintStanford-HEP-98-03, Tohoku-RCNS-98-15.
Amsler, C., et al., 1997, Nucl. Instrum. Methods Phys. Res. A396, 115.
Apollonio, M., et al., 1998, Phys. Lett. B 420, 397.Apollonio, M., et al., 1999, Phys. Lett. B 466, 415.Apollonio, M., et al., 2000, Phys. Rev. D 61, 012001.Armbruster, B., et al., 1998, Phys. Rev. C 57, 3414.Athanassopoulos, C., et al., 1995, Phys. Rev. Lett. 75, 2650.Athanassopoulos, C., et al., 1996, Phys. Rev. C 54, 2685.Athanassopoulos, C., et al., 1998, Phys. Rev. C 58, 2489.Avilez, C., G. Marx, and B. Fuentes, 1981, Phys. Rev. D 23,
1116.Bahcall, J. N., 1989, Neutrino Astrophysics (Cambridge Uni-
versity, Cambridge, England).Baldini, A., et al., 1996, Nucl. Instrum. Methods Phys. Res. A
372, 207.Baker, S., and R. Cousins 1984, Nucl. Instrum. Methods Phys.
Res. A 221, 437.Barger, V., K. Whisnant, and R. J. N. Phillips, 1980, Phys. Rev.
Lett. 45, 2084.Beacom, J. F., and P. Vogel, 1999, Phys. Rev. Lett. 83, 5222.
Rev. Mod. Phys., Vol. 74, No. 2, April 2002
Boehm, F., 2001, in Current Aspects of Neutrino Physics, editedby D. Caldwell (Springer, Berlin), p. 131.
Boehm, F., et al., 2000a, Phys. Rev. Lett. 84, 3764.Boehm, F., et al., 2000b, Phys. Rev. D 62, 072002.Boehm, F., et al., 2000c, Phys. Rev. D 62, 092005.Boehm, F., et al., 2001, Phys. Rev. D 64, 112001.Boehm, F., and P. Vogel, 1992, Physics of Massive Neutrinos
(Cambridge University, Cambridge, England).Bouchez, J., B. Pichard, J. P. Soirat, M. Spiro, and Y. Declais,
1988, Phys. Lett. B 207, 217.Cabibbo, N., 1978, Phys. Lett. 72B, 333.Danby, G., J.-M. Gaillard, K. Goulianos, L. M. Lederman, N.
Mistry, M. Schwatz, and J. Steinberger, 1962, Phys. Rev. Lett.9, 36.
Davis, B. R., P. Vogel, F. M. Mann, and R. E. Schenter, 1979,Phys. Rev. C 19, 2259.
Declais, Y., et al., 1994, Phys. Lett. B 338, 383.Derbin, A. I., A. V. Chernyi, L. A. Popeko, V. N. Muratova, G.
A. Shishkina, and S. I. Bakhlanov, 1993, JETP Lett. 57, 768.Detwiler, J., 2000, KAMLAND note 00-06, unpublished.Eadie, W. T., et al., 1971, Statistical Methods of Experimental
Physics (North-Holland, Amsterdam).Eders, G., 1966, Nucl. Phys. 78, 657.Eitel, K., 2000, Nucl. Phys. B, Proc. Suppl. 91, 191.Fayans, S. A., 1985, Sov. J. Nucl. Phys. 42, 590.Feldman, G. J., and R. D. Cousins, 1998, Phys. Rev. D 57,
3873.Fisher, P., B. Kayser, and K. S. McFarland, 1999, Annu. Rev.
Nucl. Part. Sci. 49, 481.Fukuda, S., et al., 2000, Phys. Rev. Lett. 85, 3999.Fukuda, S., et al., 2001a, Phys. Rev. Lett. 86, 5651.Fukuda, S., et al., 2001b, Phys. Rev. Lett. 86, 5656.Fukuda, Y., et al., 1998, Phys. Rev. Lett. 81, 1562.Fukuda, Y., et al., 1999, Phys. Rev. Lett. 82, 2430.Gratta, G., et al., 1997, Nucl. Instrum. Methods Phys. Res. A
400, 456.Groom, D. E., et al., 2000, Eur. Phys. J. C 15, 1.Hagner, C., M. Altmann, F. v. Feilitzsch, L. Oberauer, Y. De-
clais, and E. Kajfasz, 1995, Phys. Rev. D 52, 1343.Hahn, A. A., K. Schreckenbach, W. Gelletly, F. v. Feiltizsch, G.
Colvin, and B. Krusche, 1989, Phys. Lett. B 218, 365.Harrison, P. F., D. H. Perkins, and W. C. Scott, 1996, Phys.
Lett. B 349, 137.James, F., 1994, MINUIT Reference Manual, vers. 94.1.Kajita, T., and Y. Totsuka, 2001, Rev. Mod. Phys. 73, 85.Kirsten, T. A., 2000, Nucl. Phys. B, Proc. Suppl. 87, 152.Klapdor, H.-V., and J. Metzinger, 1982a, Phys. Rev. Lett. 48,
127.Klapdor, H.-V., and J. Metzinger, 1982b, Phys. Lett. 112B, 22.Kodama, K., et al., 2001, Phys. Lett. B 504, 218.Kopeikin, V. I., L. A. Mikaelyan, and V. V. Sinev, 1997, Phys.
At. Nucl. 60, 172.Kozlov, Y. V., S. V. Khaltourtcev, I. N. Machulin, A. V. Marte-
myanov, V. P. Martemyanov, S. V. Sukhotin, V. G. Tarasenkov,E. V. Turbin, and V. N. Vyrodov, 2000, Phys. At. Nucl. 63,1016.
Krauss, L., et al., 1984, Nature (London) 310, 191.Kuvshinnikov, A. A., L. A. Mikaelyan, S. V. Nikolaev, M. D.
Skorokhvatov, and A. V. Etenko, 1990, Sov. J. Nucl. Phys. 52,300.
Kwon, H., F. Boehm, A. A. Hahn, H. E. Henrikson, J.-L.Vuilleumier, J.-F. Cavaignac, D. H. Koang, B. Vignon, F. v.Feilitzsch, and R. L. Mossbauer, 1981, Phys. Rev. D 24, 1097.

328 Bemporad, Gratta, and Vogel: Reactor-based neutrino oscillation experiments
Llewellyn-Smith, C. H., 1972, Phys. Rep. 3, 261.Maki, Z., M. Nakagawa, and S. Sakata, 1962, Prog. Theor.
Phys. 28, 870.Marx, G., 1969, Czech. J. Phys., Sect. B 19, 1471.Marx, G., and I. Lux, 1970, Acta Phys. Acad. Sci. Hung. 28, 63.Mikaelyan, L., 2000, Nucl. Phys. B, Proc. Suppl. 91, 120.Mikheyev, S. P., and A. Yu. Smirnov, 1986a, Sov. J. Nucl. Phys.
42, 913.Mikheyev, S. P., and A. Yu. Smirnov, 1986b, Nuovo Cimento
Soc. Ital. Fis., C 91, 17.Miller, L., 2000, Ph.D. thesis (Stanford University).Nicolo, D., 1999, Ph.D. thesis (Scuola Normale Superiore,
Pisa).Pasierb, E., H. S. Gurr, J. Lathrop, F. Reines, and H. W. Sobel,
1979, Phys. Rev. Lett. 43, 96.Perl, M. L., et al., 1975, Phys. Rev. Lett. 35, 1489.Piepke, A., S. W. Moser, and V. M. Novikov, 1999, Nucl. In-
strum. Methods Phys. Res. A 432, 392.Pontecorvo, B., 1958, Sov. Phys. JETP 6, 429.Pontecorvo, B., 1967, Sov. Phys. JETP 33, 549.Oberauer, L., and F. von Feilitzsch, 1987, Phys. Lett. B 198,
113.Okamura, K., 1999, Ph.D. thesis (University of Tokyo).Raffelt, G., 1995, Stars as Laboratories for Fundamental Phys-
ics (University of Chicago, Chicago).Raghavan, R. S., S. Schoenert, S. Enamoto, J. Shirai, F. Sue-
kane, and A. Suzuki, 1998, Phys. Rev. Lett. 80, 635.Reines, F., and C. L. Cowan, Jr., 1953, Phys. Rev. 92, 830.Reines, F., and C. L. Cowan, Jr., 1959, Phys. Rev. 113, 273.Reines, F., H. S. Gurr, and H. W. Sobel, 1976, Phys. Rev. Lett.
37, 315.Reines, F., H. W. Sobel, and H. S. Gurr, 1974, Phys. Rev. Lett.
32, 180.Reines, F., H. W. Sobel, and E. Pasierb, 1980, Phys. Rev. Lett.
45, 1307.Riley, S. P., Z. D. Greenwood, W. R. Kropp, L. R. Price, F.
Rev. Mod. Phys., Vol. 74, No. 2, April 2002
Reines, H. W. Sobel, Y. Declais, A. Etenko, and M. Skorokh-vastov, 1999, Phys. Rev. C 59, 1780.
Rothschild, C. G., M. C. Chen, and F. P. Calaprice, 1998, Geo-phys. Res. Lett. 25, 1083.
Schoenert, S., 1999, Nucl. Phys. B, Proc. Suppl. 70, 195.Schoenert, S., L. Oberauer, C. Hagner, F. v. Feilitzsch, K.
Schreckenbach, Y. Declais, and Y. Mayerhofer, 1996, Nucl.Phys. B, Proc. Suppl. 48, 201.
Schreckenbach, K., G. Colvin, W. Gelletly, and F. v. Feiltizsch,1985, Phys. Lett. 160B, 325.
Tengblad, O., K. Aleklett, R. von Dincklage, E. Lund, G. Ny-man, and G. Rudstam, 1989, Nucl. Phys. A 503, 136.
Vidyakin, G. S., et al., 1994, JETP 59, 390.Vogel, P., 1984a, Phys. Rev. D 29, 1918.Vogel, P., 1984b, Phys. Rev. D 30, 1505.Vogel, P., and J. F. Beacom, 1999, Phys. Rev. D 60, 053003.Vogel, P., and J. Engel, 1989, Phys. Rev. D 39, 3378.Vogel, P., G. K. Schenter, F. M. Mann, and R. E. Schenter,
1981, Phys. Rev. C 24, 1543.Wang, Y.-F., V. Balic, G. Gratta, A. Fasso, S. Roessler, and A.
Ferrari, 2001, Phys. Rev. D 64, 013012.Wang, Y.-F., L. Miller, and G. Gratta, 2000, Phys. Rev. D 62,
013012.Wilkinson, D. H., 1982, Nucl. Phys. A 377, 474.Winter, K., 1991, Ed., Neutrino Physics (Cambridge University,
Cambridge, England).Wojcicki, S., 2001a, Nucl. Phys. B, Proc. Suppl. 91, 216.Wojcicki, S., 2001b, in Proceedings of the 9th International
Workshop on Neutrino Telescopes, Venice, edited by M.Baldo-Ceolin (Istituto Nazionale di Fısica Nucleare, Padova,Italy).
Wolfenstein, L., 1979, Phys. Rev. D 17, 2369.Wolfenstein, L., 1980, Phys. Rev. D 20, 2634.Zacek, G., 1984, Ph.D. thesis (Technical University Munich).Zacek, G., et al., 1986, Phys. Rev. D 34, 2621.Zuber, K., 1998, Phys. Rep. 305, 296.