first quarter 2016 report - swiss re4 swiss re first quarter 2016 reportkey events key events 23...
TRANSCRIPT

First Quarter 2016 Report
We make the world more resilient.

USD millions, unless otherwise stated 2015 2016 Change in %
GroupNet income attributable to common shareholders 1 440 1 229 –15Premiums earned and fee income 7 562 7 940 5Earnings per share in CHF 4.00 3.68 –8Common shareholders’ equity (31.12.2015/31.03.2016) 32 415 34 827 7Return on equity1 in % 16.1 14.6Return on investments in % 3.9 3.7Net operating margin in % 21.2 17.8Number of employees2 (31.12.2015/31.03.2016) 12 767 13 194 3Property & Casualty ReinsuranceNet income attributable to common shareholders 808 587 –27Premiums earned 3 767 3 956 5Combined ratio in %3 84.3 93.3Net operating margin in % 25.4 18.0Return on equity1 in % 22.7 19.1Life & Health ReinsuranceNet income attributable to common shareholders 277 244 –12Premiums earned and fee income4 2 607 2 835 9Net operating margin in % 14.5 12.1Return on equity1 in % 17.2 16.1Corporate SolutionsNet income attributable to common shareholders 167 80 –52Premiums earned 882 865 –2Combined ratio in % 87.8 90.4Net operating margin in % 22.9 12.3Return on equity1 in % 29.0 13.5Life CapitalNet income attributable to common shareholders 206 321 56Premiums earned and fee income4 306 284 –7Gross cash generation5 52 –25 –148Net operating margin in % 28.5 44.9Return on equity1 in % 12.7 21.2
1 Return on equity is calculated by dividing net income attributable to common shareholders by average common shareholders’ equity.2 Regular staff.3 Letter of credit fees of USD 14 million in 2015, thereof USD 3 million in Property & Casualty Reinsurance, have been reclassified from Operating expenses
to Interest expenses.4 The primary life and health insurance business (individual and group) is reported in the Life Capital segment instead of the Life & Health Reinsurance segment.
Comparative information for 2015 has been restated accordingly.5 Gross cash generation is the change in excess capital available over and above the target capital position, with the target capital being the minimum statutory
capital plus the additional capital required by Life Capital’s capital management policy.
Key Information
0
20
40
60
80
100
2015 20162014201320122011
Swiss Re Swiss Market IndexSTOXX Europe 600 Insurance Index
Share price (CHF)
Share information
Share information As of 26 April 2016
Share price in CHF 88.80Market capitalisation in CHF millions 32 919
Share performance in % 1 January 2011 ‒ 26 April 2016 (p.a.) Year to 26 April 2016
Swiss Re 11.3 –9.5Swiss Market Index 4.4 –8.4STOXX Europe 600 Insurance Index 10.0 –10.3
Financial strength ratingsAs of 26 April 2016 Standard & Poor’s Moody’s A.M. Best
Rating AA- Aa3 A+Outlook Stable Stable StableLast update 30 November 2015 15 December 2015 11 December 2015
Financial highlightsFor the three months ended 31 March

Letter to shareholders 2Key events 4Business Units at a glance 6Group results 8Reinsurance 10Property & Casualty Reinsurance 10Life & Health Reinsurance 12Corporate Solutions 13Life Capital 14 Group financial statements 16Income statement 16Statement of comprehensive income 17Balance sheet 18Statement of shareholders’ equity 20Statement of cash flow 21 Notes to the Group financial statements 22Note 1 Organisation and summary of significant accounting policies 22Note 2 Information on business segments 26Note 3 Insurance information 36Note 4 Premiums written 41Note 5 Deferred acquisition costs (DAC) and acquired present value
of future profits (PVFP) 42Note 6 Investments 44Note 7 Fair value disclosures 52Note 8 Derivative financial instruments 65Note 9 Acquisitions 69Note 10 Debt and contingent capital instruments 72Note 11 Earnings per share 73Note 12 Variable interest entities 74Note 13 Benefit plans 79Note 14 Subsequent events 80
General information 82Cautionary note on forward-looking statements 82Note on risk factors 84Contacts 91Corporate calendar 91
Content
Swiss Re Ltd Swiss Re Ltd is the holding company of the Swiss Re Group. Its shares are listed in accordance with the International Reporting Standard on the SIX Swiss Exchange and trade under the symbol SREN.

2 Swiss Re First Quarter 2016 Report
Letter to shareholders
Letter to shareholders
Keeping steady in challenging conditions
Dear shareholders,
We are pleased to report a strong net income of USD 1.2 billion for the first quarter of 2016, with contributions from all three Business Units. This performance comes amid continued market pressure and volatile financial markets – external developments that emphasise the importance of our very strong capital position and the strategic framework that drives our priorities for 2016 and beyond.
Net income for Reinsurance was USD 831 million, with Property & Casualty Reinsurance accounting for USD 587 million, a strong performance amid overall market pressure, helped by the absence of large natural catastrophes. Life & Health Reinsurance accounted for the remaining USD 244 million and delivered a solid annualised return on equity of 16.1%, above our target range. Among the highlights for the Business Unit was the co-insurance transaction with Citigroup and Primerica Life Insurance Company, which demonstrates our client access and differentiated approach.
Corporate Solutions reported net income of USD 80 million. The Business Unit has delivered on its strategy despite a softening external price environment. As the recent acquisition of US employer stop loss business IHC Risk Solutions highlights, there are attractive opportunities for growth. We continue to invest in Corporate Solutions as opportunities arise, keeping the focus on future profitability.
Life Capital, which includes Admin Re®, reports on its performance for the first time this quarter. Its net income for the first three months of 2016 was USD 321 million. The Business Unit also reported a very strong ROE of 21.2%. The result included a significant contribution from Guardian Financial Services, the acquisition of which we closed in January this year. We remain confident that Life Capital is the right vehicle to diversify our business and allocate capital to attractive and growing life and health risk pools.
Despite a challenging external environment, we maintained an attractive Property & Casualty portfolio through our April treaty renewals. Large and tailored transactions – such as that with AIG – continue to drive a growing share of our results. These are complex solutions that bring unique added value to our clients.
The fundamental underlying demand for reinsurance remains strong. Our role in absorbing risk, closing the protection gaps across all lines of business and contributing to a more resilient world is as crucial as ever.
The current environment shows even more how important it is that we remain focused on the long-term, setting ourselves apart from the market by applying a knowledge-led approach on a global scale.
1.2Group net income (USD billions) For the first three months of 2016

Swiss Re First Quarter 2016 Report 3
Walter B. Kielholz Chairman of the Board of Directors
Michel M. Liès Group CEO
In a recent example, our latest sigma study draws key takeaways from the explosion in Tianjin, China, the largest insured loss event of 2015. The tragedy highlights the potential for accumulation risk in large transportation hubs, and we encourage clients and peers to enhance risk mapping in aggregation points and hazard zones.
To better help our clients to grow in markets and segments where a lack of risk experience and data exists, we have launched our proprietary Liability Risk Drivers model, a unique forward-looking model approach to adapt to a rapidly changing world.
We also team up with partners who can help us understand how our markets are changing. Together with mapping company HERE, we analysed the insurance implications of connected and automated cars.
Lastly, we recently updated our Financial Repression Index, the first of its kind, which shows that financial repression remains near a record high, hurting households, long-term investors and the insurance industry. As a result, less money is available for investments that support sustainable economic growth.
Walter B. Kielholz Chairman of the Board of Directors
Michel M. Liès Group CEO
Zurich, 29 April 2016
In these and countless other cases, we use our knowledge to benefit our clients. They are also an example of the dedication of our employees, who come up with fresh perspectives and innovative ideas, and disseminate this knowledge to make the difference. We thank them for the progress we’ve made this quarter.
We also would like to thank you, our shareholders, for your continued support and the confidence you place in us. In this quarter, we completed the 2015 share buy-back programme of up to CHF 1.0 billion purchase value. The Annual General Meeting (AGM)last week also approved a new share buy-back programme of up to the same value which can be exercised ahead of the 2017 AGM.
With the company on a steady course, we feel there’s no better time for the Group CEO succession at the helm of Swiss Re. The new strategic framework we unveiled last year is the road map to ensure our future success.
Christian Mumenthaler, who becomes Group CEO in July, is well equipped to continue to steer our company through these challenging times.
We are also pleased to announce that Moses Ojeisekhoba, currently Regional President and CEO Reinsurance, Asia and a member of the Group Executive Committee, will become the new CEO Reinsurance. Jayne Plunkett, currently Head Casualty Reinsurance, will succeed Moses Ojeisekhoba as Regional President and CEO Reinsurance, Asia. As part of this move Jayne Plunkett will become a member of the Group Executive Committee.
We are confident that Swiss Re will continue to shape the re/insurance industry, enabling the risk-taking our society depends on and contributing to making the world progress and thrive.
Thank you for joining us on this journey.

4 Swiss Re First Quarter 2016 Report
Key events
Key events
23 February 2016 Swiss Re reports 31% rise in 2015 net income to USD 4.6 billion;Christian Mumenthaler will become Group CEO as of 1 July 2016Swiss Re reported a strong full-year net income of USD 4.6 billion for 2015, USD 938 million of which was earned in the fourth quarter. All business segments contributed to this result, with L&H Re in particular delivering a strong increase in net income after the successful management actions in 2014. With a clear focus during the past five years on the 2011–2015 Group financial targets, Swiss Re successfully delivered on its return on equity (ROE) and earnings per share (EPS) targets.
3 March 2016 Swiss Re completes the public share buy-back programme Swiss Re announced that it has completed the public share buy-back programme of up to CHF 1.0 billion purchase value, authorised by the Annual General Meeting on 21 April 2015 and launched on 12 November 2015.
16 March 2016 Swiss Re proposes an 8.2% increase in the regular dividend to CHF 4.60 and a CHF 1.0 billion share buy-back programme At Swiss Re’s Annual General Meeting of shareholders on 22 April 2016, the Board of Directors proposed a regular dividend of CHF 4.60 per share. In addition, the Board of Directors requested the authorisation of a new public share buy-back programme of up to CHF 1.0 billion purchase value. The Board of Directors further proposed the election of Sir Paul Tucker as a new member to the Board of Directors. Swiss Re also published its 2015 Annual Report and its Economic Value Management (EVM) 2015 Annual Report.
30 March 2016 Global insured losses from disasters reach USD 37 billion in 2015; Tianjin explosion caused the biggest insured loss, Swiss Re sigma study says According to the latest sigma study, global insured losses from natural catastrophes and man-made disasters in 2015 were USD 37 billion, well below the USD 62 billion average of the previous 10 years. There were 353 disaster events last year. The biggest catastrophe event in 2015 occurred at the Port of Tianjin in China.
22 April 2016 Swiss Re shareholders approve all proposals put forward by the Board of Directors at Swiss Re’s Annual General Meeting Swiss Re’s shareholders approved all proposals put forward by the Board of Directors at its Annual General Meeting in Zurich. This included the increase in regular dividend to CHF 4.60 per share and a new public share buy-back programme of up to CHF 1.0 billion purchase value.

Swiss Re First Quarter 2016 Report 5
This page intentionally left blank

6 Swiss Re First Quarter 2016 Report
Business Units at a glance
The swiss Re gRoup
Business Units at a glanceswiss Re is a leader in wholesale reinsurance, insurance and risk transfer solutions. our clients include insurance companies, corporations, the public sector and policyholders.
Business Unit Net premiums earned and fee income (usD millions)
Net income (usD millions)
Return on equity (annualised)
Operating performance
ReinsuranceReinsurance is swiss Re’s largest business in terms of income, providing about 85% of gross premiums and fee income through two segments – property & Casualty and Life & health. Reinsurance aims to extend swiss Re’s industry-leading position with disciplined underwriting, prudent portfolio management and diligent client service.
prop
erty
& C
asua
lty 19.1%(2015: 22.7%)
93.3%(2015: 84.3%) Combined ratio
Life
& h
ealth 16.1%
(2015: 17.2%)
12.1%(2015: 14.5%) Net operating margin
Corporate solutionsCorporate solutions serves mid-sized and large corporations, with product offerings ranging from traditional property and casualty insurance to highly customised solutions. Corporate solutions serves customers from more than 50 offices worldwide.
13.5%(2015: 29.0%)
90.4%(2015: 87.8%) Combined ratio
Life CapitalLife Capital manages closed and open life and health insurance books, including the existing Admin Re® business. The Business unit provides key diversification benefits to the group, helping to generate stable returns and seize attractive new opportunities. Life Capital is working to meet the growing challenges of ageing populations and rising health care costs around the world.
21.2%(2015: 12.7%)
–25m(2015: usD 52m) Gross cash generation
Total(after consolidation) 14.6%
(2015: 16.1%)
1.2bn(2015: usD 1.4bn) Group net income
Read more: page 10
Read more: page 13
Read more: page 14
587
808
2016
2015
244
277
2016
2015
80
167
2016
2015
321
206
2016
2015
1 229
1 440
2016
2015
3 956
3 767
2016
2015
2 835
2 607
2016
2015
865
882
2016
2015
284
306
2016
2015
7 940
7 562
2016
2015

Swiss Re First Quarter 2016 Report 7
Business Unit Net premiums earned and fee income (usD millions)
Net income (usD millions)
Return on equity (annualised)
Operating performance
ReinsuranceReinsurance is swiss Re’s largest business in terms of income, providing about 85% of gross premiums and fee income through two segments – property & Casualty and Life & health. Reinsurance aims to extend swiss Re’s industry-leading position with disciplined underwriting, prudent portfolio management and diligent client service.
prop
erty
& C
asua
lty 19.1%(2015: 22.7%)
93.3%(2015: 84.3%) Combined ratio
Life
& h
ealth 16.1%
(2015: 17.2%)
12.1%(2015: 14.5%) Net operating margin
Corporate solutionsCorporate solutions serves mid-sized and large corporations, with product offerings ranging from traditional property and casualty insurance to highly customised solutions. Corporate solutions serves customers from more than 50 offices worldwide.
13.5%(2015: 29.0%)
90.4%(2015: 87.8%) Combined ratio
Life CapitalLife Capital manages closed and open life and health insurance books, including the existing Admin Re® business. The Business unit provides key diversification benefits to the group, helping to generate stable returns and seize attractive new opportunities. Life Capital is working to meet the growing challenges of ageing populations and rising health care costs around the world.
21.2%(2015: 12.7%)
–25m(2015: usD 52m) Gross cash generation
Total(after consolidation) 14.6%
(2015: 16.1%)
1.2bn(2015: usD 1.4bn) Group net income

8 Swiss Re First Quarter 2016 Report
Group results
Group results
Swiss Re reported strong net income of USD 1.2 billion for the first quarter of 2016, down from USD 1.4 billion for the same period in 2015, reflecting solid underwriting, supported by net realised gains from the investment portfolio of Guardian Financial Services (Guardian). The net operating margin for the 2016 period was 17.8%, compared to 21.2% for the first three months of 2015.
Net income for Reinsurance was usD 831 million, down from usD 1.1 billion for the same period of the previous year. property & Casualty Reinsurance accounted for usD 587 million, compared to usD 808 million in the first quarter of 2015, reflecting continued good underwriting and benign natural catastrophe experience, partly offset by negative prior-year development. Life & health Reinsurance contributed usD 244 million for the first three months of 2016, compared to usD 277 million for the same period in 2015, driven by lower net realised gains and translating into a net operating margin of 12.1% for the first quarter of 2016 and 14.5% for the same period in 2015.
Corporate solutions reported net income of usD 80 million for the first quarter of 2016, compared to usD 167 million for the same period of the previous year. The 2016 result was driven by profitable performance across most lines of business and moderate income from investment activities, partially offset by realised losses from insurance in derivative form due to the continued impact of the unseasonably mild winter.
Life Capital, which includes Admin Re®, delivered net income of usD 321 million for the first three months of 2016. Admin Re® generated usD 206 million in the same period of 2015. The 2016 result also included the contribution from guardian from the date of acquisition. Net realised gains from the guardian investment portfolio contributed to income in the current
period. The first quarter of 2015 benefited from Admin Re®’s net realised gains resulting from portfolio repositioning ahead of solvency ii as well as tax credits in the uK. Life Capital’s net operating margin increased as a result to 44.9% for the first quarter of 2016, compared to 28.5% in the same period of the previous year.
Common shareholders’ equity, excluding non-controlling interests and the impact of contingent capital instruments, increased to usD 34.8 billion as of 31 March 2016 from usD 32.4 billion at the end of December 2015, reflecting the net income for the quarter and unrealised gains on fixed income securities, partially offset by the share buy-back completed on 2 March 2016. Annualised return on equity was 14.6% for the first three months of 2016 compared to 13.7% for the full year 2015 and 16.1% (annualised) for the first quarter of 2015. earnings per share for the 2016 period were ChF 3.68 or usD 3.68, compared to ChF 4.00 (usD 4.21) for the first three months of 2015.
Book value per common share increased to usD 105.04 or ChF 100.57 at the end of March 2016, compared to usD 95.98 or ChF 96.04 at the end of December 2015. Book value per common share is based on common shareholders’ equity and excludes non-controlling interests and the impact of contingent capital instruments.
Business performancepremiums earned and fee income for the group totalled usD 7.9 billion for the first three months of 2016, up from usD 7.6 billion in the same quarter of the previous year. At constant exchange rates, premiums and fees increased by 9.0%, reflecting growth in selected markets and lines of business, often through large and tailored transactions.
premiums earned by property & Casualty Reinsurance came to usD 4.0 billion, up from usD 3.8 billion for the same period
of the previous year. At constant exchange rates, premiums earned increased by 8.9%, mainly driven by large transactions in the us and europe. The property & Casualty Reinsurance combined ratio was 93.3%, compared to 84.3% for the first quarter of 2015. while both quarters benefited from the absence of major natural catastrophe losses, the first quarter of 2016 was impacted by adverse prior-year development and a continued softening of the market.
Corporate solutions premiums earned decreased to usD 865 million, a decrease of 1.9% compared to the same period of 2015, driven by foreign exchange movements. At constant exchange rates, premiums earned increased by 0.6%. The Corporate solutions combined ratio for the first quarter of 2016 was 90.4%, compared to 87.8% for the same period of the previous year, with the prior year benefiting from favourable prior-year development. in line with property & Casualty Reinsurance, both periods benefited from the very low level of natural catastrophe losses.
Life & health Reinsurance premiums earned and fee income totalled usD 2.8 billion, driven by growth in all regions, including a new large in-force transaction in the us and other new transactions in late 2015. At constant exchange rates, premiums earned and fees increased by 13.6%.
gross cash generation for Life Capital was a negative usD 25 million for the first three months of 2016, compared to a positive usD 52 million for the same period of the previous year. gross cash generation for the uK business is determined by solvency ii from January 2016, which is more sensitive to economic movements than its predecessor. As a result, large movements in interest rates and credit spreads can have a more pronounced impact on reported gross cash generation, as they have in the current period.

Swiss Re First Quarter 2016 Report 9
Investment result and expensesThe group’s investment portfolio, excluding unit-linked and with-profit investments, increased to usD 138.1 billion as of 31 March 2016, compared to usD 116.8 billion at the end of 2015. The increase was largely due to the acquisition of guardian.
The return on investments was 3.7% for the first quarter of 2016, compared to 3.9% for the same period of 2015, primarily as a result of lower net realised gains from sales.
The group’s non-participating net investment income was usD 934 million, up from usD 890 million for the first three months of 2015, driven by the larger investment portfolio. The group’s fixed income running yield for the first quarter was 3.0% in 2016, in line with the same period in 2015.
The group reported non-participating net realised gains of usD 692 million for the first quarter of 2016, compared to usD 559 million for the same period in 2015. The increase was primarily related to significant net realised gains within the guardian portfolio.
Acquisition costs for the group increased to usD 1.8 billion for the first quarter of 2016, up from usD 1.5 billion for the same period of the previous year, mainly reflecting a large transaction in Life & health and a higher share of proportional business in property & Casualty Reinsurance.
operating expenses amounted to usD 745 million for the first quarter of 2016, down from usD 770 million for the same period in 2015. At constant exchange rates, operating expenses remained largely stable.
interest expenses were usD 155 million, a slight reduction compared to the same period of the previous year.
The group reported a tax charge of usD 311 million on a pre-tax income of usD 1.6 billion for the first quarter of 2016, compared to a tax charge of usD 294 million on a pre-tax income of usD 1.8 billion for the same period in 2015. This translated into an effective tax rate in the current and previous year reporting periods of 20.0% and 16.8%, respectively. The higher rate in the current period was largely driven by lower benefits from the release of valuation allowance and by adjustments to prior-year provisions, partially offset by lower tax on profits earned in the various jurisdictions.
Income statementusD millions 2015 2016 Change in %
Revenuesgross premiums written 10 076 11 395 13Net premiums written 9 682 10 872 12Change in unearned premiums –2 269 –3 060 35Premiums earned 7 413 7 812 5Fee income from policyholders 149 128 –14Net investment income – non-participating 890 934 5Net realised investment gains/losses – non-participating 559 692 24Net investment result – unit-linked and with-profit 1 441 405 –72other revenues 12 12 0Total revenues 10 464 9 983 –5
ExpensesClaims and claim adjustment expenses –2 435 –2 867 18Life and health benefits –2 357 –2 539 8Return credited to policyholders –1 452 –350 –76Acquisition costs –1 538 –1 773 15operating expenses1 –770 –745 –3Total expenses before interest expenses –8 552 –8 274 –3
Income before interest and income tax expense 1 912 1 709 –11interest expenses1 –161 –155 –4Income before income tax expense 1 751 1 554 –11income tax expense –294 –311 6Net income before attribution of non-controlling interests 1 457 1 243 –15
income attributable to non-controlling interests 3 –Net income after attribution of non-controlling interests 1 457 1 246 –14
interest on contingent capital instruments –17 –17 0Net income attributable to common shareholders 1 440 1 229 –15
1 Letter of credit fees of usD 14 million in 2015 have been reclassified from operating expenses to interest expenses.

10 Swiss Re First Quarter 2016 Report
Reinsurance
Reinsurance
Net income for the first quarter of 2016 was usD 587 million compared to usD 808 million in the same period of 2015. The net operating margin was 18.0% in the current period, down from 25.4% in the first quarter of 2015. The first quarter of 2016 result reflected good underwriting results and benign natural catastrophe experience, partly offset by unfavourable prior-year development and a higher man-made loss burden. The investment result was higher in the first quarter of 2016 than in the same period of 2015, mainly due to a positive impact from foreign exchange remeasurement.
Net premiums earned Net premiums earned increased 5% to usD 4.0 billion in the first quarter of 2016, compared to usD 3.8 billion in the same period of 2015. The increase was driven by large transactions in the us and europe, partially offset by unfavourable foreign exchange movements.
Combined ratioproperty & Casualty Reinsurance reported a combined ratio of 93.3% for the first quarter of 2016, compared to 84.3% in the prior-year period. The increase was mainly driven by adverse prior-year development in 2016, compared to reserve releases in the first quarter of 2015 and the continued softening of the market. Both periods benefited from benign natural catastrophe experience.
The expected impact from large natural catastrophes for the first quarter of 2016 was 5.9 percentage points, while the actual impact was nil. The unfavourable development of prior accident years impacted the combined ratio by –3.5 percentage points in the first quarter of 2016, compared to a favourable impact from reserve releases of 1.6 percentage points in the same quarter of 2015.
Administrative expense ratioThe administrative expense ratio improved to 7.1% in the first quarter of 2016, compared to 7.9% in the first quarter of 2015, driven by a lower expense base and a higher premium volume quarter over quarter.
Lines of businessThe property combined ratio increased to 80.9% in the first quarter of 2016, compared to 73.1% in the first quarter of 2015. Natural catastrophe experience in both periods was benign. The first quarter of 2016 was impacted by rate reductions and the unfavourable development of earthquake losses in New Zealand, compared to reserve releases in the same period of 2015.
The casualty combined ratio increased by 8.8 percentage points to 109.2% in the first quarter of 2016, compared to 100.4% in the first quarter of 2015. The increase was mainly driven by reserve strengthening. The prior-year period benefited from reserve releases.
The specialty combined ratio increased to 76.7% for the first quarter of 2016, compared to 68.4% in the first quarter of 2015, impacted by overall less favourable prior accident year development, particularly a credit loss in spain.
property & Casualty Reinsurance
The Reinsurance Business unit, which comprises the segments property & Casualty Reinsurance and Life & health Reinsurance, reported a net income of usD 831 million in the first quarter of 2016. summaries of each segment’s performance are below.

Swiss Re First Quarter 2016 Report 11
Investment resultThe return on investments was 3.5% in the first quarter of 2016 compared to 4.2% in the same period of 2015, reflecting a decrease in the investment result of usD 88 million, mainly due to lower net realised gains.
Net investment income decreased by usD 41 million to usD 230 million in the first quarter of 2016, mainly due to reduced income from equity-accounted positions.
Net realised gains were usD 156 million compared to usD 202 million in the first quarter of 2015, as the current period included lower gains from sales of equity securities.
insurance-related investment results as well as foreign exchange remeasurement are not included in the figures above.
Shareholders’ equity Common shareholders’ equity decreased to usD 11.7 billion as of 31 March 2016 from usD 13.0 billion as of 31 December 2015, primarily driven by dividends declared to the group, partly offset by net income for the quarter, higher unrealised gains and the impact of foreign exchange movements. The annualised return on equity for the first quarter of 2016 was 19.1% compared to 22.7% in the same quarter of 2015. The decrease was mainly due to the lower net income in 2016.
Outlookprice erosion for property catastrophe business has slowed but abundant capital and low loss occurrence still create downward pressure. we reduced catastrophe capacity deployment and will continue to do so where price levels fall below our return hurdles. we observe further pressure on rates for special lines, with notable differences by lines of business and markets. Casualty markets overall remain generally more stable with differences among segments. successful differentiation will remain the key for new business, private deals and differential pricing.
we continue to execute our successful differentiation strategy while focusing on the bottom line in a softening market environment. This allows us to access the business we want and to achieve above average rates.

12 Swiss Re First Quarter 2016 Report
Reinsurance
Life & health Reinsurance
Net income was usD 244 million for the first quarter of 2016 compared to usD 277 million for the first quarter of 2015. The prior-year result benefited from higher foreign exchange remeasurement gains. excluding realised gains and foreign exchange remeasurement impact in both periods, earnings in the 2016 first quarter were stable. The annualised return on equity was 16.1%.
Net premiums earned and fee incomepremiums earned and fee income rose by 8.7% to usD 2.8 billion compared to the prior year, driven by growth in all regions, including a new large in-force transaction in the us and other new transactions in late 2015. At constant foreign exchange rates, premiums earned and fee income were 13.6% higher in the first quarter of 2016 than in the same period of 2015.
Net operating margin The net operating margin was 12.1% for the first quarter of 2016, compared to 14.5% in the same period of 2015. The 2016 margin figure was impacted by lower foreign exchange remeasurement gains and higher revenues. excluding the non-participating realised gains and the foreign exchange remeasurement impact in both periods, the margins were slightly lower in the first quarter of 2016 than in the same period of 2015.
Management expense ratio The management expense ratio was 5.2%, a slight improvement over the prior-year period, driven by a lower expense base and higher premiums in the current year.
Lines of businessincome before interest and income tax expense (eBiT) for the life business slightly decreased to usD 152 million in the first quarter of 2016, from usD 159 million in the same period of 2015. Results in the current period were impacted by more unfavourable mortality experience in the uK, partly offset by more favourable experience in Australia.
eBiT for the health business of usD 139 million was in line with the first quarter of 2015, which was usD 140 million. The 2016 result was impacted by higher critical illness claims and an update to claims incurred but not reported (iBNR) in the uK, partly offset by favourable model updates in Australia.
Investment result The return on investments was 3.6% in the first quarter of 2016 compared to 3.4% in the same period of 2015, reflecting an increase in the investment result of usD 10 million, mainly due to higher net realised gains. The fixed income running yield for the first quarter of 2016 was 3.5%, which was in line with the prior-year period.
Net investment income increased by usD 1 million to usD 272 million in the first quarter of 2016, and thus was in line with the prior year.
Net realised gains were usD 38 million compared to usD 29 million in the first quarter of 2015. The prior period included losses from interest rate derivatives, while there were lower net realised gains from sales of fixed income securities in the current period.
insurance-related investment results as well as foreign exchange remeasurement are not included in the figures above.
Shareholdersʼ equityCommon shareholders’ equity increased to usD 6.3 billion as of 31 March 2016 from usD 5.8 billion as of 31 December 2015. The increase was mainly due to net income and higher unrealised gains reflecting a decline in interest rates, partially offset by dividend declared to the group.
Return on equity was 16.1% for the first quarter of 2016 compared to 17.2% for the same period of 2015. The reduction was mainly due to lower net income.
Outlookwe expect life and health reinsurance business to be relatively flat in mature markets and to increase in high growth markets. in mature markets the prolonged low interest rate environment continues to have an unfavourable impact on long-term life business and cession rates in the us are generally expected to decrease as primary insurers retain more risk. however, we see a strong focus on capital, risk and balance sheet optimisation in mature markets, leading to positive opportunities for large transactions. high growth markets are expected to see strong increases in primary life and health volumes and cession rates are expected to be stable.
we will continue to pursue growth opportunities in high growth markets and in large transactions, including longevity deals. we are responding to the expanding need for health protection driven by ageing societies and we will apply our experience to help reduce the protection gap in all regions.

Swiss Re First Quarter 2016 Report 13
Corporate solutions
Corporate solutions continued to execute its growth plan.
in March 2016, Corporate solutions completed the previously announced acquisition of ihC Risk solutions, LLC (ihC), a leading us employer stop loss underwriter. This acquisition broadens Corporate solutions capabilities in the small- and middle-market self-funded healthcare benefits segment. Corporate solutions will now focus on the integration of ihC’s operations, with ihC immediately adopting the swiss Re Corporate solutions brand.
PerformanceNet income was usD 80 million in the first quarter of 2016, compared to usD 167 million in the same period of 2015, with a net operating margin of 12.3%, down from 22.9%. The 2016 result was driven by profitable business performance across most lines of business and moderate income from investment activities, partially offset by realised losses from insurance in derivative form, due to the continued impact of the unseasonably mild winter.
Net premiums earnedNet premiums were usD 865 million in the first quarter of 2016, a decrease of 1.9% compared to the same period of 2015, driven by foreign exchange rate movements. At constant exchange rates, net premiums increased 0.6%. gross premiums written and premiums for insurance in derivative form, net of internal fronting for the Reinsurance Business unit, increased 17.5%, or 20.8% at constant exchange rates, to usD 777 million in the first three months of 2016 compared to usD 661 million in the same period of 2015, driven by the ihC acquisition.
Combined ratioThe combined ratio increased by 2.6 percentage points to 90.4% in the first quarter of 2016 compared to 87.8% in the same period of 2015, with the prior period benefiting from favourable prior-year development.
Lines of business The property combined ratio for the first quarter of 2016 improved by 3.8 percentage points to 76.3%, reflecting continued profitable business performance in most regions. Both periods benefited from the absence of major natural catastrophe events.
The casualty combined ratio increased to 110.4% in the first three months of 2016 compared to 95.4% in the first quarter of 2015, impacted by two prior-year large loss movements in North America.
The credit combined ratio improved to 98.9% in the first quarter of 2016 compared to 110.1% in the same period of 2015. Both periods were impacted by a large loss, though to a lesser extent in 2016.
in other specialty lines, the combined ratio improved by 1.9 percentage points to 73.5% in the first quarter of 2016, mainly due to lower large man-made losses compared to the same period in 2015.
Investment resultThe return on investments was 2.2% for the first quarter of 2016, compared to 3.4% in the same period of 2015, reflecting a decrease in the investment result of usD 27 million.
Net investment income increased by usD 8 million to usD 41 million in the first quarter of 2016, driven by higher income from fixed income securities. Net realised gains were usD 5 million compared to usD 40 million in the first quarter of 2015, with lower net realised gains from sales of fixed income and equity securities.
insurance-related derivative results are not included in the investment figures above.
Corporate solutions offers insurance protection against weather perils and other risks, which are accounted for as derivatives. insurance in derivative form reported net realised losses of usD 13 million in the first quarter of 2016 compared to gains of usD 38 million in the same period of 2015. The 2016 period was impacted by the continued impact of the unseasonably mild winter.
Shareholders’ equityCommon shareholders’ equity increased to usD 2.5 billion since the end of 2015 due to net income and unrealised gains. The return on equity was 13.5% in the first quarter of 2016, compared to 29.0% in the same period of 2015.
Outlookprices for commercial insurance are under significant pressure, with a growing number of segments operating at unattractive rate levels. Corporate solutions maintains its commitment to underwriting discipline and believes that it is well positioned to successfully navigate an increasingly challenging market thanks to its value proposition, strong balance sheet and selective underwriting approach, but is not fully insulated from the general market environment.
14 Swiss Re First Quarter 2016 Report
Life Capital
Life Capital was created on 1 January 2016 to manage swiss Re’s closed and open life and health insurance books, including the existing Admin Re® business and the existing primary life and health insurance business formerly conducted by Life & health Reinsurance. Comparative information for 2015 has been restated accordingly.
During the first quarter of 2016, Life Capital reported net income of usD 321 million compared to usD 206 million in the first quarter of 2015. The 2016 result included the contribution from guardian Financial services, the acquisition of which Admin Re® announced last year. Net realised gains on the guardian investment portfolio contributed to the increase in net income in the period. The guardian acquisition — which is a strong demonstration of progress against our strategy to be a leading closed life book consolidator in the uK — was completed in January 2016, following regulatory approval. The Life Capital net income also reflected favourable Admin Re® uK actuarial valuation impacts. The prior year benefited from higher realised gains from sales of government bonds as part of the preparation for solvency ii, as well as tax credits in the uK.
The net operating margin for the first quarter of 2016 was 44.9% compared to 28.5% in the prior-year period with the increase driven by the strong performance in the current year.
Life Capital generated gross cash of negative usD 25 million in the first quarter of 2016 compared to a positive usD 52 million in the prior-year period. gross cash generation for the uK business is determined by solvency ii from January 2016, which is more sensitive to economic movements than its predecessor. As a result, large movements in interest rates and credit spreads can have a more pronounced impact on reported gross cash generation, as they have done in the current period.
Gross premiums writtengross premiums written increased by 14%, to usD 603 million during the first quarter of 2016. The increase was driven by the guardian business and the growth from the open life and health insurance books. gross premiums written in the comparative period have been restated to reflect the inclusion of the primary life and health insurance business.
Investment resultThe return on investments was 4.6% in the first quarter of 2016 compared to 5.2% in the same period of 2015, reflecting a decrease in the investment result of usD 4 million and higher average invested assets.
Net investment income increased by usD 54 million to usD 240 million in the first quarter of 2016, mainly from net asset inflows related to the guardian acquisition.
Net realised gains decreased by usD 58 million to usD 54 million in the first quarter of 2016. The prior period included gains from sales related to the re-positioning of the portfolio ahead of solvency ii, while the current period included gains from the guardian investment portfolio.
insurance-related investment results as well as foreign exchange remeasurement are not included in the figures above.
Expenses expenses were usD 108 million in the first quarter of 2016 compared to usD 91 million in the first quarter of 2015. The increase in expenses was due to the costs of running and integrating the guardian business.
Shareholders’ equityCommon shareholders’ equity increased by usD 2.2 billion compared to 31 December 2015 to usD 7.2 billion. The increase was driven by a usD 1.6 billion capital contribution from the group to partially fund the guardian acquisition. The annualised return on equity was 21.2% for the first quarter of 2016, compared to 12.7% for the first quarter of 2015. The increase was mainly due to higher net income.
OutlookThe Life Capital Business unit continues to pursue selective acquisition opportunities within the closed book market in eMeA and to dynamically grow its individual and group life and health business in europe and the us. Life Capital seeks to optimise capital and asset management to maximise cash generation and return on equity. in the closed book segment the focus remains on its operating platform to achieve operational efficiencies while in the open book segment the aim is to grow via innovation and the use of digital technology. Life Capital aims to generate significant cash while continuing to invest in its open book strategy.

Swiss Re First Quarter 2016 Report 15
This page intentionally left blank

16 Swiss Re First Quarter 2016 Report
Group financial statements (unaudited)
Income statementFor the three months ended 31 March
The accompanying notes are an integral part of the Group financial statements.
USD millions Note 2015 2016
RevenuesGross premiums written 4 10 076 11 395Net premiums written 4 9 682 10 872Change in unearned premiums –2 269 –3 060Premiums earned 3 7 413 7 812Fee income from policyholders 3 149 128Net investment income – non-participating business 6 890 934Net realised investment gains/losses – non-participating business1 6 559 692Net investment result – unit-linked and with-profit business 6 1 441 405Other revenues 12 12Total revenues 10 464 9 983
ExpensesClaims and claim adjustment expenses 3 –2 435 –2 867Life and health benefits 3 –2 357 –2 539Return credited to policyholders –1 452 –350Acquisition costs 3 –1 538 –1 773Operating expenses2 –770 –745Total expenses before interest expenses –8 552 –8 274
Income before interest and income tax expense 1 912 1 709Interest expenses2 –161 –155Income before income tax expense 1 751 1 554Income tax expense –294 –311Net income before attribution of non-controlling interests 1 457 1 243
Income attributable to non-controlling interests 3Net income after attribution of non-controlling interests 1 457 1 246
Interest on contingent capital instruments –17 –17Net income attributable to common shareholders 1 440 1 229
Earnings per share in USDBasic 11 4.21 3.68Diluted 11 3.83 3.35Earnings per share in CHF3
Basic 11 4.00 3.68Diluted 11 3.64 3.34
1 Total impairments for the three months ended 31 March were USD 5 million in 2015 and USD 33 million in 2016 of which USD 5 million and USD 33 million, respectively, were recognised in earnings.
2 Letter of credit fees of USD 14 million in 2015 have been reclassified from ”Operating expenses” to ”Interest expenses”.3 The translation from USD to CHF is shown for informational purposes only and has been calculated using the Group’s average exchange rates.

Swiss Re First Quarter 2016 Report 17
Statement of comprehensive incomeFor the three months ended 31 March
Reclassification out of accumulated other comprehensive incomeFor the three months ended 31 March
The accompanying notes are an integral part of the Group financial statements.
USD millions 2015 2016
Net income before attribution of non-controlling interests 1 457 1 243Other comprehensive income, net of tax:
Change in unrealised investment gains/losses 1 195 1 566Change in other-than-temporary impairment 1 5Change in foreign currency translation –929 137Change in adjustment for pension benefits 29 10
Total comprehensive income before attribution of non-controlling interests 1 753 2 961
Interest on contingent capital instruments –17 –17Comprehensive income attributable to non-controlling interests 3Total comprehensive income attributable to common shareholders 1 736 2 947
2015 USD millions
Unrealised investment
gains/losses1
Other-than- temporary
impairment1
Foreign currency translation1,2
Adjustment from pension benefits3
Accumulated other comprehensive
income
Balance as of 1 January 5 418 –3 –4 675 –825 –85Change during the period 1 927 2 –809 23 1 143Amounts reclassified out of accumulated other comprehensive income –347 16 –331Tax –385 –1 –120 –10 –516Balance as of period end 6 613 –2 –5 604 –796 211
2016 USD millions
Unrealised investment
gains/losses1
Other-than- temporary
impairment1
Foreign currency translation1,2
Adjustment from pension benefits3
Accumulated other comprehensive
income
Balance as of 1 January 2 748 –11 –5 687 –1 016 –3 966Change during the period 2 527 5 35 –2 2 565Amounts reclassified out of accumulated other comprehensive income –392 2 16 –374Tax –569 –2 102 –4 –473Balance as of period end 4 314 –6 –5 550 –1 006 –2 248
1 Reclassification adjustment included in net income is presented in the “Net realised investment gains/losses – non-participating business” line.2 Reclassification adjustment is limited to translation gains and losses realised upon sale or upon complete or substantially complete liquidation of an investment in a foreign
entity.3 Reclassification adjustment included in net income is presented in the “Operating expenses” line.

18 Swiss Re First Quarter 2016 Report
Group financial statements (unaudited)
Balance sheet
Assets
The accompanying notes are an integral part of the Group financial statements.
USD millions Note 31.12.2015 31.03.2016
Investments 6, 7, 8Fixed income securities:
Available-for-sale (including 11 897 in 2015 and 10 624 in 2016 subject to securities lending and repurchase agreements) (amortised cost: 2015: 76 155; 2016: 89 524) 79 435 95 068Trading (including 1 729 in 2015 and 1 815 in 2016 subject to securities lending and repurchase agreements) 2 896 2 868
Equity securities: Available-for-sale (including 605 in 2015 and 673 in 2016 subject to securities lending and repurchase agreements) (cost: 2015: 4 294; 2016: 3 932) 4 719 4 268Trading 68 88
Policy loans, mortgages and other loans 3 123 4 205Investment real estate 1 556 1 845Short-term investments (including 1 278 in 2015 and 1 865 in 2016 subject to securities lending and repurchase agreements) 7 405 8 190Other invested assets 10 367 12 055Investments for unit-linked and with-profit business (including fixed income securities trading: 4 069 in 2015 and 5 980 in 2016, equity securities trading: 22 783 in 2015 and 27 097 in 2016) 28 241 34 929Total investments 137 810 163 516
Cash and cash equivalents (including 319 in 2015 and 425 in 2016 subject to securities lending) 8 204 11 145Accrued investment income 983 1 119Premiums and other receivables 11 709 15 472Reinsurance recoverable on unpaid claims and policy benefits 6 578 8 267Funds held by ceding companies 9 870 8 906Deferred acquisition costs 5 5 471 6 186Acquired present value of future profits 5 2 964 2 294Goodwill 3 862 4 122Income taxes recoverable 191 178Deferred tax assets 5 970 6 395Other assets 2 523 3 886
Total assets 196 135 231 486

Swiss Re First Quarter 2016 Report 19
Liabilities and equity
The accompanying notes are an integral part of the Group financial statements.
USD millions Note 31.12.2015 31.03.2016
LiabilitiesUnpaid claims and claim adjustment expenses 55 518 57 684Liabilities for life and health policy benefits 7 30 131 46 281Policyholder account balances 31 422 36 802Unearned premiums 10 869 14 220Funds held under reinsurance treaties 3 320 3 551Reinsurance balances payable 1 928 2 026Income taxes payable 488 345Deferred and other non-current tax liabilities 8 093 9 203Short-term debt 10 1 834 2 381Accrued expenses and other liabilities 7 948 11 988Long-term debt 10 10 978 10 986Total liabilities 162 529 195 467
EquityContingent capital instruments 1 102 1 102Common shares, CHF 0.10 par value2015: 370 706 931; 2016: 370 706 931 shares authorised and issued 35 35Additional paid-in capital 482 521Treasury shares, net of tax –1 662 –2 236Accumulated other comprehensive income:
Net unrealised investment gains/losses, net of tax 2 748 4 314Other-than-temporary impairment, net of tax –11 –6Foreign currency translation, net of tax –5 687 –5 550Adjustment for pension and post-retirement benefits, net of tax –1 016 –1 006
Total accumulated other comprehensive income –3 966 –2 248
Retained earnings 37 526 38 755Shareholders’ equity 33 517 35 929
Non-controlling interests 89 90Total equity 33 606 36 019
Total liabilities and equity 196 135 231 486

20 Swiss Re First Quarter 2016 Report
Group financial statements (unaudited)
Statement of shareholders’ equityFor the twelve months ended 31 December and the three months ended 31 March
The accompanying notes are an integral part of the Group financial statements.
USD millions 2015 2016
Contingent capital instrumentsBalance as of 1 January 1 102 1 102IssuedBalance as of period end 1 102 1 102
Common sharesBalance as of 1 January 35 35Issue of common sharesBalance as of period end 35 35
Additional paid-in capitalBalance as of 1 January 1 806 482Share-based compensation 17 11Realised gains/losses on treasury shares –61 28Dividends on common shares1 –1 280Balance as of period end 482 521
Treasury shares, net of taxBalance as of 1 January –1 185 –1 662Purchase of treasury shares –584 –595Issuance of treasury shares, including share-based compensation to employees 107 21Balance as of period end –1 662 –2 236
Net unrealised investment gains/losses, net of taxBalance as of 1 January 5 418 2 748Changes during the period –2 670 1 566Balance as of period end 2 748 4 314
Other-than-temporary impairment, net of taxBalance as of 1 January –3 –11Changes during the period –8 5Balance as of period end –11 –6
Foreign currency translation, net of taxBalance as of 1 January –4 675 –5 687Changes during the period –1 012 137Balance as of period end –5 687 –5 550
Adjustment for pension and other post-retirement benefits, net of taxBalance as of 1 January –825 –1 016Changes during the period –191 10Balance as of period end –1 016 –1 006
Retained earningsBalance as of 1 January 34 257 37 526Net income after attribution of non-controlling interests 4 665 1 246Interest on contingent capital instruments, net of tax –68 –17Dividends on common shares1 –1 328Balance as of period end 37 526 38 755
Shareholders’ equity 33 517 35 929Non-controlling interests
Balance as of 1 January 111 89Changes during the period –25 4Income attributable to non-controlling interests 3 –3Balance as of period end 89 90
Total equity 33 606 36 019
1 Dividends to shareholders were paid in the form of a withholding tax-exempt repayment of legal reserves from capital contributions.

Swiss Re First Quarter 2016 Report 21
Statement of cash flowFor the three months ended 31 March
Interest paid was USD 79 million and USD 100 million (thereof USD 15 and 13 million for letter of credit fees) for the three months ended 31 March 2015 and 2016, respectively. Tax paid was USD 574 million and USD 301 million for the three months ended 31 March 2015 and 2016, respectively. The accompanying notes are an integral part of the Group financial statements.
USD millions 2015 2016
Cash flows from operating activitiesNet income attributable to common shareholders 1 440 1 229Add net income attributable to non-controlling interests –3
Adjustments to reconcile net income to net cash provided/used by operating activities:Depreciation, amortisation and other non-cash items 148 186Net realised investment gains/losses –1 796 –834Income from equity-accounted investees, net of dividends received 60 41Change in:
Technical provisions and other reinsurance assets and liabilities, net1 944 507Funds held by ceding companies and under reinsurance treaties 100 1 280Reinsurance recoverable on unpaid claims and policy benefits 222 99Other assets and liabilities, net –178 122Income taxes payable/recoverable –300 6Trading positions, net1 149 184
Net cash provided/used by operating activities 789 2 817
Cash flows from investing activitiesFixed income securities:
Sales 12 831 10 459Maturities 1 049 775Purchases –16 463 –11 614Net purchases/sales/maturities of short-term investments1 2 326 –443
Equity securities:Sales 399 490Purchases –1 361 –460
Securities purchased/sold under agreement to resell/repurchase, net 927 534Cash paid/received for acquisitions/disposal and reinsurance transactions, net 314Net purchases/sales/maturities of other investments1 1 662 1Net purchases/sales/maturities of investments held for unit-linked and with-profit business1 410 701Net cash provided/used by investing activities 1 780 757
Cash flows from financing activitiesPolicyholder account balances, unit-linked and with-profit business:1
Deposits 59 165Withdrawals –365 –833
Issuance/repayment of long-term debt 239 –36Issuance/repayment of short-term debt –427 540Purchase/sale of treasury shares –21 –590Net cash provided/used by financing activities –515 –754
Total net cash provided/used 2 054 2 820Effect of foreign currency translation –288 121Change in cash and cash equivalents 1 766 2 941Cash and cash equivalents as of 1 January 7 471 8 204Cash and cash equivalents as of 31 March 9 237 11 145
1 The Group changed the presentation of its investments related to unit-linked and with-profit business, and related deposits and withdrawals were reclassified from “Technical provisions, net” in the operating cash flow to “Policyholder account balances, unit-linked and with-profit business” in the financing cash flow. Comparative information for 2015 has been restated accordingly.
22 Swiss Re First Quarter 2016 Report
Notes to the Group financial statements (unaudited)
Notes to the Group financial statements
1 Organisation and summary of significant accounting policies
Nature of operationsThe Swiss Re Group, which is headquartered in Zurich, Switzerland, comprises Swiss Re Ltd (the parent company) and its subsidiaries (collectively, the “Swiss Re Group” or the “Group”). The Swiss Re Group is a wholesale provider of reinsurance, insurance and other insurance-based forms of risk transfer. Working through brokers and a network of offices around the globe, the Group serves a client base made up of insurance companies, mid- to large-sized corporations and public sector clients.
Basis of presentationThe accompanying consolidated financial statements have been prepared in accordance with accounting principles generally accepted in the United States of America (US GAAP) and comply with Swiss law. All significant intra-group transactions and balances have been eliminated on consolidation. The year-end balance sheet data presented was derived from audited financial statements. These interim financial statements do not include all disclosures that US GAAP requires on an annual basis and therefore they should be read in conjunction with the Swiss Re Group’s audited financial statements for the year ended 31 December 2015.
Use of estimates in the preparation of financial statementsThe preparation of financial statements requires management to make significant estimates and assumptions that affect the reported amounts of assets, liabilities, revenues and expenses as well as the related disclosures, including contingent assets and liabilities. The Group’s liabilities for unpaid claims and claim adjustment expenses and policy benefits for life and health include estimates for premium, claim and benefit data not received from ceding companies at the date of the financial statements. In addition, the Group uses certain financial instruments and invests in securities of certain entities for which exchange trading does not exist. The Group determines these estimates based on historical information, actuarial analyses, financial modelling and other analytical techniques. Actual results could differ significantly from the estimates described above.
On 6 January 2016, the Group acquired 100% of the shares of Guardian Holdings Europe Limited. The purchase price has been allocated based on estimated fair values of assets acquired and liabilities assumed as of the date of acquisition. The allocation required significant judgment. Consequently, it is possible that the estimates will change as the purchase price allocation gets finalised. For more details on the transaction and its impact on the Group‘s financial statements, please refer to Note 9.
Valuation of financial assetsThe fair value of the majority of the Group’s financial instruments is based on quoted prices in active markets or observable inputs. These instruments include government and agency securities, commercial paper, most investment-grade corporate debt, most high-yield debt securities, exchange-traded derivative instruments, most mortgage- and asset-backed securities and listed equity securities. In markets with reduced or no liquidity, spreads between bid and offer prices are normally wider compared to spreads in highly liquid markets. Such market conditions affect the valuation of certain asset classes of the Group, such as some asset-backed securities as well as certain derivative structures referencing such asset classes.
The Group considers both the credit risk of its counterparties and own risk of non-performance in the valuation of derivative instruments and other over-the-counter financial assets. In determining the fair value of these financial instruments, the assessment of the Group’s exposure to the credit risk of its counterparties incorporates consideration of existing collateral and netting arrangements entered into with each counterparty. The measure of the counterparty credit risk is estimated with incorporation of the observable credit spreads, where available, or credit spread estimates derived based on the benchmarking techniques where market data is not available. The impact of the Group’s own risk of non-performance is analysed in the manner consistent with the aforementioned approach, with consideration of the Group’s observable credit spreads. The value representing such risk is incorporated into the fair value of the financial instruments (primarily derivatives), in a liability position as of the measurement date. The change in this adjustment from period to period is reflected in realised gains and losses in the income statement.

Swiss Re First Quarter 2016 Report 23
For assets or derivative structures at fair value, the Group uses market prices or inputs derived from market prices. A separate internal price verification process, independent of the trading function, provides an additional control over the market prices or market input used to determine the fair values of such assets. Although management considers that appropriate values have been ascribed to such assets, there is always a level of uncertainty and judgement over these valuations. Subsequent valuations could differ significantly from the results of the process described above. The Group may become aware of counterparty valuations, either directly through the exchange of information or indirectly, for example, through collateral demands. Any implied differences are considered in the independent price verification process and may result in adjustments to initially indicated valuations. As of 31 March 2016, the Group has not provided any collateral on financial instruments in excess of its own market value estimates.
Subsequent eventsSubsequent events for the current reporting period have been evaluated up to 28 April 2016. This is the date on which the financial statements are available to be issued.
Recent accounting guidanceIn August 2014, the Financial Accounting Standards Board (FASB) issued Accounting Standards Update (ASU) 2014-13, “Measuring the Financial Assets and the Financial Liabilities of a Consolidated Collateralized Financing Entity – a consensus of the FASB Emerging Issues Task Force”, an update to topic 810, “Consolidation”. The ASU applies to entities that are required to consolidate a collateralised financing entity (CFE) under the VIE consolidation guidance when the entity measures all financial assets and financial liabilities of the CFE at fair value, with changes in fair value recorded in earnings. Before the ASU became effective, if an entity would measure the fair value of assets and liabilities separately following applicable US GAAP rules, the aggregate fair value might have differed. The new guidance allows the use of the more observable of the fair value of the financial assets or the fair value of the financial liabilities of the CFE to measure both. The Group adopted ASU 2014-13 on 1 January 2016. The adoption did not have a material effect on the Group’s financial statements.
In November 2014, the FASB issued ASU 2014-16, “Determining Whether the Host Contract in a Hybrid Financial Instrument Issued in the Form of a Share Is More Akin to Debt or to Equity – a consensus of the FASB Emerging Issues Task Force”, an update to topic 815, “Derivatives and Hedging”. The ASU provides guidance on how to assess whether or not a derivative embedded in an instrument in the legal form of a share must be bifurcated and accounted for separately from its host contract. Entities are required to use “the whole instrument approach” to determine whether the nature of the host contract in a hybrid instrument issued in the form of a share is more akin to debt or to equity. Under this approach, an issuer or investor considers all stated and implied substantive terms and features of a hybrid instrument when determining the nature of the host contract. No single term or feature will necessarily determine the nature of the host contract. The Group adopted ASU 2014-16 on 1 January 2016. The adoption did not have a material effect on the Group’s financial statements.
In January 2015, the FASB issued ASU 2015-01, “Simplifying Income Statement Presentation by Eliminating the Concept of Extraordinary Items”, an update to subtopic 225-20, “Income Statement–Extraordinary and Unusual Items”. The ASU eliminates the separate presentation of extraordinary items, net of tax and the related earnings per share. Extraordinary items were events and transactions that were distinguished by their unusual nature and by the infrequency of their occurrence. The ASU does not affect the requirement to disclose material items that are unusual in nature or infrequently occurring. The Group adopted ASU 2015-01 on 1 January 2016 on a prospective basis. The adoption did not have a material effect on the Group‘s financial statements.
In February 2015, the FASB issued ASU 2015-02, “Consolidation: Amendments to the Consolidation Analysis”, an amendment to topic 810, “Consolidation”. ASU 2015-02 (i) eliminates the indefinite deferral of the consolidation requirements for certain investment companies and similar entities, (ii) modifies how to evaluate partnerships and other entities under the variable interest entity (VIE) framework, (iii) eliminates the presumption that a general partner should consolidate a limited partnership, (iv) modifies consolidation analysis, particularly for decision-maker fee arrangements and related party relationships, (v) excludes from the scope of consolidation assessment the entities that are, or operate similar to, money market funds registered under the US Investment Company Act of 1940. The Group adopted ASU 2015-2 on 1 January 2016 following the modified retrospective method. The modified retrospective method does not require the restatement of prior periods. The adoption did not have a material effect on the Group’s financial statements; however, it led to an increase in VIEs disclosed in Note 12 Variable interest entities.

24 Swiss Re First Quarter 2016 Report
Notes to the Group financial statements (unaudited)
In April 2015, the FASB issued ASU 2015-03, “Simplifying the Presentation of Debt Issuance Costs”, an update to subtopic 835-30, “Interest—Imputation of Interest”. The ASU changes the presentation of debt issuance costs in financial statements by requiring that an entity presents such costs in the balance sheet as a direct deduction from the related debt liability rather than as an asset. Amortisation of the costs is reported as interest expense. The Group adopted ASU 2015-03 on 1 January 2016 on a prospective basis. The adoption did not have an impact on the Group‘s financial statements.
In May 2015, the FASB issued ASU 2015-07, “Disclosures for Investments in Certain Entities That Calculate Net Asset Value per Share (or Its Equivalent)”, an amendment to topic 820, “Fair Value Measurement”. ASU 2015-07 removes the requirement to categorise within the fair value hierarchy all investments for which fair value is measured using the net asset value per share practical expedient. The amendments also remove the requirement to make certain disclosures for all investments that are eligible to be measured at fair value using the net asset value per share practical expedient. Rather, those disclosures are limited to investments for which the entity has elected to measure the fair value using that practical expedient. The Group adopted ASU 2015-07 on 1 January 2016 and applies the amendments retrospectively. The retrospective approach requires that an investment for which fair value is measured using the net asset value per share practical expedient gets removed from the fair value hierarchy in all periods presented in an entity’s financial statements. The amended disclosures are provided in Note 7 Fair value disclosures.
In May 2015, the FASB issued ASU 2015-09, “Disclosures about Short-Duration Contracts”, an update to topic 944, “Financial Services — Insurance”. ASU 2015-09 requires an insurance entity to provide additional information about insurance liabilities, including information on the nature, amount, timing, and uncertainty of future cash flows related to insurance liabilities and the effect of those cash flows on the statement of comprehensive income. Requirements include disaggregated incurred and paid claims development information by accident year, on a net basis after risk mitigation, for at least the most recent 10 years with the periods preceding the current period considered required supplementary information. In addition, for each accident year presented in the claims development tables, an insurer has to provide disaggregated information about claim frequency (unless impracticable) and the amounts of incurred but not reported (IBNR) liabilities plus the expected development on reported claims. Required disclosures also include a description of the methods for determining both IBNR and expected development on reported claims as well as information about any significant changes in methods and assumptions used in the computation of the liability for unpaid claims and claim adjustment expenses, including reasons for the changes and the impact of the changes on the most recent reporting period in the financial statements. All aforementioned disclosures have to be provided on an annual basis. In addition, insurance entities must disclose the roll-forward of the liability for unpaid claims and claims adjustment expenses in both interim and annual periods. The Group will adopt the annual disclosure requirements for the annual reporting period ending on 31 December 2016, and the interim disclosure requirements for the quarter ending on 31 March 2017. The Group has set up a project to implement the new requirements.
In September 2015, the FASB issued ASU 2015-16, “Simplifying the Accounting for Measurement-Period Adjustments”, an amendment to topic 805, “Business Combinations”. ASU 2015-16 is on adjustments to provisional amounts from business combinations during the measurement periods. It requires that an acquirer recognises such adjustments in the reporting period in which the adjustment amounts are determined. Further, the ASU requires that the acquirer records, in the same period’s financial statements, the effect on earnings of changes in depreciation, amortisation, or other income effects, if any, as a result of the change to the provisional amounts, calculated as if the accounting had been completed at the acquisition date. The Group adopted this guidance on 1 January 2016. The adoption did not have an effect on the Group’s financial statements.

Swiss Re First Quarter 2016 Report 25
In January 2016, the FASB issued ASU 2016-01, “Recognition and Measurement of Financial Assets and Financial Liabilities“, an update to subtopic 825-10, “Financial Instruments – Overall“. The ASU requires an entity to carry investments in equity securities, including other ownership interests and limited liability companies at fair value through net income, with the exception of equity method investments, investments that result in consolidation or investments for which the entity has elected the practicability exception to fair value measurement. The practicability exception can only be applied by certain entities and only to equity investments without a readily determinable fair value. Investments under the practicability exception will be subject to an indicator-based impairment test. For financial liabilities to which the fair value option has been applied, the ASU also requires an entity to separately present the change in fair value attributable to instrument-specific credit risk in other comprehensive income rather than in net income. Specific exceptions apply to this requirement. In addition, the ASU requires an entity to assess whether a valuation allowance is needed on a deferred tax asset (DTA) related to fixed income securities AFS in combination with the entity‘s other DTAs rather than separately from other DTAs. The ASU also introduces changes to disclosure requirements for financial instruments not measured at fair value and introduces new requirements for equity instruments where the practicability exception to fair value measurement is applied. The new requirements are effective for annual and interim periods beginning after 15 December 2017 with early adoption permitted for requirements relating to the presentation of the impact of instrument-specific credit risk on qualifying financial liabilities in other comprehensive income. The Group is currently assessing the impact of the new requirements.
In February 2016, the FASB issued ASU 2016-02 “Leases“, which creates topic 842, “Leases“. The core principle of topic 842 is that a lessee should recognise the assets and liabilities that arise from leases. A lessee should recognise in the statement of financial position a liability to make lease payments (the lease liability) and a right-of-use asset representing the right to use the underlying asset for the lease term. This accounting treatment applies to finance leases and operating leases. The accounting applied by a lessor is largely unchanged from that applied under the current guidance. The new requirements are effective for the Group for annual and interim periods beginning after 15 December 2018. Early application of the ASU is permitted. The Group is currently assessing the impact of the new requirements.

26 Swiss Re First Quarter 2016 Report
Notes to the Group financial statements (unaudited)
2 Information on business segments
The Group provides reinsurance and insurance throughout the world through its business segments. The business segments are determined by the organisational structure and by the way in which management reviews the operating performance of the Group.
The Group presents four core operating business segments: Property & Casualty Reinsurance, Life & Health Reinsurance, Corporate Solutions and Life Capital (which includes the former Business Unit Admin Re®). The presentation of each segment’s balance sheet is closely aligned to the segment legal entity structure. The assignment of assets and liabilities for entities that span more than one segment is determined by considering local statutory requirements, legal and other constraints, the economic view of duration and currency requirements of the reinsurance business written, and the capacity of the segments to absorb risks. Interest expense is based on the segment’s capital funding position. The tax impact of a segment is derived from the legal entity tax obligations and the segmentation of the pre-tax result. While most of the tax items can be directly attributed to individual segments, the tax which impacts two or more segments is allocated to the segments on a reasonable basis. Property & Casualty Reinsurance and Life & Health Reinsurance share the same year-to-date effective tax rate as both business segments belong to the Reinsurance Business Unit.
As of 1 January 2016, the primary life and health insurance business (individual and group) is reported in the Life Capital segment instead of the Life & Health Reinsurance segment. Comparative information for 2015 has been restated accordingly.
Accounting policies applied by the business segments are in line with those described in the summary of significant accounting policies (please refer to Note 1).
The Group operating segments are outlined below.
Property & Casualty Reinsurance and Life & Health ReinsuranceReinsurance consists of two segments, Property & Casualty and Life & Health. The Reinsurance Business Unit operates globally, both through brokers and directly with clients, and provides a large range of solutions for risk and capital management. Clients include stock and mutual insurance companies as well as public sector and governmental entities. In addition to traditional reinsurance solutions, Reinsurance offers insurance-linked securities and other insurance-related capital market products in both Property & Casualty and Life & Health.
Property & Casualty includes the business lines property, casualty (including motor), and specialty. Life & Health includes the life and health lines of business.
Corporate SolutionsCorporate Solutions offers innovative insurance capacity to mid-sized and large multinational corporations across the globe. Offerings range from standard risk transfer covers and multi-line programmes, to customised solutions tailored to the needs of clients. Corporate Solutions serves customers from over 50 offices worldwide.
Life CapitalLife Capital was created on 1 January 2016 to manage Swiss Re’s primary life and health business. It comprises the closed and open life and health insurance books, including the existing Admin Re® business and the existing primary life and health insurance business formerly conducted by Life & Health Reinsurance. Through Admin Re®, Swiss Re acquires closed blocks of in-force life and health insurance business, either through reinsurance or corporate acquisition, and typically assumes responsibility for administering the underlying policies. The administration of the business may be managed directly or, where appropriate, in partnership with a third party.

Swiss Re First Quarter 2016 Report 27
Group itemsItems not allocated to the business segments are included in the “Group items” column, which encompasses Swiss Re Ltd, the Groups’ ultimate parent company, the former Legacy business in run-off, Principal Investments and certain Treasury units. Swiss Re Ltd charges trademark licence fees to the business segments which are reported as other revenues. Certain administrative expenses of the corporate centre functions that are not recharged to the operating segments are reported as Group items.
ConsolidationSegment information is presented net of external and internal retrocession and other intra-group arrangements. The Group total is obtained after elimination of intra-group transactions in the “Consolidation” column. This includes significant intra-group reinsurance arrangements, recharge of trademark licence fees, and intersegmental funding.
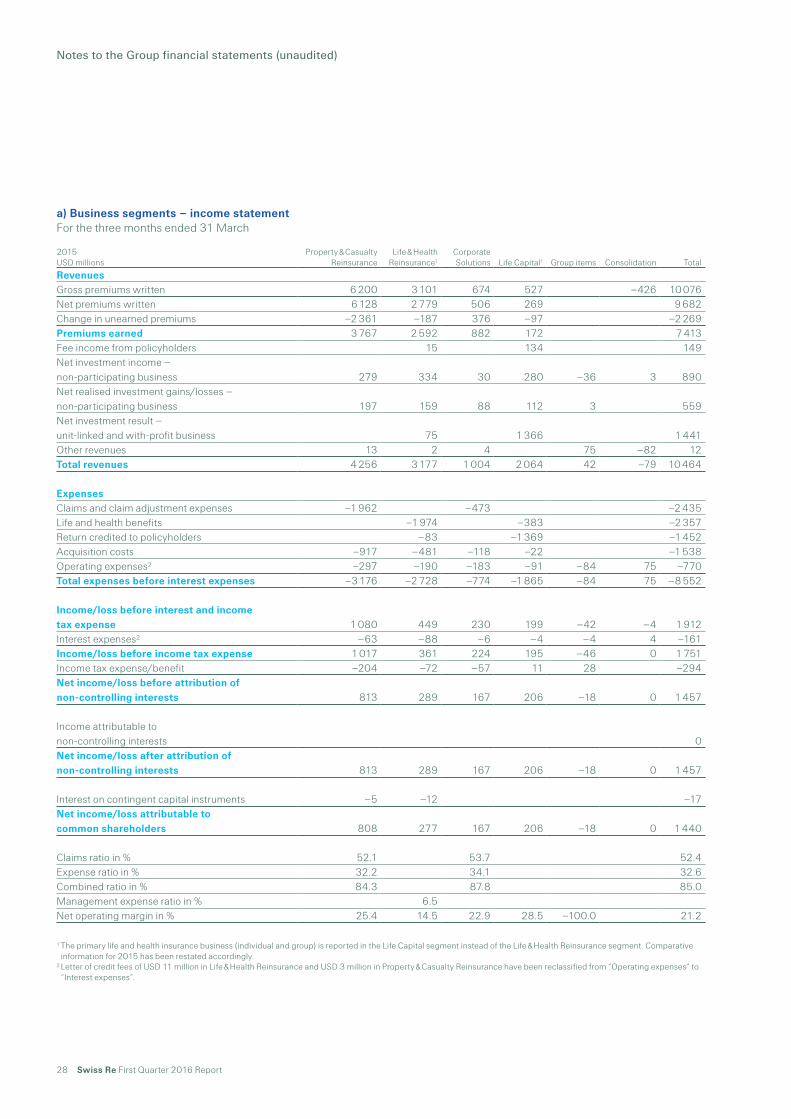
28 Swiss Re First Quarter 2016 Report
Notes to the Group financial statements (unaudited)
a) Business segments – income statementFor the three months ended 31 March
2015 USD millions
Property & Casualty Reinsurance
Life & Health Reinsurance1
Corporate Solutions Life Capital1 Group items Consolidation Total
RevenuesGross premiums written 6 200 3 101 674 527 –426 10 076Net premiums written 6 128 2 779 506 269 9 682Change in unearned premiums –2 361 –187 376 –97 –2 269Premiums earned 3 767 2 592 882 172 7 413Fee income from policyholders 15 134 149Net investment income – non-participating business 279 334 30 280 –36 3 890Net realised investment gains/losses – non-participating business 197 159 88 112 3 559Net investment result – unit-linked and with-profit business 75 1 366 1 441Other revenues 13 2 4 75 –82 12Total revenues 4 256 3 177 1 004 2 064 42 –79 10 464
ExpensesClaims and claim adjustment expenses –1 962 –473 –2 435Life and health benefits –1 974 –383 –2 357Return credited to policyholders –83 –1 369 –1 452Acquisition costs –917 –481 –118 –22 –1 538Operating expenses2 –297 –190 –183 –91 –84 75 –770Total expenses before interest expenses –3 176 –2 728 –774 –1 865 –84 75 –8 552
Income/loss before interest and income tax expense 1 080 449 230 199 –42 –4 1 912Interest expenses2 –63 –88 –6 –4 –4 4 –161Income/loss before income tax expense 1 017 361 224 195 –46 0 1 751Income tax expense/benefit –204 –72 –57 11 28 –294Net income/loss before attribution of non-controlling interests 813 289 167 206 –18 0 1 457
Income attributable to non-controlling interests 0Net income/loss after attribution of non-controlling interests 813 289 167 206 –18 0 1 457
Interest on contingent capital instruments –5 –12 –17Net income/loss attributable to common shareholders 808 277 167 206 –18 0 1 440
Claims ratio in % 52.1 53.7 52.4Expense ratio in % 32.2 34.1 32.6Combined ratio in % 84.3 87.8 85.0Management expense ratio in % 6.5Net operating margin in % 25.4 14.5 22.9 28.5 –100.0 21.2
1 The primary life and health insurance business (individual and group) is reported in the Life Capital segment instead of the Life & Health Reinsurance segment. Comparative information for 2015 has been restated accordingly.
2 Letter of credit fees of USD 11 million in Life & Health Reinsurance and USD 3 million in Property & Casualty Reinsurance have been reclassified from “Operating expenses“ to “Interest expenses“.

Swiss Re First Quarter 2016 Report 29
Business segments – income statementFor the three months ended 31 March
2016 USD millions
Property & Casualty Reinsurance
Life & Health Reinsurance
Corporate Solutions Life Capital Group items Consolidation Total
RevenuesGross premiums written 7 008 3 405 804 603 –425 11 395Net premiums written 6 948 3 081 588 255 10 872Change in unearned premiums –2 992 –258 277 –87 –3 060Premiums earned 3 956 2 823 865 168 7 812Fee income from policyholders 12 116 128Net investment income – non-participating business 237 333 36 316 20 –8 934Net realised investment gains/losses – non-participating business 296 107 –11 305 –5 692Net investment result – unit-linked and with-profit business –63 468 405Other revenues 11 5 2 78 –84 12Total revenues 4 500 3 217 892 1 373 93 –92 9 983
ExpensesClaims and claim adjustment expenses –2 374 –493 –2 867Life and health benefits –2 074 –465 –2 539Return credited to policyholders 60 –410 –350Acquisition costs –1 037 –640 –112 16 –1 773Operating expenses –280 –165 –177 –108 –92 77 –745Total expenses before interest expenses –3 691 –2 819 –782 –967 –92 77 –8 274
Income/loss before interest and income tax expense 809 398 110 406 1 –15 1 709Interest expenses –69 –78 –6 –5 –12 15 –155Income/loss before income tax expense 740 320 104 401 –11 0 1 554Income tax expense/benefit –148 –64 –27 –80 8 –311Net income/loss before attribution of non-controlling interests 592 256 77 321 –3 0 1 243
Income attributable to non-controlling interests 3 3Net income/loss after attribution of non-controlling interests 592 256 80 321 –3 0 1 246
Interest on contingent capital instruments –5 –12 –17Net income/loss attributable to common shareholders 587 244 80 321 –3 0 1 229
Claims ratio in % 60.0 57.0 59.5Expense ratio in % 33.3 33.4 33.3Combined ratio in % 93.3 90.4 92.8Management expense ratio in % 5.2Net operating margin in % 18.0 12.1 12.3 44.9 1.1 17.8

30 Swiss Re First Quarter 2016 Report
Notes to the Group financial statements (unaudited)
Business segments – balance sheetAs of 31 December
2015 USD millions
Property & Casualty Reinsurance
Life & Health Reinsurance1
Corporate Solutions Life Capital1 Group items Consolidation Total
AssetsFixed income securities 32 146 28 850 5 888 15 429 18 82 331Equity securities 2 231 921 935 700 4 787Other investments 12 105 1 976 162 1 524 6 077 –6 798 15 046Short-term investments 3 458 1 052 1 256 588 1 051 7 405Investments for unit-linked and with-profit business 818 27 423 28 241Cash and cash equivalents 4 282 280 680 1 586 1 376 8 204Deferred acquisition costs 2 051 3 020 387 13 5 471Acquired present value of future profits 1 134 1 830 2 964Reinsurance recoverable 2 872 1 652 6 438 1 069 –5 453 6 578Other reinsurance assets 8 879 7 876 2 296 3 766 3 –1 241 21 579Goodwill 1 873 1 883 106 3 862Other 8 279 5 849 917 1 208 397 –6 983 9 667Total assets 78 176 55 311 19 065 54 436 9 622 –20 475 196 135
LiabilitiesUnpaid claims and claim adjustment expenses 39 366 9 468 10 619 1 380 –5 315 55 518Liabilities for life and health policy benefits 15 472 257 14 409 –7 30 131Policyholder account balances 1 368 30 187 –133 31 422Other reinsurance liabilities 10 597 2 202 4 178 785 3 –1 648 16 117Short-term debt 1 001 2 612 515 –2 294 1 834Long-term debt 4 074 8 770 496 808 –3 170 10 978Other 9 799 8 871 1 187 1 925 2 652 –7 905 16 529Total liabilities 64 837 48 763 16 737 49 494 3 170 –20 472 162 529
Shareholders’ equity 13 316 6 548 2 262 4 942 6 452 –3 33 517
Non-controlling interests 23 66 89Total equity 13 339 6 548 2 328 4 942 6 452 –3 33 606
Total liabilities and equity 78 176 55 311 19 065 54 436 9 622 –20 475 196 135
1 The primary life and health insurance business (individual and group) is reported in the Life Capital segment instead of the Life & Health Reinsurance segment. Comparative information for 2015 has been restated accordingly.

Swiss Re First Quarter 2016 Report 31
Business segments – balance sheetAs of 31 March
2016 USD millions
Property & Casualty Reinsurance
Life & Health Reinsurance
Corporate Solutions Life Capital Group items Consolidation Total
AssetsFixed income securities 34 029 31 496 5 590 26 805 16 97 936Equity securities 1 914 937 911 1 593 4 356Other investments 13 987 2 121 270 3 405 5 296 –6 974 18 105Short-term investments 3 513 1 549 1 322 1 298 508 8 190Investments for unit-linked and with-profit business 628 34 301 34 929Cash and cash equivalents 5 159 497 936 4 310 243 11 145Deferred acquisition costs 2 569 3 219 379 19 6 186Acquired present value of future profits 1 105 1 189 2 294Reinsurance recoverable 2 829 1 637 6 311 2 679 –5 189 8 267Other reinsurance assets 11 606 7 729 2 209 4 160 3 –1 329 24 378Goodwill 1 906 1 890 175 151 4 122Other 10 167 4 668 1 249 2 057 3 879 –10 442 11 578Total assets 87 679 57 476 19 352 80 375 10 538 –23 934 231 486
LiabilitiesUnpaid claims and claim adjustment expenses 40 311 10 365 10 672 1 509 –5 173 57 684Liabilities for life and health policy benefits 15 901 260 30 137 –17 46 281Policyholder account balances 1 411 35 391 36 802Other reinsurance liabilities 13 866 2 565 3 984 1 280 3 –1 901 19 797Short-term debt 752 1 818 791 505 –1 485 2 381Long-term debt 4 111 9 601 496 788 61 –4 071 10 986Other 16 578 8 750 1 411 3 305 2 776 –11 284 21 536Total liabilities 75 618 50 411 16 823 73 201 3 345 –23 931 195 467
Shareholders’ equity 12 038 7 065 2 462 7 174 7 193 –3 35 929
Non-controlling interests 23 67 90Total equity 12 061 7 065 2 529 7 174 7 193 –3 36 019
Total liabilities and equity 87 679 57 476 19 352 80 375 10 538 –23 934 231 486

32 Swiss Re First Quarter 2016 Report
Notes to the Group financial statements (unaudited)
b) Property & Casualty Reinsurance business segment – by line of businessFor the three months ended 31 March
2015 USD millions Property Casualty Specialty Unallocated Total
RevenuesGross premiums written 2 844 2 220 1 136 6 200Net premiums written 2 814 2 215 1 099 6 128Change in unearned premiums –1 295 –562 –504 –2 361Premiums earned 1 519 1 653 595 3 767Net investment income 279 279Net realised investment gains/losses 197 197Other revenues 13 13Total revenues 1 519 1 653 595 489 4 256
ExpensesClaims and claim adjustment expenses –654 –1 072 –236 –1 962Acquisition costs –290 –493 –134 –917Operating expenses1 –166 –94 –37 –297Total expenses before interest expenses –1 110 –1 659 –407 0 –3 176
Income/loss before interest and income tax expense 409 –6 188 489 1 080Interest expenses1 –63 –63Income/loss before income tax expense 409 –6 188 426 1 017
Claims ratio in % 43.1 64.9 39.7 52.1Expense ratio in % 30.0 35.5 28.7 32.2Combined ratio in % 73.1 100.4 68.4 84.3
1 Letter of credit fees of USD 3 million in Property & Casualty Reinsurance have been reclassified from “Operating expenses“ to “Interest expenses“.

Swiss Re First Quarter 2016 Report 33
Property & Casualty Reinsurance business segment – by line of businessFor the three months ended 31 March
2016 USD millions Property Casualty Specialty Unallocated Total
RevenuesGross premiums written 2 651 3 255 1 102 7 008Net premiums written 2 599 3 251 1 098 6 948Change in unearned premiums –1 067 –1 427 –498 –2 992Premiums earned 1 532 1 824 600 3 956Net investment income 237 237Net realised investment gains/losses 296 296Other revenues 11 11Total revenues 1 532 1 824 600 544 4 500
ExpensesClaims and claim adjustment expenses –754 –1 331 –289 –2 374Acquisition costs –331 –570 –136 –1 037Operating expenses –155 –90 –35 –280Total expenses before interest expenses –1 240 –1 991 –460 0 –3 691
Income/loss before interest and income tax expense 292 –167 140 544 809Interest expenses –69 –69Income/loss before income tax expense 292 –167 140 475 740
Claims ratio in % 49.2 73.0 48.2 60.0Expense ratio in % 31.7 36.2 28.5 33.3Combined ratio in % 80.9 109.2 76.7 93.3

34 Swiss Re First Quarter 2016 Report
Notes to the Group financial statements (unaudited)
c) Life & Health Reinsurance business segment – by line of businessFor the three months ended 31 March
2015 USD millions Life Health Unallocated Total1
RevenuesGross premium written 2 045 1 056 3 101Net premiums written 1 745 1 034 2 779Change in unearned premiums –52 –135 –187Premiums earned 1 693 899 2 592Fee income from policyholders 15 15Net investment income – non-participating business 216 118 334Net realised investment gains/losses – non-participating business 10 –1 150 159Net investment result – unit-linked and with-profit business 75 75Other revenues 2 2Total revenues 2 011 1 016 150 3 177
ExpensesLife and health benefits –1 324 –650 –1 974Return credited to policyholders –83 –83Acquisition costs –305 –176 –481Operating expenses2 –140 –50 –190Total expenses before interest expenses –1 852 –876 0 –2 728
Income before interest and income tax expense 159 140 150 449Interest expenses2 –88 –88Income before income tax expense 159 140 62 361
Management expense ratio in % 7.3 4.9 6.5Net operating margin3 in % 8.2 13.8 14.5
1 The primary life and health insurance business (individual and group) is reported in the Life Capital segment instead of the Life & Health Reinsurance segment.2 Letter of credit fees of USD 11 million in Life & Health Reinsurance have been reclassified from “Operating expenses“ to “Interest expenses“.3 Net operating margin is calculated as income/loss before interest and income tax expense divided by “Total revenues” excluding “Net investment result – unit-linked and
with-profit business”.

Swiss Re First Quarter 2016 Report 35
Life & Health Reinsurance business segment – by line of businessFor the three months ended 31 March
2016 USD millions Life Health Unallocated Total
RevenuesGross premium written 2 237 1 168 3 405Net premiums written 1 935 1 146 3 081Change in unearned premiums –63 –195 –258Premiums earned 1 872 951 2 823Fee income from policyholders 12 12Net investment income – non-participating business 218 115 333Net realised investment gains/losses – non-participating business 107 107Net investment result – unit-linked and with-profit business –63 –63Other revenues 5 5Total revenues 2 044 1 066 107 3 217
ExpensesLife and health benefits –1 385 –689 –2 074Return credited to policyholders 60 60Acquisition costs –451 –189 –640Operating expenses –116 –49 –165Total expenses before interest expenses –1 892 –927 0 –2 819
Income before interest and income tax expense 152 139 107 398Interest expenses –78 –78Income before income tax expense 152 139 29 320
Management expense ratio in % 5.5 4.6 5.2Net operating margin1 in % 7.2 13.0 12.1
1 Net operating margin is calculated as income/loss before interest and income tax expense divided by “Total revenues” excluding “Net investment result – unit-linked and with-profit business”.

36 Swiss Re First Quarter 2016 Report
Notes to the Group financial statements (unaudited)
3 Insurance information
Premiums earned and fees assessed against policyholders For the three months ended 31 March
2015 USD millions
Property & Casualty Reinsurance
Life & Health Reinsurance1
Corporate Solutions Life Capital1 Total
Premiums earned, thereof:Direct 10 704 298 1 012Reinsurance 3 823 2 757 201 34 6 815Intra-group transactions (assumed and ceded) –2 148 2 –148 0
Premiums earned before retrocession to external parties 3 821 2 915 907 184 7 827
Retrocession to external parties –54 –323 –25 –12 –414Net premiums earned 3 767 2 592 882 172 7 413
Fee income from policyholders, thereof:Direct 110 110Reinsurance 15 24 39
Net fee income 0 15 0 134 149
1 As of 1 January 2016, the primary life and health insurance business (individual and group) is reported in the Life Capital segment instead of the Life & Health Reinsurance segment. Comparative information for 2015 has been restated accordingly.
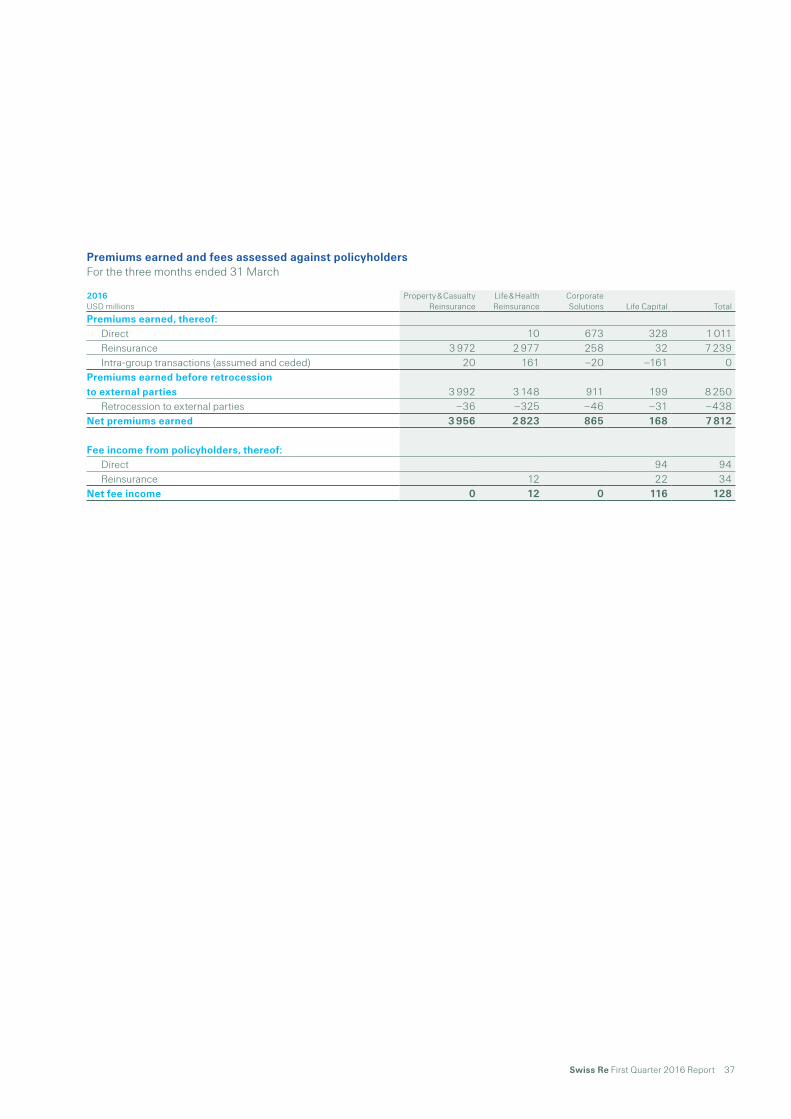
Swiss Re First Quarter 2016 Report 37
Premiums earned and fees assessed against policyholders For the three months ended 31 March
2016 USD millions
Property & Casualty Reinsurance
Life & Health Reinsurance
Corporate Solutions Life Capital Total
Premiums earned, thereof:Direct 10 673 328 1 011Reinsurance 3 972 2 977 258 32 7 239Intra-group transactions (assumed and ceded) 20 161 –20 –161 0
Premiums earned before retrocession to external parties 3 992 3 148 911 199 8 250
Retrocession to external parties –36 –325 –46 –31 –438Net premiums earned 3 956 2 823 865 168 7 812
Fee income from policyholders, thereof:Direct 94 94Reinsurance 12 22 34
Net fee income 0 12 0 116 128

38 Swiss Re First Quarter 2016 Report
Notes to the Group financial statements (unaudited)
Claims and claim adjustment expenses For the three months ended 31 March
Acquisition costsFor the three months ended 31 March
2015 USD millions
Property & Casualty Reinsurance
Life & Health Reinsurance1
Corporate Solutions Life Capital1 Total
Acquisition costs, thereof:Gross acquisition costs with external parties –932 –519 –121 –43 –1 615Intra-group transactions (assumed and ceded) –20 20 0
Acquisition costs before impact of retrocession to external parties –932 –539 –121 –23 –1 615
Retrocession to external parties 15 58 3 1 77Net acquisition costs –917 –481 –118 –22 –1 538
1 As of 1 January 2016, the primary life and health insurance business (individual and group) is reported in the Life Capital segment instead of the Life & Health Reinsurance segment. Comparative information for 2015 has been restated accordingly.
2015 USD millions
Property & Casualty Reinsurance
Life & Health Reinsurance1
Corporate Solutions Life Capital1 Total
Claims paid, thereof:Gross claims paid to external parties –1 933 –2 243 –533 –454 –5 163Intra-group transactions (assumed and ceded) –87 –111 87 111 0
Claims before receivables from retrocession to external parties –2 020 –2 354 –446 –343 –5 163
Retrocession to external parties 153 323 39 10 525Net claims paid –1 867 –2 031 –407 –333 –4 638
Change in unpaid claims and claim adjustment expenses; life and health benefits, thereof:
Gross – with external parties –58 74 94 –53 57Intra-group transactions (assumed and ceded) 138 –6 –138 6 0
Unpaid claims and claim adjustment expenses; life and health benefits before impact of retrocession to external parties 80 68 –44 –47 57
Retrocession to external parties –175 –11 –22 –3 –211Net unpaid claims and claim adjustment expenses; life and health benefits –95 57 –66 –50 –154
Claims and claim adjustment expenses; life and health benefits –1 962 –1 974 –473 –383 –4 792

Swiss Re First Quarter 2016 Report 39
Claims and claim adjustment expensesFor the three months ended 31 March
Acquisition costsFor the three months ended 31 March
2016 USD millions
Property & Casualty Reinsurance
Life & Health Reinsurance
Corporate Solutions Life Capital Total
Claims paid, thereof:Gross claims paid to external parties –2 007 –2 977 –444 –824 –6 252Intra-group transactions (assumed and ceded) –46 –115 46 115 0
Claims before receivables from retrocession to external parties –2 053 –3 092 –398 –709 –6 252
Retrocession to external parties 99 343 53 40 535Net claims paid –1 954 –2 749 –345 –669 –5 717
Change in unpaid claims and claim adjustment expenses; life and health benefits, thereof:
Gross – with external parties –499 708 –15 207 401Intra-group transactions (assumed and ceded) 146 –20 –146 20 0
Unpaid claims and claim adjustment expenses; life and health benefits before impact of retrocession to external parties –353 688 –161 227 401
Retrocession to external parties –67 –13 13 –23 –90Net unpaid claims and claim adjustment expenses; life and health benefits –420 675 –148 204 311
Claims and claim adjustment expenses; life and health benefits –2 374 –2 074 –493 –465 –5 406
2016 USD millions
Property & Casualty Reinsurance
Life & Health Reinsurance
Corporate Solutions Life Capital Total
Acquisition costs, thereof:Gross acquisition costs with external parties –1 037 –675 –131 –6 –1 849Intra-group transactions (assumed and ceded) –7 –20 7 20 0
Acquisition costs before impact of retrocession to external parties –1 044 –695 –124 14 –1 849
Retrocession to external parties 7 55 12 2 76Net acquisition costs –1 037 –640 –112 16 –1 773

40 Swiss Re First Quarter 2016 Report
Notes to the Group financial statements (unaudited)
Reinsurance receivablesReinsurance receivables as of 31 December 2015 and 31 March 2016 were as follows:
Policyholder dividendsPolicyholder dividends are recognised as an element of policyholder benefits. In the three months ended 31 March 2015 and 2016, the relative percentage of participating insurance of the life and health policy benefits was 8% and 10%, respectively. The amount of policyholder dividend expense for the three months ended 31 March 2015 and 2016 was USD 24 million and USD 71 million, respectively.
USD millions 2015 2016
Premium receivables invoiced 1 441 1 985Receivables invoiced from ceded re/insurance business 201 423Assets arising from the application of the deposit method of accounting and meeting the definition of financing receivables 171 104Recognised allowance –56 –57
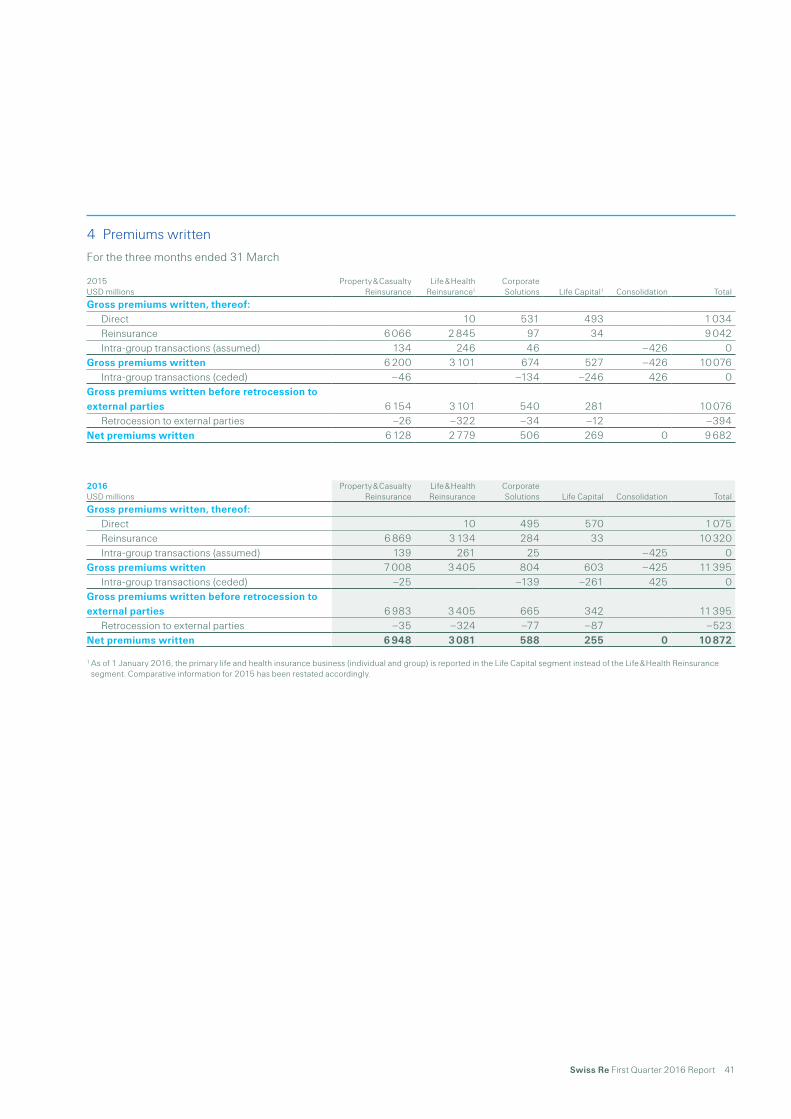
Swiss Re First Quarter 2016 Report 41
4 Premiums written
For the three months ended 31 March
2015 USD millions
Property & Casualty Reinsurance
Life & Health Reinsurance1
Corporate Solutions Life Capital1 Consolidation Total
Gross premiums written, thereof:Direct 10 531 493 1 034Reinsurance 6 066 2 845 97 34 9 042Intra-group transactions (assumed) 134 246 46 –426 0
Gross premiums written 6 200 3 101 674 527 –426 10 076Intra-group transactions (ceded) –46 –134 –246 426 0
Gross premiums written before retrocession to external parties 6 154 3 101 540 281 10 076
Retrocession to external parties –26 –322 –34 –12 –394Net premiums written 6 128 2 779 506 269 0 9 682
2016 USD millions
Property & Casualty Reinsurance
Life & Health Reinsurance
Corporate Solutions Life Capital Consolidation Total
Gross premiums written, thereof:Direct 10 495 570 1 075Reinsurance 6 869 3 134 284 33 10 320Intra-group transactions (assumed) 139 261 25 –425 0
Gross premiums written 7 008 3 405 804 603 –425 11 395Intra-group transactions (ceded) –25 –139 –261 425 0
Gross premiums written before retrocession to external parties 6 983 3 405 665 342 11 395
Retrocession to external parties –35 –324 –77 –87 –523Net premiums written 6 948 3 081 588 255 0 10 872
1 As of 1 January 2016, the primary life and health insurance business (individual and group) is reported in the Life Capital segment instead of the Life & Health Reinsurance segment. Comparative information for 2015 has been restated accordingly.

42 Swiss Re First Quarter 2016 Report
Notes to the Group financial statements (unaudited)
5 Deferred acquisition costs (DAC) and acquired present value of future profits (PVFP)
As of 31 December 2015 and 31 March 2016, the DAC were as follows:
Retroceded DAC may arise on retrocession of reinsurance portfolios, including reinsurance undertaken as part of a securitisation. The associated potential retrocession recoveries are determined by the nature of the retrocession agreements and by the terms of the securitisation.
2015 USD millions
Property & Casualty Reinsurance
Life & Health Reinsurance1
Corporate Solutions Life Capital1 Total
Opening balance as of 1 January 1 756 2 723 360 1 4 840Effect of change in Group structure1 –12 12 0Deferred 4 132 1 018 486 35 5 671Effect of acquisitions/disposals and retrocessions 7 2 9Amortisation –3 793 –560 –459 –34 –4 846Effect of foreign currency translation –51 –151 –1 –203Closing balance 2 051 3 020 387 13 5 471
2016 USD millions
Property & Casualty Reinsurance
Life & Health Reinsurance
Corporate Solutions Life Capital Total
Opening balance as of 1 January 2 051 3 020 387 13 5 471Deferred 1 503 258 100 13 1 874Amortisation –1 024 –101 –110 –8 –1 243Effect of foreign currency translation 39 42 2 1 84Closing balance 2 569 3 219 379 19 6 186
1 As of 1 January 2016, the primary life and health insurance business (individual and group) is reported in the Life Capital segment instead of the Life & Health Reinsurance segment. Comparative information for 2015 has been restated accordingly.

Swiss Re First Quarter 2016 Report 43
Life & Health Reinsurance Life Capital Total
2015 USD millions
Positive PVFP
Negative PVFP Total
Opening balance as of 1 January 1 294 2 003 0 2 003 3 297Effect of acquisitions/disposals and retrocessions 2 2 2Amortisation –159 –191 –191 –350Interest accrued on unamortised PVFP 40 84 84 124Effect of foreign currency translation –41 –77 –77 –118Effect of change in unrealised gains/losses 9 9 9Closing balance 1 134 1 830 0 1 830 2 964
Life & Health Reinsurance Life Capital Total
2016 USD millions
Positive PVFP
Negative PVFP Total
Opening balance as of 1 January 1 134 1 830 0 1 830 2 964Effect of acquisitions/disposals and retrocessions –631 –631 –631Amortisation –30 –2 11 9 –21Interest accrued on unamortised PVFP 9 21 –3 18 27Effect of foreign currency translation –8 –31 –5 –36 –44Effect of change in unrealised gains/losses –1 –1 –1Closing balance 1 105 1 817 –628 1 189 2 294
As of 31 December 2015 and 31 March 2016, the PVFP was as follows:
Retroceded PVFP may arise on retrocession of reinsurance portfolios, including reinsurance undertaken as part of a securitisation. The associated potential retrocession recoveries are determined by the nature of the retrocession agreements and by the terms of the securitisation.
In the first quarter 2016, the Group‘s Business Unit Life Capital acquired Guardian Holdings Europe Limited, the holding company for operations trading under the name Guardian Financial Services (“Guardian”), and recognised negative PVFP. Upon acquisition, PVFP is calculated as the difference between the estimated fair value and established reserves, which are in line with US GAAP accounting policies and assumptions of the Group. The product mix of Guardian is weighted towards annuity business, for which the fair value of insurance and investment contract liabilities significantly exceeds the established US GAAP reserves. This excess is mainly due to differences in discount rates and risk weightings between fair value and US GAAP estimates. Overall, the excess on the annuity business outweighs the estimated future gross profits of other business and synergy expectations included in the fair value of insurance and investment contract liabilities for the business as a whole, resulting in a negative PVFP.
The subsequent measurement of negative PVFP is in alignment with the existing measurement of positive PVFP assets (please refer to Note 1 in the annual Financial Report).
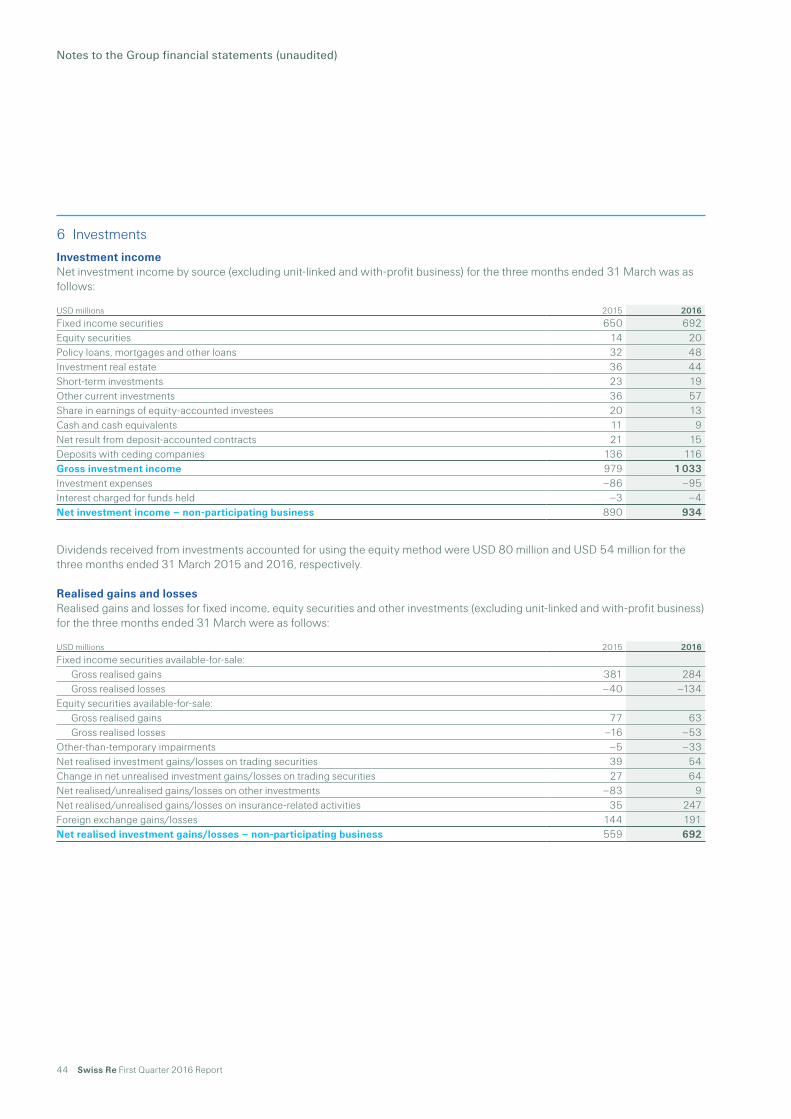
44 Swiss Re First Quarter 2016 Report
Notes to the Group financial statements (unaudited)
6 Investments
Investment incomeNet investment income by source (excluding unit-linked and with-profit business) for the three months ended 31 March was as follows:
Dividends received from investments accounted for using the equity method were USD 80 million and USD 54 million for the three months ended 31 March 2015 and 2016, respectively.
Realised gains and lossesRealised gains and losses for fixed income, equity securities and other investments (excluding unit-linked and with-profit business) for the three months ended 31 March were as follows:
USD millions 2015 2016
Fixed income securities 650 692Equity securities 14 20Policy loans, mortgages and other loans 32 48Investment real estate 36 44Short-term investments 23 19Other current investments 36 57Share in earnings of equity-accounted investees 20 13Cash and cash equivalents 11 9Net result from deposit-accounted contracts 21 15Deposits with ceding companies 136 116Gross investment income 979 1 033Investment expenses –86 –95Interest charged for funds held –3 –4Net investment income – non-participating business 890 934
USD millions 2015 2016
Fixed income securities available-for-sale:Gross realised gains 381 284Gross realised losses –40 –134
Equity securities available-for-sale:Gross realised gains 77 63Gross realised losses –16 –53
Other-than-temporary impairments –5 –33Net realised investment gains/losses on trading securities 39 54Change in net unrealised investment gains/losses on trading securities 27 64Net realised/unrealised gains/losses on other investments –83 9Net realised/unrealised gains/losses on insurance-related activities 35 247Foreign exchange gains/losses 144 191Net realised investment gains/losses – non-participating business 559 692

Swiss Re First Quarter 2016 Report 45
Investment result – unit-linked and with-profit businessFor unit-linked contracts, the investment risk is borne by the policyholder. For with-profit contracts, the majority of the investment risk is also borne by the policyholder, although there are certain guarantees that limit the down-side risk for the policyholder, and a certain proportion of the returns may be retained by the Group (typically 10%).
Net investment result on unit-linked and with-profit business credited to policyholders for the three months ended 31 March was as follows:
Impairment on fixed income securities related to credit lossesOther-than-temporary impairments for debt securities are bifurcated between credit and non-credit components, with the credit component recognised through earnings and the non-credit component recognised in other comprehensive income. The credit component of other-than-temporary impairments is defined as the difference between a security’s amortised cost basis and the present value of expected cash flows. Methodologies for measuring the credit component of impairment are aligned to market observer forecasts of credit performance drivers. Management believes that these forecasts are representative of median market expectations.
For securitised products, cash flow projection analysis is conducted by integrating forward-looking evaluation of collateral performance drivers, including default rates, prepayment rates and loss severities, and deal-level features, such as credit enhancement and prioritisation among tranches for payments of principal and interest. Analytics are differentiated by asset class, product type and security-level differences in historical and expected performance. For corporate bonds and hybrid debt instruments, an expected loss approach based on default probabilities and loss severities expected in the current and forecasted economic environment is used for securities identified as credit-impaired to project probability-weighted cash flows. Expected cash flows resulting from these analyses are discounted, and the present value is compared to the amortised cost basis to determine the credit component of other-than-temporary impairments.
A reconciliation of other-than-temporary impairments related to credit losses recognised in earnings for the three months ended 31 March was as follows:
2015 2016USD millions Unit-linked With-profit Unit-linked With-profit
Investment income – fixed income securities 21 22 27 35Investment income – equity securities 139 8 167 24Investment income – other 9 5 6 4Total investment income – unit-linked and with-profit business 169 35 200 63Realised gains/losses – fixed income securities 27 32 75 65Realised gains/losses – equity securities 1 127 51 –9 23Realised gains/losses – other –7 –5Total realised gains/losses – unit-linked and with-profit business 1 154 83 59 83Total net investment result – unit-linked and with-profit business 1 323 118 259 146
USD millions 2015 2016
Balance as of 1 January 137 136Credit losses for which an other-than-temporary impairment was not previously recognised 13Reductions for securities sold during the period –10 –12Increase of credit losses for which an other-than-temporary impairment has been recognised previously, when the Group does not intend to sell, or more likely than not will not be required to sell before recovery 4 8Impact of increase in cash flows expected to be collected –2 –2Impact of foreign exchange movements –4
Balance as of 31 March 125 143

46 Swiss Re First Quarter 2016 Report
Notes to the Group financial statements (unaudited)
Investments available-for-saleAmortised cost or cost, estimated fair values and other-than-temporary impairments of fixed income securities classified as available-for-sale as of 31 December 2015 and 31 March 2016 were as follows:
The “Other-than-temporary impairments recognised in other comprehensive income” column includes only securities with a credit-related loss recognised in earnings. Subsequent recovery in fair value of securities previously impaired in other comprehensive income is also presented in the “Other-than-temporary impairments recognised in other comprehensive income” column.
2015 USD millions
Amortised cost or cost
Gross unrealised
gains
Gross unrealised
losses
Other-than-temporary impairments
recognised in other comprehensive income
Estimated fair value
Debt securities issued by governments and government agencies:
US Treasury and other US government corporations and agencies 12 212 612 –92 12 732US Agency securitised products 2 937 29 –28 2 938States of the United States and political subdivisions of the states 1 236 55 –10 1 281United Kingdom 7 514 773 –54 8 233Canada 3 943 520 –38 4 425Germany 2 920 239 –31 3 128France 2 065 223 –18 2 270Other 7 818 262 –146 7 934
Total 40 645 2 713 –417 42 941Corporate debt securities 30 540 1 448 –530 –11 31 447Mortgage- and asset-backed securities 4 970 118 –38 –3 5 047Fixed income securities available-for-sale 76 155 4 279 –985 –14 79 435Equity securities available-for-sale 4 294 632 –207 4 719
2016 USD millions
Amortised cost or cost
Gross unrealised
gains
Gross unrealised
losses
Other-than-temporary impairments
recognised in other comprehensive income
Estimated fair value
Debt securities issued by governments and government agencies:
US Treasury and other US government corporations and agencies 11 786 835 –6 12 615US Agency securitised products 3 583 55 –11 3 627States of the United States and political subdivisions of the states 1 302 91 –5 1 388United Kingdom 8 628 1 043 –28 9 643Canada 4 188 598 –22 4 764Germany 3 025 392 –8 3 409France 2 113 359 –3 2 469Other 8 489 423 –73 8 839
Total 43 114 3 796 –156 46 754Corporate debt securities 40 764 2 090 –294 –1 42 559Mortgage- and asset-backed securities 5 646 143 –29 –5 5 755Fixed income securities available-for-sale 89 524 6 029 –479 –6 95 068Equity securities available-for-sale 3 932 501 –165 4 268

Swiss Re First Quarter 2016 Report 47
Investments tradingThe carrying amounts of fixed income securities and equity securities classified as trading (excluding unit-linked and with-profit business) as of 31 December 2015 and 31 March 2016 were as follows:
Investments held for unit-linked and with-profit businessThe carrying amounts of investments held for unit-linked and with-profit business as of 31 December 2015 and 31 March 2016 were as follows:
Maturity of fixed income securities available-for-saleThe amortised cost or cost and estimated fair values of investments in fixed income securities available-for-sale by remaining maturity are shown below. Fixed maturity investments are assumed not to be called for redemption prior to the stated maturity date. As of 31 December 2015 and 31 March 2016, USD 12 725 million and USD 15 369 million, respectively, of fixed income securities available-for-sale were callable.
Assets pledgedAs of 31 March 2016, investments with a carrying value of USD 7 329 million were on deposit with regulatory agencies in accordance with local requirements, and investments with a carrying value of USD 11 201 million were placed on deposit or pledged to secure certain reinsurance liabilities, including pledged investments in subsidiaries.
As of 31 December 2015 and 31 March 2016, securities of USD 15 828 million and USD 15 402 million, respectively, were transferred to third parties under securities lending transactions and repurchase agreements on a fully collateralised basis. Corresponding liabilities of USD 995 million and USD 2 383 million, respectively, were recognised in accrued expenses and other liabilities for the obligation to return collateral that the Group has the right to sell or repledge.
As of 31 March 2016, a real estate portfolio with a carrying value of USD 232 million serves as collateral for a credit facility allowing the Group to withdraw funds up to CHF 650 million.
Collateral accepted which the Group has the right to sell or repledgeAs of 31 December 2015 and 31 March 2016, the fair value of the equity securities, the government and corporate debt securities received as collateral was USD 7 030 million and USD 6 686 million, respectively. Of this, the amount that was sold or repledged as of 31 December 2015 and 31 March 2016 was USD 2 429 million and USD 2 685 million, respectively. The sources of the collateral are securities borrowing, reverse repurchase agreements and derivative transactions.
USD millions 2015 2016
Debt securities issued by governments and government agencies 2 710 2 616Corporate debt securities 52 124Mortgage- and asset-backed securities 134 128Fixed income securities trading – non-participating business 2 896 2 868Equity securities trading – non-participating business 68 88
2015 2016USD millions Unit-linked With-profit Unit-linked With-profit
Fixed income securities trading 2 410 1 659 2 717 3 263Equity securities trading 21 894 889 24 917 2 180Investment real estate 691 366 692 350Other invested assets 332 810Total investments for unit-linked and with-profit business 25 327 2 914 29 136 5 793
2015 2016 USD millions
Amortised cost or cost
Estimated fair value
Amortised cost or cost
Estimated fair value
Due in one year or less 4 874 4 911 6 356 6 396Due after one year through five years 19 370 19 671 20 023 20 463Due after five years through ten years 16 577 17 101 20 496 21 555Due after ten years 30 611 32 952 37 289 41 187Mortgage- and asset-backed securities with no fixed maturity 4 723 4 800 5 360 5 467Total fixed income securities available-for-sale 76 155 79 435 89 524 95 068

48 Swiss Re First Quarter 2016 Report
Notes to the Group financial statements (unaudited)
Offsetting of derivatives, financial assets and financial liabilitiesOffsetting of derivatives, financial assets and financial liabilities as of 31 December 2015 and 31 March 2016 was as follows:
Collateral pledged or received between two counterparties with a master netting arrangement in place, but not subject to balance sheet netting is disclosed at fair value. The fair values represent the gross carrying value amounts at the reporting date for each financial instrument received or pledged by the Group. Management believes that master netting agreements provide for legally enforceable set-off in the event of default, which substantially reduces credit exposure. Upon occurrence of an event of default the non-defaulting party may set off the obligation against collateral received regardless if offset on balance sheet prior to the defaulting event. The net amounts of the financial assets and liabilities presented on the balance sheet were recognised in “Other invested assets” and “Accrued expenses and other liabilities”, respectively.
2015 USD millions
Gross amounts of recognised financial
assetsCollateral set off
in the balance sheet
Net amounts of financial assets presented
in the balance sheet
Related financial instruments not set off
in the balance sheet Net amount
Derivative financial instruments – assets 2 713 –1 953 760 –13 747Reverse repurchase agreements 6 401 –3 000 3 401 –3 394 7Securities borrowing 452 452 –452 0Total 9 566 –4 953 4 613 –3 859 754
2015 USD millions
Gross amounts of recognised financial
liabilitiesCollateral set off
in the balance sheet
Net amounts of financial liabilities presented
in the balance sheet
Related financial instruments not set off
in the balance sheet Net amount
Derivative financial instruments – liabilities –2 179 1 477 –702 81 –621Repurchase agreements –2 844 2 475 –369 369 0Securities lending –1 151 525 –626 582 –44Total –6 174 4 477 –1 697 1 032 –665
2016 USD millions
Gross amounts of recognised financial
assetsCollateral set off
in the balance sheet
Net amounts of financial assets presented
in the balance sheet
Related financial instruments not set off
in the balance sheet Net amount
Derivative financial instruments – assets 3 899 –2 348 1 551 –4 1 547Reverse repurchase agreements 5 855 –1 626 4 229 –4 228 1Securities borrowing 359 359 –359 0Total 10 113 –3 974 6 139 –4 591 1 548
2016 USD millions
Gross amounts of recognised financial
liabilitiesCollateral set off
in the balance sheet
Net amounts of financial liabilities presented
in the balance sheet
Related financial instruments not set off
in the balance sheet Net amount
Derivative financial instruments – liabilities –3 215 1 973 –1 242 106 –1 136Repurchase agreements –2 622 1 101 –1 521 1 521 0Securities lending –1 387 525 –862 775 –87Total –7 224 3 599 –3 625 2 402 –1 223

Swiss Re First Quarter 2016 Report 49
Recognised gross liability for the obligation to return collateral that the Group has the right to sell or repledgeAs of 31 December 2015 and 31 March 2016, the gross amounts of liabilities related to repurchase agreements and securities lending by the class of securities transferred to third parties and by the remaining maturity are shown below. The liabilities are recognised for the obligation to return collateral that the Group has the right to sell or repledge.
The programme is structured in a conservative manner within a clearly defined risk framework. Yield enhancement is conducted on a non-cash basis, thereby taking no reinvestment risk.
2015 USD millions
Remaining contractual maturity of the agreementsOvernight and
continuous Up to 30 days 30–90 daysGreater than 90
days Total
Repurchase agreementsDebt securities issued by governments and government agencies 370 2 136 176 135 2 817Corporate debt securities 3 24 27Total repurchase agreements 373 2 160 176 135 2 844
Securities lendingDebt securities issued by governments and government agencies 217 501 433 1 151Total securities lending 217 0 501 433 1 151
Gross amount of recognised liabilities for repurchase agreements and securities lending 3 995
2016 USD millions
Remaining contractual maturity of the agreementsOvernight and
continuous Up to 30 days 30–90 daysGreater than 90
days Total
Repurchase agreementsDebt securities issued by governments and government agencies 1 166 1 044 161 135 2 506Corporate debt securities 116 116Total repurchase agreements 1 282 1 044 161 135 2 622
Securities lendingDebt securities issued by governments and government agencies 131 672 451 1 254Corporate debt securities 107 107Equity securities 26 26Total securities lending 157 0 779 451 1 387
Gross amount of recognised liabilities for repurchase agreements and securities lending 4 009

50 Swiss Re First Quarter 2016 Report
Unrealised losses on securities available-for-saleThe following table shows the fair value and unrealised losses of the Group’s fixed income securities, aggregated by investment category and length of time that individual securities were in a continuous unrealised loss position as of 31 December 2015 and 31 March 2016. As of 31 December 2015 and 31 March 2016, USD 161 million and USD 145 million, respectively, of the gross unrealised loss on equity securities available-for-sale relates to declines in value for less than 12 months and USD 46 million and USD 20 million, respectively, to decline in value for more than 12 months.
Less than 12 months 12 months or more Total2015 USD millions Fair value
Unrealised losses Fair value
Unrealised losses Fair value
Unrealised losses
Debt securities issued by governments and government agencies:
US Treasury and other US government corporations and agencies 5 993 91 11 1 6 004 92US Agency securitised products 1 503 23 223 5 1 726 28States of the United States and political subdivisions of the states 325 9 6 1 331 10United Kingdom 1 551 52 56 2 1 607 54Canada 976 14 96 24 1 072 38Germany 860 25 131 6 991 31France 502 13 23 5 525 18Other 3 113 111 202 35 3 315 146
Total 14 823 338 748 79 15 571 417Corporate debt securities 11 246 481 365 60 11 611 541Mortgage- and asset-backed securities 2 419 32 225 9 2 644 41Total 28 488 851 1 338 148 29 826 999
Less than 12 months 12 months or more Total2016 USD millions Fair value
Unrealised losses Fair value
Unrealised losses Fair value
Unrealised losses
Debt securities issued by governments and government agencies:
US Treasury and other US government corporations and agencies 2 504 6 2 504 6US Agency securitised products 877 8 201 3 1 078 11States of the United States and political subdivisions of the states 101 5 101 5United Kingdom 976 19 52 9 1 028 28Canada 1 071 5 97 17 1 168 22Germany 113 8 125 0 238 8France 39 3 39 3Other 2 302 55 170 18 2 472 73
Total 7 983 109 645 47 8 628 156Corporate debt securities 7 904 275 199 20 8 103 295Mortgage- and asset-backed securities 1 535 25 172 9 1 707 34Total 17 422 409 1 016 76 18 438 485

Swiss Re First Quarter 2016 Report 51
Mortgages, loans and real estateAs of 31 December 2015 and 31 March 2016, the carrying values of investments in mortgages, policy and other loans, and real estate (excluding unit-linked and with-profit business) were as follows:
The fair value of the real estate as of 31 December 2015 and 31 March 2016 was USD 3 211 million and USD 3 574 million, respectively. The carrying value of policy loans, mortgages and other loans approximates fair value.
Depreciation expense related to income-producing properties was USD 7 million and USD 9 million for the three months ended 31 March 2015 and 2016, respectively. Accumulated depreciation on investment real estate totalled USD 504 million and USD 527 million as of 31 December 2015 and 31 March 2016, respectively.
Substantially all mortgages, policy loans and other loan receivables are secured by buildings, land or the underlying policies.
USD millions 2015 2016
Policy loans 91 90Mortgage loans 1 946 2 433Other loans 1 086 1 682Investment real estate 1 556 1 845

52 Swiss Re First Quarter 2016 Report
Notes to the Group financial statements (unaudited)
7 Fair value disclosures
Fair value, as defined by the Fair Value Measurements and Disclosures Topic, is the price that would be received to sell an asset or paid to transfer a liability in an orderly transaction between market participants at the measurement date.
The Fair Value Measurements and Disclosures Topic requires all assets and liabilities that are measured at fair value to be categorised within the fair value hierarchy. This three-level hierarchy is based on the observability of the inputs used in the fair value measurement. The levels of the fair value hierarchy are defined as follows:
Level 1 inputs are quoted prices in active markets for identical assets or liabilities that the Group has the ability to access. Level 1 inputs are the most persuasive evidence of fair value and are to be used whenever possible.
Level 2 inputs are market-based inputs that are directly or indirectly observable, but not considered level 1 quoted prices. Level 2 inputs consist of (i) quoted prices for similar assets or liabilities in active markets; (ii) quoted prices for identical assets or liabilities in non-active markets (eg markets which have few transactions and where prices are not current or price quotations vary substantially); (iii) inputs other than quoted prices that are observable (eg interest rates, yield curves, volatilities, prepayment speeds, credit risks and default rates); and (iv) inputs derived from, or corroborated by, observable market data.
Level 3 inputs are unobservable inputs. These inputs reflect the Group’s own assumptions about market pricing using the best internal and external information available.
The types of instruments valued, based on unadjusted quoted market prices in active markets, include most US government and sovereign obligations, active listed equities and most money market securities. Such instruments are generally classified within level 1 of the fair value hierarchy.
The types of instruments that trade in markets that are not considered to be active, but are valued based on quoted market prices, broker or dealer quotations, or alternative pricing sources with reasonable levels of price transparency, include most government agency securities, investment-grade corporate bonds, certain mortgage- and asset-backed products, less liquid listed equities, and state, municipal and provincial obligations. Such instruments are generally classified within level 2 of the fair value hierarchy.
Exchange-traded derivative instruments typically fall within level 1 or level 2 of the fair value hierarchy depending on whether they are considered to be actively traded or not.
Certain financial instruments are classified within level 3 of the fair value hierarchy, because they trade infrequently and therefore have little or no price transparency. Such instruments include private equity, less liquid corporate debt securities and certain asset-backed securities. Certain over-the-counter (OTC) derivatives trade in less liquid markets with limited pricing information, and the determination of fair value for these derivatives is inherently more difficult. Such instruments are classified within level 3 of the fair value hierarchy. Pursuant to the election of the fair value option, the Group classifies certain liabilities for life and health policy benefits in level 3 of the fair value hierarchy. When appropriate, valuations are adjusted for various factors such as liquidity, bid/offer spreads, and credit considerations. Such adjustments are generally based on available market evidence. In the absence of such evidence, management’s best estimate is used.
The fair values of assets are adjusted to incorporate the counterparty risk of non-performance. Similarly, the fair values of liabilities reflect the risk of non-performance of the Group, captured by the Group’s credit spread. These valuation adjustments from assets and liabilities measured at fair value using significant unobservable inputs are recognised in net realised gains and losses. For the three months ended 31 March 2016, these adjustments were not material. Whenever the underlying assets or liabilities are reported in a specific business segment, the valuation adjustment is allocated accordingly. Valuation adjustments not attributable to any business segment are reported in Group items.
In certain situations, the Group uses inputs to measure the fair value of asset or liability positions that fall into different levels of the fair value hierarchy. In these situations, the Group will determine the appropriate level based on the lowest level input that is significant to the determination of the fair value.

Swiss Re First Quarter 2016 Report 53
Valuation techniquesUS government securities typically have quoted market prices in active markets and are categorised as level 1 instruments in the fair value hierarchy. Non-US government holdings are generally classified as level 2 instruments and are valued on the basis of the quotes provided by pricing services, which are subject to the Group’s pricing validation reviews and pricing vendor challenge process. Valuations provided by pricing vendors are generally based on the actual trade information as substantially all of the Group’s non-US government holdings are traded in a transparent and liquid market.
Corporate debt securities mainly include US and European investment-grade positions, which are priced on the basis of quotes provided by third-party pricing vendors and first utilise valuation inputs from actively traded securities, such as bid prices, bid spreads to Treasury securities, Treasury curves, and same or comparable issuer curves and spreads. Issuer spreads are determined from actual quotes and traded prices and incorporate considerations of credit/default, sector composition, and liquidity and call features. Where market data is not available, valuations are developed based on the modelling techniques that utilise observable inputs and option-adjusted spreads and incorporate considerations of the security’s seniority, maturity and the issuer’s corporate structure.
Values of mortgage- and asset-backed securities are obtained both from third-party pricing vendors and through quoted prices, some of which may be based on the prices of comparable securities with similar structural and collateral features. Values of certain asset-backed securities (ABS) for which there are no significant observable inputs are developed using benchmarks to similar transactions or indices. For both residential mortgage-backed securities (RMBS) and commercial mortgage-backed securities (CMBS), cash flows are derived based on the transaction-specific information, which incorporates priority in the capital structure, and are generally adjusted to reflect benchmark yields, market prepayment data, collateral performance (default rates and loss severity) for specific vintage and geography, credit enhancements, and ratings. For certain RMBS and CMBS with low levels of market liquidity, judgements may be required to determine comparable securities based on the loan type and deal-specific performance. CMBS terms may also incorporate lock-out periods that restrict borrowers from prepaying the loans or provide disincentives to prepay and therefore reduce prepayment risk of these securities, compared to RMBS. The factors specifically considered in valuation of CMBS include borrower-specific statistics in a specific region, such as debt service coverage and loan-to-value ratios, as well as the type of commercial property. Mortgage- and asset-backed securities also includes debt securitised by credit card, student loan and auto loan receivables. Pricing inputs for these securities also focus on capturing, where relevant, collateral quality and performance, payment patterns, and delinquencies.
The Group uses third-party pricing vendor data to value agency securitised products, which mainly include collateralised mortgage obligations (CMO) and mortgage-backed government agency securities. The valuations generally utilise observable inputs consistent with those noted above for RMBS and CMBS.
Equity securities held by the Group for proprietary investment purposes are mainly classified in level 1. Securities classified in level 1 are traded on public stock exchanges for which quoted prices are readily available.
The category “Other invested assets” includes the Group’s private equity and hedge fund investments which are made directly or via ownership of funds. Valuation of direct private equity investments requires significant management judgement due to the absence of quoted market prices and the lack of liquidity. Initial valuation is based on the acquisition cost, and is further refined based on the available market information for the public companies that are considered comparable to the Group’s holdings in the private companies being valued, and the private company-specific performance indicators; both historic and projected. Subsequent valuations also reflect business or asset appraisals, as well as market transaction data for private and public benchmark companies and the actual companies being valued, such as financing rounds and mergers and acquisitions activity. The Group’s holdings in private equity and hedge funds are generally valued utilising net asset values (NAV), subject to adjustments, as deemed necessary, for restrictions on redemption (lock-up periods and amount limitations on redemptions). These investments are included under investments measured at net asset value as practical expedient.
The Group holds both exchange-traded and (OTC) interest rate, foreign exchange, credit and equity derivative contracts for hedging and trading purposes. The fair values of exchange-traded derivatives measured using observable exchange prices are classified in level 1. Long-dated contracts may require adjustments to the exchange-traded prices which would trigger reclassification to level 2 in the fair value hierarchy. OTC derivatives are generally valued by the Group based on internal models, which are consistent with industry standards and practices, and use both observable (dealer, broker or market consensus prices, spot and forward rates, interest rate and credit curves and volatility indices) and unobservable inputs (adjustments for liquidity, inputs derived from the observable data based on the Group’s judgements and assumptions).

54 Swiss Re First Quarter 2016 Report
Notes to the Group financial statements (unaudited)
The Group’s OTC interest rate derivatives primarily include interest rate swaps, futures, options, caps and floors, and are valued based on the cash flow discounting models which generally utilise as inputs observable market yield curves and volatility assumptions.
The Group’s OTC foreign exchange derivatives primarily include forward, spot and option contracts and are generally valued based on the cash flow discounting models, utilising as main inputs observable foreign exchange forward curves.
The Group’s investments in equity derivatives primarily include OTC equity option contracts on single or baskets of market indices and equity options on individual or baskets of equity securities, which are valued using internally developed models (such as the Black-Scholes type option pricing model and various simulation models) calibrated with the inputs, which include underlying spot prices, dividend curves, volatility surfaces, yield curves, and correlations between underlying assets.
The Group’s OTC credit derivatives can include index and single-name credit default swaps, as well as more complex structured credit derivatives. Plain vanilla credit derivatives, such as index and single-name credit default swaps, are valued by the Group based on the models consistent with the industry valuation standards for these credit contracts, and primarily utilise observable inputs published by market data sources, such as credit spreads and recovery rates. These valuation techniques warrant classification of plain vanilla OTC derivatives as level 2 financial instruments in the fair value hierarchy.
Governance around level 3 fair valuationThe Asset Valuation Committee, endorsed by the Group Executive Committee, has a primary responsibility for governing and overseeing all of the Group’s asset and derivative valuation policies and operating parameters (including level 3 measurements). The Asset Valuation Committee delegates the responsibility for implementation and oversight of consistent application of the Groupʼs pricing and valuation policies to the Pricing and Valuation Committee.
The Pricing and Valuation Committee, which is a joint Risk Management & Finance management control committee, is responsible for the implementation and consistent application of the pricing and valuation policies. Key functions of the Pricing and Valuation Committee include: oversight over the entire valuation process, approval of internal valuation methodologies, approval of external pricing vendors, monitoring of the independent price verification (IPV) process and resolution of significant or complex valuation issues.
A formal IPV process is undertaken monthly by members of the Valuation Risk Management team within the Financial Risk Management function. The process includes monitoring and in-depth analyses of approved pricing methodologies and valuations of the Group’s financial instruments aimed at identifying and resolving pricing discrepancies.
The Risk Management function is responsible for independent validation and ongoing review of the Group’s valuation models. The Product Control group within Finance is tasked with reporting of fair values through the vendor- and model-based valuations, the results of which are also subject to the IPV process.

Swiss Re First Quarter 2016 Report 55
This page intentionally left blank
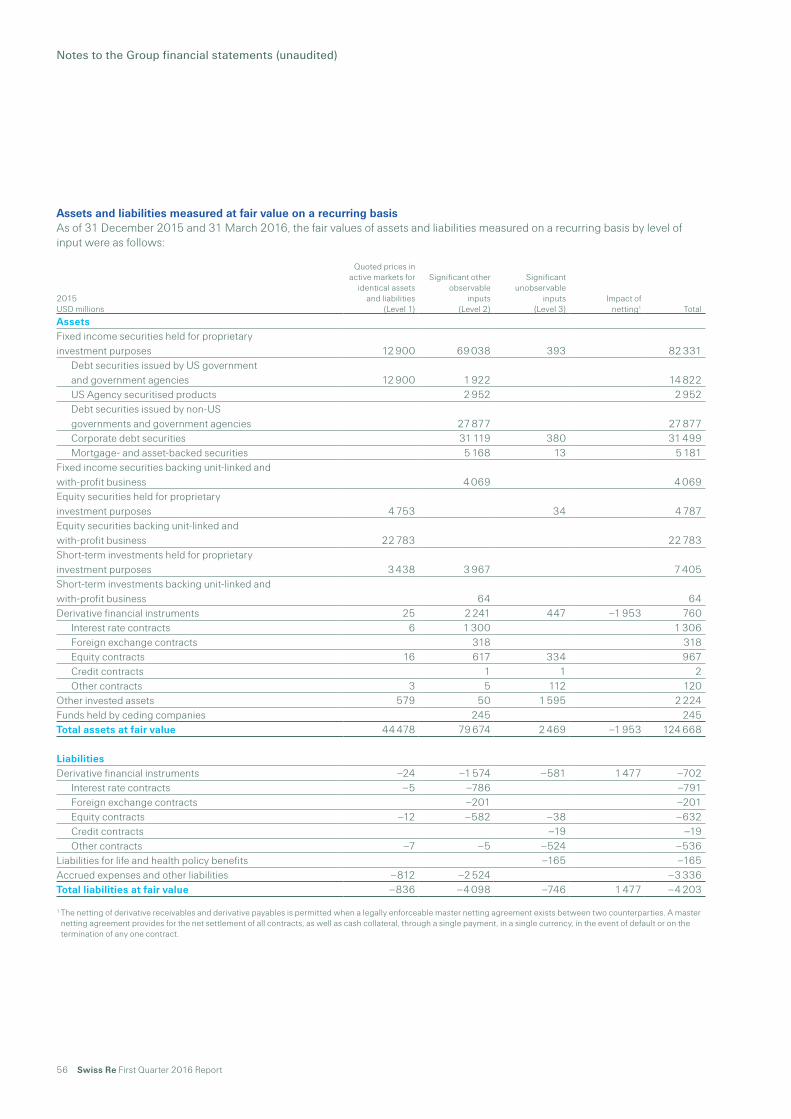
56 Swiss Re First Quarter 2016 Report
Notes to the Group financial statements (unaudited)
Assets and liabilities measured at fair value on a recurring basisAs of 31 December 2015 and 31 March 2016, the fair values of assets and liabilities measured on a recurring basis by level of input were as follows:
2015 USD millions
Quoted prices in active markets for
identical assets and liabilities
(Level 1)
Significant other observable
inputs (Level 2)
Significant unobservable
inputs (Level 3)
Impact of netting1 Total
AssetsFixed income securities held for proprietary investment purposes 12 900 69 038 393 82 331
Debt securities issued by US government and government agencies 12 900 1 922 14 822US Agency securitised products 2 952 2 952Debt securities issued by non-US governments and government agencies 27 877 27 877Corporate debt securities 31 119 380 31 499Mortgage- and asset-backed securities 5 168 13 5 181
Fixed income securities backing unit-linked and with-profit business 4 069 4 069Equity securities held for proprietary investment purposes 4 753 34 4 787Equity securities backing unit-linked and with-profit business 22 783 22 783Short-term investments held for proprietary investment purposes 3 438 3 967 7 405Short-term investments backing unit-linked and with-profit business 64 64Derivative financial instruments 25 2 241 447 –1 953 760
Interest rate contracts 6 1 300 1 306Foreign exchange contracts 318 318Equity contracts 16 617 334 967Credit contracts 1 1 2Other contracts 3 5 112 120
Other invested assets 579 50 1 595 2 224Funds held by ceding companies 245 245Total assets at fair value 44 478 79 674 2 469 –1 953 124 668
LiabilitiesDerivative financial instruments –24 –1 574 –581 1 477 –702
Interest rate contracts –5 –786 –791Foreign exchange contracts –201 –201Equity contracts –12 –582 –38 –632Credit contracts –19 –19Other contracts –7 –5 –524 –536
Liabilities for life and health policy benefits –165 –165Accrued expenses and other liabilities –812 –2 524 –3 336Total liabilities at fair value –836 –4 098 –746 1 477 –4 203
1 The netting of derivative receivables and derivative payables is permitted when a legally enforceable master netting agreement exists between two counterparties. A master netting agreement provides for the net settlement of all contracts, as well as cash collateral, through a single payment, in a single currency, in the event of default or on the termination of any one contract.

Swiss Re First Quarter 2016 Report 57
2016 USD millions
Quoted prices in active markets for
identical assets and liabilities
(Level 1)
Significant other observable
inputs (Level 2)
Significant unobservable
inputs (Level 3)
Impact of netting1
Investments measured at net
asset value as practical expedient Total
AssetsFixed income securities held for proprietary investment purposes 12 534 84 481 921 97 936
Debt securities issued by US government and government agencies 12 534 2 103 14 637US Agency securitised products 3 641 3 641Debt securities issued by non-US governments and government agencies 31 092 31 092Corporate debt securities 41 774 909 42 683Mortgage- and asset-backed securities 5 871 12 5 883
Fixed income securities backing unit-linked and with-profit business 5 980 5 980Equity securities held for proprietary investment purposes 4 333 23 4 356Equity securities backing unit-linked and with-profit business 27 097 27 097Short-term investments held for proprietary investment purposes 3 814 4 376 8 190Short-term investments backing unit-linked and with-profit business 62 62Derivative financial instruments 39 3 331 529 –2 348 1 551
Interest rate contracts 8 2 317 2 325Foreign exchange contracts 444 444Equity contracts 22 567 406 995Credit contracts 3 1 4Other contracts 9 122 131
Investment real estate 265 265Other invested assets 302 537 532 1 023 2 394Other investments backing unit-linked and with-profit business 536 536Funds held by ceding companies 244 244Total assets at fair value 48 119 99 547 2 270 –2 348 1 023 148 611
LiabilitiesDerivative financial instruments –41 –2 262 –912 1 973 –1 242
Interest rate contracts –8 –1 267 –1 275Foreign exchange contracts –1 –430 –431Equity contracts –13 –565 –48 –626Credit contracts –17 –17Other contracts –19 –847 –866
Liabilities for life and health policy benefits –176 –176Accrued expenses and other liabilities –617 –2 862 –3 479Total liabilities at fair value –658 –5 124 –1 088 1 973 0 –4 897
1 The netting of derivative receivables and derivative payables is permitted when a legally enforceable master netting agreement exists between two counterparties. A master netting agreement provides for the net settlement of all contracts, as well as cash collateral, through a single payment, in a single currency, in the event of default or on the termination of any one contract.

58 Swiss Re First Quarter 2016 Report
Notes to the Group financial statements (unaudited)
Assets and liabilities measured at fair value on a recurring basis using significant unobservable inputs (level 3)As of 31 December 2015 and 31 March 2016, the reconciliation of the fair values of assets and liabilities measured on a recurring basis using significant unobservable inputs were as follows:
2015 USD millions
Fixed income securities
Equity securities
Derivative assets
Other invested
assetsTotal
assetsDerivative
liabilities
Liabilities for life
and health policy
benefitsTotal
liabilities
Assets and liabilitiesBalance as of 1 January 401 39 521 1 812 2 773 –757 –187 –944
Realised/unrealised gains/losses:Included in net income 4 –12 –2 –10 190 22 212Included in other comprehensive income –14 –5 –42 –61 0
Purchases 31 30 156 217 0Issuances 0 –90 –90Sales –47 –21 –380 –448 15 15Settlements –46 –79 –125 62 62Transfers into level 31 65 8 70 143 –1 –1Transfers out of level 31 0 0Impact of foreign exchange movements –1 –19 –20 0
Closing balance as of 31 December 393 34 447 1 595 2 469 –581 –165 –746
1 Transfers are recognised at the date of the event or change in circumstances that caused the transfer.
2016 USD millions
Fixed income securities
Equity securities
Derivative assets
Investment real estate
Other invested
assetsTotal
assetsDerivative
liabilities
Liabilities for life
and health policy
benefitsTotal
liabilities
Assets and liabilitiesBalance as of 1 January 393 34 447 1 595 2 469 –581 –165 –746
Impact of Accounting Standards Updates2 274 –1 120 –846 –207 –207Realised/unrealised gains/losses:
Included in net income 3 84 13 5 105 –113 –12 –125Included in other comprehensive income –7 –7 0
Purchases 568 1 37 606 0Issuances 0 –8 –8Sales –32 –22 –54 16 16Settlements –2 –8 –10 –14 –14Transfers into level 31 6 12 18 –5 –5Transfers out of level 31 –12 –12 0Impact of foreign exchange movements –2 3 1 1 1
Closing balance as of 31 March 921 23 529 265 532 2 270 –912 –176 –1 088
1 Transfers are recognised at the date of the event or change in circumstances that caused the transfer.2 Impact of ASU 2015 – 02 and ASU 2015 – 07. Please refer to Note 1 for more details.

Swiss Re First Quarter 2016 Report 59
Gains and losses on assets and liabilities measured at fair value on a recurring basis using significant unobservable inputs (level 3)The gains and losses relating to the assets and liabilities measured at fair value using significant unobservable inputs (level 3) for the three months ended 31 March were as follows:
Assets and liabilities measured at fair value on a non-recurring basisIn accordance with the provisions of the Impairment or Disposal of Long-Lived Assets Subsections of FASB Codification Subtopic 360-10, loans held for sale with a carrying amount of USD 116 million were written down to their fair value of USD 109 million, resulting in a loss of USD 7 million, which was included in earnings for the period in “Net realised investment gains/losses – non-participating business”. This non-recurring fair value measurement was based on level 3 unobservable inputs using a discounted cash flow approach by an external vendor.
USD millions 2015 2016
Gains/losses included in net income for the period –9 –20Whereof change in unrealised gains/losses relating to assets and liabilities still held at the reporting date 13 –51

60 Swiss Re First Quarter 2016 Report
Notes to the Group financial statements (unaudited)
Quantitative information about level 3 fair value measurementsUnobservable inputs for major level 3 assets and liabilities as of 31 December 2015 and 31 March 2016 were as follows:
USD millions2015
Fair value2016
Fair value Valuation technique Unobservable inputRange
(weighted average)
AssetsCorporate debt securities 380 909
Private placement corporate debt 241 601 Corporate Spread Matrix Credit spread 96 bps–760 bps (249 bps)
Private placement credit tenant leases 51 51 Discounted Cash Flow Model Illiquidity premium 75 bps–175 bps (132 bps)
Infrastructure loan 86 88 Discounted Cash Flow Model Valuation spread 181 bps–196 bps (185 bps)
Derivative equity contracts 334 406OTC equity option referencing correlated equity indices
334 406 Proprietary Option Model Correlation –60%–100% (20%)1
Investment real estate 265 Discounted Cash Flow Model Discount rate due to lifetime lease
5% per annum
LiabilitiesDerivative equity contracts –38 –48
OTC equity option referencing correlated equity indices
–38 –48 Proprietary Option Model Correlation –60%–100% (20%)1
Other derivative contracts and liabilities for life and health policy benefits
–689 –1 023
Variable annuity and fair valued GMDB contracts
–567 –695 Discounted Cash Flow Model Risk margin 4% (n.a.)Volatility 4%–42%Lapse 0.5%–33%Mortality adjustment –10%–0%Withdrawal rate 0%–90%
Swap liability referencing real estate investments
–201 Discounted Cash Flow Model Discount rate due to lifetime lease
5% per annum
Weather contracts –82 –84 Proprietary Option Model Risk Margin 8%-11% (9%)Correlation –90%–63% (–19%)Volatility (power/gas) 32%–84% (49%)Volatility (temperature)
0–204 (23) HDD/CAT2
Index value (temperature)
175–4924 (2197) HDD/CAT2
1 Represents average input value for the reporting period.2 Heating Degree Days (HDD); Cumulative Average Temperature (CAT).

Swiss Re First Quarter 2016 Report 61
Sensitivity of recurring level 3 measurements to changes in unobservable inputsThe significant unobservable input used in the fair value measurement of the Group’s private placement corporate debt securities is credit spread. A significant increase (decrease) in this input in isolation would result in a significantly lower (higher) fair value measurement. The significant unobservable input used in the fair value measurement of the Group’s private placement credit tenant leases is illiquidity premium. A significant increase (decrease) in this input in isolation would result in a significantly lower (higher) fair value measurement. The significant unobservable input used in the fair value measurement of the Group’s infrastructure loan is valuation spread. A significant increase (decrease) in this input in isolation would result in a significantly lower (higher) fair value measurement.
The significant unobservable input used in the fair value measurement of the Group’s OTC equity option referencing correlated equity indices is correlation. Where the Group is long correlation risk, a significant increase (decrease) in this input in isolation would result in a significantly higher (lower) fair value measurement. Where the Group is short correlation risk, a significant increase (decrease) in this input in isolation would result in a significantly lower (higher) fair value measurement.
The significant unobservable input used in the fair value measurement of the Group’s investment real estate and swap liability referencing real estate investment is the rate used to discount future property sales to reflect lifetime lease on residential properties. A significant increase (decrease) in this input in isolation would result in a significantly lower (higher) fair value measurement.
The significant unobservable inputs used in the fair value measurement of the Group’s variable annuity and fair valued guaranteed minimum death benefit (GMDB) contracts are: risk margin, volatility, lapse, mortality adjustment rate and withdrawal rate. A significant increase (decrease) in isolation in each of the following inputs: risk margin, volatility and withdrawal rate would result in a significantly higher (lower) fair value of the Group’s obligation. A significant increase (decrease) in isolation in a lapse rate for in-the-money contracts would result in a significantly lower (higher) fair value of the Group’s obligation, whereas for out-of-the-money contracts, an isolated increase (decrease) in a lapse assumption would increase (decrease) fair value of the Group’s obligation. Changes in the mortality adjustment rate impact fair value of the Group’s obligation differently for living-benefit products, compared to death-benefit products. For the former, a significant increase (decrease) in the mortality adjustment rate (ie increase (decrease) in mortality, respectively) in isolation would result in a decrease (increase) in fair value of the Group’s liability. For the latter, a significant increase (decrease) in the mortality adjustment rate in isolation would result in an increase (decrease) in fair value of the Group’s liability.
The significant unobservable inputs used in the fair value measurement of the Group’s weather contracts are risk margin, correlation, volatility and index value. Where the Group has a long position, a significant increase (decrease) in the risk margin input in isolation would result in a significantly higher (lower) fair value measurement. Where the Group has a long volatility or correlation position, a significant increase (decrease) in the correlation and volatility inputs would result in a significantly higher (lower) fair value measurement. Where the Group has a long index position, an increase (decrease) in the index value input in isolation would result in a significantly higher (lower) fair value measurement. Where the Group has a short position, a significant increase (decrease) in the risk margin input in isolation would result in a significantly lower (higher) fair value measurement. Where the Group has a short volatility or correlation position a significant increase (decrease) in the correlation and volatility inputs would result in a significantly lower (higher) fair value measurement. Where the Group has a short index position, an increase (decrease) in the index value input in isolation would result in a significantly lower (higher) fair value measurement.

62 Swiss Re First Quarter 2016 Report
Notes to the Group financial statements (unaudited)
Other invested assets measured at net asset valueOther invested assets measured at net asset value as of 31 December 2015 and 31 March 2016, respectively, were as follows:
The hedge fund investments employ a variety of strategies, including global macro, relative value, event-driven and long/short equity across various asset classes.
The private equity direct portfolio consists of equity and equity-like investments directly in other companies. These investments have no contractual term and are generally held based on financial or strategic intent.
Private equity and real estate funds generally have limitations imposed on the amount of redemptions from the fund during the redemption period due to illiquidity of the underlying investments. Fees may apply for redemptions or transferring of interest to other parties. Distributions are expected to be received from these funds as the underlying assets are liquidated over the life of the fund, which is generally from 10 to 12 years.
The redemption frequency of hedge funds varies depending on the manager as well as the nature of the underlying product. Additionally, certain funds may impose lock-up periods and redemption gates as defined in the terms of the individual investment agreement.
Fair value optionThe fair value option under the Financial Instruments Topic permits the choice to measure specified financial assets and liabilities at fair value on an instrument-by-instrument basis.
The Group elected the fair value option for positions in the following line items in the balance sheet:
Other invested assets The Group elected the fair value option for certain investments classified as equity method investees within other invested assets in the balance sheet. The Group applied the fair value option, as the investments are managed on a fair value basis. The changes in fair value of these elected investments are recorded in earnings.
Funds held by ceding companies For operational efficiencies, the Group elected the fair value option for funds held by the cedent under three of its reinsurance agreements. The assets are carried at fair value and changes in fair value are reported as a component of earnings.
Investments for unit-linked and with-profit business For operational efficiencies, the Group elected the fair value option for equity linked deposits from one of its unit-linked businesses. The assets are carried at fair value and changes in fair value are reported as a component of earnings.
Liabilities for life and health policy benefits The Group elected the fair value option for existing GMDB reserves related to certain variable annuity contracts which are classified as universal life-type contracts. The Group has applied the fair value option, as the equity risk associated with those contracts is managed on a fair value basis and it is economically hedged with derivative options in the market.
Accrued expenses and other liabilities For operational efficiencies, the Group elected the fair value option on a hybrid financial instrument, where the host contract is a debt instrument and the embedded derivative is pegged to the performance of the fund's real estate portfolio. The liability is carried at fair value and changes in fair value are reported as a component of earnings.
USD millions2015
Fair value2016
Fair valueUnfunded
commitmentsRedemption frequency
(if currently eligible)Redemption
notice period
Private equity funds 686 619 184 non-redeemable n.a.Hedge funds 135 134 redeemable1 45‒95 days2
Private equity direct 121 77 non-redeemable n.a.Real estate funds 203 193 93 non-redeemable n.a.Total 1 145 1 023 277
1 The redemption frequency varies by position.2 Cash distribution can be delayed for an extended period depending on the sale of the underlyings.
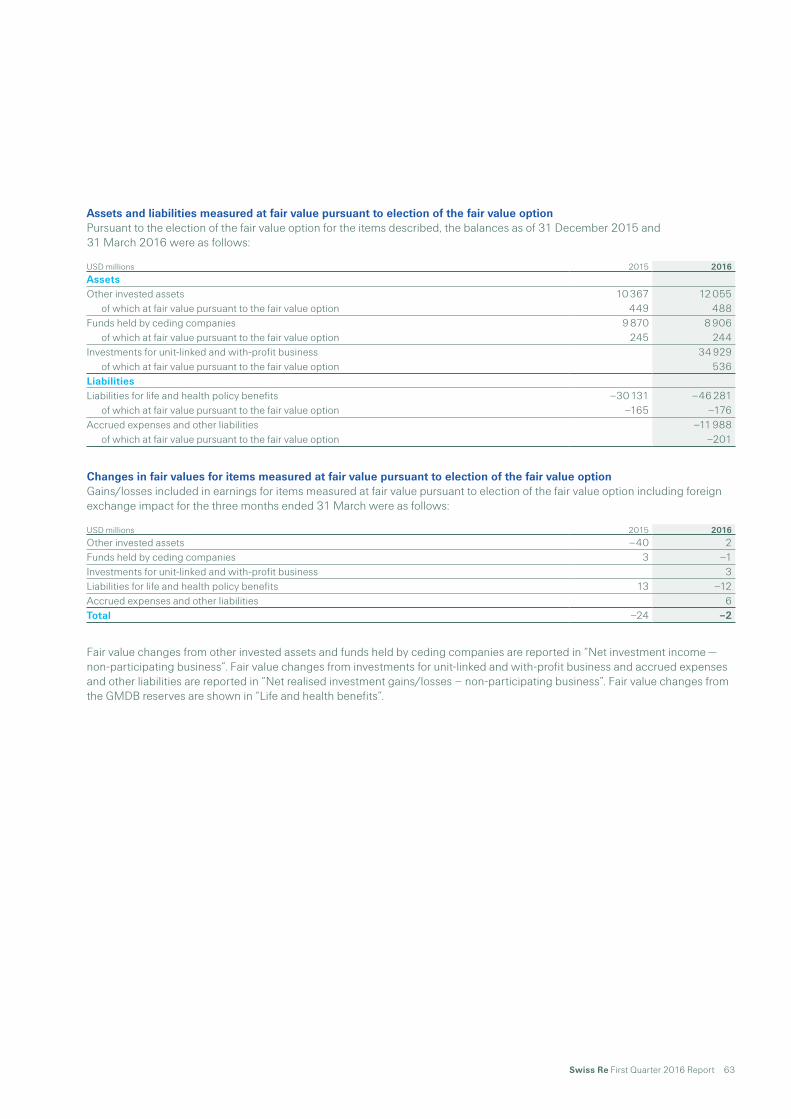
Swiss Re First Quarter 2016 Report 63
Assets and liabilities measured at fair value pursuant to election of the fair value optionPursuant to the election of the fair value option for the items described, the balances as of 31 December 2015 and 31 March 2016 were as follows:
Changes in fair values for items measured at fair value pursuant to election of the fair value optionGains/losses included in earnings for items measured at fair value pursuant to election of the fair value option including foreign exchange impact for the three months ended 31 March were as follows:
Fair value changes from other invested assets and funds held by ceding companies are reported in “Net investment income — non-participating business”. Fair value changes from investments for unit-linked and with-profit business and accrued expenses and other liabilities are reported in “Net realised investment gains/losses – non-participating business”. Fair value changes from the GMDB reserves are shown in “Life and health benefits”.
USD millions 2015 2016
AssetsOther invested assets 10 367 12 055
of which at fair value pursuant to the fair value option 449 488Funds held by ceding companies 9 870 8 906
of which at fair value pursuant to the fair value option 245 244Investments for unit-linked and with-profit business 34 929
of which at fair value pursuant to the fair value option 536LiabilitiesLiabilities for life and health policy benefits –30 131 –46 281
of which at fair value pursuant to the fair value option –165 –176Accrued expenses and other liabilities –11 988
of which at fair value pursuant to the fair value option –201
USD millions 2015 2016
Other invested assets –40 2Funds held by ceding companies 3 –1Investments for unit-linked and with-profit business 3Liabilities for life and health policy benefits 13 –12Accrued expenses and other liabilities 6Total –24 –2

64 Swiss Re First Quarter 2016 Report
Notes to the Group financial statements (unaudited)
Assets and liabilities not measured at fair value but for which the fair value is disclosedAssets and liabilities not measured at fair value but for which the fair value is disclosed as of 31 December 2015 and 31 March 2016, were as follows:
Policy loans, other loans and certain mortgage loans are classified as level 3 measurements, as they do not have an active exit market. Some of these positions need to be assessed in conjunction with the corresponding insurance business. Considering these circumstances, the Group presents the carrying amount as an approximation for the fair value.
Investments in real estate are fair valued primarily by external appraisers based on proprietary discounted cash flow models that incorporate applicable risk premium adjustments to discount yields and projected market rental income streams based on market-specific data. These fair value measurements are classified in level 3 in the fair value hierarchy.
Debt positions, which are fair valued based on executable broker quotes or based on the discounted cash flow method using observable inputs, are classified as level 2 measurements. Fair value of the majority of the Group’s level 3 debt positions is judged to approximate carrying value due to the highly tailored nature of the obligation and short-notice termination provisions.
2015 USD millions
Significant other observable inputs
(Level 2)
Significant unobservable
inputs (Level 3) Total
AssetsPolicy loans 91 91Mortgage loans 1 946 1 946Other loans 1 086 1 086Investment real estate 3 211 3 211Total assets 0 6 334 6 334
LiabilitiesDebt –8 681 –5 674 –14 355Total liabilities –8 681 –5 674 –14 355
2016 USD millions
Significant other observable inputs
(Level 2)
Significant unobservable
inputs (Level 3) Total
AssetsPolicy loans 90 90Mortgage loans 2 433 2 433Other loans 1 682 1 682Investment real estate 3 309 3 309Total assets 0 7 514 7 514
LiabilitiesDebt –8 852 –6 450 –15 302Total liabilities –8 852 –6 450 –15 302

Swiss Re First Quarter 2016 Report 65
8 Derivative financial instruments
The Group uses a variety of derivative financial instruments including swaps, options, forwards, credit derivatives and exchange-traded financial futures in its trading and hedging strategies, in line with the Group’s overall risk management strategy. The objectives include managing exposure to price, foreign currency and/or interest rate risk on planned or anticipated investment purchases, existing assets or liabilities, as well as locking in attractive investment conditions for future available funds.
The fair values represent the gross carrying value amounts at the reporting date for each class of derivative contract held or issued by the Group. The gross fair values are not an indication of credit risk, as many over-the-counter transactions are contracted and documented under ISDA master agreements or their equivalent. Management believes that such agreements provide for legally enforceable set-off in the event of default, which substantially reduces credit exposure.

66 Swiss Re First Quarter 2016 Report
Notes to the Group financial statements (unaudited)
Fair values and notional amounts of derivative financial instrumentsAs of 31 December 2015 and 31 March 2016, the fair values and notional amounts of the derivatives outstanding were as follows:
The notional amounts of derivative financial instruments give an indication of the Group’s volume of derivative activity. The fair value assets are included in “Other invested assets” and the fair value liabilities are included in “Accrued expenses and other liabilities”. The fair value amounts that were not offset were nil as of 31 December 2015 and 31 March 2016.
2015 USD millions
Notional amount assets/liabilities
Fair value assets
Fair value liabilities
Carrying value assets/liabilities
Derivatives not designated as hedging instrumentsInterest rate contracts 63 485 1 306 –791 515Foreign exchange contracts 14 230 281 –201 80Equity contracts 16 374 967 –632 335Credit contracts 188 2 –19 –17Other contracts 18 113 120 –536 –416Total 112 390 2 676 –2 179 497
Derivatives designated as hedging instrumentsForeign exchange contracts 2 151 37 37Total 2 151 37 0 37
Total derivative financial instruments 114 541 2 713 –2 179 534
Amount offsetWhere a right of set-off exists –1 162 1 162Due to cash collateral –791 315Total net amount of derivative financial instruments 760 –702 58
2016 USD millions
Notional amount assets/liabilities
Fair value assets
Fair value liabilities
Carrying value assets/liabilities
Derivatives not designated as hedging instrumentsInterest rate contracts 84 596 2 325 –1 275 1 050Foreign exchange contracts 23 976 442 –231 211Equity contracts 17 002 995 –626 369Credit contracts 215 4 –17 –13Other contracts 18 276 131 –866 –735Total 144 065 3 897 –3 015 882
Derivatives designated as hedging instrumentsForeign exchange contracts 6 714 2 –200 –198Total 6 714 2 –200 –198
Total derivative financial instruments 150 779 3 899 –3 215 684
Amount offsetWhere a right of set-off exists –1 590 1 590Due to cash collateral –758 383Total net amount of derivative financial instruments 1 551 –1 242 309

Swiss Re First Quarter 2016 Report 67
Non-hedging activitiesThe Group primarily uses derivative financial instruments for risk management and trading strategies. Gains and losses of derivative financial instruments not designated as hedging instruments are recorded in “Net realised investment gains/losses — non-participating business” in the income statement. For the three months ended 31 March, the gains and losses of derivative financial instruments not designated as hedging instruments were as follows:
Hedging activitiesThe Group designates certain derivative financial instruments as hedging instruments. The designation of derivative financial instruments is primarily used for overall portfolio and risk management strategies. As of 31 March, the following hedging relationships were outstanding:
Fair value hedges The Group enters into foreign exchange swaps to reduce the exposure to foreign exchange volatility for certain of its issued debt positions and fixed income securities. These derivative instruments are designated as hedging instruments in qualifying fair value hedges. Gains and losses on derivative financial instruments designated as fair value hedging instruments are recorded in “Net realised investment gains/losses ― non-participating business” in the income statement. For the three months ended 31 March, the gains and losses attributable to the hedged risks were as follows:
Hedges of the net investment in foreign operations The Group designates derivative and non-derivative monetary financial instruments as hedging the foreign currency exposure of its net investment in certain foreign operations.
For the year ended 31 December 2015 and the three months ended 31 March 2016, the Group recorded an accumulated net unrealised foreign currency remeasurement gain of USD 1 631 million and a gain of USD 1 411 million, respectively, in shareholders’ equity. These offset translation gains and losses on the hedged net investment.
USD millions 2015 2016
Derivatives not designated as hedging instrumentsInterest rate contracts –30 459Foreign exchange contracts 219 112Equity contracts –102 –147Credit contracts –1 1Other contracts 53 –96Total gain/loss recognised in income 139 329
2015 2016 USD millions
Gains/losses on derivatives
Gains/losses on hedged items
Gains/losses on derivatives
Gains/losses on hedged items
Fair value hedging relationshipsForeign exchange contracts 119 –119 –205 205Total gain/loss recognised in income 119 –119 –205 205

68 Swiss Re First Quarter 2016 Report
Notes to the Group financial statements (unaudited)
Maximum potential lossIn consideration of the rights of set-off and the qualifying master netting arrangements with various counterparties, the maximum potential loss as of 31 December 2015 and 31 March 2016 was approximately USD 1 551 million and USD 2 309 million, respectively. The maximum potential loss is based on the positive market replacement cost assuming non-performance of all counterparties, excluding cash collateral.
Credit risk-related contingent featuresCertain derivative instruments held by the Group contain provisions that require its debt to maintain an investment-grade credit rating. If the Group’s credit rating were downgraded or no longer rated, the counterparties could request immediate payment, guarantee or an ongoing full overnight collateralisation on derivative instruments in net liability positions.
The total fair value of derivative financial instruments containing credit risk-related contingent features amounted to USD 106 million and USD 128 million as of 31 December 2015 and 31 March 2016, respectively. For derivative financial instruments containing credit risk-related contingent features, the Group posted collateral of nil as of 31 December 2015 and 31 March 2016, respectively. In the event of a reduction of the Group’s credit rating to below investment grade, a fair value of USD 128 million additional collateral would have had to be posted as of 31 March 2016. The total equals the amount needed to settle the instruments immediately as of 31 March 2016.

Swiss Re First Quarter 2016 Report 69
9 Acquisitions
IHC Risk Solutions CorporationOn 31 March 2016, Swiss Re Corporate Solutions acquired 100% of the shares of IHC Risk Solutions, LLC, a leading US employer stop loss underwriter. The cost of the acquisition was USD 153 million. The transaction includes IHC Risk Solutions‘ operations, its team of experts and business portfolio, including in-force, new and renewal business by IHC Risk Solutions. This acquisition broadens the Group’s current employer stop loss capabilities in the small- and middle-market self-funded healthcare benefits segment.
Guardian Holdings Europe LimitedOn 6 January 2016, the Group acquired 100% of the shares of Guardian Holdings Europe Limited, the holding company for operations trading under the name Guardian Financial Services (“Guardian”) from private equity company Cinven. Guardian provides insurance solutions to financial institutions and insurance companies, either through the acquisition of closed books of business or through entering reinsurance agreements with its customers.
The transaction has further demonstrated progress against the strategy of the Group’s Business Unit Life Capital (formerly Admin Re®) as a leading closed life book consolidator in the UK, adding approximately 900,000 policies including a mixture of annuities, life insurance and pensions. As a result, the policyholder and asset base of the Group has expanded and Life Capital has diversified its current business mix, with a total of approximately four million policies under administration.
The results of the operations of Guardian have been included in the Group’s consolidated financial statements since 6 January 2016. For the period 6 January until 31 March 2016, Guardian generated USD 526 million (including net investment result – unit-linked and with-profit business of USD 108 million) in revenues and USD 274 million in net income for the Group.
Determination and allocation of the purchase price The total cost of acquisition as of 6 January 2016 was USD 2.3 billion in cash, paid in form of the following components:
USD millions 2016
Share purchase 1 211Debt repayment 1 118Total cost of acquisition 2 329Goodwill 153Total net assets acquired 2 176

70 Swiss Re First Quarter 2016 Report
Notes to the Group financial statements (unaudited)
The purchase price has been allocated based on estimated fair values of assets acquired and liabilities assumed as of the date of acquisition. The allocation required significant judgement. Consequently, the estimates might change. The estimated fair values of assets acquired and liabilities assumed as of the date of the acquisition were as follows:
USD millions 2016
AssetsFixed income securities 11 321Equity securities 1Policy loans, mortgages and other loans 1 240Short-term investments 117Other invested assets 590Investments for unit-linked and with-profit business 8 023Total investments 21 292Cash and cash equivalents 2 775Accrued investment income 265Premiums and other receivables 39Reinsurance recoverable 1 751Negative acquired present value of future profits –641Deferred tax assets 119Other assets 11Total assets acquired 25 611
LiabilitiesUnpaid claims and claims adjustment expenses 56Liabilities for life and health policy benefits 16 535Policyholder account balances 6 157Reinsurance balances payable 9Income taxes payable 6Deferred and other non-current tax liabilities 294Accrued expenses and other liabilities 378Total liabilities assumed 23 435
Total net assets acquired 2 176

Swiss Re First Quarter 2016 Report 71
Intangible assets Historic intangible assets including goodwill have been eliminated. The Group has established negative acquired present value of future profits (negative PVFP), which qualifies as a purchased intangible liability, and goodwill.
The negative PVFP of USD 641 million is amortised over a weighted average amortisation period of 12 years. The residual amount is expected to be nil.
The goodwill of USD 153 million recognised upon acquisition is attributed to the Life Capital Business Unit. It is mainly the result of synergies, which the Group expects to receive from cost savings, capital savings and asset allocation management actions. These do not qualify for separate recognition. The recorded goodwill is not expected to be deductible for tax purposes and, as of 31 March 2016, remained unchanged at constant foreign exchange rates.
ReceivablesReceivables acquired consisted of the following:
The receivables are expected to be collectible.
Pro forma financial results (unaudited)The following table shows the Group’s unaudited pro forma consolidated information for the three months ended 31 March 2015, assuming that the acquisition had occurred on 1 January 2015:
The pro forma information for the period 1 January 2016 until 5 January 2016 is immaterial.
The pro forma results are presented for informational purposes and in order to illustrate the financial effect on the Group’s income statement only. Consequently, they neither reflect the results that would have occurred had the acquisition been closed on the assumed date, nor necessarily indicate future results.
2016 USD millions Fair value
Gross contractual amount
Receivables from ceded re/insurance business 39 39Other debtors 15 15Total 54 54
USD millions 2015
Total revenues 11 443Net income 1 644

72 Swiss Re First Quarter 2016 Report
Notes to the Group financial statements (unaudited)
10 Debt and contingent capital instruments
The Group enters into long- and short-term debt arrangements to obtain funds for general corporate use and specific transaction financing. The Group defines short-term debt as debt having a maturity at the balance sheet date of not greater than one year and long-term debt as having a maturity of greater than one year. For subordinated debt positions maturity is defined as the first optional redemption date (notwithstanding that optional redemption could be subject to regulatory consent). Interest expense is classified accordingly.
The Groupʼs debt as of 31 December 2015 and 31 March 2016 was as follows:
The Group uses debt for general corporate purposes and to fund discrete pools of operational leverage and financial intermediation assets. Operational leverage and financial intermediation are subject to asset and liability matching, resulting in little to no risk that the assets will be insufficient to service and settle the liabilities. Debt used for operational leverage and financial intermediation is treated as operational debt and excluded by the rating agencies from financial leverage calculations. Certain debt positions are limited- or non-recourse, meaning the debtorsʼ claims are limited to assets underlying the financing. As of 31 December 2015 and 31 March 2016, debt related to operational leverage and financial intermediation amounted to USD 4.0 billion (thereof USD 3.0 billion limited- or non-recourse) and USD 3.6 billion (thereof USD 2.7 billion limited- or non-recourse), respectively.
Interest expense on long-term debt and contingent capital instrumentsInterest expense on long-term debt for the periods ended 31 March was as follows:
In addition to the above, interest expense on contingent capital instruments classified as equity was USD 17 million and USD 17 million for the three months ended 31 March 2015 and 2016, respectively.
Long-term debt issued in 2016No long-term debt was issued in the first quarter 2016.
USD millions 2015 2016
Senior financial debt 791Senior operational debt 765 505Subordinated financial debt 1 069 1 085Short-term debt – financial and operational debt 1 834 2 381
Senior financial debt 3 688 3 711Senior operational debt 467 422Subordinated financial debt 4 103 4 186Subordinated operational debt 2 720 2 667Long-term debt – financial and operational debt 10 978 10 986
Total carrying value 12 812 13 367Total fair value 14 355 15 302
USD millions 2015 2016
Senior financial debt 30 29Senior operational debt 3 3Subordinated financial debt 73 49Subordinated operational debt 34 32Total 140 113

Swiss Re First Quarter 2016 Report 73
11 Earnings per share
Earnings per share for the three months ended 31 March were as follows:
Dividends are declared in Swiss francs. In 2015, the Group paid a dividend per share of CHF 4.25, as well as an additional special dividend of CHF 3.00. All dividends were paid in the form of withholding tax exempt repayment of legal reserves from capital contributions. On 23 February 2016, the Board of Directors of the Group proposed a dividend of CHF 4.60 for the 2015 financial year to be paid in 2016. This was approved by shareholders at the Annual General Meeting on 22 April 2016.
At the 151st Annual General Meeting held on 21 April 2015, the Group’s shareholders authorised the Group Board of Directors to repurchase up to a maximum CHF 1 billion purchase value of the Group’s own shares prior to the 2016 Annual General Meeting by way of a buy-back programme for cancellation purposes. The share buy-back programme was completed as of 2 March 2016. The total number of shares repurchased amounted to 10.6 million, of which 4.4 million and 6.2 million shares were repurchased as of 31 December 2015 and between 1 January and 2 March 2016, respectively.
USD millions (except share data) 2015 2016
Basic earnings per shareNet income 1 457 1 243Non-controlling interests 3Interest on contingent capital instruments1 –17 –17Net income attributable to common shareholders 1 440 1 229Weighted average common shares outstanding 342 110 887 333 979 460Net income per share in USD 4.21 3.68Net income per share in CHF2 4.00 3.68
Effect of dilutive securitiesChange in income available to common shares due to contingent capital instruments1 17 17Change in average number of shares due to contingent capital instruments 35 745 192 35 745 192Change in average number of shares due to employee options 2 450 503 2 219 012
Diluted earnings per shareNet income assuming debt conversion and exercise of options 1 457 1 246Weighted average common shares outstanding 380 306 582 371 943 664Net income per share in USD 3.83 3.35Net income per share in CHF2 3.64 3.34
1 Please refer to Note 10 “Debt and contingent capital instruments”.2 The translation from USD to CHF is shown for informational purposes only and has been calculated using the Group’s average exchange rates.

74 Swiss Re First Quarter 2016 Report
Notes to the Group financial statements (unaudited)
12 Variable interest entities
The adoption of ASU 2015-2 as of 1 January 2016 led to an increase in the number of variable interest entities (VIEs), mainly due to the evaluation of partnerships and investment funds.
The Group enters into arrangements with VIEs in the normal course of business. The involvement ranges from being a passive investor to designing, structuring and managing the VIEs. The variable interests held by the Group arise primarily as a result of the Group‘s involvements in certain insurance-linked securitisations, life and health funding transactions, swaps in trusts, debt financing, investment, senior commercial mortgage and infrastructure loans as well as other entities, which meet the definition of a VIE.
When analysing whether the entity is a VIE, the Group mainly assesses if (1) the equity is sufficient to finance the entity‘s activities without additional subordinated financial support, (2) the equity holders have the right to make significant decisions affecting the entity‘s operations and (3) the holders of the voting rights substantively participate in the gains and losses of the entity.
When one of these criteria is not met, the entity is considered a VIE and is assessed for consolidation under the VIE section of the Consolidation Topic.
The party that has a controlling financial interest is called a primary beneficiary and consolidates the VIE. The party is deemed to have a controlling financial interest if it has both of the following:
the power to direct the activities of the VIE that most significantly impact the entity‘s economic performance; and
the obligation to absorb the entity‘s losses that could potentially be significant to the VIE or the right to receive benefits from the entity that could potentially be significant to the VIE.
For all its variable interests in VIEs, the Group assesses whether it has a controlling financial interest in these entities and, thus, is the primary beneficiary. The Group identifies the activities that most significantly impact the entity‘s performance and determines whether the Group has the power to direct those activities. In conducting the analysis, the Group considers the purpose, the design and the risks that the entity was designed to create and pass through to its variable interest holders. Additionally, the Group assesses if it has the obligation to absorb losses or if it has the right to receive benefits of the VIE that could potentially be significant to the entity. If both criteria are met, the Group has a controlling financial interest in the VIE and consolidates the entity.
The Group monitors changes to the facts and circumstances of the existing involvements with legal entities to determine whether they require reconsideration of the entity‘s designation as a VIE or voting interest entity. For VIEs, the Group reassesses regularly the primary beneficiary determination.
Insurance-linked securitisationsThe insurance-linked securitisations transfer pre-existing insurance risk to investors through the issuance of insurance-linked securities. In insurance-linked securitisations, the securitisation vehicle assumes the insurance risk from a sponsor through insurance or derivative contracts. The securitisation vehicle generally retains the issuance proceeds as collateral, which consists of investment-grade securities. The Group does not have potentially significant variable interest in these vehicles and therefore is not a primary beneficiary.
Typically, the variable interests held by the Group arise through ownership of insurance-linked securities, in which case the Group‘s maximum loss equals the principal amount of the securities held by the Group.

Swiss Re First Quarter 2016 Report 75
Life and health funding vehiclesThe Group participates in certain structured transactions that retrocede longevity and mortality risks to captive reinsurers with an aim to provide regulatory capital credit to a transaction sponsor through creation of funding notes by a separate funding vehicle which is generally considered a VIE. The Group‘s participation in these transactions is generally limited to providing contingent funding support via a financial contract with a funding vehicle, which represents a potentially significant variable interest in the funding vehicle. The Group does not have power to direct activities of the funding vehicles and therefore is not a primary beneficiary of the funding vehicles in these transactions. The Group‘s maximum exposure in these transactions equals either the total contract notional or outstanding balance of the funding notes issued by the vehicle, depending on the specific contractual arrangements.
Swaps in trustsThe Group provides interest rate and foreign exchange risk hedges to certain asset securitisation trusts which qualify as VIEs. As the Group‘s involvement is limited to interest rate and foreign exchange derivatives, it does not have power to direct any activities of the trusts and therefore does not qualify as primary beneficiary of any of these trusts. These activities are in run-off.
Debt financing vehiclesThe Group consolidates a debt-financing vehicle created to collateralise reinsurance coverage provided by the Group. The Group manages the asset portfolio in the vehicle and absorbs the variability of the investment return of the vehicle‘s portfolio thereby satisfying both criteria for a controlling financial interest: power over activities most significant to the vehicle‘s economic performance and significant economic interest.
As part of a broader run-off transaction, the Group holds equity in and borrows funds from a VIE. The assets held by the VIE consist primarily of investment grade securities and the majority of their returns is absorbed by a third party, minimising the Group‘s maximum exposure. The Group is not a primary beneficiary of the VIE, because it does not have power over most significant activities of the VIE and its interests are not potentially significant.
Investment vehiclesThe ASU 2015-2 implementation resulted in consolidation by the Group of the following two structured investment vehicles that are VIEs:
Real estate investment entity, which holds real estate backing annuities business. The Group is its primary beneficiary, because it has both power over the entity‘s investment decisions, as well as a significant variable interest in the entity.
Investment entity, which was acquired through the Guardian acquisition, primarily holding loans and structured securities, where the Group holds the entire variable interest and participated in the entity‘s formation. As the contractual termination of the Group‘s interests in the vehicle will take place in 2016, the loans are classified as held for sale in the Group‘s consolidated balance sheet. The securities are classified as trading.
The Group‘s variable interests in investment partnerships arise through ownership of the limited partner interests. Many investment partnerships are VIEs under ASU 2015-2, because the limited partners as a group lack kick-out or participating rights. The Group does not hold the general partner interest in the limited partnerships and therefore does not direct investment activities of the entity. Therefore, the Group lacks power over the relevant activities of the vehicles and, consequently, does not qualify as the primary beneficiary. The Group is exposed to losses when the values of the investments held by the investment vehicles decrease. The Group‘s maximum exposure to loss equals the Group‘s share of the investment.

76 Swiss Re First Quarter 2016 Report
Notes to the Group financial statements (unaudited)
The Group is a passive investor in structured securitisation vehicles issuing residential and commercial mortgage-backed securities (RMBS and CMBS, respectively) and other asset-backed securities (ABS). The Group‘s investments in RMBS, CMBS and other ABS are passive in nature and do not obligate the Group to provide any financial or other support to the issuer entities. By design, RMBS, CMBS and ABS securitisation entities are not adequately capitalised and therefore considered VIEs. The Group is not the primary beneficiary, because it does not have power to direct most significant activities. These investments are accounted for as available–for–sale as described in the investment note 6 and are not included in the tables below.
The Group consolidates an investment vehicle, because the Group holds the entire interest in the entity and makes investment decisions related to the entity. The investment vehicle is a VIE under ASU 2015-2, because it is structured as an umbrella company comprised of multiple sub-funds. The majority of the investments held in this vehicle are accounted for as available–for–sale and are disclosed in the investment note 6 and not included in the tables below.
Investment vehicles (unit-linked business)Additionally, the Group invests on behalf of the policyholders as a passive investor in a variety of investment funds across various jurisdictions. By design, many of these funds meet a VIE definition. While the Group may have a potentially significant variable interest in some of these entities due to its share of the fund‘s total net assets, it never has power over the fund‘s investment decisions, or unilateral kick-out rights relative to the decision maker.
The Group is not exposed to losses in the aforementioned investment vehicles, as the investment risk is borne by the policyholder.
Senior commercial mortgage and infrastructure loans The Group also invests in structured commercial mortgage and infrastructure loans, which are held for investment.
The commercial mortgage loans are made to non-recourse special purpose entities collateralised with commercial real estate. The entities are adequately capitalised and generally structured as voting interest entities. Occasionally, the borrower entities can be structured as limited partnerships where the limited partners do not have kick-out or participating rights, which results in the VIE designation.
The infrastructure loans are made to non-recourse special purpose entities collateralised with infrastructure project assets. Some borrower entities may have insufficient equity investment at risk, which results in the VIE designation.
The Group does not have power over the activities most significant to the aforementioned borrower entities designated as VIEs and therefore does not consolidate them.
The Group‘s maximum exposure to loss from its investments equals the loan outstanding amount.
Other The Group consolidates a vehicle providing reinsurance to its members, because it serves as a decision maker over the entity‘s investment and underwriting activities, as well as provides retrocession for the majority of the vehicle‘s insurance risk and receives performance-based fees. Additionally, the Group is obligated to provide the vehicle with loans in case of a deficit. The vehicle is a VIE, primarily because its total equity investment at risk is insufficient and the members lack decision-making rights.
The Group did not provide financial or other support to any VIEs during 2016 that it was not previously contractually required to provide.

Swiss Re First Quarter 2016 Report 77
Consolidated VIEsThe following table shows the total assets and liabilities on the Group‘s balance sheet relating to the VIEs of which the Group is the primary beneficiary as of 31 December 2015 and 31 March 2016:
The assets of the consolidated VIEs may only be used to settle obligations of these VIEs and to settle any investors‘ ownership liquidation requests. There is no recourse to the Group for the consolidated VIEs‘ liabilities. The assets of the consolidated VIEs are not available to the Group‘s creditors.
USD millions 2015 2016
Fixed income securities:Available-for-sale 3 876 4 092Trading 69
Equity securities available-for-sale 1Policy loans, mortgages and other loans 109Investment real estate 265Short-term investments 88 257Other invested assets 26 2Cash and cash equivalents 147 485Accrued investment income 42 53Premiums and other receivables 34 48Deferred acquisition costs 9 12Deferred tax assets 38 47Other assets 8 224Total assets 4 268 5 664
Unpaid claims and claim adjustment expenses 53 67Liabilities for life and health policy benefits 2Unearned premiums 26 32Reinsurance balances payable 2 13Deferred and other non-current tax liabilities 96 145Accrued expenses and other liabilities 17 279Long-term debt 2 720 2 667Total liabilities 2 914 3 205

78 Swiss Re First Quarter 2016 Report
Notes to the Group financial statements (unaudited)
Non-consolidated VIEsThe following table shows the total assets and liabilities in the Group‘s balance sheet related to the VIEs in which the Group held a variable interest but was not the primary beneficiary as of 31 December 2015 and 31 March 2016:
The following table shows the Group‘s assets, liabilities representing variable interests and maximum exposure to loss related to the VIEs in which the Group held a variable interest but was not the primary beneficiary as of 31 December 2015 and 31 March 2016:
The assets and liabilities for the swaps in trusts represent the positive and negative fair values of the derivatives the Group has entered into with the trusts.
USD millions 2015 2016
Fixed income securities available-for-sale 52 382Equity securities available-for-sale 571Policy loans, mortgages and other loans 1 808Other invested assets 1 706 2 751Investments for unit-linked and with-profit business 8 782Other assets 1Total assets 1 759 13 295
Accrued expenses and other liabilities 45 66Total liabilities 45 66
2015 2016
USD millions Total assetsTotal
liabilities
Maximum exposure
to loss1
Difference between exposure
and liabilities Total assetsTotal
liabilities
Maximum exposure
to loss1
Difference between exposure
and liabilities
Insurance-linked securitisations 52 52 52 294 294 294Life and health funding vehicles 2 1 1 777 1 776 3 1 1 804 1 803Swaps in trusts 146 44 –2 – 108 65 –2
Debt financing 361 27 27 355 26 26Investment vehicles 1 009 1 011 1 011 2 863 2 864 2 864Investment vehicles for unit-linked and with-profit business 8 782 – –Commercial mortgage / infrastructure loans 890 890 890Other 189 189 189Total 1 759 45 – – 13 295 66 – –
1 Maximum exposure to loss is the loss the Group would absorb from a variable interest in a VIE in the event that all of the assets of the VIE are deemed worthless.2 The maximum exposure to loss for swaps in trusts cannot be meaningfully quantified due to their derivative character.

Swiss Re First Quarter 2016 Report 79
13 Benefit plans
Net periodic benefit costPension and post-retirement cost for the three months ended 31 March 2015 and 2016 were USD 29 million and USD 28 million, respectively.
Employer’s contributions for 2016For the three months ended 31 March 2016, the Group contributed USD 49 million to its defined benefit pension plans and USD 4 million to other post-retirement plans, compared to USD 57 million and USD 4 million, respectively, in the same period of 2015.
The expected 2016 contributions to the defined benefit pension plans and to the post-retirement benefit plans, revised as of 31 March 2016 for the latest information, amount to USD 155 million and USD 16 million, respectively.

80 Swiss Re First Quarter 2016 Report
Notes to the Group financial statements (unaudited)
14 Subsequent events
Cancellation of Swiss Re sharesAt the 152nd Annual General Meeting held on 22 April 2016, Swiss Re Ltd‘s shareholders approved the cancellation of shares, repurchased under the share buy-back programme launched in November 2015 and completed on 2 March 2016.

Swiss Re First Quarter 2016 Report 81
This page intentionally left blank

Certain statements and illustrations contained herein are forward-looking. These statements (including as to plans, objectives, targets and trends) and illustrations provide current expectations of future events based on certain assumptions and include any statement that does not directly relate to a historical fact or current fact.
Forward-looking statements typically are identified by words or phrases such as “anticipate”, “assume”, “believe”, “continue”, “estimate”, “expect”, “foresee”, “intend”, “may increase” and “may fluctuate” and similar expressions or by future or conditional verbs such as “will”, “should”, “would” and “could”. These forward-looking statements involve known and unknown risks, uncertainties and other factors, which may cause Swiss Re’s actual results of operations, financial condition, solvency ratios, capital or liquidity positions or prospects to be materially different from any future results of operations, financial condition, solvency ratios, capital or liquidity positions or prospects expressed or implied by such statements or cause Swiss Re to not achieve its published targets.
Such factors include, among others:
instability affecting the global financial system and developments related thereto;
deterioration in global economic conditions;
Swiss Re’s ability to maintain sufficient liquidity and access to capital markets, including sufficient liquidity to cover potential recapture of reinsurance agreements, early calls of debt or debt-like arrangements and collateral calls due to actual or perceived deterioration of Swiss Re’s financial strength or otherwise;
the effect of market conditions, including the global equity and credit markets, and the level and volatility of equity prices, interest rates, credit spreads, currency values and other market indices, on Swiss Re’s investment assets;
changes in Swiss Re’s investment result as a result of changes in its investment policy or the changed composition of its investment assets, and the impact of the timing of any such changes relative to changes in market conditions;
uncertainties in valuing credit default swaps and other credit-related instruments;
possible inability to realise amounts on sales of securities on Swiss Re’s balance sheet equivalent to their mark-to-market values recorded for accounting purposes;
the outcome of tax audits, the ability to realise tax loss carryforwards and the ability to realise deferred tax assets (including by reason of the mix of earnings in a jurisdiction or deemed change of control), which could negatively impact future earnings;
the possibility that Swiss Re’s hedging arrangements may not be effective;
the lowering or loss of one of the financial strength or other ratings of one or more Swiss Re companies, and developments adversely affecting Swiss Re’s ability to achieve improved ratings;
the cyclicality of the reinsurance industry;
Cautionary note on forward-looking statements
82 Swiss Re First Quarter 2016 Report
General information

uncertainties in estimating reserves;
uncertainties in estimating future claims for purposes of financial reporting, particularly with respect to large natural catastrophes, as significant uncertainties may be involved in estimating losses from such events and preliminary estimates may be subject to change as new information becomes available;
the frequency, severity and development of insured claim events;
acts of terrorism and acts of war;
mortality, morbidity and longevity experience;
policy renewal and lapse rates;
extraordinary events affecting Swiss Re’s clients and other counter parties, such as bankruptcies, liquidations and other credit-related events;
current, pending and future legislation and regulation affecting Swiss Re or its ceding companies and the interpretation of legislation or regulations by regulators;
legal actions or regulatory investigations or actions, including those in respect of industry requirements or business conduct rules of general applicability;
changes in accounting standards;
significant investments, acquisitions or dispositions, and any delays, unexpected costs or other issues experienced in connection with any such transactions;
changing levels of competition; and
operational factors, including the efficacy of risk management and other internal procedures in managing the foregoing risks.
These factors are not exhaustive. Swiss Re operates in a continually changing environment and new risks emerge continually. Readers are cautioned not to place undue reliance on forward-looking statements. Swiss Re undertakes no obligation to publicly revise or update any forward-looking statements, whether as a result of new information, future events or otherwise.
This communication is not intended to be a recommendation to buy, sell or hold securities and does not constitute an offer for the sale of, or the solicitation of an offer to buy, securities in any jurisdiction, including the United States. Any such offer will only be made by means of a prospectus or offering memorandum, and in compliance with applicable securities laws.
Swiss Re First Quarter 2016 Report 83

Note on risk factors
General impact of adverse market conditions The operations of Swiss Re Ltd (“Swiss Re”) and its subsidiaries (the “Group”) as well as its investment returns are subject to market volatility and macro-economic factors, which are outside of the Group’s control and are often inter-related.
Despite signs of moderate increase in global growth forecasts and positive macro-economic trends in the United States, growth forecasts among the principal global economies remain uneven and uncertain, and that uncertainty has been compounded by significant volatility in equity, currency and commodities markets. Slower growth rates in China, together with the actions taken on its currency, and drastic reductions in the price of oil, together with volatility in foreign currency and investment markets caused by interest rate action in the United States; continued concerns over the implications of austerity-driven economic policies in Europe and the ability of the European Union to address significant ongoing structural challenges; concerns over a possible exit of the United Kingdom from the European Union; deceleration in GDP growth and other negative trends in emerging markets; and geopolitical instability, reflecting the political and military situations in the Middle East and North Africa, the rise of the Islamic State, concerns over further terrorist attacks across the globe and the political, economic and social crises caused by massive waves of migration into and through Europe, have contributed to downward pressure on the capital markets and in turn on market capitalisation of many listed companies, call into question the likelihood of continued recovery of the global economies and are beginning to raise the spectre of another global recession.
With fewer options available to policymakers and concerns generally over the absence of realistic confidence-building measures, and with heightened risk that volatility or depressed conditions in one sector, one market, one country or one region could have far broader implications, volatility can be expected to continue. Further adverse developments or the continuation of adverse trends that in turn have a negative impact on financial markets and economic conditions could limit our ability to access the capital markets and bank funding markets, could adversely affect the ability of counterparties to meet their obligations to us and could adversely affect the confidence of the ultimate buyers of insurance. Any such developments and trends could also have an adverse effect on the Group’s investment results, which in the current low interest rate environment and soft insurance cycle could have a material adverse effect on the Group’s overall results, make it difficult to determine the value of certain assets in the Group’s portfolio and/or make it difficult to acquire suitable investments to meet the Group’s risk and return criteria.
Regulatory changesSwiss Re and its subsidiaries operate in a highly regulated environment and are subject to group supervision. Swiss Re’s subsidiaries are subject to applicable regulation in each of the jurisdictions in which they conduct business, particularly Switzerland, the United States, the United Kingdom, Luxembourg and Germany. The regulatory regimes to which members of the Group are subject have changed significantly in recent years and are expected to continue to evolve as a result of global efforts following the credit crisis.
Although early regulatory efforts following the credit crisis were focused primarily on banking institutions, there has been a noticeable trend in recent years to extend the scope of reforms and oversight beyond such institutions to cover insurance and reinsurance operations. Legislative initiatives directly impacting the Group’s industry include the establishment of a pan-European regulator for insurance companies, the European Insurance and Occupational Pension Authority (the “EIOPA”), which has the power to overrule national regulators in certain circumstances. In addition, the Group is subject to the Swiss Solvency Test and, through its legal entities organised in the European Economic Area, Solvency II, which entered into force on 1 January 2016.
84 Swiss Re First Quarter 2016 Report
General information

The Group is also monitoring the impact of the Swiss Federal Act on Financial Market Infrastructure (which became effective 1 January 2016 and introduced new regulations for over-the-counter derivatives trading in line with international standards) and the proposed Swiss Federal Financial Services Act and Financial Institutions Act (which contain rules for financial services providers that are based on the EU Markets in Financial Instruments Directive (“MiFID”) regulations). In the United States, as a possible step towards federal oversight of insurance, the US Congress created the Federal Insurance Office within the Department of Treasury. In addition, provisions of the Wall Street Reform and Consumer Protection Act of 2010, as well as provisions in the proposed European Market Infrastructure Regulation and proposed changes to MiFID, in respect of derivatives could have a significant impact on the Group.
Other changes are focused principally on banking institutions, but some could have direct applicability to insurance or reinsurance operations and others could have a general impact on the regulatory landscape for financial institutions, which might indirectly impact capital requirements and/or required reserve levels or have other direct or indirect effects on the Group or its securities. Changes are particularly likely to impact financial institutions designated as “systemically important,” a designation which is expected to result in enhanced regulatory supervision and heightened capital, liquidity and diversification requirements under evolving reforms.
There is an emerging focus on classifying certain insurance companies as systemically important as well. The Group could be designated as a global systemically important financial institution (SIFI) under the framework for systemically important financial institutions developed by the Financial Stability Board, or as a systemically important non-bank financial company by the Financial Stability Oversight Council (the FSOC) in the United States. Separately, the International Association of Insurance Supervisors, an international body that represents insurance regulators and supervisors, published a methodology for identifying global systemically important insurers (“G-SIIs”) and on a framework for supervision of internationally active insurance groups. Initial designation of insurers as G-SIIs took place in July 2013, and initial designation of reinsurers as G-SIIs has been postponed pending further development of the methodology due by November 2015, to be applied to new designations in 2016. If and when reinsurers are included in the list of G-SIIs, the Group could be so designated. Were the Group to be designated as a G-SII, it could be subject to one or both of the resulting regimes, once implemented, including capital standards under both regimes (the Basic Capital Requirement for G-SIIs and the Insurance Capital Standard for Internationally Active Insurance Groups). In addition, the Group ultimately will be subject to oversight of its Swiss regulator in respect of recovery and resolution planning.
Significant policy decisions on a range of regulatory changes that could affect the Group and its operations remain undecided. The Group cannot predict which legislative and regulatory initiatives ultimately will be enacted or promulgated, what the scope and content of these initiatives ultimately will be, when they will be effective and what the implications will be for the industry, in general, and for the Group, in particular. Certain of these initiatives could have a material impact on the Group’s business.
In addition, regulatory changes could occur in areas of broader application, such as competition policy and tax laws. Changes in tax laws, for example, could increase the taxes the Group pays, the attractiveness of products offered by the Group, the Group’s investment activities and the value of deferred tax assets. Any number of these changes could apply to the Group and its operations. These changes, or inconsistencies between the various regimes that apply to the Group, could increase the costs of doing business, reduce access to liquidity, limit the scope of business or affect the competitive balance, or could make reinsurance less attractive to primary insurers.
Swiss Re First Quarter 2016 Report 85

Market riskVolatility and disruption in the global financial markets can expose the Group to significant financial and capital markets risk, including changes in interest rates, credit spreads, equity prices and foreign currency exchange rates, which may adversely impact the Group’s financial condition, results of operations, liquidity and capital position. The Group’s exposure to interest rate risk is primarily related to the market price and cash flow variability associated with changes in interest rates. In general, a low interest rate environment, such as the one experienced in recent years, poses significant challenges to the insurance and reinsurance industries, with earnings capacity under stress unless lower investment returns from fixed income assets can be offset by lower combined ratios or higher returns from other asset classes. Economic weakness, fiscal tightening and monetary policies are keeping government yields low, which impacts investment yields and affects the profitability of life savings products with interest rate guarantees. Exposure to credit spreads primarily relates to market price and cash flow variability associated with changes in credit spreads. When credit spreads widen, the net unrealised loss position of the Group’s investment portfolio can increase, as could other-than-temporary impairments.
The Group is exposed to changes in the level and volatility of equity prices, as they affect the value of equity securities themselves as well as the value of securities or instruments that derive their value from a particular equity security, a basket of equity securities or a stock index. The Group is also subject to equity price risk to the extent that the values of life-related benefits under certain products and life contracts, most notably variable annuity business, are tied to financial market values; to the extent market values fall, the financial exposure on guarantees related to these contracts would increase to the extent this exposure is not hedged. While the Group has discontinued writing new variable annuity business and has an extensive hedging programme covering its existing variable annuity business that it believes is sufficient, certain risks cannot be hedged, including actuarial risks, basis risk and correlation risk. Exposure to foreign exchange risk arises from exposures to changes in spot prices and forward prices as well as to volatile movements in exchange rates.
These risks can have a significant effect on investment returns and market values of securities positions, which in turn may affect both the Group’s results of operations and financial condition. The Group continues to focus on asset-liability management for its investment portfolio, but pursuing even this strategy has its risks – including possible mismatch – that in turn can lead to reinvestment risk. The Group seeks to manage the risks inherent in its investment portfolio by repositioning the portfolio from time to time, as needed, and to reduce risk and fluctuations through the use of hedges and other risk management tools.
Credit riskIf the credit markets were again to deteriorate and further asset classes were to be impacted, the Group could experience further losses. Changes in the market value of the underlying securities and other factors impacting their price could give rise to market value losses. If the credit markets were to deteriorate again, the Group could also face further write-downs in other areas of its portfolio, including other structured instruments, and the Group and its counterparties could once again face difficulties in valuing credit-related instruments. Differences in opinion with respect to valuations of credit-related instruments could result in legal disputes among the Group and its counterparties as to their respective obligations, the outcomes of which are difficult to predict and could be material.
The Group is also subject to credit and other risks in its credit business, including reliance on banks that underwrite and monitor facilities in which the Group participates and potential default by borrowers under those facilities.
86 Swiss Re First Quarter 2016 Report
General information
Liquidity risksThe Group’s business requires, and its clients expect, that it has sufficient capital and sufficient liquidity to meet its re/insurance obligations, and that this would continue to be the case following the occurrence of any foreseeable event or series of events, including extreme catastrophes, that would trigger insurance or reinsurance coverage obligations. The Group’s uses of funds include obligations arising in its reinsurance business (including claims and other payments as well as insurance provision repayments due to portfolio transfers, securitisations and commutations), which may include large and unpredictable claims (including catastrophe claims), funding of capital requirements and operating costs, payment of principal and interest on outstanding indebtedness and funding of acquisitions. The Group also has unfunded capital commitments in its private equity and hedge fund investments, which could result in funding obligations at a time when it is subject to liquidity constraints. In addition, the Group has potential collateral requirements in connection with a number of reinsurance arrangements, the amounts of which may be material and the meeting of which could require the Group to liquidate cash equivalents or other securities.
The Group manages liquidity and funding risks by focusing on the liquidity stress that is likely to result from extreme capital markets scenarios or from extreme loss events or combinations of the two. Generally, the ability to meet liquidity needs could be adversely impacted by factors that the Group cannot control, such as market dislocations or interruptions, adverse economic conditions, severe disruption in the financial and worldwide credit markets and the related increased constraints on the availability of credit; changes in interest rates, foreign exchange rates and credit spreads; or by perceptions among market participants of the extent of the Group’s liquidity needs.
The Group may not be able to secure new sources of liquidity or funding, should projected or actual liquidity fall below levels it requires. The ability to meet liquidity needs through asset sales may be constrained by market conditions and the related stress on valuations, and through third-party funding may be limited by constraints on the general availability of credit and willingness of lenders to lend. In addition, the Group’s ability to meet liquidity needs may also be constrained by regulatory requirements that require regulated entities to maintain or increase regulatory capital, or that restrict intra-group transactions, the timing of dividend payments from subsidiaries or the fact that certain assets may be encumbered or otherwise non-tradable. Failure to meet covenants in lending arrangements could give rise to collateral posting or defaults, and further constrain access to liquidity. Finally, any adverse ratings action could trigger a need for further liquidity (for example, by triggering termination provisions or collateral delivery requirements in contracts to which the Group is a party) at a time when the Group’s ability to obtain liquidity from external sources is limited by such ratings action.
Counterparty risksThe Group is exposed to the risk of defaults, or concerns about defaults, by its counterparties. Securities trading counterparties, counterparties under swaps and other derivative contracts, and financial intermediaries may default on their obligations due to bankruptcy, insolvency, lack of liquidity, adverse economic conditions, operational failure, fraud or other reasons, which could have a material adverse effect on the Group.
The Group could also be adversely affected by the insolvency of, or other credit constraints affecting, counterparties in its reinsurance operations. Moreover, the Group could be adversely affected by liquidity issues at ceding companies or at third parties to whom the Group has retroceded risk, and such risk could be exacerbated to the extent any such exposures are concentrated.
Swiss Re First Quarter 2016 Report 87

Risks relating to credit rating downgradesRatings are an important factor in establishing the competitive position of reinsurance companies, and market conditions could increase the risk of downgrade. Third-party rating agencies assess and rate the financial strength of reinsurers and insurers. These ratings are intended to measure a company’s ability to repay its obligations and are based upon criteria established by the rating agencies.
The Group’s ratings reflect the current opinion of the relevant rating agencies. One or more of its ratings could be downgraded or withdrawn in the future. Rating agencies may increase the frequency and scope of ratings reviews, revise their criteria or take other actions that may negatively impact the Group’s ratings. In addition, changes to the process or methodology of issuing ratings, or the occurrence of events or developments affecting the Group, could make it more difficult for the Group to achieve improved ratings which it would otherwise have expected.
As claims paying and financial strength ratings are key factors in establishing the competitive position of reinsurers, a decline in ratings alone could make reinsurance provided by the Group less attractive to clients relative to reinsurance from competitors with similar or stronger ratings. A decline in ratings could also cause the loss of clients who are required by either policy or regulation to purchase reinsurance only from reinsurers with certain ratings. Certain larger reinsurance contracts contain terms that would allow the ceding companies to cancel the contract if the Group’s ratings or those of its subsidiaries are downgraded beyond a certain threshold. Moreover, a decline in ratings could impact the availability and terms of unsecured financing and obligate the Group to provide collateral or other guarantees in the course of its reinsurance business or trigger early termination of funding arrangements potentially resulting in a need for additional liquidity. As a ratings decline could also have a material adverse impact on the Group’s costs of borrowing or ability to access the capital markets, the adverse implications of a downgrade could be more severe.
Legal and regulatory risksIn the ordinary course of business, the Group is involved in lawsuits, arbitrations and other formal and informal dispute resolution procedures, the outcomes of which determine rights and obligations under insurance, reinsurance and other contractual agreements. From time to time, the Group may institute, or be named as a defendant in, legal proceedings, and the Group may be a claimant or respondent in arbitration proceedings. These proceedings could involve coverage or other disputes with ceding companies, disputes with parties to which the Group transfers risk under reinsurance arrangements, disputes with other counterparties or other matters. The Group cannot predict the outcome of any of the foregoing, which could be material for the Group.
The Group is also involved, from time to time, in investigations and regulatory proceedings, certain of which could result in adverse judgements, settlements, fines and other outcomes. The number of these investigations and proceedings involving the financial services industry has increased in recent years, and the potential scope of these investigations and proceedings has also increased, not only in respect of matters covered by the Group’s direct regulators, but also in respect of compliance with broader business conduct rules, including those in respect of market abuse, bribery, money laundering, trade sanctions and data protection and privacy. The Group is also subject to audits and challenges from time to time by tax authorities, which could result in increases in tax costs, changes to internal structures and interest and penalties. The Group could be subject to risks arising from alleged, or actual, violations of any of the foregoing, and could also be subject to risks arising from potential employee misconduct, including non-compliance with internal policies
88 Swiss Re First Quarter 2016 Report
General information

and procedures and malfeasance, such as undertaking or facilitating cyber attacks on internal systems. Substantial legal liability could materially adversely affect the Group’s business, financial condition or results of operations or could cause significant reputational harm, which could seriously affect its business.
Insurance, operational and other risksAs part of the Group’s ordinary course operations, the Group is subject to a variety of risks, including risks that reserves may not adequately cover future claims and benefits, risks that catastrophic events (including hurricanes, windstorms, floods, earthquakes, acts of terrorism, man-made disasters such as industrial accidents, explosions, and fires, and pandemics) may expose the Group to unexpected large losses (and related uncertainties in estimating future claims in respect of such events); changes in the insurance industry that affect ceding companies, particularly those that further increase their sensitivity to counterparty risk; competitive conditions (including as a result of consolidation and the availability of significant levels of alternative capacity); cyclicality of the industry; risks related to emerging claims and coverage issues (including, for example, trends to establish stricter building standards, which can lead to higher industry losses for earthquake cover based on higher replacement values); risks arising from the Group’s dependence on policies, procedures and expertise of ceding companies; risks related to investments in emerging markets; and risks related to the failure of, or attacks directed at, the Group’s operational systems and infrastructure. Any of the foregoing, as well the occurrence of future risks that the Group’s risk management procedures fail to identify or anticipate, could have a material adverse effect on the Group, and could also give rise to reputational risk.
Use of models; accounting mattersThe Group is subject to risks relating to the preparation of estimates and assumptions that management uses, for example, as part of its risk models as well as those that affect the reported amounts of assets, liabilities, revenues and expenses in the Group’s financial statements, including assumed and ceded business. For example, the Group estimates premiums pending receipt of actual data from ceding companies, which actual data could deviate from the estimates. In addition, particularly with respect to large natural catastrophes, it may be difficult to estimate losses, and preliminary estimates may be subject to a high degree of uncertainty and change as new information becomes available. Deterioration in market conditions could have an adverse impact on assumptions used for financial reporting purposes, which could affect possible impairment of present value of future profits, fair value of assets and liabilities, deferred acquisition costs or goodwill. To the extent that management’s estimates or assumptions prove to be incorrect, it could have a material impact on underwriting results (in the case of risk models) or on reported financial condition or results of operations, and such impact could be material.
The Group’s results may be impacted by changes in accounting standards, or changes in the interpretation of accounting standards. The Group’s results may also be impacted if regulatory authorities take issue with any conclusions the Group may reach in respect of accounting matters. Changes in accounting standards could impact future reported results or require restatement of past reported results.
The Group uses non-GAAP financial measures in its external reporting, including in this report. These measures are not prepared in accordance with US GAAP or any other comprehensive set of accounting rules or principles, and should not be viewed as a substitute for measures prepared in accordance with US GAAP. Moreover, these may be different from or otherwise inconsistent with non-GAAP financial measures used by other companies. These measures have inherent limitations, are not required to be uniformly applied and are not audited.
Swiss Re First Quarter 2016 Report 89

The Group also publishes, on an annual basis, a report of its results, including financial statements and an accompanying independent assurance report, prepared in accordance with the Group’s proprietary economic value management (“EVM”) principles (“EVM report”). Financial information included in the EVM report contains non-GAAP financial measures. The EVM principles differ significantly from US GAAP and, accordingly, the Group’s results prepared in accordance with US GAAP will differ from its EVM results, and those differences could be material. The Group’s annual EVM results are available after release of its annual audited US GAAP results and can be more volatile than the US GAAP results because, among other things, assets and liabilities are measured on a market-consistent basis, profit recognition on new contracts is recognised at inception rather than over the lifetime of the contract, and life and health actuarial assumptions are on a best estimate basis as opposed to generally being locked-in. The Groupʼs EVM financial statements should not be viewed as a substitute for the Group’s US GAAP financial statements.
Risks related to the Swiss Re corporate structureSwiss Re is a holding company, a legal entity separate and distinct from its subsidiaries, including Swiss Reinsurance Company Ltd. As a holding company with no operations of its own, Swiss Re is dependent upon dividends and other payments from Swiss Reinsurance Company Ltd and its other principal operating subsidiaries.
90 Swiss Re First Quarter 2016 Report
General information

Contacts
Investor RelationsTelephone +41 43 285 4444 Fax +41 43 282 4444 [email protected]
Media RelationsTelephone +41 43 285 7171 Fax +41 43 282 7171 [email protected]
Share RegisterTelephone +41 43 285 6810 Fax +41 43 282 6810 [email protected]
Corporate calendar
29 July 2016Second quarter 2016 results
3 November 2016Third quarter 2016 results
2 December 2016Investors’ Day in Zurich
Swiss Re First Quarter 2016 Report 91

©2016 Swiss Re. All rights reserved.
Title: Swiss Re Group First Quarter 2016 Report
Production: Swiss Re Corporate Real Estate & Logistics/ Media Production, Zurich
The web version of the First Quarter 2016 Report is available at: www.swissre.com/investors
Order no: 1504017_16_EN
CCHCC, 4/16


Swiss Re Ltd Mythenquai 50/60 P.O. Box 8022 Zurich Switzerland
Telephone +41 43 285 2121 Fax +41 43 285 2999 www.swissre.com