first annual dental conference - gamco … · first annual dental conference june 3, ......
TRANSCRIPT

June 11, 2003
Gabelli & Company, Inc.
One Corporate Center Rye, NY 10580-1422 Tel (914) 921-8436 Fax (914) 921-5098 www.gabelli.com
“Conference Highlights”
First Annual DENTAL Conference
June 3, 2003
Company Exchange Ticker 6/11/03 Price
DENTSPLY International, Inc. NASD XRAY $39.23
Henry Schein, Inc. NASD HSIC 48.99
Orthodontic Centers of America, Inc. NYSE OCA 8.16
Patterson Dental Company NASD PDCO 42.66
PracticeWorks, Inc. NASD PRWK 15.74
Sybron Dental Specialities, Inc. NYSE SYD 23.15
Young Innovations, Inc. NASD YDNT 27.38
Jennie Tsai (914) 921-8436
@2003 Gabelli & Company, Inc.
- Please refer to important disclosures at the end of this report -
1

G
abel
li &
Com
pany
, Inc
.
So
urce
: Com
pany
dat
a an
d G
abel
li &
Com
pany
, Inc
. est
imat
es.
(in m
illio
ns, e
xcep
t per
shar
e da
ta)
DE
NT
SPL
YH
enry
Ort
hodo
ntic
Cen
ters
Patt
erso
n D
enta
lPr
actic
eWor
ks, I
nc.
Sybr
on D
enta
lY
oung
Inte
rnat
iona
l, In
c.(N
ASD
/PR
WK
)In
nova
tions
, Inc
.(N
ASD
/XR
AY
)(N
ASD
-HSI
C)
(NY
SE/O
CA
)(N
ASD
/SY
D)
(NA
SD/Y
DN
T)
(num
bers
are
pro
form
a if
appr
opri
ate)
12-M
onth
Hig
h/Lo
w$4
3.50
$31.
25$5
7.73
$35.
34$2
7.40
$4.1
155
.11
$
35
.41
$
$19.
40$4
.50
$23.
68$1
1.41
$28.
49$1
6.75
Cap
italiz
atio
nFY
E 12
/31
FY
E 12
/31
FYE
12/3
1FY
E 4/
30FY
E 12
/31
FYE
9/30
FYE
12/3
1B
alan
ce S
heet
as o
f:3/
31/0
33/
31/0
33/
31/0
34/
30/0
33/
31/0
33/
31/0
31/
0/00
Shar
es O
utst
andi
ng78
.444
.050
.268
.017
.638
.28.
9O
ptio
ns/C
onve
rts1.
61.
10.
20.
30.
60.
50.
4Fu
lly D
ilute
d Sh
ares
Out
stan
ding
80.0
45.1
50.4
68.3
18.2
38.7
9.3
Pric
e as
of
$39.
23$4
8.99
$8.1
6$4
2.66
$15.
74$2
3.15
$27.
38E
quity
Mar
ket C
apita
lizat
ion
3,13
6.8
$
2,20
7.9
$
411.
3$
2,91
3.0
$
286.
5$
894.
9$
255.
3$
+
Tota
l Deb
t and
Pre
ferr
ed S
tock
797.
624
8.7
120.
60.
040
.531
3.6
0.1
+ M
inor
ity In
tere
st1.
39.
10.
00.
00.
00.
00.
0- C
ash
and
Equi
vale
nts
46.2
201.
412
.121
7.4
9.6
27.3
1.5
- Hid
den
Ass
ets
0.0
28.7
0.0
0.0
0.0
0.0
0.0
Tot
al E
nter
pris
e V
alue
(TE
V)
3,88
9.5
$
2,23
5.5
$
519.
7$
2,69
5.6
$
317.
4$
1,18
1.3
$
254.
0$
Co
nsol
idat
ed:
Net
Rev
enue
s20
04P
1,81
5.0
$
9.0%
3,46
1.0
$
9.0%
435.
2$
10.0
%1,
855.
8$
12
.0%
216.
7$
17.6
%53
0.3
$
5.
0%85
.0$
10.0
%G
row
th20
03E
1,66
5.1
$
10.0
%3,
174.
7$
12
.4%
395.
6$
-10.
0%1,
657.
0$
17
.1%
184.
2$
111.
5%50
5.0
$
10
.6%
77.3
$
7.
0%20
021,
513.
7$
33
.6%
2,82
5.0
$
10.4
%43
9.6
$
25
.3%
1,41
5.5
$
8.4%
87.1
$
44.3
%45
6.7
$
3.
7%72
.2$
13.4
%
EB
ITD
A20
04P
363.
2$
20.0
%29
9.3
$
8.
6%14
5.8
$
33
.5%
221.
7$
11.9
%46
.1$
21
.3%
126.
0$
23.8
%27
.0$
31.8
%M
argi
n20
03E
329.
9$
19.8
%26
2.1
$
8.
3%13
1.4
$
33
.2%
191.
4$
11.6
%36
.8$
20
.0%
119.
9$
23.7
%23
.8$
30.8
%20
0230
0.4
$
19
.8%
225.
3$
8.0%
143.
1$
32.5
%15
6.1
$
11
.0%
14.5
$
16.7
%11
7.2
$
25
.7%
21.5
$
29
.8%
EPS
- C
ont.
Ops
2004
P$2
.43
14.4
%$3
.52
15.4
%$1
.38
12.5
%$1
.99
17.2
%$1
.10
42.8
%$1
.52
13.4
%$1
.58
14.8
%G
row
th20
03E
$2.1
215
.1%
$3.0
515
.9%
$1.2
3-1
4.6%
$1.7
020
.0%
$0.7
792
.4%
$1.3
426
.1%
$1.3
812
.1%
2002
$1.8
446
.0%
$2.6
331
.1%
$1.4
418
.7%
$1.4
221
.2%
$0.4
0-6
5.7%
$1.0
65.
6%$1
.23
27.8
%
P/E
2004
P16
.2x
13.9
x5.
9x
21.4
x14
.3x
15.2
x17
.3x
2003
E18
.5x
16.1
x6.
6x
25.1
x20
.4x
17.3
x19
.8x
2002
21.3
x18
.6x
5.7
x30
.1x
39.2
x21
.8x
22.2
xT
EV
/EB
ITD
A20
04P
10.7
7.5
3.6
12.2
6.9
9.4
9.4
2003
E11
.88.
54.
014
.18.
69.
910
.720
0212
.99.
93.
617
.321
.910
.111
.8
Spec
ialti
es, I
nc.
(NA
SD/P
DC
O)
06/1
1/03
Sche
in, I
nc.
of A
mer
ica,
Inc.
Com
pany
2

Gabelli & Company, Inc.
The Dental Market - Overview The 2002 US and Canadian dental market is approximately $4.4-$4.5 billion, growing at 5%-7%. Industry estimates place the European dental market at approximately $3.2 billion, growing at similar rates. The industry has consolidated over the past five years as manufacturers and distributors have merged or acquired other companies to become single-source, full service providers to its customers. Nonetheless, the global dental market is still somewhat fragmented as the top ten manufacturers have less than 50% market share. The industry will continue to consolidate as the smaller players find it harder to compete with the larger ones with more resources and thus sell out and exit the market. Solid Demand The dental market is growing at 5%-7% annually over the next few years. Demand is increasing due to the following:
– The “Graying” of the Baby Boomers in the US. The percentage of the US population over 65 will increase from 12.7% in 2000 to 20% in 2030. This segment of the population is keeping their natural teeth longer than previous generations. About 30% of adults over 65 years old are edentulous (toothless) compared to 46% twenty years ago. In addition, they have greater disposable income, enabling them to spend more dollars on dental care treatments, if necessary.
Table 1: Age Mix of the US Population (2000A to 2025P)
2000 2005 2010 2015 2020 2025
Under 18 70,374 25.6% 71,618 24.9% 72,101 24.0% 74,113 23.7% 77,151 23.7% 80,346 23.8%
18-44 108,931 39.6 108,147 37.6 108,457 36.2 110,291 35.3 113,098 34.8 116,411 34.5
45-64 61,157 22.2 71,581 24.9 79,590 26.5 81,905 26.2 80,946 24.9 78,416 23.2
Over 65 34,836 12.7 36,372 12.6 39,715 13.2 45,959 14.7 53,733 16.5 62,642 18.5
Total 275,298 100.0 287,718 100.0 299,863 100.0 312,268 100.0 324,928 100.0 337,815 100.0
Source: US Census.
– Limited Longevity of Natural Teeth. Natural teeth has longevity of about 50 years, so those 50 and over will require dental treatments such as periodontal (treatment of gums), endodontic (root canals) and edentulous needs (dentures or dental implants) in addition to preventive dentistry services. These procedures will aid in maintaining the longevity of natural teeth.
– Increasing Dental Plan Coverage. The percentage of the US population that has some form of dental
insurance has increased significantly over time. In 1994, 44% of the population had some form of coverage compared to 56% now.
– Aesthetics and Specialty Procedures. The demand for ancillary dental services such as cosmetic dentistry has grown significantly as patients strive for the “Hollywood smile”, benefiting areas such as orthodontia (both visible and invisible braces), whitening procedures, porcelain veneers (laminates), dental implants and others. Currently, the worldwide market for dental implants is approximately $1 billion, growing at 12% to 15% annually.
Resilient – In addition, the demand for dental services is very resilient and will not be severely affected by war, the economy nor unemployment rate (unless it goes to 8%-9%).
3

Gabelli & Company, Inc.
According to the Healthcare Financing Administration (HCFA), per capita spending on dental care will increase from $215 in 2000 to $359 in 2010, representing a 5.3% annual growth rate, aided by the demand from the baby boomers.
Chart 1: Dental Expenditure Per Capita
173 184 193 202 215 231 246 259 273 287 300 315 329 344 359
$0.0
$50.0$100.0
$150.0
$200.0
$250.0$300.0
$350.0
$400.0
1996 97 98 99 2000 01 02 03P 04P 05P 06P 07P 08P 09P 10P
Y ear
Source: Health Care Financing Administration (HCFA). P = Projected
SERVICE PROVIDERS = Less Pain, More Gain The number of dentists providing services will decrease over the next decade due to the following:
– Fewer Dentists. More dentists are retiring, and fewer dentists are graduating from dental school. For instance, there
are 2,000 fewer dentists today than one year ago. This trend will continue over the next two decades. The table below shows that the dentist per capita ratio will decline over the next twenty years.
Table 2 : Dentists per 100,000 US Population Year 1990 2000 2005P 2010P 2015P 2020P
Per 100,000 59.1 58.3 57.9 57.2 55.8 53.7 Source: US Census and Health Care Financing Administration (HCFA).
– Dentists are Busier Than Ever. – Dentists are busy and will stay busy over the next decade as fewer students enter
the field and the need for dental services increases. Busy dentists want products and value-added services that will increase their productivity. Dentists also keep their supply inventories low and rely on distributors for timely deliveries. As such, they will pay more for customer service, reliability and breadth and depth of products.
– Dentists have Pricing Power. The CPI for dental services has averaged 1.2% higher (5.9% CAGR) than core CPI
(4.7% CAGR) from 1960 to 1997. Dentists can typically increase the prices for their services annually without fear of losing a patient. If dentists can increase fees per procedures, then manufacturers’ and distributors’ new product offerings and price increases will be better received. Moreover, the cost of the supplies makes up 6%-8% of the dentist’s total revenue generated (about $25,000-$30,000 annually), which is not a big cost item relative to other expense items.
4

Gabelli & Company, Inc.
DENTAL CONFERENCE HIGHLIGHTS – The underlying stability of the dental market and favorable dynamics impacting the dental market make the
public dental companies attractive for the long-term investor. – As consolidation continues, the large manufacturers/ distributors will benefit and add value to shareholders by
acquiring small companies and running them more efficiently and effectively.
– Currently, Bush’s tax bill will benefit small business owners such as dentists via accelerated depreciation and larger deductions for capital equipment.
– In the near term, many dentists are retooling their offices to increase productivity and invest in their own
practices. This will benefit the manufacturers that sell high productivity equipment, the distributors that provide equipment services, and the service providers with clinical applications as digital x-rays and other digital imaging services.
Manufacturers
– The two large dental manufacturers, DENTSPLY and Sybron Dental, have significant international presence, which presents an opportunity to benefit from the growth that will occur in the developing countries over the next two decades.
– Specific product segments such as x-ray (both traditional and digital) and infection control are attractive
segments. Companies such as DENTSPLY that currently have no presence in either segment would like to gain a presence.
– DENTSPLY, Sybron, and Young Innovations are continuously seeking for strategic acquisitions. There
are hundreds of small mom and pop family owned dental manufacturers that are candidates for consolidation.
Distributors
– Both the distributors, Henry Schein and Patterson Dental, will generate significant amounts of free cash flow over the next five years.
– Both Patterson Dental and Henry Schein are participating in and benefiting from the consolidation in the
dental distribution business, acquiring small distributors and offering a more comprehensive package of products and services to its customer base.
Services – With the shortage of dentists and orthodontists expected over the next decade, both Orthodontic Centers
of America and PracticeWorks are offering services that will increase the doctor’s productivity.
5
Gabelli & Company, Inc.
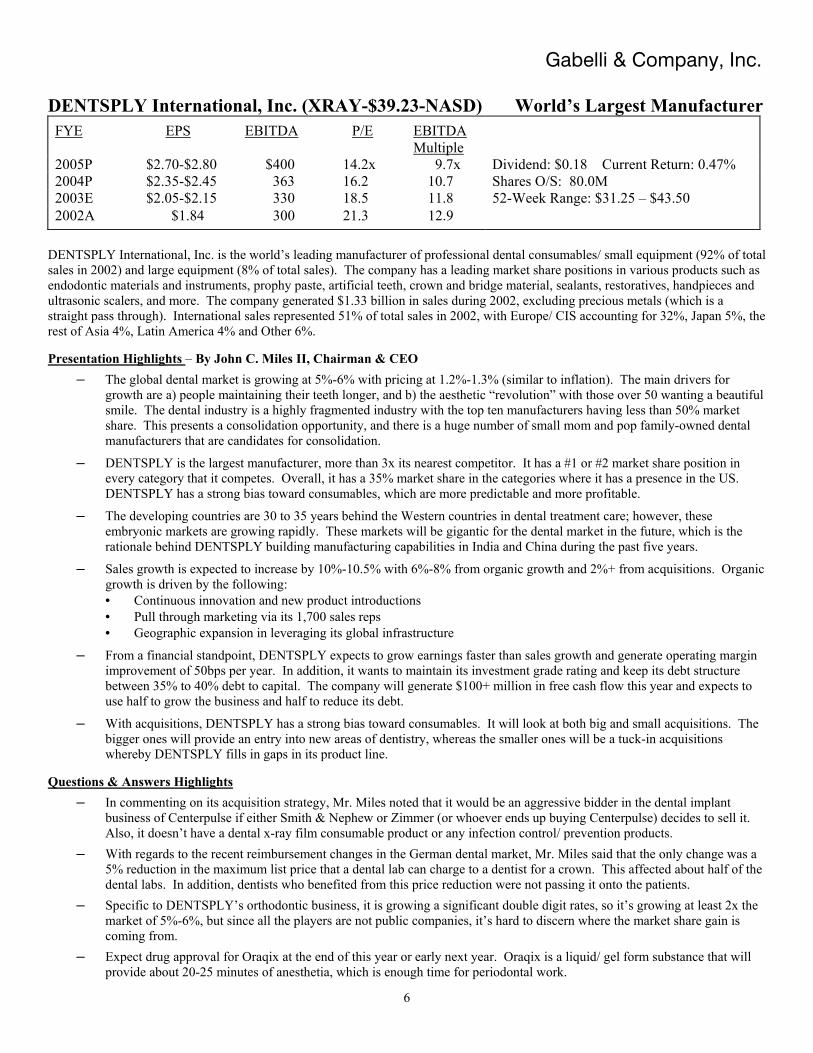
DENTSPLY International, Inc. (XRAY-$39.23-NASD) World’s Largest Manufacturer FYE EPS EBITDA P/E EBITDA
Multiple
2005P $2.70-$2.80 $400 14.2x 9.7x Dividend: $0.18 Current Return: 0.47% 2004P $2.35-$2.45 363 16.2 10.7 Shares O/S: 80.0M 2003E $2.05-$2.15 330 18.5 11.8 52-Week Range: $31.25 – $43.50 2002A $1.84 300 21.3 12.9
DENTSPLY International, Inc. is the world’s leading manufacturer of professional dental consumables/ small equipment (92% of total sales in 2002) and large equipment (8% of total sales). The company has a leading market share positions in various products such as endodontic materials and instruments, prophy paste, artificial teeth, crown and bridge material, sealants, restoratives, handpieces and ultrasonic scalers, and more. The company generated $1.33 billion in sales during 2002, excluding precious metals (which is a straight pass through). International sales represented 51% of total sales in 2002, with Europe/ CIS accounting for 32%, Japan 5%, the rest of Asia 4%, Latin America 4% and Other 6%. Presentation Highlights – By John C. Miles II, Chairman & CEO
– The global dental market is growing at 5%-6% with pricing at 1.2%-1.3% (similar to inflation). The main drivers for growth are a) people maintaining their teeth longer, and b) the aesthetic “revolution” with those over 50 wanting a beautiful smile. The dental industry is a highly fragmented industry with the top ten manufacturers having less than 50% market share. This presents a consolidation opportunity, and there is a huge number of small mom and pop family-owned dental manufacturers that are candidates for consolidation.
– DENTSPLY is the largest manufacturer, more than 3x its nearest competitor. It has a #1 or #2 market share position in every category that it competes. Overall, it has a 35% market share in the categories where it has a presence in the US. DENTSPLY has a strong bias toward consumables, which are more predictable and more profitable.
– The developing countries are 30 to 35 years behind the Western countries in dental treatment care; however, these embryonic markets are growing rapidly. These markets will be gigantic for the dental market in the future, which is the rationale behind DENTSPLY building manufacturing capabilities in India and China during the past five years.
– Sales growth is expected to increase by 10%-10.5% with 6%-8% from organic growth and 2%+ from acquisitions. Organic growth is driven by the following: • Continuous innovation and new product introductions • Pull through marketing via its 1,700 sales reps • Geographic expansion in leveraging its global infrastructure
– From a financial standpoint, DENTSPLY expects to grow earnings faster than sales growth and generate operating margin improvement of 50bps per year. In addition, it wants to maintain its investment grade rating and keep its debt structure between 35% to 40% debt to capital. The company will generate $100+ million in free cash flow this year and expects to use half to grow the business and half to reduce its debt.
– With acquisitions, DENTSPLY has a strong bias toward consumables. It will look at both big and small acquisitions. The bigger ones will provide an entry into new areas of dentistry, whereas the smaller ones will be a tuck-in acquisitions whereby DENTSPLY fills in gaps in its product line.
Questions & Answers Highlights
– In commenting on its acquisition strategy, Mr. Miles noted that it would be an aggressive bidder in the dental implant business of Centerpulse if either Smith & Nephew or Zimmer (or whoever ends up buying Centerpulse) decides to sell it. Also, it doesn’t have a dental x-ray film consumable product or any infection control/ prevention products.
– With regards to the recent reimbursement changes in the German dental market, Mr. Miles said that the only change was a 5% reduction in the maximum list price that a dental lab can charge to a dentist for a crown. This affected about half of the dental labs. In addition, dentists who benefited from this price reduction were not passing it onto the patients.
– Specific to DENTSPLY’s orthodontic business, it is growing a significant double digit rates, so it’s growing at least 2x the market of 5%-6%, but since all the players are not public companies, it’s hard to discern where the market share gain is coming from.
– Expect drug approval for Oraqix at the end of this year or early next year. Oraqix is a liquid/ gel form substance that will provide about 20-25 minutes of anesthetia, which is enough time for periodontal work.
6

Gabelli & Company, Inc.
Henry Schein, Inc. (HSIC-$48.99-NASD) Distributor FYE EPS EBITDA P/E EBITDA
Multiple
2005P $4.00-$4.10 $340 12.2x 6.6x Dividend: nil Current Return: nil 2004P $3.50-$3.60 300 13.9 7.5 Shares O/S: 45.1M 2003E $3.00-$3.10 262 16.1 8.5 52-Week Range: $35.34 – $57.73 2002A $2.63 225 18.6 9.9
Henry Schein, Inc. is the largest distributor to office-based practitioners in the combined North American and European markets. It offers over 90,000 SKUs to its 400,000 customers in over 125 countries. Its customer base consists of dentists, office-based physicians, veterinarians, governments and institutions. The company has about 15% share of the combined markets that it participates in and about 29% share of the Canadian and US dental markets. Henry Schein generated $2.8 billion in sales in 2002, up 10% (all organic) and is on track to grow sales at a similar rate in 2003. Presentation Highlights – By James Breslawski (President of Sullivan Schein Dental) & Steven Paladino (CFO)
– The North American and European dental, medical and veterinary markets that Henry Schein participates in is about $16 billion, growing at 5%-6% annually. The healthcare distribution industry has been fairly predictable and performance is largely resistant to recessions and economic downturns, mainly benefiting from the aging population. Although there has been consolidation in these markets over the past five years, the markets remain fragmented.
– The dental market is benefiting from the following:
• Increased procedures due to aging demographics • Technological advances • Increased insurance coverage • Rising demand in cosmetic dentistry • The realization of the inter-relationship between oral health and overall well-being
– The medical market is benefiting from the following:
• Aging demographics • A shift in procedure from more costly acute care settings to less expensive alternate care settings • Growth in injectibles and vaccines
– Henry Schein currently captures about $8,000 of the average $25,000 spent by US dental practitioners, which will increase
over time. It has signed on 13,000 customers into its Privileges loyalty program. It has a large installed base of practice management software clients; in fact, one out of three dentists uses a Henry Schein system.
– Henry Schein has generated ten consecutive quarters of EPS growth in excess of 20%, aided by acquisitions. Going
forward, if Henry Schein achieves sales growth of 7%-9%, then it can achieve a minimum 15% EPS growth, before acquisitions. Operating margin is expected to expand by 30-50bps annually.
– It recently announced two acquisitions:
• Colonial Surgical, a distributor of examination gloves mainly to dentists, with over $40 million in revenues in 2002 - The examination gloves category is estimated at $200 million and dentists have brand loyalty - There are cross-selling opportunities since 9,000 Colonial Surgical dentists are not HSIC customers
• Hager Dental, a full service German distributor with 40 field sales reps, has 2002 sales > 50 million Euros - Provides Henry Schein with equipment and service capabilities and deeper penetration into Germany
7

Gabelli & Company, Inc.
Questions & Answers Highlights
– In commenting on the Bush tax law, Mr. Breslawski noted that it will benefit small business owners such as dentists via accelerated depreciation and larger deductions since dentists are very dependent on their equipment, which can increase productivity. On the medical side, it’s not as capital intensive or plant intensive, so it’s beneficial, but less.
– With regards to the competitive dynamics in the medical market (a $6-$8 billion market vs. $4 billion for the dental
market), there are four players: a) Henry Schein, b) PSS World Medical, c) McKesson’s General Medical, and d) Cardinal Health’s Allegiance. HSIC believes that it is #1, but it’s hard to discern since McKesson or Cardinal doesn’t break out their sales, but it’s either #1 or #2. Combined these four players have about 40% market share, so the market is still fragmented and presents a good opportunity for HSIC.
– Over the past five years, price increases have range from 1%-2%. HSIC passes along manufacturers’ price increases to
maintain its margins. Specific to the dental market growth, price has risen at 1.5% or less and the balance is volume related.
– In commenting on the rebate accounting with the supermarket players/ distributors and Royal Ahold, Mr. Paladino noted
that Henry Schein does not have the opportunities with rebates that a supermarket gets since its manufacturers don’t have to buy shelf space. However, HSIC does avail itself to some volume rebates, and these rebates are recognized when the product is sold, not when the product is bought.
– In commenting on corporate governance, with the election of the members that are on the ballot, the majority of HSIC’s
Board will be independent. In the past 1-2 years, HSIC has added three independent board members. Going forward, it will add independent members as the opportunity presents itself.
8

Gabelli & Company, Inc.
Orthodontic Centers of America, Inc. (OCA - $8.16-NYSE) Service Provider FYE EPS EBITDA P/E EBITDA
Multiple
2005P $1.50-$1.60 $161 5.3x 3.2x Dividend: nil Current Return: nil 2004P $1.30-$1.40 146 5.9 3.6 Shares O/S: 50.4M 2003E $1.20-$1.30 131 6.6 4.0 52-Week Range: $4.11 – $27.40 2002A $1.44 143 5.7 3.6
Orthodontic Centers of America, Inc. is a provider of integrated business services to orthodontic and pediatric dental practices. It was founded in 1985 and is currently affiliated with 370 practices in 46 different states. It provides business, operational, and marketing expertise to affiliated practices to help them realize greater productivity. The company merged with OrthAlliance in November 2001. The company also has affiliations with practices in Japan (4 practices), Mexico, Spain and Puerto Rico. Presentation Highlights – By Cory Armand (VP- Investor Relations) and Tony Paternostro (EVP – Doctor Relations)
– The US orthodontic market is underpenetrated at $12-$15 billion. It’s growing, but it’s highly fragmented with many solo practices. There are 200 new orthodontists graduating per year.
– OCA services include purchasing, human resources, patient scheduling system, accounting, financial statementing, operating statistic system, Walrus imaging and digital imaging, and tracking system for advertising, all of which are integrated.
– The affiliated practitioners of OCA charge 25% less for orthodontic treatment than the national average. There’s also an easy monthly payment plan for patients. Unlike traditional practices that use referrals, OCA advertises on average $75k per practice to increase awareness and get patients into their practices.
– Accounts receivable (billed, unbilled, and unreimbursed expenses) has grown mainly due to OCA’s revenue recognition policy. OCA does believe that over the near term, there will be a closing of the gap between the net income and cash flow from operations. The slowing of OCA’s business growth will moderate the effect of the accounts receivable growth in the future.
– With regards to the OrthAlliance acquisitions, there are currently 46 litigating practices and 114 non-litigating practices. Of the 114 non-litigating practices, there are 29 that are currently not paying and 79 practices where OCA has come up with permanent arrangements for.
Questions & Answers Highlights
– Over the next 1 ½ years, OCA will refocus on its core OCA doctors to help them grow their practices. The return from investing in its existing practices is much higher than that of new affiliations, and OCA will proactively manage these practices and consult with the doctors as to how best to grow each practice.
– The OrthAlliance acquisition was a good opportunity since it allowed OCA to increase its customer base, provide services to as many doctors as possible, and align with a quality group of doctors. As for the litigant doctors associated with the OrthAlliance merger, OCA did not put a dollar value to the litigant doctors at the time of the close of the merger.
– The OrthAlliance doctors were upset by the OrthAlliance experience, more from a financial/ stock point of view rather than the services. They were not necessarily upset with OCA, although it’s hard to generalize. There are 46 practices that are litigating and 29 practices that are not paying. Of those not paying, OCA is working through the issues via its Litigation Settlement Team.
– OCA will buy back as much stock as it can without jeopardizing the core business and still maintain adequate liquidity. Under its current credit structure, there are certain covenants that OCA needs to comply with such as fixed coverage ratio covenants.
– OCA’s US practices have been essentially flat due to a few new affiliations per quarter offset by some buyout by OrthAlliance doctors. OCA is making progress on the recruiting side, especially with pediatric dentists.
– The current accounts receivable does include some non-paying OrthAlliance doctors. However, they are reserved for according to OCA’s reserve schedule which is 50% for amounts due over 90 days and 100% for amounts due over 120 days. As time passes, the receivables of the non-paying doctors will be 100% reserved.
9

Gabelli & Company, Inc.
Patterson Dental Company (PDCO - $42.66-NASD) Distributor FYE 4/30 EPS EBITDA P/E EBITDA
Multiple
2005P $2.25-$2.35 $253 18.4x 10.6x Dividend: nil Current Return: nil 2004E $1.95-$2.05 222 21.4 12.2 Shares O/S: 68.3M 2003A $1.70 191 25.1 14.1 52-Week Range: $35.41 – $55.11 2002A $1.42 156 30.1 17.3
Patterson Dental Company is the largest dental distributor in North America with roughly 30% share. It was founded in 1877, but its modern history began in 1985 when the then management did a LBO from the Beatrice Companies. Back in 1985, the company had $150 million in sales. Growing substantially, the company generated $1.66 billion in sales during FYE 4/30/2003. The company distributes more than 83,000 products through its 1,250 direct sale force and 98 locations and 12 distribution centers. In addition, 10% of its sales come from its veterinary distribution business, J.A. Webster, which was acquired in July 2001. Webster has about 10% share of the US veterinary distribution market. Presentation Highlights – By R. Stephen Armstrong, Chief Financial Officer
– Within the dental distribution business, the product mix is split 60% consumable, 30% equipment and 10% other products/ services. Within the veterinary distribution business, 95% of revenues are from consumables.
– Within practice management software, there are three main players (Henry Schein’s EasyDental, PracticeWorks and Patterson’s Eaglesoft) and 24 small providers. Most dentists (i.e., 85%-90%) have front office practice software capabilities such as billing and account information, but only 15% have back room clinical applications. This presents the real opportunity. Clinical applications such as digital x-ray cost $8k-$10k for a base system and $50k-$60k to network the whole office to get real productivity benefits.
– Patterson’s objective is to grow 4% above its market of 7%-9% or 11%-13% aided by acquisitions, improve gross margins by 10bps per year, improve operating margin by 50bps per year, thereby resulting in 18%-20% EPS growth. In a typical year, 80% to 85% of net income will become free cash flow.
• Gross margin was down in the past two fiscal years since the veterinary business is about 10 full points lower than the dental margins (mid 20% in the vet space vs. 36% gross margin for dental during FYE 4/30/2003).
Questions & Answers Highlights
– In commenting on acquisitions, Patterson Dental prefers small tuck-ins with $5-$10 million in sales that usually operate at 1%-1.5% operating margin. After acquiring the company, Patterson will strip out all the internal workings of the business such as distribution centers, purchasing agents, accountants, and keep the sales reps and the customers. Usually within 12-18 months, Patterson can increase the margins from 1%-3% to 10%-11%. Since its 2001 Thompson Dental acquisition was a large one, Patterson kept the three branches and a warehouse, which was a negative drain on operations in 2003, but should see benefits in 2004 and 2005. In addition, there are plenty of acquisition opportunities out there, but it usually takes a life event to stimulate the owner’s decision to sell.
– With regards to going overseas such as Western Europe and the UK, Patterson is not interested for now, since it doesn’t have the opportunity to lever up its infrastructure and gain operating efficiencies once it crosses the borders.
– Gross margins are lower in the veterinary market due to the pharmaceuticals, which are supplied by the big pharma companies that squeeze the distributors on pricing. However, consumables for veterinary practices carry the same margins as the dental consumables and over time, Patterson would like to get its veterinary gross margin up to the 30% range.
– There are other industries with characteristics similar to veterinary and dental that Patterson has considered getting into, but it will not talk about those potential industries.
– The new Bush tax bill will have a stimulating effect on the small business owner such as dentists since it increases the deduction for the small business owner from $25k to $100k under Section 179 and increases the bonus depreciation from 30% to 50% under Section 169. It can be a deciding factor if the dentist is concerned about near-term cash flow, but it has to be taken into context with a lot of other factors in the purchasing decision.
– The positive effect related to HIPPA compliance benefited Patterson’s Coldwell division this past year, but it will have very little benefit this year.
– Webster has about 10% share of the national market. The Butler Company of Dublin, OH has about 17%-19% of the market and Burns (which is part of the Darby Group in Florida) has about 12%-13% share.
10
Gabelli & Company, Inc.
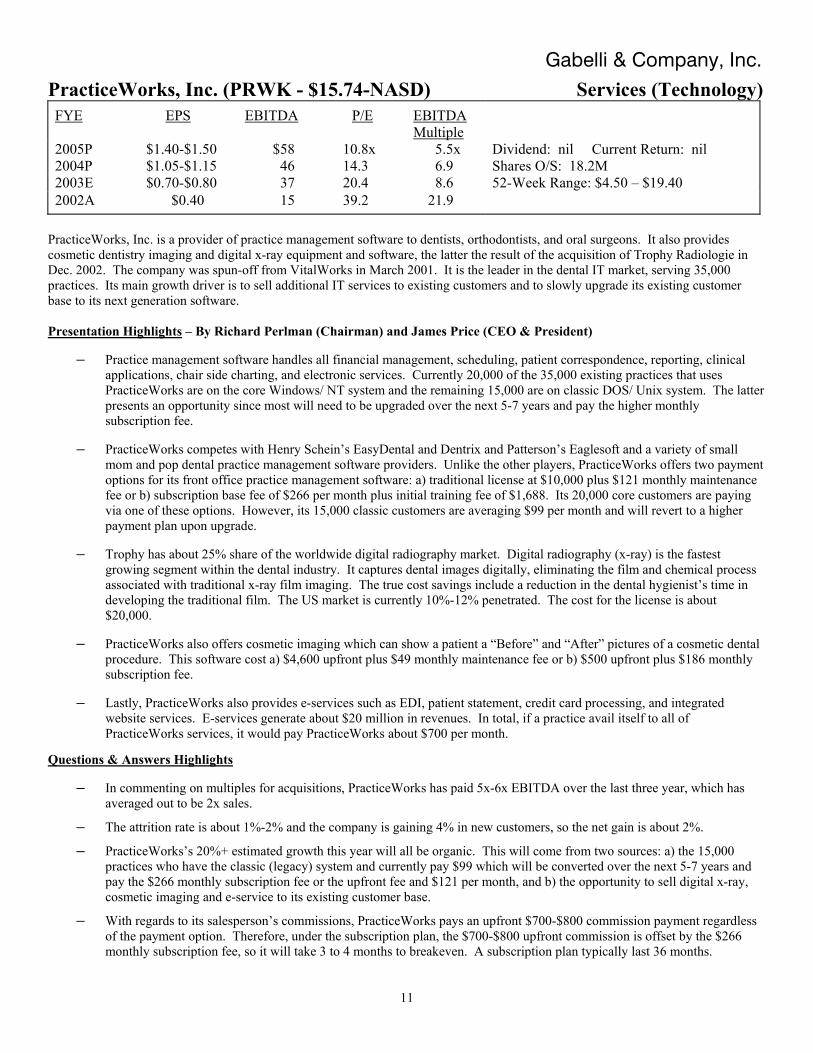
PracticeWorks, Inc. (PRWK - $15.74-NASD) Services (Technology) FYE EPS EBITDA P/E EBITDA
Multiple
2005P $1.40-$1.50 $58 10.8x 5.5x Dividend: nil Current Return: nil 2004P $1.05-$1.15 46 14.3 6.9 Shares O/S: 18.2M 2003E $0.70-$0.80 37 20.4 8.6 52-Week Range: $4.50 – $19.40 2002A $0.40 15 39.2 21.9
PracticeWorks, Inc. is a provider of practice management software to dentists, orthodontists, and oral surgeons. It also provides cosmetic dentistry imaging and digital x-ray equipment and software, the latter the result of the acquisition of Trophy Radiologie in Dec. 2002. The company was spun-off from VitalWorks in March 2001. It is the leader in the dental IT market, serving 35,000 practices. Its main growth driver is to sell additional IT services to existing customers and to slowly upgrade its existing customer base to its next generation software. Presentation Highlights – By Richard Perlman (Chairman) and James Price (CEO & President)
– Practice management software handles all financial management, scheduling, patient correspondence, reporting, clinical applications, chair side charting, and electronic services. Currently 20,000 of the 35,000 existing practices that uses PracticeWorks are on the core Windows/ NT system and the remaining 15,000 are on classic DOS/ Unix system. The latter presents an opportunity since most will need to be upgraded over the next 5-7 years and pay the higher monthly subscription fee.
– PracticeWorks competes with Henry Schein’s EasyDental and Dentrix and Patterson’s Eaglesoft and a variety of small mom and pop dental practice management software providers. Unlike the other players, PracticeWorks offers two payment options for its front office practice management software: a) traditional license at $10,000 plus $121 monthly maintenance fee or b) subscription base fee of $266 per month plus initial training fee of $1,688. Its 20,000 core customers are paying via one of these options. However, its 15,000 classic customers are averaging $99 per month and will revert to a higher payment plan upon upgrade.
– Trophy has about 25% share of the worldwide digital radiography market. Digital radiography (x-ray) is the fastest growing segment within the dental industry. It captures dental images digitally, eliminating the film and chemical process associated with traditional x-ray film imaging. The true cost savings include a reduction in the dental hygienist’s time in developing the traditional film. The US market is currently 10%-12% penetrated. The cost for the license is about $20,000.
– PracticeWorks also offers cosmetic imaging which can show a patient a “Before” and “After” pictures of a cosmetic dental procedure. This software cost a) $4,600 upfront plus $49 monthly maintenance fee or b) $500 upfront plus $186 monthly subscription fee.
– Lastly, PracticeWorks also provides e-services such as EDI, patient statement, credit card processing, and integrated website services. E-services generate about $20 million in revenues. In total, if a practice avail itself to all of PracticeWorks services, it would pay PracticeWorks about $700 per month.
Questions & Answers Highlights
– In commenting on multiples for acquisitions, PracticeWorks has paid 5x-6x EBITDA over the last three year, which has averaged out to be 2x sales.
– The attrition rate is about 1%-2% and the company is gaining 4% in new customers, so the net gain is about 2%.
– PracticeWorks’s 20%+ estimated growth this year will all be organic. This will come from two sources: a) the 15,000 practices who have the classic (legacy) system and currently pay $99 which will be converted over the next 5-7 years and pay the $266 monthly subscription fee or the upfront fee and $121 per month, and b) the opportunity to sell digital x-ray, cosmetic imaging and e-service to its existing customer base.
– With regards to its salesperson’s commissions, PracticeWorks pays an upfront $700-$800 commission payment regardless of the payment option. Therefore, under the subscription plan, the $700-$800 upfront commission is offset by the $266 monthly subscription fee, so it will take 3 to 4 months to breakeven. A subscription plan typically last 36 months.
11

Gabelli & Company, Inc.
Sybron Dental Specialties, Inc. (SYD - $23.15-NYSE) Manufacturer FYE 9/30 EPS EBITDA P/E EBITDA
Multiple
2005P $1.65-$1.75 $135 13.5x 8.8x Dividend: nil Current Return: nil 2004P $1.47-$1.57 126 15.2 9.4 Shares O/S: 38.7M 2003E $1.32-$1.40 120 17.3 9.9 52-Week Range: $11.41 – $23.68 2002A $1.06 117 21.8 10.1
Sybron Dental Specialties, Inc. is a manufacturer of value-added consumables to dentists and orthodontists. It operates two segments: Kerr Professional Dental (61% of total sales in FY2002) and Ormco orthodontics (39% of total sales). Kerr is an old-line dental manufacturer that traces its history back to 1891, while Ormco was founded in the early 1960s. Sybron Dental was spun-off from Sybron International, Inc. in Dec. 2000. With revenues of $457 million during FY2002, international sales represented 41% of total sales. The company has made 27 acquisitions since 1993. Presentation Highlights – By Floyd Pickrell (President & CEO) and Gregory Waller (CFO)
– 94% of revenues are from consumables, which provide recurring revenue stream. Further breakout of revenue category is as follows: general professional dental (44.1%), orthodontics (35.4%), infection control (11.3%), and endodontics (9.2%). International sales breakout is as follows: Europe/ Middle East (23.2%), Asia/ Pacific (11%), and Canada/ Mexico/ Latin America (7.1%). No single customer accounts for more than 8% of sales.
– The company estimates the professional dental market at $3.0-$3.5 billion, growing at 5%-7%. The leading players are DENTSPLY, Sybron’s Kerr, 3M Espe Dental AG, and Ivoclar Vivadent Group. Within its Kerr general dental segment, Sybron Dental has a leading market position in alloys, carbide dental burs, curing lights, and composites. It has 174 sales people that help pull through demand through its distributors such as Schein, Patterson and Darby.
– The company estimates the orthodontic market at $500 million, growing at 4%-6%. The leading players are Sybron’s Ormco, 3M Unitek, DENTSPLY’s GAC, and American Orthodontics, which combined have greater than 80% share of the market. Within it Ormco segment, Sybron Dental has a leading position in brackets, buccal tubes/ bands, wires, orthodontic pliers and hand instruments, and disposable products. It has 119 sales people that sell direct to orthodontists and endodontists.
– The company’s core strategies are a) to continue to innovate and introduce new products, b) to have ongoing cost reductions, and c) to execute a disciplined acquisition strategy. • Its annual R&D investment is $10+ million with 108 employees devoted to R&D. • It looks for opportunities to reduce costs such as closing plants and/ or consolidating distribution facilities • Acquisition criteria: 4x-6x pro forma EBIT
- Example: SaveWave acquisition in Feb. 2000, manufacturer of disposable air/ water syringes; sever all 18 employees, ran product through Sybron’s distribution channels, increased GM to 60.3%, increased sales
– Sybron’s financial goals are as follows: • Sales growth of 6%-10% with 4%-6% internally generated and 2%-4% from acquisitions • Gross margin range of 53%-58%, EBITDA margin range of 22%-26%, EBIT margin range of 20%-24% • EPS growth of 10%-15% annually • Continue to reduce inventory days, work toward 3x turns over the next 18 months
– Free cash flow will be used for a) acquisitions, b) reduce debt, and c) stock repurchase (if it’s in the interest of shareholders). Questions & Answers Highlights
– In commenting on the dynamics of the orthodontic market with pricing pressure, Mr. Pickrell noted that Sybron’s main focus is on its high end brackets which make the doctors more efficient and allow them to treat the patient in a shorter timeframe, thereby increasing the doctor’s productivity. Their low end offering introduced last year is the last item that comes out of a salesperson’s bag.
– With regards to competitive pressure and market share positions, Sybron current conversion rate is greater than its lose rate, so as long as this trend continues, it will have positive growth, and management is quite bullish right now.
– In responding to the pricing environment for acquisitions given that DENTSPLY, Young Innovations, and 3M are all looking for target acquisitions, Mr. Pickrell commented that there are literally hundreds of small mom and pop dental companies and when they decide to sell, Sybron will pay a fair price. Of the 27 acquisitions that Sybron has completed, none of them was in an auction situation, and management believes that this will be true going forward.
12

Gabelli & Company, Inc.
Young Innovations, Inc. (YDNT-$27.38-NASD) Manufacturer FYE EPS EBITDA P/E EBITDA
Multiple
2005P $1.75-$1.85 $31.0 15.2x 8.3x Dividend: nil Current Return: nil 2004P $1.55-$1.65 27.0 17.3 9.4 Shares O/S: 9.33 M 2003E $1.35-$1.40 24.0 19.8 10.7 52-Week Range: $16.75 – $28.49 2002A $1.23 21.5 22.2 11.8
Young Innovations, Inc. is a manufacturer of dental consumables and equipment to dentists and consumers. Its products include prophy angles, cups and brushes, x-ray machines, dental handpieces, orthodontic toothbrushes, flavored exam gloves, and more. Sales in 2002 were $72.2 million with 48% from preventive products, 19% diagnostic products (x-ray machines), 19% infection control products and 14% home care products. International sales represented less than 10% of sales during 2002. The company has made several acquisitions in the past including Panoramic Corp. (Feb. 98), Athena Technologies (April 99), Plak Smacker (June 00), and Biotrol/ Challenge (June 01). Presentation Highlights – By Alfred Brennan (President & CEO) and Arthur Herbst (CFO)
– According to the CMS, the demand for dental services will grow from $60.7 billion to $77.5 billion in 2005, a 5% CAGR. The increasing demand for dental procedures is driven by the following: • Insurance carriers emphasizing preventive dentistry • Increasing dental insurance coverage • Favorable demographic trends • Increasing evidence of link between good oral health and good overall health
– The dental industry is a consolidating industry with over 400 dental manufacturers. It is increasingly difficult for small manufacturers to compete due to burdensome regulatory requirements and limited manufacturing and distribution resources. In addition, most small manufacturers are single product companies and it is hard for them to manufacture a second product since their brand becomes identified with the first product.
– Within the attractive dental market, Young has a #1 or #2 market share positions in the following: disposable prophy angles, metal prophy angles and cups, children’s toothbrushes, fluorides, panoramic x-ray systems, surface disinfectants, and evacuation system cleaners. Recurring revenue products currently make up 87% of its total sales.
– Three sources of primary growth are 1) new product development, 2) operating efficiencies, and 3) acquisitions. • New products – evolutionary, not revolutionary; emphasis on recurring revenue products • Operating efficiencies – possible improvements include facilities consolidation, increased automation and job
combinations • Acquisition Criteria – products with similar patterns, life cycles, and cash flow generation, complementary cultures and
pro-forma 6x-8x EBIT
– Young’s financial goals are as follows: sale growth of 4%-6% internally generated, 7%-8% incremental from acquisitions, resulting in 15%-20% EPS growth.
Questions & Answers Highlights
– In the areas that Young participates in, consumable products make up only a couple of cents of each dollar of revenue earned by the dentist, so overall, it is not a big cost item. Staff costs are the biggest cost item in a practice. The dental office has 1,200 items for all the dentist’s procedures. Most dentists use about 40 products in the preventive procedure and Young gets about $0.25 of what constitutes a couple of bucks in product costs. This repeat, reliable, consistent product is important to Young’s success.
– R&D spending is about $1.5 million, and it’s well integrated into the business with most of it coming out of the manufacturing and marketing functions, rather than a pure R&D function.
– In a steady state with no acquisitions, Young would like to improve operating margins by 50bps per year. It has achieves this historically and thinks that it has the ability to do so.
13

Gabelli & Company, Inc.
Henry Schein Stock Price Chart
$30.0
$35.0
$40.0
$45.0
$50.0
$55.0
10-Nov-02 30-Dec-02 18-Feb-03 9-Apr-03 29-M ay-03 18-Jul-03D at e
Stoc
k Pr
ice
Patterson Dental Stock Price Chart
$30.0
$35.0
$40.0
$45.0
$50.0
$55.0
30-M ar-03 19-Apr-03 9-M ay-03 29-M ay-03 18-Jun-03D at e
Stoc
k Pr
ice
Company Reports: Henry Schein, Inc. – 12/6/2002 Patterson Dental Company – 4/22/2003 Henry Schein, Inc. 1Q Update – 5/7/2003 The Research Analyst who prepared this report hereby certifies that the views expressed in this report accurately reflect the analyst’s personal views about the subject companies and their securities. The Research Analyst has not been, is not and will not be receiving direct or indirect compensation for expressing the specific recommendations or views in this report. Jennie Tsai (914) 921-8436 Gabelli & Company, Inc. 2003
ONE CORPORATE CENTER RYE, NY 10580 GABELLI & COMPANY, INC. TEL (914) 921-3700 FAX (914) 921-5098 Gabelli & Company, Inc. (“we or “us”) attempts to provide timely, value-added insights into companies or industry dynamics for institutional investors. We do not have any formal ratings system for our research reports, and we do not undertake to “upgrade” or “downgrade” ratings after publishing a report. We generally write reports on securities that we believe to be undervalued and do not issue any “sell” ratings. Thus, virtually all of our reports containing recommendations would be considered “buy” ratings. We prepared this report as a matter of general information. We do not intend for this report to be a complete description of any security or company and it is not an offer or solicitation to buy or sell any security. All facts and statistics are from sources we believe to be reliable, but we do not guarantee their accuracy. We do not undertake to advise you of changes in our opinion or information. Unless otherwise noted, all stock prices reflect the closing price on the business day immediately prior to the date of this report. We do not use “price targets” predicting future stock performance. We do refer to “private market value” or PMV, which is the price that we believe an informed buyer would pay to acquire 100% of a company. There is no assurance that there are any willing buyers of a company at this price and we do not intend to suggest that any acquisition is likely. Additional information is available on request. In the last 12 months we have provided investment banking services as a syndicate or selling group member of underwritten offering to approximately 2% of the companies that were the subjects of our research reports (all of which would be considered “buy” ratings). Our affiliates beneficially own on behalf of their investment advisory clients or otherwise approximately 6.5% of SYD and 1.2% of YDNT. Our affiliates beneficially own on behalf of their investment advisory clients or otherwise approximately less than 1% of XRAY, HSIC, OCA, PDCO, and PRWK. Because the portfolio managers at our affiliates make individual investment decisions with respect to the client accounts they manage, these accounts may have transactions inconsistent with the recommendations in this report. These portfolio managers may know the substance of our research reports prior to their publication as a result of joint participation in research meetings or otherwise. The analyst who wrote this report may receive commissions from customers’ transactions in the securities mentioned in this report and may receive compensation that is based upon (among other factors) our revenues from acting as a syndicate or selling group member in underwritten offerings. The Analyst who wrote this report owns 250 shares of HSIC.
14
Patterson Dental Company Price Performance Since Initial Recommendation Source: Public Data. We recommended PDCO on April 22, 2003 at a price of $36.95 per share.
Henry Schein, Inc. Price Performance Since Initial Recommendation Source: Public Data. We recommended HSIC on December 6, 2002 at a price of $43.07 per share.