first 30 days of dialysis - the renal network 90 days (48 deaths/100 pt years at risk) in patients...
TRANSCRIPT

5/30/2012
1
Dialysis Initiation: Getting the Patient Off on the Right Foot and Maintaining It
Goals for the First 30 Days
Joseph A. Kuhn, MD, FACPMay 24, 2012
Columbus, Ohio
Dialysis Initiation: Getting the Patient Off on the Right Foot and Maintaining It
Goals for the First 30 Days
• Disclaimer:– Nephrology Associates, PA– Medical Director, FMC Riverside Park– Medical Advisory Board, FMC– Physician Technology Leadership Group, FMC– Consultant to Chief Medical Officer, FMC
Goal Setting for the First 30 Days
WHY ???

5/30/2012
2
Dialysis Initiation: Getting the Patient Off on the Right Foot and Maintaining It
Goals for the first 30 days: 1. Reduce high mortality, morbidity, and
hospitalization rate on dialysis initiation!2. Reduced the high cost at the initiation of renal replacement therapy
Dialysis Initiation: Getting the Patient Off on the Right Foot and Maintaining It
Discuss:1. Value of a CKD program in your area2. Role of TOPs (Treatment Options Program -
FMC)3. Role of Right Start -FMC4. Dialysis Adequacy5. Catheter Reduction

5/30/2012
3
A Special Group: New Patients Have Special Needs
New HD Pts Arrive:• Anemic• Malnourished• Underdialyzed (uremic)• With catheter• High inflammatory state (catheter)• Inactive• Jobs threatened• Overwhelmed• More likely to be hospitalized• More likely to die• DEPRESSED
Background : Why do we need CKD Programs, TOPs, and Right Start ???
• ESRD patients <65 years old do not receive Medicare coverage until 91 days of ESRD therapy. In order to make results comparable across age groups, USRDS has been reporting mortality rates for all patients after 90 days of ESRD therapy.
• Several studies of incident dialysis have highlighted multiple co-morbidities and risk factors that are present in the majority of patients starting dialysis therapies. Nevertheless, few studies have focused on the mortality of dialysis patients during these initial 90 days, or on processes to reduce it. 8
Published Data for Initial 90 Day Mortality
• 1990 USRDS (Held et al): reported a 12% mortality rate in the initial 90 days (48 deaths/100 pt years at risk) in patients starting dialysis.
• Khan et al (AJKD 1995): reported a 12.6% mortality rate during the initial 90 days (50 deaths per 100 pt years at risk).
• Soucie and McClellan (JASN 1996): reported avg mortality rate of 24 deaths per 100 pt yrs at risk, based on data supplied by facility staff.
• FMS had reported internally a 10% mortality during that initial 90 day period of time, or an annualized 40 deaths per 100 ptyears at risk; this compares to less than 16 deaths per 100 ptyears at risk for prevalent patients.
9

5/30/2012
4
5/30/2012
5
CKD Care
Almost 59% of incident patients said they received care from nephrologists before the onset of ESRD.• Among the HD incident patients who had received
pre-ESRD care from nephrologists, 20% of them have fistulae as their first access vs. 12.9% overall.
• Barriers:– Patient reluctance to have permanent access– Lack of timely surgical follow-up– Use of catheters to “trial” dialysis– Patients are “older and sicker”
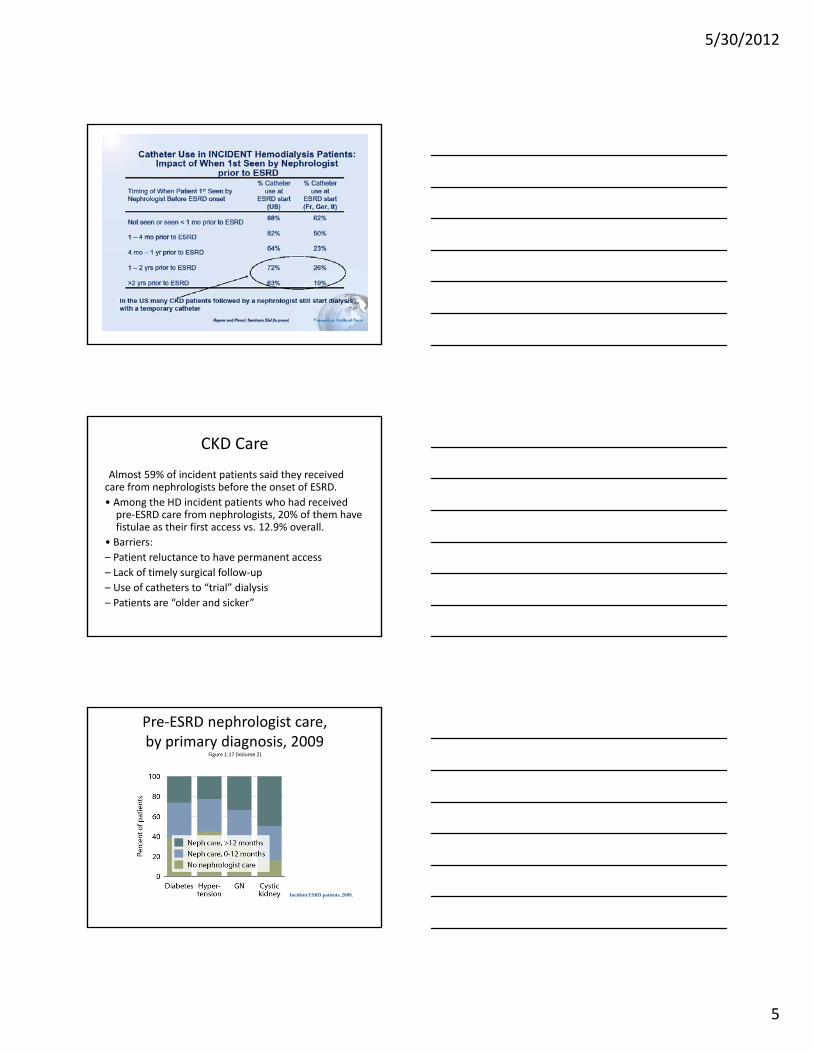
Pre-ESRD nephrologist care, by primary diagnosis, 2009
Figure 1.17 (Volume 2)
Incident ESRD patients, 2009.

5/30/2012
6
Access use at first outpatient hemodialysis, by pre-ESRD nephrology
care, 2009Figure 1.19 (Volume 2)
Incident hemodialysis patients, 2009.

5/30/2012
7
Dialysis Initiation: Getting the Patient Off on the Right Foot and Maintaining It
How can CKD Programs and TOPs (Treatment Options Program FMC) decrease Early Mortality and Morbidity?
What should be components of your CKD program and why?
Dialysis Initiation: Getting the Patient Off on the Right Foot and Maintaining It
• If we wait until ESRD to prepare a patient for dialysis we get:– Hemodialysis with a catheter– No preemptive transplant– No permanent access– No home dialysisWhen a patient starts hemodialysis with a catheter, chances are that they will continue hemodialysis only

5/30/2012
8
Dialysis Initiation: Getting the Patient Off on the Right Foot and Maintaining It
• We must change:– Late referral to Nephrology– Inability of Nephrology Community to coordinate
care to move patient to ESRD care (CKD Program)• Slow progression• Treat comorbid conditions• ESRD education• Dietary and Social Services• Timely Access

5/30/2012
9
NKF Pre-Dialysis Goals and Risk of Death
• Three NKF pre-dialysis goals - Key Drivers:
1. Creation of a permanent access
2. Treatment of anemia to recommended targets
3. Maintenance of adequate nutrition
00.10.20.30.40.50.60.70.80.9
1
0 Goals 1 Goal 2 Goals 3 Goals
Rel
ativ
e ris
k of
dea
th
• ~193,000 US patients studied• 59% did not meet any of the 3 goals
at the time they started dialysis• 1% met all 3 goals
2010 NKF Abstract; Yelena Slinin

5/30/2012
10
Pre-Dialysis Goals and Risk of Death
So far we know these are important:Timely referralAccessAnemia RxNutrition
USRDS Data and Risk of Death• 82% of US patients start dialysis with a temporary catheter
• From 1993 to 2005 in the first 3 months of dialysis Hospitalizations for cardiovascular disease increased 20-30%
• Hospitalizations for infection increased by 200%
• Mortality in months 1 through 5 on dialysis were HIGHER in 2005 than in 1998
• First year dialysis patient mortality rates are unchanged from 1996
CJASN 4:S5-S11, 2009; A Collins, et al
USRDS Data and Risk of Death -Conclusion
1.Reducing high catheter rates is key to reducing early hospitalization and mortality
2.CKD Education and Timely Referral are key strategies to reduce high catheter rates
CJASN 4:S5-S11, 2009; A Collins, et al

5/30/2012
11
Dialysis Outcomes and Practice Patterns Study (DOPPS) Data Shows:
• A substantial proportion of the first-year mortality can be reduced by addressing modifiable factors including temporary catheter use, preservation of residual renal function, pre-dialysis nephrology care, BP control, and adequate nutrition
• Highest priority targets should include decreasing catheter use and treating malnutrition
• Phosphorus control, preserving kidney function, and avoiding excessively low BP levels are also important
Pre-dialysis nephrology care helps!
DOPPS 2010 ASN Abstract; B Robinson et al
Nephrology Practice: Realities of CKD Care
• Nephrology Practices Provide CKD care to many patients, only a small number of whom will progress to ESRD.
• There is no consistent, accepted CKD clinic program across independent nephrology practices.
• Nephrology clinics lack data about Timely Referral for their patient population.
• Management of CKD co-morbidities and complications, permanent access and modality education may be difficult to deploy across the CKD clinic population without special personnel and technology resources.
• Real-time assessment of outcomes at CKD stages 4 and 5 for a specific clinic patient population may be difficult to obtain without special personnel and technology resources not currently available to the average CKD clinic
32
Dialysis Providers CKD Initiative Realities
• Have a variety of disconnected, but ongoing efforts to improve vascular access preparation
• Have developed educational materials and personnel resources to support preparation for RRT, reduce the use of temporary catheters and to assess patient status at the initiation of RRT, but these resources are not consistently and fully available to all nephrology clinics
• Have traditionally had limited access to support individual clinic efforts to improve late stage CKD care and to, therefore, improve the health of patients who must start RRT
• Have technology resources to assist in the collection of baseline data, the development of technology tools for patient care, and to collect outcomes data to help identify best practices associated with best outcomes
33

5/30/2012
12
Theory: Consistent CKD Education and Case Management is Key
to Improved Patient Outcomes and Growth
Pat
ien
ts
Time
New Patients
Discharges
Growth
• Effort to Improve Practice ESRD Growth Through Upstream Patient Education and Primary Care Community Awareness
• Increase the Number of Patients that Survive late Stage CKD to Dialysis
• Reduce Incident Catheter Rates
• Improve Long Term Patient RetentionGroup Strategies ESRD Patient Dynamic – Discharges
due to Transplant, Death and Other Transfers Out.
Patient Retention Key to Growth
35
Average Patient Retention for Group Strategies Practices
• Goal is to improve Patient Retention
Dialysis Initiation: Getting the Patient Off on the Right Foot and Maintaining It
Value of Comprehensive CKD ProgramIf no CKD care: HD with catheter
-No: AccessHome DialysisPre-emptive Transplant
Result: More likely to stay with HD, catheter, and to risk hospitalization and early death

5/30/2012
13
Nephrology Associates, PA of Delaware
37
Nephrology Associates, PA
Nephrology Associates CKD Program
Established 7 years ago after 2 years of study and preparation-NOT just an anemia management program-10 offices, 25 Nephrologists, 12 NP’s, > 125 employees
5/30/2012
14
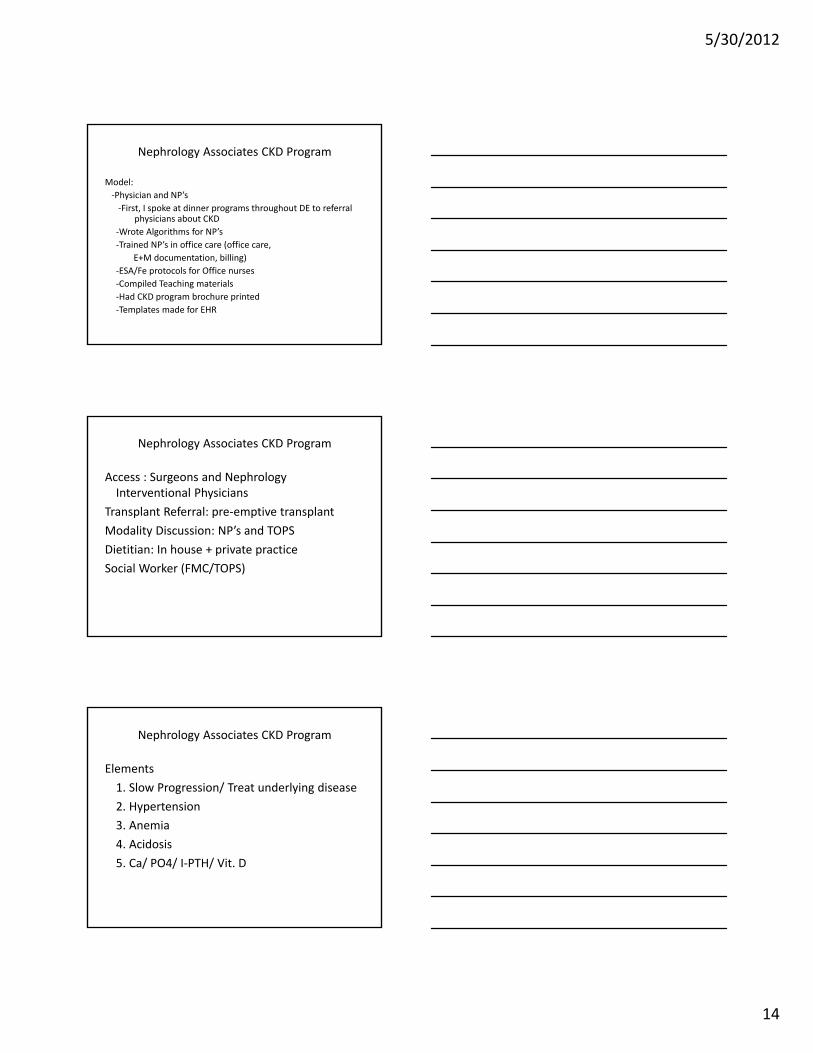
Nephrology Associates CKD Program
Model:-Physician and NP’s
-First, I spoke at dinner programs throughout DE to referral physicians about CKD
-Wrote Algorithms for NP’s-Trained NP’s in office care (office care,
E+M documentation, billing)-ESA/Fe protocols for Office nurses-Compiled Teaching materials-Had CKD program brochure printed-Templates made for EHR
Nephrology Associates CKD Program
Access : Surgeons and Nephrology Interventional Physicians
Transplant Referral: pre-emptive transplantModality Discussion: NP’s and TOPSDietitian: In house + private practiceSocial Worker (FMC/TOPS)
Nephrology Associates CKD Program
Elements1. Slow Progression/ Treat underlying disease2. Hypertension3. Anemia4. Acidosis5. Ca/ PO4/ I-PTH/ Vit. D

5/30/2012
15
Nephrology Associates CKD Program
6. Nutrition7. Lipids8. Diabetes Management 9. Smoking Cessation10. Modality Training (30/20/10)11. Vaccination: Hep B, Annual
influenza, Pneumovax
Nephrology Associates CKD Program
Importance of CQI and a robust data base and easily searched EHRCQI projects: Anemia and Iron Management
Transplant ReferralAccess PlacementVaccinationTops Referral/ Modality Training
Nephrology Associates CKD Program
CKD Program is: Right for patientsA loss leader - not a money maker at first glance but:
Increases practice referralsCaptures patients for hospital
care and ESRDDecreases Hospitalization and
Early Mortality (Increases Dialysis Population)
ESAs/ IV Fe: Modest $ makers

5/30/2012
16
Nephrology Assoc. Follows a Large Diverse Population of Patients
46
Total Nephrology Associates Patient Trend – ESRD v. Non ESRD – 2010 Estimate Based on 10 Months Data
• Total Practice Patient and ESRD Patient Growth Appear to be Slowing – 93% Overall ESRD Patient Market Share
• 40%+ New Practice Patients Each Year – 47% Patients Enter Practice Through Office
• Consistent CKD Patient Management Process is Key to Continued Growth and Success
Nephrology Associates, PA
• Increased Effort to Establish CKD Protocol
• 60% of New ESRD Starts have Been Referred Timely to Practice
• Timely Referral Leads to Better Patient Retention
• Maximizing 4+ Monthly ESRD Visits 47
Dominant Four County ESRD Patient Market Share
Practice ESRD Census at 12/31/2009 v. Network Reported – Patient Home Zip. 87% Market Share Based on Dialysis Clinic Census.
• Dominant Market Share Facilitates Consistent CKD Referral Patterns
• 93% Combined Market Share in Four County Area
48

5/30/2012
17
Increased Effort to Establish CKD Protocol
Percent of Total – Unique Patients with CKD Clinic Visits v. Total Unique Patients Per Year
• 14% Increase In Patients Utilizing the Outpatient Clinics
• Dedicated Physician Resource for CKD Program Development
49
Nephrology Associates - Stage 4
Stage 4 – New Castle & Cecil County

5/30/2012
18
Stage 5 – Kent County
Stage 4 –Sussex County
Nephrology Associates - Stage 5

5/30/2012
19
Stage 5 – New Castle & Cecil County
Stage 5 – Kent County
Stage 5 –Sussex County

5/30/2012
20
Maximizing 4+ Monthly ESRD Visits
• In a Stable ESRD patient on dialysis > 1 year, one can argue the value of weekly physician/extender visits, BUT
• Personal Opinion: In the first 30 days you can’t see the patient too much!!
• Personal Opinion: Since in all units, there are always new patients, weekly visits should be the standard
Knowledge of ESRD Therapies and Frequency of Nephrology Visits per # of Visits in
Preceding Yearn=676 per self-administered questionnaire
Pts from CRIOS study
Finkelstein, Story, Firanek…Mendelssohn, Kidney Int, July 30 2008:1-7
40
25
45
56
43
5864
51
64
0
20
40
60
80
HD CAPD Transplant
% o
f P
ts w
ith
Kno
wle
dge
0-1 visits 2-3 visits 4+ visits
**
*
*
*p<0.001 **p<0.003
Maximizing 4+ Monthly ESRD Visits
Percentage Based on CPT Code Level Billed for In-Center Services
• Dedicated Physician Extender Resource Ensure Maximum MCP Visits and Outcomes
• 8% Home Ratio
60

5/30/2012
21
Maximizing the Impact of the CKD Clinic
1. The scope of CKD at Nephrology Associates
2. Practice Believes that CKD patients will benefit from special management
3. Key management components to improve Outcomes –Education and Management of CKD Population
4. FMC Partnership : Coordinator Position
61
Timely Practice Patient Referral Impacts Key FMC Metrics
62
Practice – Point of Entry / Timely Referral / CKD ProcessBest
Best Bubble Size Indicates Count of Late Stage CKD Patients
NA, DE
FM
C
Imp
act
–In
cid
ent
Cat
het
ers,
Ho
me
Rat
io,
Co
mm
erci
al M
ix a
nd
Pat
ien
t R
eten
tio
n
• Practice Patient Referral Dynamics Has Direct Impact on Key FMC Metrics
• Goal is to Move Practices to Upper Right by Working Upstream to Change Practice Patient Dynamics
• Modifiable Practice Patterns
Consistent Application of Pre-ESRD Care to 1,700 Annual New Starts Key to Continued Success
63
• 2,117 New Dialysis Starts –Average ~42 Per Month Including Transients.
• 46% of New Starts Over the Age of 65
• 74% of New Starts have Been Followed in the Office Prior to ESRD
• Goal is to Apply Consistent CKD Care Strategies to Drive Growth in ESRD Population
NA, DE ESRD Patient Dynamic. Discharges due to Death, Transplant and Transfer Out

5/30/2012
22
Nephrology Associates Patient Retention Tops Among Group Strategies Practices
64
AKDHC ESRD Patient Retention v. Group Strategies 35 Practice Average
• Opportunity to Improve Patient Retention Exists with Support from FMC Group Strategies Initiative
Nephrology Associates CKD Program
• Improve patient outcomes at CKD stages 4 and 5• Reduce patient morbidity and mortality at 120 days
and 1 year on dialysis• Reduce the use of temporary catheters in dialysis• Increase the number of patients using home therapies• Reduce hospitalizations for late stage CKD patients
and for patients during the first year of RRT• Improve the Quality of Life for patients with late stage
CKD patients and for patients during the first year of RRT
• Set an expected standard for Vascular Access, Nutrition, and Modality Education for the majority of patients at the start of RRT
65
Dialysis Initiation: Getting the Patient Off on the Right Foot and Maintaining It
Fresenius Treatment Options Program

5/30/2012
23
Treatment Option Program
• Initiated to educate patients with Stage 3 or 4 CKD prior to ESRD
• Consists of a two-hour education program provided at least every month in each FMC “area”
• Patients are referred by their nephrologists or PCPs• Non-biased presentation of available treatment modalities
– Home Therapy– Transplant– No therapy
• Patients are encouraged to attend with family members
Fresenius Treatment OptionsProgram
Currently in DE done in Home Dialysis ProgramsWill travelWill see patients quickly and one on oneComprehensiveReports back to physiciansWill do follow up
Treatment Options Program
NOT just a home dialysis discussion-Will help you get a patient to accept ESRD, dialysis, and access-Will discuss palliative care / hospice -Will help with transplant referral-Will get social service help and
Commercial Insurance help

5/30/2012
24
Treatment OptionsSeptember 2006 thru May 2011
• Approximately 55,500 per-ESRD educations performed• 170,245 patients admitted total FMS
– 17,274 of this group received TOPS education (10.1%)
– 152,971 starts did not have TOPS education (89.8%)
• 5,155 patients without TOPS started on HT = 3.3%• 3,766 patients with TOPS started on HT = 21.8%
Treatment OptionsProgram January thru May 2011
• 7,570 pre-ESRD educations performed• 14,812 patients admitted total FMS
– 2,402 of this group received TOPS education (16%)
– 12,410 starts did not have TOPS education (84%)
• 302 patients without TOPS started on HT = 2%
• 408 patients with TOPS started on HT = 17%
HD Catheter Starts 2011
0%
10%
20%
30%
40%
50%
60%
70%
80%
90%
1
% Total TOPS HD cathstarts YTD (1,127 of2,402)
% Total non-TOPS HDcath starts YTD (9,827of 12,410)
5/30/2012
25
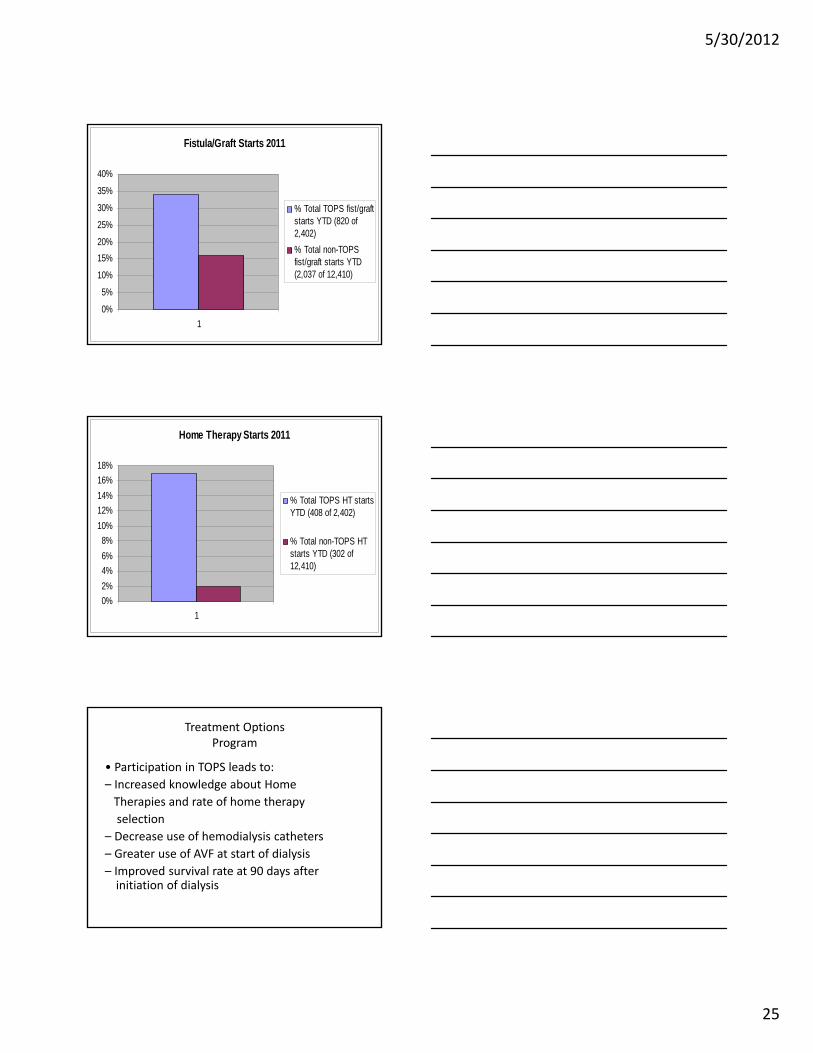
Fistula/Graft Starts 2011
0%
5%
10%
15%
20%
25%
30%
35%
40%
1
% Total TOPS fist/graftstarts YTD (820 of2,402)
% Total non-TOPSfist/graft starts YTD(2,037 of 12,410)
Home Therapy Starts 2011
0%
2%
4%
6%
8%
10%
12%
14%
16%
18%
1
% Total TOPS HT startsYTD (408 of 2,402)
% Total non-TOPS HTstarts YTD (302 of12,410)
Treatment OptionsProgram
• Participation in TOPS leads to:– Increased knowledge about Home
Therapies and rate of home therapyselection
– Decrease use of hemodialysis catheters– Greater use of AVF at start of dialysis– Improved survival rate at 90 days after
initiation of dialysis

5/30/2012
26
Raymond M. Hakim, M.D., Ph.D.July 2011
Programs to Improve ESRD Patient Outcomes
76
RightStart(Program to improve outcomes in incident ESRD Patients)
RightStartOnce your patient has gotten to the
dialysis unit - additional education and follow up over first 4 months-Two forms:
1. Field based: each patient receives a case manager (nurse or dietitian)
2. Telephonic: case manager, usually a nurse – less expensive, less successful at making contact

5/30/2012
27
RightStartWidely accepted in North BU and former RCG
units- 2011-300 field based units: face to face visit q 2 weeks-800 telephonic units: Telephone call q 2 weeks
RightStart Pt Education Topics and CMS Requirements; determine topics specific to IDT
CMS Patient Education Record Topics
• Welcome to Dialysis
• Dialysis Management: Treatments & Meds
• Rehabilitation & Quality of Life
• Infection Prevention, Safety, Personal Care
• Nutrition Management
• Medical Emergencies & Natural Disasters
• Treatment Options
Additional RightStart Topics
• RightStart Welcome brochure
• Traffic lights
• Healthy Heart
• Anemia
• Strong Bones reinforcement
• Nutrition/Fluid management reinforcement
• Diabetes– What is diabetes?– Blood sugar control– Diabetes medicines– Hypoglycemia– Hyperglycemia– Sick day guidelines– Eye care– Mouth care– Keeping active

5/30/2012
28
What Do Patients Say They Want?(I CARE)
InformationCompassionAttitudeResponsivenessExpertise
82
Outcomes for 1st 90 Day Patients vs. 91+ Days
16.8
18.1
17. 5
17.2
18.0
18.6
18.5
17.9
11.1
11. 9
12.2
12.1
12.1
12.3
12.2
12.6
0
5
10
15
20
25
30
35
40
1997 1998 1999 2000 2001 2002 2003 2004
Day
s/P
t Y
r at
Ri
1st 90 Days Day 91+
Hospital Days/Pt Year at Risk
41.8
40.2
40.3
40.2
43.4 49 46 44.2
19.3
20.7
21.4
22 22.1
22 21.5
21.6
0
20
40
60
80
100
1997 1998 1999 2000 2001 2002 2003 2004
De
ath
s/1
00
Pt
Yr
at R
1st 90 Days Day 91+
Mortality
Which group would you like to be in-Blue or Yellow?
Co-Morbidities and Risk Factors Associated with Early Mortality
Co-Morbidity• Age• Nutritional Status• Diabetes• Cardiovascular Disease• LVH• Depression
Reversible Risk Factors• Anemia (Hgb <10)• Low albumin <3.5 g/dl)• High Phosphorus• High catheter rate• Depression
Reversible Risk Factors• Anemia (Hgb <10)• Low albumin <3.5 g/dl)• High Phosphorus• High catheter rate• Depression
Risk Factors• Unplanned start
(w/o permanent access)• Short (<4 months) prior
nephrological care• Low residual renal output
Risk Factors• Unplanned start
(w/o permanent access)• Short (<4 months) prior
nephrological care• Low residual renal output
84

5/30/2012
29
At Initiation of Dialysis in the U.S.(1997 – 2000)
• 57% had albumin concentration below lower limit of normal
• 80% of patients with Hct <28% were not receiving EPO
• 50% had no visit with dietitian (21% had one visit)• Only 25% had a permanent access 30 days before
starting dialysis• 33% used temporary access (catheters) 60 days after
initiation
85
Laboratory Outcomes Following Initiation of Dialysis (N = 7,658) HCFA Data from Q4, 1997
6 Months
6-12 mo
12-24 mo
24 mo
% with URR > 65% 43 68 76 78
Median Dialysis Time (min) 210 210 210 210
% patients with HCT > 33%
41 58 60 59
% of patients with Albumin > 3.5
63 81 86 87
Rocco: AJKD, 2001
Outcomes for Patients Initiating Dialysis(1997 – 2000)
Month 1Month 2Month 3Month 4+
56 62 6278
0
20
40
60
80
100
URR > 70%N=562
41
5971
78
0
20
40
60
80
100
Hgb > 11%
N=682
5158
6579
0
20
40
60
80
100
Albumin > 3.7 g/dL
N=696
1 2 3 4+ 1 2 3 4+
1 2 3 4+

5/30/2012
30
Transition from CKD to ESRDPsychological Impact
Stages of Grief1.Denial
• I don’t know why I am here.• It’s just until my kidneys get better.
2.Anger• I don’t need this in my life.• My doctor did not tell me about this.
How do patients cope with “Their kidneys dying”?
88
Stages of Grief (con’t)
3.Bargaining• Can I dialyze once a week, but longer?• Can I keep my catheter? I hate to get stuck.
4.Depression• My kidneys are dead.• I do not use the bathroom as much.
5.Acceptance• Can I eat better?• Can I work at home?
Transition from CKD to ESRDPsychological Impact
89
Patient Perception Is Their Reality
90

5/30/2012
31
• Week: 1/2 3/4 5/6 7/8 9/10 11/12• Goals• M.D.• Nursing• S.W.• R.D.
RightStart® Grid
91
RightStart® GoalsDefined goals for each healthcare team member
General Goals• Ongoing individualized interactive Patient Education & Self-Care, Medication Reviews,
care plans, recommendation for a liberal diet• Protocol-driven outcomes
Specific Goals• Week 2: Sp Kt/V ≥ 1.4• Weeks 3-4: Target EDW
Hgb >10, T. Sat >=20%Transplant referral & permanent access planning
• Weeks 5-6: Stable BP• Weeks 7-8: Hgb > 11
PO4 3.5-5.5 mg/dLUse Permanent Access
• Weeks 9-10: Review Goal Achievement• Weeks 11-12: HgbA1C <=7%
Albumin >=3.7 g/dLPTH 150-300 (BiPTH 75-150)
92
Where Should We Focus Our Care?Contribution of “Actionable” items to Mortality
Fresenius pts, 1/1/04-12/31/04, n=78,420
Lacson et al, AJKD, 53(1), 79-90, 2009

5/30/2012
32
paricalcitolPTH>300
Supplementson HD
Alb < 3.7
megesterolAlb < 3.2
Teaching(Eat, Eat,
Eat!)
BindersPhos >5.5
Renal Dietitians
Star PlanRightStart
94
Incident FMS Patients, 1/1/07-9/30/07, n=16,178
Phosphorus vs. Albumin (Q3 07)
3.0
3.5
4.0
4.5
5.0
5.5
6.0
6.5
7.0
7.5
<3.4 3.4-<3.6 3.6-<3.8 3.8-<4.0 4.0-<4.2 >=4.2
3-M onth Average Albumin (g/dl)
3-M
on
th A
ve
rag
e P
ho
sp
ho
rus
(m
g/d
L)
N= 95,606 Patients at FMS Legacy Facilities
96A higher albumin does not correlate with higher phosphorus

5/30/2012
33
3 Month Avg Potassium vs. 3 Month Avg Albumin
3 .0
3 .5
4 .0
4 .5
5 .0
5 .5
6 .0
<3 .4 3 .4 -<3 .6 3 .6 -<3 .8 3 .8 -<4 .0 4 .0 -<4 .2 >=4 .2
3 -M o n th Av e ra g e A lb u m in (g /d l)
3-M
on
th A
ve
rag
e P
ota
ss
ium
(m
Eq
/L)
(Q3 2007 FMS Legacy Patients, N=95,561)
97A higher albumin does not correlate with higher serum K
“Patient Messages” to Improve Nutrition
1. “One of the advantages of starting dialysis, is that you can eat more and better”. Eat well, and we’ll dialyze well.
2. “You lose some protein during dialysis, so replenishing the protein in your body is important”.
3. Do not skip meals, if you cannot eat a meal, be sure to have a protein drink or other protein supplement.
4. Eat before coming to treatment, preferably 30 minutes before if possible. Then eat some protein right after treatment, bring a lunch with you to eat after treatment to restore protein and energy levels.
98
• Be sure to eat at least 2-3 servings of protein foods everyday (eggs, chicken, lean beef, fish, supplements) and always eat protein food first in the meal.– 97% of patients with albumin 4.0 g/dl or higher eat
within 30 minutes before and 30 minutes after dialysis.
99

5/30/2012
34
Enrollment Process
• RightStart®, N=923– Prospective enrollment of ALL new patients within one to three
weeks of dialysis initiation– Exclusions:
Seasonal or transient patients Nursing home residents Patients with cognitive dysfunction that precludes ability
to learn
• Time-Concurrent Control Group, N=1,047– Retrospective data retrieval of all new patients in non-RightStart®
clinics in same geographic area for one year concurrent with the RightStart® program
100
Demographics
Variable RightStart® Control Group p Value
Age (years) 61.8 + 16.0 62.0 + 17.2 NS1
Male/Female 45.8%/54.2%
46.6%/53.4% NS2
Diabetes (I & II) 53.8% 53.8% NS2
Caucasian 57.2% 47.8% P<0.052
AA/Hispanic 36.5% 36.2% NS2
Other 6.3% 16% NS2
1 = Student’s t-test2 = Chi-square
101
Adequacy and Vascular Access Outcomes
Percent Reduction of Catheters
Percent of Patients with Sp Kt/V ≥ 1.4
58.8 58.361.8 64.2
73.5
82
51.348.8
52.8 5457.6
61.266.8
75.9
0
20
40
60
80
100
0 1 2 3 4 6 12
Months
% P
atie
nts
Meetin
g T
a
RightStart Control
23.1
54.2
69.2
7.84.9
27.3
48.1
65.8
0
20
40
60
80
100
Base toMO1
Base toMO3
Base toMO6
Base toMO12
Perc
ent o
f Patie
RightStart Control
23.1
54.2
69.2
7.84.9
27.3
48.1
65.8
0
20
40
60
80
100
Base toMO1
Base toMO3
Base toMO6
Base toMO12
Perc
ent o
f Patie
RightStart Control
102

5/30/2012
35
Laboratory Parameters
Percent of Patients with Hgb ≥ 11
Percent of Patients with Albumin >3.5 g/dL
63.9
84.287.1 85.6
82.5 83.4
40.436.8
50.1
74.279 79.2 79.6 78.2
0
20
40
60
80
100
0 1 2 3 4 6 12
Months
% P
atie
nts
Meetin
g T
a
RightStart Control
63.9
84.287.1 85.6
82.5 83.4
40.436.8
50.1
74.279 79.2 79.6 78.2
0
20
40
60
80
100
0 1 2 3 4 6 12
Months
% P
atie
nts
Meetin
g T
a
RightStart Control
63.6
72.375.4 74.6
80.785
55.752.7
60.265.9
70.374.6
79.183.3
0
20
40
60
80
100
0 1 2 3 4 6 12
Months
% P
atie
nts
Meetin
g T
a
RightStart Control
63.6
72.375.4 74.6
80.785
55.752.7
60.265.9
70.374.6
79.183.3
0
20
40
60
80
100
0 1 2 3 4 6 12
Months
% P
atie
nts
Meetin
g T
a
RightStart Control
103
Patient Education Tool for Catheter Pts
Survival Curve, 1st 365 DaysAdjusted Cox-proportional hazards regression model
4003002001000
risk_days_365
1.00
0.95
0.90
0.85
0.80
Cu
m S
urv
ival
p
P<0.001 by Cox Log-rank, Breslow, and Tarone-Ware testsat 90, 180, and 365 day exposure levels.
RightStart®
Control
Adjusted by age, race, gender, diabetes
105

5/30/2012
36
Mortality Hazard Ratios
Mortality Period
Unadjusted Hazard Ratio1
(95% CI)
Adjusted2
Hazard Ratio1
(95% CI)
P Value (Adj.
Hazard Ratio)
RightStart®
(deaths per 100 pt
yrs)
Control (deaths per 100 pt yrs)
90-days0.52
(0.35-0.76)
0.60(0.37-0.97)
0.037 0.20 0.39
180-days0.55
(0.40-0.75)
0.60(0.40-0.91)
0.015 0.18 0.33
365-days0.60
(0.46-0.79)
0.66(0.46-0.95)
0.026 0.17 0.30
1 = Control used as reference group2 = Adjusted for age, gender, race, diabetes 106
Hospital Days per Patient Yr at Risk
14.513.3
13.4
18.3 18.5
17
0
5
10
15
20
Mo 1-3 Mo 1-6 Mo 1-12
Hos
pital
Day
s/P
t Y
r at
R
RightStart Control
14.513.3
13.4
18.3 18.5
17
0
5
10
15
20
Mo 1-3 Mo 1-6 Mo 1-12
Hos
pital
Day
s/P
t Y
r at
R
RightStart Control
107
Reduce Cycle Time:Example: Efficiency of Epogen Management
• Time (Days) from Date of 1st Outpatient Dialysis to Date of 1st Epogen Order
• Components Measured– Days to 1st Lab Draw– Days to 1st EPO Order
108

5/30/2012
37
Days to First Lab Draw for Incident Patients
**p<0.0001
8
5
0
2
4
6
8
10
Per
cen
t
Control RightStart
8
5
0
2
4
6
8
10
Per
cen
t
Control RightStart
**14.6
10
0
5
10
15
20
25
30
Per
cen
t
Control RightStart
14.6
10
0
5
10
15
20
25
30
Per
cen
t
Control RightStart
**
Days to First EPO Order for Incident Patients
109
Percent of Pts with Hgb11-12 g/dL at 120 Days
18.7
24.8
0
5
10
15
20
25
30
Per
cen
t
Control RightStart
18.7
24.8
0
5
10
15
20
25
30
Per
cen
t
Control RightStart
**p<0.001
**
62.872.9
0
20
40
60
80
100
Per
cen
t
Control RightStart
62.872.9
0
20
40
60
80
100
Per
cen
t
Control RightStart
**
Percent of Pts with Albumin >=3.5 g/dL at 120 Days
110
Percent of Pts with Phosphorus 3.5-5.5 mg/dL at
120 Days
51.3 56.5
0
20
40
60
80
100
Per
cen
t
Control RightStart
51.3 56.5
0
20
40
60
80
100
Per
cen
t
Control RightStart
*p=0.02
*65.2
75.2
0
20
40
60
80
100
Per
cen
t
Control RightStart
65.275.2
0
20
40
60
80
100
Per
cen
t
Control RightStart
*
Percent of Pts with spKt/V >=1.4 at 120 Days
(eKt/V >=1.2 for FMS pt group)
111

5/30/2012
38
Percent of Pts with AV-Fistula at 120 Days
25.2
34.4
0
10
20
30
40
50
Per
cent
Control RightStart
25.2
34.4
0
10
20
30
40
50
Per
cent
Control RightStart
**p<0.0001
**
112
Average Number of Foot Checks Done During First 120 Days (diabetic pts only)
0.6
1.9
0
0.5
1
1.5
2
Per
cent
Control RightStart
0.6
1.9
0
0.5
1
1.5
2
Per
cent
Control RightStart
**p<0.0001
**
113
One Year Survival of RightStart Pts vs. Case-Control matching, All Pts n=approx 8,000
120 Days
Hazard Ratios at 120 days: 0.66At 1 year: 0.78
RightStart Patients
Matched non-RightStart patients
P<0.0001
114

5/30/2012
39
Data
Patients Treatments per Patient
Cohort Total Day 1-120 Day 1-180Possible 51.3 78Right Start 1,144 41.80 60.80Non-RS 6,838 35.98 51.30Delta 5.82 9.50
115
Incident patients 1/1/10 to 6/30/10
Summary
1. Patients initiating dialysis present with several co-morbidities and risk factors, and knowledge deficits that are associated with a high initial 90-day mortality rate, (generally not reflected in published data).
2. Several of these risk factors can be attenuated or reversed more rapidly with an intensive team effort during the initial 90 days of therapy.
3. The RightStart® program, consisting of focused attention on reversible risk factors and patient education, resulted in a significant reduction in mortality and hospitalization during those initial 90 days, which extended up to 1 year following initiation of dialysis.
116
Top 10 Lessons Learned from RightStart for Incident Dialysis Patients
1. Reduce cycle timea) Lab panel on 1st treatmentb) Lab follow-up by MD and RN next (2nd) treatment
2. Make early “emotional” connection with new pt. Recognize grieving process and empathize, support pt to reach acceptance phase & empowerment/self-management
3. Delay heavy (intensive) teaching until 2-3 weeks after start4. Team-driven “curriculum”5. Emphasize good nutrition- “Eat well and we’ll dialyze you well”6. Provide oral nutritional supplements early on7. Get rid of catheters ASAP8. Include family members or next of kin in education9. Focus on pt as most important team member10. Assure TOPS program participation before starting dialysis
117

5/30/2012
40
Dialysis Adequacy
• There is no more important time to establish dialysis adequacy than the first 30 days– Catheter, poorly functioning access, denial,
stretching the boundaries, hospitalization, poor control of BP, volume
• Urea kinetics is not the only measure of adequacy: TIME
Dialysis Adequacy
• Before we rush to cut time based on Kt/V remember this takes into account UREA removal not Na, K, H2O, PO4
– Volume requires time– PO4 requires time– K requires time to do safely
Dialysis Adequacy
• No downside to spKt/V > 1.4 other than time• Tremendous potential upside• We have been wrong before in shortening
dialysis (1980’s)• Role of time (t)

5/30/2012
41
Dialysis AdequacyDOPPS
RR of Death 0.81 > 4 Hrs vs < 4 HrsEach additional 30 min: decrease risk of death 7%
Australia/ New ZealandSurvival worse < 3.5 hours and better 4.5-4.9 hours
FMS DataEach 15 min. decrease from 4 hours : 12% increase risk of death
Dialysis Adequacy
• FHN trial group of the NIH (N Engl J Med 2010, 36:2287-2300/Dec 9, 2010) http://www.nejm.org/doi/pdf/10.1056/NEJMoa1001593 demonstrates that more frequent dialysis leads to improve blood pressure control, decreased left ventricular mass, and better phosphorus control.
Dialysis Adequacy
• Dialysis at a Crossroads: 50 Years Later (Clin J Am Soc Nephrol 10:2215-2211/ Dec 9,2010) http://cjasn.asnjournals.org/content/early/2010/12/09/CJN.08450910.full.pdf+html suggests that increasing time (t)on dialysis (t) to control blood pressure or more frequent dialysis will lead to decrease left ventricular hypertrophy and fibrosis by control of extracellular fluid volume .

5/30/2012
42
• Ultrafiltration Rate– HEMO Study: UF Rates > 10 ml/Kg/hr associated
with increased risk of death• Other studies >13 ml/kg/hr
Dialysis Adequacy• Longer dialysis will lead to more gentle ultrafiltration
and better control of blood pressure and extracellular fluid volume. This will allow reduction in antihypertensive agents which seem to contribute to better control blood pressure at the expense of higher levels of extracellular fluid volume. This current approach (antihypertensive agents rather than longer or more frequent dialysis to control blood pressure) has not been successful in controlling left ventricular hypertrophy and fibrosis.
Dialysis Adequacy
• Is t the answer?

5/30/2012
43
Dialysis AdequacyHemodialysis Time (td): < 100 Kg. : 4 Hrs.
100-115 Kg. : 4.25 Hrs.> 115 Kg : 4.5 Hrs
When a hemodialysis catheter is in place, increase dialysis time by 0.5 Hrs. Dialysis time will be decreased by 0.5 hours when the hemodialysis catheter is removed.
Maximum ultrafiltration rate will be 12 ml/Kg/Hr. based on estimated dry weight. Maximum fluid removal may be rounded up to the nearest 0.2 Kg (200 ml) over the length of the dialysis. Dialysis time is to be extended when interdialytic weight gain exceeds this maximum. Time is to be based on 12 ml/Kg/Hr. maximum.
Dialysis AdequacyIf eKt/V < 1.15, dialysis time will be extended by 0.5 Hrs
(if the patient dialyzed their prescribed time for eKt/V determination).
If eKt/V is 1.15 to 1.19, dialysis time will be extended 0.25 Hrs (if the patient dialyzed their prescribed time for eKt/V determination).
If the patient has intradialytic hypotension or severe cramping at the prescribed time, contact the physician or physician extender for added treatment time.
Dialysis AdequacyFresenius Medical Services Penndel Region
Hemodialysis Treatment Time
Hemodialysis treatments at this Fresenius unit are at a minimum of four hours. It is well documented that missing or shortening dialysis treatments is detrimental to your health and is highly discouraged by our medical and nursing staff.
Dialysis treatment times will be extended if fluid weight gains are in excess of a predetermined amount based on your dry body weight.
Dialysis treatment times are also extended if you dialyzed through a dialysis catheter rather than a fistula or graft.
Dialysis treatment times may need to be extended because of inadequate clearance of dialysis toxins based on a measurement known as Kt/V. Finally, if significant decrease in your blood pressure or severe cramping occur at your prescribed time, your treatment will be extended for your safety and comfort. Slower fluid removal with longer treatment time will almost always alleviate these symptoms.
We hope that you understand that this policy is based on our concern for your health and dialysis safety.
Medical director: ___________________Patient Signature:_________________________

5/30/2012
44
Goals First 30 Days
• For the immediate future, catheters will not go away
• Unless you have a catheter reduction plan in your unit, the patient with a catheter at the start of dialysis will still be using it in 6-12 months !!!!
Goals First 30 Days
• Catheter Reduction Program– Have a Program in Place, not “Business as Usual”– Select and Utilize Vascular Access Managers and
Expert Cannulators– Review at CQI for trends
132
Why the Concern With Catheters?
Compared to AVF/Gs, CVC patients have:
Two to three times increased risk of death
Five to ten times increased risk of septicemia
Hospitalized eighteen days per year, compared to nine days
Reduced Kt/V, HGB and albumin values
Higher ESA, antibiotic and thrombolytic use
Higher expenses to facility and the healthcare system

5/30/2012
45
Catheter Reduction Program1. Surgical consultation day of admission
-Takes time to get appt. and then to schedule surgery: must be considered urgent
2. Permanent access placed within 2-3 weeks of admission
-Vein mapping by time of surgical visit3. Utilization of AVF without CVC in 90 days from placement (Graft 45 days)
-AVF assessed by 4 weeks for maturation and plan made if not progressing (50%)
134
Vascular Access Team Roles and Responsibilities• Medical Director:
• Directs Team with implementation of CRP Checklist and resources
• Leads staff meeting to review risks of CVCs, Best Practice Checklist, Access Plan, Expert Cannulator and Vascular Access Manager roles responsibilities and expectation of team
• Ensure processes are in place to make certain all patients are educated regarding importance of permanent access placement
• Oversees and monitors processes to ensure all CVC patients have access plans in place.
• Resolves communication and system barriers that may be preventing permanent access placement
• Leads QAI team in the analysis of facility, surgeon and attending physician data.
• Educates attending physicians (if applicable) • Works/communicates with attending physicians,
hospitals and surgeons to reduce CVC admissions
• Clinic Manager:• Oversees CRP Checklist and resource
implementation. • Partners with Medical Director to ensure
appropriate CRP processes are in place and working.
• Oversees Vascular Access Managers and Expert Cannulators activities.
• Oversees tracking and reporting to QAI committee on status and progress of CVC reduction program.
Vascular Access Manager (VAM):
• Designated by QAI Committee• Implements VAM Roles and
Responsibilities• Educates patients, implements Catheter Patient
Access Plans and completes and updates Catheter Reduction Workbook.
• Refer to VAM Roles and Responsibilities for additional details
Expert Cannulator:• Designated by QAI committee• Nurse or PCT designated as Expert
Cannulator to assess and cannulate all new AVF/Gs.
• Refer to Expert Cannulator Program Guidelines for additional details.
135
Vascular Access Team Roles and Responsibilities Cont.Registered Nurse:
• Discusses VA Plan during first meeting with patient and ongoing
• Implements applicable CRP checklist elements
• Assists team to identify barriers that may be preventing permanent access placement
• If designated, implements VAM responsibilities
Patient Care Technician:
• Implements applicable CRP checklist elements
• Discusses VA Plan during first meeting with patient and ongoing with patients
• Assists team to identify barriers that may be preventing permanent access placement
• Implement VAM/Expert Cannulator functions under RN supervision
Dietician:•Implementation of applicable CRP checklist
elements.•Discusses VA Plan during first meeting and
ongoing with patients •Assists team to identify barriers that may be
preventing permanent access placement•Discusses risks of CVC- including relationship
of poor outcomes to CVCs.Social Worker:
•Implements applicable CRP checklist elements.
•Discusses VA Plan during first meeting with patient and ongoing with patients
•Assists team to identify barriers that may be preventing permanent access placement
•Discusses risks of CVCs. and helps address specific barriers to permanent access
•Assist with insurance or transportation issues

5/30/2012
46
Dialysis Initiation: Getting the Patient Off on the Right Foot and Maintaining It
Discuss:1.Value of a CKD program in your area2.Role of TOPs3.Role of Right Start4. Adequacy Program5. Catheter Reduction Program
137